1. Introduction
Text responses are often integrated into assessments, especially in the social sciences. In comparison to the straightforward evaluation of multiple-choice tasks, text responses require the recognition and interpretation of linguistic relationships during their evaluation. Perceiving [
1] and understanding [
1,
2,
3] written text is a cognitively complex task, which is additionally affected by cognitive biases [
4], for example, due to prior information [
5,
6]. Several challenges may arise during the evaluation process and affect the coding result, ranging from illegible words in hand-written assessments to comprehension problems across the written text. Evaluation sessions require steady attention, which can wane during longer sessions. Thus, the rater has to make responsible decisions while being affected by heuristics and monotonous work [
7]. Overall, we can summarize that rating is a demanding procedure and is costly due to the training and required time for the personnel involved.
In the present paper, we introduce our R-based software shinyReCoR, which makes it possible to train an automatic response coder to code answers quickly, reliably, and completely automatically. We describe the method behind shinyReCoR, which augments the automatic text response coder (ReCo) [
8] and comprises a pipeline of different natural language processing and machine learning methods. We also explain the employed techniques and how they have been included in the app, the specificity behind them, alternative processing capabilities, and computational aspects. Since the core method was developed and tested with German short text responses from a large-scale assessment, its focus is on German. However, with the employed techniques being partly language-agnostic and otherwise widely available for many languages, the app also allows coding of other languages (currently, English).
The method was developed for coding short text responses. The length of the answers varies, depending on the task, between one word and several sentences. For the presented method, there is no such requirement as an optimal answer length, as other variables also play a crucial role for response complexity. Less complex tasks usually evoke shorter responses, for example when only text parts of the task have to be recalled, while more complex tasks tend to generate longer answers, which may also contain a greater variety of words. This can lead to poorer automatic coding quality [
9]. However, it has already been shown [
8] that the method also works with linguistically more diverse responses. Nevertheless, this is an empirical question to be answered for each data set.
With the development of the app, we not only aimed to create a freely available program that codes responses, we also intended to meet high scientific requirements and grant maximum transparency, flexibility, and usability. To achieve these goals, we decided to develop an R-based app, which can be controlled via a graphical user interface without programming knowledge. Furthermore, the procedure primarily involves only baseline techniques that are available for a large range of languages. The whole process can be controlled easily and is user-friendly, while all computations are carried out in the background. The present article illuminates which calculations the app runs in the backend as well as which capabilities users find in the frontend.
The coding used to train the model is manually assigned by humans, which can be regarded as a gold standard for training and evaluation models. Possible issues regarding human work as the ground truth are discussed in the article. It can be noted, though, that the first part of the procedure is unsupervised and carried out without human codes. In such a case, the app can categorize text data into response types according to responses’ semantics.
Finally, let us define the crucial terminology in this paper.
We use the term coding, which describes the process of assigning a nominal class to a response (e.g., correct or incorrect). Since a deterministic clustering process plays a central role in the (automatic) coding process, we focus on the term coding instead of scoring, which is more commonly used when data are classified at an ordinal or metric scale. The classification of ordinal data is not excluded by the described method, but it is restricted according to the deterministic approach.
Moreover, we use the terms classes or labels, which appear more often in the context of machine learning applications.
In supervised learning, a model is trained to separate data based on their features and assigned labels, whereas in unsupervised learning, such as clustering, data are organized based only on their features.
The term hyperparameter refers to model parameters that are specified for methodological components, but not optimized during training. For example, the number of clusters, k, which has to be predefined a-priori, can optimize both supervised and unsupervised models.
The following part of the text refers to the current version of the app, shinyReCoR v0.2.0.
2. Method
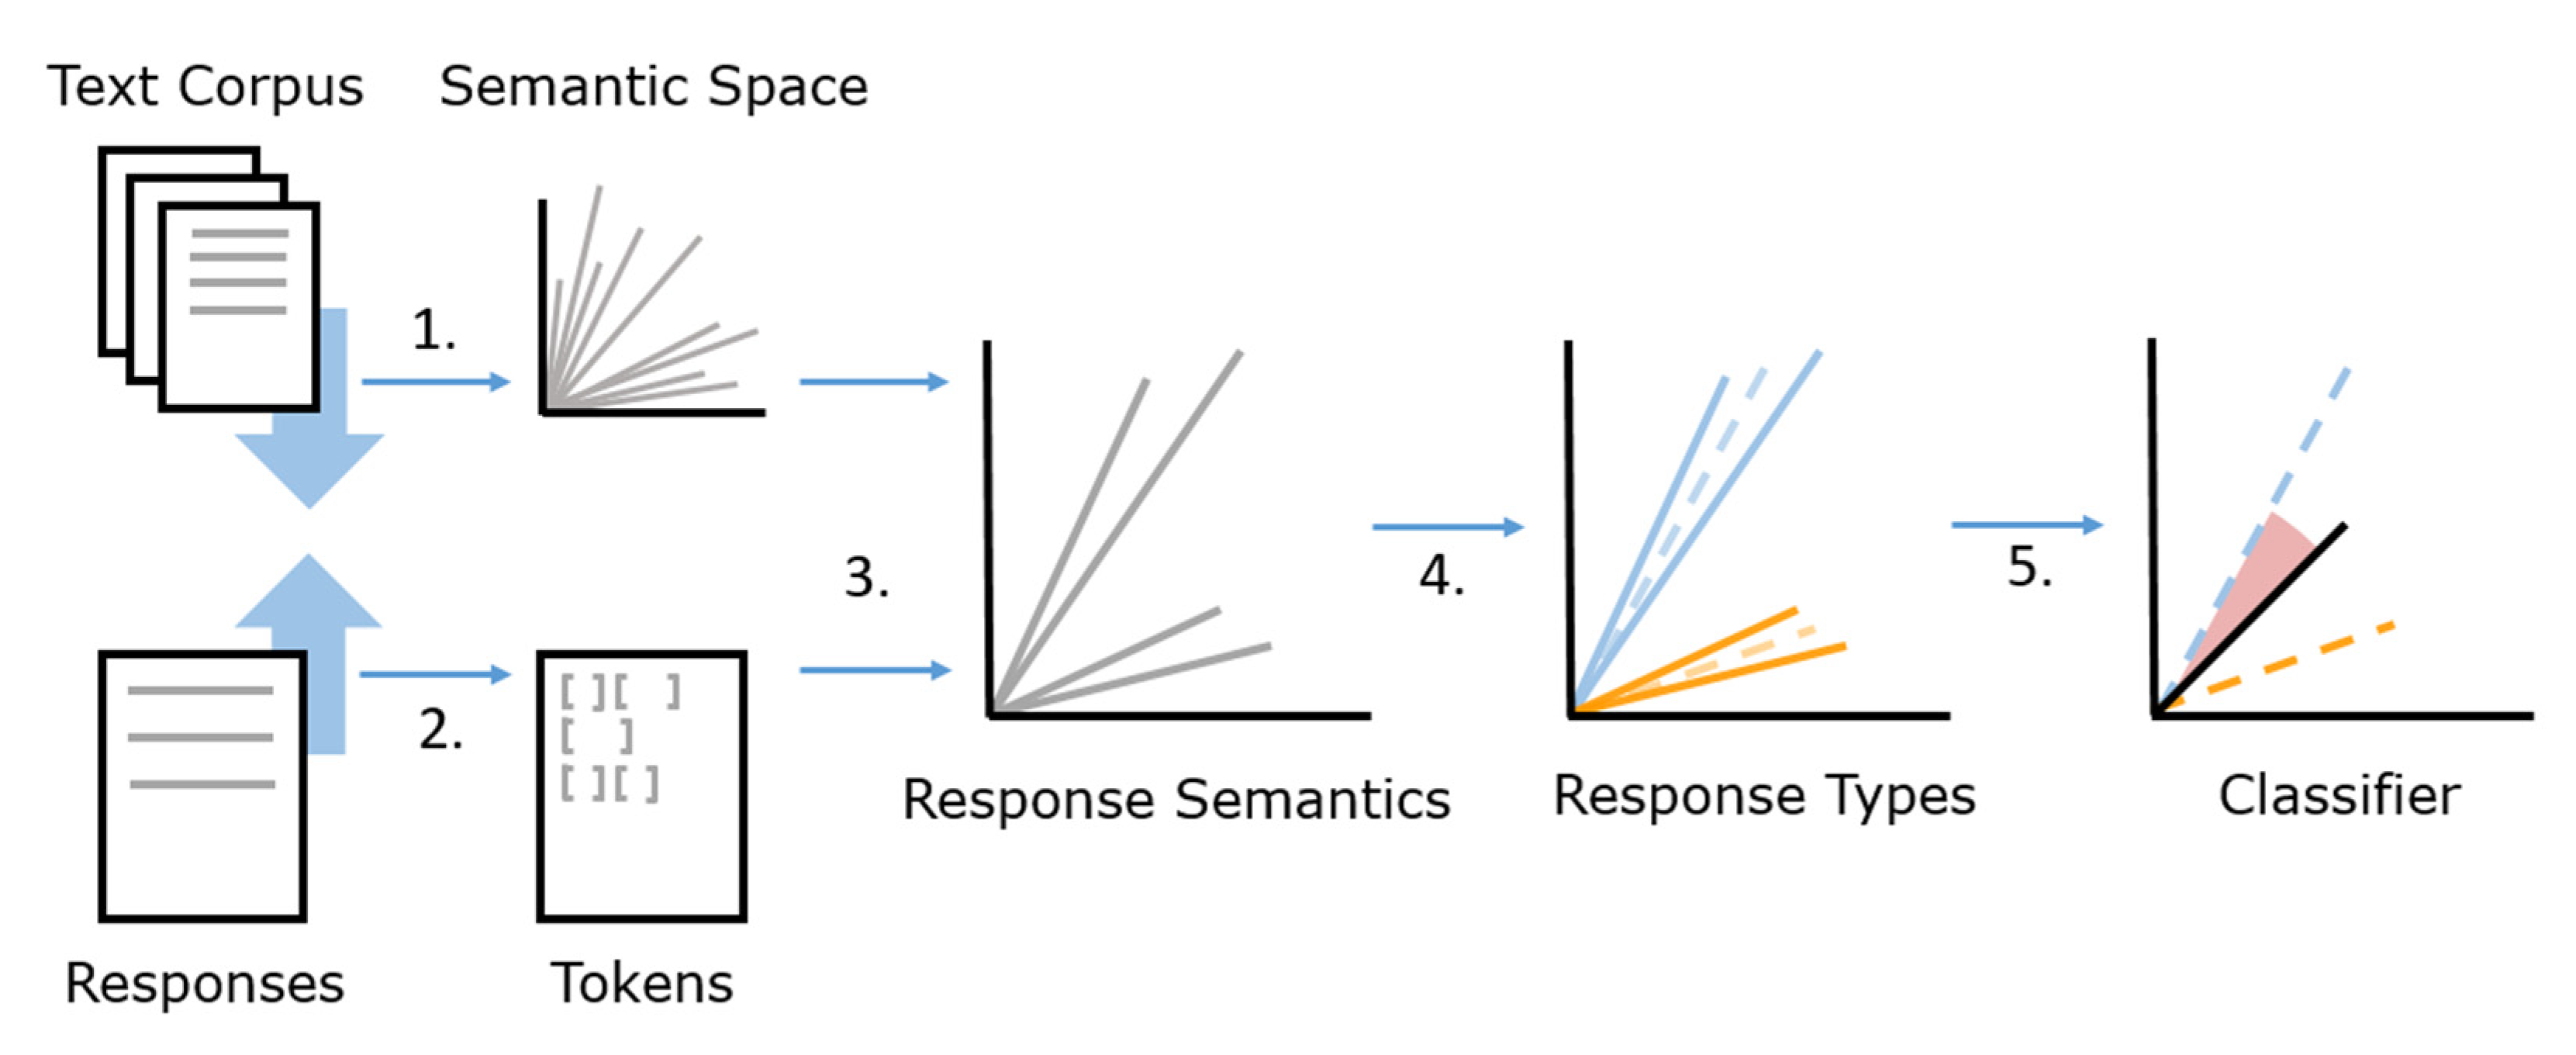
In order to provide an overview of the entire process, this section first outlines the different components of the method (see
Figure 1). Second, the subsequent subsections explain each step in more detail.
The overall aim of the process is to use response data and an external text corpus to train an item-specific cluster model for automatic coding in order to be able to code unseen responses to the same item automatically. Training data, as well as a semantic space, are needed to depict the semantics of the different response types as representatively as possible. The semantic space itself is not part of the training data but a vector space model representing semantic similarities of words from an external text corpus. A minimum requirement of the number of responses cannot be specified since the success of clustering depends on several factors, such as the complexity of the responses, the response lengths, the characteristics and complexity of the language, the number of possible codes, and the semantic delimitation of the response categories, to name just a few. The method was predominantly tested with data from a large-scale assessment (see [
8,
10]). Large-scale assessments, on the one hand, satisfy requirements such as data volume (
n > 1000), and, on the other hand, they constitute an attractive field of application. Nevertheless, applicability for smaller data sets is not precluded and can be easily tested and evaluated in the app.
The first step of the response analysis process, according to the original paper [
8] (
Figure 1), is building or choosing a semantic space from a text corpus (1). In simple terms, semantic spaces are a set of
n-dimensional vectors, where each vector represents the semantics of a word as a set of numerical values. For example, the word ‘dog’ is represented by the vector
. We first assume that we have ready-made vector spaces, e.g., built with Latent Semantic Analysis, covering the relevant words in a target language as vector representations. The set of those words can also be called the dictionary. Numerical representations of words allow measuring their similarity with mathematical operations, for example, using the cosine distance between two vectors. The responses are separated into single words (tokens; 2) and can be, as well as the text corpus, preprocessed to normalize the text and focus on relevant semantics by removing supposedly unnecessary information. Additionally, automatic spelling correction can optimize the quality of the response texts. Words are transferred further into their numerical representations by assigning word vectors from the previously formed semantic space to all response words. All word vectors within a response must be averaged across the
n dimensions to generate a single response vector (3). Like measuring the similarity between word vectors, the distance or angle between two response vectors can represent their semantic similarity. Due to their numerical representation, the responses can be clustered in the next step. Response types are formed by the unsupervised process, with responses being assigned to clusters according to their semantic similarity (4). The cluster information of the responses now makes it possible to assign new responses to a given response cluster (5). The new response is then automatically coded according to the code distribution of the responses within the cluster. In machine learning methods, it is common to separate the data set and then use one part to train the model and the other part(s) to evaluate the coding quality. The success of the coding can be interpreted using several evaluation measures, such as accuracy, sensitivity, or kappa [
11].
2.1. Building a Semantic Space
To make responses accessible for mathematical operations, they must be transferred into a quantitative format. For this purpose, we use semantic spaces, which are also called vector space models (VSMs) or word embeddings in the context of natural language processing. Semantic spaces have been used for several decades and can be built using a large text corpus.
One popular method is Latent Semantic Analysis (LSA). Established in the 1990s [
12], it forms a semantic space via a singular value decomposition of a count-based term-document matrix. Term weighting can increase word association precision [
13].
More recently, neural networks (NN) have become increasingly popular again and have become state-of-the-art for training semantic spaces [
14,
15,
16,
17].
In comparison to modern methods, LSA shows satisfying results in different similarity tasks [
18]. This is especially important since newer (NN-)methods rely on the correct adjustment of hyperparameters [
18,
19] and a large amount of data [
20] to realize their advantages, while the processing of more data is also associated with a longer computation time.
Since the dictionary must cover as many words in the respective response data as possible, we offer to create a custom semantic space using LSA. LSA can be easily implemented using existing R packages. Furthermore, we offer to download pre-built topic-specific semantic spaces. This enables quick usage without investing computing time to build new spaces. The increasing popularity of NLP, especially word embeddings trained with neural networks, leads to a wide offer of pre-trained models on the Internet. We do not want to exclude the use of such methods and therefore also allow the use of third-party vector spaces, such as ones trained with w2v [
17] or GloVe [
15], which only require a minor adjustment to be used in the app. How to use third-party models is described on our website.
What method-independent vector spaces have in common is that words can be mapped to
n-dimensional vectors. Usually, the number of the dimensions is set to 300, yielding promising results across methods (see [
15,
17,
21]). The cosine distance can be used to calculate the semantic similarity (1),
based on the angle
between two vectors
and
in an
n-dimensional space and is the standard measurement for comparing words and documents in semantic spaces. Compared to Euclidean distance, cosine refers to the direction of two vectors only and not the spatial distance. The semantic similarity lies in the range of values
, where 0 indicates orthogonality of the vectors to each other and a maximum dissimilarity, while
, defined as the minimum of two vectors’ angles, can range from 0 to 180 degrees.
As previously mentioned, all relevant words must be covered by the semantic space. Relevant words can be seen as those that distinguish the responses on the basis of their meaning. If a word occurs in responses and not in the dictionary, the semantic information of this single word is lost for the further process. Complete coverage of words would be ideal, but it is not possible in cases where, for example, spelling mistakes cannot be corrected accurately so that these are not represented in the semantic space. This is where preprocessing comes into play for normalizing observed language utterances.
2.2. Preprocessing
Language can be very diverse in its form. The complexity is reflected in morphology, syntax, and semantics. Thus, language offers a wide range of possibilities to write down certain information. Through preprocessing steps, texts can be normalized to a certain degree, which enables easier machine processing; for example, by involving less linguistic noise. In the first step, the responses are separated into word elements, which are, in their single form, also called unigrams or tokens. Typically, words are corrected regarding their spelling. After decapitalization, language-specific steps like normalizing umlauts can apply. In the next step, digits and punctuation, as well as stop words, will be removed. Stop words frequently occur in the language but have no meaningful semantics and are therefore considered noise. These include, for example, determiners and pronouns. In the last step, the words can be reduced to their word stems.
Table 1 shows the effects of preprocessing for an example sentence. Preprocessing steps can be selected and adjusted individually within the app. For example, stemming is not mandatory, and the stop word list can be modified. Numerical representations can also remain a component, but they must also be covered within the semantic space. Numbers in the form of integers (e.g., 1, 3, 7) or in written form (e.g., one, three, seven) are mostly covered here up to a certain number and considered a text string.
The spell checker algorithm changes tokens that are not recognized as words into words from a predefined dictionary. The quality gain of the classifier with spelling corrected responses is determined by the word distribution. If relevant words are misspelled more often, this may also affect the accuracy of the classifier. For simple responses like our demo dataset, spelling correction has only a small impact and improves the accuracy by one percent. For other response characteristics, the impact may well be greater.
Morphology adds further information to the word by adding, changing, or omitting affixes. Together with the limited number of responses, compared to the complete universe of possible responses, this can lead to unreliable clustering because more data (in the training set as well as in the text corpus for semantic space building) are needed to represent them properly in the semantic space. This type of linguistic variability can be minimized by a stemming algorithm, which automatically removes affixes and reduces the word to its stem. We use the Porter stemmer, a rule-based algorithm [
22], which is one of the most widely used stemming algorithms.
Further irrelevant linguistic variability can be minimized by decapitalizing words. For example, the sentence, ‘The cat hunts the bird’ initially contains five unique words. Due to the capitalization at the beginning of the sentence, ‘The’ is considered to be a different word than ‘the’.
Normalizing responses provides two advantages. First, fewer training data are needed to represent the prototypical responses. Second, at the same time, the model becomes more generalizable because it only differentiates between the supposedly relevant criteria and thus counteracts overfitting.
It is important to note that both the text corpus used to create the semantic space and the responses undergo the same preprocessing steps. Otherwise, not all the words can be matched, so that not all the semantic information is captured. As mentioned in
Section 2.1, words that are not covered will get lost in the process since they cannot be represented in the semantic space. Spelling correction is useful to maximize the coverage rate, as no misspelled words are lost in the further process.
2.3. Response Semantics
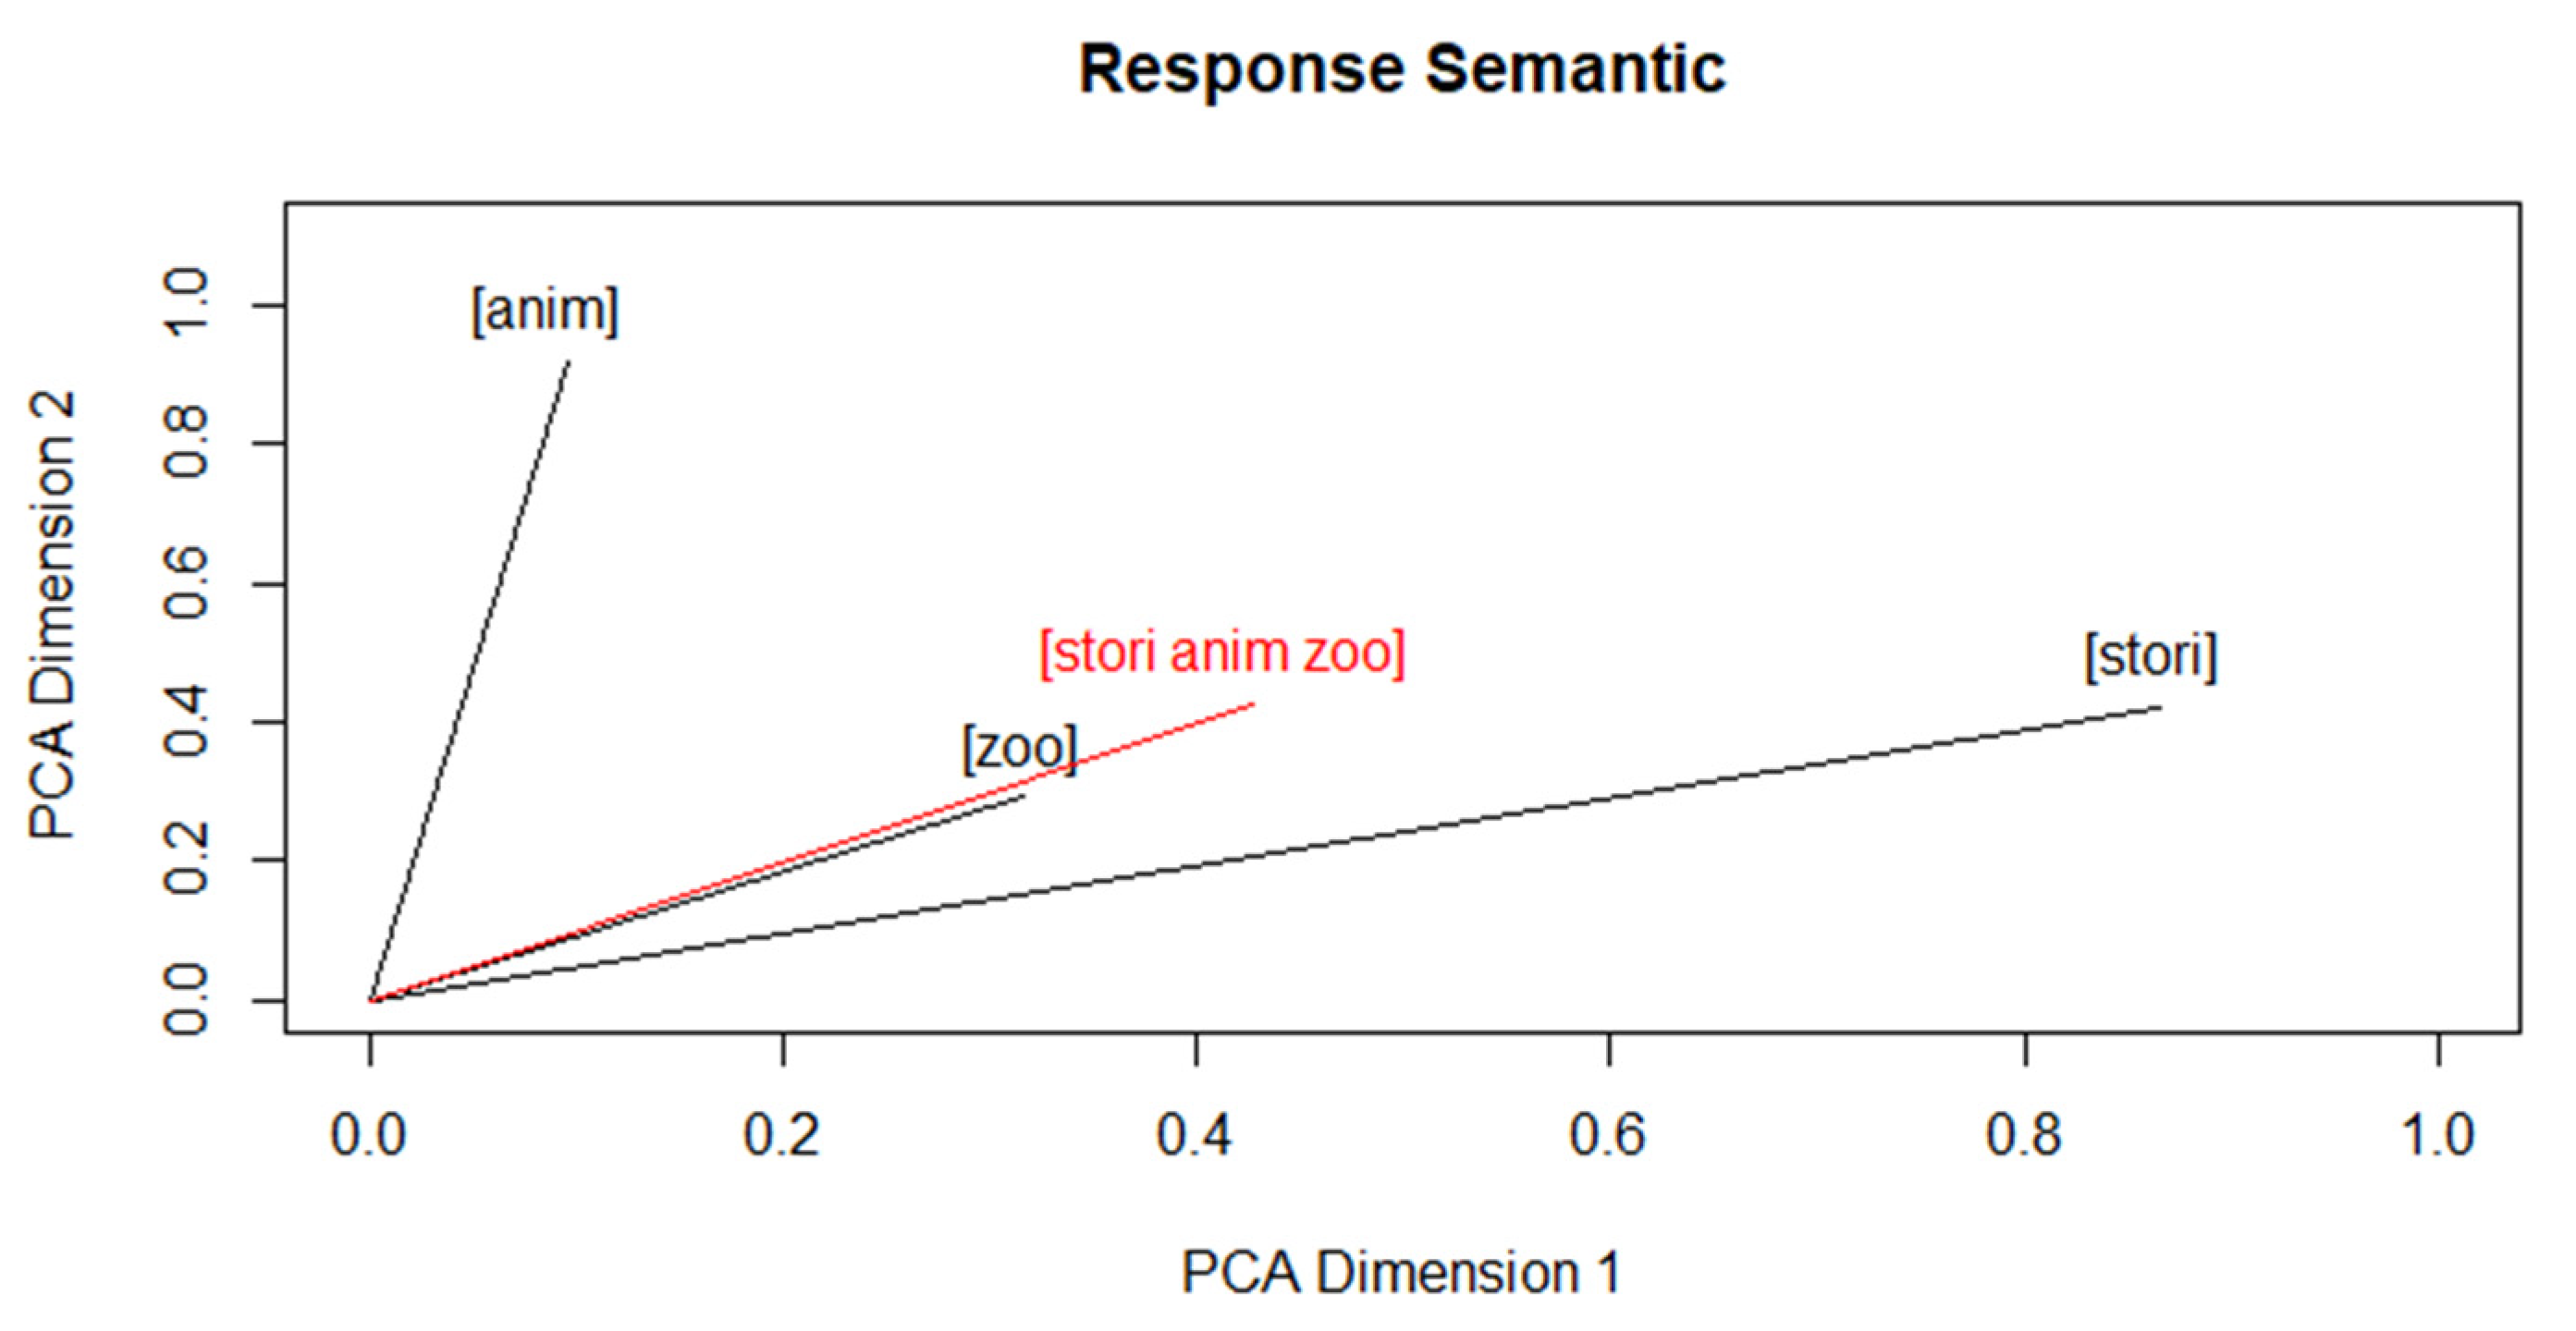
In order to get a response representation from the individual word vectors, these are averaged using their centroid vector (i.e., arithmetic mean for each dimension).
Figure 2 shows the process using the previously preprocessed example sentence.
We use the bag of words paradigm, which means that the word order is ignored when calculating the response vector. On the one hand, this has the advantage of requiring fewer responses to identify response types. On the other hand, word order sometimes encodes relevant information (e.g., compare ‘The cat hunts the bird.’ and ‘The bird hunts the cat.’). With bag of words, such differences in responses may be overlooked. It is always a matter of construct relevance whether this is appropriate or not.
2.4. Response Types
Response types are clusters of responses with similar semantic content. On the one hand, the classification provides the basis for automatic coding assignments; on the other hand, the cluster assignments can be used to explore qualitative relationships (outside of the app). The semantic comparison of two responses works like the semantic comparison of two words by determining the cosine similarity of two response vectors. A distance matrix is created to compare all responses’ (dis-)similarities to cluster the responses regarding their coarse meaning. Zehner et al. [
8] use hierarchical clustering with the Ward fusion algorithm [
23,
24], which yields good results on the evaluated data, is a fast method, and is not NP-hard, which is the case for the popular
k-Means clustering [
25].
We provide different clustering methods to explore individual options and select the method that achieves the best results. Hierarchical methods mostly form clusters of different sizes, whereas k-Means tends to form clusters of similar sizes. The advantage of hierarchical methods is that they are good at detecting outliers, i.e., atypical responses and arranging these responses into individual clusters, which improves the homogeneity of other clusters. In the app’s current version, the parameter k, which represents the number of clusters, must be defined beforehand. Standard methods like the elbow method are typically not suitable in the context of hyperdimensional spaces, which means that the number of clusters has to be determined exploratively. A later version of the app will allow determining the optimal number of clusters more systematically.
In the evaluation process described later on, the optimal number of clusters can be assessed. The optimum is dependent on factors such as the responses’ complexity and the size of the data set. It is essential to form clusters that are as pure as possible in terms of coding since the coding distribution in the clusters forms the foundation for the classification process. At the same time, overfitting must be avoided. If the number of clusters equals the number of data points, each response forms its own cluster. Consequently, in the case of automatic coding, an answer would receive the same coding as the most similar response regarding its cosine distance.
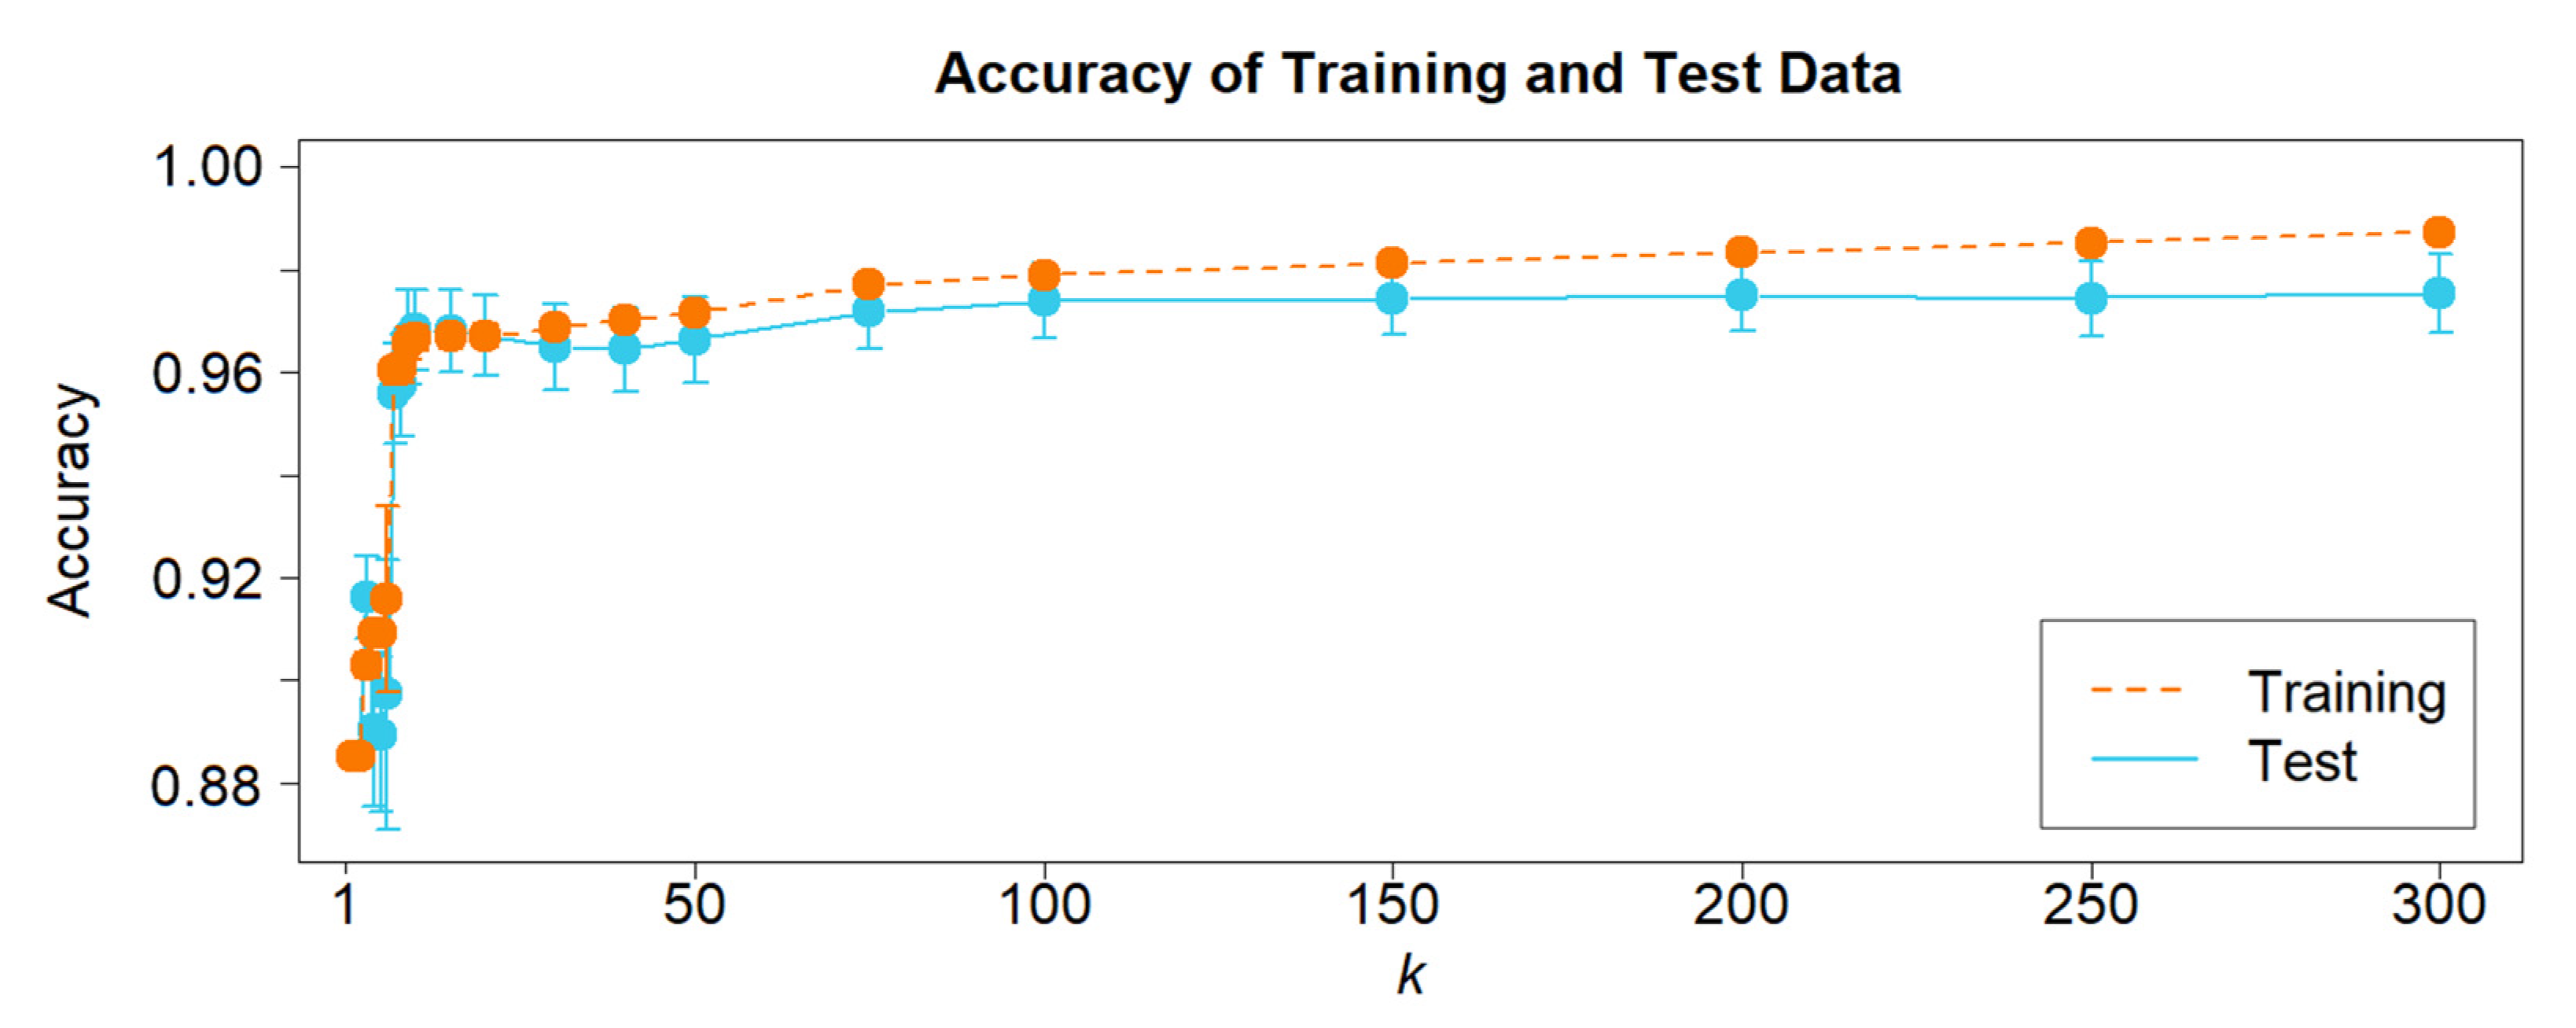
Figure 3 shows the impact of
k on the accuracy of the automatic coding for exemplary training and test data. While the accuracy of the training data increases steadily with the number of clusters, the accuracy of the test data stays nearly constant from
k = 200 clusters. Thus, when
k is too high, this presents the issue of overfitting, so the coding assignments are too specific and cannot be generalized to new independent data. Cluster models tend to be robust in this aspect (see
Figure 3). While the classification accuracy of the exemplary training data set increases steadily with increasing
k, the classification accuracy of the corresponding test data reaches a plateau at about 200 clusters and then only decreases slightly. While this example shows moderate robustness, more sensitive data or methods can lead to a faster-decreasing accuracy after reaching the local maximum.
Now that the automatic coding system has a model of response types, unseen responses can be related to it for automatically coding them. It can be noted that the procedure does not take human coding into account until this point.
2.5. Response Coding
A response’s automatic coding is based on its assignment to a cluster and the code distribution within the cluster. For this assignment, the response is processed under the same preprocessing conditions as the responses in the training data and is also represented in the
n-dimensional vector space. It is then assigned to the cluster with the highest similarity between its centroid vector and the response vector. Finally, the response’s classification is based on the conditional probability
(see Equation (2)). It represents the probability of a response being labeled in a certain way
, given that it is assigned to a certain cluster
. It can be computed via
, which gives the probability that a response is classified as code, or label,
, given it was assigned to cluster
.
The conditional probability calculation is illustrated using an example of a polytomous coding system (
Table 2). We assume that the response is assigned to a fictitious cluster
with 210 responses. Four hundred responses are located outside the cluster, which makes a total of 610 responses.
For each possible code, the automatic coding calculates the conditional probability that the response is classified as certain code , given that it is assigned to a certain cluster . For this, it incorporates the code probabilities , , and , while the cluster probability is . The response is then assigned to the most likely code, or label, regarding the response distribution in cluster . In our example, the conditional probabilities for all possible code assignments are , , and . Thus, if a response is assigned cluster , it is coded as Full Credit (i.e., code 2).
With these rules to classify unseen responses, the resulting classifier finally requires an assessment of its evaluation.
2.6. Evaluation
2.6.1. Repeated k-Fold Cross-Validation
In a final step, the out-of-sample accuracy of the automatic coding process is measured empirically. This way, not only its performance but also its generalizability can be assessed.
Typically, in machine learning, the available data is split into at least two parts, where the majority of the data is used for training and another part is withheld for evaluation. The simplest way of implementing this concept is a hold-out evaluation. There, typically, 70 percent of the data is taken to train the model, and the resulting classifier is then evaluated based on the remaining 30 percent. Since responses are assigned randomly to either the training or test set, this simple split potentially leads to higher or lower performance results randomly. Thus, to increase its reliability, the evaluation with its random assignment should be repeated, and performance results aggregated across evaluation cycles.
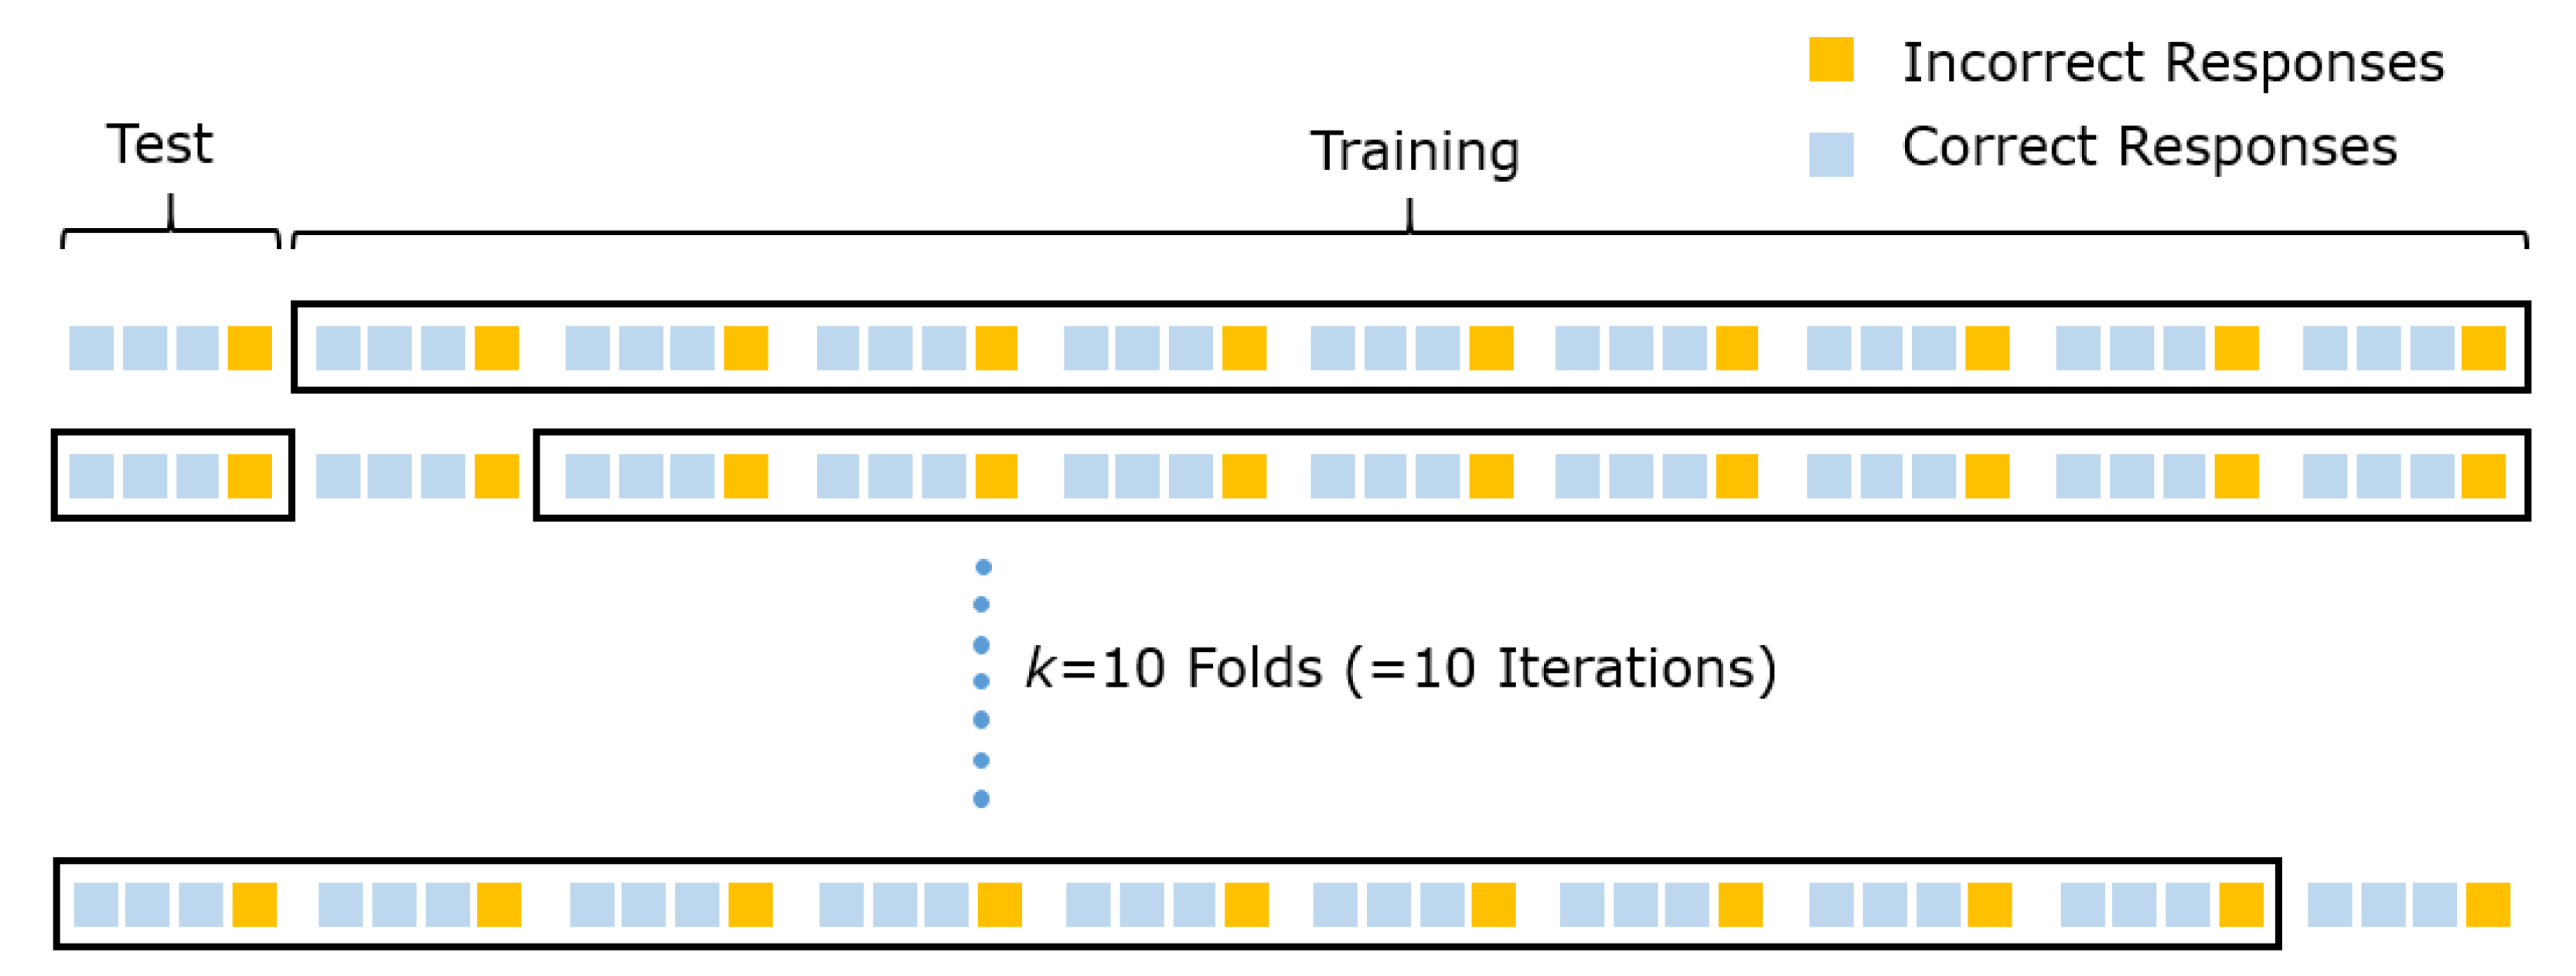
Ideally, training is carried out with as much information as possible. Therefore, the optimal implementation of this concept is leave-one-out cross-validation, which only removes one response for training. However, leave-one-out cross-validation is computationally highly expensive because it requires as many repetitions as there are responses. Hence, we instead use a repeated, stratified
k-fold cross-validation strategy (
Figure 4). Please note that
k here represents the number of folds, not the number of clusters.
For this, the data are divided into k folds (i.e., parts), with one fold being withheld for evaluation and the remaining data serving as the training basis. As an example, let us consider a data set with 1000 responses, of which 75 percent are classified as correct and 25 percent as incorrect. The split of the data set leaves us with ten folds, each containing 100 responses. Importantly, each fold contains 75 correct and 25 incorrect responses, mirroring the complete data’s code distribution. In its first cycle, the cross-validation trains the classifier (i.e., the cluster-based Bayes classifier) with 900 responses and tests its performance on the remaining 100 ones. This process is repeated k (here, ten) times until every single fold constituted the test set once. In turn, the entire process with k evaluations can be repeated t (often, ten) times to minimize the influence of the random assignment to folds. The final evaluation measure results from aggregating the evaluation results.
As to which measures can be used for evaluation, this is part of the next section.
2.6.2. Evaluation Metrics for Dichotomous Items
As automatic coding is a classification problem, its evaluation is based on a confusion matrix with
l ×
l cells, where
l is the number of possible codes. For a simple showcase, see
Table 3; this is a 2-by-2 matrix. In this dichotomously coded example, the code ‘correct’ is considered as the positive class. By comparing the predictions with their true codings, various measures can be used to assess classification quality.
Accuracy is the simplest measure. It gives the percentage of all correctly coded responses compared to the number of all responses. It is computed by the sum of correct predictions relative to the total number of predictions (see Equation (3)).
The measure offers a first indication of the classifier’s quality, but its interpretation should always incorporate the code distribution. That is, if 85 percent of the responses were correct and a naïve baseline system assigned the code ‘correct’ to all responses, it would already attain an accuracy of 85 percent. Thus, responses with a skewed distribution naturally receive a higher value. In order to evaluate coding quality beyond random chance granted by the code distribution, Cohen’s kappa [
26] is a central measure for coder agreement (see Equation (4)), where
indicates the relative agreement between all correctly predicted codings
in comparison to expected chances
.
Kappa’s values range between
while
means a perfect agreement between the machine predictions and the manually coded test data. A value of
means there is no predictive power, and the predictions are as good as chance, and they could also be reached by random guessing. Values of
means that the predictions are less accurate than the chances and can indicate methodological problems if it is highly negative. Examples and interpretation guidelines can be found in [
27].
Since, as a measure of agreement, kappa’s sampling distribution is similar to the sampling distribution of correlation coefficients, the agreement values attained in each evaluation cycle of the k folds are converted using the Fisher z-transformation before and transformed back after aggregation.
In addition to those two measures to interpret classification success, further metrics are integrated into the evaluation process.
Sensitivity indicates the ratio between true positives
TP to all positives
P,
while specificity is used to show the relation of the correctly predicted negatives
TN to all negatives
N,
and precision shows the relation of all true positives
to the sum of all
TP and false positives
FPPrecision, as well as sensitivity and specificity, provide more detailed insights into the coding process, in particular, whether codings are biased in a certain direction. The F1-Score unites precision
PPV and sensitivity
TPR into a single score, which also allows it to be used alongside kappa and accuracy as a measure of coding success,
2.6.3. Evaluation with Polytomous Coding
If the responses are coded with more than two levels, it is possible to evaluate the classification of each code individually. For each code , a confusion matrix is formed in which the respective code can be regarded as positive and all other codes as negative. On this basis, measures of accuracy, kappa, or sensitivity and specificity can be calculated and compared with each other.
2.6.4. Partial-Credit Scoring or Ordinal Coding
The ordinal character of partial credit scoring, or ordinal coding more generally, is not taken into account in our automatic coding approach. This is the case because we identify response types based on a semantic space. Such semantic spaces do not encode information about the superiority or inferiority of one or the other response type. Instead, we assume that certain areas of the semantic space are associated with a certain code. Responses are, thus, nominally assigned to scores based on their semantic features. However, this procedure does not preclude the use of ordinal codes as long as there is sufficient code separation through semantics.
For the evaluation of polytomous codes with an ordinal character, quadratic weighted kappa [
26,
28] can be used. This agreement coefficient weights classifications with respect to the distance between the automatic and manual codes. This way, misclassifications of adjacent codes are penalized less than those that have at least one other code in between. For example, an automatic coding’s misclassification of a response which actually is a Full Credit response as No Credit is more penalized in this coefficient than when it would have assigned Partial Credit because the latter is closer to the target code. With quadratic weighted kappa, in particular, the distance between the code levels is not linearly equal, but it is squared.
3. ReCo’s Shiny App: shinyReCoR
While the previous section described the underlying methods, this section now outlines how you can download, install, and use the app shinyReCoR. It is loosely based on the program ReCo (Automatic Text Response Coder), which lacks a graphical user interface. With shinyReCoR, you can build classifiers for automatically coding your text response data without the need for scripting in R.
3.1. Download and Installation
This command causes R to execute an R script which downloads the package from our secure server as well as any required dependencies from a CRAN mirror. In order to see what the script does, users can type the URL above into a web browser and inspect the script. Alternatively, the package can be downloaded and installed manually via our website (
www.reco.science). Once the installation is complete, a message confirms the installation success in the R console.
3.2. Troubleshooting
Regarding different R setups, certain file system structures can lead to difficulties. For example, if R’s library path is located in a folder with limited access rights (e.g., Windows program directory), shinyReCoR cannot write required files. In such a case, by running the program with administrator rights, the app will be granted access, and the program will run as planned.
Moreover, the package’s setup can fail on Windows if Rtools40 is not installed beforehand. If this is the case, the automatic setup routine will notify the user.
Bug reports are collected and published in its repository, along with recommended solutions.
3.3. First Steps
Now, how does automatic coding work with shinyReCoR? The following part describes the response coding pipeline from the user’s perspective. The section can also be used as a guide which to consult while using the app. Please also note that all workflow steps display an information column on the left, presenting instructions on the current step.
3.3.1. Starting the App
After successful installation, the app can be started by entering the following command into the R console:
shinyReCoR::recoApp() Alternatively, the library shinyReCoR can be loaded, and then the function
recoApp() needs to be called separately. Both variants will launch the user interface. Depending on whether RStudio is used, the interface will open in the web browser or RStudio’s built-in viewer (
Figure 5). The users then find themselves directly in the first step of the response analysis. There is also the possibility of switching to the tabs for creating or managing projects as well as accessing further information (e.g., to see how the demo item and its responses are designed) and setting up the system (e.g., to enable parallel processing). On the left side is a permanent column with background information on the step the user is currently working on.
3.3.2. Managing and Storing Your Items in Projects
Something Shiny users are usually not used to is that shinyReCoR allows storing their results across sessions. That is, even if the app is closed, the products of the previous session will still be available without the need for the user to export and import them. This is achieved via projects.
One separate project must be created for each item and its responses intended to be coded automatically. This comprises the responses and codes after the data import. A single project is focused on building a coding model (i.e., classifier), dependent on the responses to one item. While the user interface will always display English texts, it is important to select the project’s test language because external information such as language-specific dictionaries for spelling correction or stop-word lists are required.
3.3.3. Demo Dataset
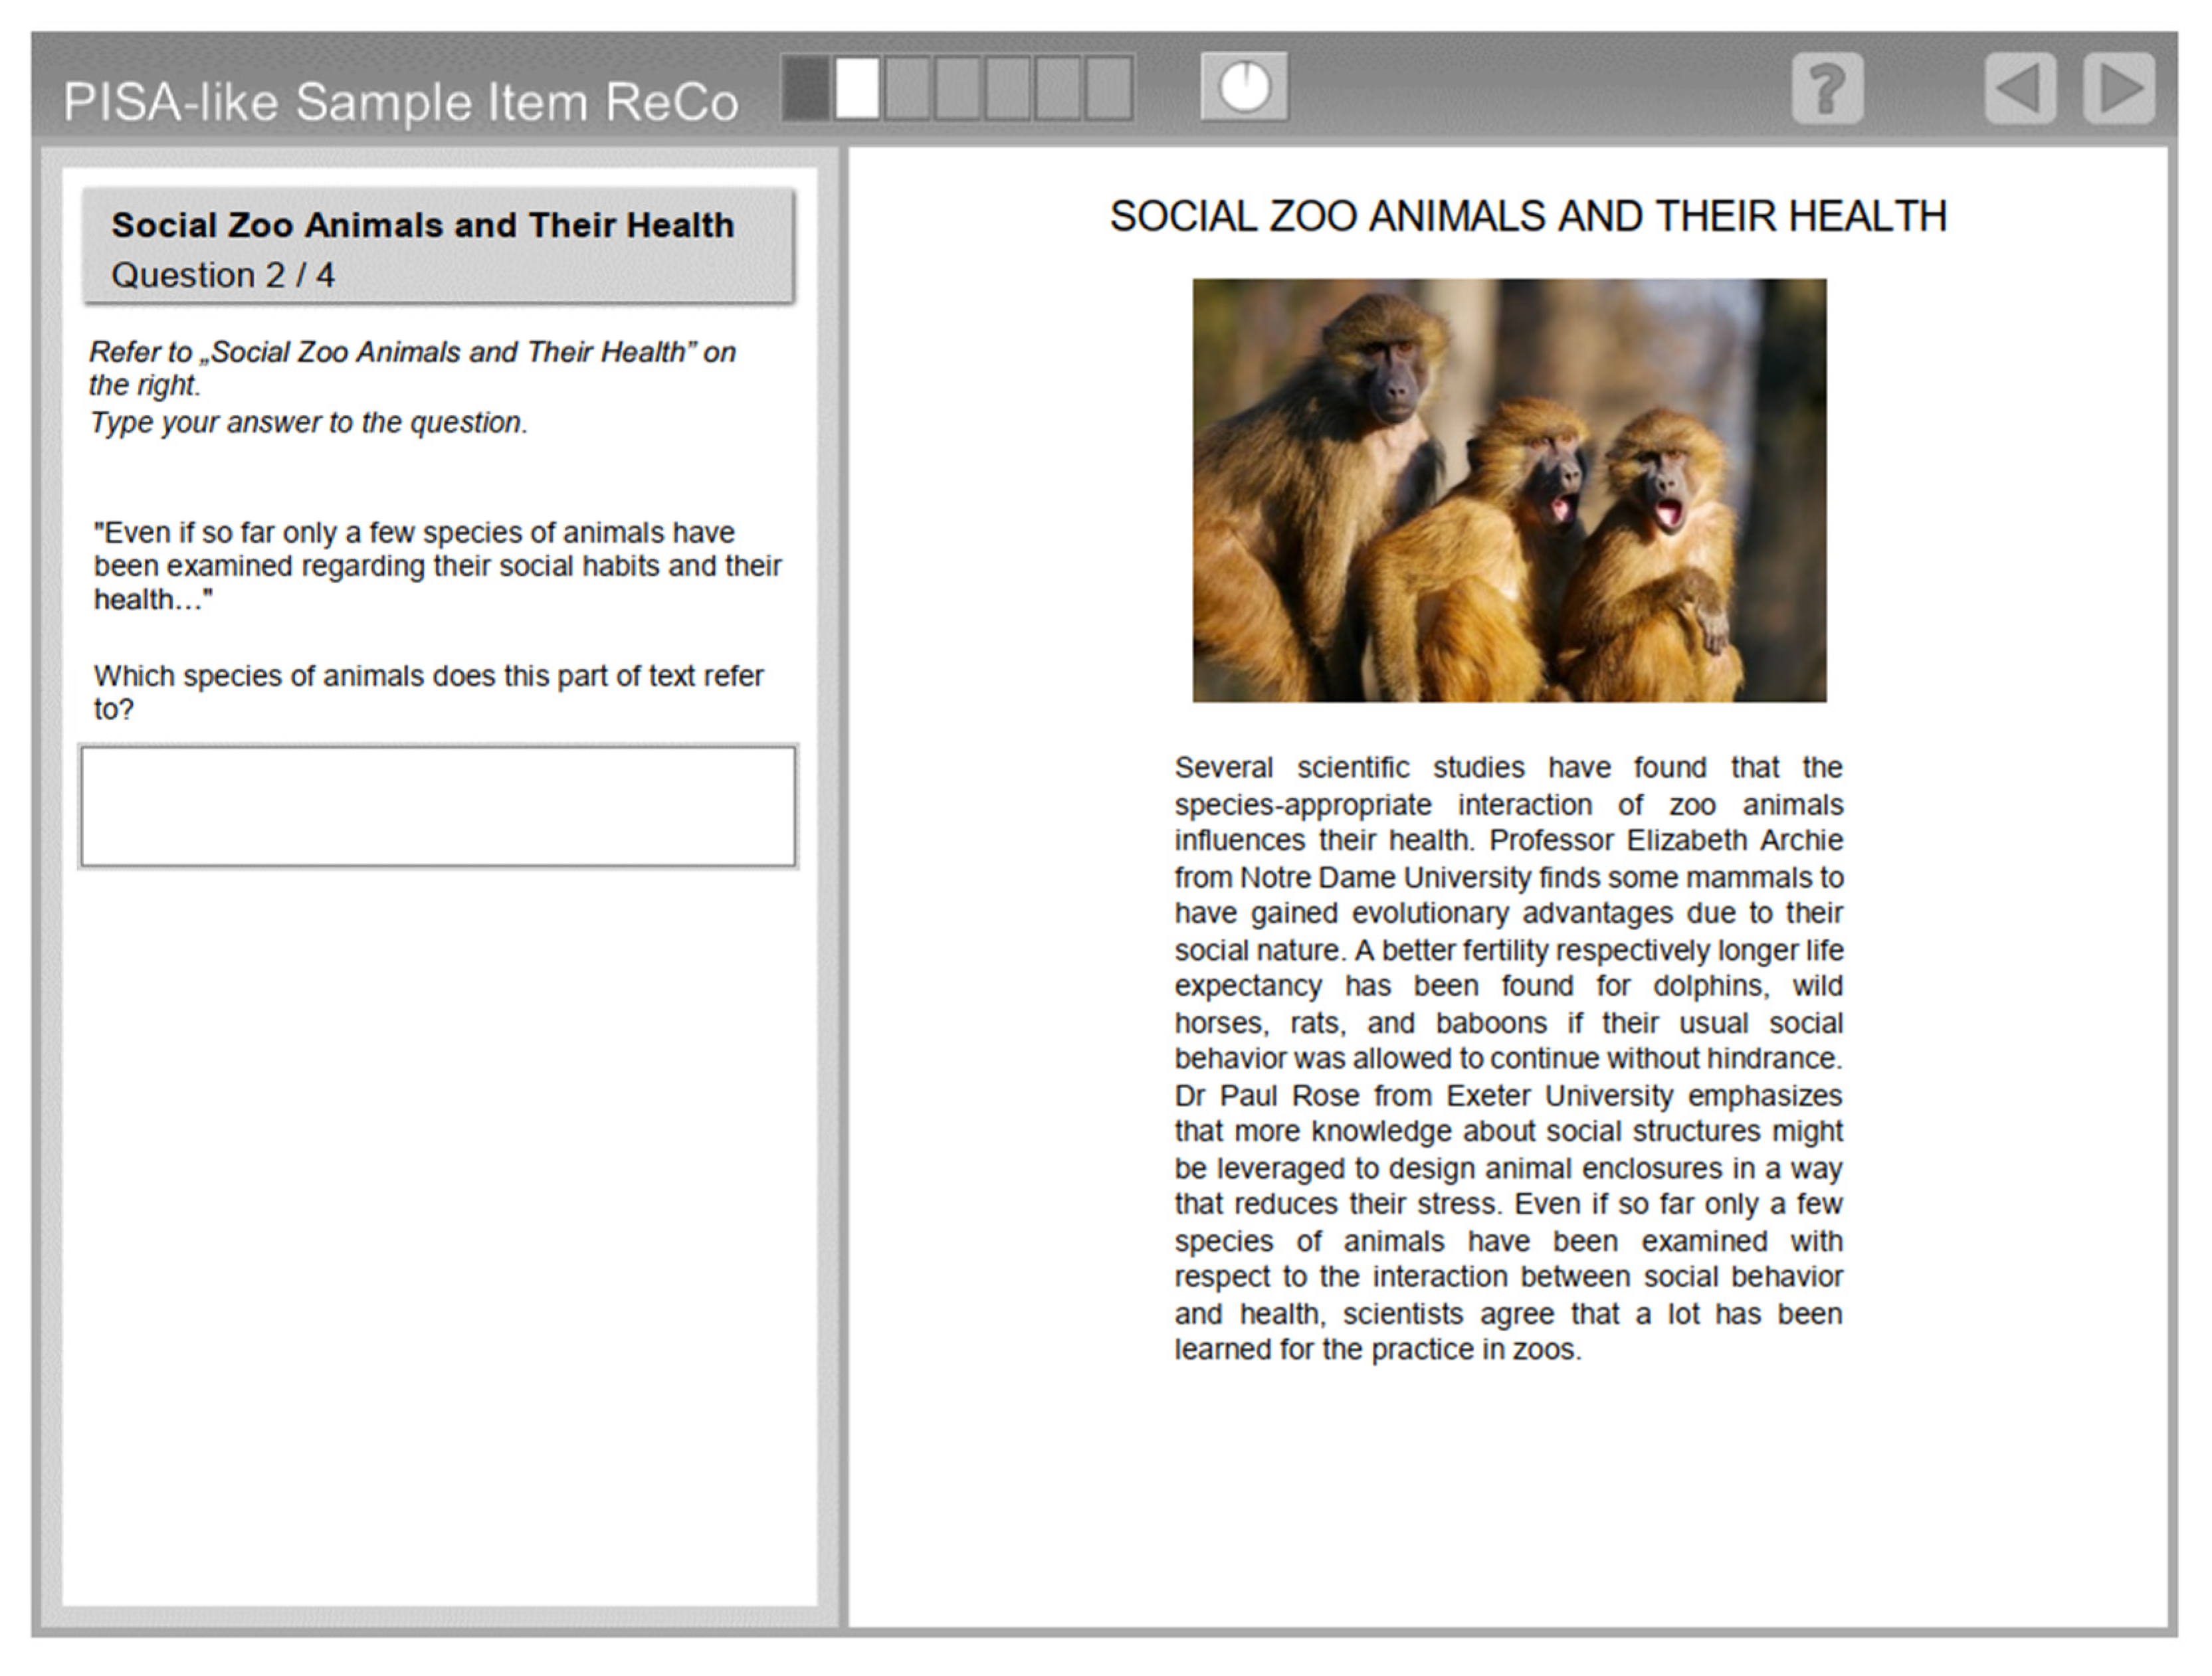
The package includes a demo item with empirically-based but actually simulated responses to a fictitious educational large-scale assessment task for measuring reading literacy. The item and its responses are recreated from a real-world empirical data collection by semi-automatically replacing words with corresponding words from the fictitious task, including adapted spelling mistakes and empty responses. Item confidentiality prohibited the use of the actual empirical data, but this way, we were able to provide a simple response set with mostly realistic responses and a prototypical number of student responses for a large-scale assessment
The item is a fairly simple task (
Figure 6) that only requires naming at least two of four animal species from a text. The codings nominally discriminate between correct and incorrect responses (coded as 0 and 1, respectively). The response data set is used as a running example in the following sections to illustrate the analysis. We chose to use a simple data set at this point because it allowed us to manually reconstruct a large number of responses and keep a realistic assessment character. More complex responses can typically lead to lower performance.
3.4. Response Analysis: From Data Import to Exploring the Classifier
The following subsections describe the workflow from importing the response data together with manual codes to exploring the resulting classifier for automatic coding. After one analysis step is completed, the user can either choose the next numbered workflow tab at the top of the app or navigate through the workflow using arrow buttons on the top right.
Some methods in the app (i.e., stop word removal, automatic spelling correction, and text corpus for building the semantic space) rely on language-specific dictionaries, making the provision of methods dependent on available resources. This is why only a selection of languages are supported. Currently, users are limited to English and German response texts, although other common languages will be included in future versions.
3.4.1. Upload and Structure Data
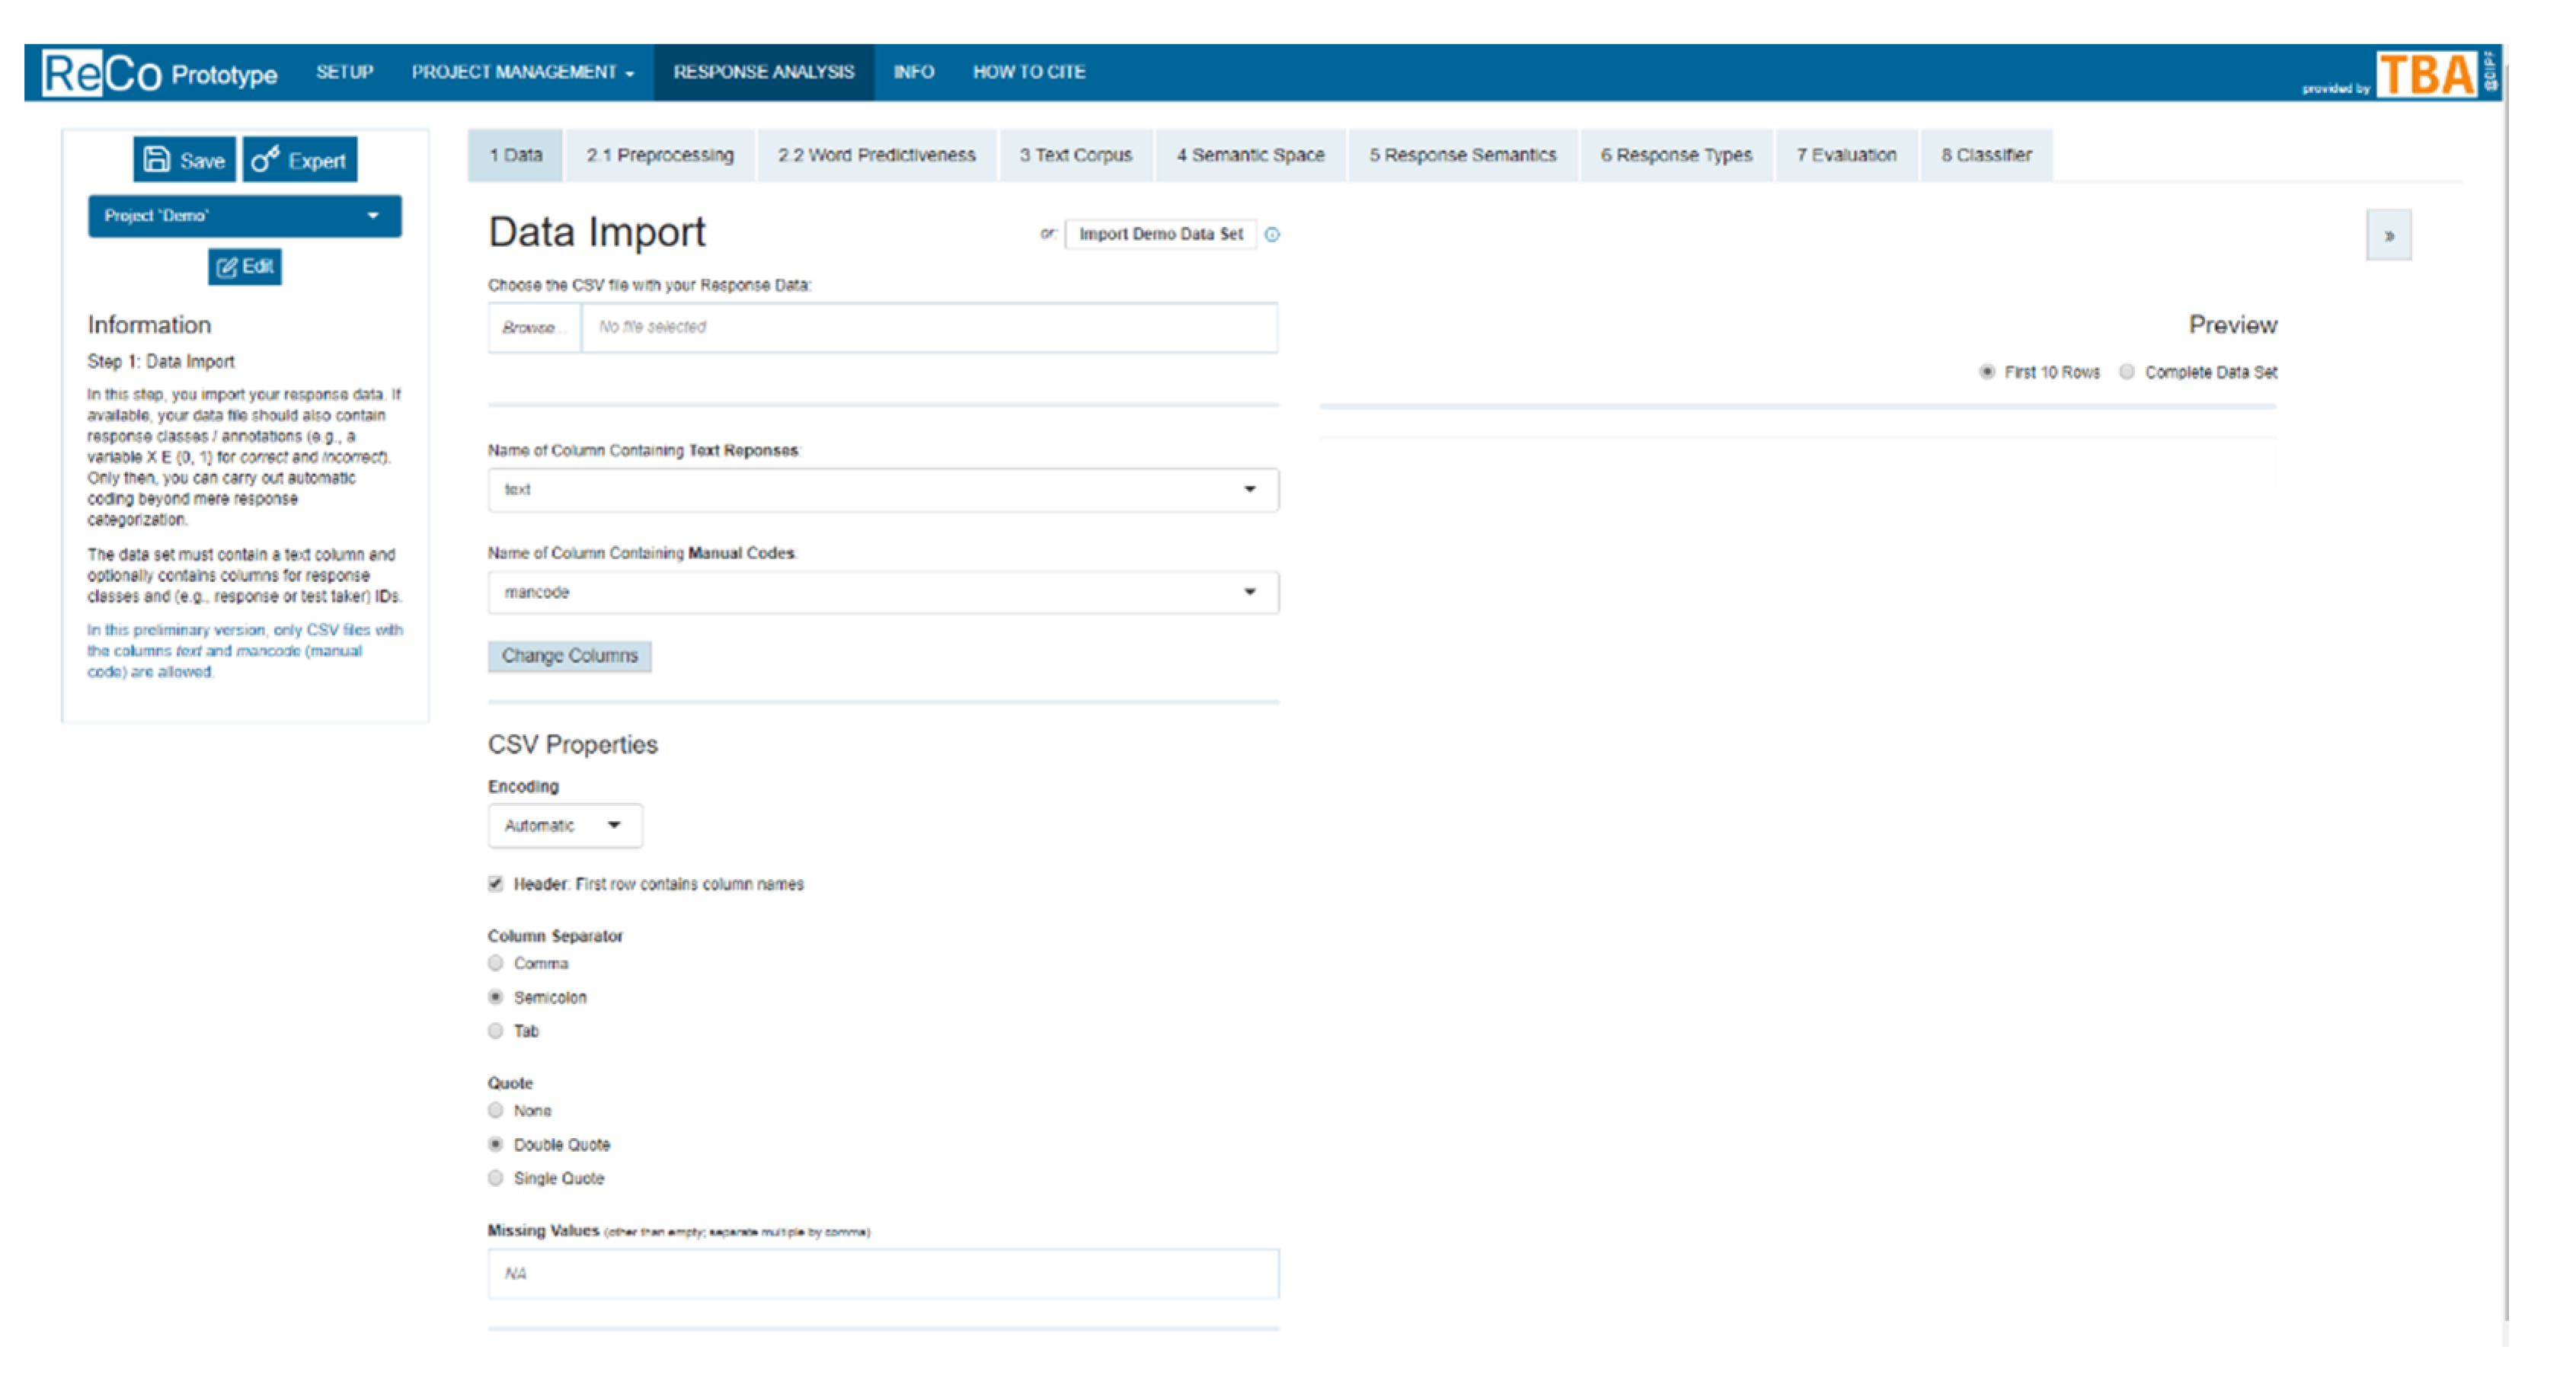
In the data import section (1 Data), which is the first step of the response-analysis pipeline, the response data are imported into the app for further processing.
This requires a specific data structure. The data should not include responses to more than one items or tasks. The response data set must have at least one response column with text and, in the app’s current version, should have a column with the manual code (
Figure 7). The interface provides the ability to select which column contains the response texts and which one contains the codes.
With this, all information needed to apply automatic coding is given. It is essential to have one unambiguous code assigned to each response. If the file contains codings of several raters, they should be reduced to one beforehand; for example, by determining the modal value. If the data set contains additional variables beyond the response and code columns (e.g., ID), these can be kept in the data set. Later on, intermediate results and responses’ cluster assignments can be exported as a complete data set. Once the data are imported and the relevant columns selected, the input data can be inspected in a table.
Alternatively, users can choose to import the demo data set that is delivered with the package. For this, the button OR: Import Demo Data Set can be used.
3.4.2. Preprocessing and Word Predictiveness
The preprocessing of texts in natural language processing is common to reduce unnecessary linguistic variance. shinyReCoR offers a range of preprocessing techniques (
2.1 Preprocessing) that can be applied in different combinations. The user can spellcheck and decapitalize the responses as well as remove digits, punctuation, and stop words. Lists of stop words are predefined and can be customized for each project. With stemming, the words are reduced to their word stem, which cuts off affixes of words based on a simple set of rules [
22]. The combination of chosen preprocessing techniques directly impacts the processed responses. Both text views, original and processed, are shown interactively so that the effect of each technique on the responses can directly be assessed. Users can choose between an example text as well as a sample from their response data. All preprocessed responses can be inspected in an interactive table via the button
View Preprocessing Results.
Once the responses have been preprocessed, the next step (
2.2 Word Predictiveness) provides insights as to what words (more precisely, tokens) are predictive for each code. If certain words contained in responses have a strong association with the response’s overall code, they are crucial for automatic coding. This view provides the user with information on the frequency of single tokens and their value for predicting the overall code. The latter is operationalized as
-value (see [
29], pp. 169–172); the higher the value, the stronger the association between the token and dominant code.
3.4.3. Text Corpus, Semantic Space, and Response Semantics
The next step (3 Text Corpus) constitutes the base for building a semantic space in the subsequent step (4 Semantic Space). In turn, the semantic space then serves as the base for computing the response semantics (5 Response Semantics).
A quality text corpus is essential when translating qualitative text data into a numerical representation. In the long run, the app provides two ways for choosing a text corpus. First, users can specify important topics on the basis of which the app collects texts from Wikipedia that are relevant for the response data at hand. This feature is not included in the current version but will be in the next release. Second, the app offers to choose pre-built corpora and semantic spaces. The following focuses on this second path as it is available in the currently released app.
The app allows using pre-built semantic vector spaces to match the words with their word vectors. The corpus is processed with the same preprocessing technique as the responses. Most crucially, it should contain as many words that are relevant to the item contents as possible. As touched upon above, future versions will provide a semantic vector space generator that uses keywords to search item-relevant documents from a Wikipedia dump to build a custom vector space using LSA [
12]. Moreover, additional larger pre-built domain-specific semantic spaces will be available for download. The data size of the semantic space depends on the number of words, number of dimensions, and number of decimal places, with a typical space ranging from 100 MB to 1 GB. Due to the file size, only a small general space is included in the base package. Additional spaces can then be downloaded within the app.
As already mentioned, the coverage of words is of great importance so that no relevant information is lost. When the text corpus is selected, the coverage of words that are contained in the responses is calculated and displayed, making it easy to determine the optimal corpus and space.
When using the demo data set, users can select the pre-built corpus SocialZoo.
After the selection of the text corpus, the next step (4 Semantic Space) allows exploring the selected or built semantic space. An interactive 3D plot shows the positions of words contained in the response data within the semantic space. The plot also encodes words’ frequency in the response data set (not in the text corpus) in the dots’ colors. Please note that dimensionality reduction techniques reduce the hyperdimensional semantic space here. In addition to interacting with the visualization, users can also enter word pairs and compute their semantic similarity or inspect the complete list of tokens covered by the selected semantic space.
3.4.4. Response Semantics and Response Types
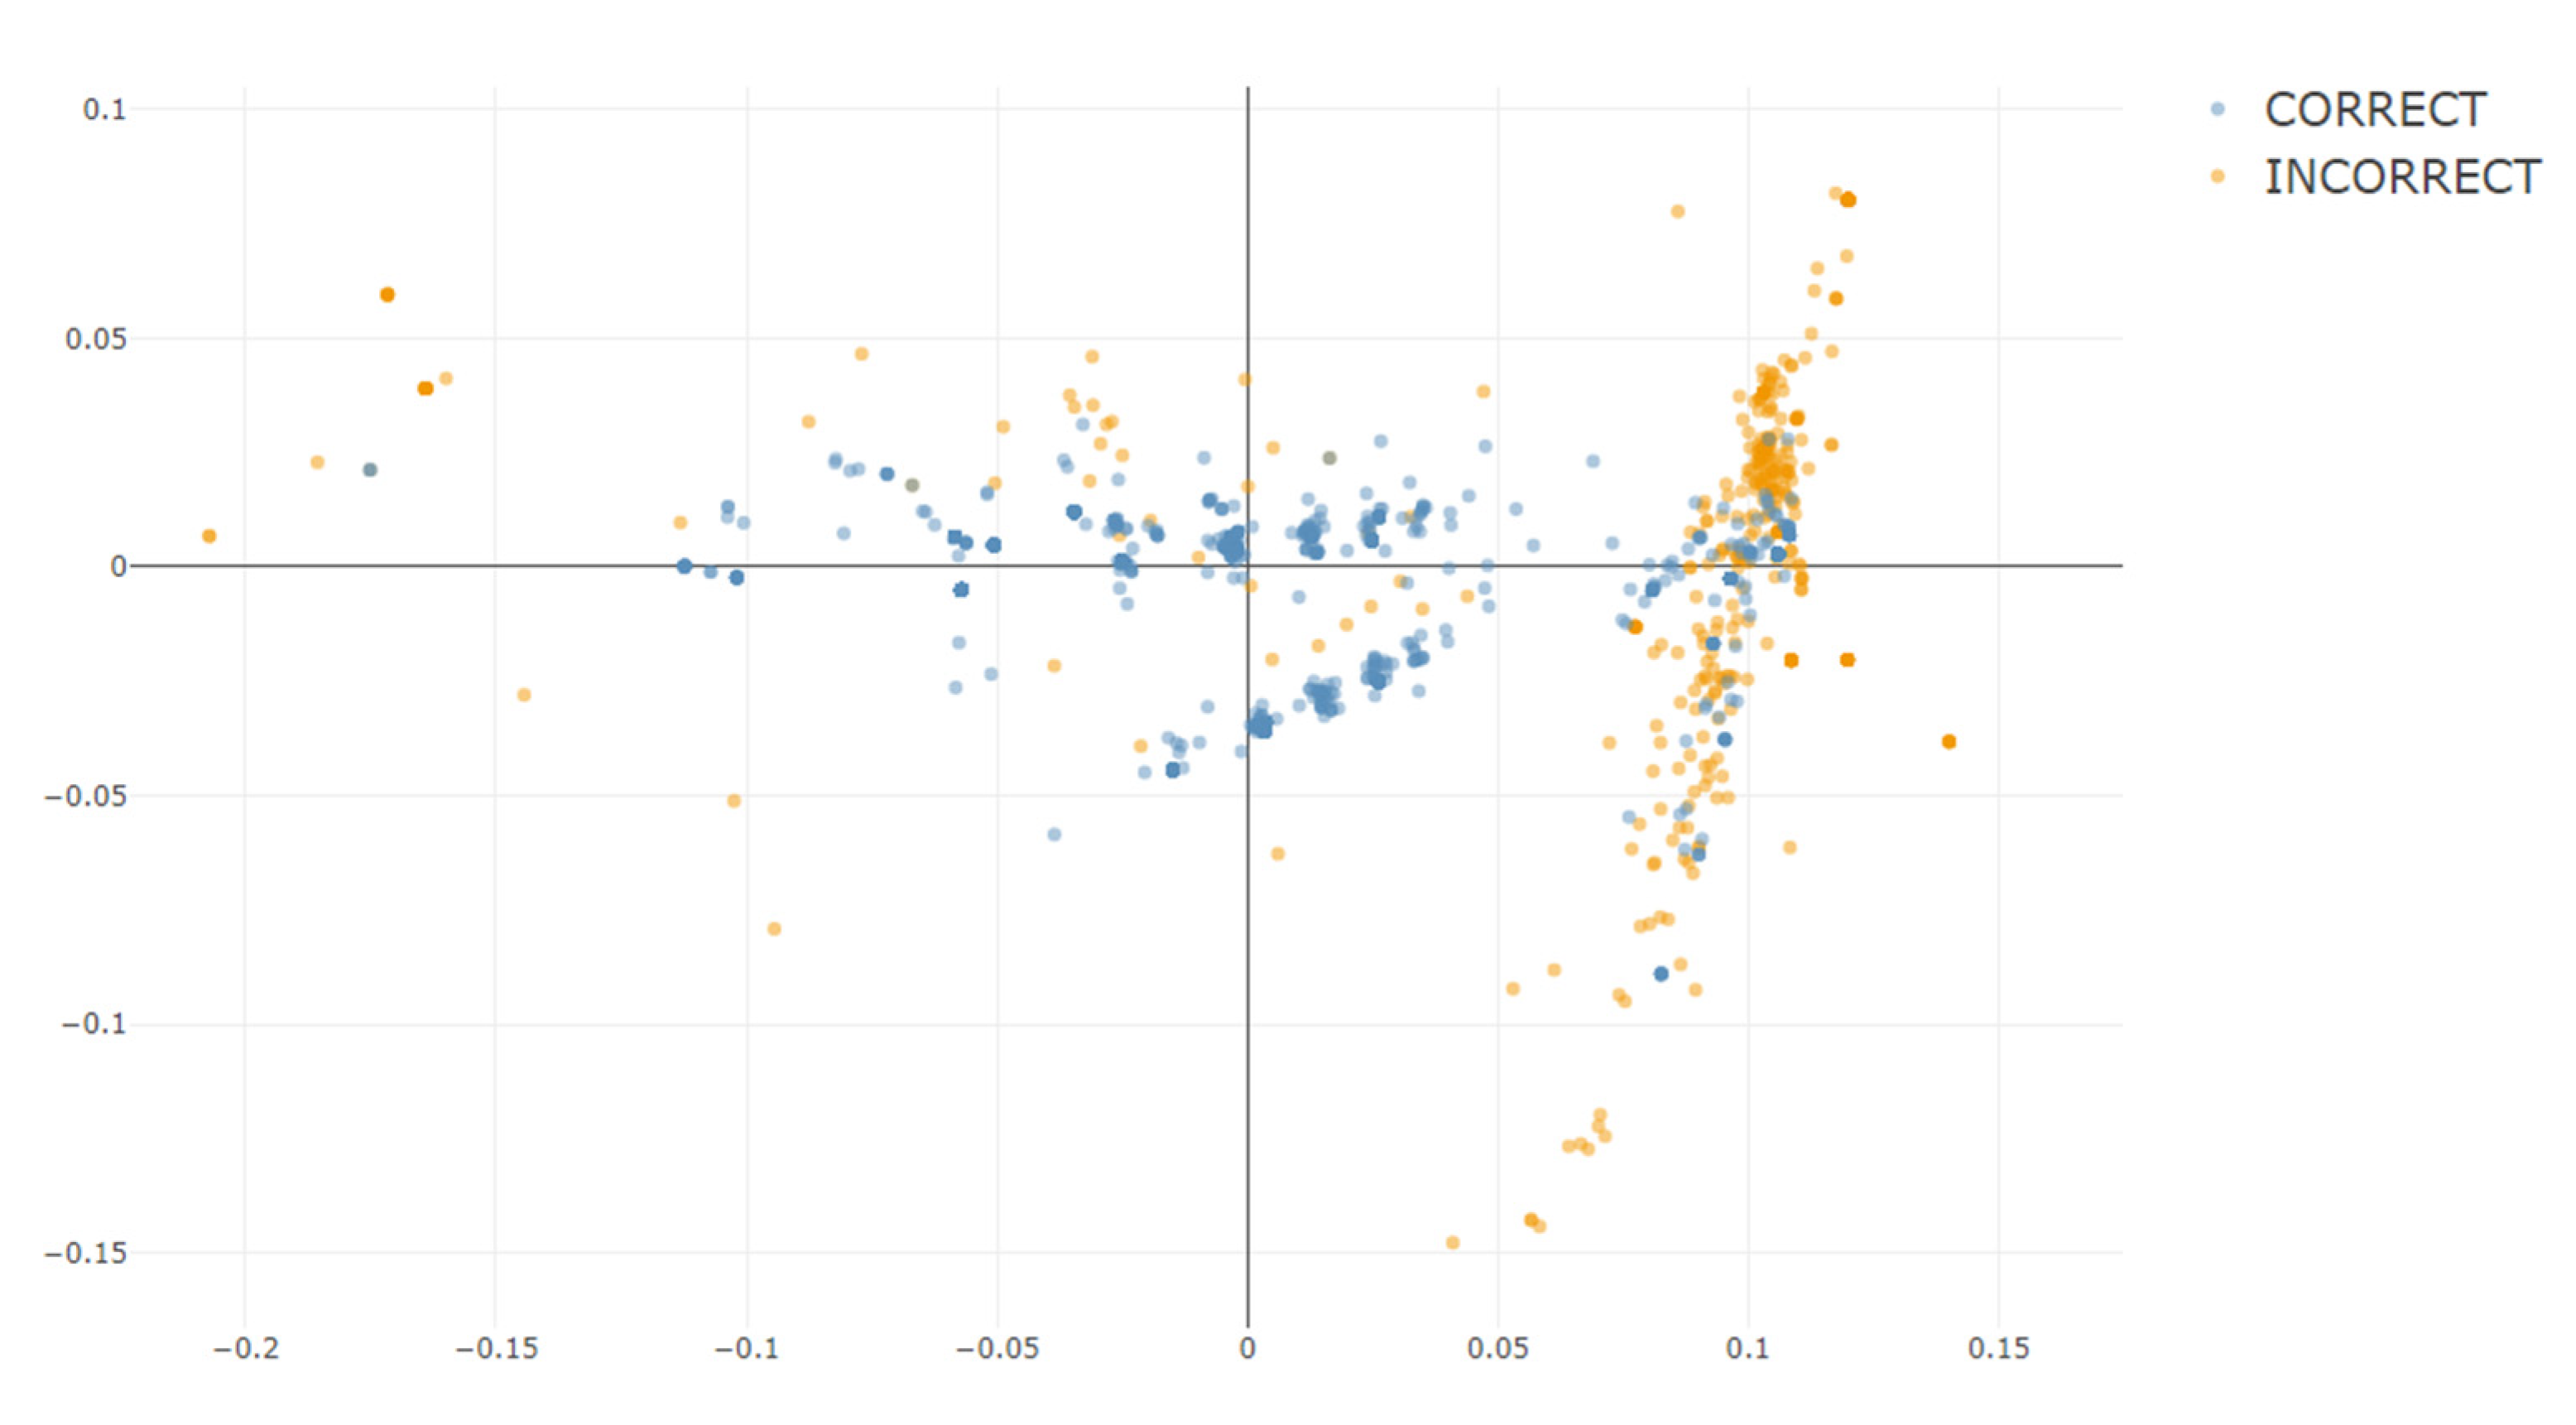
After this exploratory one, the next step (5 Response Semantics) is crucial. It projects the response data into the selected semantic space. For this, users press the button Compute Response Vectors. After some time, during which the app computes the centroid vectors of all responses, the progress bar at the bottom right disappears and is replaced by a plot similar to the previous one. The plot visualizes the responses. A table presents the response vectors.
The similarity of the responses can be measured by their spatial proximity and angles. The spatial representation in the space, reduced to two or three dimensions via dimensionality reduction, allows visualizing the semantic space.
Figure 8 shows a two-dimensional representation of the demo data’s response vectors in the app. Every dot represents a single response within the data. For a better visual overview, the responses are displayed as dots and not as vectors. The different colors indicate the different response codes. Apparently, in the demo data set, the response vectors separated spatially well concerning their codes, which provides a good foundation for the next step.
Based on these response vectors, the next step (6 Response Types) aims to identify homogeneous groups of responses and to separate those from other, distinguishable groups of responses. For this, the user selects the distance measure, clustering method, and the number of clusters. At this point, the app does not support the user in finding the optimal number of clusters. In the future, it will do so by reporting performance results in relation to the number of clusters and measures of clustering quality such as Average Silhouette Width. Currently, the user can find the optimal solution by carrying out the clustering (Button Create Clusters) and inspecting cluster purity in the resulting table on the right as well as using cross-validation for evaluation in the next step.
Once clustering is completed, the app displays another interactive table on the right that allows detailed diagnostic investigations. The table displays each cluster’s code distribution and the number of assigned responses. Obviously, clusters should be as homogeneous as possible concerning their codes, which is summarized in the entropy measure [
30] (the closer to 0, the purer).
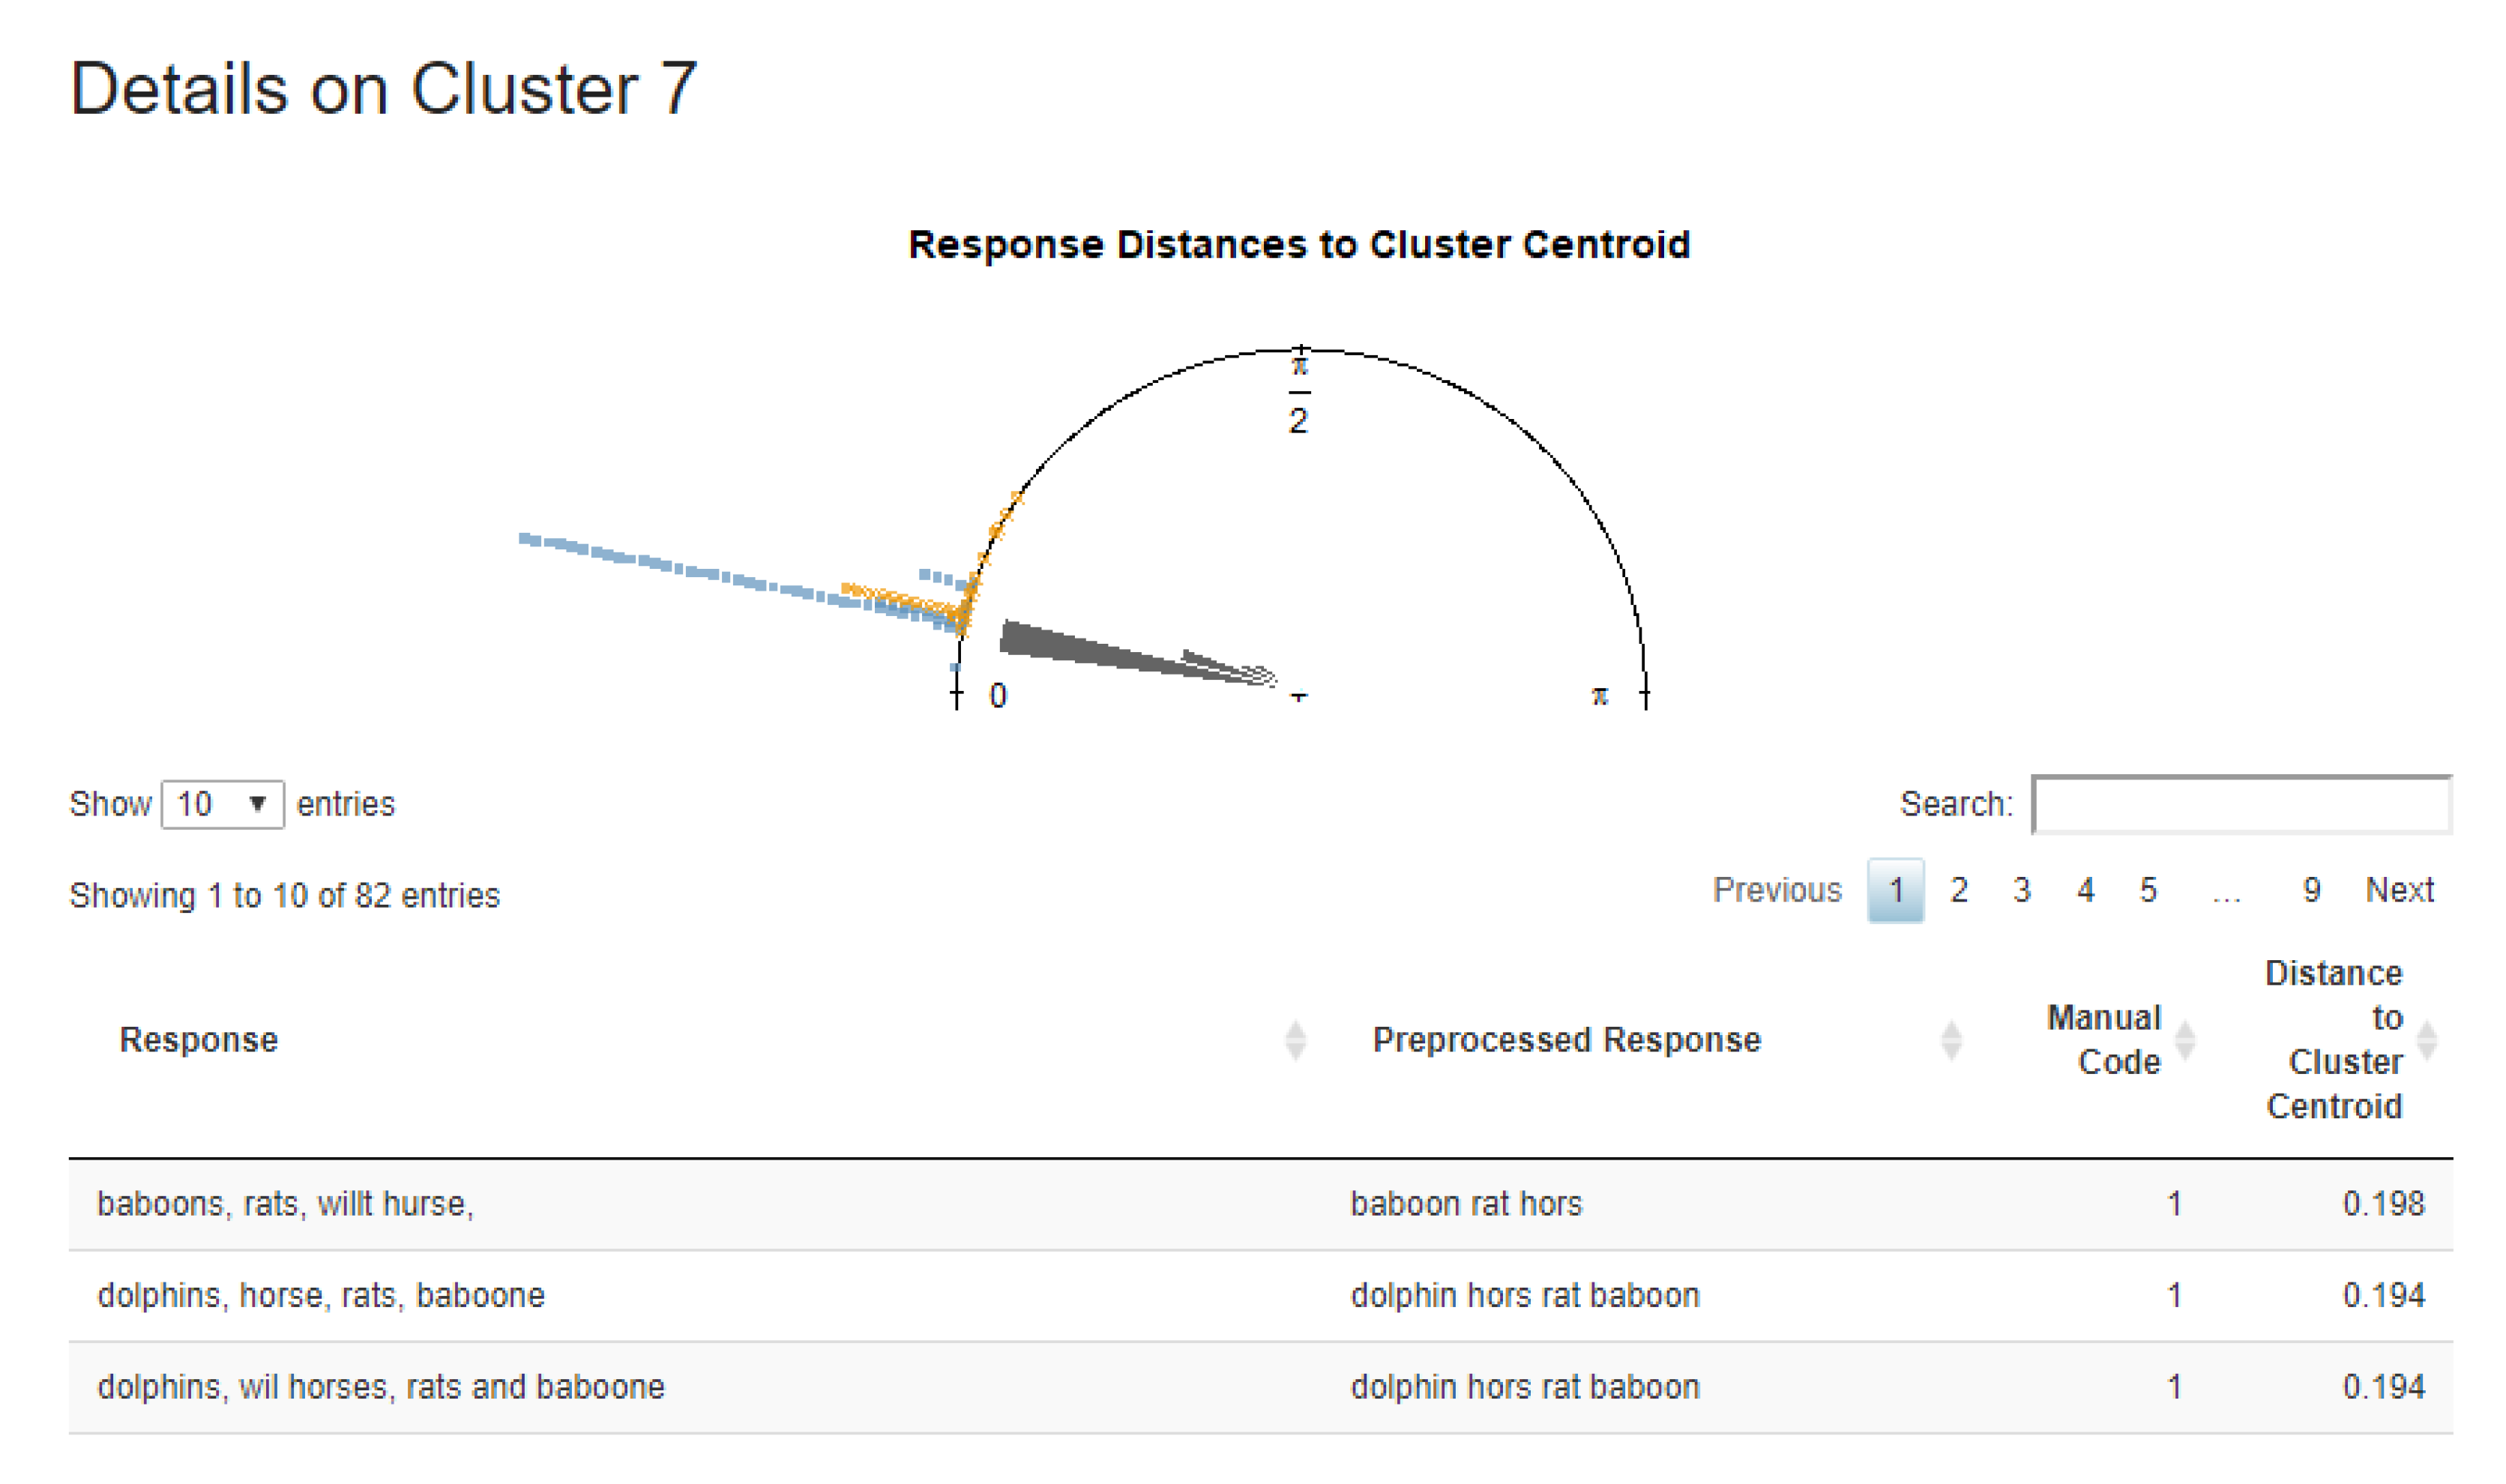
Furthermore, via a click in the
Details column, each cluster can be investigated more closely. The appearing dialogue (
Figure 9) shows a table with each response’s distance to the cluster centroid to which it is assigned. One usage of this table is to sort the table by codes in order to identify misclassified responses in that cluster. Moreover, the top shows a summary for the cluster in the form of (half) a rose diagram, which visualizes the distribution of angles to the cluster centroid. The distribution’s dispersion, the mean’s shift from 0, as well as the distances of deviating responses concerning their code are of particular interest in this diagnostic plot.
3.4.5. Evaluation
Testing the coding methods of the automatic classifier and seeing how it codes different responses can be exciting, but its practical implementation requires systematic evidence-based reasoning; in other terms, evaluation (7 Evaluation). The app offers a stratified, repeated k-fold cross-validation, which splits the data into k parts and each part is used as the test set once. This procedure is repeated t times. Both parameters, k and t, can be defined manually. In the end, the evaluation results are aggregated, serving as a proxy for out-of-sample performance.
Usually, 5- or 10-fold evaluation strategies are used. However, the definitions of k and t should be based on the size of the data set and the coding distribution. For a 10-fold strategy evaluating a data set with 100 responses and a skewed response distribution in which 90 percent of the responses are coded as correct, there will only be one incorrect response in each fold due to stratified assignment. In this example, the evaluation could be optimized by smaller folds or more repetitions.
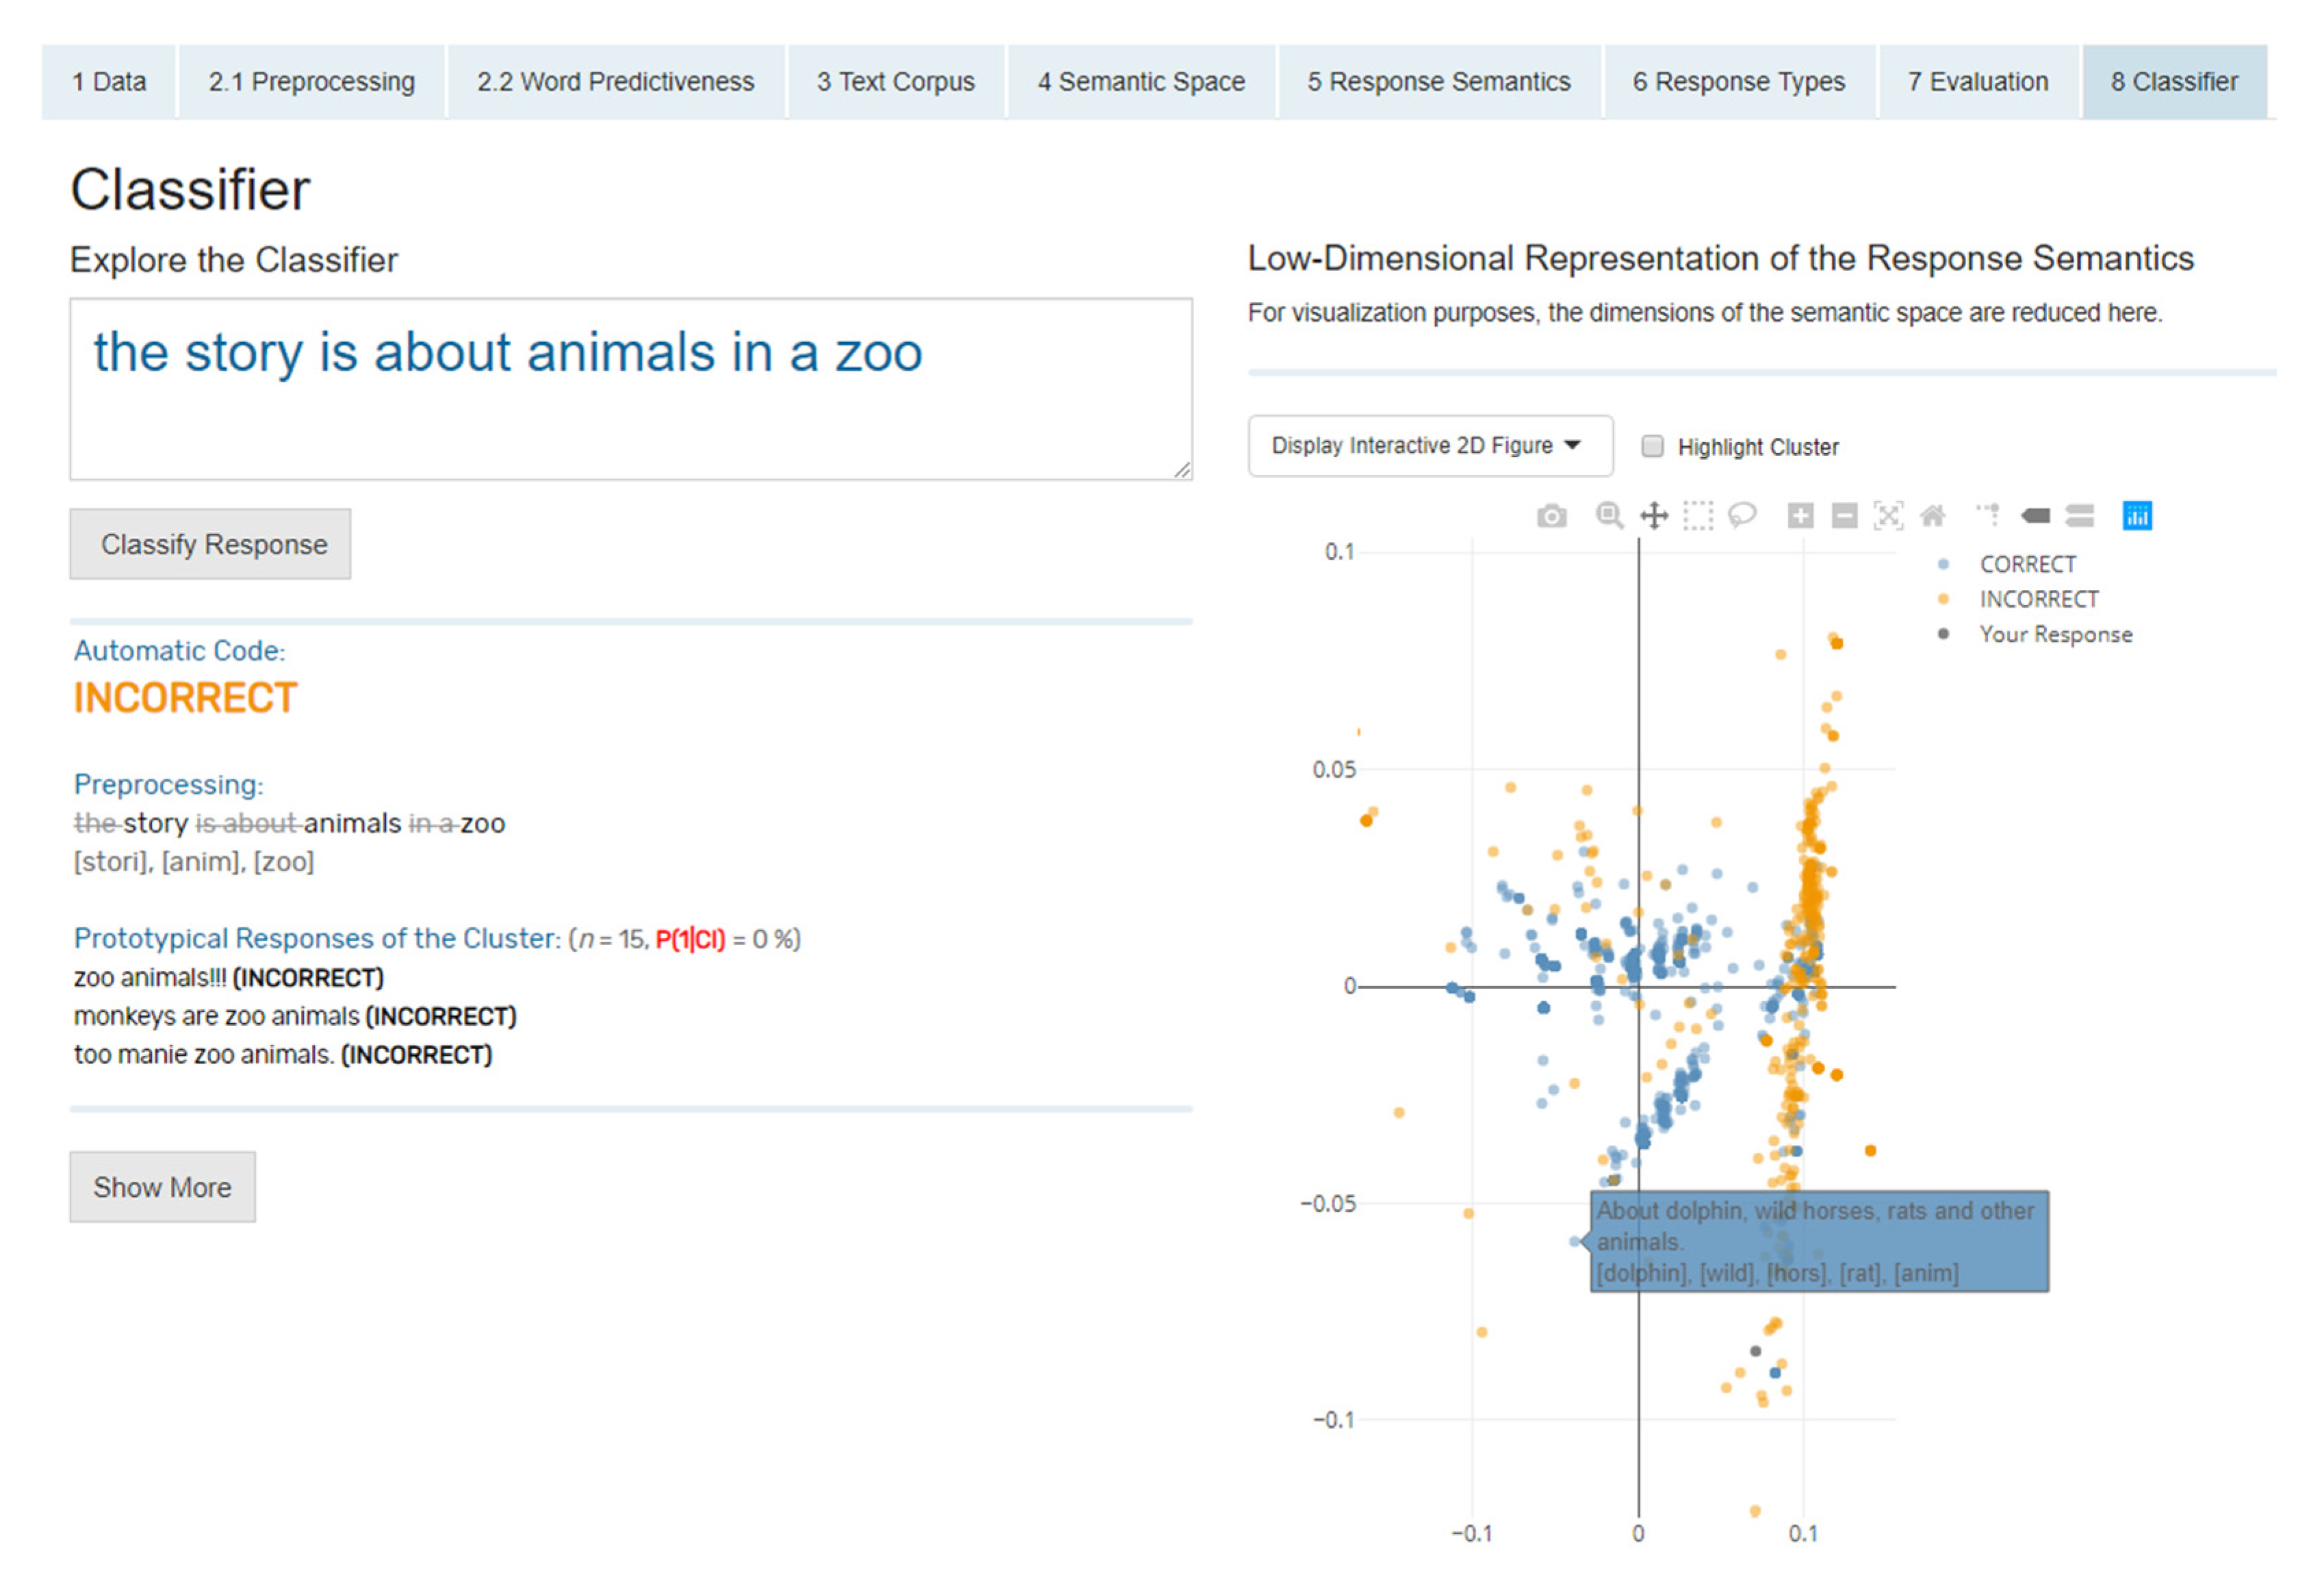
3.4.6. Classification
The classifier screen (
8 Classifier) is the heart of the app, as all methods converge at this point. In this part, the complete final classifier is used, meaning all responses are used for model training. The interface has a simple design to focus on the response assignment (
Figure 10). In this part of the app, the classifier can be explored by typing in different responses and their automatic classification. The response can be entered into a text field, and with one click on
Classify Response, it will be automatically coded. In addition to the coding result, information about the processing and the classification of the response to a cluster is displayed to understand the coding process and to give a deeper insight into the underlying mechanics of the procedure. The response text is displayed in raw and processed form, and information about all similar responses is presented. Similar responses here means other responses that are located in the same cluster as the just entered response. The response is depicted in an interactive plot showing the semantic space to give a visual understanding of the response location in relation to other responses. The user can filter the data points regarding their cluster assignment and change between two- and three-dimensional figures.
Currently, the automatic classification is limited to exploration in the sense of manually typed responses. In future versions, it will also be possible to evaluate entire data sets without using them for model training.
3.5. Future Developments
The app is under ongoing development to cover additional usage scenarios for automatic coding and for categorizing texts without manual labels. The article describes only the app’s current state.
Currently, the upload is limited to CSV files, with a focus on two columns: one text and one code column. For enhancing analyses without manual codes, the app will soon allow text data imports without any manual annotations. We also plan to provide importing data formats from R and third-party applications, such as SPSS.
Already now, users can view and export responses’ assignments to clusters independently of the manual coding, but the import step currently requires two columns.
Furthermore, we plan to enable users to generate their own semantic spaces via the ReCo-server and download them directly into the app to cover item-specific vocabulary.
We are also planning an export function for the classifier to integrate it into other applications, such as assessment systems, which allow real-time coding.
4. Objectives and Requirements of shinyReCoR
shinyReCoR is a freely available R package, downloadable from our website shinyReCoR. The app works on the popular operating systems Windows, macOS, and Linux, on which at least R 4.0.1 is installed. RStudio can be useful for further processing of the data but is not necessary for using the app. The hardware requirements depend on the size of the used data sets. It is possible to use parallel processing, which can speed up individual tasks, depending on the number of CPU cores and data volume. Using hardware with lower performance may lead to longer execution times for particularly large data sets, but it is still possible to use the app.
4.1. The Advantages of Using R as the Basis
The central idea behind R, to use a particular programming language for applying statistics [
31,
32] combined with open accessibility and a huge exchange of the community, leads to great popularity, especially in the scientific context. The number of offered packages, which are programmed and provided mainly by the community, covers many requirements for statistical analysis and research. Therefore, with R at the basis of shinyReCoR, users can continue their work seamlessly in R with the package’s output. Moreover, we plan to enable users to change the workflow flexibly according to their needs over the long run.
Due to the release of Shiny [
33], it is possible to handle data in an interactive and vivid way through a graphical user interface. The special advantage of Shiny, which we also use for the app, is that parameters can be changed quickly via the interface (e.g., with a slider). Recalculations are executed in real-time. This way, shinyReCoR, for example, provides the user with interactive plots so that the user gains valuable insights into the data and the influence of different parameter realizations. With the advantages of Shiny, more users can benefit from the software package as they can focus on exploring their data, choosing reasonable methods, and exploring resulting classifiers while all calculations run in the backend. We took advantage of these potentials to implement our app for automatic coding and offer shinyReCoR, an instrument that researchers can use across diverse domains and without any required programming knowledge. The R code of the app can be viewed after the package downloads.
4.2. Privacy
To ensure maximum data protection of your research data while using the app, shinyReCoR, including all dependent packages, must be installed locally on the computer. There is no external communication regarding the response or user data, and for all stored parameters, (intermediate) results are stored locally in your working directory (which is the package library here). Only the download process and the (not yet released) tailored text corpus assembly involve communication with the ReCo server. That is, first, the users’ computer will communicate with the ReCo server when the package is downloaded manually from the website or the automatic installation process is triggered in R. Second, in its future version, the app will allow harvesting a text corpus from Wikipedia dumps stored on our server that is tailored to the users’ response data. For this, the user will enter relevant terms that are at the heart of the item responses’ semantics. This query will be sent to the ReCo server, and the app will then download a corresponding text corpus, which will be used to compute a semantic space model for the app.
4.3. Updates
The development and deployment of software are more of a process than a static delivery. Especially the context of science and the rapidly growing knowledge in the domains of natural language processing [
34,
35] and machine learning [
36] require constant adaption and implementation of new techniques. The paper describes the currently released alpha version v0.2.0 of shinyReCoR, which is still limited to the core methods described in the article. Updates will be published regularly on our website.
5. Discussion and Challenges
5.1. Polytomous Coding
The whole coding process is not restricted to the use of binary (i.e., dichotomous) codes. The cluster structure within the automatic coding allows polytomous coding assignments as well as those with ordinal properties. Let us consider this challenge with respect to the semantic space, where each response is represented as a vector. The presence of multiple code levels increases the potential of semantic overlapping where similar content actually must be separated through the unsupervised processes. Each code typically has one or more prototypical responses assigned (i.e., reference texts in the coding guides). It can be assumed that the more the responses differ semantically, the greater the distances between them, which increases the probability that the unsupervised process will separate them.
5.2. Gold Standard: Human Coding
A classifier is trained and evaluated on the basis of human coded responses. The success of the automatic classifier is thus measured against the human class assignments. These represent the gold standard. However, since a relatively large amount of unstructured data, be it images, videos, or text responses, needs to be labeled or coded, human involvement is necessary. The coding quality can have a large impact on the accuracy of classifiers, depending on the relative number of miscodings [
37,
38]. Once again, a distinction must be made between incorrect codings where the label does not fit the data material and just disagreement between raters where a certain margin of interpretation allows varying codings (i.e., border cases). Both harm the accuracy of a trained classifier through noise [
39,
40,
41].
While strict misclassification is caused, for example, due to the human coder’s way of working and motivation, a low agreement between two raters can be caused by several characteristics. Here, especially, the margin of interpretation plays an important role, which should be eliminated by an efficient coding instruction because all possible responses and response variants have been considered, and the coding is fixed for them. Thus, more or less, every response is mentally matched with the coding guides. It is, of course, not possible that all variants are covered word-for-word in the coding instruction. At this point, it requires humans or machines to transfer the coding directive to the text. Humans naturally have the advantage that they are called intelligent, and they can complete this simple task; however, a certain variance can lead to mistakes. Here, again, the advantage of the machine comes into play, which cannot be considered intelligent from a psychological point of view even though this buzz term is often used for complex and less complex algorithms but, using a deterministic approach, it always produces the same result under the same conditions. This means that an item-specific model is always assigned the same coding for a given response.
5.3. Ambiguity
Comprehension problems involving word ambiguities are not restricted to human perception, see [
42,
43]. When forming word embeddings using LSA, the method ignores the variety of different word contexts. In the semantic space, words are considered to be similar if they occur in similar contexts [
12,
17,
44], where the context can be defined as the neighbor words close to a target word in the text. The window, though, defining what is considered a neighborhood varies. LSA [
12] includes all words in the same document, whereas word2vec uses a window of words [
17] which includes the
n words before and after the target word.
If there is a word in a dictionary with multiple meanings, this can lead to unreliable representations. For example, the word ‘break’ can mean to stop an activity or to separate something into several parts. It can also be used for referring to a component of a car. Even though the meanings may be similar in some sense, they are used in different contexts. This blends the spatial representation of the word vector across different contexts, resulting in a fuzzier representation. While deep learning methods can take this contextual information into account [
16], the model training is more involved and requires larger data sets to train and work with it.
We argue that a precise representation is unnecessary because we only need a point in the semantic space, which we associate with a category, to set further points in relation to these. Nevertheless, we cannot rule out the possibility that unreliable representations due to word ambiguities influence the clustering process.
5.4. Bag of Words
The word order is not taken into account for representing the response in the vector space. This means that fewer responses are needed to represent certain response types. However, if the word order or a part of the syntactical structure is essential for determining a response’s code, which can be the case depending on the item, this could lead to several response types being mixed together. The result would be miscodings and would reduce the performance of the automatic coding process. A special case is negation which refers to a verb. Ignoring the word order in the two sentences ‘No, he is guilty’ and ‘He is not guilty’ will lead the bag of words process to the same result.
5.5. Language Diversity
5.5.1. Stop Words
Stop words usually are frequent words without significant semantic content on their own. Thus, they are typically omitted in many natural language processing tasks to reduce the noise within the text. The number of stop words is strongly dependent on the language. Within the Natural Language Toolkit (NLTK) stop word list [
45], for example, 179 stop words are listed for English, 232 for German, 313 for Spanish, and 1784 for Slovenian. In addition, the stop word lists can even differ within languages, depending on the predefined lists.
Furthermore, negations are also often listed. Omitting them through stop word removal results in a sentence such as ‘He did forget the wedding day’ equalling the sentence ‘He did not forget the wedding day’, which can have serious consequences and bias the calculation of response semantics. Fortunately, the empirical world makes processing a little easier for automatic coding for most assessment domains, because test takers rarely intend to write the correct thing but bluntly negate it. For example, if testees are required to write down what a story is about, instruction-conform (i.e., motivated) test behavior would not result in the proper semantics just complemented with a negating particle. Therefore, shinyReCoR offers the possibility of checking all stop words during processing and to customize them manually. This is important as the given example is not representative for all assessment domains.
5.5.2. Language Structure
Language diversity is one of the greatest challenges in NLP. There are between 5000 and 8000 languages spoken worldwide, which differ greatly in terms of their characteristics [
46]. NLP research is mainly done based on the English language, which, on the one hand, comes from its global usage [
47] and also because it is considered the language of science [
48].
With some methods, it is difficult or even impossible to make them usable for other languages. Different language properties require different processing. For example, languages differ in terms of the alphabet and their sentence and word structure. Based on those characteristics, languages are often classified as analytic or synthetic. Analytic languages have few or no inflections, while synthetic languages might contain an abundance. The extraction of information from texts, thus, can vary from focusing on morphemes or sentence structure.
Building language models or semantic spaces requires a large number of text examples. Languages that are widely spread on the internet are easily accessible, whereas models of low-resource languages might require adaption of high-resource language models by, for example, linear projection [
49] (see [
50] for an overview).
In its current version, shinyReCoR allows the use of both English and German texts. The implementation of new languages is planned and will initially cover all common languages, and different variants such as American English, British English, and Australian English will also be implemented.
5.6. Parameter Settings
With shinyReCoR, we intend to offer a variety of methods and settings with which users can customize processes to fit their text data and assessment setting as best as possible. Specific configurations in the machine processing of language are commonly applied and provide satisfactory results. A good example of this is preprocessing, such as stemming words and removing stop words. Those common methods constitute the app’s basis, whereby it allows to vary certain methods and parameter values to optimize the model. This concerns the individual composition of the semantic space, all preprocessing steps, and the clustering method. Since there is no recipe for success, it is up to the user to explore the optimal configuration. Every setting can have a significant impact on classification success, depending on the response’s characteristics. However, the app offers the possibility to try out different strategies to gain the most accurate automatic response coder.
5.7. Bias
The use of algorithm-based decisions can have far-reaching consequences, depending on how they are used, and the user should be aware of this. The training of machine learning and language models is strongly dependent on the data being offered, where the qualitative content of the texts and the distribution of content can serve as a source of biases [
51,
52,
53]. In the context of education and educational evaluation, the use of automated methods can systematically disadvantage individuals [
51] or groups [
52,
53].
Whether and how a disadvantage could arise from the presented automated coding system has not yet been empirically tested, while it has been shown for others [
54,
55]. Influences could arise from various factors, such as biased language models [
51,
52,
53], linguistic patterns that go beyond semantics to infer groupings, or simply biased target labels (i.e., human codes). That said, the distortion of language models [
52] can theoretically be relativized for the intended use here to a certain extent since the exact word vector representations are not relevant, but only the relations between the response vectors are of interest. The nature of the preprocessing steps could also be of importance, since, for example, responses with certain spelling errors might be corrected accurately. Likewise, preprocessing offers different added value for different languages, which means that individual test language users could be discriminated against in multilingual comparisons. However, it is particularly important to prevent individuals from being systematically disadvantaged by an automatic process, for example, in high-stakes assessments, so it is necessary to investigate any influences. Even assessments that are considered low-stakes for individuals might have a negative impact on them if, for example, policy making [
56] is influenced by the assessments’ potentially biased evidences.
The reference to possible discrimination should be made with every method involving machine decisions with far-reaching consequences. However, machine methods also offer important advantages to reduce discrimination in decision processes and to increase objectivity and reliability. Machines are inherently objective in their judgment process and are not cognitively influenced by strenuous coding work. Thus, while automatic coding might involve its own biases, one can also consider it wrong to not apply automatic coding where it could help to get rid of human biases in assessment.
The classification process in shinyReCoR is transparent compared to many other machine learning techniques, where decisions are made in a black box. The cluster-based method makes each decision understandable to users, where similarly ranked responses can be viewed to understand the process. The method may not be perfect, but its simplicity and transparency provide a practical application for assessment, while the performant or fair applicability of shinyReCoR can be supported or refuted by empirical evaluation.


