Evidence for Recent Polygenic Selection on Educational Attainment and Intelligence Inferred from Gwas Hits: A Replication of Previous Findings Using Recent Data

Abstract
:1. Introduction
2. Materials and Methods
3. Results
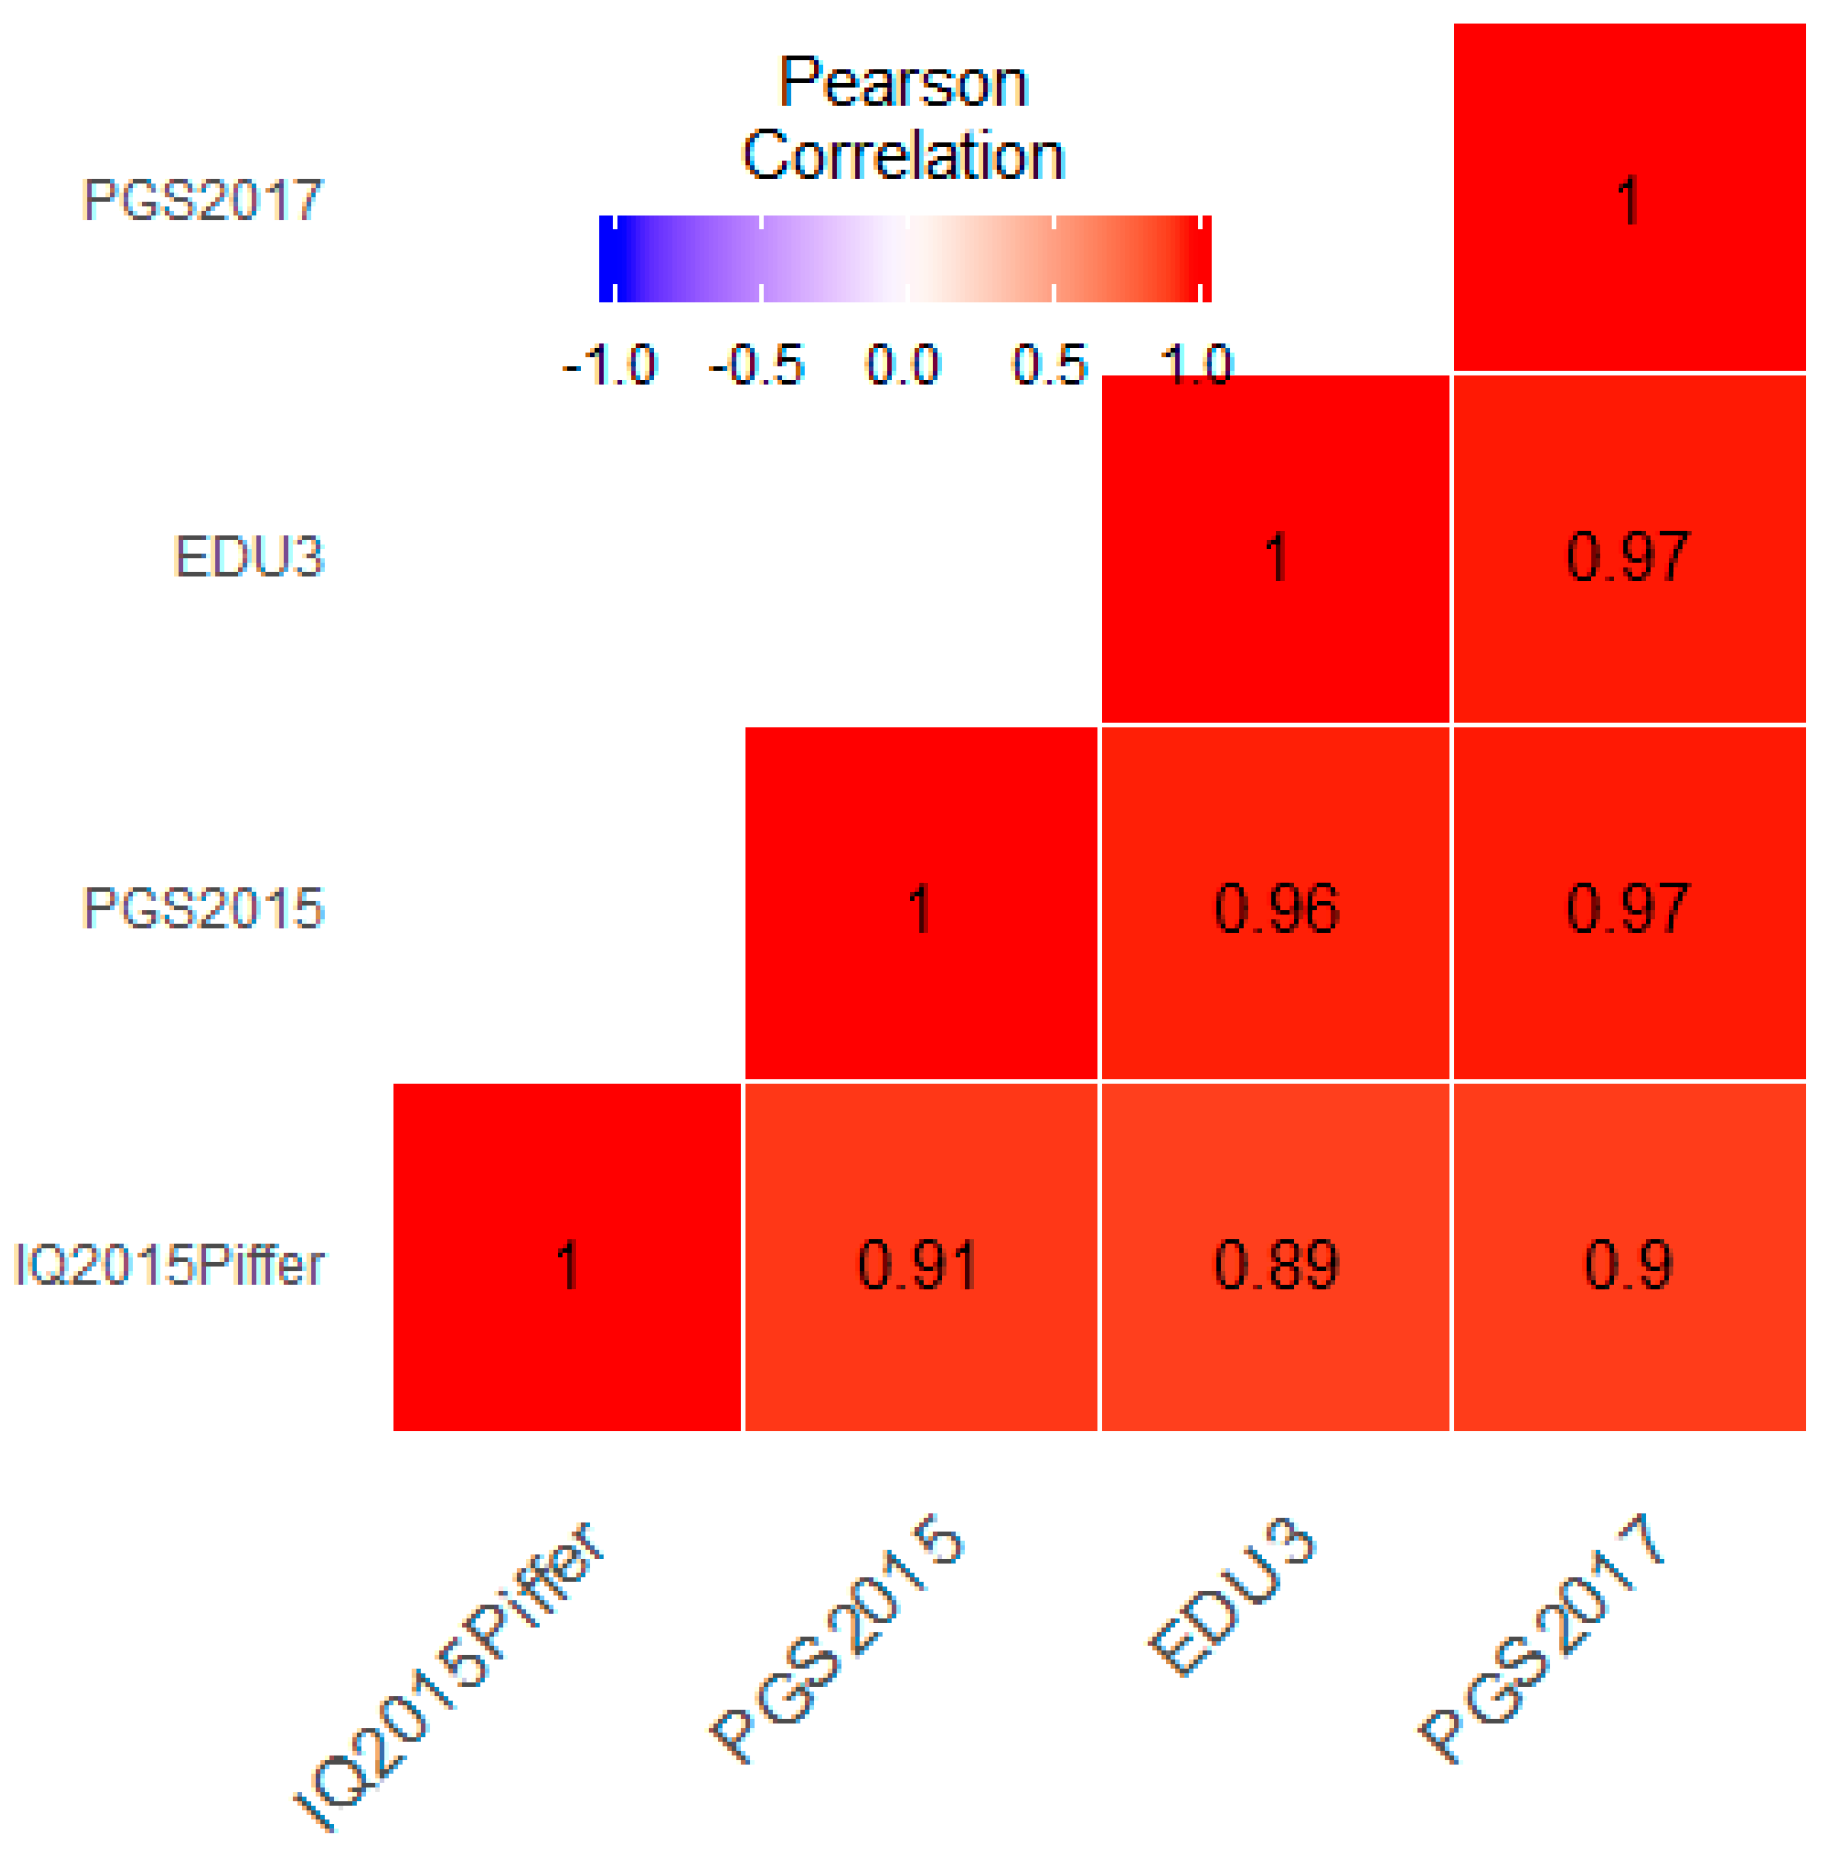
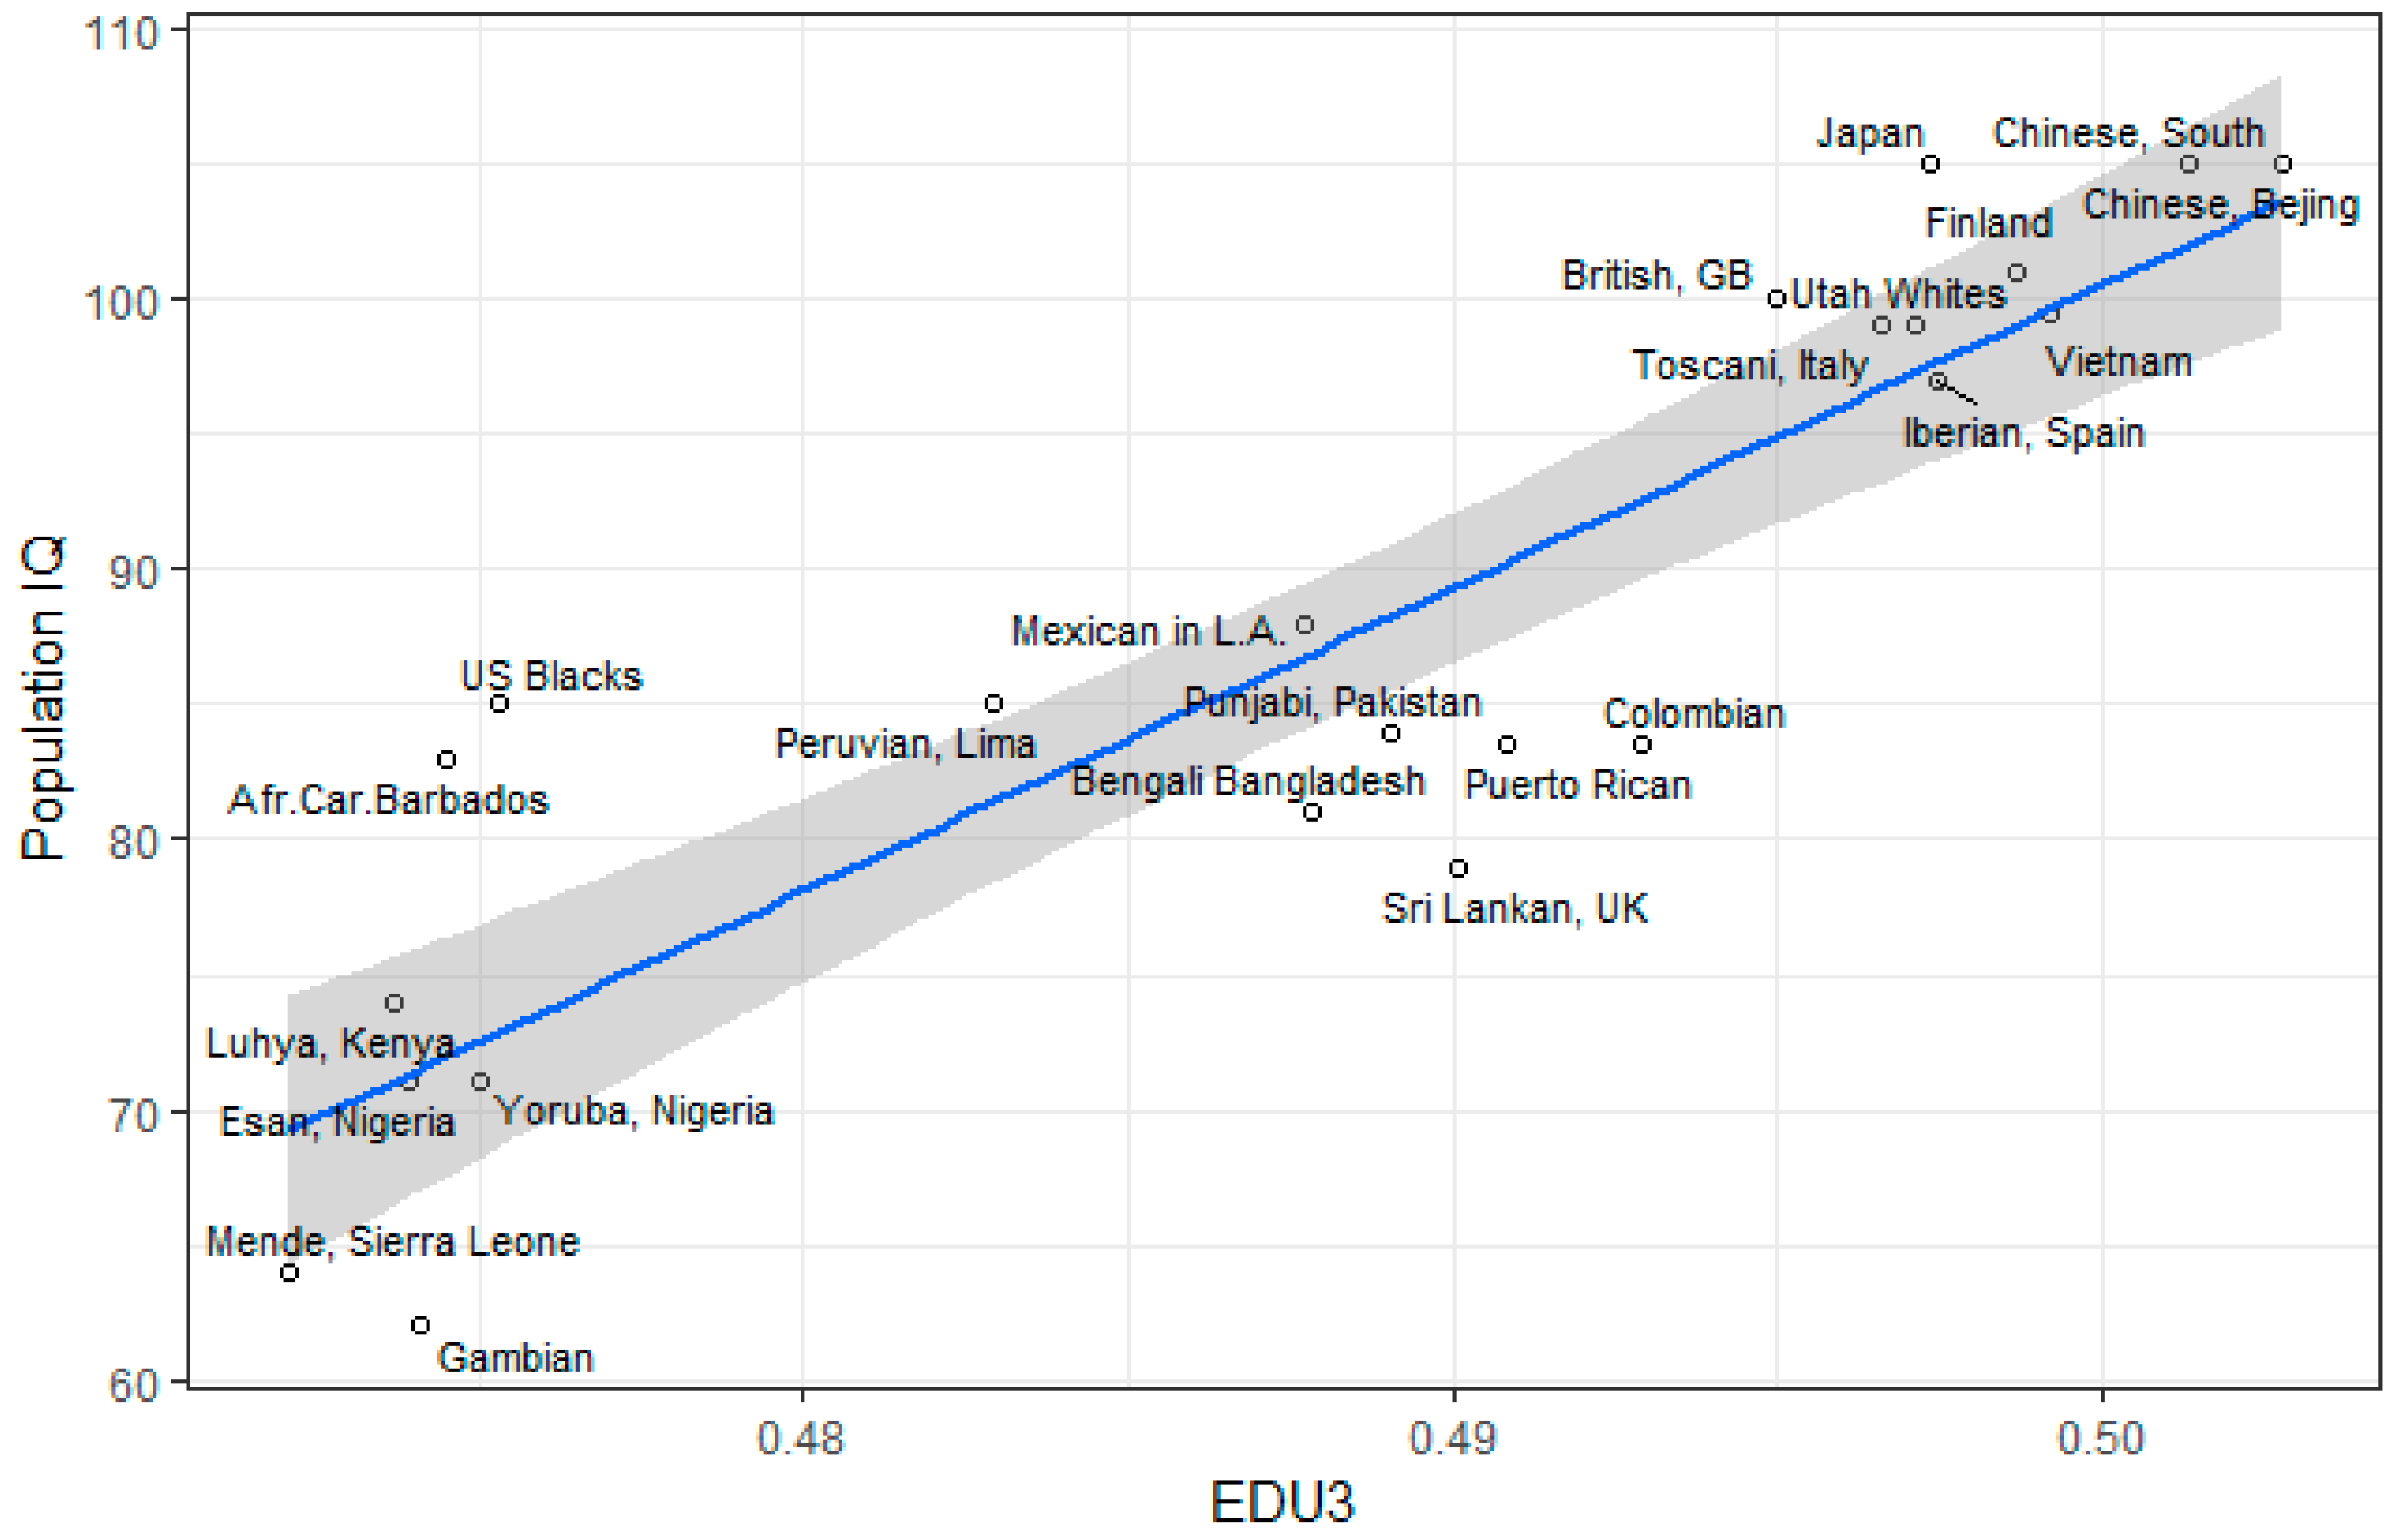
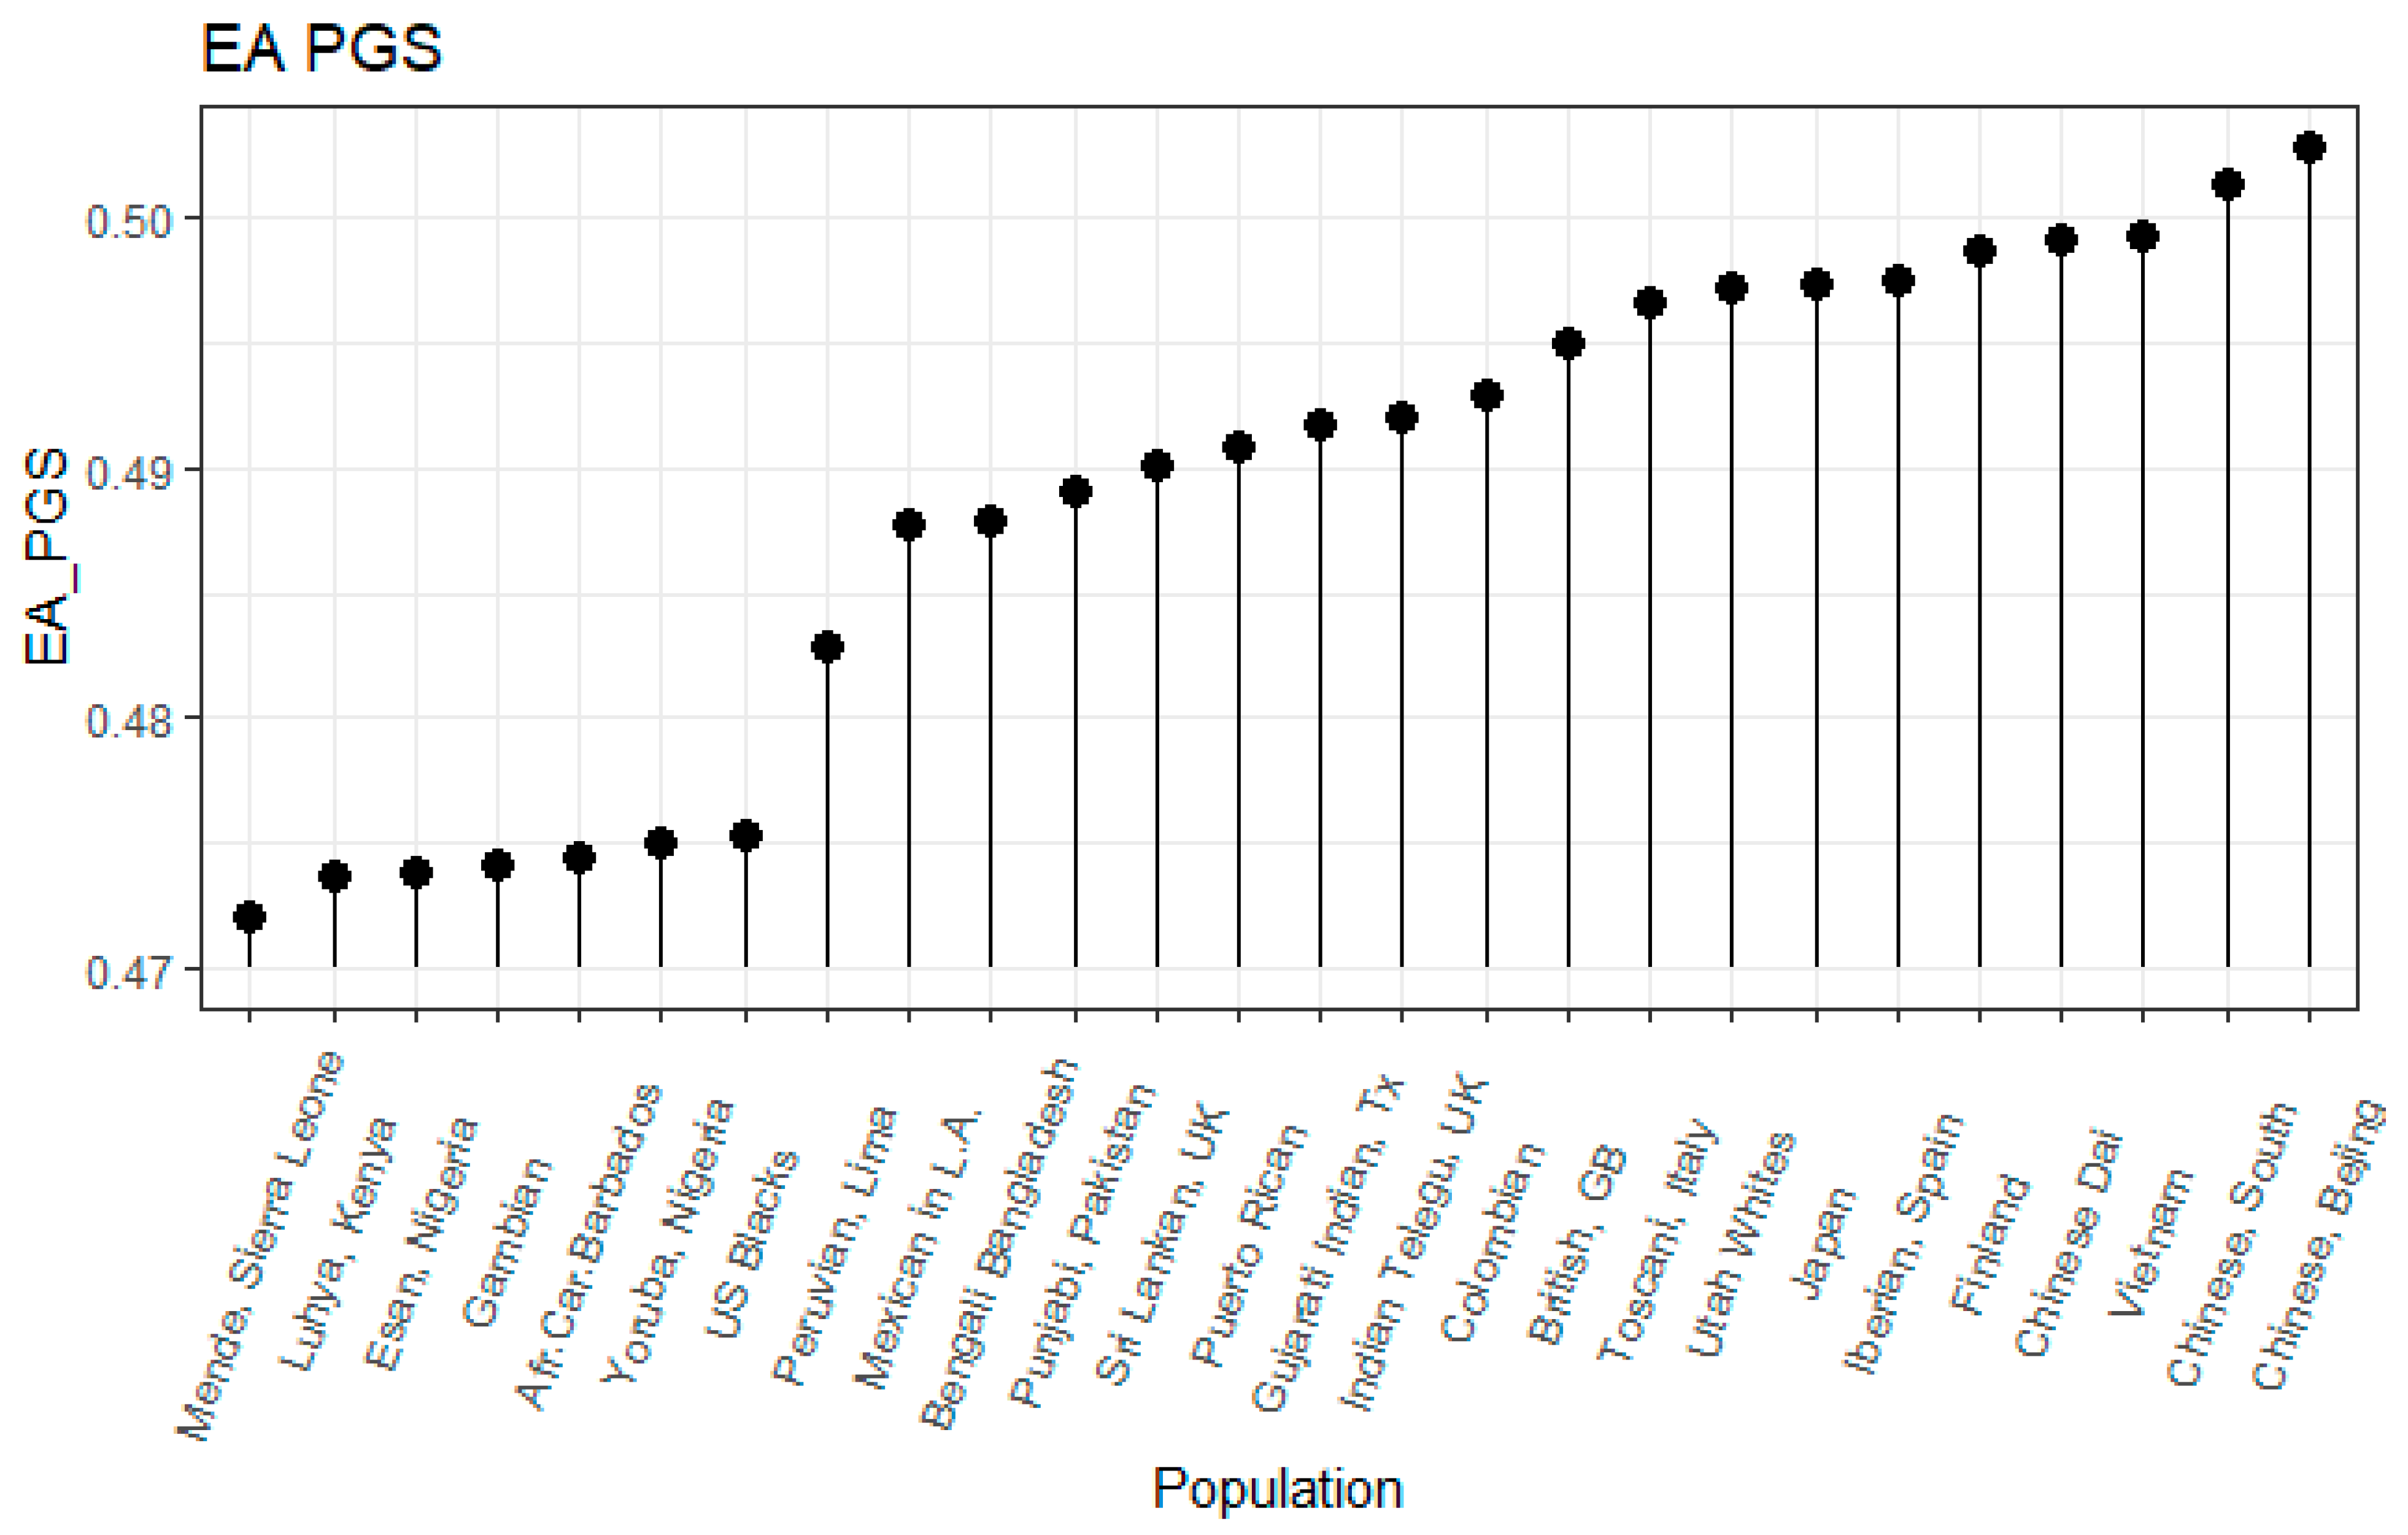
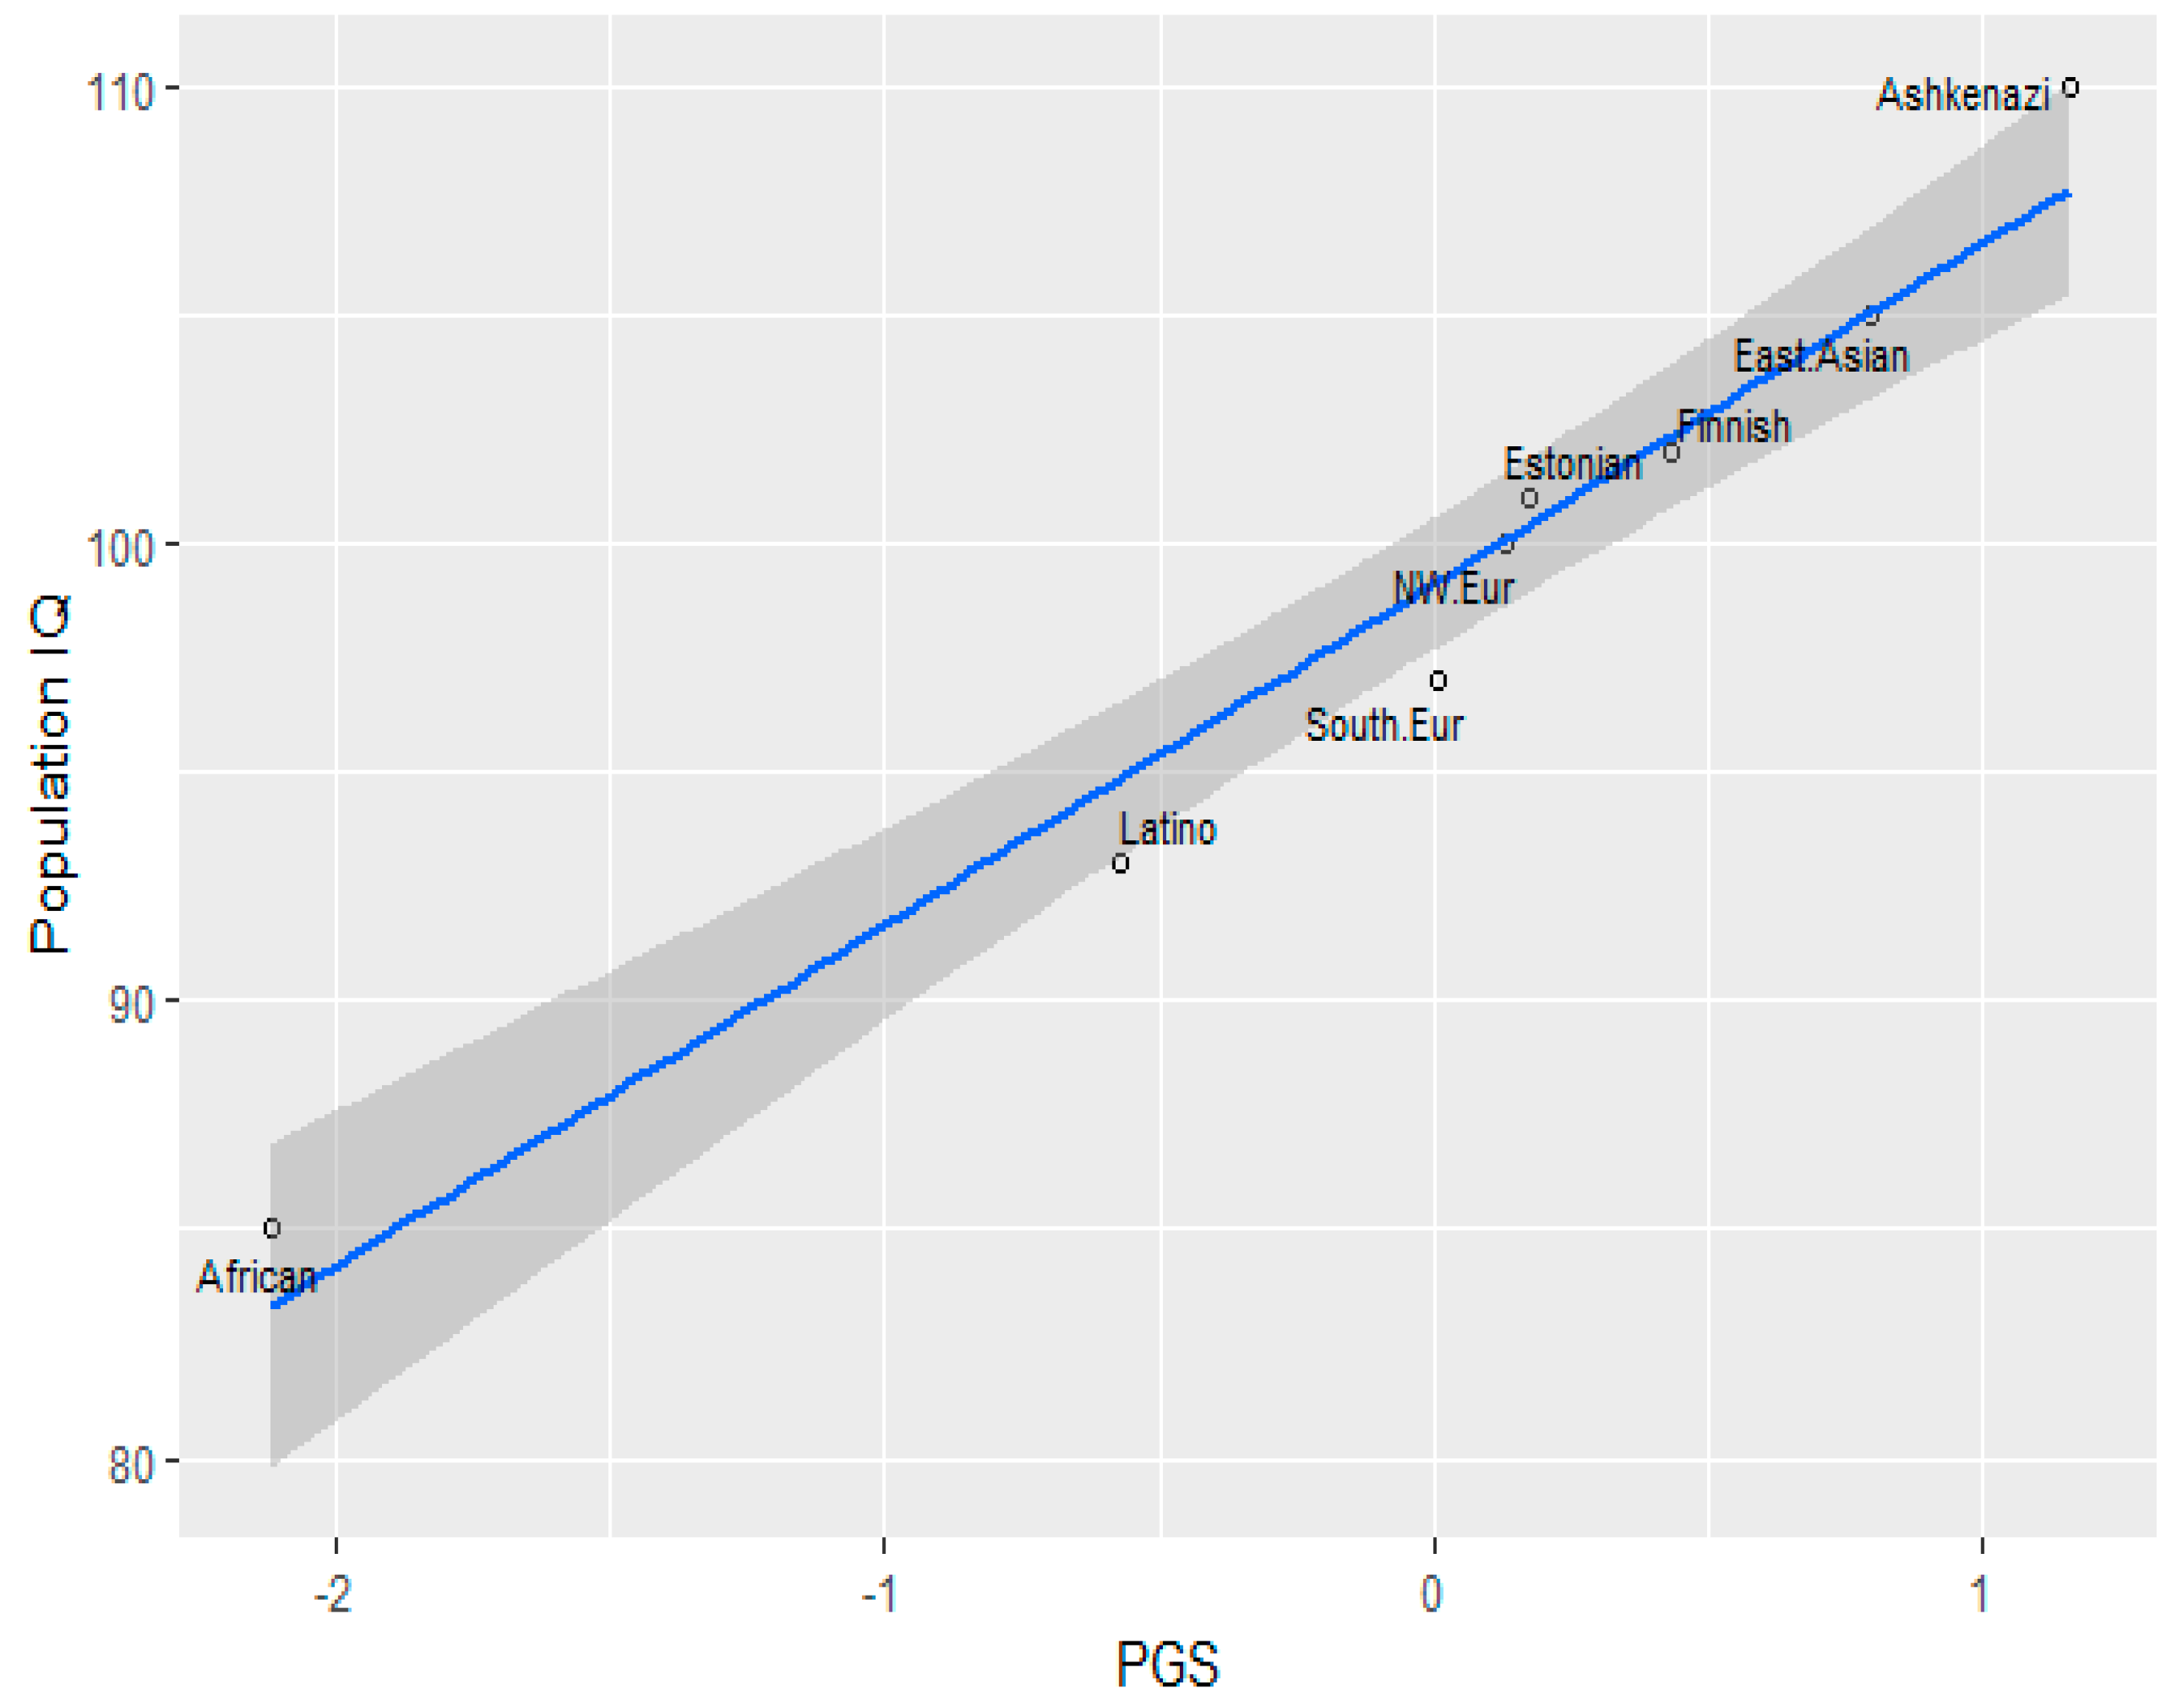
3.1. Correlation between Polygenic Scores and Population Iq
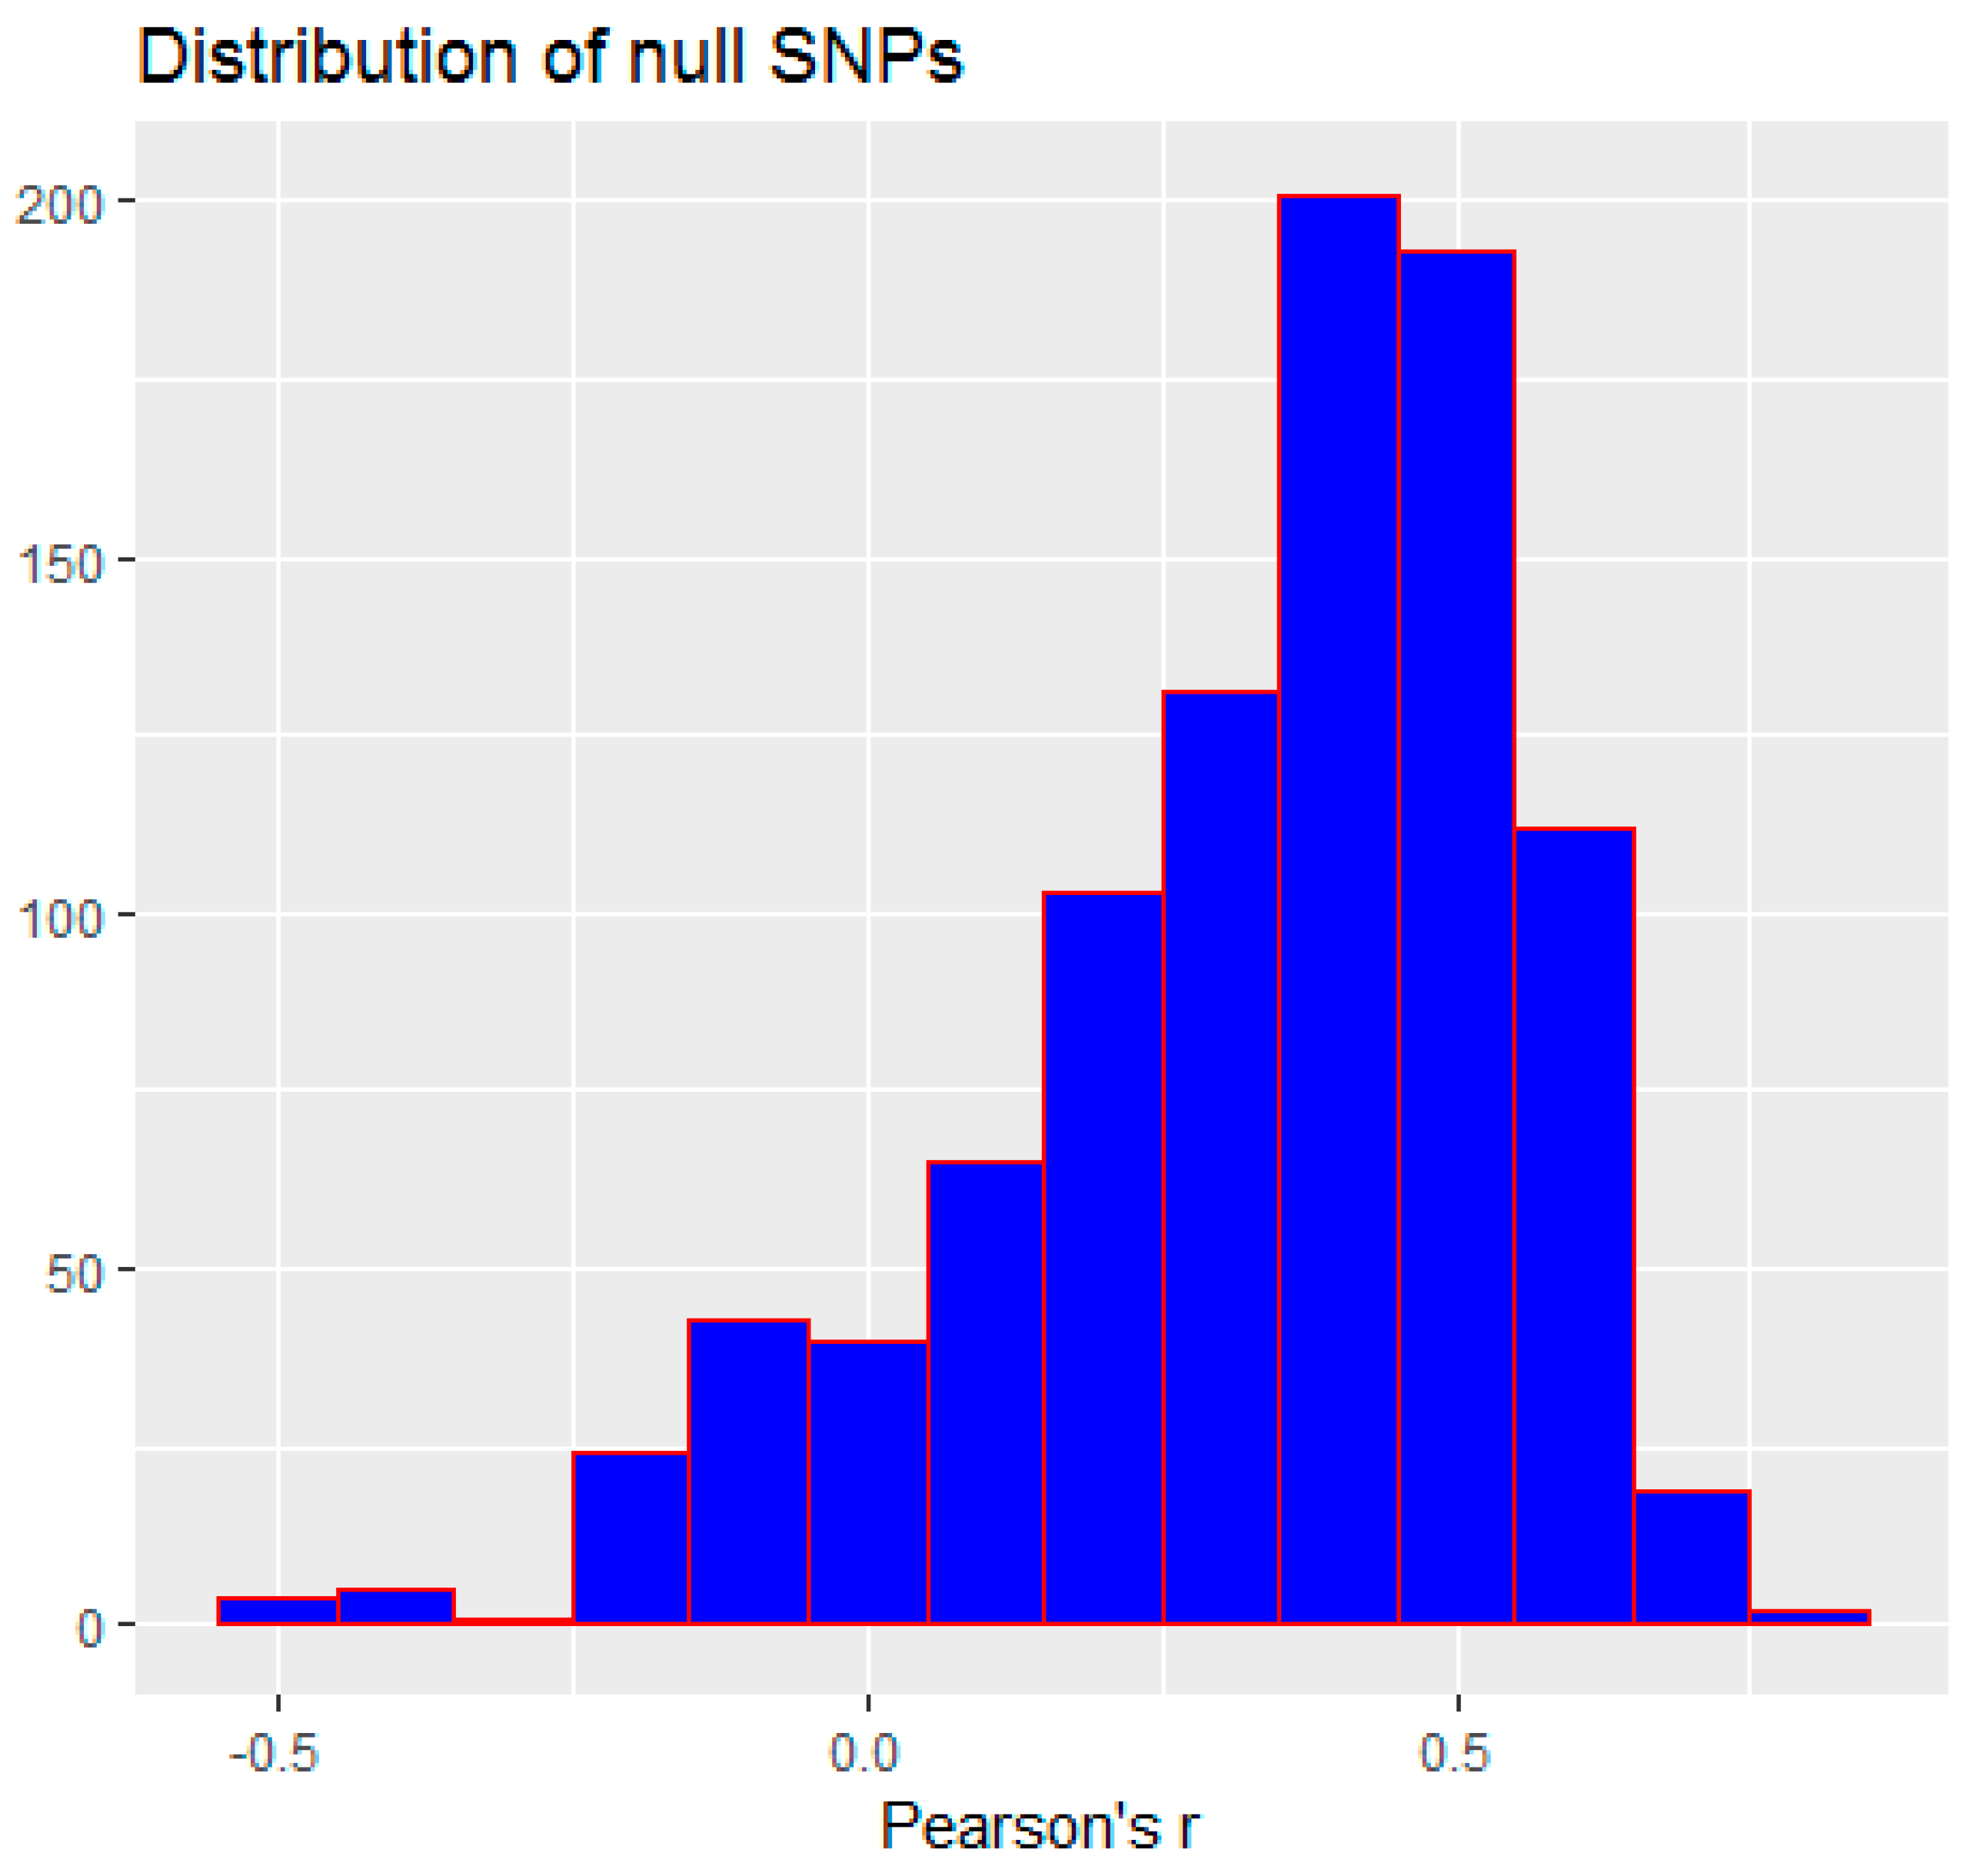
3.2. Monte Carlo Simulation
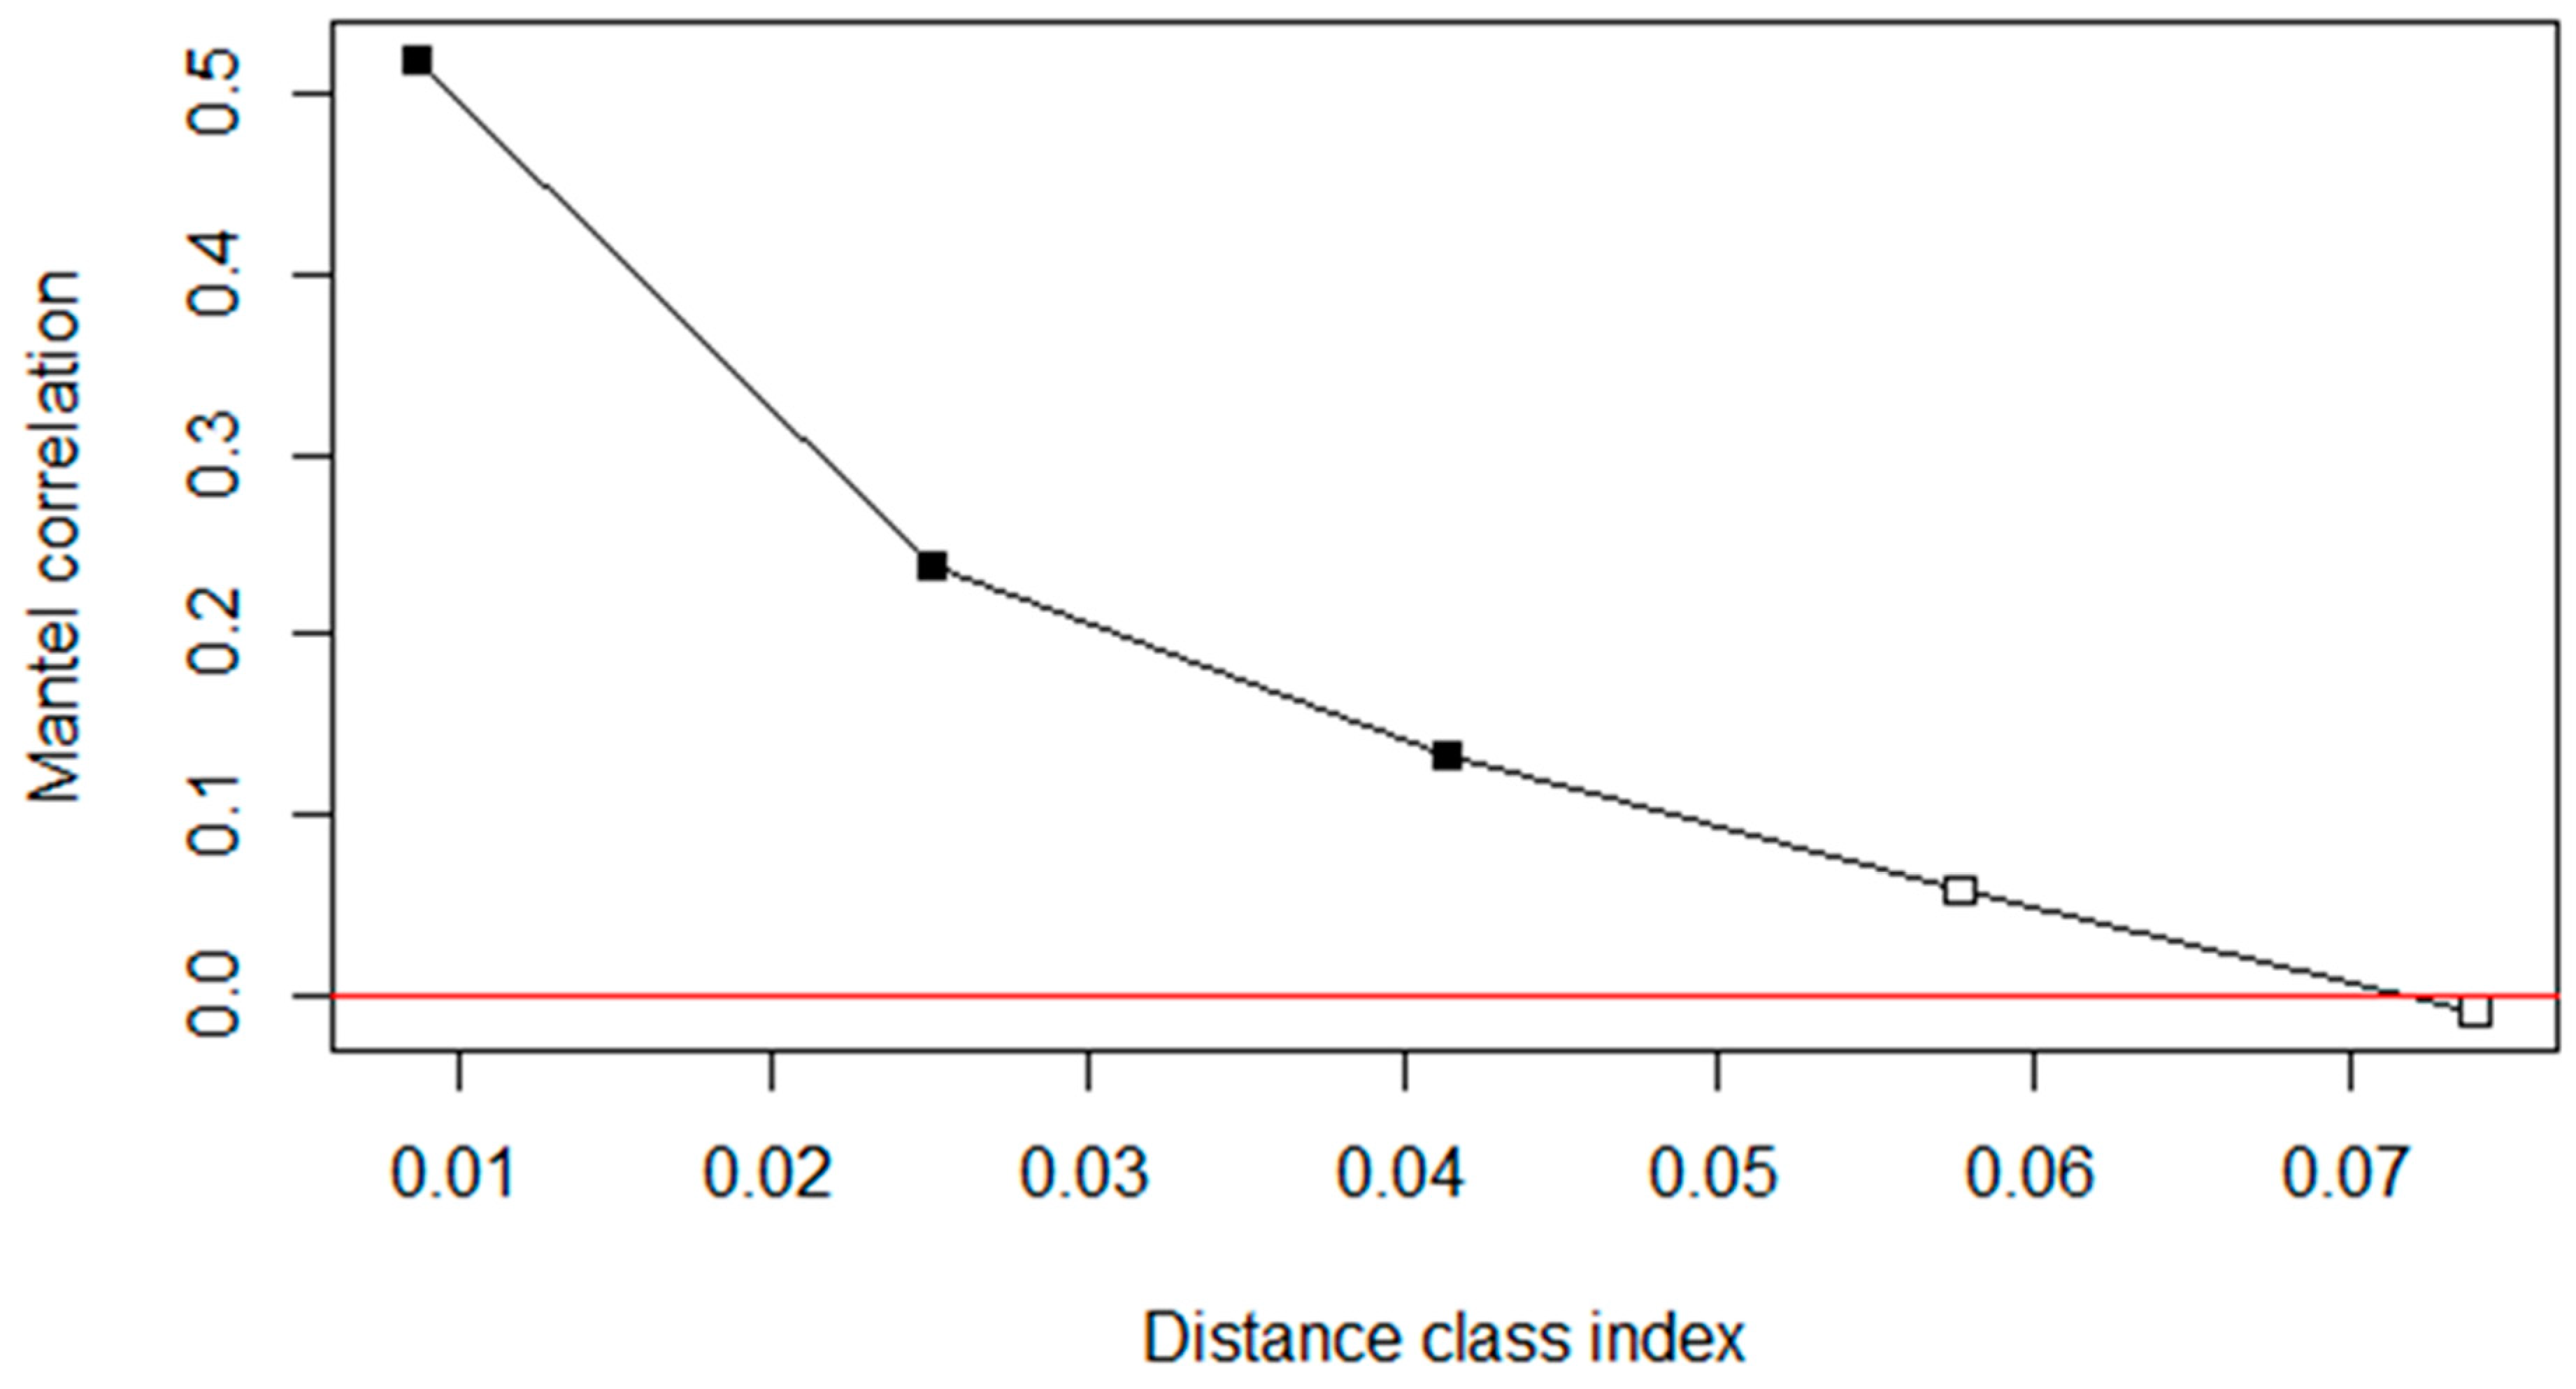
3.3. Controlling for Spatial (Phylogenetic) Autocorrelation
ANOVA
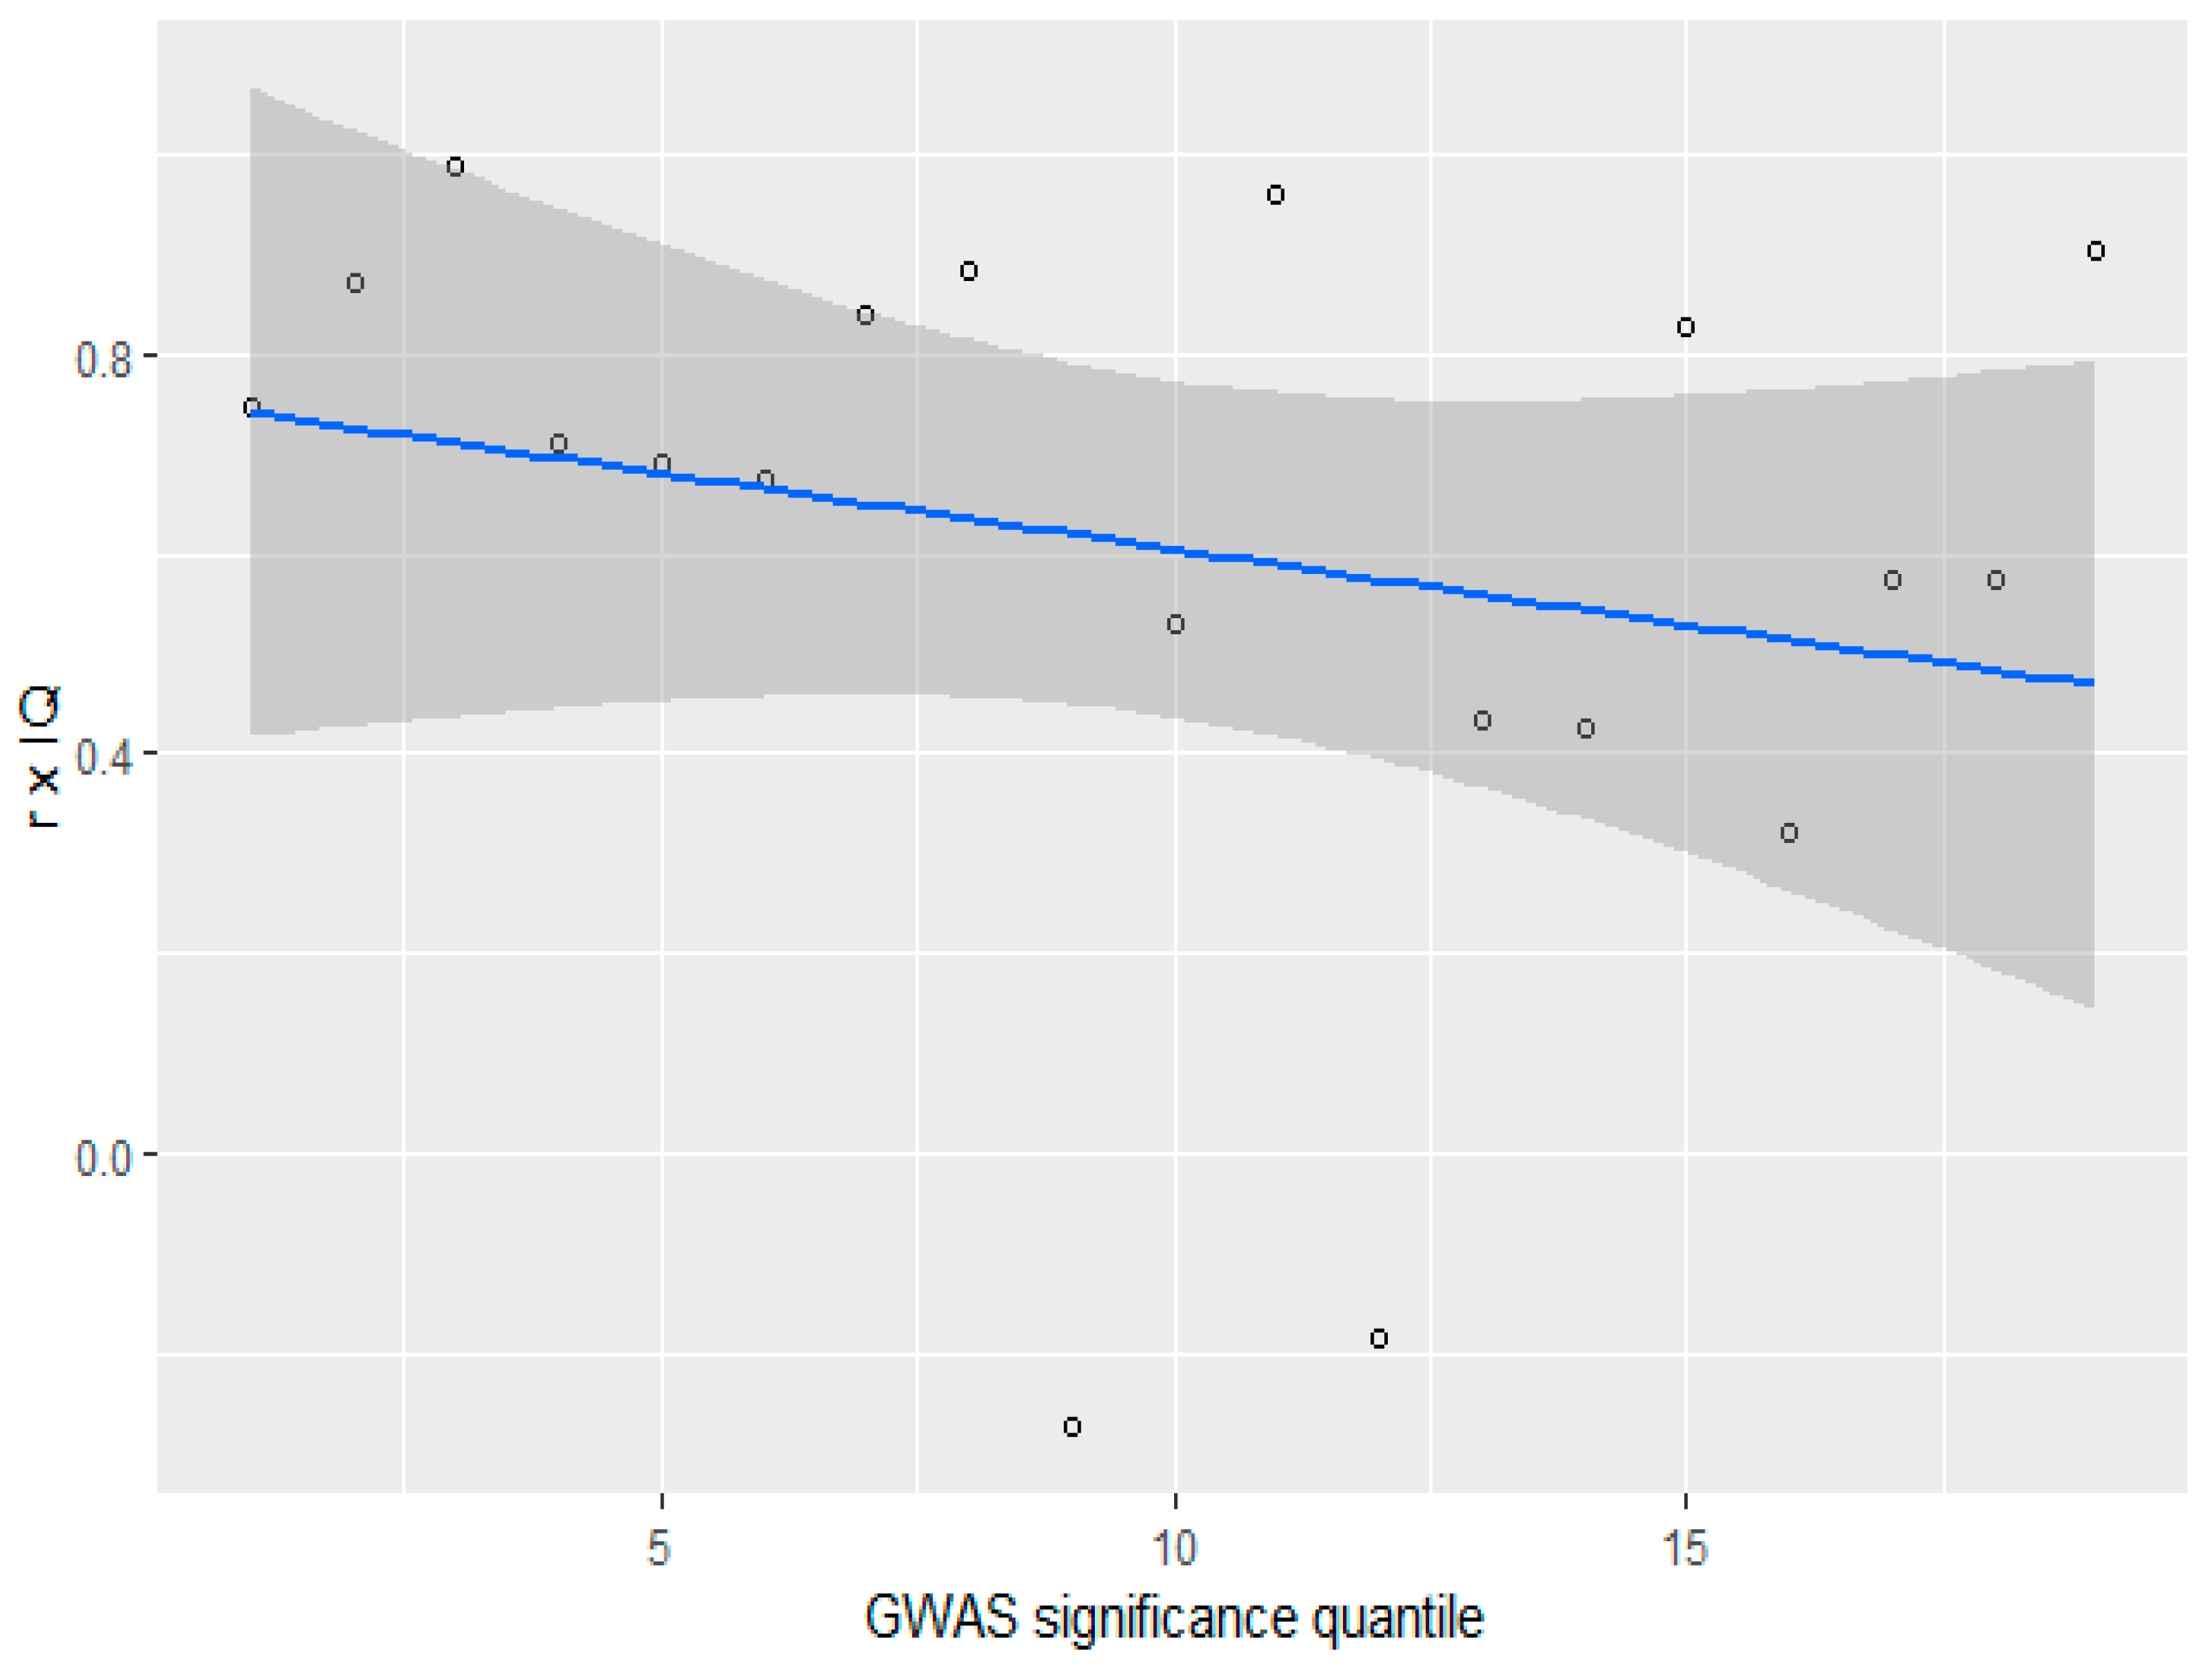
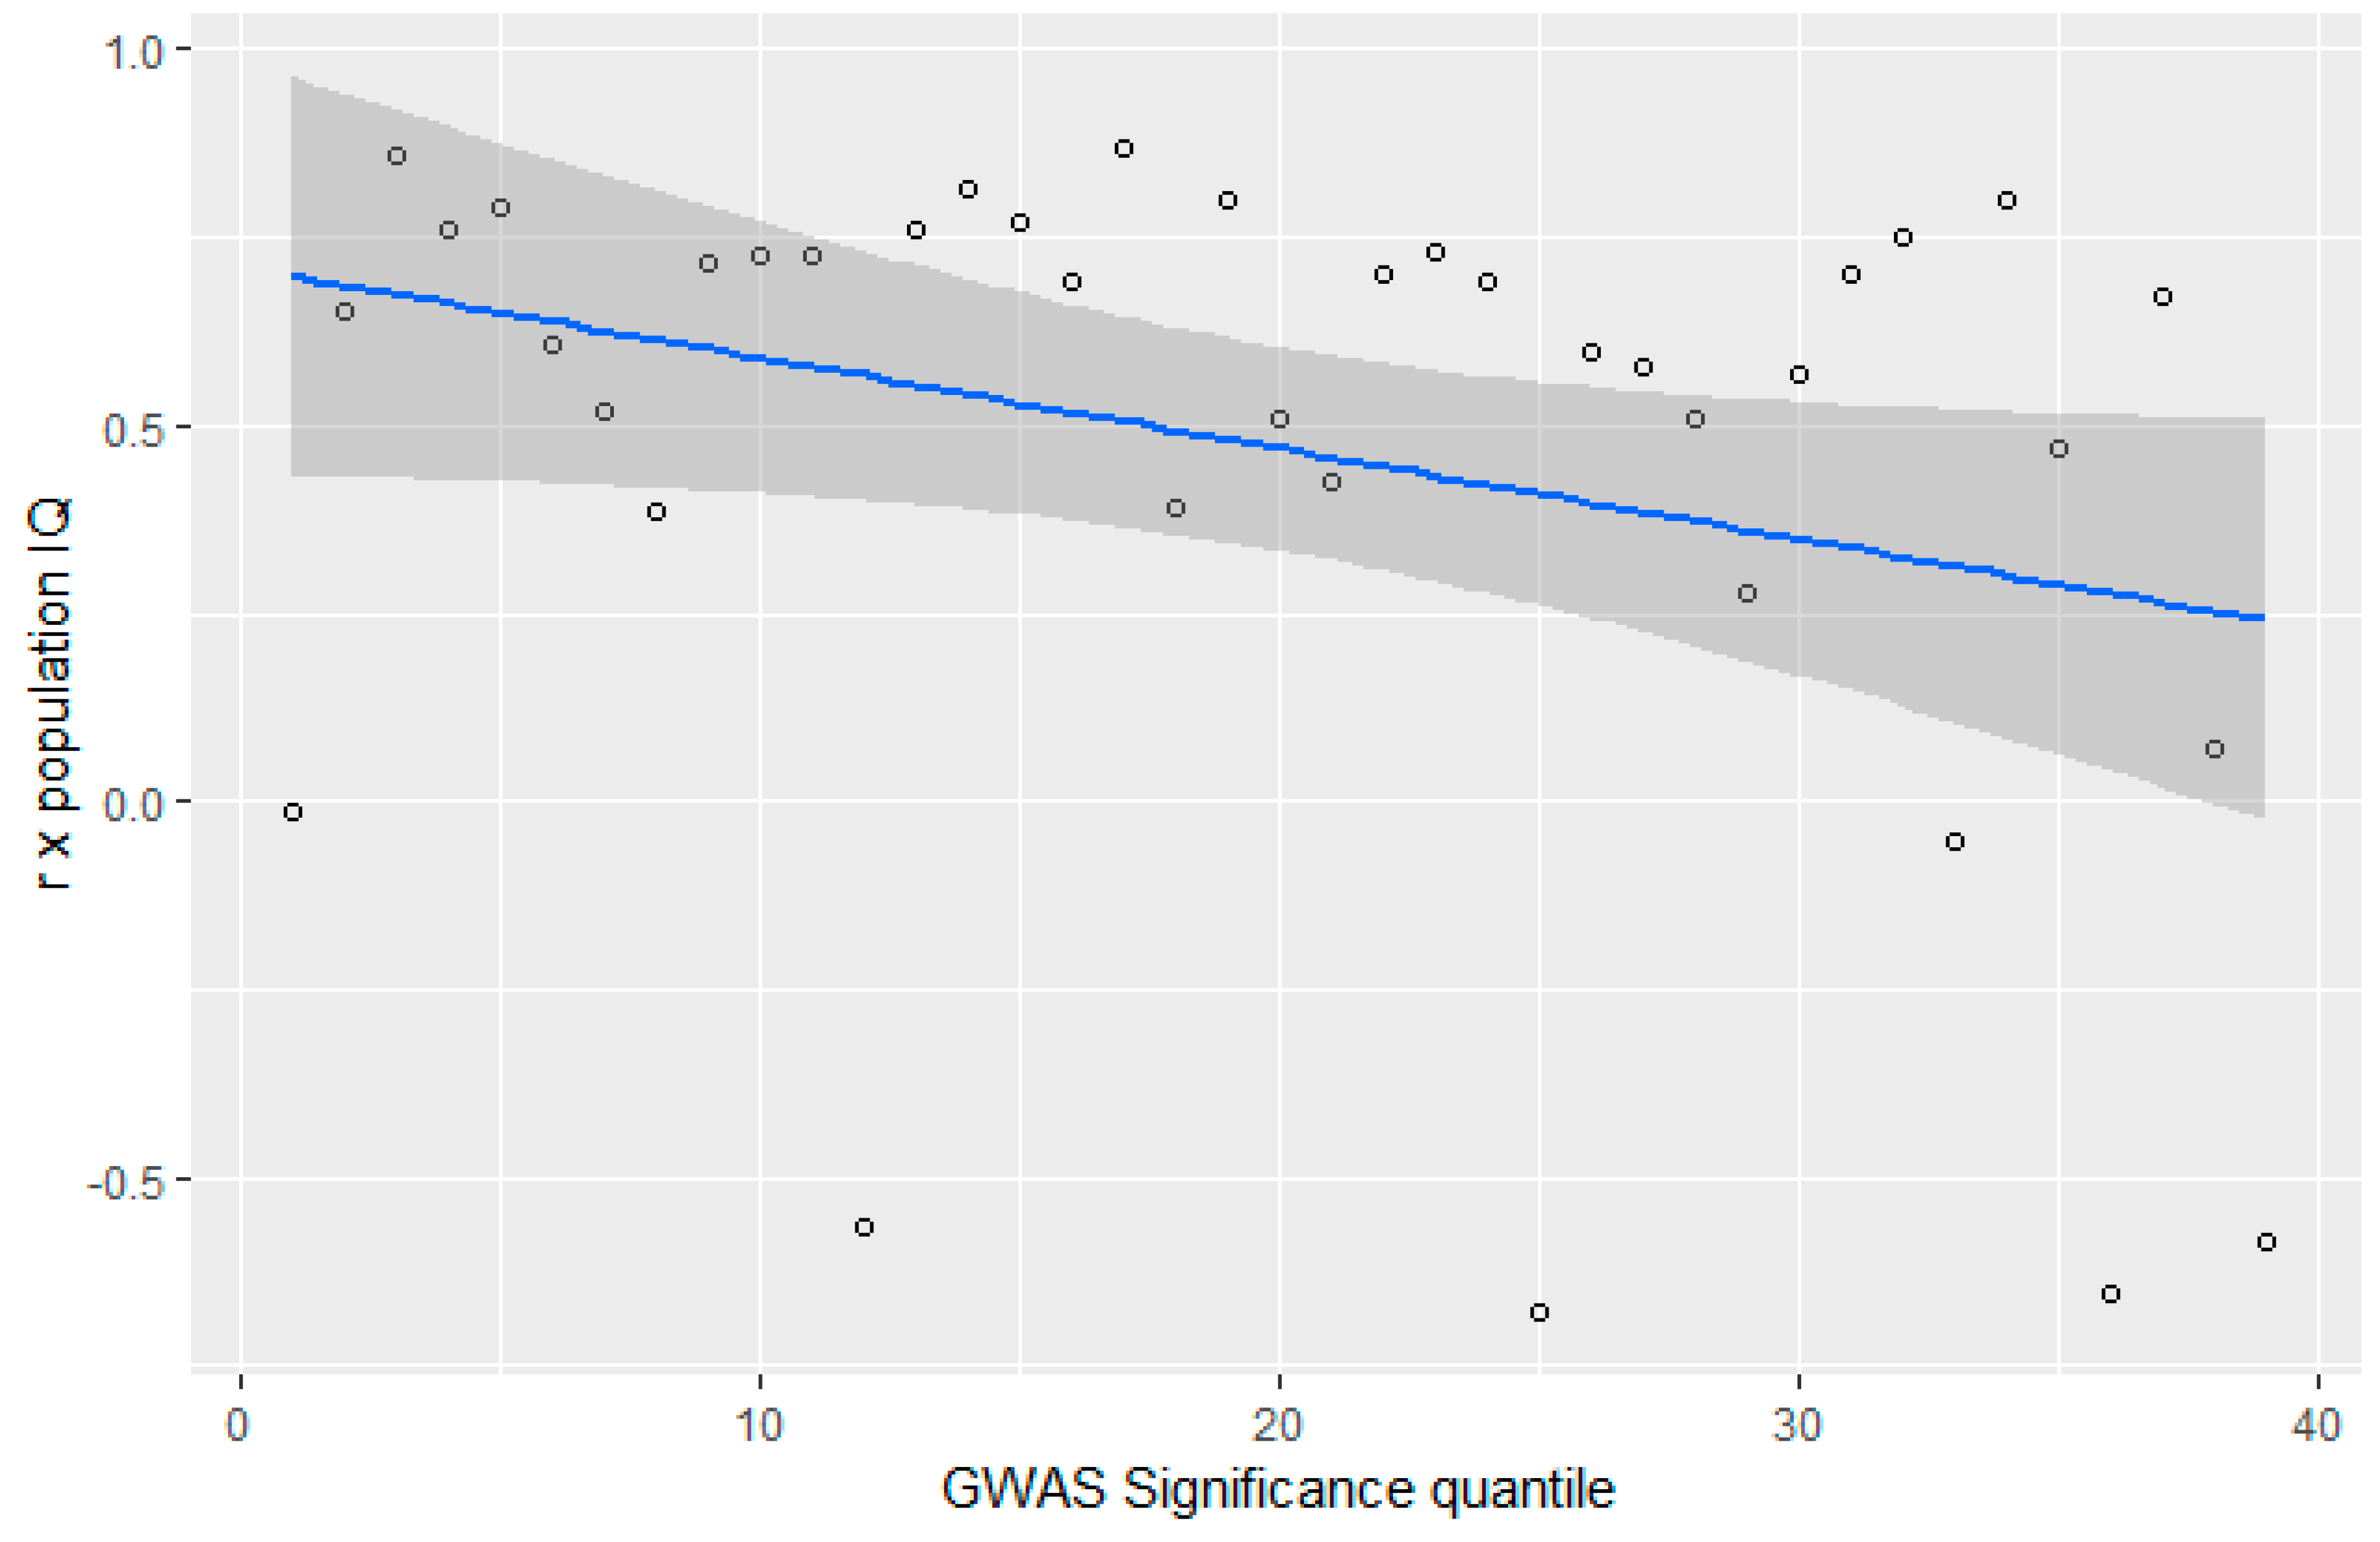
3.4. GWAS Significance and r x IQ
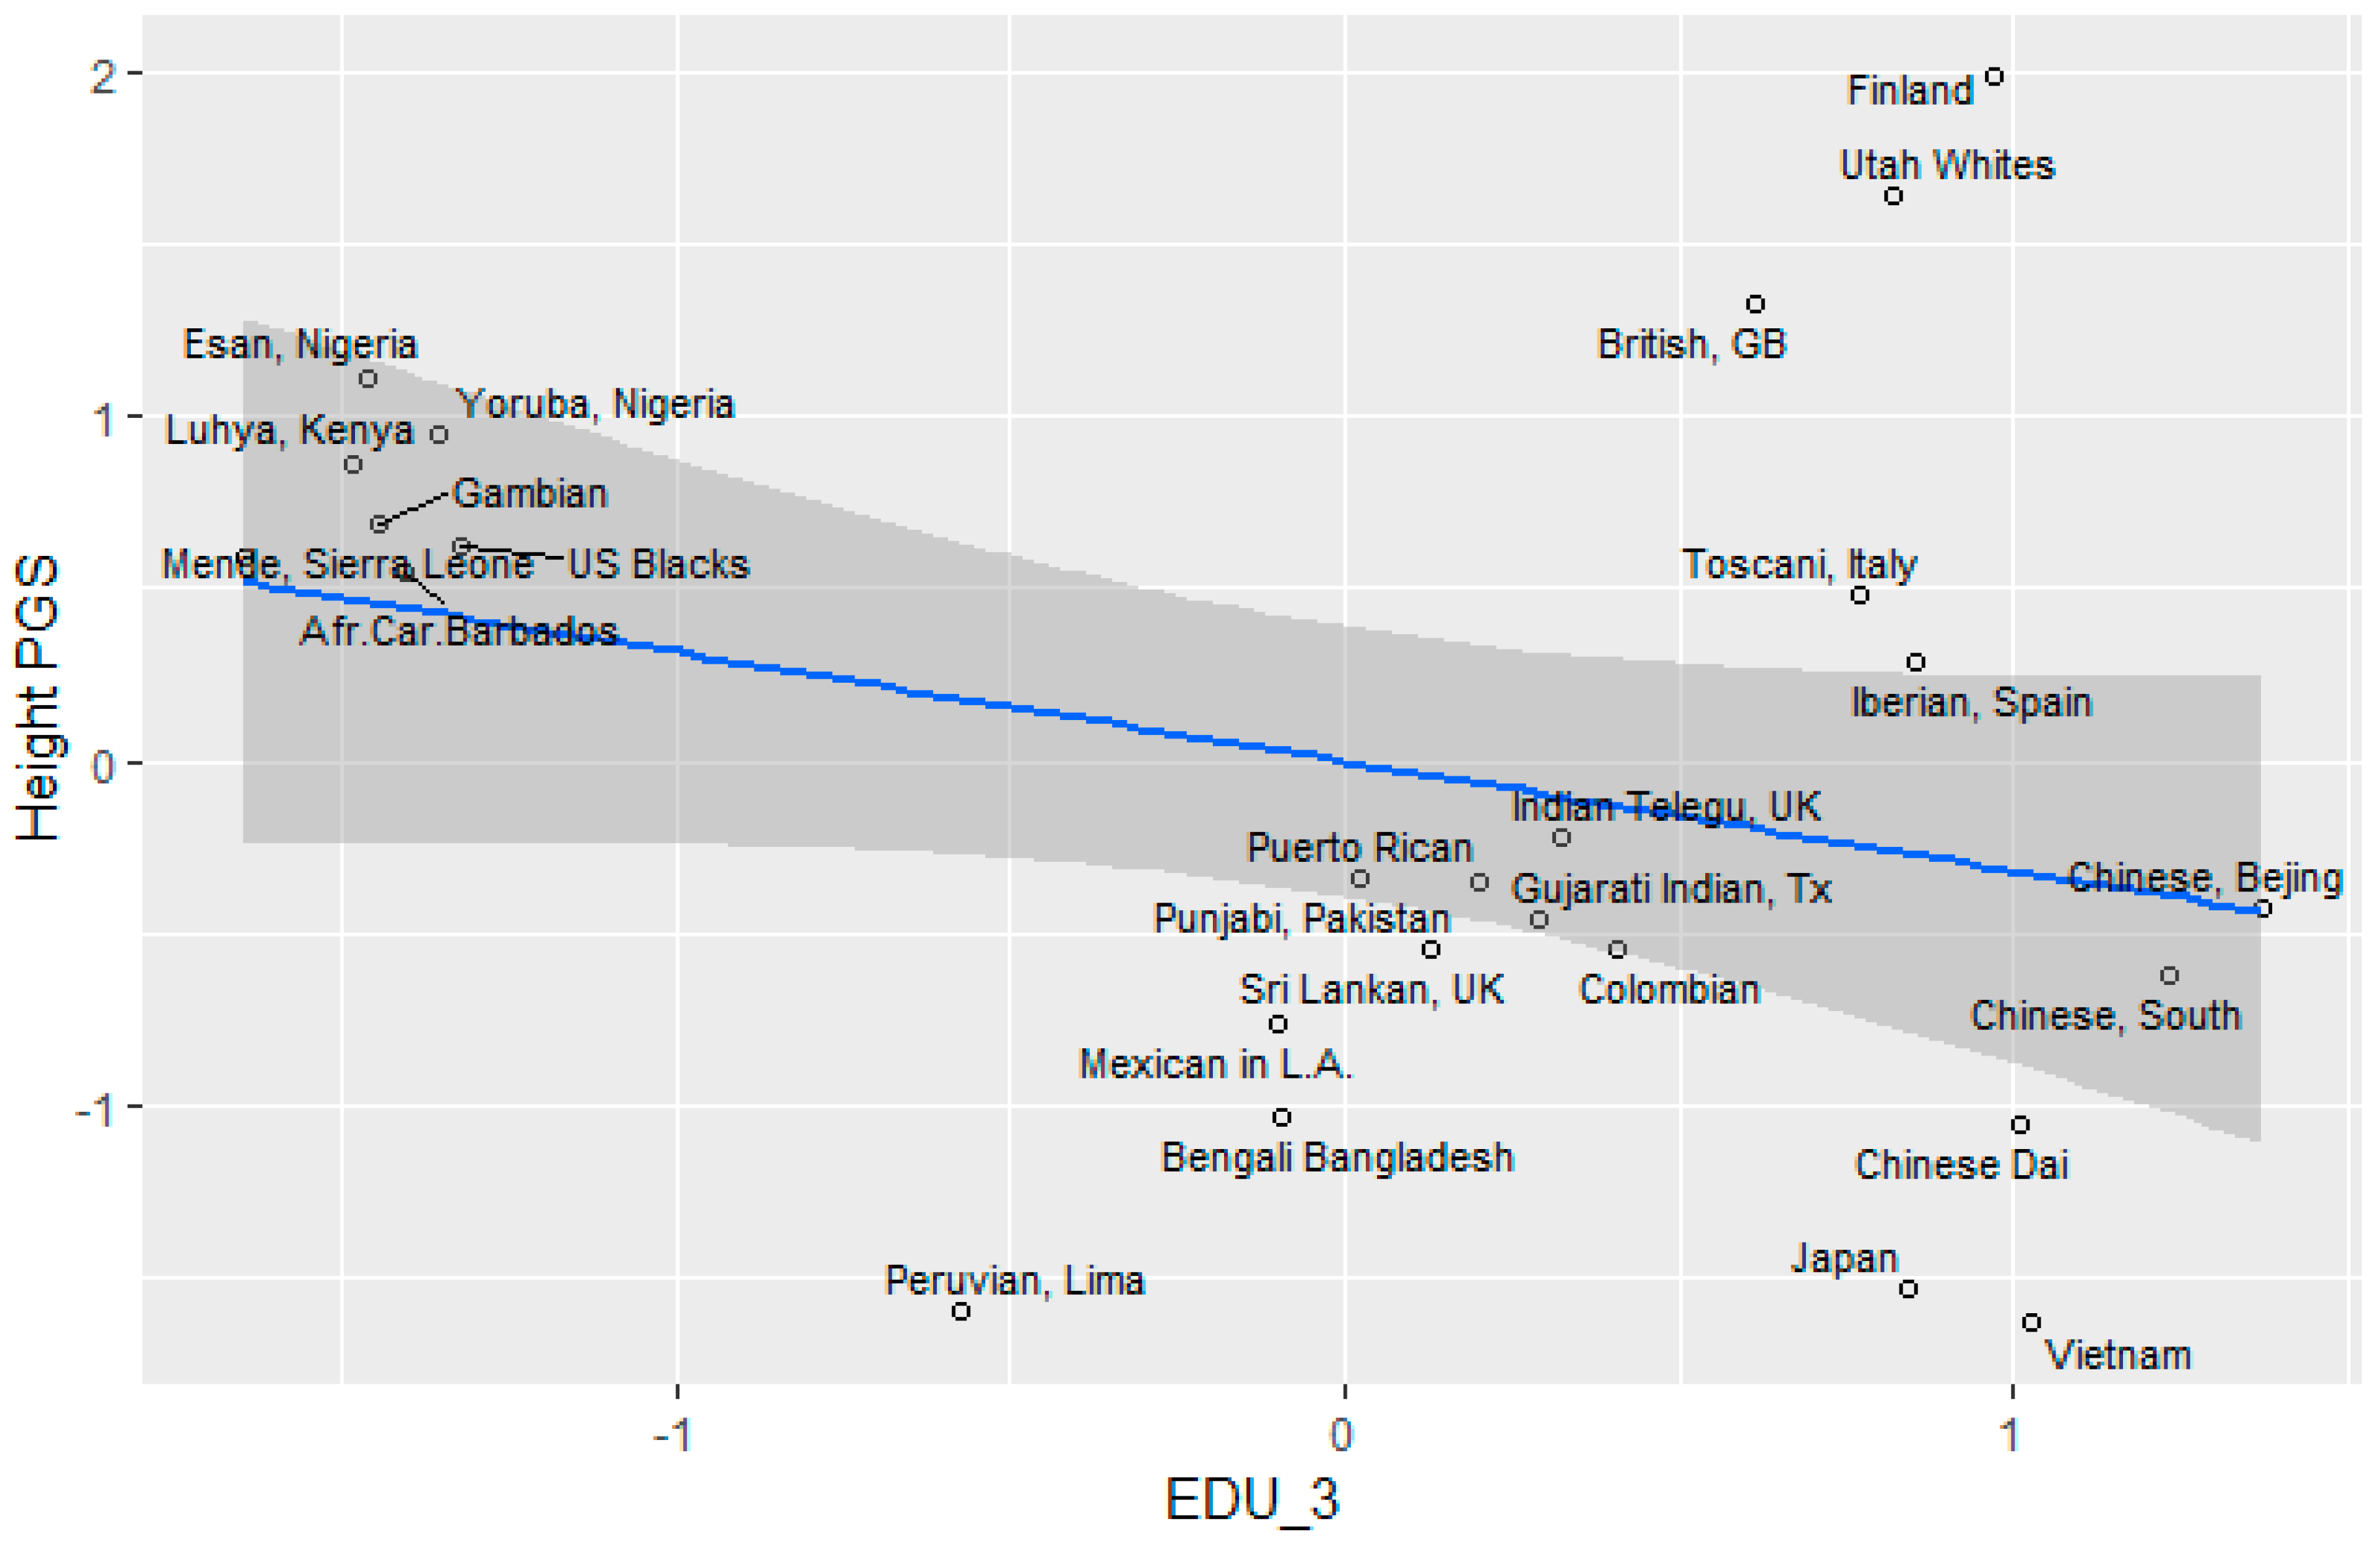
Height
3.5. Socioeconomic Factors
Gnomad
3.6. GWAS Significance and r x IQ (gnomAD)
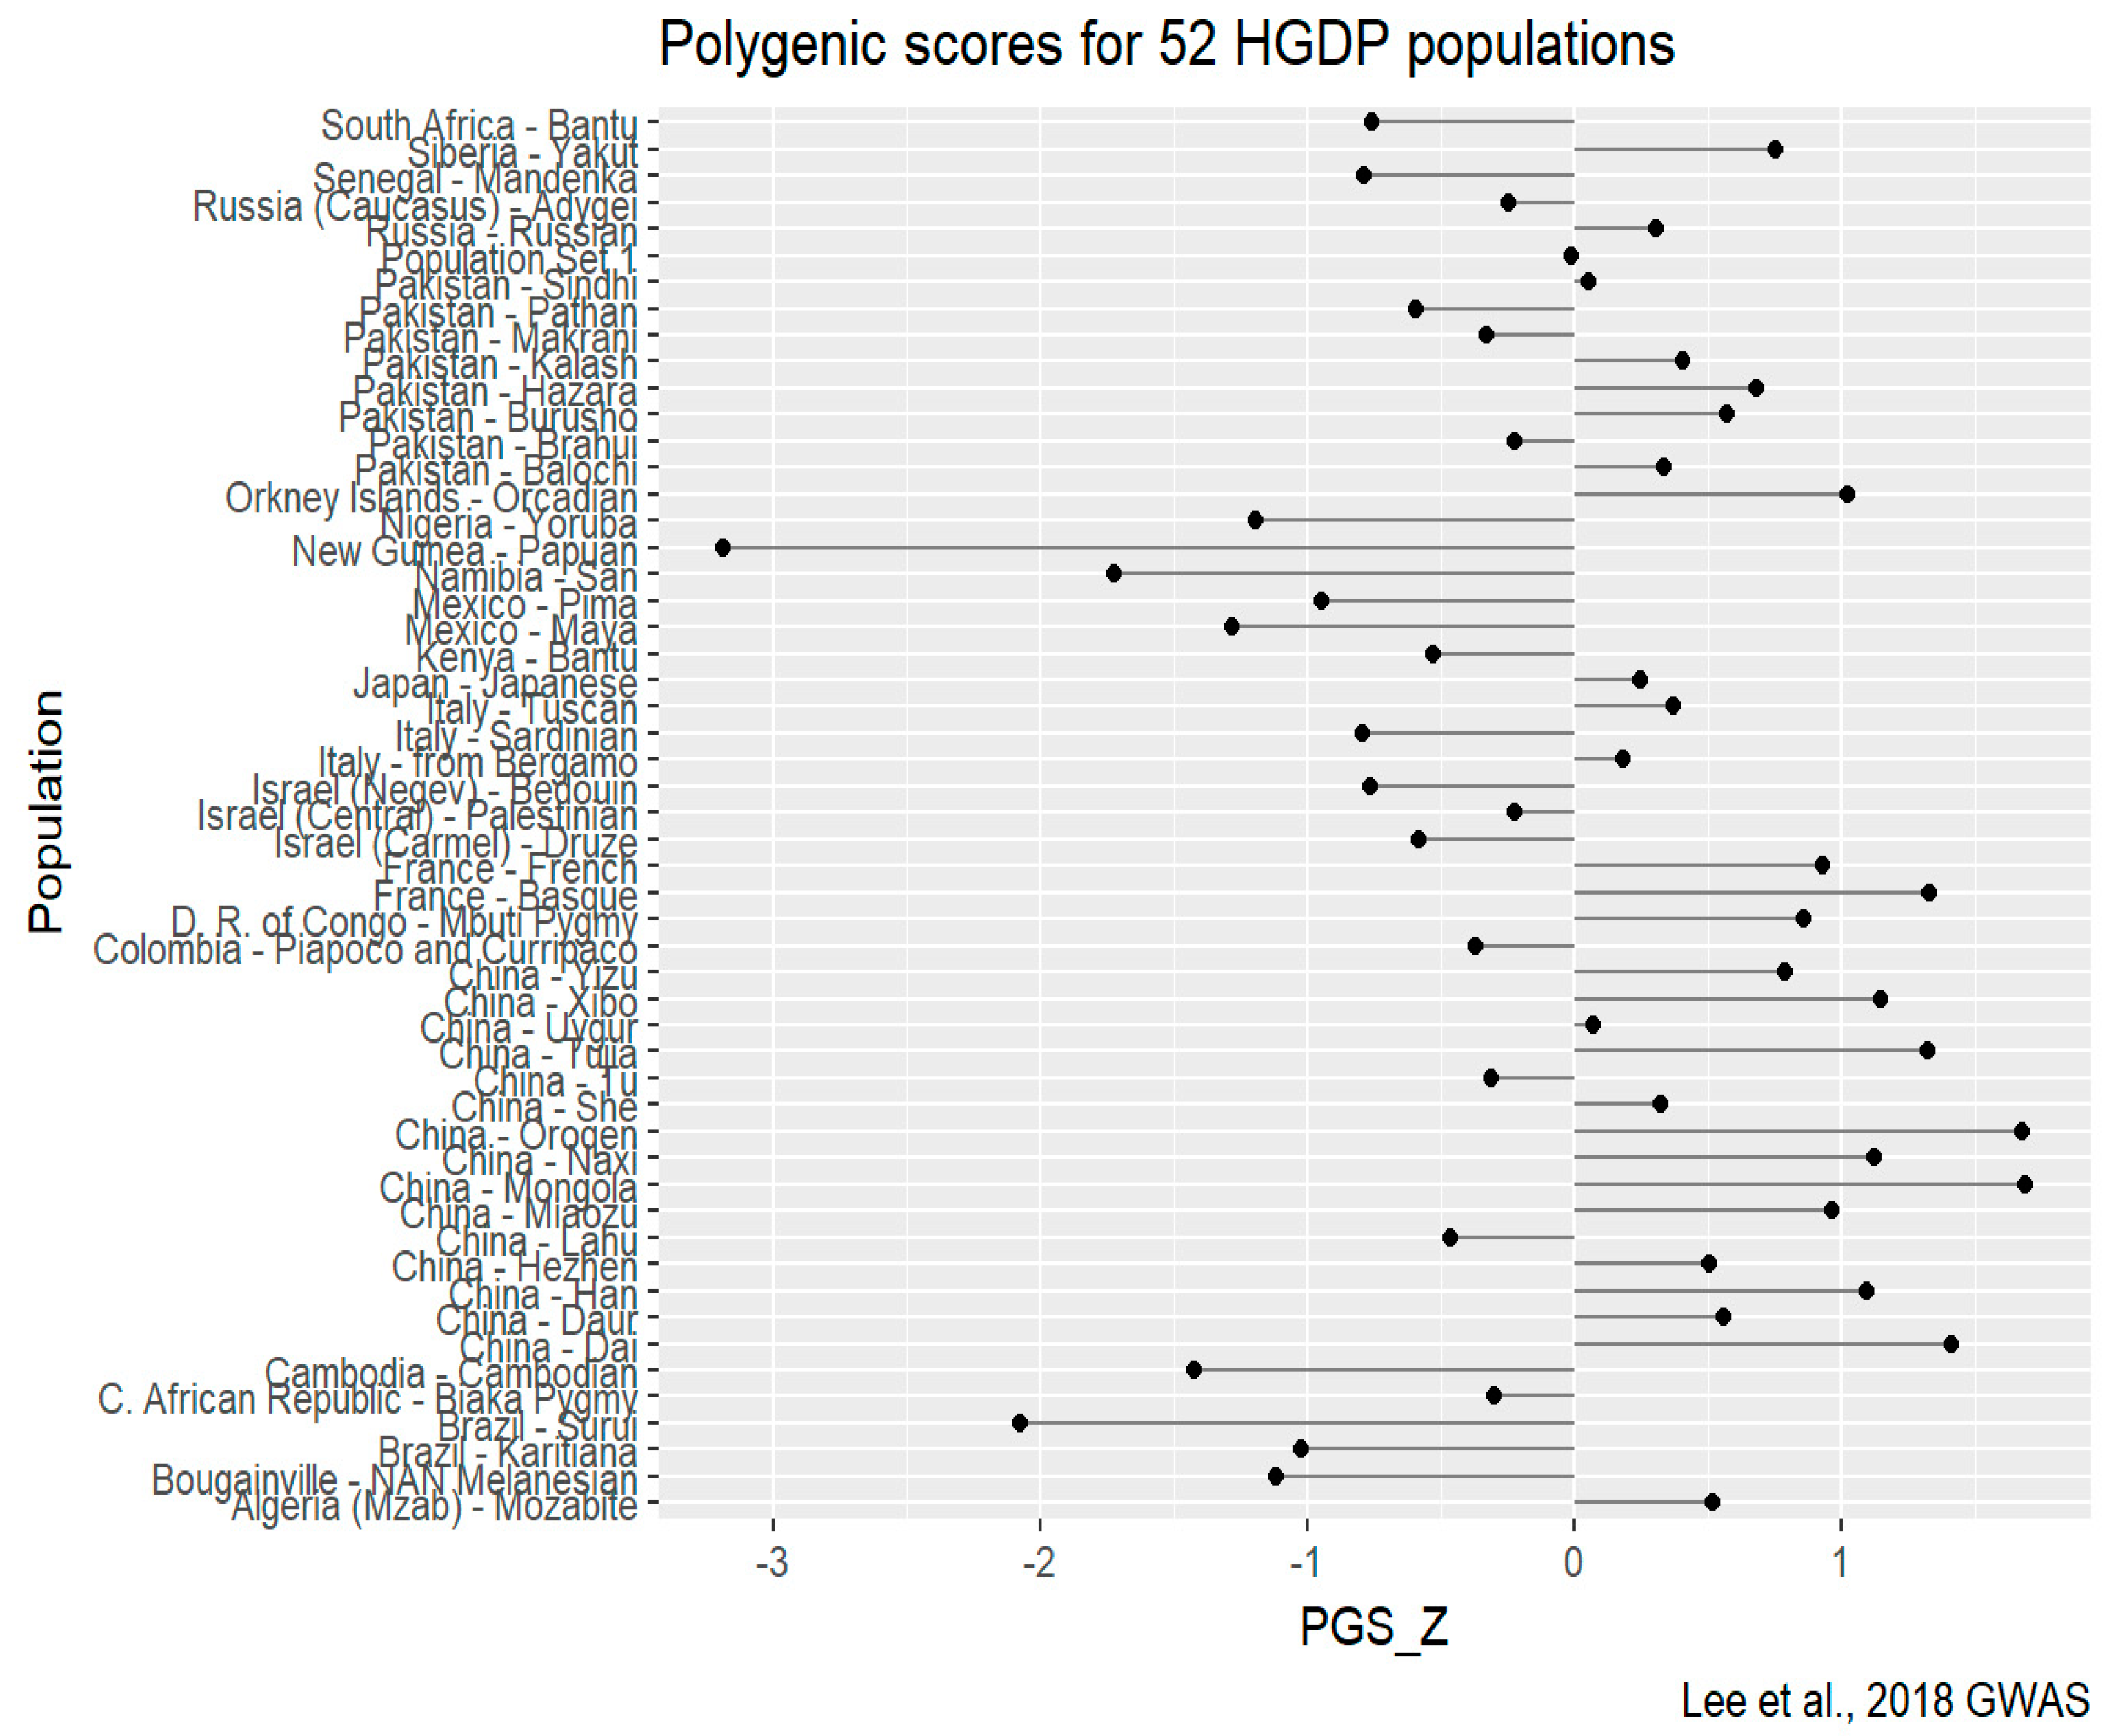
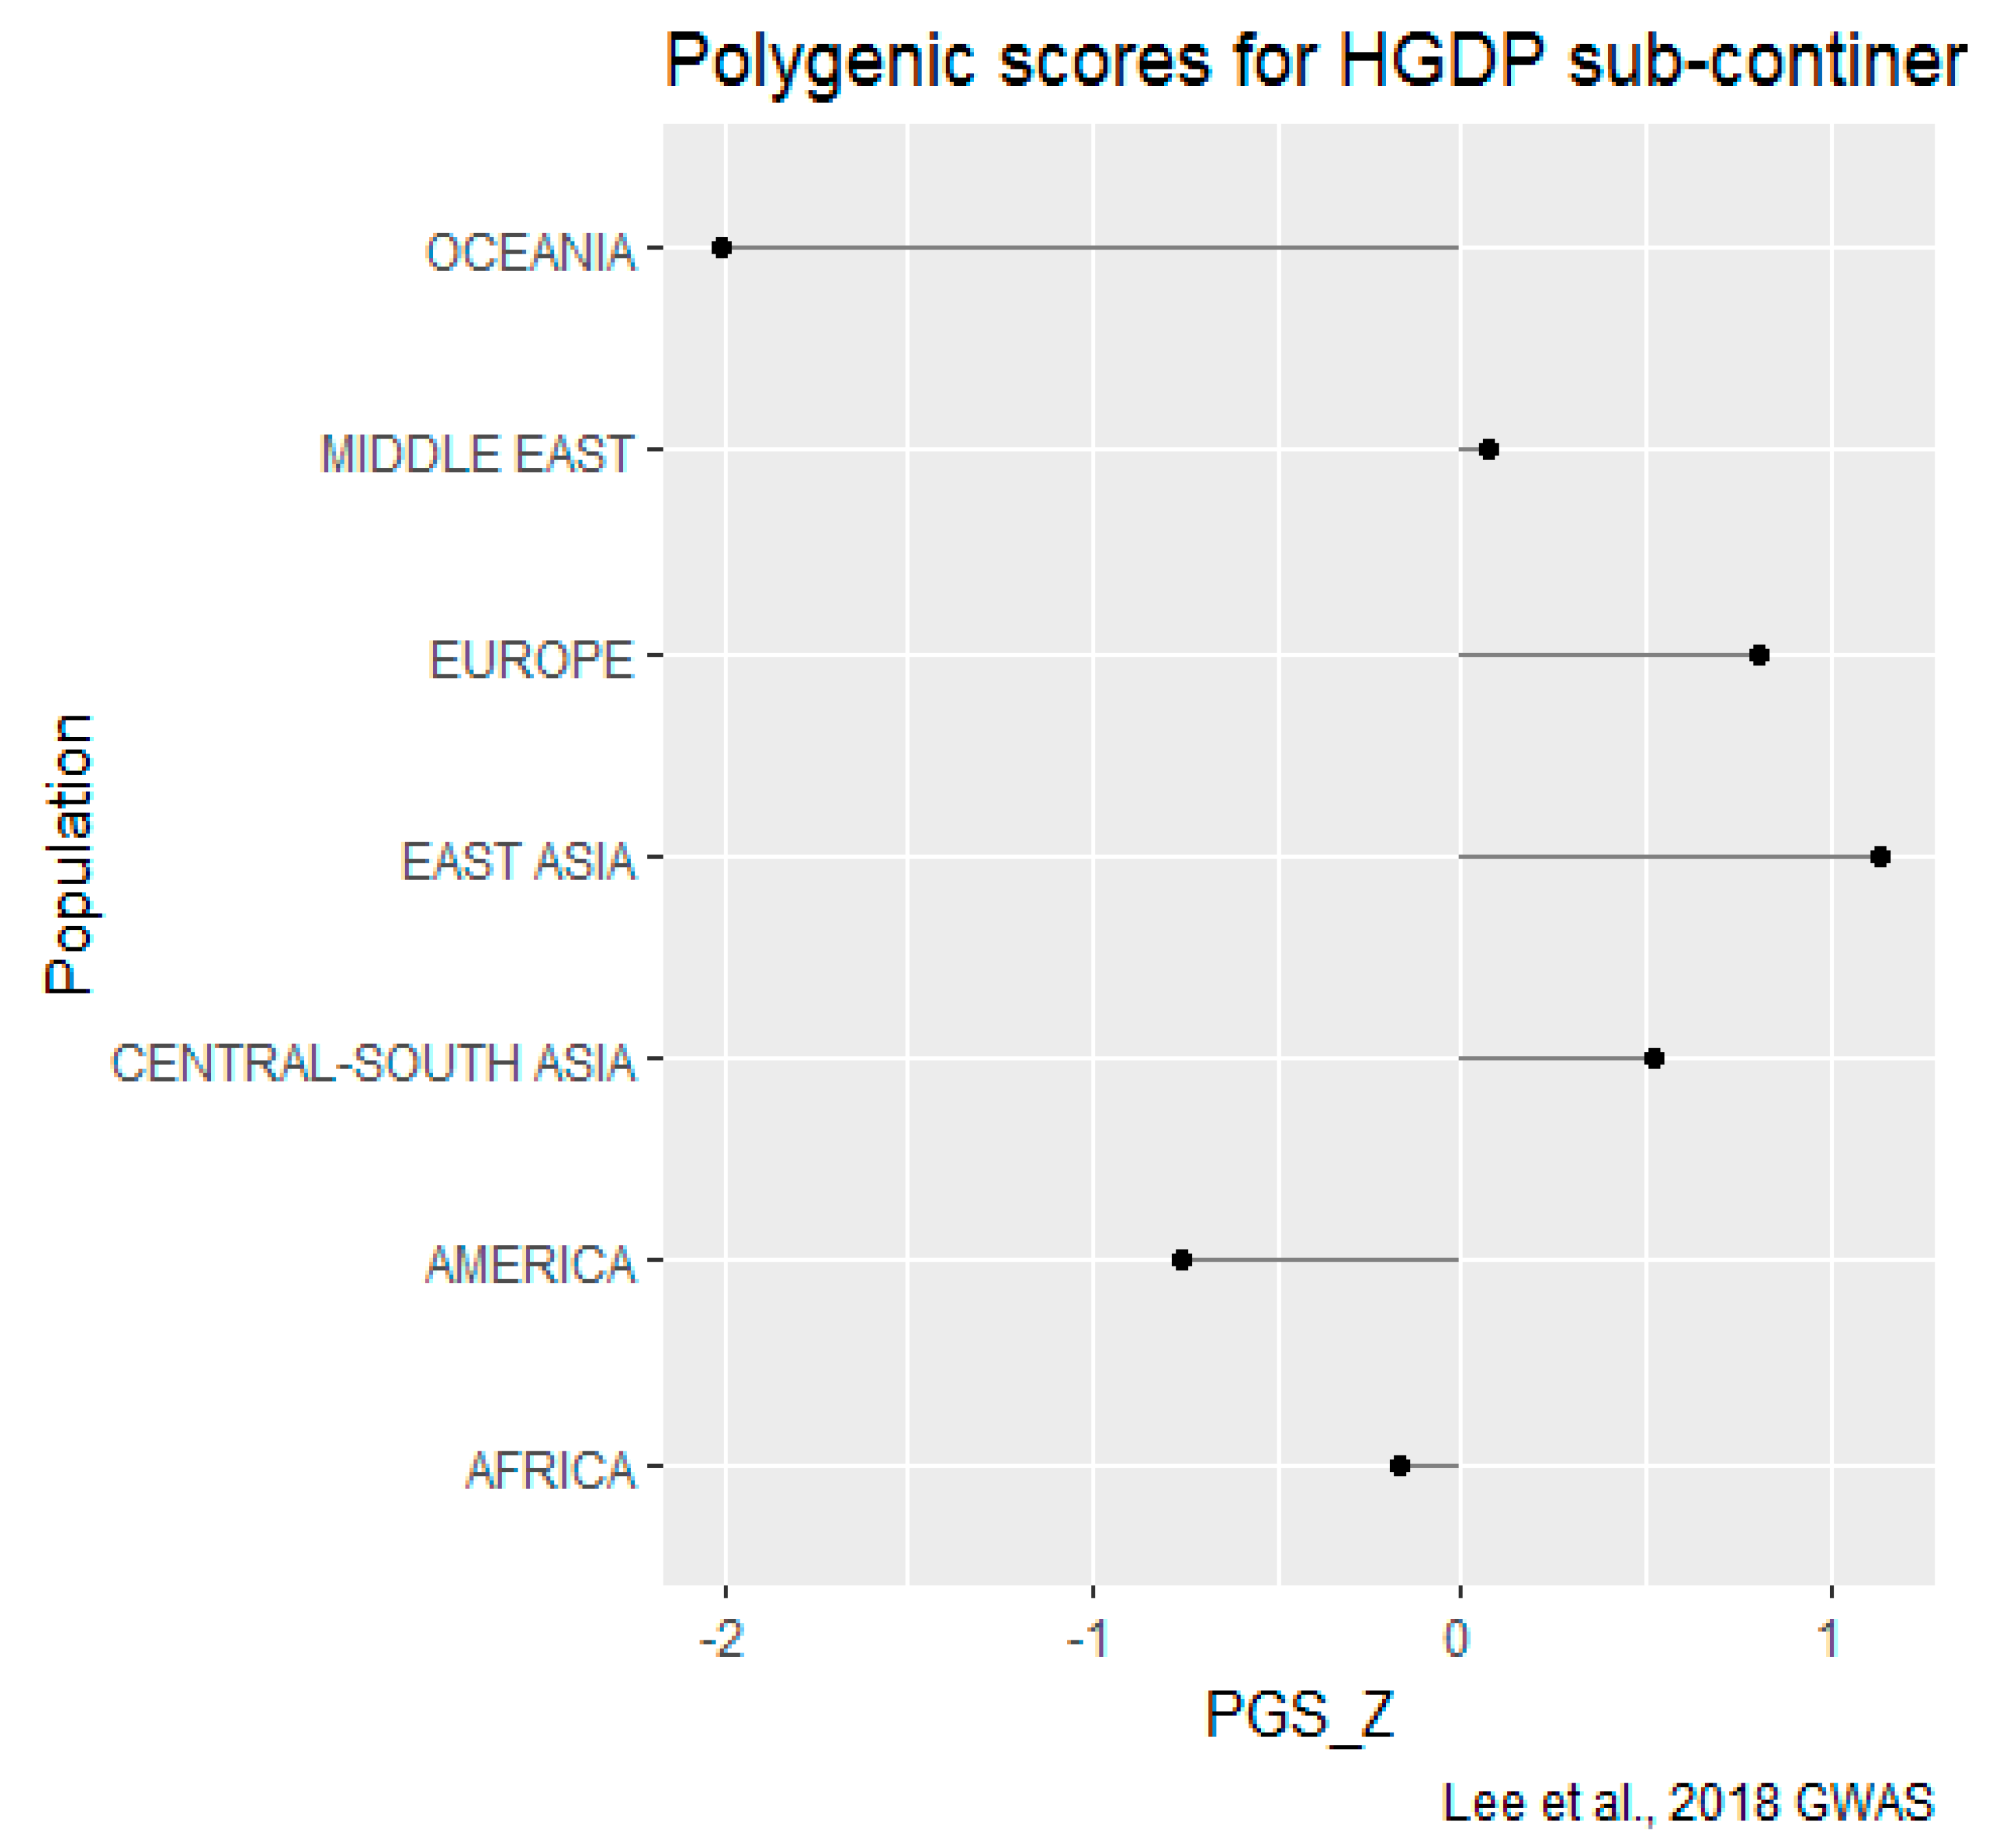
HGDP-CEPH
4. Discussion
Supplementary Materials
Funding
Acknowledgments
Conflicts of Interest
References
- Stulp, G.; Barrett, L. Evolutionary perspectives on human height variation. Biol. Rev. 2016, 91, 206–234. [Google Scholar] [CrossRef] [PubMed]
- Menotti, A.; Kromhout, D.; Blackburn, H.; Fidanza, F.; Buzina, R.; Nissinen, A. Food intake patterns and 25-year mortality from coronary heart disease: Cross-cultural correlations in the Seven Countries Study. Eur. J. Epidemiol. 1999, 15, 507–515. [Google Scholar] [CrossRef] [PubMed]
- Robinson, M.R.; Hemani, G.; Medina-Gomez, C.; Mezzavilla, M.; Esko, T.; Shakhbazov, K.; Powell, J.E.; Vinkhuyzen, A.; Berndt, S.I.; Gustafsson, S.; et al. Population genetic differentiation of height and body mass index across Europe. Nat. Genet. 2015, 47, 1357–1362. [Google Scholar] [CrossRef] [PubMed]
- Deurenberg, P.; Deurenberg-Yap, M.; Guricci, S. Asians are different from Caucasians and from each other in their body mass index/body fat per cent relationship. Obes. Rev. 2002, 3, 141–146. [Google Scholar] [CrossRef] [PubMed]
- Pritchard, J.K.; Pickrell, J.K.; Coop, G. The genetics of human adaptation: Hard sweeps, soft sweeps, and polygenic adaptation. Curr. Biol. 2010, 20, 208–221. [Google Scholar] [CrossRef]
- Pritchard, J.K.; Di Rienzo, A. Adaptation–not by sweeps alone. Nat. Rev. Genet. 2010, 11, 665–667. [Google Scholar] [CrossRef] [PubMed]
- Lee, J.J.; Wedow, R.; Okbay, A.; Kong, E.; Maghzian, O.; Zacher, M.; Nguyen-Viet, T.A.; Bowers, P.; Sidorenko, J.; Karlsson Linnér, R.; et al. Gene discovery and polygenic prediction from a genome-wide association study of educational attainment in 1.1 million individuals. Nat. Genet. 2018, 50, 1112–1121. [Google Scholar] [CrossRef] [PubMed]
- Piffer, D. Factor analysis of population allele frequencies as a simple, novel method of detecting signals of recent polygenic selection: The example of educational attainment and IQ. Mankind Q. 2013, 54, 168–200. [Google Scholar]
- Piffer, D. A review of intelligence GWAS hits: Their relationship to country IQ and the issue of spatial autocorrelation. Intelligence 2015, 53, 43–50. [Google Scholar] [CrossRef]
- Berg, J.J.; Coop, G. A population genetic signal of polygenic adaptation. PLoS Genet. 2014, 10, e1004412. [Google Scholar] [CrossRef]
- Turchin, M.C.; Chiang, C.W.; Palmer, C.D.; Sankararaman, S.; Reich, D.; Genetic Investigation of ANthropometric Traits (GIANT) Consortium; Hirschhorn, J.N. Evidence of widespread selection on standing variation in Europe at height-associated SNPs. Nat. Genet. 2012, 44, 1015–1101. [Google Scholar] [CrossRef] [PubMed]
- Zoledwieska, M.; Carlo, S.; Charleston, W.K.C.; Serena, S.; Antonella, M.; Maristella, S.; Fabio, B.; Joseph, H.M.; Michele, M.; Andrea, M.; et al. Height-reducing variants and selection for short stature in Sardinia. Nat. Genet. 2015, 47, 1352–1356. [Google Scholar] [CrossRef]
- Asgari, S.; Luo, Y.; Belbin, G.M.; Bartell, E.; Roger, R.; Llowikowski, K.; Contreras, C.; Yataco, R.; Galea, J.T.; Jimenez, J.; et al. A positively selected, common, missense variant in FBN1 confers a 2.2 centimeter reduction of height in the Peruvian population. bioRxiv 2019, 561241. [Google Scholar] [CrossRef]
- Chung, W.; Chen, J.; Turman, C.; Lindstrom, S.; Zhu, Z.; Loh, P.-R.; Kraft, P.; Liang, L. Efficient cross-trait penalized regression increases prediction accuracy in large cohorts using secondary phenotypes. Nat. Commun. 2019, 10, 569. [Google Scholar] [CrossRef]
- Piffer, D. Evidence for Recent Polygenic Selection on Educational Attainment and Intelligence Inferred from GWAS Hits: A Replication of Previous Findings Using Recent Data. Preprints 2017. [Google Scholar] [CrossRef]
- Rietveld, C.A.; Medland, S.E.; Derringer, J.; Yang, J.; Esko, T.; Martin, N.W.; Westra, H.J.; Shakhbazov, K.; Abdellaoui, A.; Agrawal, A.; et al. GWAS of 126,559 individuals identifies genetic variants associated with educational attainment. Science 2013, 340, 1467–1471. [Google Scholar] [CrossRef]
- Sniekers, S.; Stringer, S.; Watanabe, K.; Jansen, P.R.; Coleman, J.R.I.; Krapohl, E.; Taskesen, E.; Hammerschlag, A.R.; Okbay, A.; Zabaneh, D.; et al. Genome-wide association meta-analysis of 78,308 individuals identifies new loci and genes influencing human intelligence. Nat. Genet. 2017. [Google Scholar] [CrossRef]
- Davies, G.; Marioni, R.E.; Liewald, D.C.; Hill, W.D.; Hagenaars, S.P.; Harris, S.E.; Ritchie, S.J.; Luciano, M.; Fawns-Ritchie, C.; Lyall, D.; et al. Genome-wide association study of cognitive functions and educational attainment in UK Biobank (N = 112,151). Mol. Psychiatry 2016, 21, 758–767. [Google Scholar] [CrossRef] [PubMed]
- Woodley, M.A.; Younuskunju, S.; Balan, B.; Piffer, D. Holocene Selection for Variants Associated with General Cognitive Ability: Comparing Ancient and Modern Genomes. Twin Res. Human Genet. 2017, 20, 271–280. [Google Scholar] [CrossRef]
- Selzam, S.; Krapohl, E.; von Stumm, S.; O’Reilly, P.F.; Rimfeld, K.; Kovas, Y.; Dale, P.S.; Lee, J.J.; Plomin, R. Predicting educational achievement from DNA. Mol. Psychiatry 2017, 22, 267–272. [Google Scholar] [CrossRef]
- Elliott, M.L.; Belsky, D.W.; Anderson, K.; Corcoran, D.L.; Ge, T.; Knodt, A.; Prinz, J.A.; Sugden, K.; Williams, B.; Ireland, D.; et al. A Polygenic Score for Higher Educational Attainment is Associated with Larger Brains. bioRxiv 2018, 287490. [Google Scholar] [CrossRef]
- The 1000 Genomes Project Consortium. A global reference for human genetic variation. Nature 2015, 526, 68–74. [Google Scholar] [CrossRef]
- Karczewski, K.J.; Francioli, L.C.; Tiao, G.; Cummings, B.B.; Alföldi, J.; Wang, Q.; Collins, R.L.; Laricchia, K.M.; Ganna, A.; Birnbaum, D.P.; et al. Variation across 141,456 human exomes and genomes reveals the spectrum of loss-of-function intolerance across human protein-coding genes. bioRxiv 2019, 531210. [Google Scholar] [CrossRef]
- Grasgruber, P.; Sebera, M.; Hrazdìra, E.; Cacek, J.; Kalina, T. Major correlates of male height: A study of 105 countries. Econ. Hum. Biol. 2016, 21, 172–195. [Google Scholar] [CrossRef]
- Pers, T.H.; Timshel, P.; Hirschhorn, J.N. SNPsnap: A Web-based tool for identification and annotation of matched SNPs. Bioinformatics 2015, 31, 418–420. [Google Scholar] [CrossRef]
- Davison, A.C.; Hinkley, D.V. Bootstrap Methods and Their Application; Cambridge University Press: Cambridge, UK, 1997. [Google Scholar]
- Lim, S.S.; Updike, R.L.; Kaldjian, A.S.; Barber, R.M.; Cowling, K.; York, H.; Friedman, J.; Xu, R.; Whisnant, J.L.; Taylor, H.J.; et al. Measuring human capital: A systematic analysis of 195 countries and territories, 1990–2016. Lancet 2018, 392, 1217–1234. [Google Scholar] [CrossRef]
- Mantel, N. The detection of disease clustering and a generalized regression approach. Cancer Res. 1967, 27, 209–220. [Google Scholar] [PubMed]
- Diniz-Filho, J.A.; Soares, T.N.; Lima, J.S.; Dobrovolski, R.; Lemes Landeiro, V.; Pires de Campos Telles, M.; Rangel, T.F.; Bini, L.M. Mantel test in population genetics. Genet. Mol. Biol. 2013, 36, 475–485. [Google Scholar] [CrossRef]
- Amigo, J.; Salas, A.; Phillips, C.; Carracedo, A. SPSmart: Adapting population based SNP genotype databases for fast and comprehensive web access. BMC Bioinform. 2008, 9, 428. [Google Scholar] [CrossRef] [PubMed]
- Handley, L.J.; Manica, A.; Goudet, J.; Balloux, F. Going the distance: Human population genetics in a clinal world. Trends Genet. 2007, 23, 432–439. [Google Scholar] [CrossRef]
- R Core Team. R: A Language and Environment for Statistical Computing; R Foundation for Statistical Computing: Vienna, Austria, 2018. [Google Scholar]
- Dutton, E.; Kirkegaard, E.O. Fluid g in Scandinavia and Finland: Comparing results from PISA Creative Problem Solving and the WAIS IV matrices subtest. Open Diff. Psychol. 2014. [Google Scholar] [CrossRef]
- Dunkel, C.S.; Woodley of Menie, M.A.; Pallesen, J.; Kirkegaard, E.O.W. Polygenic scores mediate the Jewish phenotypic advantage in educational attainment and cognitive ability compared with Catholics and Lutherans. Available online: http://dx.doi.org/10.1037/ebs0000158 (accessed on 28 March 2019).
- Lynn, R.; Vanhanen, T. Intelligence: A Unifying Construct for the Social Sciences; Ulster Institute for Social Research: London, UK, 2012. [Google Scholar]
- The NIQ-dataset (V1.3.1). Available online: http://viewoniq.org/wp-content/uploads/2018/08/NIQ-DATASET-V1.3.1.zip (accessed on 28 March 2019).
- Richwine, J. IQ and Immigration Policy. Ph.D. Thesis, Harvard University, Cambridge, MA, USA, 2009. [Google Scholar]
- Wood, A.R.; Esko, T.; Yang, J.; Vedantam, S.; Pers, T.H.; Gustafsson, S.; Chu, A.Y.; Estrada, K.; Luan, J.; Kutalik, Z.; et al. Defining the role of common variation in the genomic and biological architecture of adult human height. Nat. Genet. 2014, 46, 1173–1186. [Google Scholar] [CrossRef]
- Moreno-Mayar, J.V.; Potter, B.A.; Vinner, L.; Steinrücken, M.; Rasmussen, S.; Terhorst, J.; Kamm, J.A.; Albrechtsen, A.; Malaspinas, A.S.; Sikora, M.; et al. Terminal Pleistocene Alaskan genome reveals first founding population of Native Americans. Nature 2018, 553, 203–207. [Google Scholar] [CrossRef] [PubMed]
- Martin, A.R.; Gignoux, C.R.; Walters, R.K.; Wojcik, G.L.; Neale, B.M.; Gravel, S.; Daly, M.J.; Bustamante, C.D.; Kenny, E.E. Human Demographic History Impacts Genetic Risk Prediction across Diverse Populations. Am. J. Hum. Genet. 2017, 100, 635–649. [Google Scholar] [CrossRef] [PubMed]
- Zanetti, D.; Weale, M.E. True causal effect size heterogeneity is not required to explain trans-ethnic differences in GWAS signals. bioRxiv 2016, 085092. [Google Scholar] [CrossRef]
- Martin, A.R.; Kanai, M.; Kamatani, Y.; Okada, Y.; Neale, B.M.; Daly, M.J. Current clinical use of polygenic scores will risk exacerbating health disparities. bioRxiv 2018, 441261. [Google Scholar] [CrossRef]
- Rabinowitz, J.A.; Kuo, S.I.; Felder, W.; Musci, R.J.; Bettencourt, A.; Benke, K.; Sisto, D.Y.; Smail, E.; Uhl, G.; Maher, B.S.; et al. Associations between an Educational Attainment Polygenic Score with Educational Attainment in an African American Sample. Genes Brain Behav. 2019. [Google Scholar] [CrossRef]
- Mahajan, A.; Rodan, A.R.; Le, T.H.; Gaulton, K.J.; Haessler, J.; Stilp, A.M.; Kamatani, Y.; Zhu, G.; Sofer, T.; Puri, S.; et al. Trans-ethnic Fine Mapping Highlights Kidney-Function Genes Linked to Salt Sensitivity. Am. J. Hum. Genet. 2016, 99, 636–646. [Google Scholar] [CrossRef]
- Ntzani, E.E.; Liberopoulos, G.; Manolio, T.A.; Ioannidis, J.P.A. Consistency of genome-wide associations across major ancestral groups. Hum. Genet. 2012, 131, 1057–1071. [Google Scholar] [CrossRef]
- Li, Z.; Chen, J.; Yu, H.; He, L.; Xu, Y.; Zhang, D.; Yi, Q.; Li, C.; Li, X.; Shen, J.; et al. Genome-wide association analysis identifies 30 new susceptibility loci for schizophrenia. Nat. Genet. 2017, 49, 1576–1583. [Google Scholar] [CrossRef]
- Jelenkovic, A.; Sund, R.; Hur, Y.M.; Yokoyama, Y.; Hjelmborg, J.V.; Möller, S.; Honda, C.; Magnusson, P.K.; Pedersen, N.L.; Ooki, S.; et al. Genetic and environmental influences on height from infancy to early adulthood: An individual-based pooled analysis of 45 twin cohorts. Sci. Rep. 2016, 6, 2849. [Google Scholar] [CrossRef] [PubMed]
- Bouchard, T.J., Jr. Genetic and environmental influences on adult intelligence and special mental abilities. Hum. Biol. 1998, 70, 257–279. [Google Scholar] [PubMed]
- Shull, G.H. What is “Heterosis”? Genetics 1948, 33, 439–446. [Google Scholar] [PubMed]


| Population | IQ | Learning | EDU3 (Weighted) | EDU3 (Unweighted) | EDU 3 (Causal) | EDU2 | Piffer 2015 [9] |
|---|---|---|---|---|---|---|---|
| Afr.Car.Barbados | 83 | 72 | −1.30 | 0.474 | 0.444 | −1.48 | −1.25 |
| US Blacks | 85 | −1.28 | 0.475 | 0.445 | −1.07 | −1.05 | |
| Bengali Bangladesh | 81 | 69 | −0.16 | 0.488 | 0.462 | 0.04 | 0.03 |
| Chinese Dai | 1.09 | 0.499 | 0.472 | 0.88 | 0.83 | ||
| Utah Whites | 99 | 89 | 0.76 | 0.497 | 0.480 | 0.40 | 0.53 |
| Chinese, Bejing | 105 | 1.61 | 0.503 | 0.477 | 1.54 | 1.53 | |
| Chinese, South | 105 | 95 | 1.42 | 0.501 | 0.476 | 1.32 | 1.32 |
| Colombian | 83.5 | 66 | 0.23 | 0.493 | 0.477 | −0.08 | 0.02 |
| Esan, Nigeria | 71 | 64 | −1.30 | 0.474 | 0.447 | −1.45 | −1.39 |
| Finland | 101 | 91 | 1.10 | 0.499 | 0.483 | 1.08 | 0.64 |
| British, GB | 100 | 88 | 0.59 | 0.495 | 0.482 | 0.78 | 0.68 |
| Gujarati Indian, Tx | 0.23 | 0.492 | 0.465 | 0.46 | 0.33 | ||
| Gambian | 62 | 65 | −1.30 | 0.474 | 0.439 | −1.56 | −1.57 |
| Iberian, Spain | 97 | 86 | 0.22 | 0.497 | 0.480 | 0.54 | 0.52 |
| Indian Telegu, UK | 66 | 0.25 | 0.492 | 0.469 | 0.18 | 0.27 | |
| Japan | 105 | 94 | 1.14 | 0.497 | 0.484 | 1.27 | 1.41 |
| Vietnam | 99.4 | 82 | 1.18 | 0.499 | 0.477 | 1.18 | 1.23 |
| Luhya, Kenya | 74 | 66 | −1.38 | 0.474 | 0.441 | −1.40 | −1.69 |
| Mende, Sierra Leone | 64 | 65 | −1.53 | 0.472 | 0.436 | −1.40 | −1.49 |
| Mexican in L.A. | 88 | 74 | −0.29 | 0.488 | 0.481 | -0.18 | 0.04 |
| Peruvian, Lima | 85 | 70 | −0.99 | 0.483 | 0.465 | -0.60 | 0.20 |
| Punjabi, Pakistan | 84 | 68 | −0.01 | 0.489 | 0.470 | 0.33 | 0.16 |
| Puerto Rican | 83.5 | 73 | 0.10 | 0.491 | 0.474 | −0.06 | −0.05 |
| Sri Lankan, UK | 79 | 75 | 0.05 | 0.490 | 0.466 | 0.13 | −0.09 |
| Toscani, Italy | 99 | 86 | 0.78 | 0.497 | 0.479 | 0.54 | 0.45 |
| Yoruba, Nigeria | 71 | 64 | −1.22 | 0.475 | 0.440 | −1.40 | −1.63 |
| Variable | Beta | T | Sig | VIF |
|---|---|---|---|---|
| Model 1 | ||||
| PS 9 distances | 0.524 | 9.024 | <2 × 10⁻¹⁶ | 1.713 |
| Fst distances | 0.250 | 4.305 | 2.4 × 10⁻⁵ | |
| Model 2 | ||||
| PS 161 distances | 0.456 | 7.063 | 1.61 × 10⁻¹¹ | 1.912 |
| Fst dist | 0.274 | 4.241 | 3.14 × 10⁻⁵ | |
| Model 3 | ||||
| EDU3 | 0.680 | 9.290 | <2 × 10⁻¹⁶ | 2.761 |
| Fst dist | 0.045 | 0.615 | 0.539 | |
| Model 4 * | ||||
| EDU3 | 0.772 | 7.964 | 7.87 × 10⁻¹⁶ | 3.026 |
| Fst dist | −0.324 | −3.344 | 0.00096 |
| EDU PGS | HDI | Total Protein | Child Mortality | R^2 | Sum of Squares |
|---|---|---|---|---|---|
| 0.661 *** | 0.371 ** | 0.865 | 473.55 | ||
| 0.889 *** | 0.782 | 807.13 | |||
| P = 0.0012 | |||||
| 0.717 *** | 0.354 *** | 0.885 | 399.97 | ||
| 0.896 *** | 0.793 | 759.19 | |||
| P = 3.6 × 10⁻⁵ | |||||
| 0.702 *** | −0.279 * | 0.842 | 640.12 | ||
| 0.906 *** | 0.812 | 509.24 | |||
| P = 0.031 |
| Height PGS | HDI | Total Protein | Child Mortality | R^2 | Sum of Squares |
|---|---|---|---|---|---|
| 0.486 *** | 0.711 *** | 0.849 | 85.62 | ||
| 0.610 ** | 0.343 | 390.35 | |||
| P = 5.07 × 10⁻⁸ | |||||
| 0.238 ** | 0.819 ** | 0.896 | 58.36 | ||
| 0.614 ** | 0.346 | 386.54 | |||
| P = 3.08 × 10⁻⁹ | |||||
| 0.627 *** | −0.703 *** | 0.837 | 366.77 | ||
| 0.599 ** | 0.327 | 84.29 | |||
| P = 1.74 × 10⁻⁷ |
| Population | IQ | PGS (GWAS Sig.) | PGS Clumped |
|---|---|---|---|
| Finnish | 102 (Dutton and Kirkegaard, 2014) [33] | 49.456 | 50.315 |
| Ashkenazi | 110 (Dunkel et al, 2019) [34] | 50.038 | 50.805 |
| Southern Europe | 97(Lynn & Vanhanen, 2012) [35] | 49.119 | 50.056 |
| Estonia | 101(Becker, 2019) [36] | 49.248 | 50.14 |
| NW European | 100(Dutton and Kirkegaard, 2014) [33] | 49.215 | 50.097 |
| African (American) | 85 | 47.414 | 47.656 |
| Latino | 93 (Richwine, 2009) [37] | 48.654 | 49.294 |
| East Asian | 105 (Lynn & Vanhanen, 2012) [35] | 49.750 | 50.076 |
© 2019 by the author. Licensee MDPI, Basel, Switzerland. This article is an open access article distributed under the terms and conditions of the Creative Commons Attribution (CC BY) license (http://creativecommons.org/licenses/by/4.0/).
Share and Cite
Piffer, D. Evidence for Recent Polygenic Selection on Educational Attainment and Intelligence Inferred from Gwas Hits: A Replication of Previous Findings Using Recent Data. Psych 2019, 1, 55-75. https://doi.org/10.3390/psych1010005
Piffer D. Evidence for Recent Polygenic Selection on Educational Attainment and Intelligence Inferred from Gwas Hits: A Replication of Previous Findings Using Recent Data. Psych. 2019; 1(1):55-75. https://doi.org/10.3390/psych1010005
Chicago/Turabian StylePiffer, Davide. 2019. "Evidence for Recent Polygenic Selection on Educational Attainment and Intelligence Inferred from Gwas Hits: A Replication of Previous Findings Using Recent Data" Psych 1, no. 1: 55-75. https://doi.org/10.3390/psych1010005
APA StylePiffer, D. (2019). Evidence for Recent Polygenic Selection on Educational Attainment and Intelligence Inferred from Gwas Hits: A Replication of Previous Findings Using Recent Data. Psych, 1(1), 55-75. https://doi.org/10.3390/psych1010005