Article

Nitrogen-Doped Biocarbon Derived from Alginate-Extraction Residues of Sargassum spp.: Towards Low-Cost Electrocatalysts for Alkaline ORR

1
Centro de Investigación Científica de Yucatán, A.C. Calle 43 No. 130 x 32 y 34, Chuburná de Hidalgo, Mérida C.P. 97205, Mexico
2
IXM-Secihti, Centro de Investigación Científica de Yucatán, Carretera Sierra Papacal-Chuburná Puerto, Km 5, Sierra Papacal, Mérida C.P. 97302, Mexico
*
Author to whom correspondence should be addressed.
Chemistry 2025, 7(5), 144; https://doi.org/10.3390/chemistry7050144
Submission received: 17 June 2025 / Revised: 29 July 2025 / Accepted: 21 August 2025 / Published: 3 September 2025
(This article belongs to the Section Catalysis)

Abstract

Extraction processes of alginates from Sargassum spp. generate a substantial number of solid residues that are commonly discarded. This study explores the sustainable transformation of these residues into nitrogen-doped biocarbon through chemical activation with KOH and nitrogen doping using urea. XRD, FTIR, SEM-EDX, Raman spectroscopy, BET surface area analysis, XPS, and CHNS elemental analysis were used to characterize the materials. The doped and activated biocarbon (BDA) demonstrated excellent physicochemical properties, including a specific surface area of 1790 m2 g−1 and a mesoporous structure. Electrochemical evaluation in alkaline media revealed a current density of −4.37 mA cm−2, an onset potential of 0.922 E vs. RHE, and a half-wave potential of 0.775 E vs. RHE. Koutecky–Levich analysis indicated a two-electron reduction pathway. The superior performance was attributed to the synergistic effects of high surface area, nitrogen functionalities (pyridinic-N and pyrrolic-N), and enhanced accessibility of active sites. These results highlight the potential of waste-derived, nitrogen-doped biocarbon as a sustainable and low-cost alternative for ORR electrocatalysis in alkaline fuel cells.

1. Introduction

The continuous and extensive arrival of Sargassum spp. (also known as Sargasso) to the shores of the Mexican Caribbean has made it one of the most invasive macroalgae species, raising significant concern [1]. The excessive accumulation of this seaweed has been well-documented for its harmful environmental effects and its negative impact on tourism and the fishing industry. Thus, it is crucial to prioritize the valorization of this seaweed to expand its limited commercial applications while mitigating its environmental impact [2]. Its high availability could present both economic and environmental benefits by promoting the extraction of a wide range of high-value-added compounds, such as biofuels, bio-hydrogen, pharmaceuticals, chemicals, biocarbon, feed/food supplements, pigments, fertilizers, and more, all without competing with human food sources [3,4]. In this regard, aquatic biomass, particularly algae, is considered a renewable, sustainable, and promising resource for developing third-generation biorefineries. Several studies have demonstrated the biorefinery processes for extracting oil and biofuels from Sargassum spp. [5,6,7].
Sargassum spp. (brown algae) is particularly attractive for producing various chemical substances, including carbohydrates, polysaccharides, lipids, proteins, and amino acids [8]. One of the main products derived from brown algae is polysaccharides, such as propylene glycol alginate, sodium alginate, potassium alginate, and calcium alginate [9]. Nevertheless, during alginate extraction, a waste byproduct is generated that has not yet been studied or utilized, resulting in its undervaluation. There are studies about the potential of alginate extraction from Sargassum spp., as a biorefinery concept [10,11,12,13].
Specifically, Anion Exchange Membrane Fuel Cells (AEMFCs) are gaining significant attention as a highly promising technology for sustainable energy conversion [14,15]. Operating in an alkaline medium, AEMFCs offer distinct advantages, including the ability to utilize earth-abundant, non-precious metal catalysts and exhibiting faster reaction kinetics for the oxygen reduction reaction (ORR) at the cathode [16,17]. The ORR is a crucial multi-electron transfer reaction that often limits the overall performance and cost-effectiveness of fuel cells. Therefore, the development of efficient, durable, and cost-effective electrocatalysts for the ORR remains a critical challenge for the widespread adoption of AEMFCs. At present, the search for new materials to improve performance in the oxygen reduction reaction (ORR) is ongoing.
However, very few explore the possibility of using the waste from the extraction process as a high-value-added product [18,19,20]. Besides, classic biorefineries focus on the production of specific products, discarding the waste generated during the extraction process [21]. This waste, however, can be converted into biocarbon, offering a promising alternative for applications in alkaline fuel cells. At present, the search for new materials to improve performance in the oxygen reduction reaction (ORR) is ongoing. This study focuses on the valorization of sargasso biomass, highlighting its significant potential for application in a biorefinery that converts Sargassum spp. into alginates, with process waste transformed into biocarbon. The physicochemical properties were characterized, including morphology, elemental composition, and pore structure. Additionally, the performance of the catalysts was evaluated through electrochemical testing.

2. Materials and Methods

2.1. Synthesis of Biocarbon

Sargasso was collected from the beaches of Puerto Morelos, Quintana Roo, Mexico. After collection, the seaweed was washed with deionized water to remove sand and other impurities and then sun-dried for three days. The dried material was subsequently crushed and sieved. This material was used to obtain alginates, and the waste from this process, referred to as residual biomass without alginates (RBWA), was converted into biochar through a thermochemical pyrolysis process. This process was carried out in a tube furnace at 700 °C for 2 h under an inert nitrogen atmosphere with a flow rate of 50 mL min−1. The resulting material was designated as BP. Subsequently, chemical activation was performed by preparing a 1 M KOH solution in which the RBWA was impregnated for 2 h at 80 °C, using a 1:2 ratio (RBWA: KOH). The mixture was then dried in a furnace at 100 °C for 48 h and pyrolyzed under the previously described conditions, resulting in a sample labeled as BA. Additionally, the RBWA was initially impregnated with urea in a 1:1 ratio for nitrogen doping. This procedure was conducted in a hydrothermal synthesis reactor, heated in a muffle furnace at a ramp rate of 10 °C min−1 to 160 °C, and maintained for 6 h. Following this, the sample was activated with KOH and pyrolyzed as previously described, resulting in a sample encoded as BDA. All samples were washed with 2 M HCl for 2 h to remove impurities and unreacted KOH until a neutral pH of 7 was achieved. Figure 1 shows a synthesis scheme of the samples obtained from the source material.

2.2. Methods and Measurement Conditions

Thermal degradation analysis of the samples was conducted using a TGA 800 (Perkin Elmer, Shelton, CT, USA) at a heating rate of 10 °C min−1 in an inert nitrogen atmosphere ranging from 25 °C to 800 °C. Functional group identification was performed by FTIR-ATR using a Bruker Tensor II spectrometer (Billerica, MA, USA), analyzing the wavenumber range of 4000 to 500 cm−1 with a resolution of 4 cm−1. The morphological properties and chemical composition of the samples were examined using a JEOL JSM6360LV (Mundelein, IL, USA) scanning electron microscope (SEM) equipped with an energy-dispersive spectroscopy (EDS) detector. Structural characteristics of the catalysts were investigated using Raman spectroscopy with a DXR Raman microscope (Thermo Scientific, Madison, WI, USA) featuring a 630 nm He–Ne laser, and by X-ray powder diffraction (XRD) with a Bruker D2 PHASER (Karlsruhe, Germany) (Cu Kα radiation source, λ = 0.154184 nm). Surface chemical composition was analyzed via X-ray photoelectron spectroscopy (XPS) using a Thermo Scientific K-Alpha instrument (East Grinstead, UK). Elemental analysis for carbon, hydrogen, nitrogen, and sulfur contents was performed with a Thermo Flash 2000 elemental analyzer (Milan, Italy). Two samples of each material were measured, and the results were reported as mean values. The Brunauer–Emmett–Teller (BET) surface area (SBET) of the resulting biocarbon was measured using a Quantachrome Nova instrument (Osaka, Japan). Before measurement, the biocarbon was degassed at 100 °C for 6 h to remove moisture and impurities. The pore size distribution and pore diameter were analyzed using the Barrett–Joyner–Halenda (BJH) method. This assessment was based on the volume of gas adsorbed at a relative pressure near unity (0.98 P/P0).
Electrochemical tests were conducted using a potentiostat (VSP Bio-Logic Science Instrument, Seyssinet-Pariset, France) with a three-electrode configuration. An Ag/AgCl electrode was used as the reference electrode, while a graphite rod was used as the counter electrode and a 5 mm diameter glassy carbon as a working electrode. The catalyst ink was prepared by dispersing 10 mg of electrocatalyst in 1 mL of isopropyl alcohol and adding 10 µL of Nafion solution. Subsequently, 10 µL of the resulting ink was drop-cast onto the working electrode surface. Initially, the electrode was activated by performing 40 cycles of cyclic voltammetry (CV) from 0.0 to 1.2 E vs. RHE at a scan rate of 50 mV s−1 in a nitrogen-saturated 0.1 M KOH solution. Afterwards, the third cycle from a subsequent set of three CV scans at 20 mV s−1 (0.0 to 1.2 E vs. RHE) was reported as the representative cyclic voltammogram. The capacitive current was recorded at 5 mV s−1 from 0.0 to 1.2 V vs. RHE at 2000 rpm and subtracted from the linear sweep voltammetry (LSV) curves acquired under the same conditions in an oxygen-saturated 0.1 M KOH solution at varying rotation speeds [22,23]. The potentials were referenced to the reversible hydrogen electrode (RHE).

3. Results and Discussion

3.1. TGA and FTIR of Raw Materials

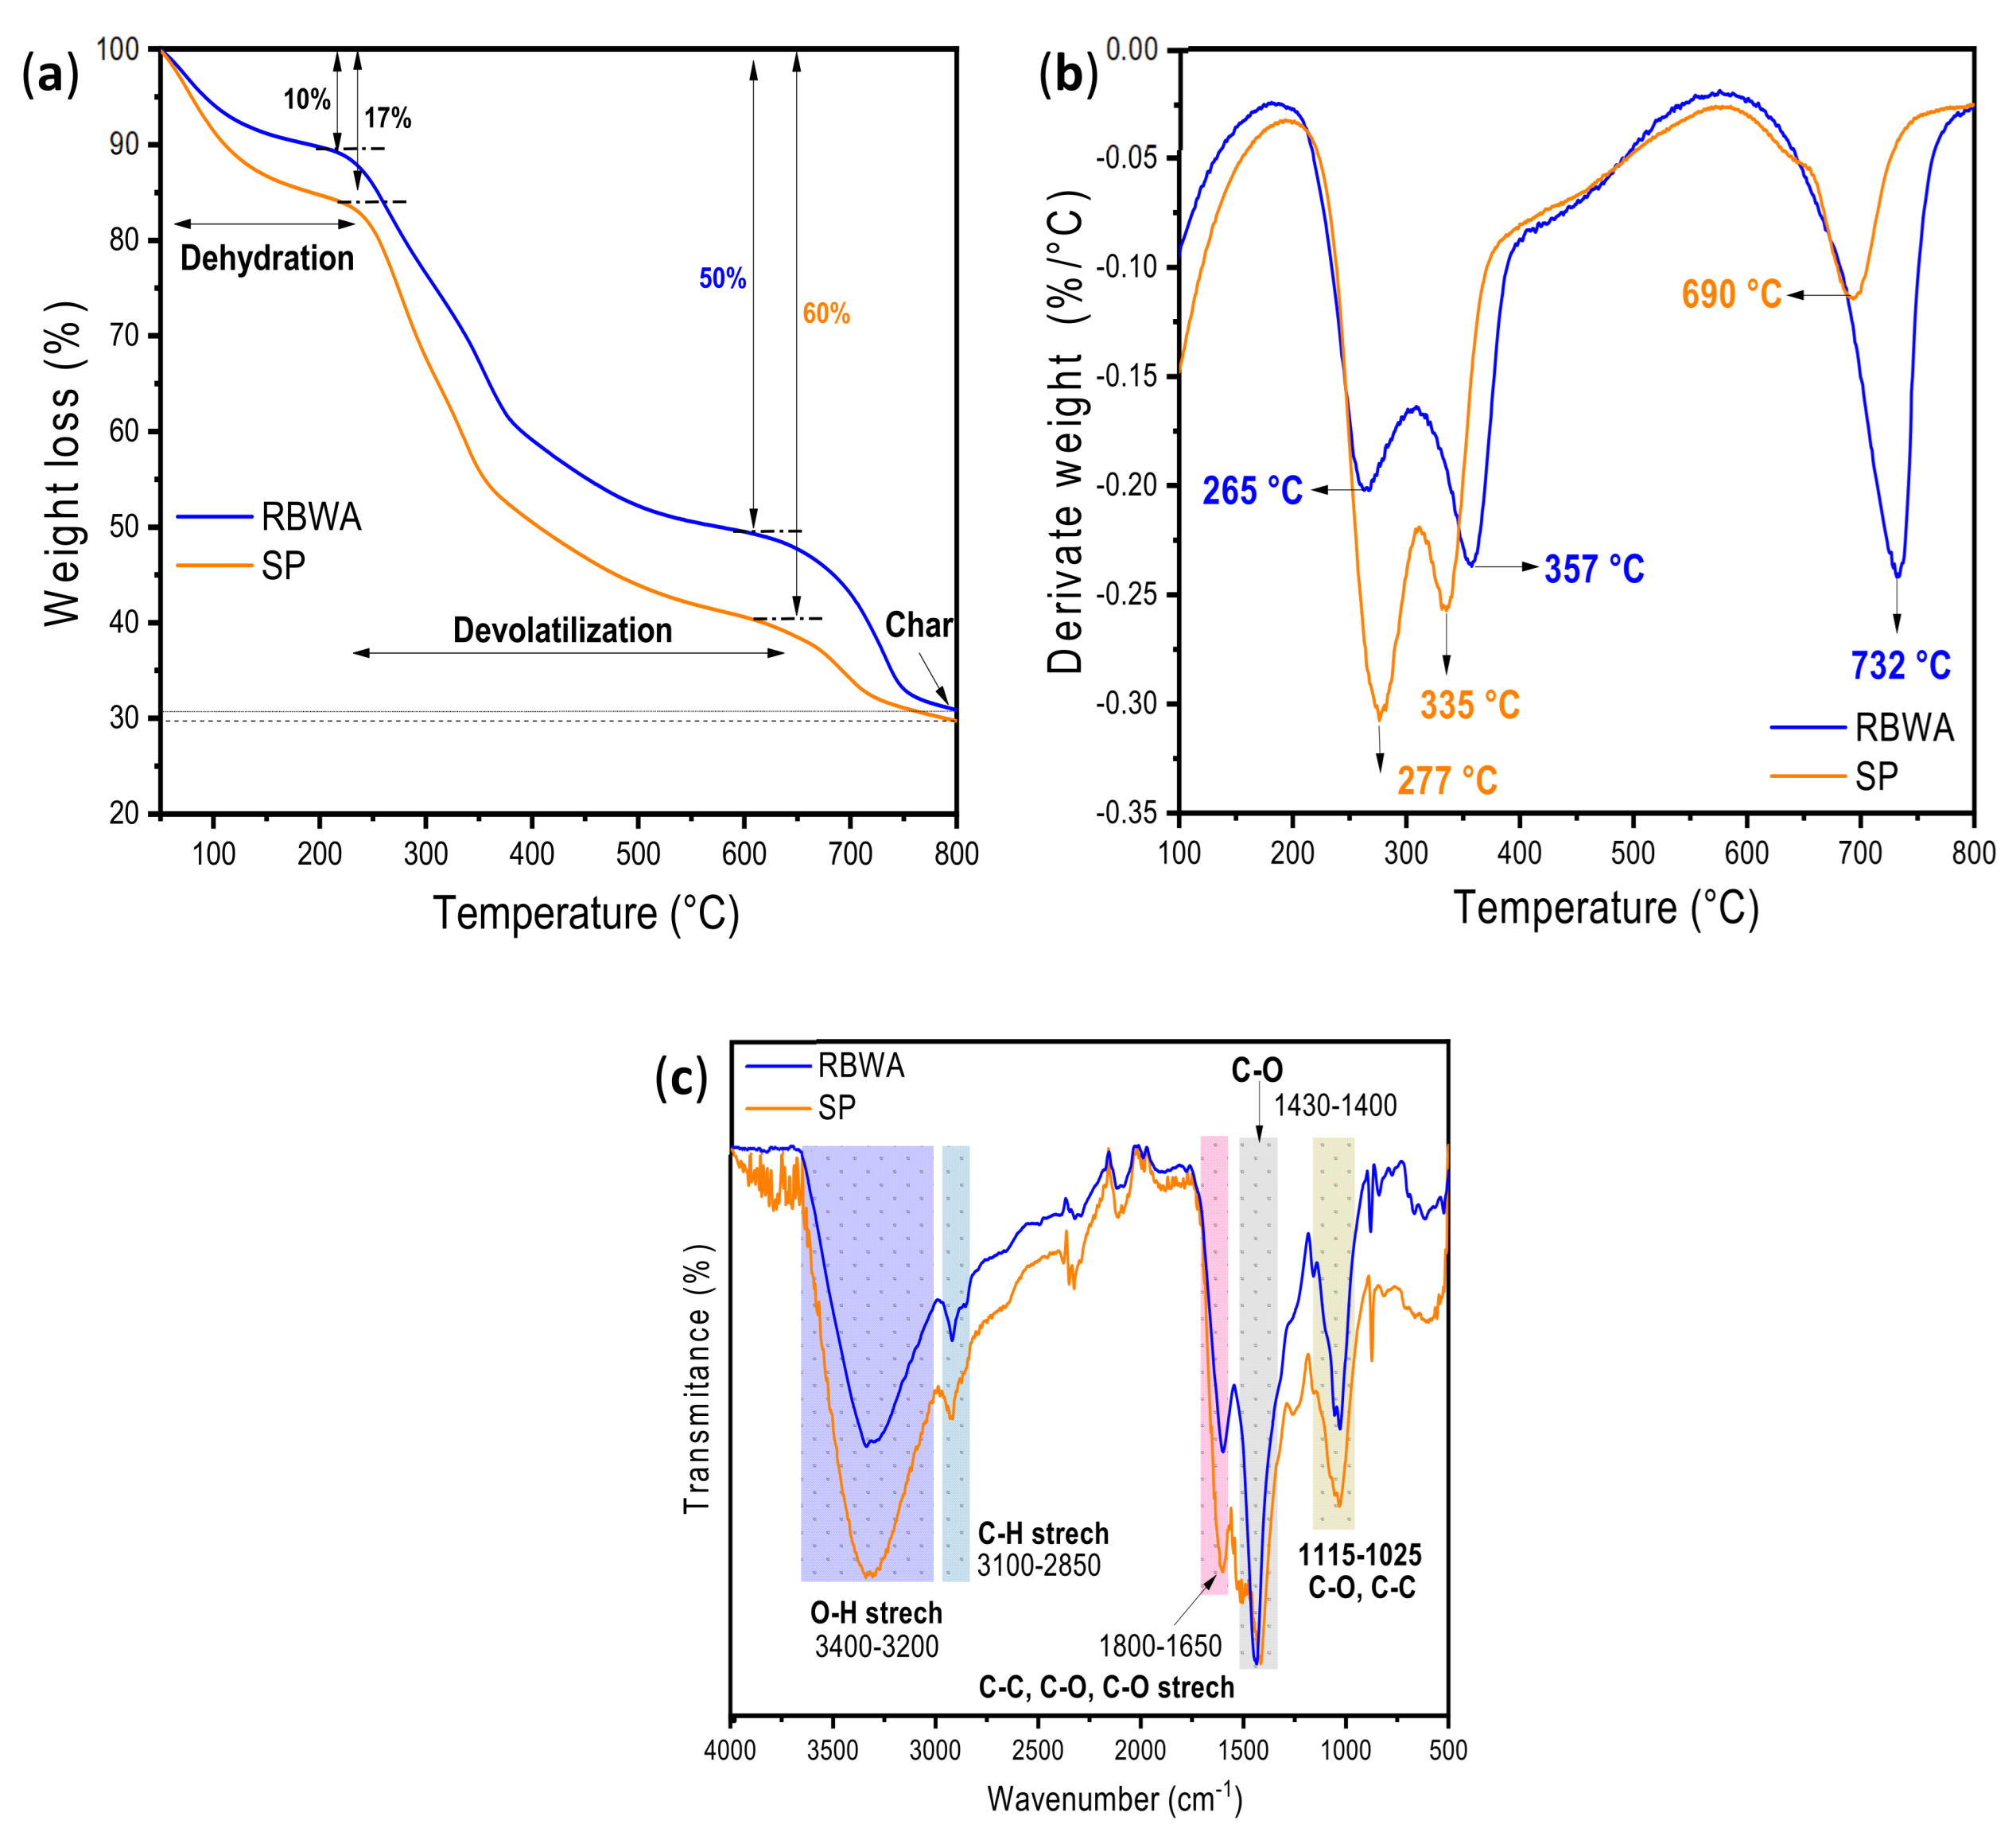
The TGA technique was employed to assess the thermal stability and decomposition behavior of the raw samples. Figure 2a shows the thermogravimetric profiles of the RBWA and SP (Sargassum spp.) samples, divided into three stages. The mass loss of SP commences earlier compared to that of RBWA, as SP primarily contains crude lipids, proteins, and polysaccharides, which are easier to pyrolyze. Both samples exhibit similar behavior, beginning with an initial phase of moisture or mass loss of 10% (RBWA) and 17% (SP) due to dehydration and the removal of light volatile components [24]. The second stage reaches a maximum at 630 °C, with a weight loss of 50% for RBWA and 60% for SP, respectively. In the third stage, biochar formation occurs at around 800 °C for both samples, with a yield of approximately 30%. This value is comparable to other results described in the literature [25].
Figure 2b displays the percentage of mass losses and differential thermogravimetric (DTG) analysis. RBWA and SP exhibit two strong peaks between 250 and 350 °C, attributed to a devolatilization process related to the decomposition of hemicellulose and cellulose components [26]. Finally, a single strong peak is observed at 690 °C and 732 °C, respectively, corresponding to the total oxidation of organic matter (Figure S1, Supplementary Material and their discussion). Figure 2c presents the infrared spectrum analysis. Both seaweed powders exhibit a peak at 3400–3200 cm−1, likely due to the O-H stretching of hydroxyl groups [27], with this peak being more prominent in the SP sample. A weak peak is observed above 2900 cm−1, corresponding to C-H stretching groups. This peak has also been associated with N-H bonds, likely due to polysaccharides and amino acids, which are inherent to seaweeds [28,29]. The peak centered around 1600 cm−1 indicates several types of C=C, C-O, C=O, and O-H stretching vibrations, possibly due to lignin and alginates [30]. The band at 1410 cm−1 corresponds to the vibrational mode of the C-O group, which is a characteristic feature of the carboxylic group typically found in this type of algae [31]. The weak peak at 1032 cm−1 in both seaweed samples is frequently reported for C-O groups and C-C stretching, indicating alginates [32]. These findings indicate that the surface functional groups and thermal stability of the raw materials experienced only minor alterations following the alginate extraction process.

3.2. Physicochemical Characterization

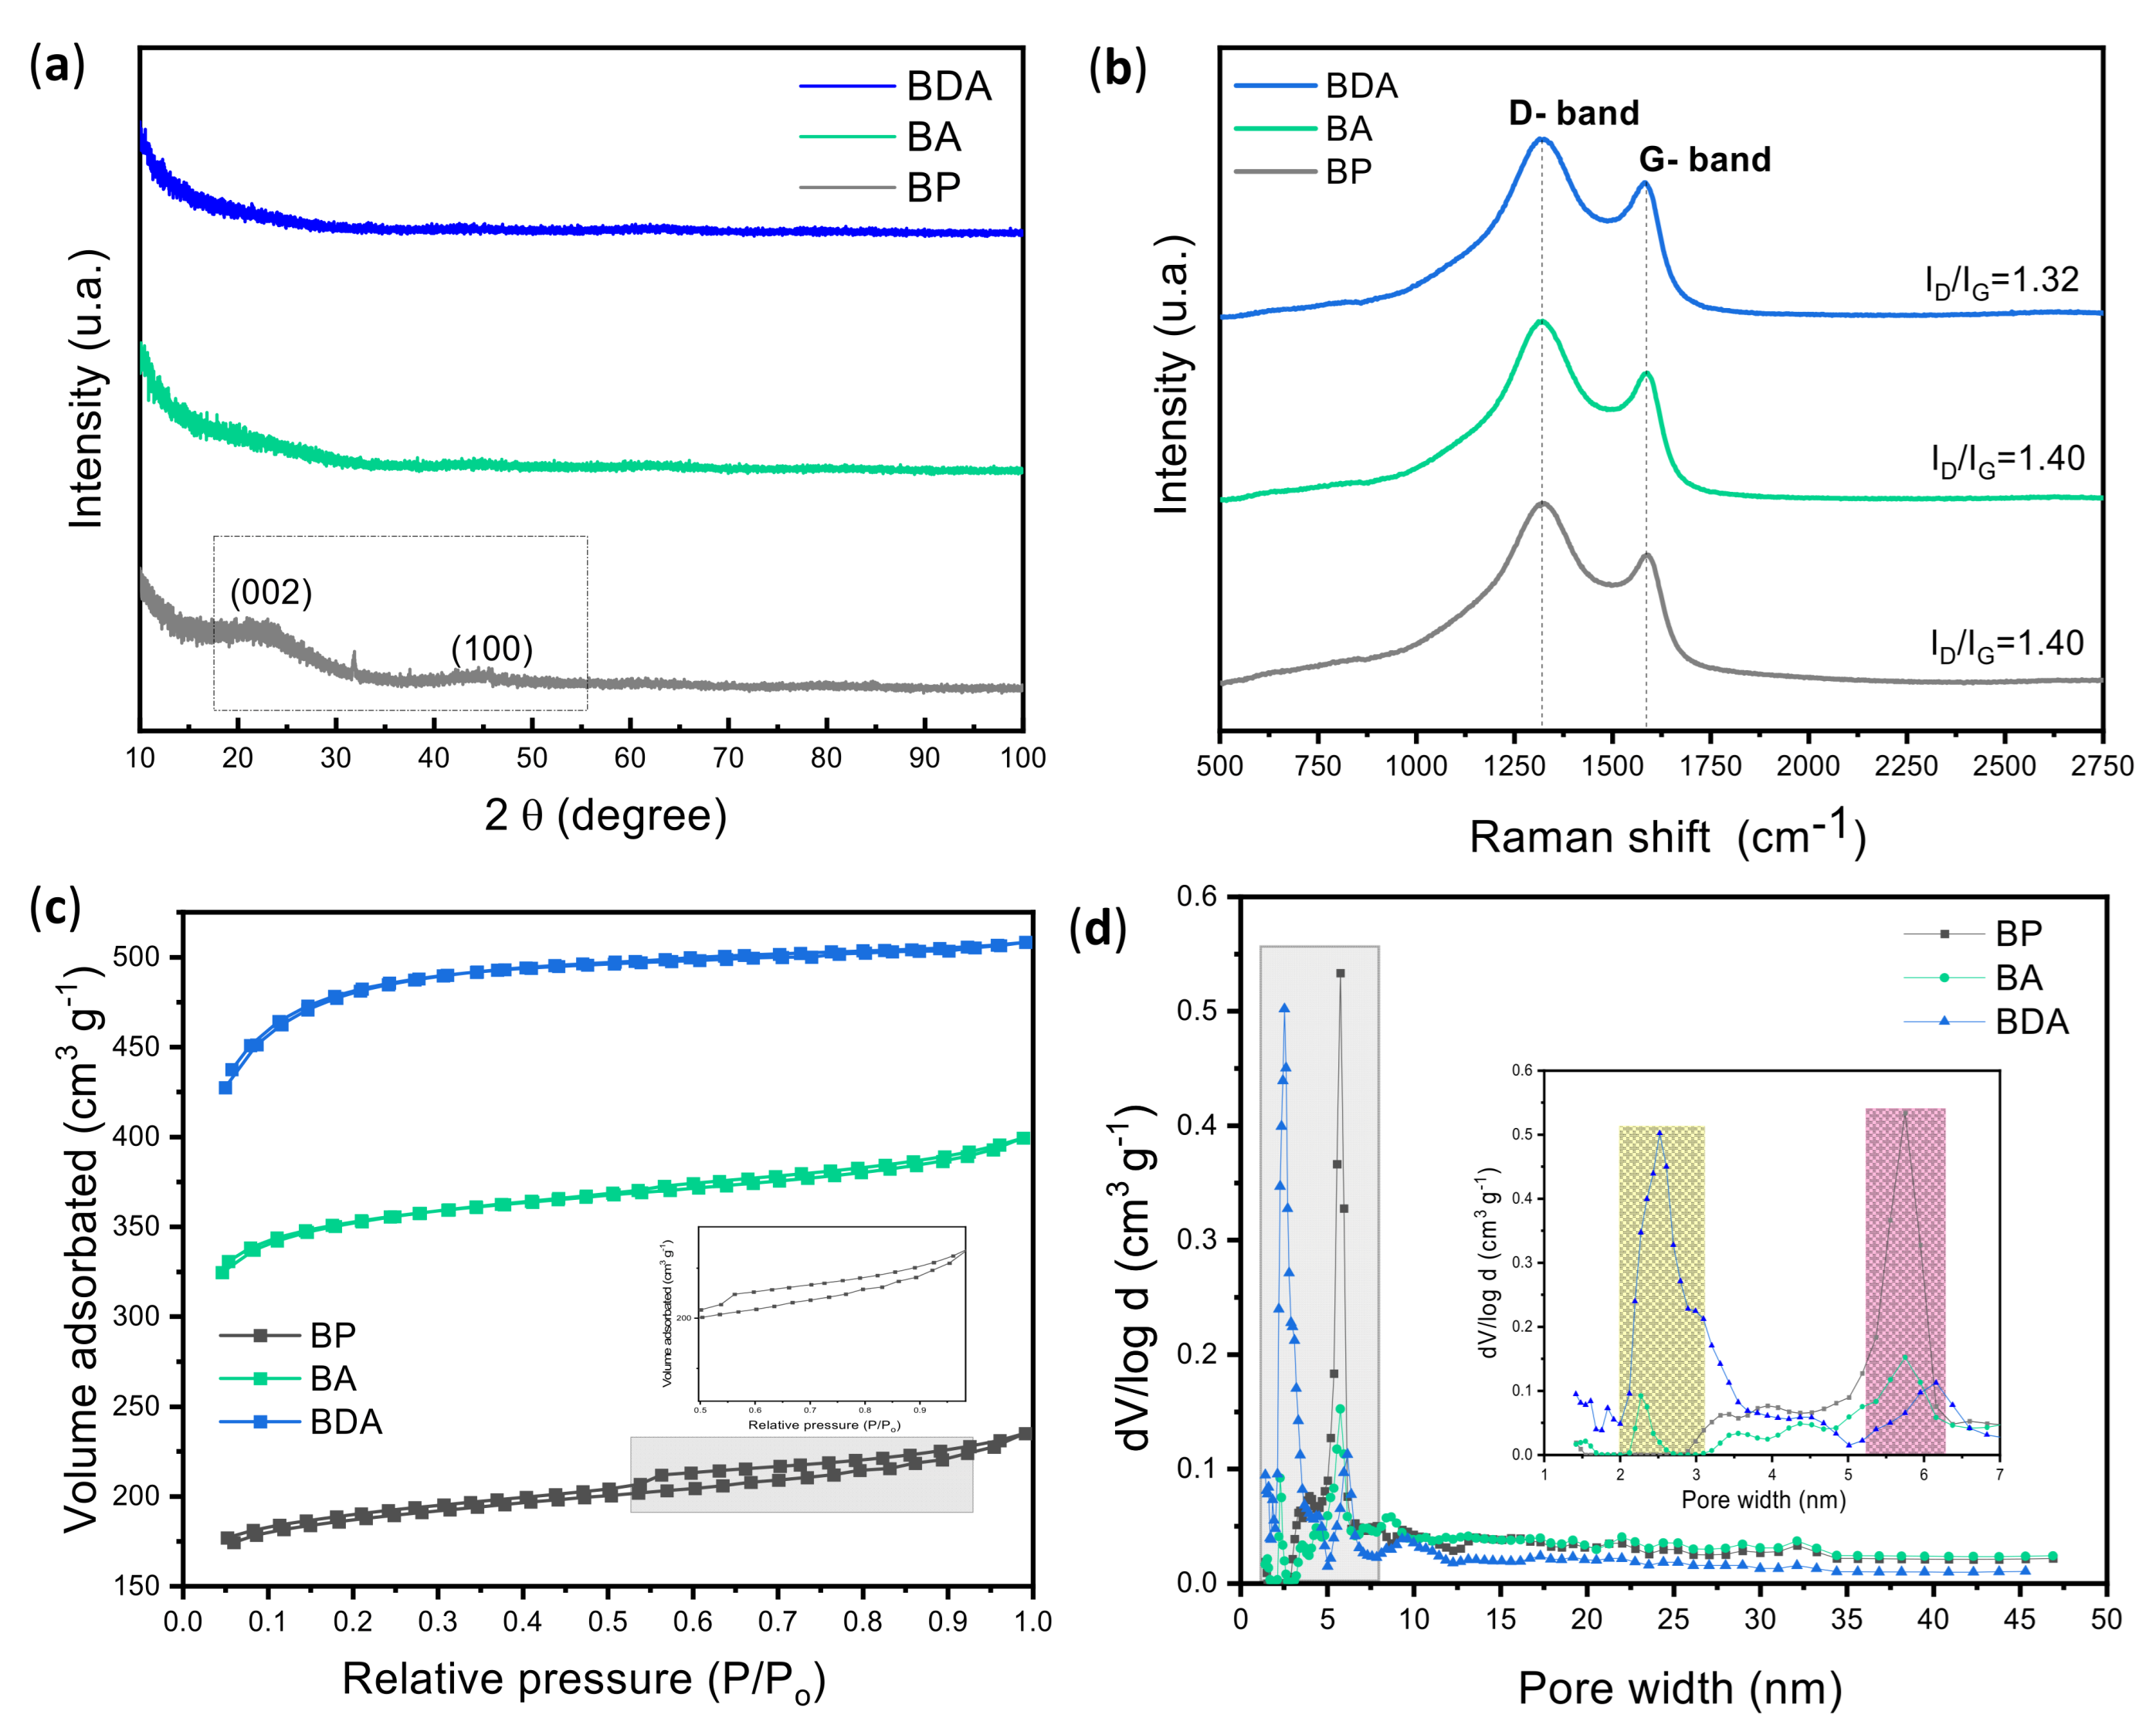
The physical and chemical properties of BP, BA, and BDA are shown in Figure 3. The structural characteristics of the biocarbon were examined by X-ray diffraction. The diffractograms are compared in Figure 3a and reveal the presence of amorphous carbons with a disordered structure with random orientation. The BP sample exhibits a broad peak at 2θ = 23°, indicating the presence of carbonaceous materials with a disordered structure. Another peak at 43° corresponds to the (100) plane commonly observed in carbon diffractions associated with graphite [33]. On the other hand, no diffraction peaks are present in samples BA and BDA, suggesting a completely amorphous structure (Figure S2). The degree of impurities in biocarbon can be characterized by Raman spectra, as revealed in Figure 3b. It shows the presence of D and G bands at 1318 cm−1 and 1559 cm−1. The D band corresponds to the sp3 disordered phase and the sp2 ordered phase due to heteroatoms in the graphitic plane [34]. The G band at 1590 cm−1 is primarily associated with the quadrant breathing mode of aromatic rings, the E2g vibration mode of graphite, and the presence of alkene C=C bonds [35]. The ratio of ID/IG, derived from these bands, provides valuable insights into the degree of graphitization and the level of disorder within the carbon structure. The BP sample exhibited the lowest ID/IG ratio at 1.32, whereas BA and BP showed values of 1.40 and 1.50, respectively (Figure S4). The increase in the ID/IG ratio observed suggests that the doping process introduced a greater number of defects in the biocarbon, a finding supported by the SEM analysis. Other authors mention that the increase in ID/IG ratio due to N-doping is attributed to the incorporation of nitrogen atoms into the sp2 carbon network and the resulting deformation of carbon layers [36].
Figure 3c displays the N2 adsorption/desorption isotherms at 77 K for the biocarbon, highlighting the influence of the activation process on the specific surface area. Samples BA and BDA (activated and doped biocarbon, respectively) show an isotherm type I, while sample BP revealed a type IV isotherm with type H4 hysteresis, according to the IUPAC classification. The H4-type hysteresis loop in the range of 0.5 < P/Po < 0.99 has a more pronounced uptake at low partial pressures (P/P0), indicating the filling of micropores, which is common in micro-mesoporous carbon materials [37,38]. The Brunauer–Emmett–Teller (BET) equation was used to calculate the specific surface areas, which were found to be 4 m2 g−1 for SP and RBWA, as they received no treatment. The results revealed that the surface area of BDA and BA were the highest at 1790 m2 g−1 and 1306 m2 g−1, respectively, followed by SP (682 m2 g−1) (Figure S5). The pore size calculated from the BJH method demonstrated that the reduction in pore size from 4.5 nm (BP) to 3.1 nm (BDA) achieved through KOH activation is a crucial factor contributing to the high surface area of activated biocarbon, reaching 1790 m2 g−1 for the BDA sample (Table 1). Increasing the specific surface area and porosity of biocarbon facilitates the exposure of active sites, enhances mass and heat transfer, and accelerates reaction rates [39]. Consequently, BDA demonstrates significant potential as a catalyst, attributed to its high surface area, considerable mesoporosity and microporosity, nitrogen doping, and large pore volume. The FTIR spectra of SP and RBWA samples are presented and discussed in the Figure S3, providing additional insights into their surface functional groups.
As shown in the pore size distributions of Figure 3d, all samples tend towards mesoporosity. Key parameters, including surface area and porosity, obtained through elemental analysis and BET measurements, are summarized in Table 1. Further experimental details and data are available in Table S1.
The quantification of the main elements in biocarbon, i.e., C, N, H, and S, was performed by elemental analysis, and the results are shown in Table 1. The raw material Sargassum spp. (SP) and residual biomass (RBWA) had a low carbon content of 34.85% and 31.44%, respectively, as well as higher hydrogen content (3.74–3.92%). The hydrogen content can be attributed to the composition of biomass precursors, which predominantly consist of hydrocarbon molecules containing C–H bonds [40]. For reference, commercial activated carbon typically contains around 88% carbon, 1% sulfur, 0.5% hydrogen, and 0.5% nitrogen, along with 3 to 4% impurities, which include mineral elements or ash [41]. The carbon content in the biocarbon increased to 77.07% with pyrolysis and activation (BA), while the BDA content was lower (58.75%) due to doping with urea. However, the hydrogen content decreased to 2.58%. BA contained the highest amount of S (2.04%), and RBWA contained the lowest (0.83%). Additional information is provided in Table S2.
Elemental nitrogen was identified in all samples by elemental analysis CHNS. However, nitrogen content was not quantified in BP and BA samples using the EDX technique, suggesting that the detection of elemental nitrogen in the biochar directly depends on the sensitivity and inherent limitations of the analytical method. SP and RBWA showed minimal nitrogen content, likely due to the intrinsic characteristics of the biomass. After pyrolysis, the nitrogen content in BP decreased further, probably as a result of the decomposition of nitrogen-containing groups with low thermal stability at high temperatures. In contrast, BDA displayed a slight increase in nitrogen content, indicating successful incorporation of nitrogen into the biocarbon through urea doping. The biocarbons exhibited low C contents, and only BDA presented higher N content than the commercial activated carbon.
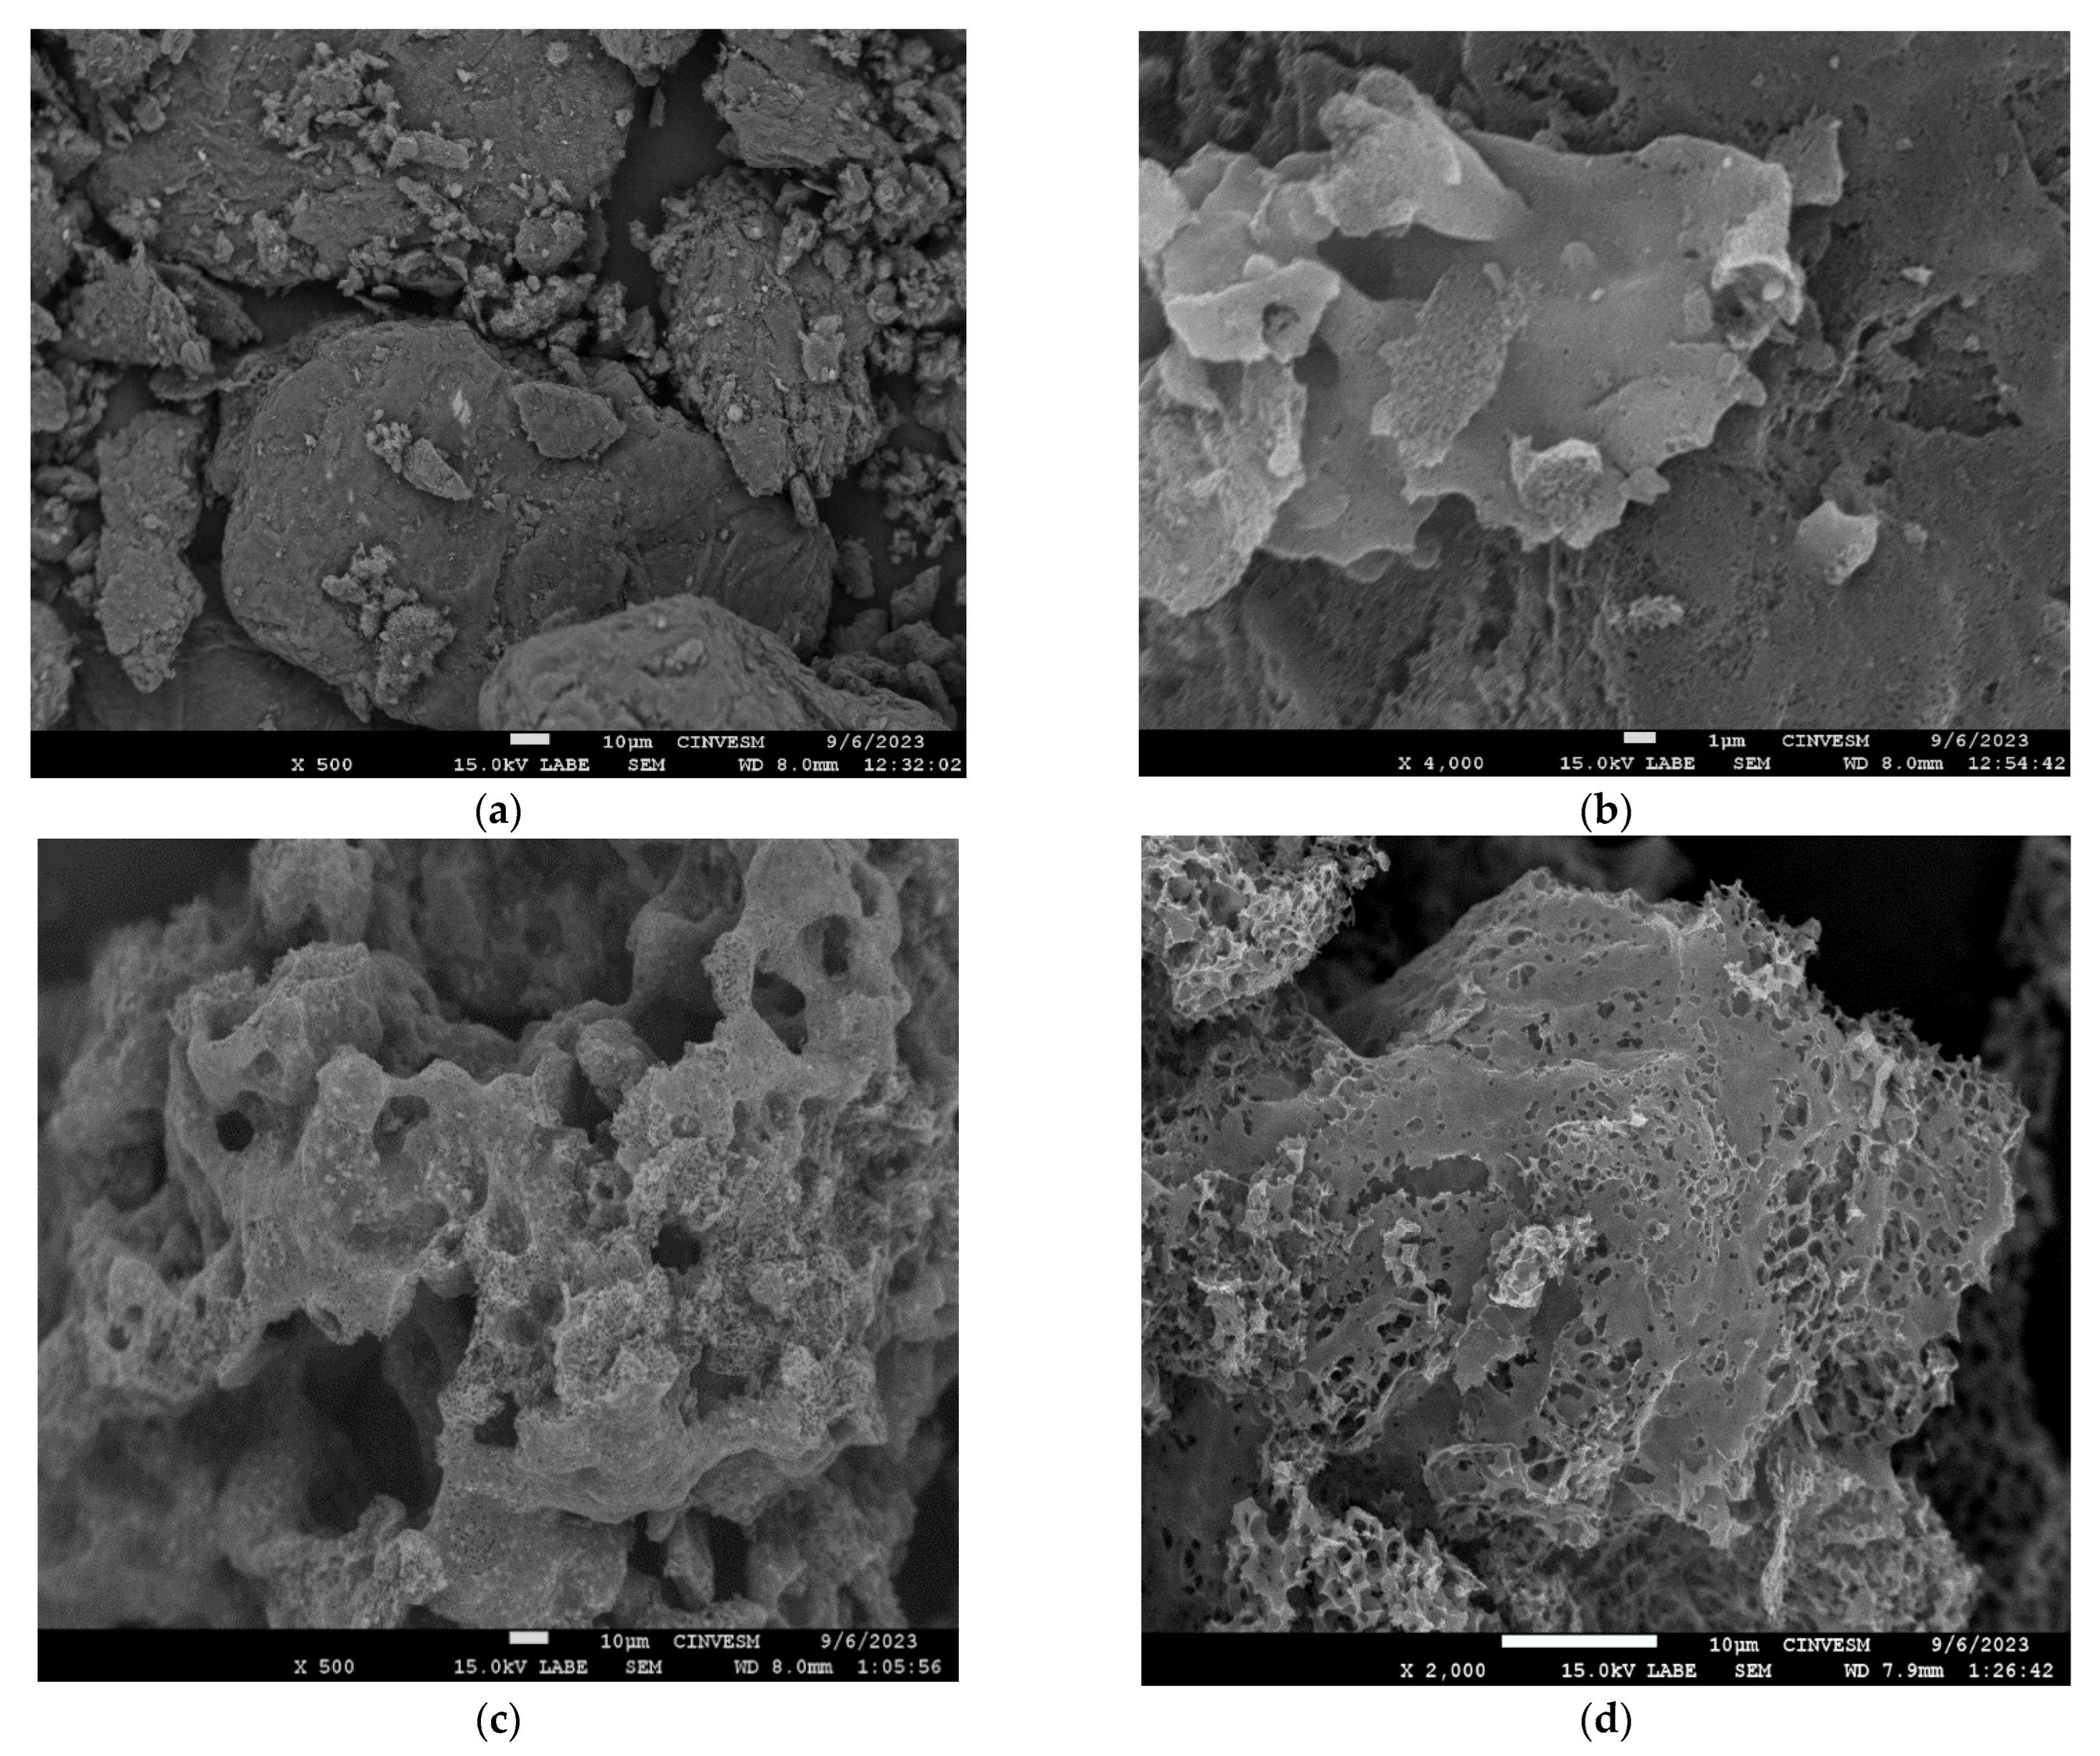
SEM is principally utilized for characterizing biochar and is effective in identifying micro-pores within the biochar. The analysis of the morphology of the four samples revealed that the different treatments influenced their morphology. Figure 4 shows the SEM micrographs of the raw material (RBWA) and the biocarbons obtained by pyrolysis. In general, RBWA revealed an indefinite shape, with an irregular surface [42]. In Figure 4b, BP exhibits a rough, predominantly amorphous surface with poorly defined micrographs and weakly developed pores. This observation is consistent with its larger average pore diameter as determined by BET analysis. Figure 4c shows a more porous surface related to the KOH activation of the BA sample. Figure 4d illustrates that BDA exhibited the most well-developed pores, characterized by a better-defined morphology and smaller dimensions compared to those observed in BA. These findings are corroborated by BET analysis, which indicates that BDA possesses a greater surface area and smaller pore size, facilitating the exposure of more effective active sites to enhance ORR kinetics [43]. On the other hand, BP displays the lowest surface area and the largest pore size (Table 1). Additional SEM micrographs together with corresponding EDS elemental mapping analyses are provided in Figures S6–S9, offering further insights into the surface morphology and elemental distribution of the synthesized samples. Table S3 presents the weight percentage (wt%) and atomic percentage (at%), focusing on the elements C, N, S, and Na.
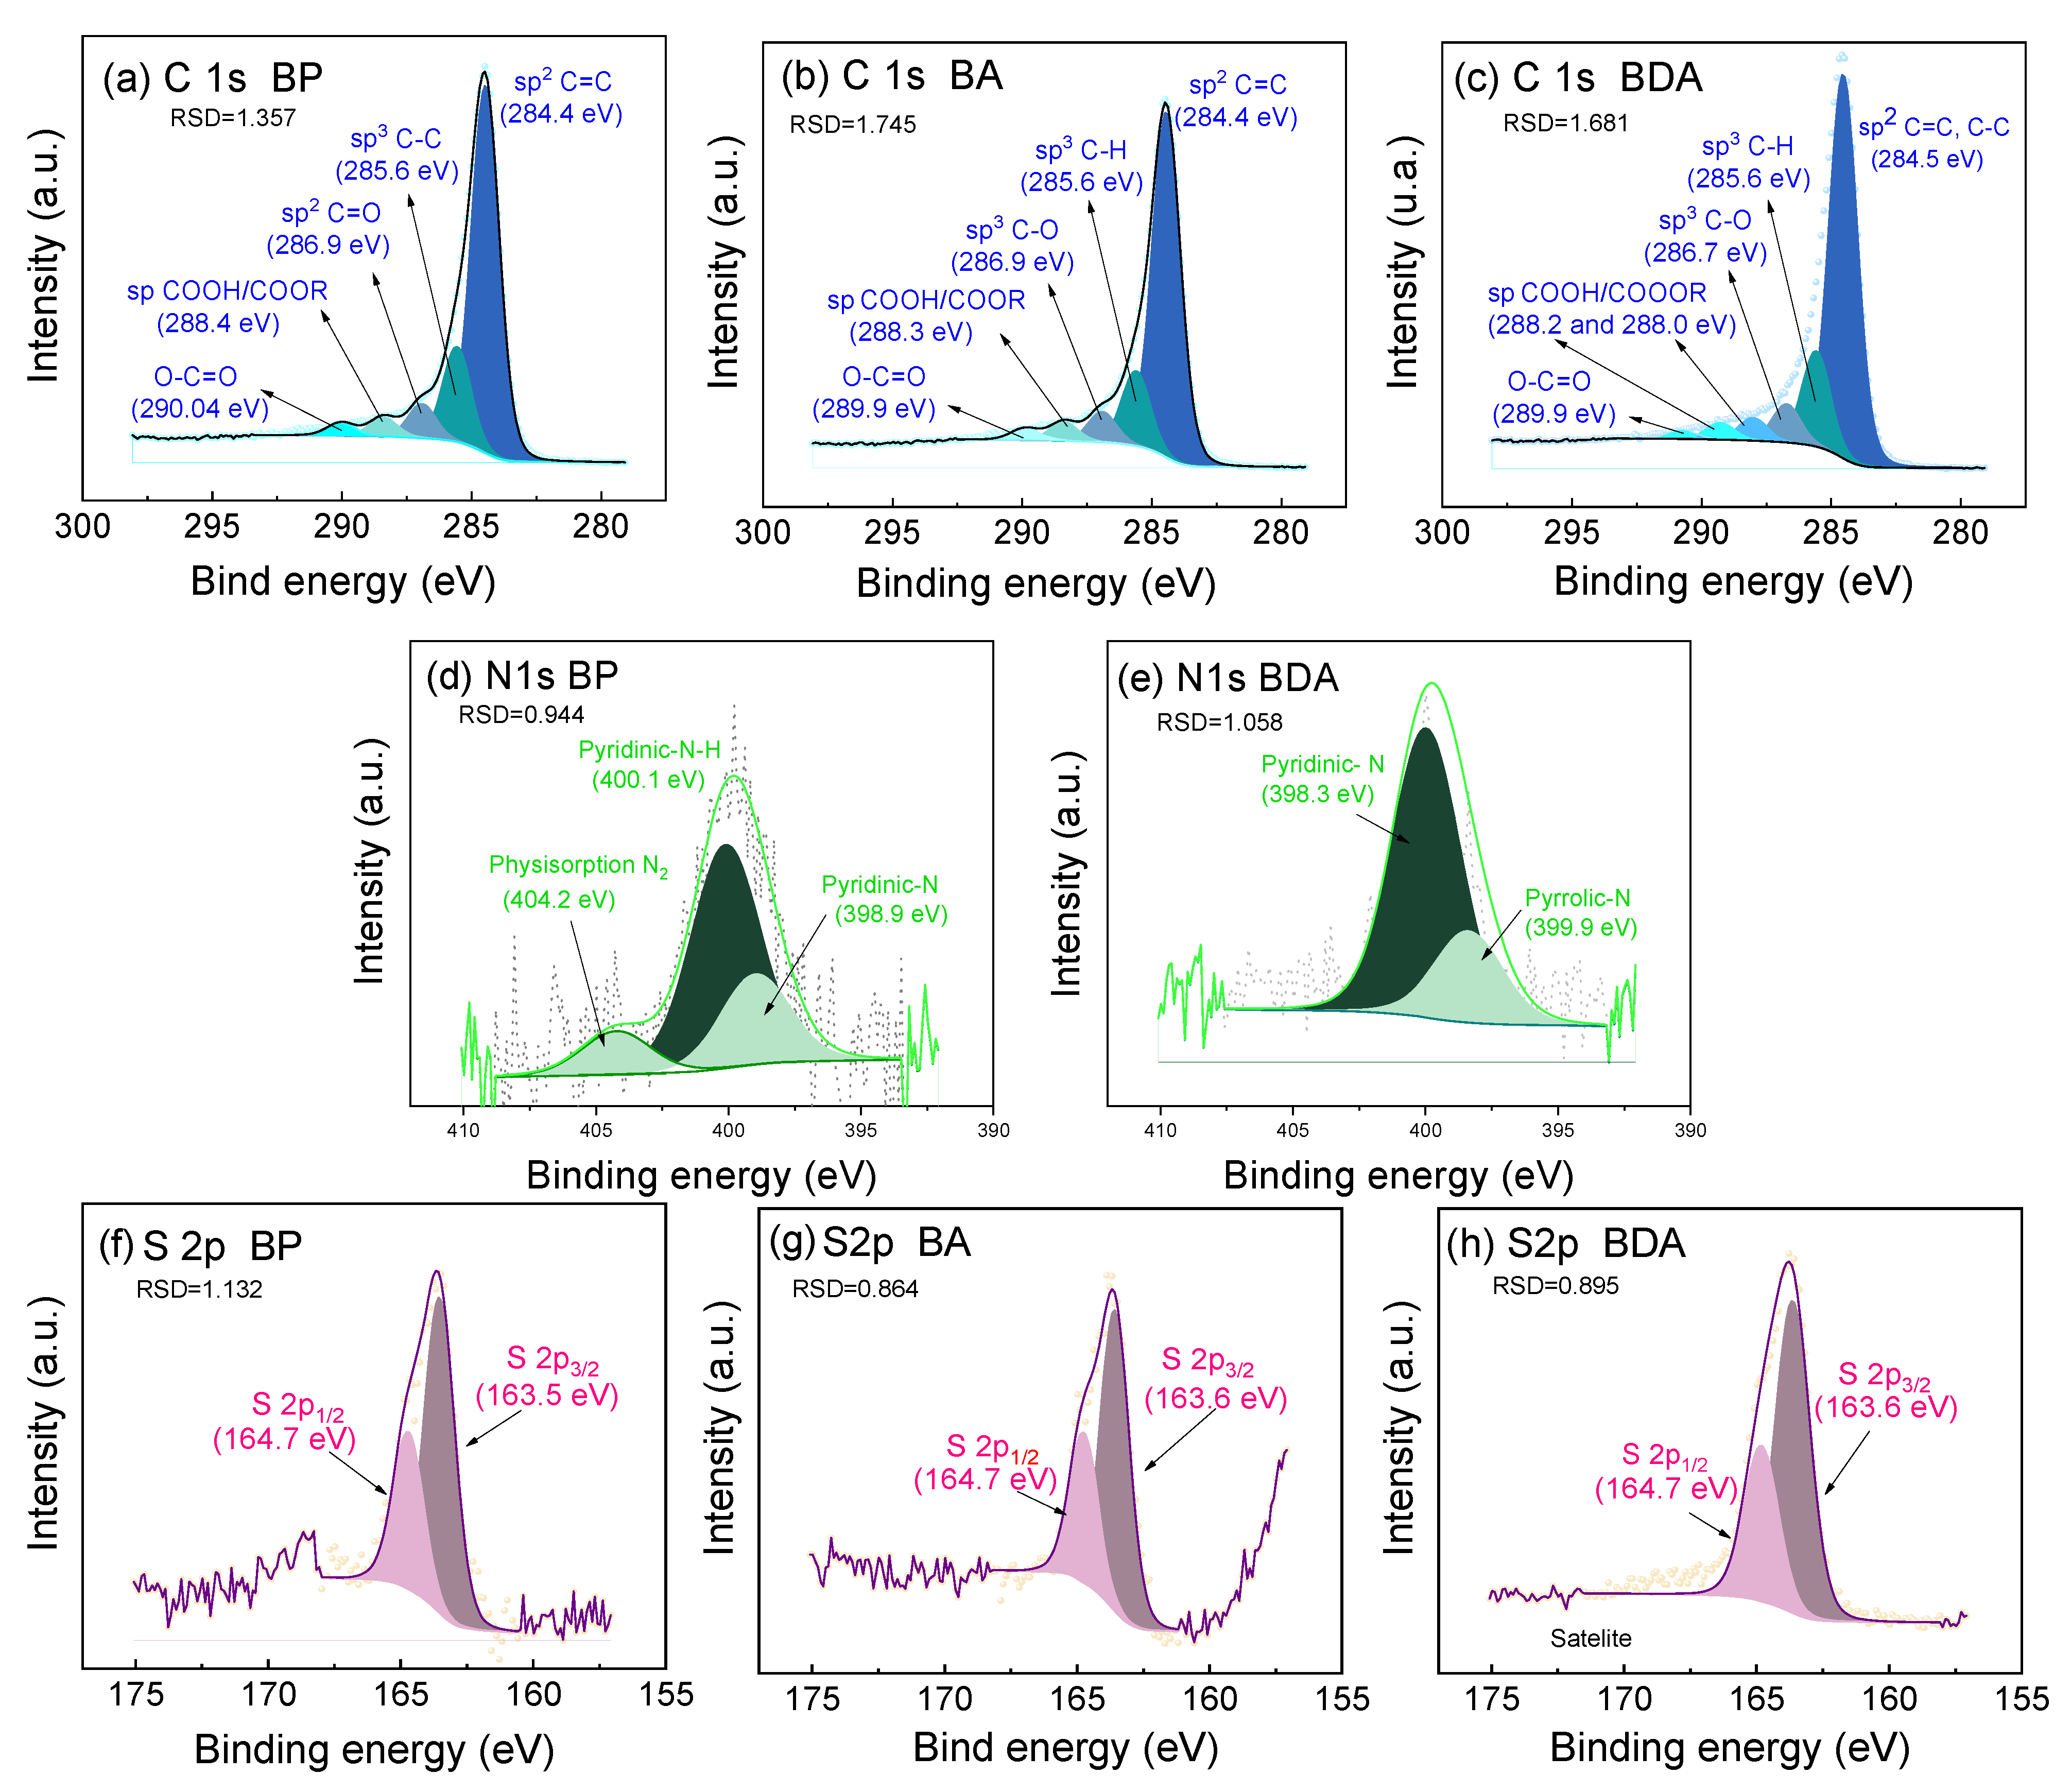
Figure 5 shows the XPS analysis to investigate the surface chemical composition by examining the binding energies of C1s, N1s, and S 2p photoelectrons in the biocarbon. For all presented spectra, the Residual Standard Deviation (RSD) values ranged from 0.8% to 1.8%. These values are well within the acceptable range for curve fitting in XPS, indicating a high degree of confidence in the deconvolution results. It revealed the presence of C, N, and S on the surface of the samples. BP showed two fitted peaks at 398.9 eV and 400.1 eV corresponding to Pyridine-N, and Pyridine-N-H with compositions of 25.31 and 62.61 at. %, respectively. In contrast, BDA exhibited two main peaks: one at 398.3 eV associated with Pyridinic-N, and another at 399.9 eV associated with Pyrrolic-N [44], with compositions of 24.01 and 75.99 at. %, respectively, underscoring the effectiveness of nitrogen doping in the biocarbon structure. The findings revealed the development of nitrogen-enriched functional groups within the biocarbon structure. Based on the electrochemical performance of biocarbon materials synthesized at an activation temperature of 700 °C, it can be concluded that the current density is enhanced by the presence of Pyrrolic-N and Pyridinic-N in BDA. Furthermore, some authors suggest that Pyrrolic-N is more stable than Pyridinic-N and has a greater effect on oxygen reduction [45]. Since the sulfur was detected in BP, BA, and BDA, its S 2p spectra were deconvoluted, and two peaks were observed. The sulfur states are related to thiophene (C– S–C, 163.5 and 164.7 eV) [46]. The content of N in the N-doped biochar (BDA) was slightly higher than in the non-doped biochar. Besides, elemental nitrogen was not detected in BA using the XPS method, likely due to nitrogen concentrations in this biochar being below the detection threshold of XPS, which ranges from approximately 0.05 to 0.1% [47], as summarized in Table 2. The total amount of active nitrogen species (pyrrolic-N, pyridinic-N, and pyridinic N-H) reached 87.92% and 90.0% for BP and BDA, respectively. In general, these XPS analyses indicated that BDA exhibits improved electrochemical performance with respect to BP and BA.

3.3. Electrochemical Characterization

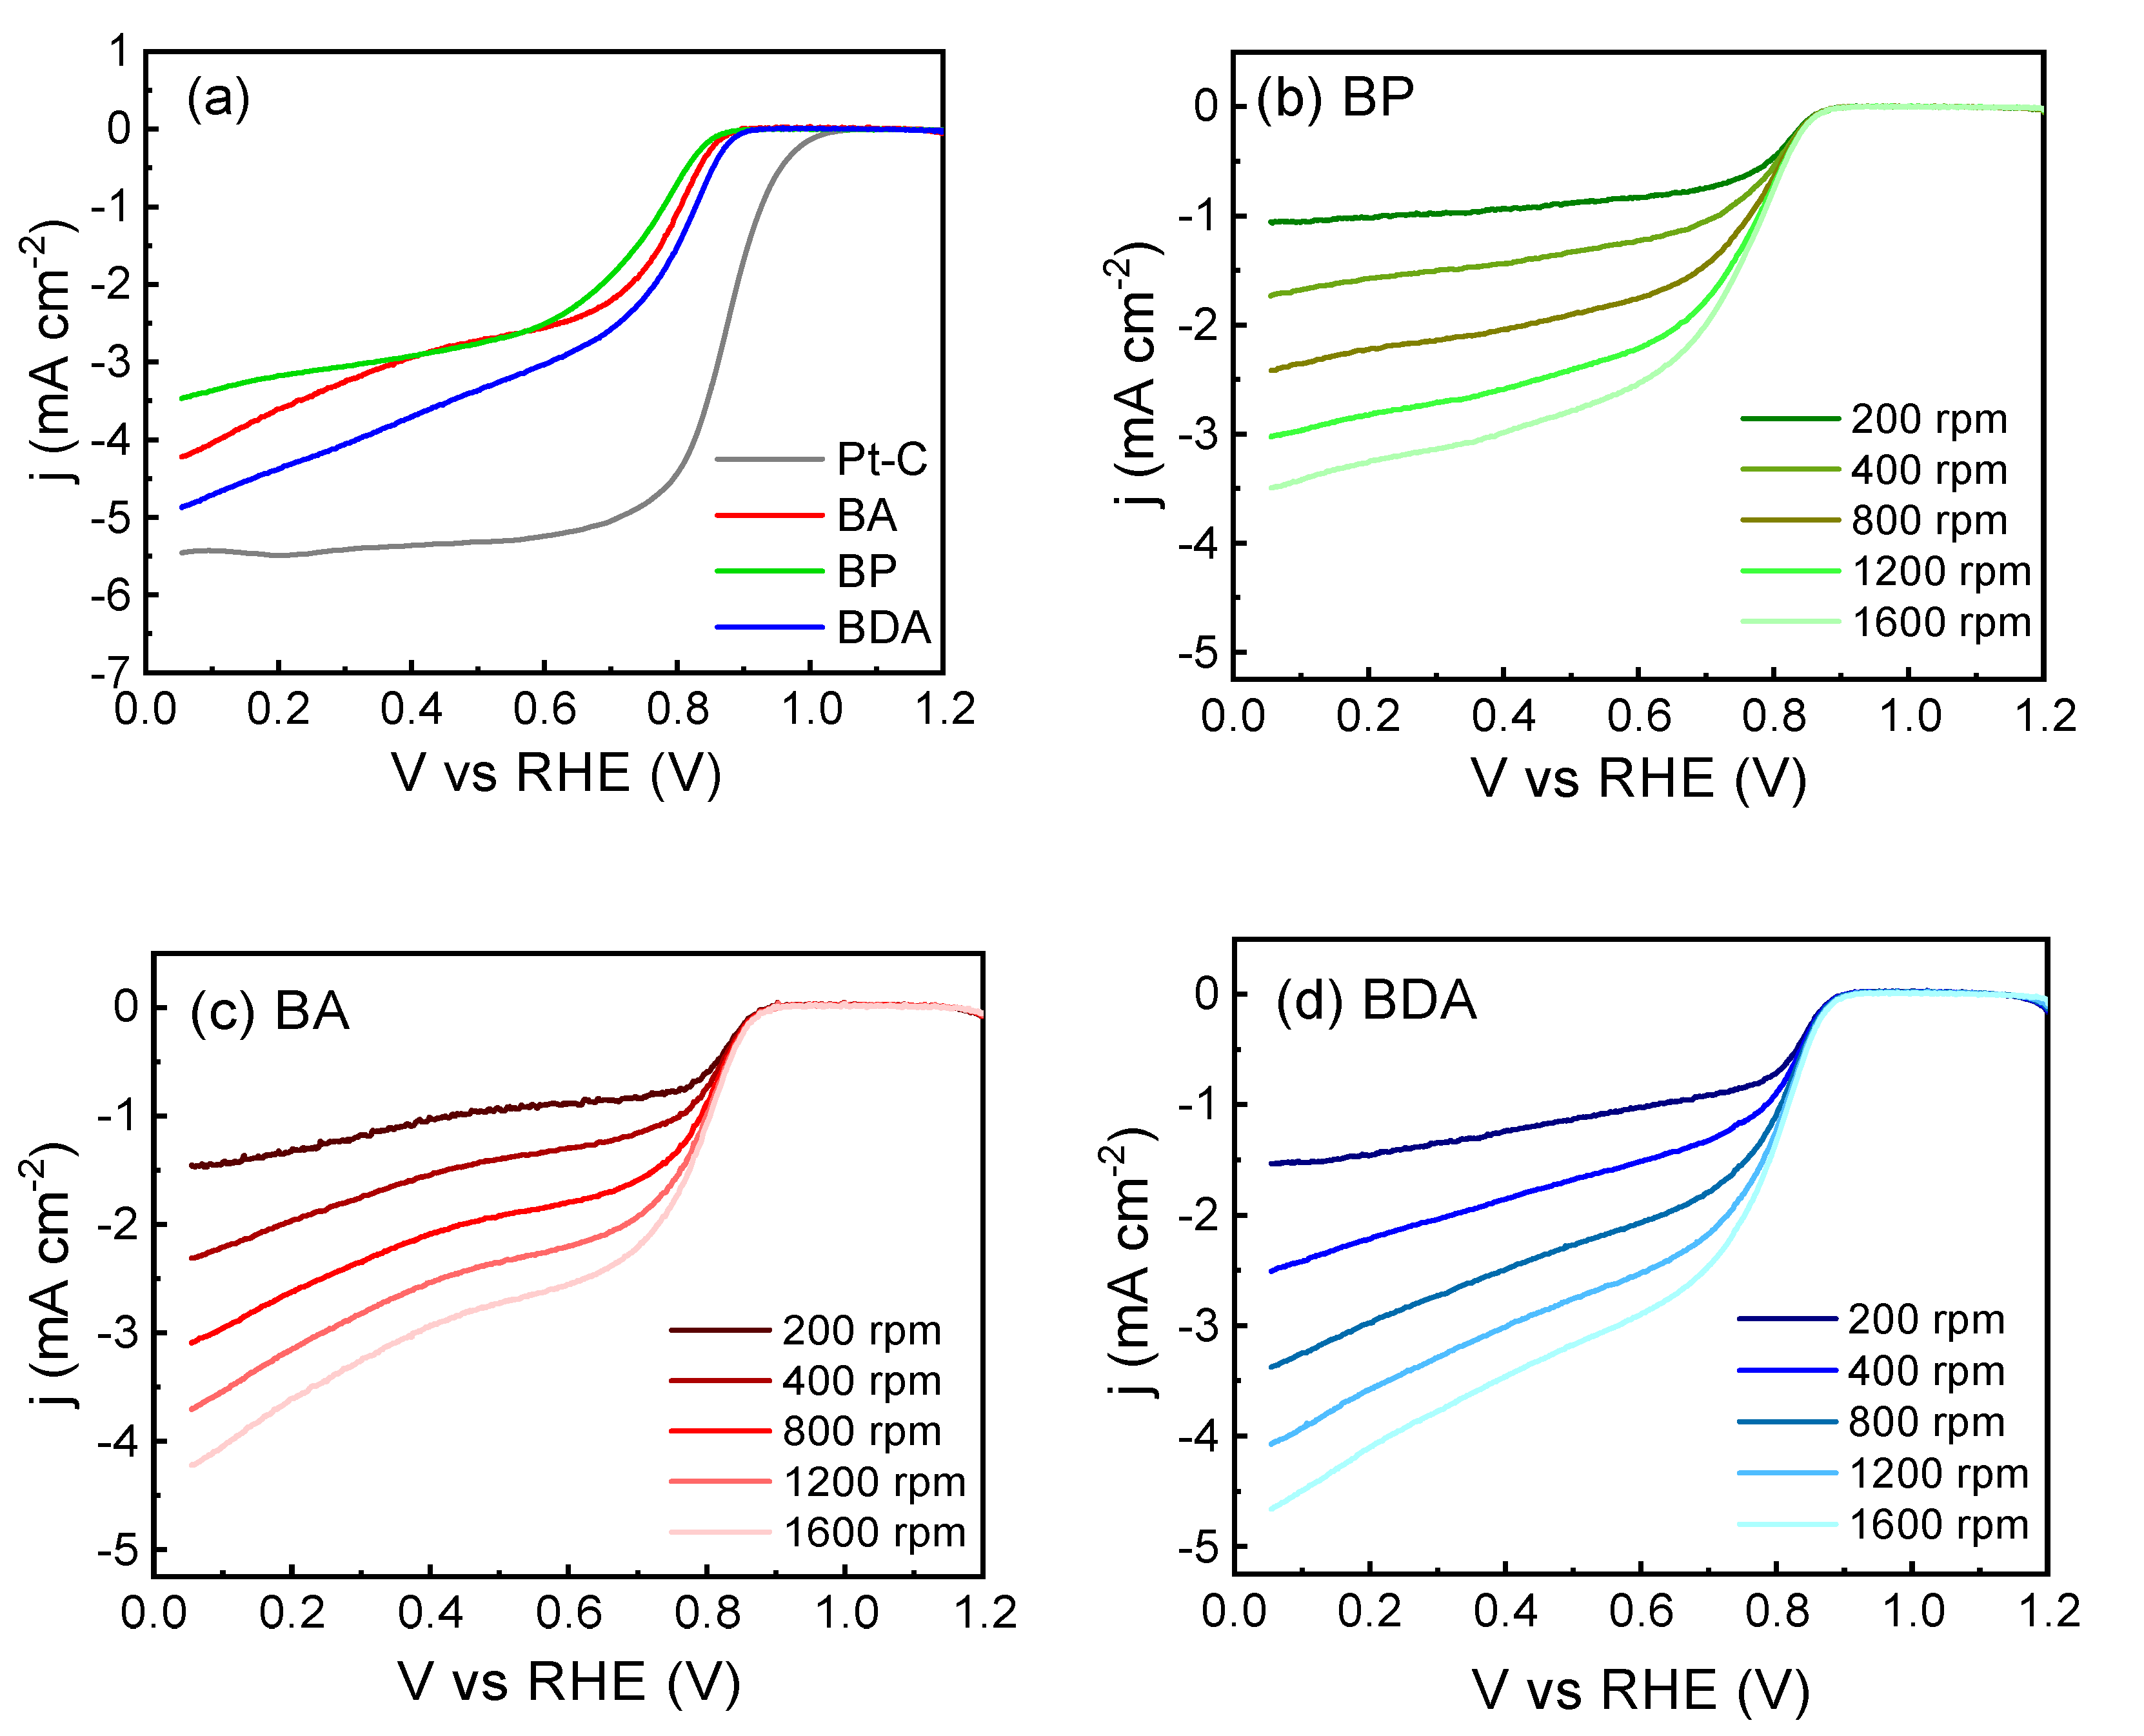
Figure 6 presents an overview of the electrochemical activity for ORR of BP, BA, BDA, and commercial 10 wt.% Pt-C (also named as Pt-C). Figure 6a shows linear sweep voltammograms (LSVs) in an oxygen-saturated 0.1 M KOH solution at 1600 rpm, within a potential range of 0.0 to 1.2 E vs. RHE. For comparison, the LSV of a commercial Pt-C catalyst is included, highlighting its higher oxygen reduction activity. The biocarbon samples did not exhibit a plateau in the diffusion-controlled region, and consequently, the diffusion-limited current was not achieved. Figure 6b–d show the ORR kinetics of BP, BA, and BDA using LSV curves at various rotation rates, from 200 to 1600 rpm. As expected, the current density increased with increasing rotation rate. It is observed that BDA demonstrates greater electrochemical activity for ORR compared to BP and BA. This behavior is primarily attributable to the increased exposure of effective active sites, a larger specific surface area (1790 m2 g−1), and a higher concentration of active nitrogen species (90%). Nitrogen content in BDA was critical for the catalytic activity toward ORR. Notably, Pyridinic-N and Pyrrolic-N played an important role in ORR by contributing active sites and reducing mass transfer resistances [48]. Moreover, the onset potential of BDA was slightly higher than that of BP and BA, yet remained lower than that of Pt-C (Table 3).
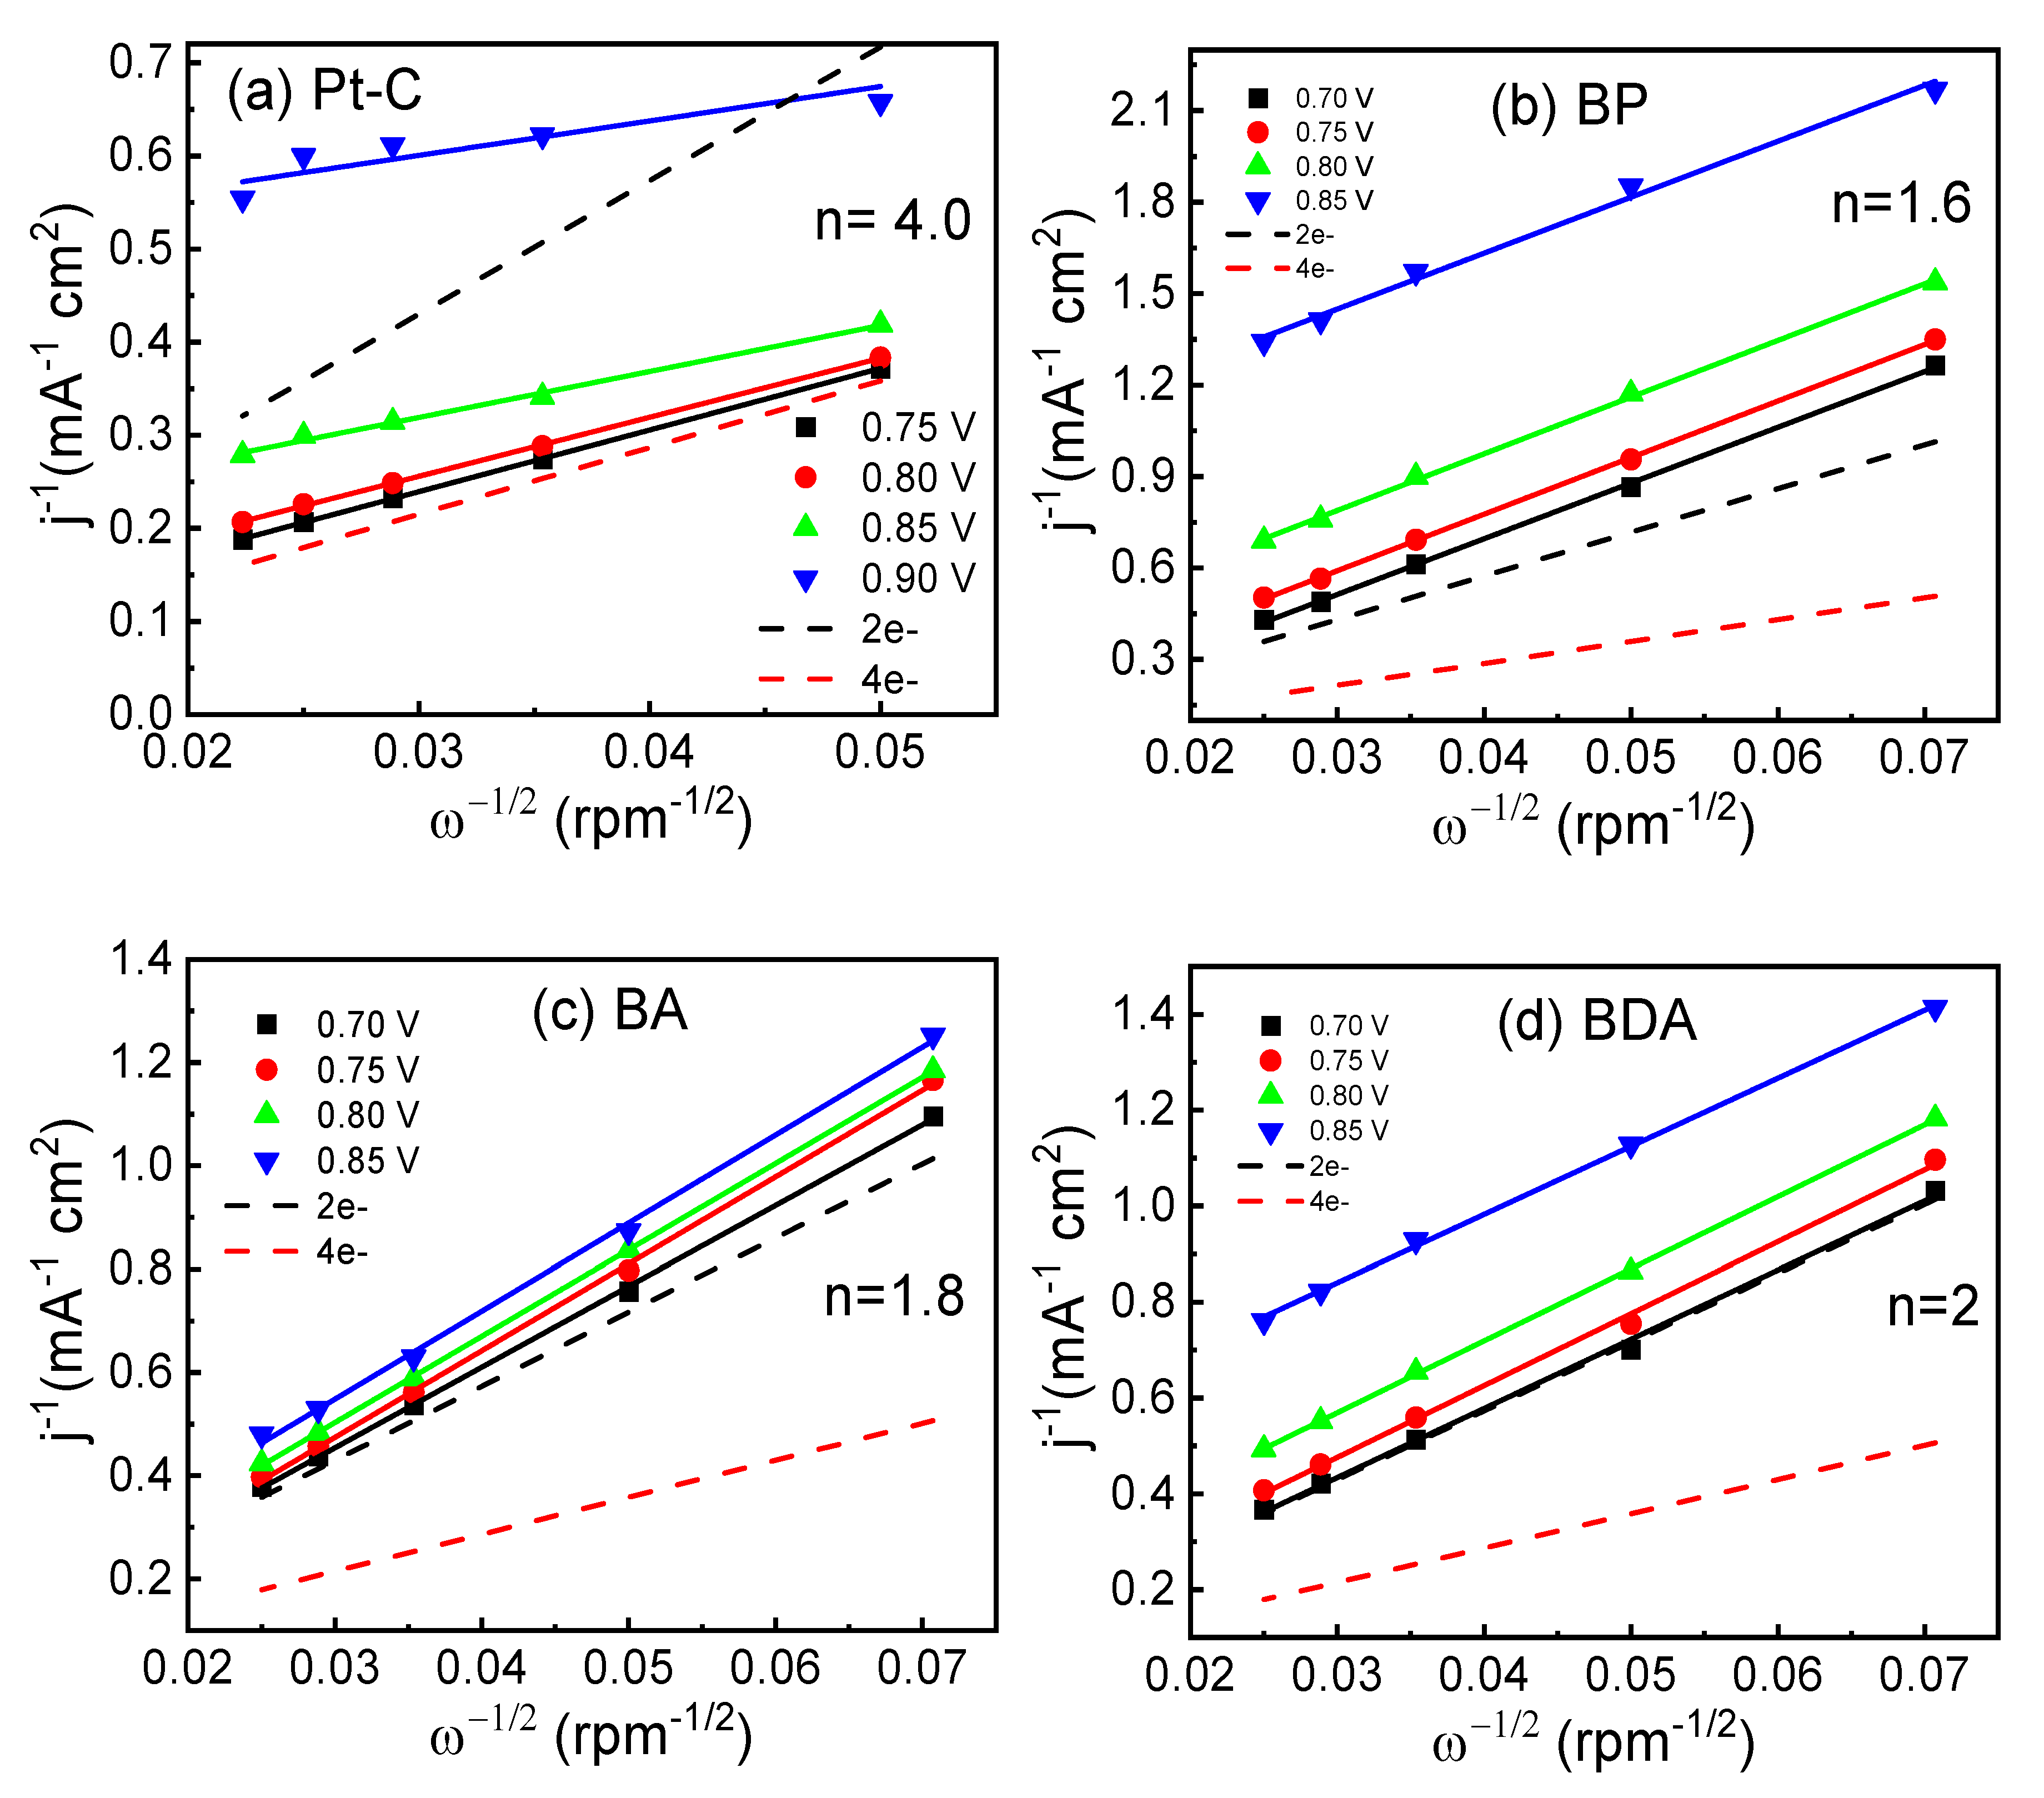
Koutecky–Levich equation was applied to determine the number of electrons transferred per O2 molecule (n). Figure 7 displays the variation of n in the potential range of −0.70 to −0.85 V. for BP, BA, and BDA, with Pt/C included for comparative analysis. The Pt-C catalyst shows an electron transfer number of 4.0, suggesting that the ORR on this catalyst proceeds via a four-electron pathway. It is well known that Pt possesses the highest intrinsic activity for the reduction of O2 to H2O, facilitating complete chemical-to-electrical energy conversion [49]. In contrast, the calculated average n values for BP, BA, and BDA (1.6, 1.8, and 2.0, respectively) indicate that the ORR predominantly occurs via a two-electron pathway, as illustrated in Figure 6. These values, being below 4 and even less than 2, suggest the promotion of HO2 formation during the ORR. A direct relationship exists between the value of n and the quantity of HO2 generated during the ORR. When n = 2, it indicates that only HO2 is produced, whereas when n = 4, it signifies that only H2O is produced, with no HO2 formation [50].
Besides, some authors attribute the high selectivity of nitrogen-doped carbon materials toward the two-electron pathway to their mesoporous structure, which facilitates mass transport and allows for the rapid release of produced H2O2, preventing further reduction or decomposition [51]. Although the results suggest a two-electron pathway, this does not exclude biocarbon from viable candidates, such as nitrogen-doped biocarbon, as non-metal electrocatalysts for ORR. This is particularly relevant considering their origin as waste byproducts from the alginate extraction process, positioning them as sustainable materials at the end of a production chain. Such utilization aligns with the principles of circular economy and waste valorization, offering a potential low-cost and environmentally friendly alternative for electrocatalysis.

4. Conclusions

The valorization of residual biomass without alginates (RBWA) generated during the extraction of alginates from Sargassum spp. demonstrated a sustainable and effective approach to producing nitrogen-doped biocarbon (BDA) through pyrolysis and chemical activation with KOH. The BDA sample exhibited significant physicochemical properties, including a specific surface area of 1790 m2 g−1 and a reduced average pore diameter of 3.1 nm, which are crucial factors for enhancing catalytic performance.
Electrochemical studies demonstrated that the BDA exhibited a current density of −4.37 mA cm−2, an onset potential of 0.922 E vs. RHE, and a half-wave potential of 0.775 E vs. RHE in 0.1 M KOH. Furthermore, Koutecky–Levich analysis indicated that the ORR followed a two-electron pathway, attributed to the concentration of active nitrogen species (90%). XPS analysis confirmed the presence of pyrrolic-N and pyridinic-N functional groups, which notably enhanced the catalytic performance by increasing the number of accessible active sites and minimizing mass transfer resistance.
These findings highlight the potential of nitrogen-doped biocarbon derived from Sargassum spp. waste, not only as a cost-effective material, but also as a promising candidate for applications beyond alkaline fuel cells. Given the observed two-electron transfer pathway, this material could be effectively employed in advanced oxidation processes or for the electrochemical production of hydrogen peroxide [52,53]. By integrating the principles of the circular economy, this study addresses the environmental challenges posed by Sargassum spp. accumulation while contributing to the development of low-cost and high-performance electrocatalysts. Furthermore, the innovative use of waste biomass underscores its feasibility as a high-value product in energy applications, supporting the broader adoption of renewable resources and waste valorization strategies.

Supplementary Materials

The following supporting information can be downloaded at: https://www.mdpi.com/article/10.3390/chemistry7050144/s1, Figure S1: Thermogravimetric analysis, (a) TGA and (b) DTG analysis, for SP and MRSA samples in a nitrogen atmosphere; Figure S2: Diffractograms obtained from samples BP, BA and BDA; Figure S3: FTIR analysis of SP and MRSA samples; Figure S4: Raman characterization of precursor biochar (BP), activated biochar (BA), doped and activated biochar (BDA) samples; Figure S5: N2 adsorption/desorption isotherms at 77 K of samples (a) MRSA and (b) BDA; Figure S6: Scanning electron microscopy images of the MRSA sample; Figure S7: Scanning electron microscopy (SEM) images of sample BP; Figure S8: Scanning electron microscopy (SEM) images of sample BA; Figure S9: Scanning electron microscopy images of the BDA sample; Table S1: Results of the surface area and pore size analysis; Table S2: Results for CHN-S elemental analysis; Table S3: Results of EDS analysis demonstrating its elemental composition.

Author Contributions

Conceptualization, A.C. and B.E.; methodology, A.C., B.E. and J.M.B.-L.; formal analysis, B.E. and R.B.; investigation, A.C., B.E., J.M.B.-L., R.B. and J.U.; data curation, A.C. and J.M.B.-L.; writing—original draft preparation, A.C., J.M.B.-L., R.B., J.U. and J.B.; writing—review and editing, A.C., J.M.B.-L., R.B., J.U. and J.B.; supervision, B.E. All authors have read and agreed to the published version of the manuscript.

Funding

This research received no external funding.

Data Availability Statement

The original contributions presented in this study are included in the article material. Further inquiries can be directed to the corresponding author.

Acknowledgments

The authors want to thank Secretaría de Ciencia, Humanidades, Tecnología e Innovación (Secihti) for the Grants 253986 and 254667. XPS measurements were performed at LANNBIO Cinvestav Mérida, under support from projects 2009-01-123913, 292692, 294643, 188345, 204822, 292692, and 294643.

Conflicts of Interest

The authors declare no conflicts of interest.

References

  1. Paredes-Camacho, R.M.; González-Morales, S.; González-Fuentes, J.A.; Rodríguez-Jasso, R.M.; Benavides-Mendoza, A.; Charles-Rodríguez, A.V.; Robledo-Olivo, A. Characterization of Sargassum spp. from the Mexican Caribbean and its valorization through fermentation process. Processes 2023, 11, 685. [Google Scholar] [CrossRef]
  2. Amador-Castro, F.; García-Cayuela, T.; Alper, H.S.; Rodriguez-Martinez, V.; Carrillo-Nieves, D. Valorization of pelagic Sargassum biomass into sustainable applications: Current trends and challenges. J. Environ. Manag. 2021, 283, 112013. [Google Scholar] [CrossRef] [PubMed]
  3. Narayanan, M. Promising biorefinery products from marine macro and microalgal biomass: A review. Renew. Sustain. Energy Rev. 2024, 190, 114081. [Google Scholar] [CrossRef]
  4. López-Contreras, A.M.; Núñez, P.N.; García, B.C.; Driegen, J.; Lwanga, E.H.; Domin, P.; Gurrola, M.P. Sargassum in Mexico: From Environmental Problem to Valuable Resource; Wageningen Food & Biobased Research: Wageningen, The Netherlands, 2022. [Google Scholar] [CrossRef]
  5. Del-Río, P.G.; Gullón, B.; Romaní, A.; Garrote, G. Eco-friendly strategy for the joint valorization of invasive macroalgae and fast-growing wood to produce advanced biofuels. Renew. Energy 2023, 219, 119496. [Google Scholar] [CrossRef]
  6. Aparicio, E.; Rodríguez-Jasso, R.M.; Pinales-Márquez, C.D.; Loredo-Treviño, A.; Robledo-Olivo, A.; Aguilar, C.N.; Kostas, E.T.; Ruiz, H.A. High-pressure technology for Sargassum spp biomass pretreatment and fractionation in the third generation of bioethanol production. Bioresour. Technol. 2021, 329, 124935. [Google Scholar] [CrossRef]
  7. González-Gloria, K.D.; Rodríguez-Jasso, R.M.; Rosero-Chasoy, G.; Shiva; Kostas, E.T.; Aparicio, E.; Sanchez, A.; López-Sandin, I.; Ruiz, H.A. Scale-up of hydrothermal processing: Liquid hot water and pilot-scale tubular steam explosion batch reactor for bioethanol production using macroalgae Sargassum spp. biomass. Bioresour. Technol. 2023, 369, 128448. [Google Scholar] [CrossRef]
  8. Seyedalhosseini, S.H.; Salati, A.P.; Mozanzadeh, M.T.; Parrish, C.C.; Shahriari, A. Effects of dietary seaweeds (Gracilaria spp. and Sargassum spp.) on growth, feed utilization, and resistance to acute hypoxia stress in juvenile Asian seabass (Lates calcarifer). Aquac. Rep. 2023, 31, 101663. [Google Scholar] [CrossRef]
  9. Grand View Research. Alginate Market Size, Share & Trends Analysis Report by Type (High M, High G), by Product (Sodium, Propylene Glycol), by Application (Pharmaceutical, Industrial), by Region, and Segment Forecasts, 2021–2028; Grand View Research: San Francisco, CA, USA, 2019. [Google Scholar]
  10. Ramírez-Partida, A.E.; García-Cayuela, T.; Amador-Castro, L.F.; Alper, H.S.; Carrillo-Nieves, D. Towards a biorefinery processing Sargassum seaweed: Techno-economic assessment of alginate and fucoidan production through SuperPro Designer® process simulation. Environ. Technol. Innov. 2024, 34, 103587. [Google Scholar] [CrossRef]
  11. Mazumder, A.; Holdt, S.L.; De Francisci, D.; Alvarado-Morales, M.; Mishra, H.N.; Angelidaki, I. Extraction of alginate from Sargassum muticum: Process optimization and study of its functional activities. J. Appl. Phycol. 2016, 28, 3625–3634. [Google Scholar] [CrossRef]
  12. Mohammed, A.; Rivers, A.; Stuckey, D.C.; Ward, K. Alginate extraction from Sargassum seaweed in the Caribbean region: Optimization using response surface methodology. Carbohydr. Polym. 2020, 245, 116419. [Google Scholar] [CrossRef]
  13. Saji, S.; Hebden, A.; Goswami, P.; Du, C. A brief review on the development of alginate extraction process and its sustainability. Sustainability 2022, 14, 5181. [Google Scholar] [CrossRef]
  14. Firouzjaie, H.A.; Mustain, W.E. Catalytic advantages, challenges, and priorities in alkaline membrane fuel cells. ACS Catal. 2020, 10, 225–234. [Google Scholar] [CrossRef]
  15. Men Truong, V.; Richard Tolchard, J.; Svendby, J.; Manikandan, M.A.; Miller, H.; Sunde, S.; Yang, H.; Dekel, D.R.; Barnett, A.O. Platinum and platinum group metal-free catalysts for anion exchange membrane fuel cells. Energies 2020, 13, 582. [Google Scholar] [CrossRef]
  16. Ng, W.K.; Wong, W.Y.; Rosli, N.A.; Loh, K.S. Commercial anion exchange membranes (AEMs) for fuel cell and water electrolyzer applications: Performance, durability, and materials advancement. Separations 2023, 10, 424. [Google Scholar] [CrossRef]
  17. Hossen, M.; Hasan, S.; Sardar, R.I.; Haider, J.; Mottakin, K.; Tammeveski, K.; Atanassov, P. State-of-the-art and developmental trends in platinum group metal-free cathode catalyst for anion exchange membrane fuel cell (AEMFC). Appl. Catal. B Environ. 2023, 325, 121733. [Google Scholar] [CrossRef]
  18. The, Y.Y.; Lee, K.T.; Chen, W.H.; Lin, S.C.; Sheen, H.K.; Tan, I.S. Dilute sulfuric acid hydrolysis of red macroalgae Eucheuma denticulatum with microwave-assisted heating for biochar production and sugar recovery. Bioresour. Technol. 2017, 246, 20–27. [Google Scholar] [CrossRef]
  19. Francavilla, M.; Manara, P.; Kamaterou, P.; Monteleone, M.; Zabaniotou, A. Cascade approach of red macroalgae Gracilaria gracilis sustainable valorization by extraction of phycobiliproteins and pyrolysis of residue. Bioresour. Technol. 2015, 184, 305–313. [Google Scholar] [CrossRef] [PubMed]
  20. Méndez, A.; Gascó, G.; Ruiz, B.; Fuente, E. Hydrochars from industrial macroalgae “Gelidium Sesquipedale” biomass wastes. Bioresour. Technol. 2019, 275, 386–393. [Google Scholar] [CrossRef]
  21. del Río, P.G.; Gullón, B.; Pérez-Pérez, A.; Romaní, A.; Garrote, G. Microwave hydrothermal processing of the invasive macroalgae Sargassum muticum within a green biorefinery scheme. Bioresour. Technol. 2021, 340, 125733. [Google Scholar] [CrossRef] [PubMed]
  22. Pérez-Salcedo, K.Y.; Alonso-Lemus, I.L.; Quintana, P.; Mena-Durán, C.J.; Barbosa, R.; Escobar, B. Self-doped Sargassum spp. derived biocarbon as electrocatalysts for ORR in alkaline media. Int. J. Hydrogen Energy 2019, 44, 12399–12408. [Google Scholar] [CrossRef]
  23. Rosas-Medellín, D.; Rodríguez-Varela, F.J.; Escobar, B. Sulfur doped biocarbon obtained from Sargassum spp. for the oxygen reduction reaction. Int. J. Hydrogen Energy 2022, 47, 30172–30177. [Google Scholar] [CrossRef]
  24. Chávez-Guerrero, L.; Toxqui-Terán, A.; Rivera-Haro, J.A.; Lozoya-Márquez, L.A.; Lara-Banda, M. Management of Pelagic Sargassum spp. Landings to atlantic coastlines through direct combustion and further synthesis of highly pure calcium carbonate using the residual ashes. Waste Biomass Valorization 2021, 12, 6591–6599. [Google Scholar] [CrossRef]
  25. Aragón-Vallejo, J.D.; Salazar-Cruz, B.A.; Chávez-Cinco, M.Y.; Rivera-Armenta, J.L.; Espindola-Flores, A.C. Novel Polypropylene–Sargassum Particles composites: Evaluation of thermal and thermomechanical properties. J. Compos. Sci. 2023, 7, 455. [Google Scholar] [CrossRef]
  26. Kulig, D.; Zimoch-Korzycka, A.; Jarmoluk, A.; Marycz, K. Study on alginate-chitosan complex formed with different polymers ratio. Polymers 2016, 8, 167. [Google Scholar] [CrossRef]
  27. Li, L.; Ma, X.; Chen, R.; Wang, C.; Lu, M. Nitrogen-containing functional groups-facilitated acetone adsorption by ZIF-8-derived porous carbon. Materials 2018, 11, 159. [Google Scholar] [CrossRef]
  28. Chen, J.P.; Yang, L. Chemical modification of Sargassum sp. for prevention of organic leaching and enhancement of uptake during metal biosorption. Ind. Eng. Chem. Res. 2005, 44, 9931–9942. [Google Scholar] [CrossRef]
  29. Chen, X.; Zhang, R.; Li, Y.; Li, X.; You, L.; Kulikouskaya, V.; Hileuskaya, K. Degradation of polysaccharides from Sargassum fusiforme using UV/H2O2 and its effects on structural characteristics. Carbohydr. Polym. 2020, 230, 115647. [Google Scholar] [CrossRef]
  30. Oliveira, R.C.; Hammer, P.; Guibal, E.; Taulemesse, J.M.; Garcia, O. Characterization of metal-biomass interactions in the lanthanum (III) biosorption on Sargassum sp. using SEM/EDX, FTIR, and XPS: Preliminary studies. Chem. Eng. J. 2014, 239, 381–391. [Google Scholar] [CrossRef]
  31. Kannan, S. FT-IR and EDS analysis of the seaweeds Sargassum wightii and Gracilaria corticata (red algae). Int. J. Curr. Microbiol. Appl. Sci. 2014, 3, 341–351. [Google Scholar]
  32. Leal, D.; Matsuhiro, B.; Rossi, M.; Caruso, F. FT-IR spectra of alginic acid block fractions in three species of brown seaweeds. Carbohydr. Res. 2008, 343, 308–316. [Google Scholar] [CrossRef]
  33. Wang, L.; Khalil, R.A.; Bakken, J.; Skreiberg, Ø. Production and characterization of biocarbon from woody biomasses produced at 1000 °C. Fuel 2024, 370, 131667. [Google Scholar] [CrossRef]
  34. Karbhal, I.; Chaturvedi, V.; Patrike, A.; Yadav, P.; Shelke, M.V. Honeycomb boron carbon nitride as high-performance anode material for Li-Ion batteries. ChemNanoMat 2022, 8, e202200056. [Google Scholar] [CrossRef]
  35. Wu, J.B.; Lin, M.L.; Cong, X.; Liu, H.N.; Tan, P.H. Raman spectroscopy of graphene-based materials and its applications in related devices. Chem. Soc. Rev. 2018, 47, 1822–1873. [Google Scholar] [CrossRef] [PubMed]
  36. Lin, Z.; Waller, G.; Liu, Y.; Liu, M.; Wong, C.P. Facile synthesis of nitrogen-doped graphene via pyrolysis of graphene oxide and urea, and its electrocatalytic activity toward the oxygen-reduction reaction. Adv. Energy Mater. 2012, 2, 884–888. [Google Scholar] [CrossRef]
  37. Zhang, X.; Huang, R.; Show, P.L.; Mahlknecht, J.; Wang, C. Degradation of tetracycline by nitrogen-doped biochar as a peroxydisulfate activator: Nitrogen doping pattern and non-radical mechanism. Sustain. Horizons 2024, 10, 100091. [Google Scholar] [CrossRef]
  38. Liang, K.; Chen, Y.; Wang, S.; Wang, D.; Wang, W.; Jia, S.; Mitsuzakic, N.; Chen, Z. Peanut shell waste derived porous carbon for high-performance supercapacitors. J. Energy Storage 2023, 70, 107947. [Google Scholar] [CrossRef]
  39. Fu, X.; Li, Y. Efficient activation of persulfate for tetracycline hydrochloride degradation by biochar prepared from corn stover doped with organic phosphorus sources. Desalin. Water Treat. 2024, 319, 100559. [Google Scholar] [CrossRef]
  40. dos Reis, G.S.; Grimm, A.; Fungaro, D.A.; Hu, T.; de Brum, I.A.S.; Lima, E.C.; Naushad, M.; Dotto, G.L.; Lassi, U. Synthesis of sustainable mesoporous sulfur-doped biobased carbon with superior performance sodium diclofenac removal: Kinetic, equilibrium, thermodynamic and mechanism. Environ. Res. 2024, 251, 118595. [Google Scholar] [CrossRef]
  41. Rodriguez Correa, C.; Otto, T.; Kruse, A. Influence of the biomass components on the pore formation of activated carbon. Biomass Bioenergy 2017, 97, 53–64. [Google Scholar] [CrossRef]
  42. López-Miranda, J.L.; Silva, R.; Molina, G.A.; Esparza, R.; Hernandez-Martinez, A.R.; Hernández-Carteño, J.; Estévez, M. Evaluation of a dynamic bioremediation system for the removal of metal ions and toxic dyes using Sargassum spp. J. Mar. Sci. Eng. 2020, 8, 899. [Google Scholar] [CrossRef]
  43. Watson, V.J.; Nieto Delgado, C.; Logan, B.E. Influence of chemical and physical properties of activated carbon powders on oxygen reduction and microbial fuel cell performance. Environ. Sci. Technol. 2013, 47, 6704–6710. [Google Scholar] [CrossRef] [PubMed]
  44. Grimm, A.; dos Reis, G.S.; Khokarale, S.G.; Ekman, S.; Lima, E.C.; Xiong, S.; Hultberg, M. Shiitake spent mushroom substrate as a sustainable feedstock for developing highly efficient nitrogen-doped biochars for treatment of dye-contaminated water. J. Water Process Eng. 2023, 56, 104435. [Google Scholar] [CrossRef]
  45. Wang, X.; Zuo, L.; Wang, Y.; Zhen, M.; Xu, L.; Kong, W.; Shen, B. Electrochemical performance of nitrogen self-doping carbon materials prepared by pyrolysis and activation of defatted microalgae. Molecules 2023, 28, 7280. [Google Scholar] [CrossRef] [PubMed]
  46. Laisné, E.; Thivet, J.; Manavalan, G.; Petnikota, S.; Mikkola, J.P.; Thyrel, M.; Hu, T.; Lima, E.C.; Naushad, M.; Lassi, U.; et al. Box-Behnken design for the synthesis optimization of mesoporous sulfur-doped carbon-based materials from birch waste: Promising candidates for environmental and energy storage application. Colloids Surf. A Physicochem. Eng. Asp. 2024, 692, 133899. [Google Scholar] [CrossRef]
  47. Nzediegwu, C.; Naeth, M.A.; Chang, S.X. Elemental composition of biochars is affected by methods used for its determination. J. Anal. Appl. Pyrolysis 2021, 156, 105174. [Google Scholar] [CrossRef]
  48. Lai, L.; Potts, J.R.; Zhan, D.; Wang, L.; Poh, C.K.; Tang, C.; Gong, H.; Shen, Z.; Lin, J.; Ruoff, R.S. Exploration of the active center structure of nitrogen-doped graphene-based catalysts for oxygen reduction reaction. Energy Environ. Sci. 2012, 5, 7936–7942. [Google Scholar] [CrossRef]
  49. Park, J.; Nabae, Y.; Hayakawa, T.; Kakimoto, M. Highly Selective Two-Electron Oxygen Reduction Catalyzed by Mesoporous Nitrogen-Doped Carbon. ACS Catal. 2014, 4, 3749–3754. [Google Scholar] [CrossRef]
  50. Olson, T.S.; Pylypenko, S.; Atanassov, P.; Asazawa, K.; Yamada, K.; Tanaka, H. Anion-exchange membrane fuel cells: Dual-site mechanism of oxygen reduction reaction in alkaline media on cobalt−polypyrrole electrocatalysts. J. Phys. Chem. C 2010, 114, 5049–5059. [Google Scholar] [CrossRef]
  51. Wang, Y.; Wang, D.; Li, Y. A fundamental comprehension and recent progress in advanced Pt-based ORR nanocatalysts. SmartMat 2021, 2, 56–75. [Google Scholar] [CrossRef]
  52. Zhai, Q.; Huang, H.; Lawson, T.; Xia, Z.; Giusto, P.; Antonietti, M.; Jaroniec, M.; Chhowalla, M.; Baek, J.; Liu, Y.; et al. Recent advances on carbon-based metal-free electrocatalysts for energy and chemical conversions. Adv. Mater. 2024, 36, 2405664. [Google Scholar] [CrossRef]
  53. Mazzucato, M.; Facchin, A.; Parnigotto, M.; Durante, C. New and revised aspects of the electrochemical synthesis of hydrogen peroxide: From model electrocatalytic systems to scalable materials. ACS Catal. 2024, 14, 6369–6403. [Google Scholar] [CrossRef]
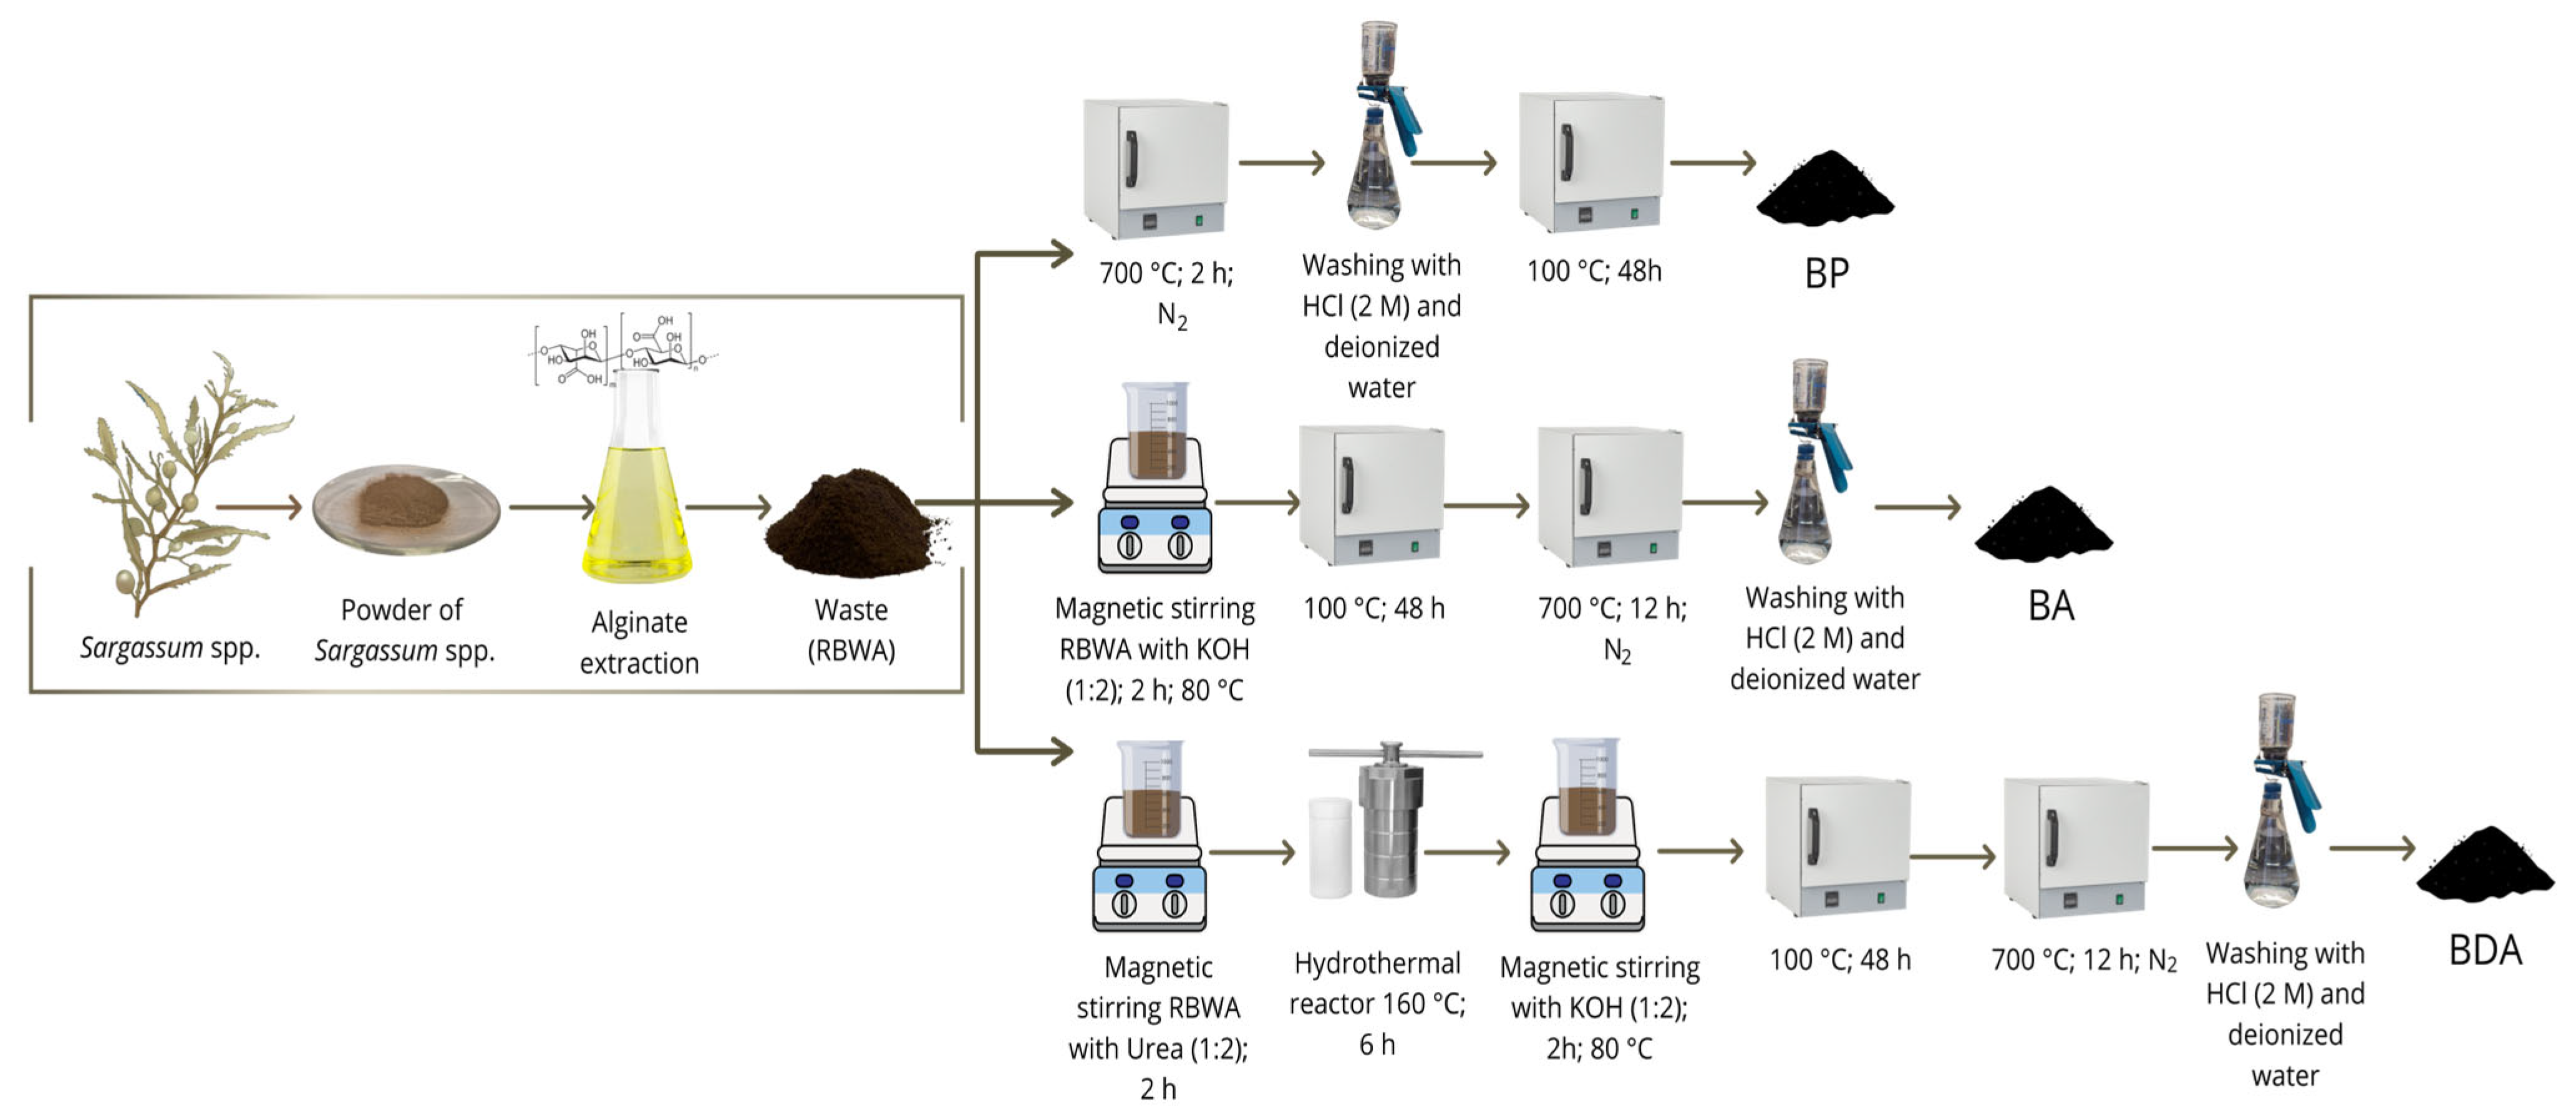
Figure 1. Scheme of the use of Sargassum spp. as raw material for several samples of biochar.
Chemistry 07 00144 g001
Figure 2. (a) Thermogravimetric analysis (TGA), (b) differential thermogravimetric (DTG) analysis, and (c) FTIR spectra.
Chemistry 07 00144 g002
Figure 3. (a) X-ray diffractograms, (b) Raman spectra, (c) surface area analysis by BET characterization, and (d) pore size distribution calculated using BJH.
Chemistry 07 00144 g003
Figure 6. (a) Linear sweep voltammetry (LSV) curves at 1600 rpm, 5 mV s−1, and O2-saturation conditions and (bd) LSV curves at different rotation rates for BP, BA, BDA, and commercial electrocatalyst Pt-C, same conditions.
Chemistry 07 00144 g006
Figure 7. Koutecky–Levich plots of Pt-C, BP, BA, and BDA.
Chemistry 07 00144 g007
Figure 4. SEM images of (a) RBWA, (b) BP, (c) BA, and (d) BDA.
Chemistry 07 00144 g004
Figure 5. XPS spectra of biocarbons (ac) C1s, (d,e) N1s, and (fh) S 2p.
Chemistry 07 00144 g005
Table 1. Physicochemical properties and EDX analysis of the raw materials and biocarbon.
Elemental Composition (%)EDX Analysis
wt.%
SampleSBET
(m2 g−1)
Average Pore Diameter (nm)CHNSCNS
SP14.034.853.740.601.50---
RBWA34.331.443.920.640.8325.592.340.36
BP6824.575.871.090.181.5775.42-1.69
BA13063.177.070.630.592.0488.23-1.34
BDA17903.158.752.580.771.1757.842.610.36
Table 3. Electrochemical parameters of the biocarbon compared to Pt-C.
SampleCurrent Density a 0.2 E vs. RHE (mA cm−2) at 1600 RPMOnset Potential (E vs. RHE)Half-Wave Potential E1/2 (E vs. RHE)Electron Transfer Number (n)
Pt-C−5.481.0590.8704
BP−3.170.9080.7391.6
BA−3.600.8960.7721.8
BDA−4.370.9220.7752
Table 2. XPS chemical composition of the BP, BA, and BDA samples.
Chemical Composition by XPS (at. %)
SampleC1sO1sS2pN1s
BP93.594.920.570.67
Pyridinic
N-H
Pyridinic
N
Pyrrolic
62.6125.31--
BA84.1311.230.35------
BDA92.984.401.770.85
Pyridinic
N-H
Pyridinic
N
Pyrrolic
N
--24.0175.99
Disclaimer/Publisher’s Note: The statements, opinions and data contained in all publications are solely those of the individual author(s) and contributor(s) and not of MDPI and/or the editor(s). MDPI and/or the editor(s) disclaim responsibility for any injury to people or property resulting from any ideas, methods, instructions or products referred to in the content.