Abstract
Multicolour graphene quantum dots (GQDs), from blue to orange emitting, were successfully synthesized via a one-step hydrothermal method using potassium hydrogen phthalate and o-phenylenediamine as the raw materials. After purification by silica gel column chromatography, four kinds of GQDs with maximum emission wavelengths of 420 nm (blue), 500 nm (green), 540 nm (yellow), and 555 nm (orange) were obtained, and all had a high quantum yield (9.7%, 8.8%, 9.3%, and 10.3%, respectively). The structural characterization revealed that the synthesized GQDs had a regular morphology, with a size of 2–3 nm and a thickness of 1–2 nm. The D-band-to-G-band ratio was less than 0.3, indicating that the GQDs had a high degree of graphitization. In addition, the emission peaks of the GQDs were red-shifted as the particle size increased, confirming that their luminescence was dominated by the quantum confinement effect. By analyzing the surface states and the functional groups of the multicolour GQDs, it was found that the GQDs had a similar elemental composition, which further proved that the emission wavelengths did not depend on the surface element composition, but conformed to the luminescence mechanism regulated by the quantum-limited effect. Furthermore, the four types of GQDs exhibited low cytotoxicity and good stability, suggesting their potential applications in biomarkers and for the synchronous detection of a variety of analytes.
1. Introduction
Graphene quantum dots (GQDs), as a new kind of fluorescent nanomaterials, have shown broad application prospects in the fields of bioimaging, detection, energy catalysis, and so on due, to their unique optical properties, low toxicity, and good biocompatibility [1,2,3,4]. Compared with traditional semiconductor quantum dots, GQDs not only have adjustable fluorescence emission characteristics, but also avoid the environmental risks of the heavy metal elements [5,6,7,8,9]. As a fluorescence detection probe, GQDs have lower detection limits, higher detection sensitivities, and shorter detection times; therefore, they have high application prospects in the fields of biomarkers and sensing detection [10,11]. In addition, multicolour GQDs with different emission wavelengths can also realize multi-channel synchronous detection, improve detection efficiency, and save detection time. However, how to achieve the accurate control of multicolour GQDs through a one-step, simple, and green synthesis strategy, especially covering luminescence from blue to red light, is still a technical challenge in this field.
At present, the synthesis of graphene quantum dots (GQDs) primarily relies on conventional methods, such as arc discharge, laser ablation, and chemical oxidation [12,13,14]. However, these approaches suffer from three critical limitations: their multi-step complexity (involving tedious purification or exfoliation procedures that hinder reproducibility); the toxic reagents (e.g., strong acids/oxidants (H2SO4/HNO3)) used during chemical oxidation, which pose environmental and biosafety risks; and their narrow tunability–limited emission range (typically blue–green), due to insufficient control of their size and surface chemistry. In contrast, hydrothermal synthesis has emerged as a favoured alternative, offering simple operation, low cost, environmental benignity (aqueous solvents, mild temperatures), and scalability, while enabling the precise modulation of the optical properties through parameter optimization [15,16,17]. In recent years, the fluorescence properties of GQDs have been preliminarily regulated by adjusting the precursor type, reaction temperature, time, and dopants. Notably, the hydrothermal synthesis parameters—particularly the temperature and duration—are critical for governing the carbonization degree and size distribution of GQDs. Elevated temperatures and prolonged reactions typically yield larger particles with red-shifted emission wavelengths, albeit at the potential cost of reduced quantum yields. Conversely, moderate conditions (e.g., 180–220 °C for 6–10 h) often produce GQDs with uniform sizes and enhanced luminescence efficiency, as optimized carbonization balances nucleation and growth [18,19,20,21,22,23]. However, most studies are still limited to a single- or narrow-spectrum emission, and the synthesis of multicolour GQDs often relies on multi-step reactions or the introduction of complex surface passivators, which limits their practical application potential [24,25,26]. Therefore, it is of great significance to develop a one-step hydrothermal method to realize the efficient synthesis of multicolour GQDs and to reveal their luminescence mechanism, which will promote the functional application of GQDs.
In this study, a controllable synthesis strategy for multicolour GQDs based on a one-step hydrothermal method is proposed. Multicolour GQDs were prepared with potassium hydrogen phthalate (KHP) and o-phenylenediamine (OPDA) as the raw materials to achieve the broad-spectrum regulation of fluorescence from blue to red. The structural and elemental composition and the fluorescence properties of the GQDs were systematically studied, and the structural–activity relationship between the size, luminescence, and surface states of the GQDs are discussed below. This strategy simplifies the preparation process of traditional multicolour GQDs, and provides a new idea for the development of low-cost and high-performance fluorescent nanomaterials. The prepared multicolour GQDs showed no cytotoxicity and good stability, which is expected to expand their application to multi-channel biomarkers and the simultaneous detection of multiple analytes.
2. Materials and Methods
2.1. Chemicals
Potassium hydrogen phthalate (KHP) (AR), o-phenylenediamine (OPDA) (AR), potassium periodate (KIO4) (AR), ethyl alcohol (AR), ethyl acetate (AR), and petroleum ether (30–60 °C) (AR) were obtained from Sinopharm Group Chemical reagent Co., Ltd. (Shanghai, China). Silica gel packing, 100 mesh, was purchased from Qingdao Marine Chemical Factory. Quinine sulfate (AR) was obtained from Shanghai Aladdin Chemical reagent Company (Shanghai, China). CCK-8 (BR) was purchased from Beijing Zhuangmeng Reagent Company (Beijing, China). DEME (BR), penicillin (BR), streptomycin (BR), and fetal calf serum (BR) were obtained from Gibco reagent company (Waltham, MA, USA). Water used in this experiment was Milli-Q ultra-pure water (18.2 M−1) (Darmstadt, Germany).
2.2. Preparation of the Multicolour GQDs
A total of 0.020 g KHP, 0.021 g OPDA, and 50 mg potassium periodate (KIO4) were dissolved in 40 mL of ultrapure water and subjected to ultrasonic treatment for 30 min. The above solution reacted at 220 °C for 10 h. After cooling to room temperature, the resulting yellow solution was the GQDs mixed solution. The original GQDs solution was purified using petroleum ether and an ethyl acetate mixture, with ethyl acetate and ethanol as the mobile phase.
The GQDs solution was irradiated with a 100 W UV lamp (Spectroline, Long Island, NY, USA) to investigate the photobleaching ability of the GQDs by measuring the amount of change in the fluorescence intensity of the GQDs solution. The salt ion stability of the GQDs was investigated by measuring the amount of change in the fluorescence intensity of the GQDs solution by dropping GQDs into solutions with different salt ion concentrations.
2.3. Characterization of the Multicolour GQDs
The morphology and size of the synthesized GQDs were characterized by transmission electron microscopy (TEM), high-resolution transmission electron microscopy (HRTEM), and atomic force microscopy (AFM). The TEM images and HRTEM images were obtained using a JEM-2100 electron microscope (JEOL, Tokyo, Japan) operating at 200 kV. The AFM images were obtained using an SPM9700 Atomic Force microscope (Shimadzu, Kyoto, Japan). The dynamic light scattering (DLS) of the GQDs was characterized by a laser particle size analyzer (Zetasizer Nano ZS, Malvern, United Kingdom) at 25 °C. The X-ray photoelectron spectroscopy (XPS) analyses were performed on a GENESIS X-ray photoelectron spectrometer (EDAX Inc., Mahwah, NJ, USA). The Fourier transform infrared (FTIR) spectra were obtained using a Nexus 470 FTIR spectrometer (NICOLET, Thermo Fisher Scientific, Waltham, MA, USA) in the 500–4000 cm−1 range. The fluorescence spectra of the GQDs were recorded using an RF-5301PC fluorescence spectrophotometer (Shimadzu, Kyoto, Japan). The excitation wavelength was set at 360 nm. The absorption spectra were obtained using a NanoDrop 2000c (Thermo scientific, Waltham, MA, USA) UV-vis spectrophotometer.
2.4. Fluorescence Quantum Yield of the Multicolour GQDs
The quantum yields of the four kinds of GQDs were measured by reference method [27].
2.5. Cytotoxicity of the Multicolour GQDs
MC3T3-E1 cells in logarithmic growth phase were inoculated evenly into 96-well cell culture plate, and 200 μL of DEME medium containing 10% fetal bovine serum, 1% penicillin, and 1% streptomycin were added, and then incubated for 24 h at 37 °C, 5% CO2 saturated humidity. After they adhered to wall and entered into logarithmic growth phase, we aspirated out original culture solution, added 90 μL of medium solution containing different concentrations of GQDs, and incubated them for another 12 h. Total of 10 μL of CCK-8 was added to each well and incubated for 2 h. Then, OD value was measured by enzyme counter at 450 nm.
3. Results and Discussion
3.1. Synthesis Schematic of the Multicolour GQDs
Figure 1 illustrates the synthesis process of the multicolour GQDs. An aqueous solution of KHP, OPDA, and KIO4 was mixed evenly by an ultrasonic treatment, and then a hydrothermal synthesis was performed to obtain the original GQDs. The original GQDs were separated by silica gel column chromatography. Since the polarity of each component was different, GQDs of various wavelengths (420 nm, 440 nm, 500 nm, 540 nm, and 555 nm) with high purity were obtained. The GQDs with emission wavelengths of 420 nm, 500 nm, 540 nm, and 555 nm were denoted as blue-GQDs (b-GQDs), green-GQDs (g-GQDs), yellow-GQDs (y-GQDs), and orange-GQDs (o-GQDs), respectively.
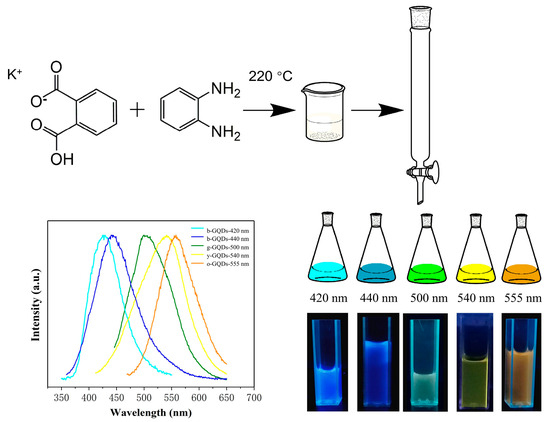
Figure 1.
One-step synthesis and purification route for GQDs with different emission wavelengths.
3.2. Spectral Properties of the Multicolour GQDs
Figure 2 shows the UV absorption spectra of the multicolour GQDs. It can be seen that all the GQDs have strong absorption from 250 nm to 300 nm, which can be attributed to the π-π* leaps of the C=C and the n-π* leaps of the C=O and C=N [28]. In the absorption region above 300 nm, the y-GQDs and o-GQDs have absorption peaks at 382 nm and 423 nm, respectively. Figure 3a–d show the photographs of the b-GQDs, g-GQDs, y-GQDs, and o-GQDs under a UV lamp (365 nm), as well as their respective fluorescence excitation spectra and fluorescence emission spectra. The maximum fluorescence emission wavelengths of the four colour GQDs were at 420 nm, 500 nm, 540 nm, and 555 nm, respectively. The maximum emission wavelengths of the four colour GQDs did not depend on the excitation wavelengths, and they were able to emit bright fluorescence under the irradiation of 365 nm UV lamps. The quantum yields of the GQDs were calculated to be 9.7% for the b-GQDs, 8.8% for the g-GQDs, 9.3% for the y-GQDs, and 10.3% for the o-GQDs. Among them, the o-GQDs exhibited the highest quantum yield. Furthermore, the fluorescence decay time spectra of the four GQDs were examined (Figure 3e–h). The fluorescence lifetime (τ) of the four GQDs were 1.6421 ns for the b-GQDs, 3.10337 ns for the g-GQDs, 8.1599 ns for the y-GQDs, and 2.0016 ns for the o-GQDs. The results indicate that the fluorescence decay lifetimes of the GQDs are monoexponential functions, suggesting that the GQDs have a single fluorescence centre. In addition, the different fluorescence lifetimes further confirm that the four types of GQDs have different electronic excited states and different properties.
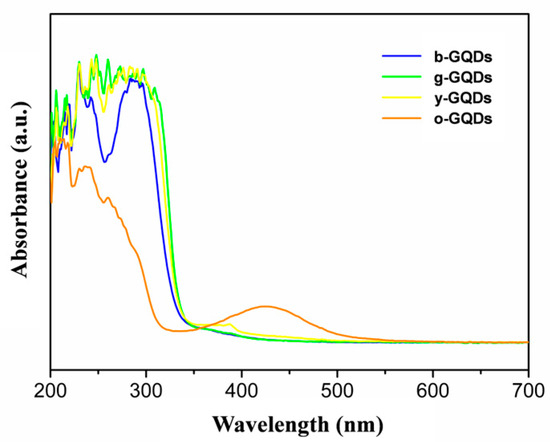
Figure 2.
UV-vis absorption spectra of b-GQDs, g-GQDs, y-GQDs, and o-GQDs.
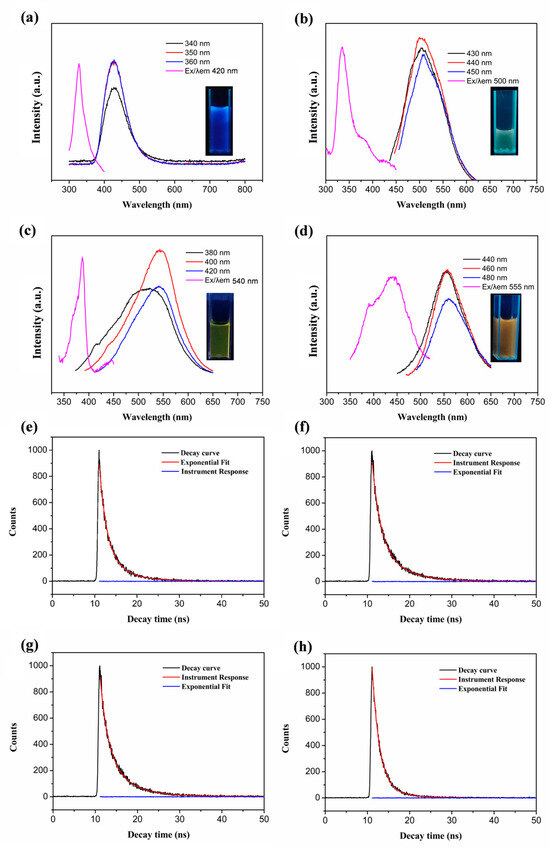
Figure 3.
The PL excitation spectra (Ex) and PL emission spectra (Em) of the b-GQDs (a), g-GQDs (b), y-GQDs (c), and o-GQDs (d) under excitation with light of different wavelengths (the insert photographs are images of the GQDs under 365 nm UV light). The PL decay spectra and fitted curves for the b-GQDs (e), g-GQDs (f), y-GQDs (g), and o-GQDs (h).
3.3. Structural Characterization of the Multicolour GQDs
The four types of GQDs had good morphologies, with shapes closely resembling spheres and demonstrating excellent dispersibility (Figure 4a–d). The particle size distribution of the four GQDs exhibited a normal distribution, with sizes of 1.58 ± 0.43 nm, 2.46 ± 0.27 nm, 3.10 ± 0.35 nm, and 3.22 ± 0.71 nm, respectively (Figure S1). Combined with the spectral properties, it could be seen that the particle size of the GQDs increased with a red shift of the fluorescence emission wavelength. From the HRTEM images, the g-GQDs, y-GQDs, and o-GQDs were observed to have a good lattice structure, while the b-GQDs were too small to observe their lattice structure. The lattice spacing of the GQDs were all around 0.21 nm, which corresponds to the lattice spacing of the 100-crystal structure of graphene, proving that these GQDs had graphite cores. The AFM plots of the four types of GQDs demonstrate that their thicknesses were approximately 1–2 nm, suggesting that the synthesized GQDs consisted of 1–3 layers of graphene (Figure S2).
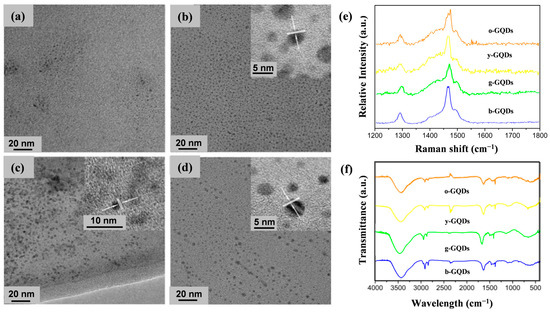
Figure 4.
TEM and HRTEM images of b-GQDs (a), g-GQDs (b), y-GQDs (c), and o-GQDs (d). (e) Raman spectra of b-GQDs, g-GQDs, y-GQDs, and o-GQDs. (f) FTIR spectra of b-GQDs, g-GQDs, y-GQDs, and o-GQDs.
The Raman spectra of typical GQDs have two broad peaks at 1354 cm−1 and 1500 cm−1, while the Raman peaks in this study were shifted to 1280 cm−1 and 1460 cm−1, which might have been due to the use of liquid samples (Figure 4e). All four GQDs exhibited extremely high graphitization, with their ID/IG less than 0.3. The high degree of graphitization led to the larger size of the sp2 subdomain of the GQDs, which resulted in the red shifting of the fluorescence emission peaks. To further understand the surface functional groups of the prepared GQDs and their relationship with fluorescence, the multicolour GQDs were tested by FTIR and XPS. All the GQDs contained hydrophilic groups, such as –OH (3440 cm−1), –NH– (3200 cm−1), and C–O (1250 cm−1), which endowed the GQDs with good water solubility (Figure 4f). Moreover, a C=C bond at 1520 cm−1, a C=N bond at 1640 cm−1, and a C–N bond at 1430 cm−1 indicated the presence of polycyclic aromatic hydrocarbon structures in the synthesized GQDs. The XPS results showed that the four types of GQDs were composed of carbon, nitrogen, and oxygen elements (Figure 5). Table S1 displays the content of the main elements in the four types of GQDs. Interestingly, the multicolour GQDs had very similar elemental contents, with all of their N elemental contents around 2–3%, while their C elemental percentages were all in the range of 60–70%. The oxygen contents of the b-GQDs, g-GQDs, and y-GQDs were in the range of 17–18%, while the oxygen contents of the o-GQDs were in the range of 30%. Whether the increase in the oxygen content is related to the wavelength red shift needs to be further verified; but overall, the similar elemental compositions suggest that the correlation of their luminescence with their elemental composition is small.
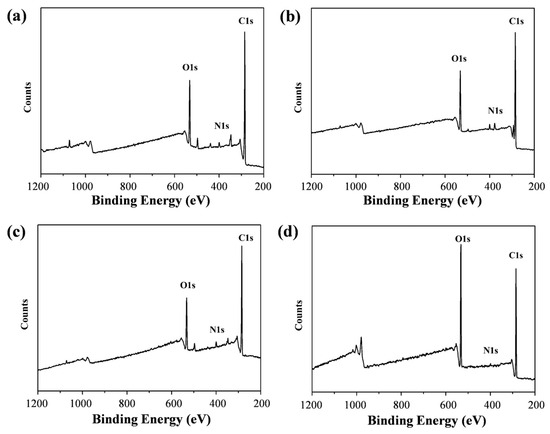
Figure 5.
XPS spectra of b-GQDs (a), g-GQDs (b), y-GQDs (c), and o-GQDs (d).
Figure 6 shows the high-resolution XPS spectra, in which a1, b1, c1, and d1 are the high-resolution C1s spectra of the four GQDs. The C1s spectra can be divided into four peaks after the peak-splitting process. The peaks are located at the positions of 284.9 eV, 286.1 eV, 288.0 eV, and 288.9 eV, which correspond to the positions of the C=C/C–C, C–N/C–O, C=O, and COOH bonds. Figure 6(a2–d2) show the high-resolution N1s spectra of the four GQDs. The split-peak processing shows that the nitrogen in the prepared GQDs mainly consisted of pyridine nitrogen (398.4 eV), nitrogen in the amino group (399.1 eV), and nitrogen in pyridine (400.2 eV). Figure 6(a3–d3) show the high-resolution O1s spectra of the four GQDs. After the split-peak treatment, it was found that the oxygen in the prepared GQDs mainly consisted of oxygen located in the C=O (531.6 eV) and C–O (532.9 eV) bonds. Combining this with the results of the FTIR, it could be concluded that the prepared GQDs mainly contained carbon, oxygen, and nitrogen elements. Comparing the four types of GQDs, it was found that the C=O content of the four GQDs firstly rose and then gradually decreased, while their C=N ratio changed irregularly. As their luminescence was not consistent with the surface-state luminescence mechanism, it could be concluded that the fluorescence emission wavelength of the prepared GQDs was mainly related to the particle size, and less related to its surface elemental composition.
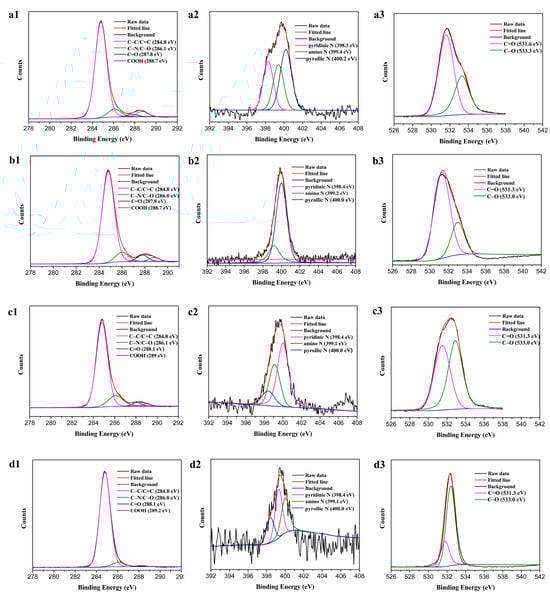
Figure 6.
High-resolution C1s (a1–d1), N1s (a2–d2), and O1s (a3–d3) XPS spectra of b-GQDs, g-GQDs, y-GQDs, and o-GQDs, respectively.
3.4. Quantum Confinement Modulation of Luminescence Mechanism
According to the theoretical calculations [29], the emission wavelengths of the GQDs were linearly related to the size of the quantum dots. When the size of the GQDs increased, their sp2 hybridization region expanded, which made the π-electron leaving domain expand and the band gap decrease, resulting in a red shift of the wavelength. From the Raman data, it could be seen that the prepared GQDs had a D-band–G-band ratio of less than 0.3, with a very high degree of graphitization. When the sp2 subdomains of the GQDs were close to the size of the grains, their luminescence was regulated by the quantum confinement. Combined with the TEM data, when the particle size of the GQDs increased, the fluorescence emission was red-shifted, which is in line with the luminescence mechanism regulated by the quantum confinement effect, and the mechanism is shown in Figure S3.
3.5. Cytotoxicity of the Multicolour GQDs
In practical applications, the safety of nanomaterials is very important. To investigate the potential value of the multicolour GQDs in fluorescent labelling and synchronous detection, their cytotoxicity was determined. The cells were mixed and cultured with different concentrations of the GQDs, and then the survival rate of the cells was measured to illustrate the toxicity magnitude of the four kinds of GQDs by a CCK-8 assay. The survival rate of the cells was above 85% when the concentration of the GQDs was increased from 10 μg mL−1 to 50 μg mL−1 (Figure 7). The maintained cell viability (80–90%) falls within the expected range for nanomaterials considered to have low cytotoxicity [30,31].
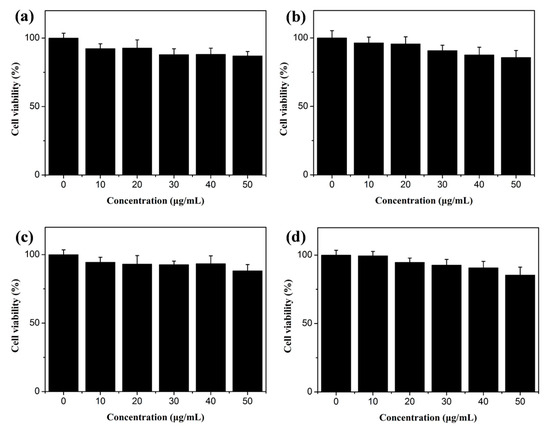
Figure 7.
Cytotoxicity of b-GQDs (a), g-GQDs (b), y-GQDs (c), and o-GQDs (d).
3.6. Stability of the Multicolour GQDs
The photostability and resistance to salt ion interference of the GQDs were investigated to verify the stability of the GQDs. As shown in Figure 8a–d, after 100 min of irradiation using a 100 W UV lamp, the four prepared GQDs basically maintained more than 70% fluorescence intensity, which indicates that the prepared GQDs had good resistance to photobleaching. In another set of experiments, the four GQDs maintained more than 90% fluorescence under the interference of a salt ion intensity of 2 M, which indicates that the prepared GQDs had good resistance to the interference of salt ions (Figure 8e–h). The excellent properties of the prepared GQDs show their great potential in the fields of biomarker and analytical detection.
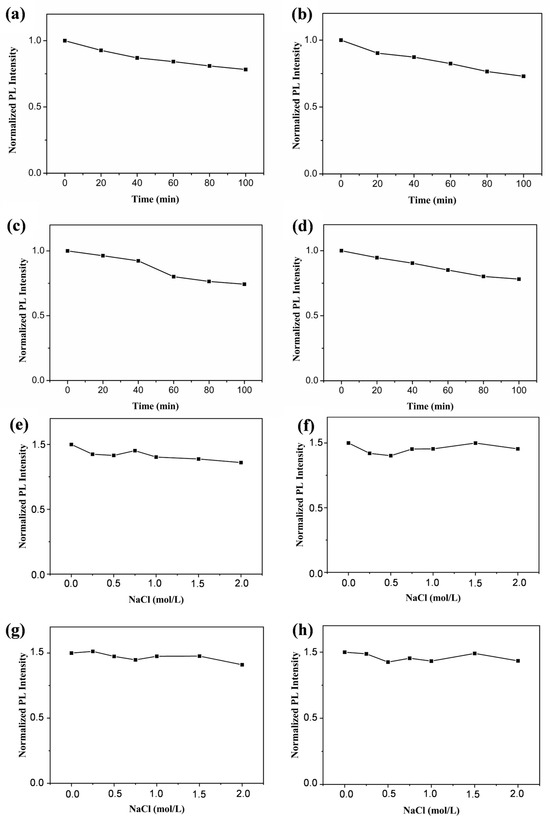
Figure 8.
Photostability data for b-GQDs (a), g-GQDs (b), y-GQDs (c), and o-GQDs (d) in water under continuous irradiation with UV light. The effect of the concentration of salt on the fluorescence intensity of the b-GQDs (e), g-GQDs (f), y-GQDs (g), and o-GQDs (h).
4. Conclusions
A one-step hydrothermal method for the synthesis of multicolour GQDs using KHP and OPDA as the raw materials was designed. After purification, four kinds of GQDs, with blue, green, yellow, and orange fluorescence emissions, were obtained. The structures, elemental compositions, and spectral data of the four GQDs showed that the emission wavelengths of the GQDs were red-shifted with an increase in the particle size, which indicates that the alteration of the optical properties of the GQDs were mainly affected by the modulation of the quantum confinement. In addition, the prepared GQDs had the advantages of uniform morphology, small size, stable luminescence properties, and good biocompatibility, so they can be used in biomarkers and for the simultaneous detection of multiple analytes.
Supplementary Materials
The following supplementary information can be downloaded at: https://www.mdpi.com/article/10.3390/chemistry7030094/s1. Figure S1: Histograms of the particle size distributions of the b-GQDs, g-GQDs, y-GQDs, and o-GQDs; Figure S2: The AFM images and height profiles analysis along the corresponding lines of the b-GQDs, g-GQDs, y-GQDs, and o-GQDs; Figure S3: Model for the tunable fluorescence of GQDs with different sizes; Table S1: The element content analysis of the four GQDs.
Author Contributions
Methodology and writing—original draft, B.W. and L.S.; data curation, K.L. and D.W.; writing—review and editing, conceptualization, and supervision, J.W. and F.G. All authors have read and agreed to the published version of the manuscript.
Funding
This research was supported by the Sichuan Science and Technology Program (2024NSFSC1266) and the Sichuan Innovation Team Project of the National Modern Agricultural Industry Technology System (SCCXTD-2025-24).
Data Availability Statement
The data will be made available on request.
Conflicts of Interest
The authors declare that they have no known competing financial interests or personal relationships that could have appeared to influence the work reported in this paper.
Correction Statement
This article has been republished with a minor correction to the image quality of figure (4f). This change does not affect the scientific content of the article.
References
- Izquierdo-García, P.; Fernández-García, J.M.; Martín, N. Twenty years of graphene: From pristine to chemically engineered nano-sized flakes. J. Am. Chem. Soc. 2024, 146, 32222–32234. [Google Scholar] [CrossRef] [PubMed]
- Zhao, F.; Li, X.; Zuo, M.; Liang, Y.; Qin, P.; Wang, H.; Wu, Z.; Luo, L.; Liu, C.; Leng, L. Preparation of photocatalysts decorated by carbon quantum dots (GQDs) and their applications: A review. J. Environ. Chem. Eng. 2023, 11, 109487. [Google Scholar] [CrossRef]
- Kucherik, A.; Kumar, A.; Andrey, A.; Vlad, S.; Anton, O.; Ilya, B.; Shchanikov, S.; Kumar, M. Carbyne as a promising material for e-nose applications with machine learning. Nanotechnology 2025, 36, 072002. [Google Scholar] [CrossRef]
- Keyvani, A.H.; Mohammadnejad, P.; Pazoki-Toroudi, H.; Gilabert, I.P.; Chu, T.; Manshian, B.B.; Soenen, S.J.; Sohrabi, B. Advancements in cancer treatment: Harnessing the synergistic potential of graphene-based nanomaterials in combination therapy. ACS Appl. Mater. Interfaces 2025, 17, 2756–2790. [Google Scholar] [CrossRef]
- Gulati, S.; Baul, A.; Amar, A.; Wadhwa, R.; Kumar, S.; Varma, R.S. Eco-friendly and sustainable pathways to photoluminescent carbon quantum dots (GQDs). Nanomaterials 2025, 13, 554. [Google Scholar] [CrossRef]
- Wang, Y.; He, Q.; Zhao, X.; Yuan, J.; Zhao, H.; Wang, G.; Li, M. Synthesis of corn straw-based graphene quantum dots (GQDs) and their application in PO43- detection. J. Environ. Chem. Eng. 2022, 10, 107150. [Google Scholar] [CrossRef]
- Ali, M.; Maiyalagan, T.; Lee, K.H.; Choi, I.; Ko, M.J. Utilizing molecular states of carbon quantum dots (GQDs) to efficiently harvest outdoor and indoor energy via luminescent solar concentrator. Surf. Interfaces 2024, 52, 104953. [Google Scholar] [CrossRef]
- Ahmed, H.E.H.; Soylak, M. Exploring the potential of carbon quantum dots (GQDs) as an advanced nanomaterial for effective sensing and extraction of toxic pollutants. Trends Anal. Chem. 2024, 180, 117939. [Google Scholar] [CrossRef]
- Wu, Y.; Combs, C.; Okosun, B.O.; Tayutivutikul, K.; Darland, D.C.; Zhao, J.X. Fe3+-doped graphene quantum dots-based nanozyme for H2O2 detection in cellular metabolic distress. ACS Appl. Nano Mater. 2025, 8, 2774–2784. [Google Scholar] [CrossRef]
- Yu, H.P.; Xiang, Y.J.; Wu, K.G.; He, D.; Chai, X.H.; Xu, L.; Cheng, Y.Q.; Duan, X.J.; Li, W.H. Green synthesis of carbon dots from Hakka yellow wine lees: Characterization and applications for Fe3+ and NaFeEDTA sensing. LWT 2024, 208, 116744. [Google Scholar] [CrossRef]
- Zhi, S.Z.; Zou, X.H.; Bao, S.S.; Liu, J.; Yang, Z.C.; Shi, J.J.; Pan, P.; Qi, Y.Y.; He, J. A dual-potential electrochemiluminescence sensor for glutamate pyruvate transaminase detection based on AgNPs/N, S-GQDs modified paper-based electrode. Microchem. J. 2024, 206, 111442. [Google Scholar] [CrossRef]
- Cortes, F.R.U.; Falomir, E.; Lancis, J.; Mínguez-Vega, G. Pulsed laser fragmentation synthesis of carbon quantum dots (GQDs) as fluorescent probes in non-enzymatic glucose detection. Appl. Surf. Sci. 2024, 665, 160326. [Google Scholar] [CrossRef]
- Kumar, P.; Ravichandran, A.; Durgadevi, S.; Manikandan, V.; Song, K.S.; Prabhu, D.; Jeyakanthan, J.; Thirumurugan, D.; Muthusamy, G. Microwave-assisted green synthesis of GQDs from mesosphaerum suaveolens extract: Photocatalytic degradation and anticancer activity. Waste Biomass Valori. 2024, 15, 6539–6552. [Google Scholar] [CrossRef]
- Sanabria, A.E.R.; Narváez, S.U.; Portilla, J.V.G.; Rodríguez, G.A.T. Sonochemical synthesis of GQDs from coffee husk: Insights in aggregation mechanism, optimization and sustainability analysis. Heliyon 2025, 11, e41000. [Google Scholar] [CrossRef]
- Hidayat, R.N.; Widiyandari, H.; Parasdila, H.; Prilita, O.; Astuti, Y.; Mufti, N.; Ogi, T. Green synthesis of ZnO photocatalyst composited carbon quantum dots (GQDs) from lime (Citrus Aurantifolia). Catal. Commun. 2024, 187, 106888. [Google Scholar] [CrossRef]
- Yu, W.Z.; Li, Q.; He, L.Q.; Zhou, R.L.; Liao, L.F.; Xue, J.H.; Xiao, X.L. Green synthesis of GQDs for determination of iron and isoniazid in pharmaceutical formulations. Anal. Methods 2023, 15, 944–950. [Google Scholar] [CrossRef]
- Nejatpour, M.; Ünsür, A.M.; Yılmaz, B.; Gül, M.; Ozden, B.; Barisci, S.; Dükkancı, M. Enhanced photodegradation of perfluorocarboxylic acids (PFCAs) using carbon quantum dots (GQDs) doped TiO2 photocatalysts: A comparative study between exfoliated graphite and mussel shell-derived GQDs. J. Environ. Chem. Eng. 2025, 13, 115382. [Google Scholar] [CrossRef]
- Rajamanikandan, S.; Biruntha, M.; Ramalingam, G. Blue emissive carbon quantum dots (GQDs) from bio-waste peels and its antioxidant activity. J. Cluster Sci. 2022, 33, 1045–1053. [Google Scholar] [CrossRef]
- Wang, Y.; Wang, Y.; Liu, D.; Feng, Y.; Yang, D.; Wu, S.; Jiang, H.; Wang, D.; Bi, S. Study on the synthesis and electrochemical properties of nitrogen-doped graphene quantum dots. Materials 2024, 17, 6163. [Google Scholar] [CrossRef]
- Facure, M.H.M.; Schneider, R.; Mercante, L.A.; Correa, D.S. Rational hydrothermal synthesis of graphene quantum dots with optimized luminescent properties for sensing applications. Mater. Today Chem. 2022, 23, 100755. [Google Scholar] [CrossRef]
- Guan, J.; Liu, X.; Bai, N.; Wang, F.; Yang, Z.; Zhang, J.; Gao, F.; Zhang, P.; Wei, Z. Luminescence properties of GQDs and photocatalytic properties of TiO2/ZnO/GQDs ternary composites. J. Mater. Sci. Mater. Electron. 2023, 34, 2169. [Google Scholar] [CrossRef]
- Ateia, E.E.; Rabie, O.; Mohamed, A.T. Magneto-fluorescent core-shell Sr0.8La0.2Fe11CuO19 @ GQDs for the detection of metal ions. Appl. Surf. Sci. 2024, 678, 161123. [Google Scholar] [CrossRef]
- Li, Z.; Zhou, Z.; Wang, J.; Sun, Q.; Zhang, J.; Tao, T.; Fu, Y. Ratiometric fluorescence detection of doxorubicin by R-GQDs based on the inner filter effect and fluorescence resonance energy transfer. New J. Chem. 2023, 47, 3541–3548. [Google Scholar] [CrossRef]
- Zhou, P.; Xu, J.; Guo, J.; Hou, X.; Dai, L.; Xiao, X.; Huo, K. Driving multicolour lignin-based carbon quantum dots into selective metal-ion recognition and photocatalytic antibiotic decomposition. Green Chem. 2024, 26, 6005–6018. [Google Scholar] [CrossRef]
- Ma, X.F.; Li, J.F. Preparation of multicolour carbon quantum dots by hydrothermal method and their functionalization applications. J. Lumin. 2024, 266, 120296. [Google Scholar] [CrossRef]
- Chen, X.R.; Han, X.; Zhang, C.X.; Xue, Q.; Liu, X.L.; Zhang, J.H.; Liu, W.; Ragauskas, A.J.; Song, X.P.; Zhang, Z.Y. Synthesis of red, green, and blue carbon quantum dots and construction of multicolour cellulose-based light-emitting diodes. Small Struct. 2024, 5, 2300449. [Google Scholar] [CrossRef]
- Wang, Q.; Fu, X.; Huang, X.; Wu, F.Y.; Ma, M.H.; Cai, Z.X. A rapid triple-mode fluorescence switch assay for immunoglobulin detection by using quantum dots-gold nanoparticles nanocomposites. Sensor. Actuat. B Chem. 2016, 231, 779–786. [Google Scholar] [CrossRef]
- Soni, H.; Pamidimukkala, P.S. Green synthesis of N, S co-doped carbon quantum dots from triflic acid treated palm shell waste and their application in nitrophenol sensing. Mater. Res. Bull. 2018, 108, 250–254. [Google Scholar] [CrossRef]
- Sk, M.A.; Ananthanarayanan, A.; Huang, L.; Lim, K.H.; Chen, P. Revealing the tunable photoluminescence properties of graphene quantum dots. J. Mater. Chem. C 2014, 2, 6954–6960. [Google Scholar] [CrossRef]
- Zhu, S.J.; Zhang, J.H.; Qiao, C.Y.; Tang, S.J.; Li, Y.F.; Yuan, W.J.; Li, B.; Tian, L.; Liu, F.; Hu, R.; et al. Strongly green-photoluminescent graphene quantum dots for bioimaging applications. Chem. Commun. 2011, 47, 6858–6860. [Google Scholar] [CrossRef]
- Nurunnabi, M.; Khatun, Z.; Huh, K.M.; Park, S.Y.; Lee, D.Y.; Cho, K.J.; Lee, Y.K. In vivo biodistribution and toxicology of carboxylated graphene quantum dots. ACS Nano 2013, 7, 6858–6867. [Google Scholar] [CrossRef]
Disclaimer/Publisher’s Note: The statements, opinions and data contained in all publications are solely those of the individual author(s) and contributor(s) and not of MDPI and/or the editor(s). MDPI and/or the editor(s) disclaim responsibility for any injury to people or property resulting from any ideas, methods, instructions or products referred to in the content. |
© 2025 by the authors. Licensee MDPI, Basel, Switzerland. This article is an open access article distributed under the terms and conditions of the Creative Commons Attribution (CC BY) license (https://creativecommons.org/licenses/by/4.0/).