1. Introduction
With the increase in industrial activity, producing new materials and compounds on an increasing scale, there is a need to look for alternatives in the supply of raw materials to meet this demand. The search for renewable resources that make a significant contribution to the fine chemicals sector and its sub-sectors has been the goal of many research centers [
1,
2]. Unconventional methods of obtaining these substances have become a point of interest for the development of new technologies [
3,
4,
5,
6,
7]. In addition to this trend, more efficient waste management techniques are gaining ground, focusing on reducing the emissions of SO
x, NO
x, NH
3, CO, volatile organic compounds (VOCs), heavy metals and other inorganic contaminants into water and soil [
8,
9]. International agreements have sparked this discussion, emphasizing the need for adequate industrial development to manage the impacts of natural resource depletion [
10,
11].
In the context of urban solid waste (USW) that is eligible for bioprocessing, cigarette butts (CBs) are the world’s biggest waste source, with 4.5 trillion cigarette butts generated annually, a figure that is still expected to grow globally [
12].
One compound found in cigarettes that exhibits these characteristics is lignocellulose, particularly lignin, which is a component of tobacco and remains present in cigarette butts (CBs). However, when cigarettes are consumed, lignin undergoes various thermochemical phenomena such as combustion, distillation, pyrolysis, pyrosynthesis, condensation, etc. [
13,
14,
15,
16].
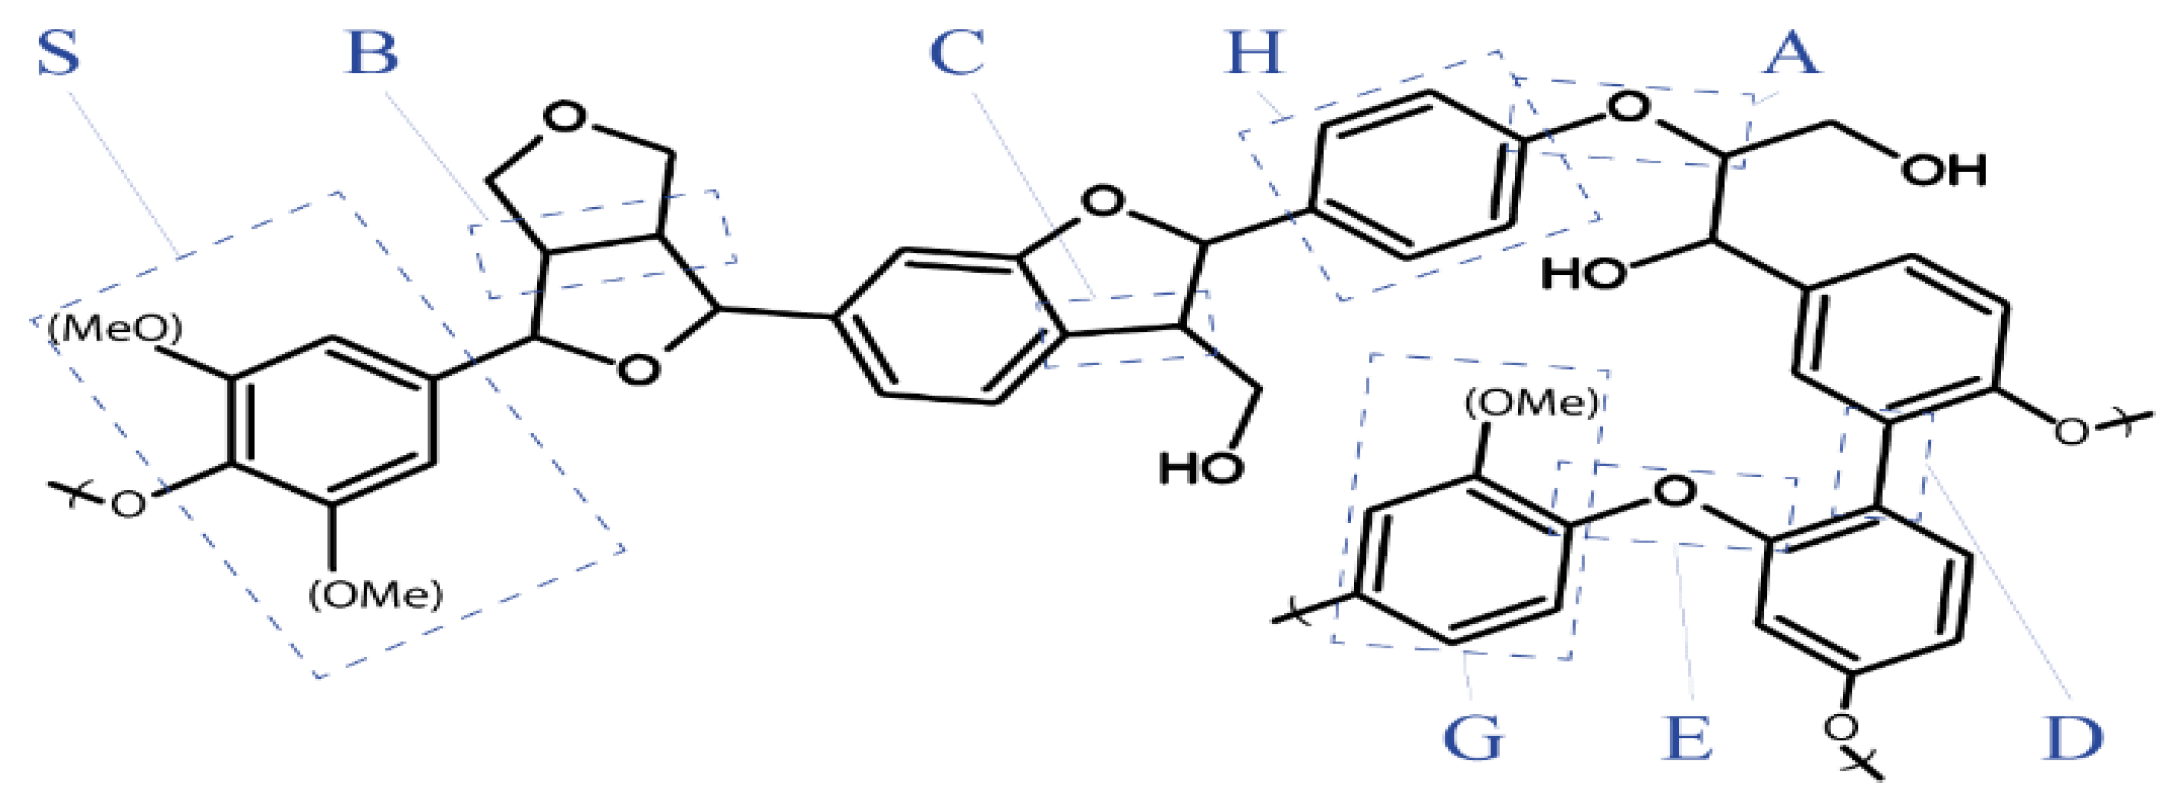
Lignin is a macromolecule responsible for providing stiffness and strength to plant tissues. It is the second most abundant biopolymer on earth after cellulose. The biosynthesis of this material consists of the formation of a three-dimensional network of monolignols, phenolic units linked by ether and carbon–carbon bonds. [
17,
18,
19], typically identified in
Figure 1, from A to E [
17,
18]. In tobacco, the lignin present in cigarettes is generally rich in syringyl (S) and guaiacyl (G) units, [
20,
21,
22] although their proportions may vary slightly between plant species or even within the same species.
Traditionally, lignin is an unwanted byproduct in traditional wood pulp production, which requires the development of efficient and environmentally friendly separation processes [
23,
24]. Conventional solvent extraction is the oldest technique and is still widely used in industry. The alkaline extraction of lignin is a less aggressive process for the environment, it is easier to recover other materials and it reduces the waste that needs to be disposed of [
25]. Therefore, a process for extracting lignin from alternative sources should take advantage of this alkaline pulping stage.
In Brazil, the CB recycling process developed by Teixeira et al. [
26] has proven to be highly efficient in the sustainable production of cellulosic mass. The patent for this process has been licensed to the company Poiato Recicla (São Paulo, Brazil), which has converted millions of CBs annually. However, the black liquor that forms part of the recycling cycle concentrates SSL left over from the process. Therefore, this solid fraction can still be redirected to a new stage of utilization, making the most of its potential for chemical conversion into molecules of greater interest, as mentioned above.
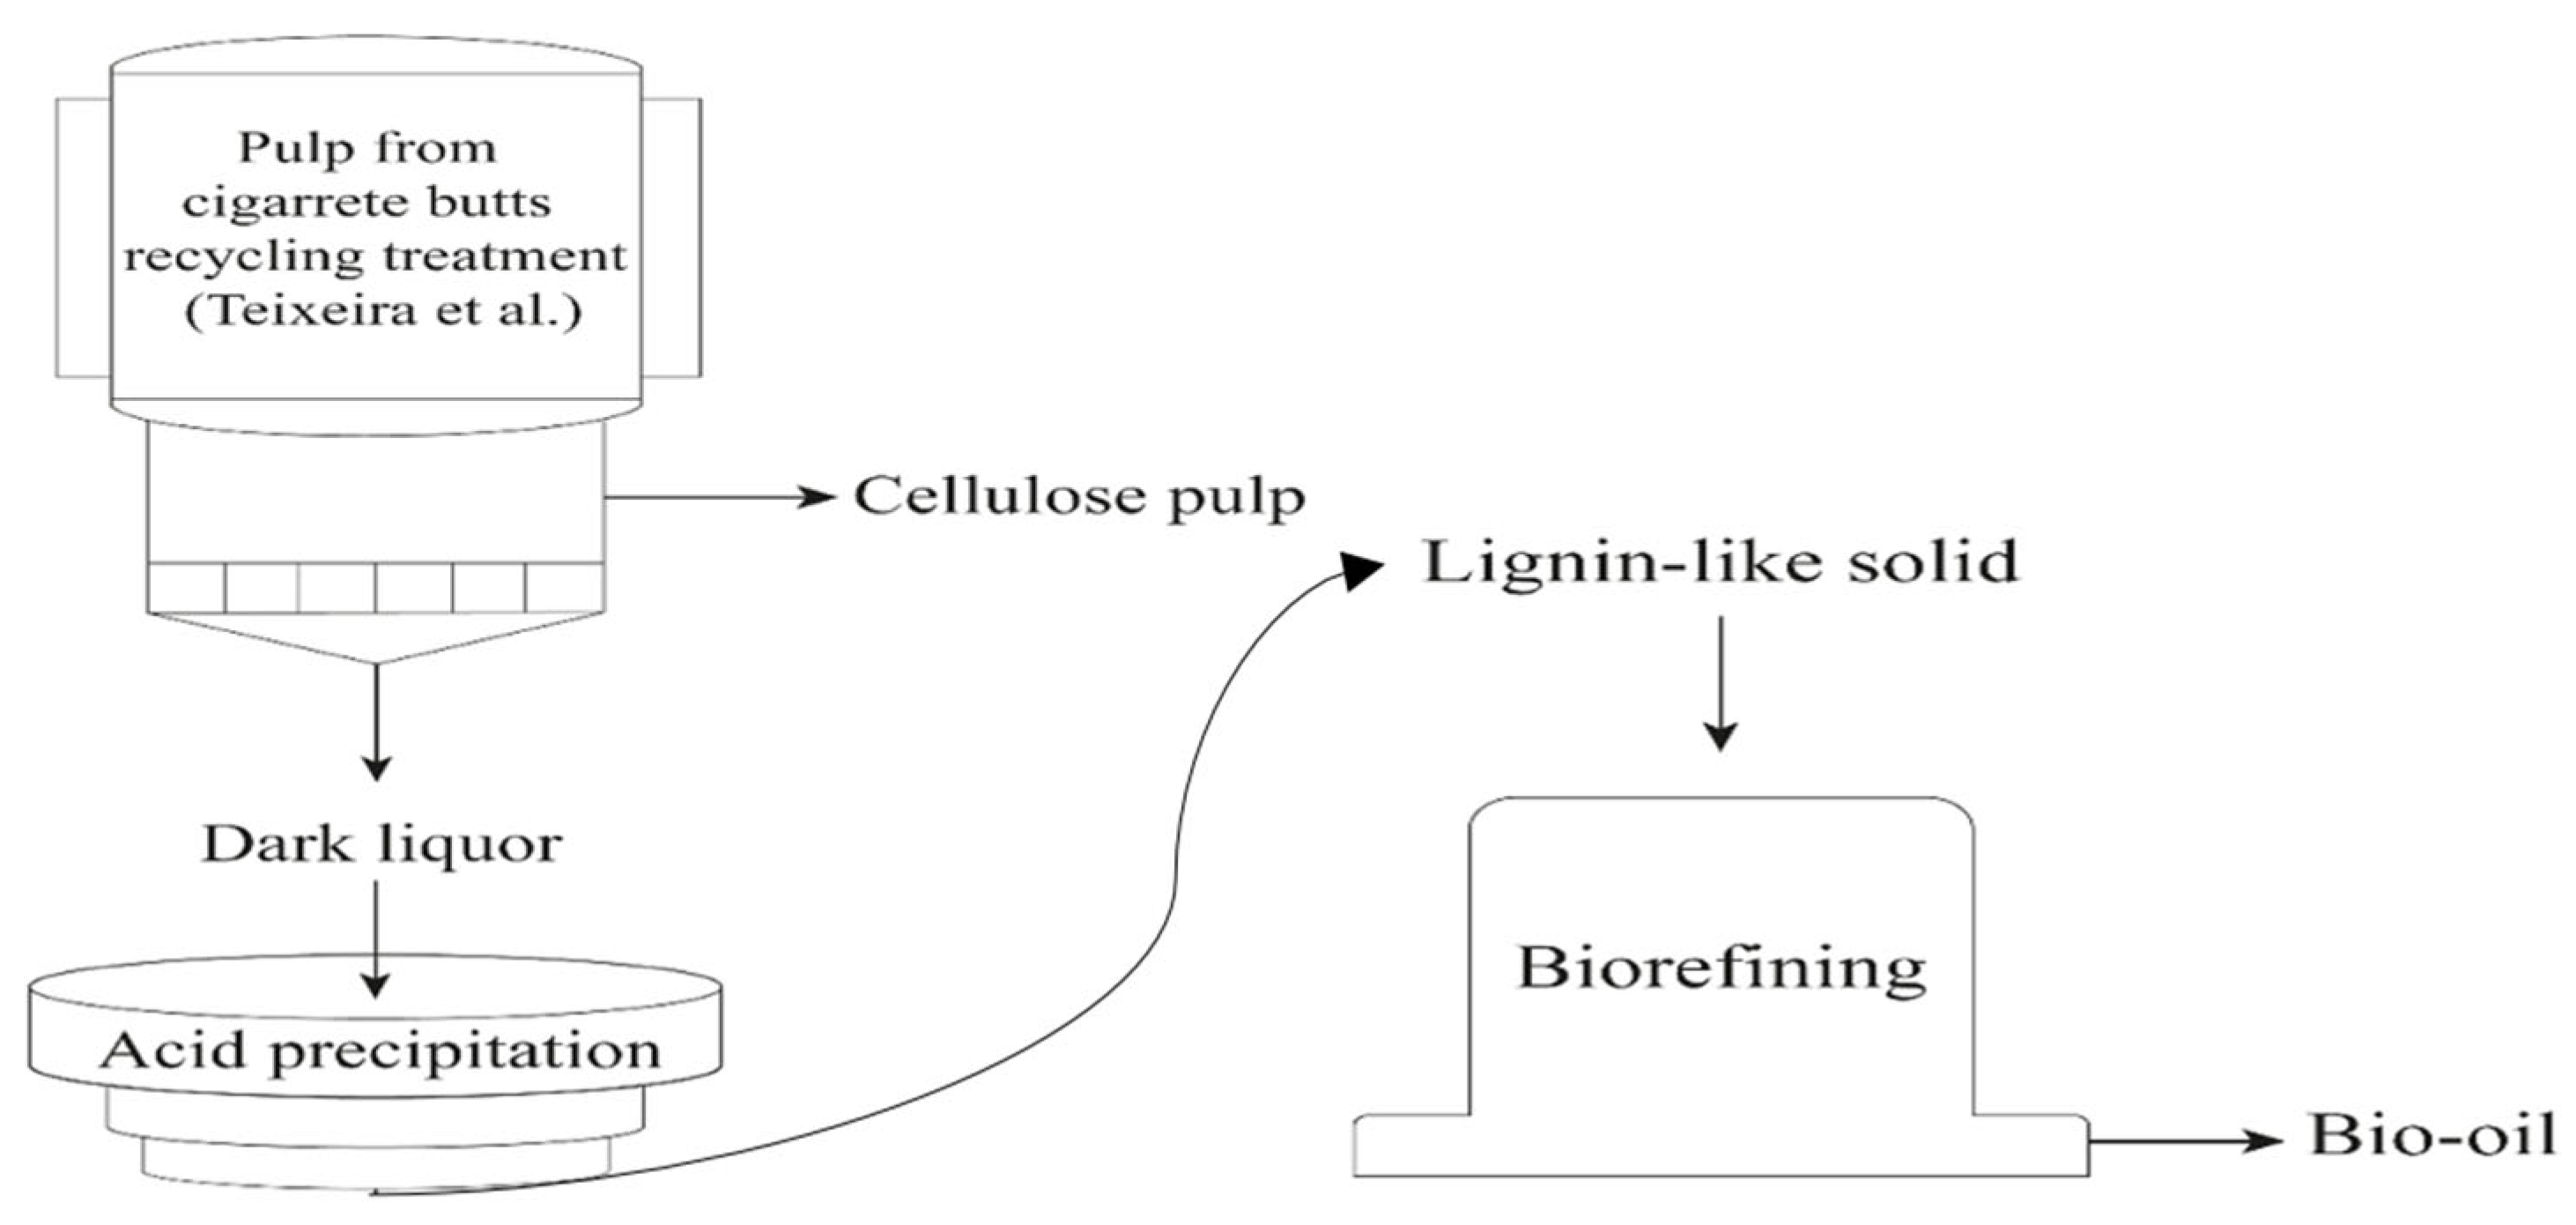
With the aim of combining an efficient process for converting lignin [
27,
28] with the recycling of CBs [
29,
30], the biorefining of SSL from CBs appears to be a viable suggestion [
31,
32]. The catalytic bioprocessing defined for SSL consists of the process of catalytic hydrogenation by transfer (CTH) [
33,
34,
35,
36]. This reaction occurs by donating H from the solvent in an inert atmosphere—free from a pressurized H
2 system—causing hydrogenolysis and the subsequent hydrogenation of the compounds originating from the SSL. In this work, isopropanol is the solvent for this purpose, as it is more chemically susceptible than other H donors [
34]. An overview of the process is shown in
Figure 2.
This study aims to characterize the products obtained from the recycled lignocellulosic fraction of cigarette butts, referred to as a lignin-like solid (LLS), produced via catalytic transfer hydrogenation (CTH), in order to improve their suitability for chemical and energy-related applications. Specifically, it investigates the chemical transformation of lignocellulose-rich waste under CTH conditions, contributing to a deeper understanding of its reactivity and potential for valorization—particularly in substrates that remain underexplored in the literature.
3. Results
3.1. Obtaining a Similar Solid of Lignin (SSL)
The percentage of the SSL obtained from the initial mass of CBs can vary in each batch. This is because there is the influence of factors associated with the conditions of the material at the time of collection, such as how the cigarette was consumed, humidity, the specifics of each manufacturer, geographical origin, contact with other waste, etc. In any case, the dry mass of the SSL obtained from 1.6 kg of CBs was approximately 102 g. It is possible to improve the efficiency of this stage by implementing a filter press system made of material resistant to alkaline attack.
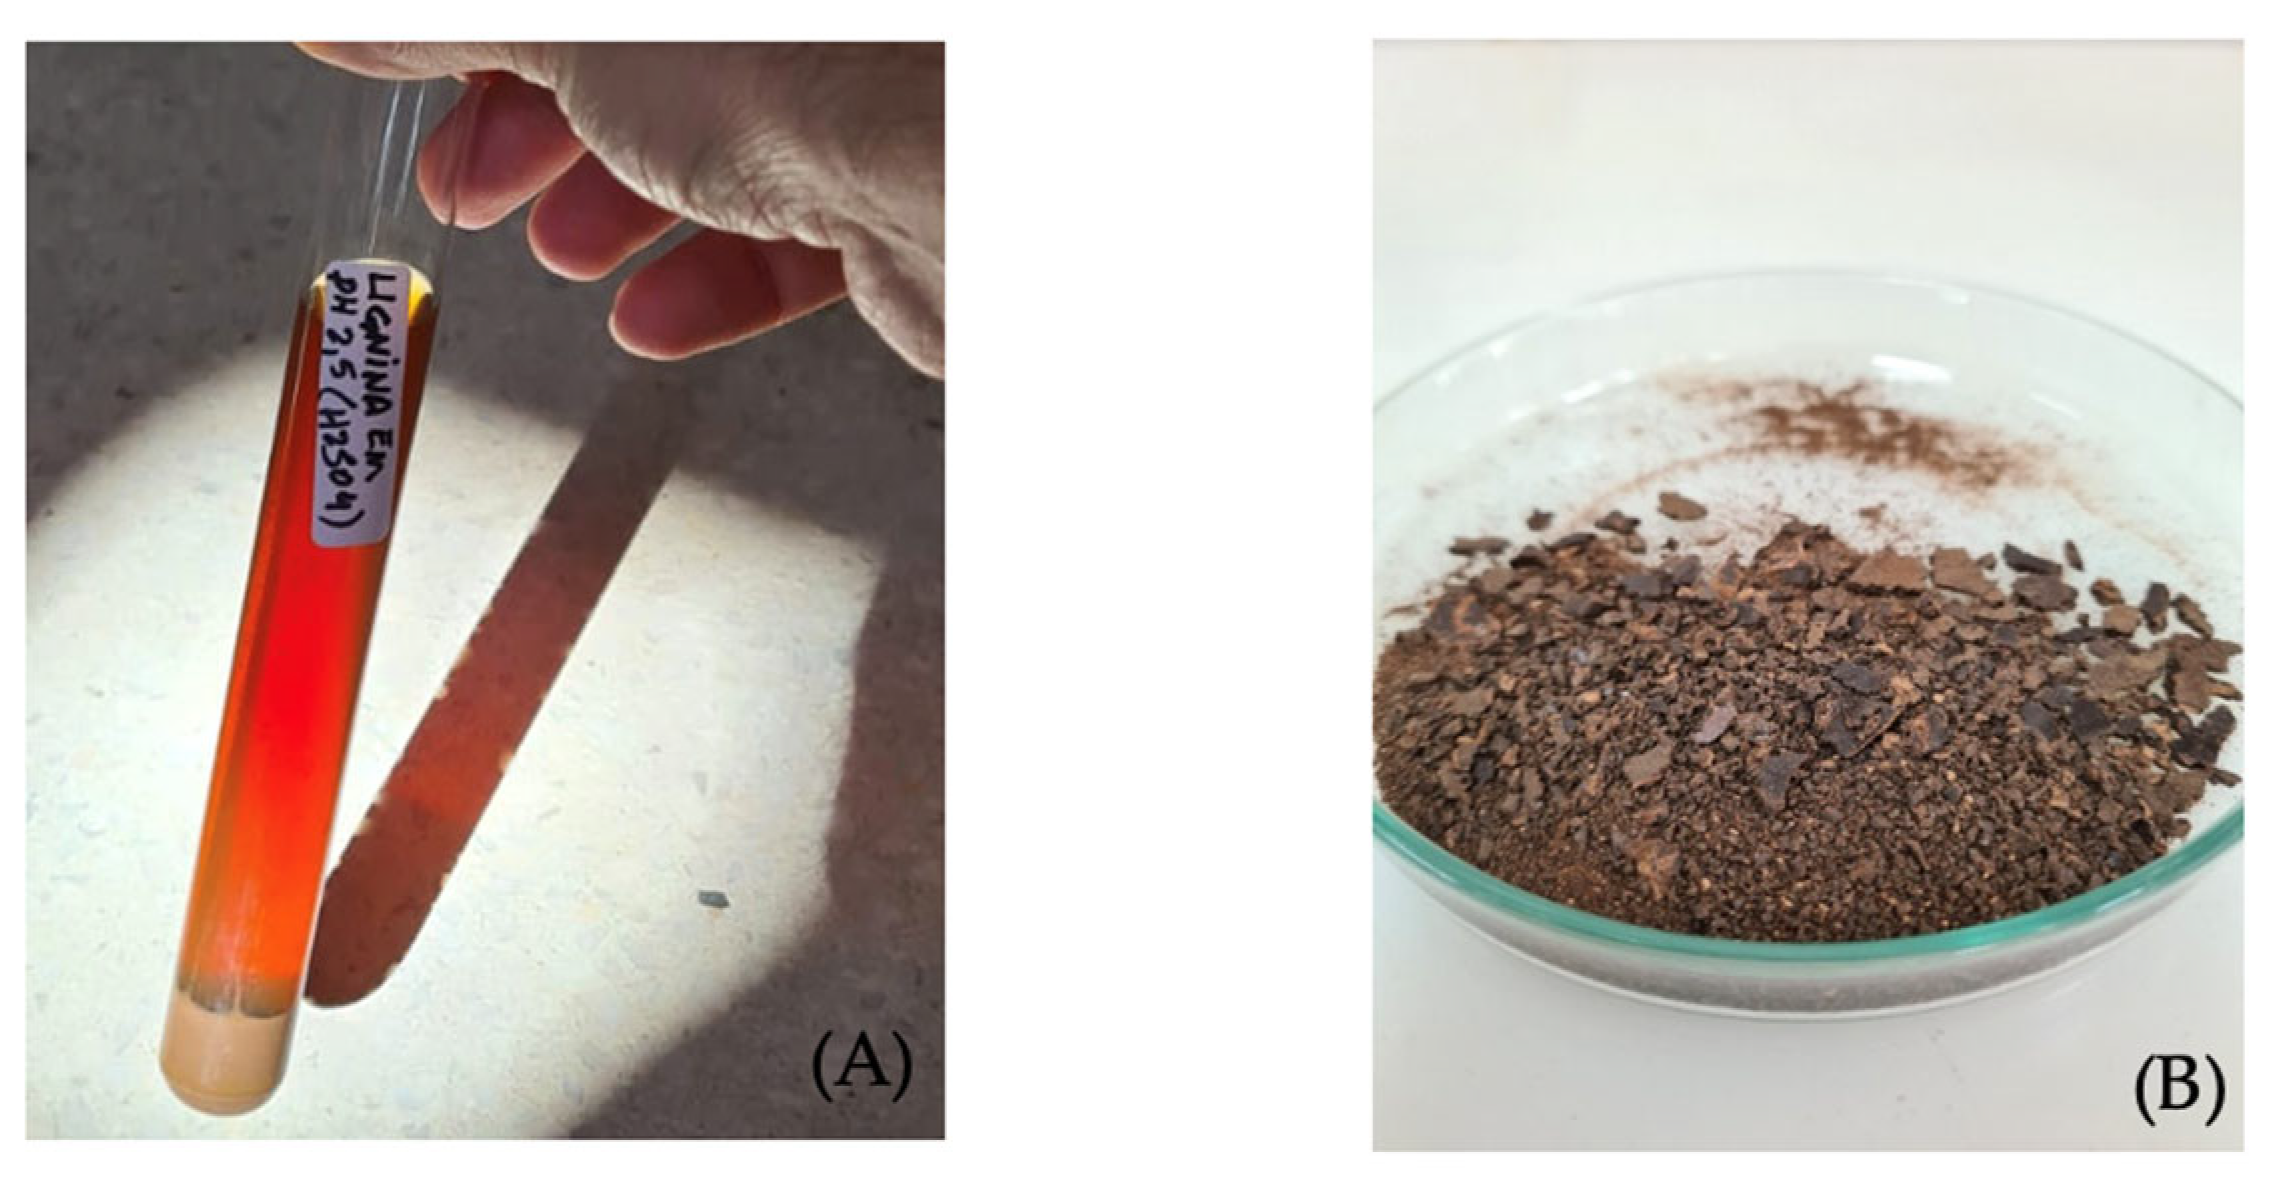
The precipitation work was initially carried out by adding a solution of concentrated hydrochloric acid (6N) based on previous work [
26]. However, it was realized that the presence of residual chloride ions in the precipitate samples could inhibit the hydrogenation reaction by contaminating the Raney nickel catalyst (
Figure 4A,B).
Other forms of chloride-free precipitation were therefore sought [
25,
40,
41,
42], which is why it was decided to use concentrated H
2SO
4 for this procedure. The result can be seen in
Figure 4A,B.
3.2. Analysis of SSL by Infrared Spectroscopy (FTIR)
For lignin samples that are extracted directly from the plant base, the main absorption band characteristic of different parts of the plant, have been studied for decades and the respective data published in widely accepted articles [
26,
43,
44,
45,
46,
47]. In the case of the SSL, infrared spectroscopy showed the presence of the monolignols that make up tobacco, since there was still unconsumed material from the leaves.
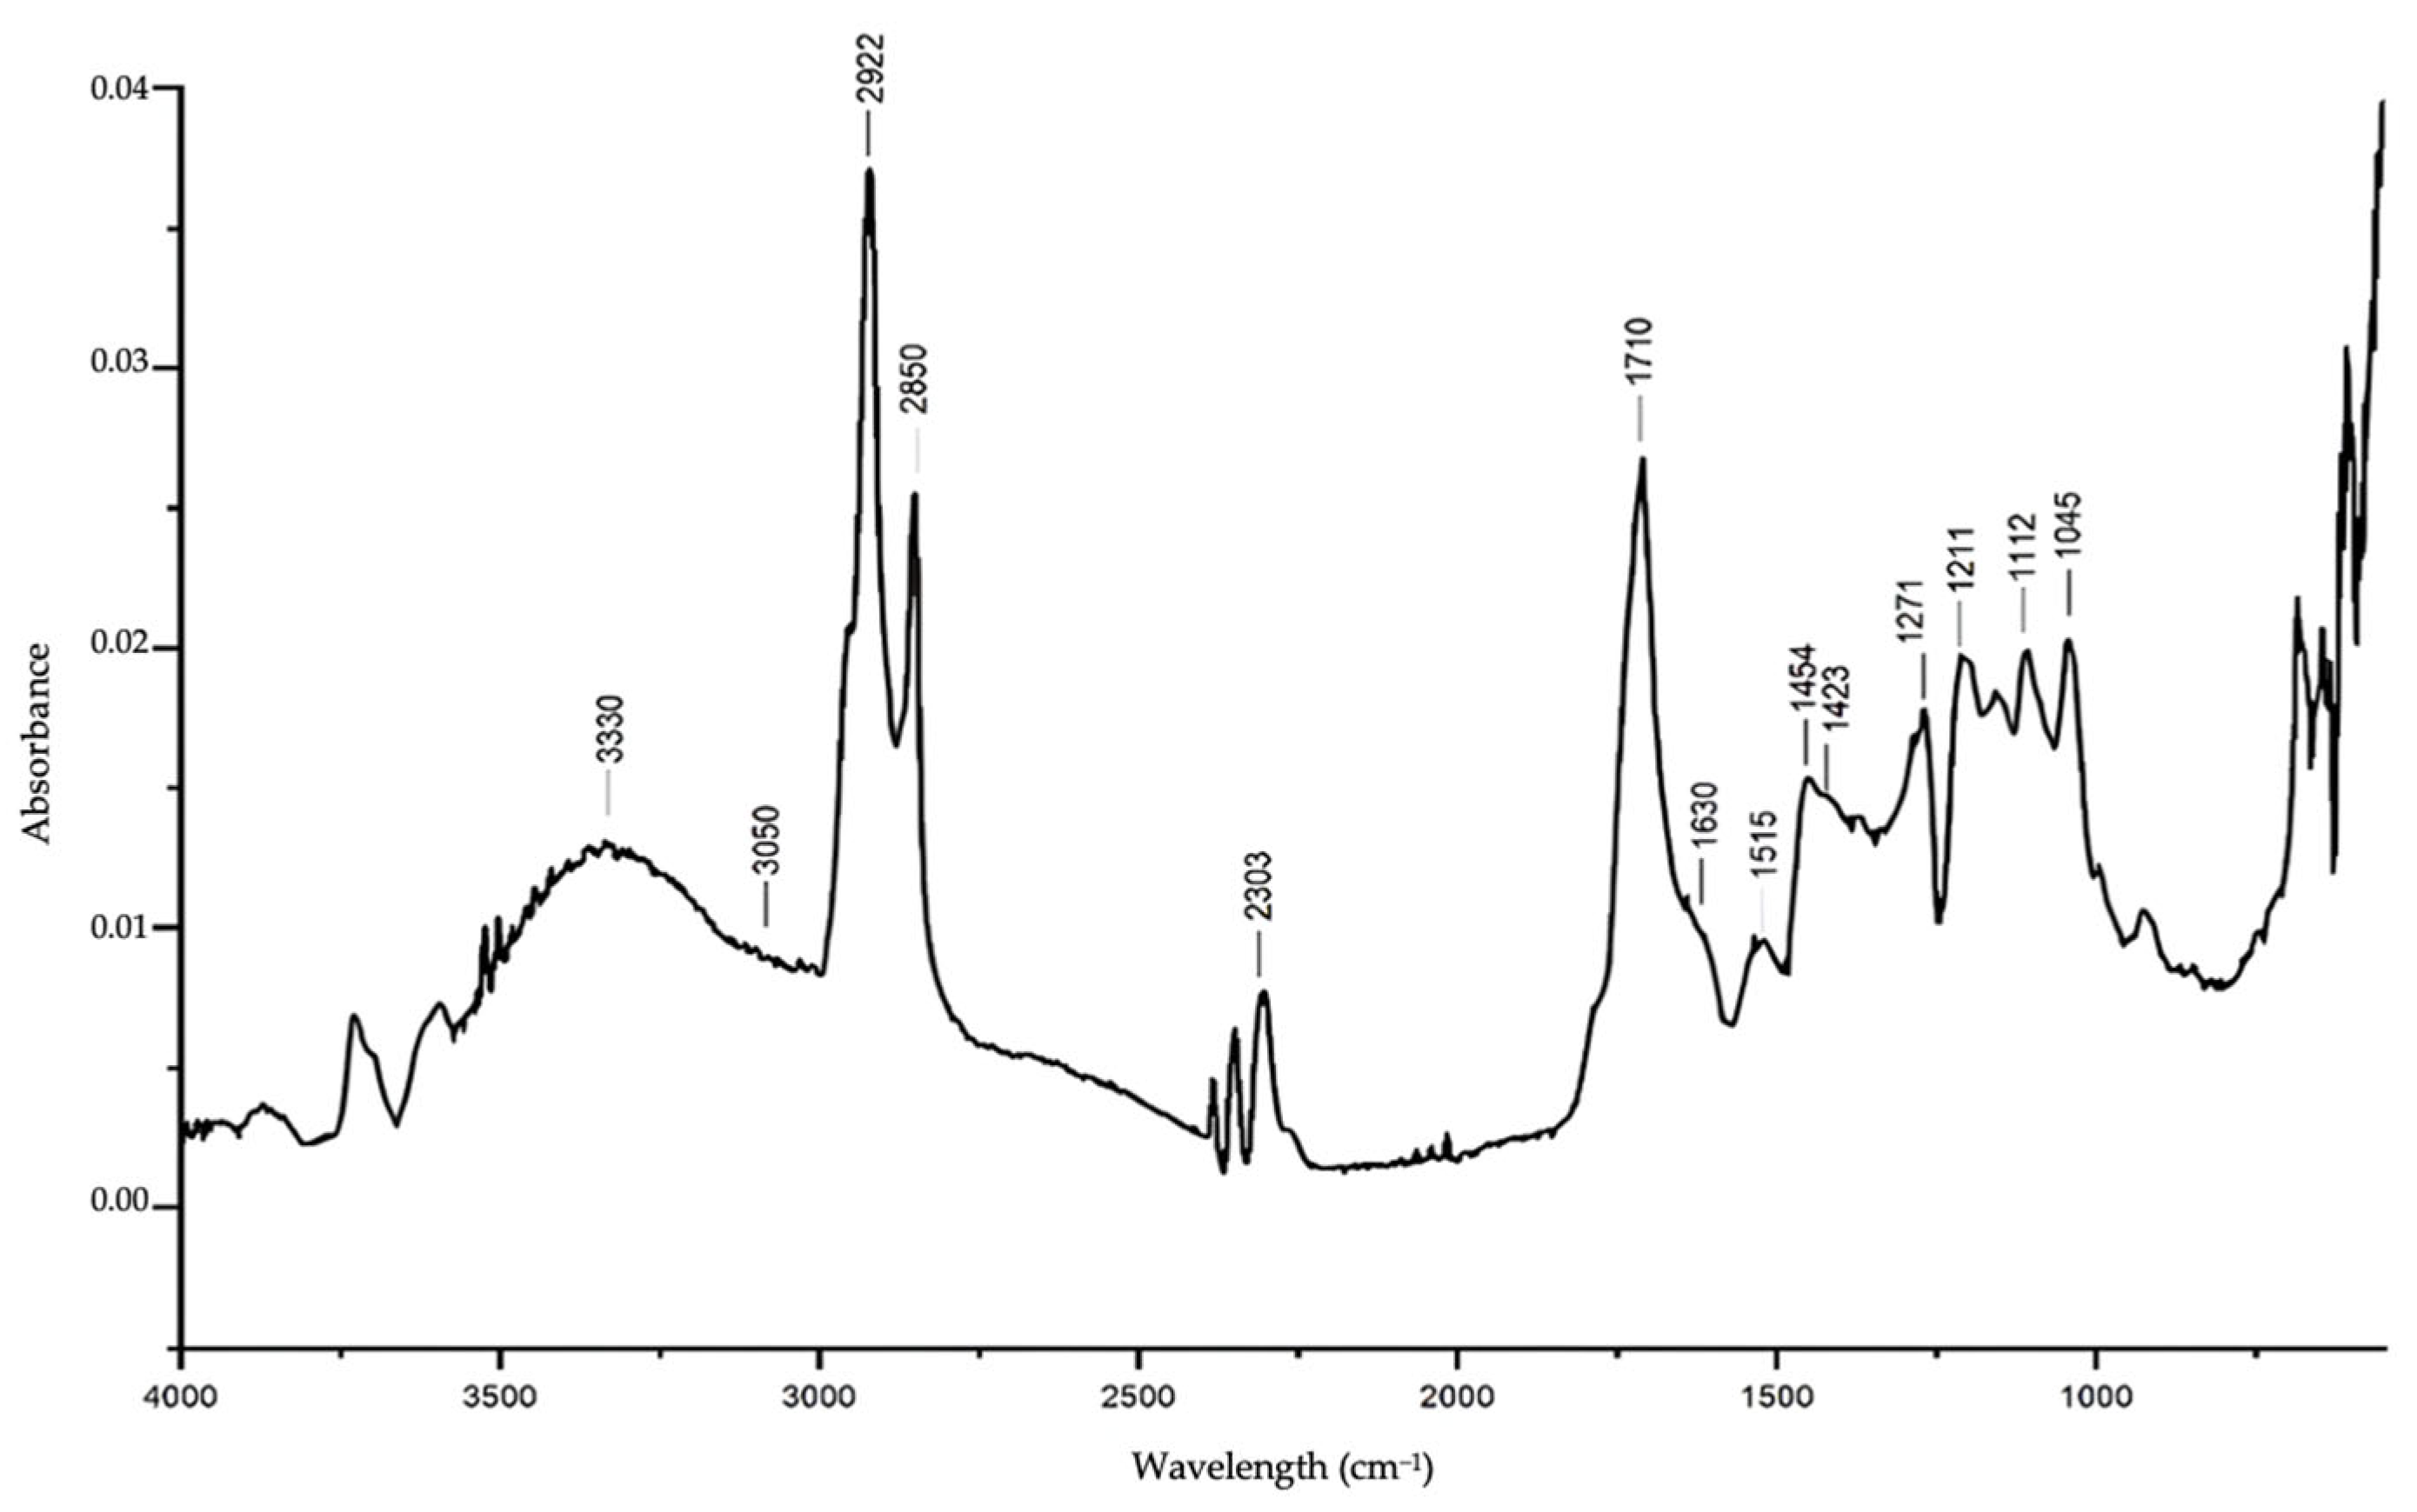
The spectrum in
Figure 5 shows an absorption band for –OH groups in the 3500–3150 cm
−1 region.
This band, which is more extensive than that of a pure lignin sample, suggests that this group forms a variety of bonds (aromatic and aliphatic) and that there are other hydroxylated substances in the sample. In addition, this broadening of the band as a kind of shoulder in the 3000–3100 cm−1 region also occurs due to C–H stretching in aromatic methoxyls and in methyl and methylene groups of side chains.
Even if the sample is contaminated with nitrogen compounds, which have N–H bond absorption bands in the 3300 cm−1 region, the –OH group band is more intense, causing overlaps. Normally, the ratio between the C–H/O–H bands in this region in pure lignins is low, suggesting that the target solid in this study, despite containing lignin, has a high degree of contamination with the other substances mentioned above. The bands located at 2922, and 2850 cm−1 correspond to C–H stretching in aliphatic methylene groups, which may originate from the pyrolysis of lignin and the structure of other contaminants such as carbohydrates and proteins.
Another important point is that the main bands of contaminants such as those mentioned above are largely overlapped by the more common bands of lignin and compounds with similar groups (derived from pyrolysis and other possible reactions). However, even with the difficulty of identifying these substances in the sample, there is a band at 2303 cm−1, which combined with others in the region of 3100, 2967, 1610, 1505 and 525 cm−1, suggests the spectral pattern that identifies nitrogen compounds present in cigarettes (nitrosamines, proteins, etc.).
It is possible to see a strong absorption band at 1710 cm−1 corresponding to the stretching of non-conjugated carbonyls and carboxyls, typical in lignin spectra. The shoulder with a medium absorption band at 1630 cm−1 corresponds to the stretching of conjugated carbonyls and carboxyls, as well as the C=C bonds of the aromatic skeleton of G- and GS-type lignins.
The bands observed at 1515, 1454 and 1423 cm−1 belong to the aromatic structure of various species of lignin, which are more expressive in the types that have G rings and mixtures of G and S rings.
The bands at 1271, 1211, 1112 and 1045 cm−1 correspond to the C–C, C–O and C=O stretches of G rings. Values slightly higher (1275 cm−1) suggest the same vibrational mode in mixtures of G and S rings. This region is usually analyzed together, as variations in the content of S, G and H rings cause changes in these bands, but maintain the fingerprint of this spectral window.
The solid sample corresponds to a mixture of compounds like lignin, as well as fragments of the pyrolysis caused by cigarette smoking, despite the presence of nitrogen compounds that precipitated along with the materials of interest.
Comparing
Figure 5 with the literature on the identification of the characteristic bands of lignin from herbaceous vegetables and tobacco [
47], we can see the influence of the vibrational modes of nitrogen compounds, explaining the differences in the wavenumber of the absorbance bands of lignin in the solid sample in question, when compared with the bands observed in pure tobacco lignin [
48,
49].
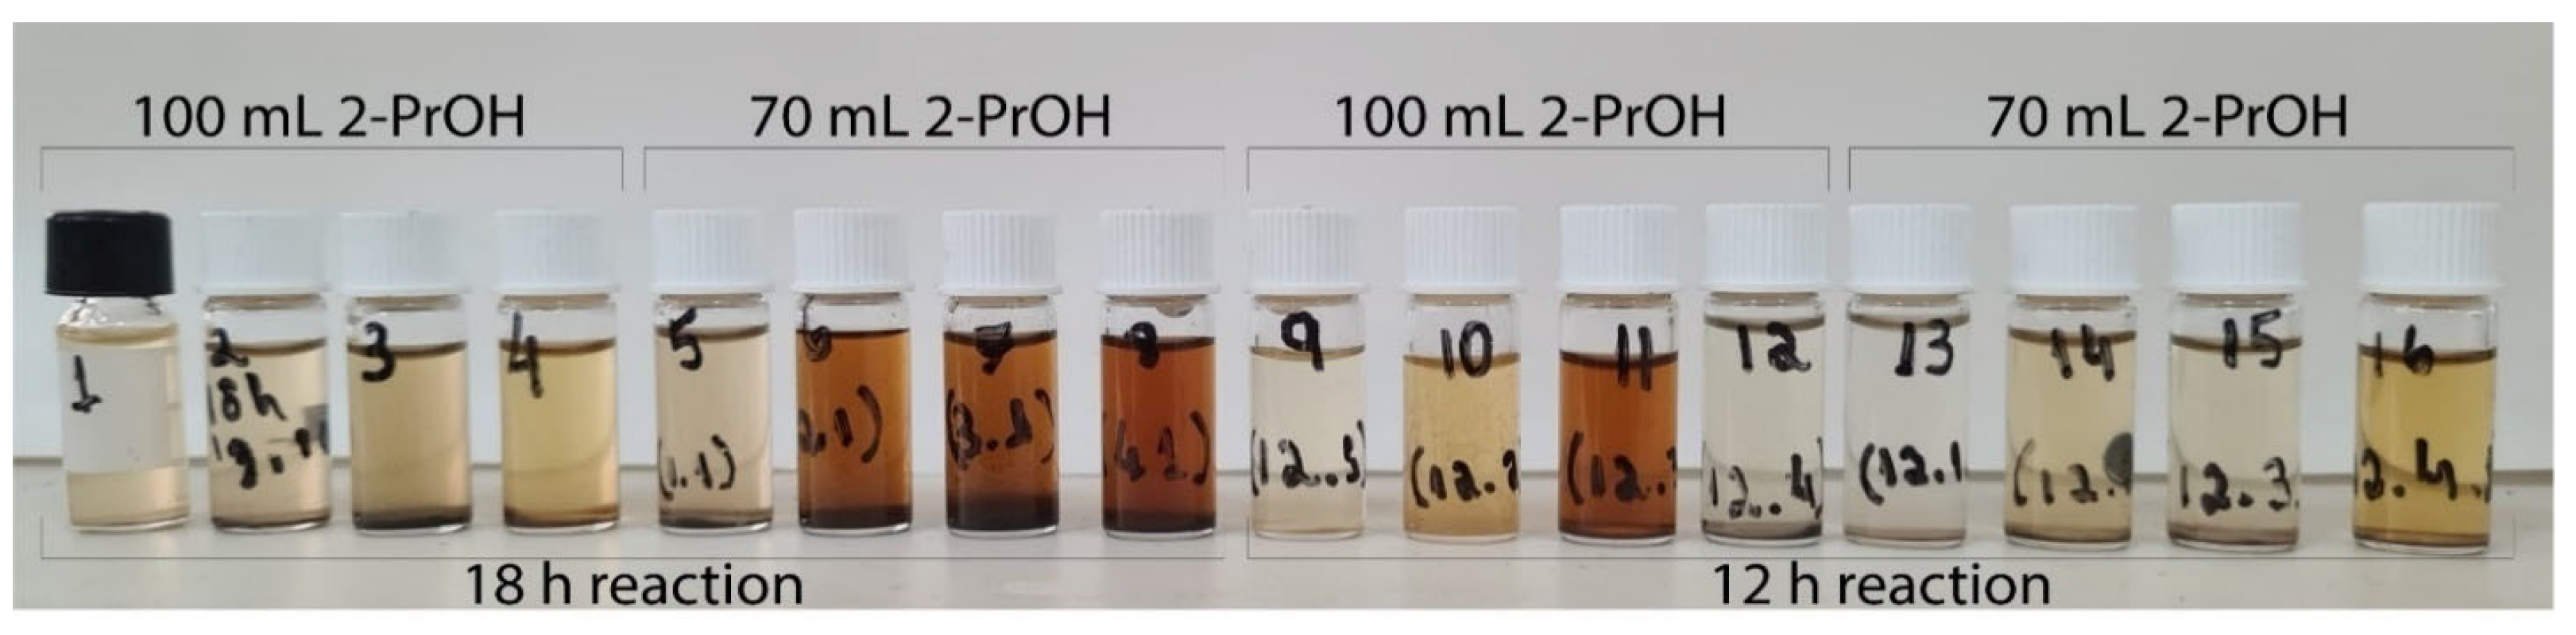
3.3. Catalytic Biorefining
The biorefining process took place through transfer hydrogenation reactions as described in
Section 2.2. Pre-filtered samples of the bio-oil obtained in each reaction are shown in
Figure 6. The reaction time and amount of SSL caused significant visual changes, even though each product was subjected to the same sampling conditions.
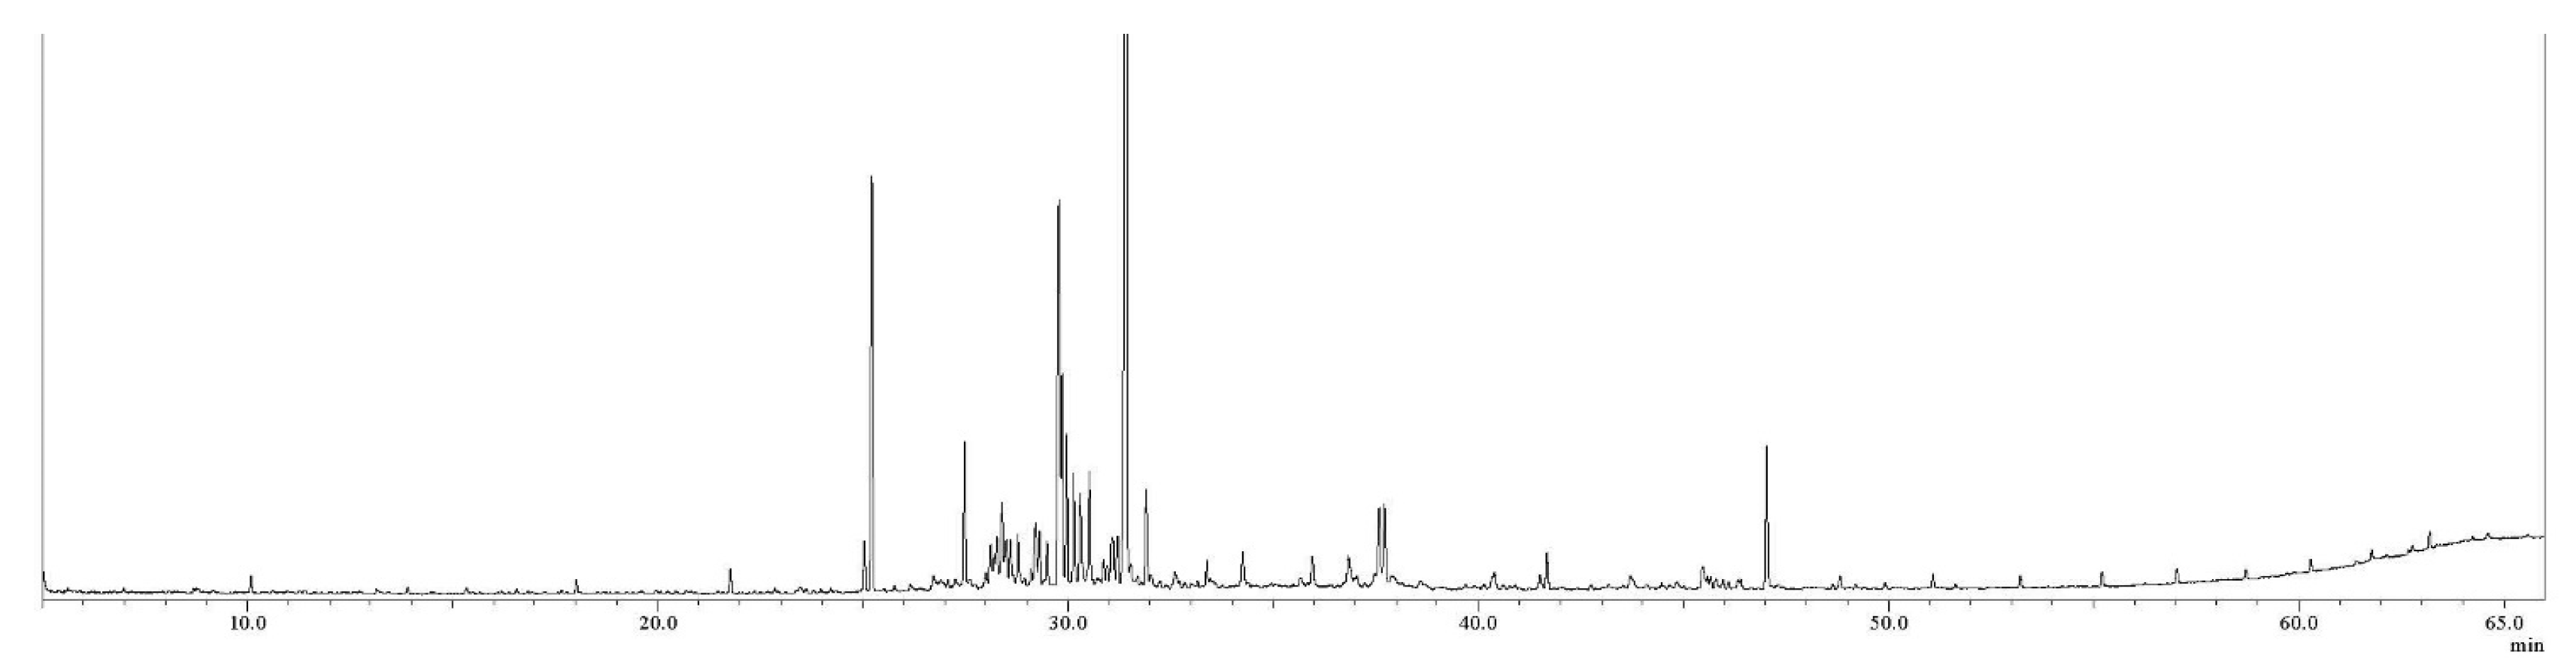
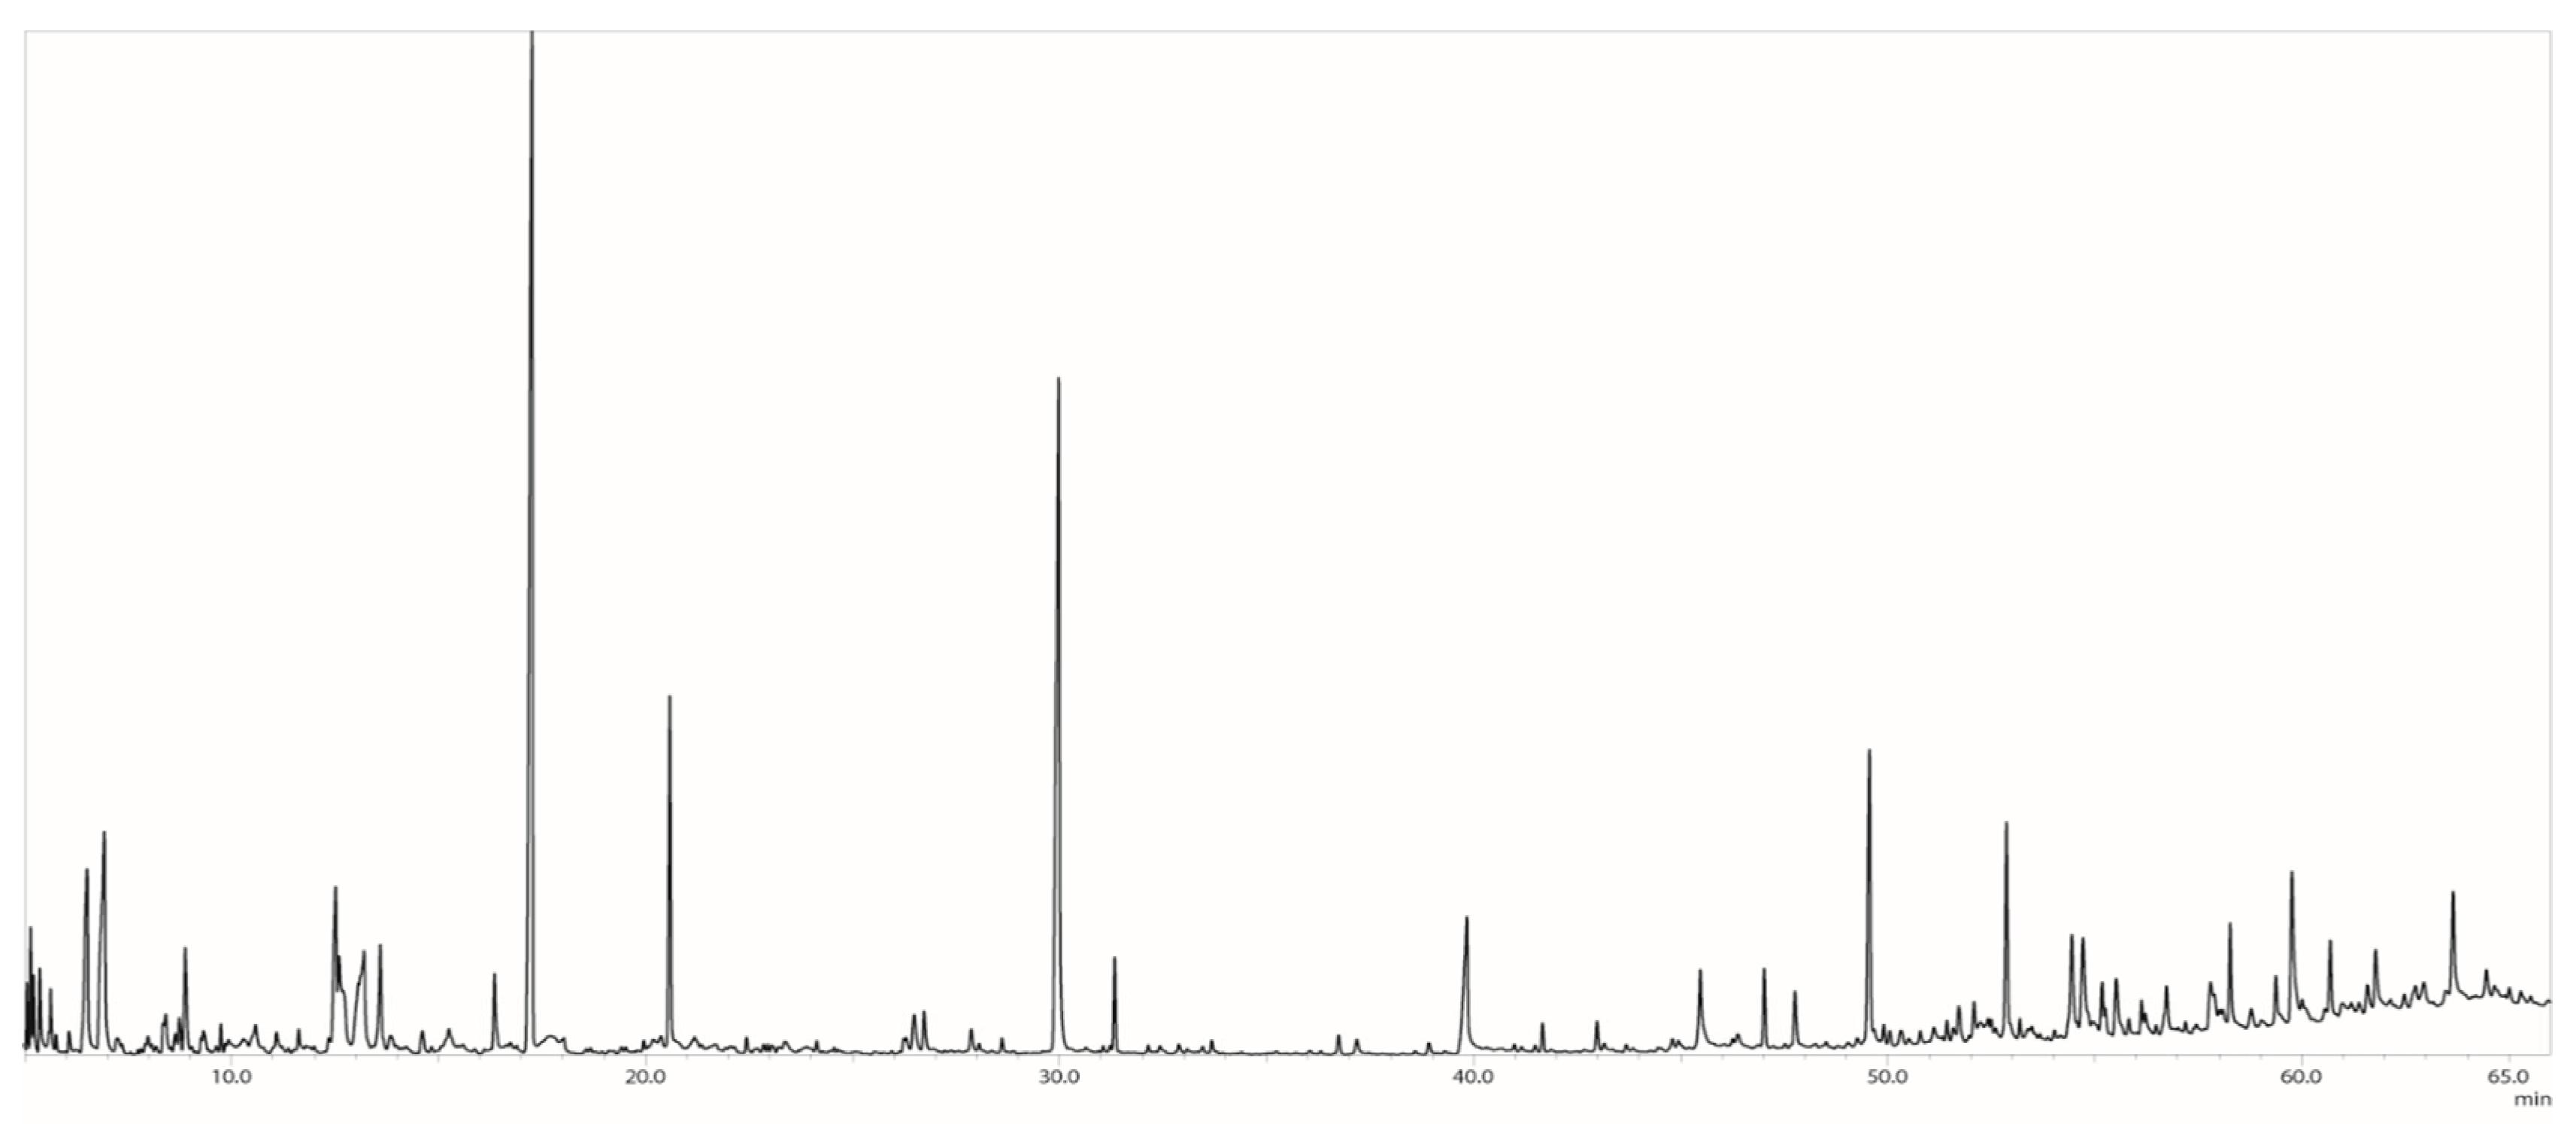
3.4. GCMS Analysis
The results of the GCMS runs are shown in
Figure 7. The r1 sample showed greater peak intensity than the other samples r2–r16. However, there were no significant differences in the positions of the chromatographic events detected. This points to the fact that the hydrogenation reactions take place in the same pathways, despite variations in the initial amount of reagents or the reaction times adopted.
As expected, the composition of the bio-oil was a complex mixture of isomers and compounds with very close retention times. This similarity of the compounds derives from breaks in the ethyl and aryl-ethyl bonds of the monolignols, as well as the lignin fragments still present in the SSL. A very representative group of these substances was detected in almost all the runs. The peaks were identified automatically using the LabSolutions software, version 4.45, combined with the NIST 17 libraries, using a peak integration algorithm developed for this work.
Figure 8 shows the main results collected from this analysis.
The relationship between the chromatographic peaks and the spectral data generated for each substance allows us to conclude that the area under each peak is proportional to the relative content for each detection.
To get a more comprehensive view of the results,
Figure 8 shows the results grouped according to the most important functional groups of the compounds identified in each sample. The similarity of the search carried out by the algorithm with the NIST library records gives a percentage of reliability of the results in each run.
In addition to carrying out an exhaustive examination of all the peaks in each analysis, the types of hydrocarbons present in the samples were investigated based on the GCMS data, as shown in
Table 2 for the r1 sample. Of the total hydrocarbons formed in the bio-oil, around 30% of the mixture is made up of cyclic and/or branched chain components, such as naphthalene derivatives, benzene, cyclohexane, bicyclic compounds and others with longer chains such as 1-1′-bicyclooctyl and stigmastane (percentages were calculated in relative and absolute terms). This fraction is similar to those of petroleum naphthas, which are light fractions commonly used to produce basic petrochemical compounds.
3.5. Effect of Reagent Concentration and Reaction Time
There was a predominance of hydrocarbons in almost all the runs, as well as a significant content of alcohols, esters, nitrogen compounds and ketones. This general behavior was due to the high level of hydrogenation of the starting material, evidenced by the formation of volatile compounds released shortly after the reaction, which were certainly oxygenated. This conclusion is in line with what was found by the high pressure recorded in the system at the end of each reaction (around 20 bar), even though it was subjected to an ice bath before the reactor was opened.
According to the arrangement of SSL concentrations in the samples, some pattern of behavior of the results according to this parameter was expected. This behavior was more pronounced in the classes of substances that dominated the samples, that is, hydrocarbons and nitrogenous substances. It should also be noted that the difference in the volume of isopropanol used also established different levels in the overall results, as did the reaction time. Therefore, what was noticed was a decrease in the hydrocarbon content because of the increase in the mass ratio of SSL/volume of isopropanol. It was also noticed that the nitrogen compounds competed with the formation of hydrocarbons, showing inversely proportional variations. This is most evident in r7 and r11, where the increase in the formation of one was reflected in the drop in the formation of the other. In a way, these results show that the presence of nitrogen compounds inhibits the catalytic activity of Raney nickel in promoting the deoxygenation of lignin and its fragments. In this sense, more oxygenated compounds such as esters are more favored when the level of nitrogen is higher, which occurs more clearly in r4, r9 and r11.
The effect of the reaction time was an easier parameter to determine. It is clear from the results that reducing the reaction time from 18 to 12 h (a drop of more than 30%) resulted in a drop in the hydrogenation level of the starting material. Although the pattern established from r1 to r8 resembles that observed from r9 to r16, the maximum values in the hydrocarbon content reached lower levels.
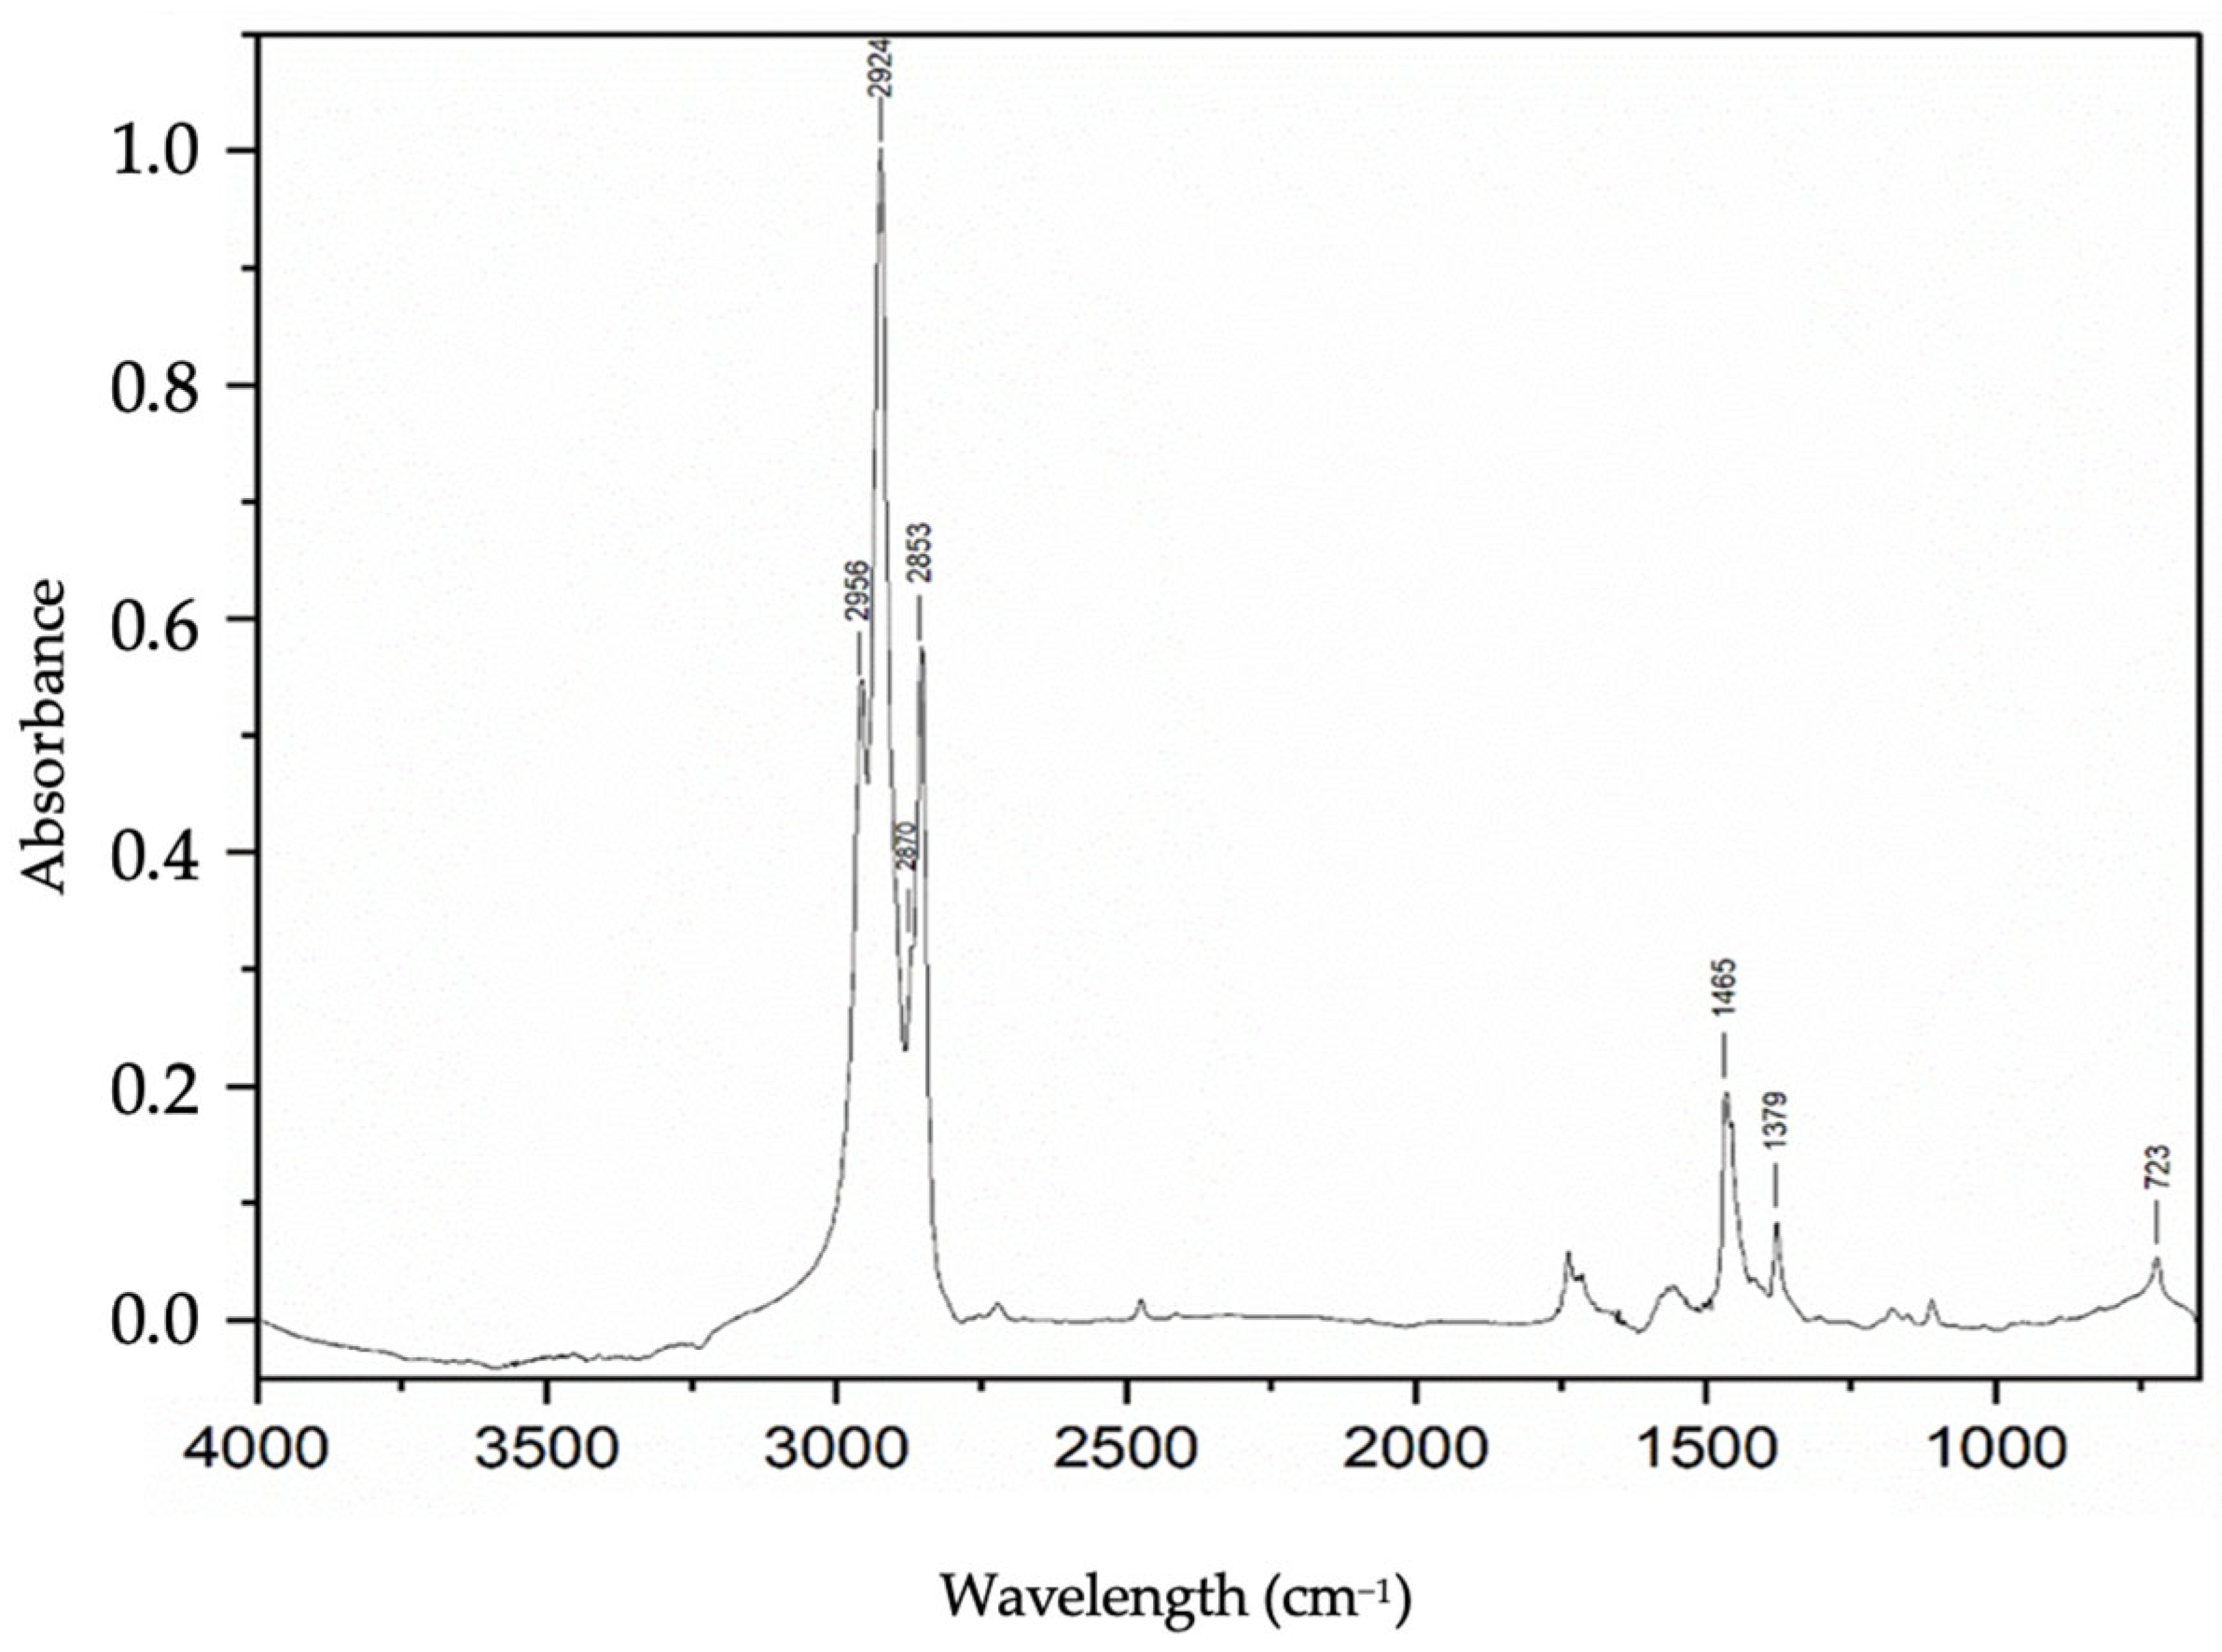
In addition to the chromatographic data obtained, a sample of r1 subjected to FTIR spectroscopy analysis using the same experimental procedure discussed in
Section 3.2 revealed a predominance of aliphatic hydrocarbons in relation to the other functional groups.
Figure 9 highlights the main characteristic peaks of long-chain alkanes, such as the band at 2956 cm
−1 corresponding to symmetrical stretching of C–H bonds, symmetrical stretching of –CH
2 groups at 2922 cm
−1, a shoulder at 2870 cm
−1 corresponding to symmetrical stretching of –CH
3 groups and symmetrical stretching of –CH
2 groups at 2853 cm
−1.
In addition to these signals, C–H bond bands are shown at 1465 and 1379 cm
−1 corresponding to symmetrical bending in the scissors plane. At 724 cm
−1, a band corresponding to –CH
2 group bending was detected. The higher concentration of these compounds made it easier to interpret the spectrum from the data available in the literature [
50] and corroborated the information obtained by GCMS. The absence of bands in the region above 3000 cm
−1 and other bands referring to the stretching of C=O groups that were detected in the SSL and discussed in
Section 3.2 points to a high level of hydrogenation in the bio-oil formation process, albeit semi-quantitatively.
3.6. Effect of the GCMS Sensitivity Parameters
Different from studies that use more than one chromatographic column to characterize complex mixtures, such as the one carried out by Ferrini [
27], the GCMS analyses were detected by MS in a system with a single column. Therefore, the analysis method needed to have a sensitivity such that the maximum number of peaks could be resolved satisfactorily. For this stage, the sensitivity of the instrument and the detection range of the MS were restricted to the range of compounds that were theoretically consistent with the result of the hydrogenation of lignin fragments.
This made it possible to read peaks that could be identified with good precision. However, the high sensitivity set for the peak processing algorithm and the MS detector included signals with similarity to the NIST library below 90%. Parameters associated with the slope of the tangent line at the start of the chromatographic event and the height of the peak increase the propagation of error in some analyses.
This prevented some patterns in the results from being easily interpreted in the order r1 to r16. This effect can be seen mainly in the behavior of samples r7 and r11 in relation to the adjacent samples. In the expected behavior pattern for hydrocarbon formation, r7 showed a higher value and r11 a lower value. In any case, there is a general periodicity in the behavior of the production of the majority compounds (hydrocarbons) as a function of the initial concentration of the SSL, according to the volume of 2-PrOH used.
3.7. Comparisons with Reaction in H2 Atmosphere
The hydrogenation test of the SSL using molecular hydrogen was also carried out. The characterization of the complex bio-oil mixture formed allowed a comparison of the behavior of the SSL in terms of the products that can be obtained by this process. In addition, the efficiency of traditional catalytic methods applied to this type of material could be compared to transfer hydrogenation. The reaction parameters were the same as for the procedure carried out in r1 (0.5 g SSL, 5 g catalyst, 18 h reaction), replacing the H donor solvent with ethanol, given its low reactivity and low catalyst inhibition [
34]. The pressure of the H
2 atmosphere was initially set at 30 bar.
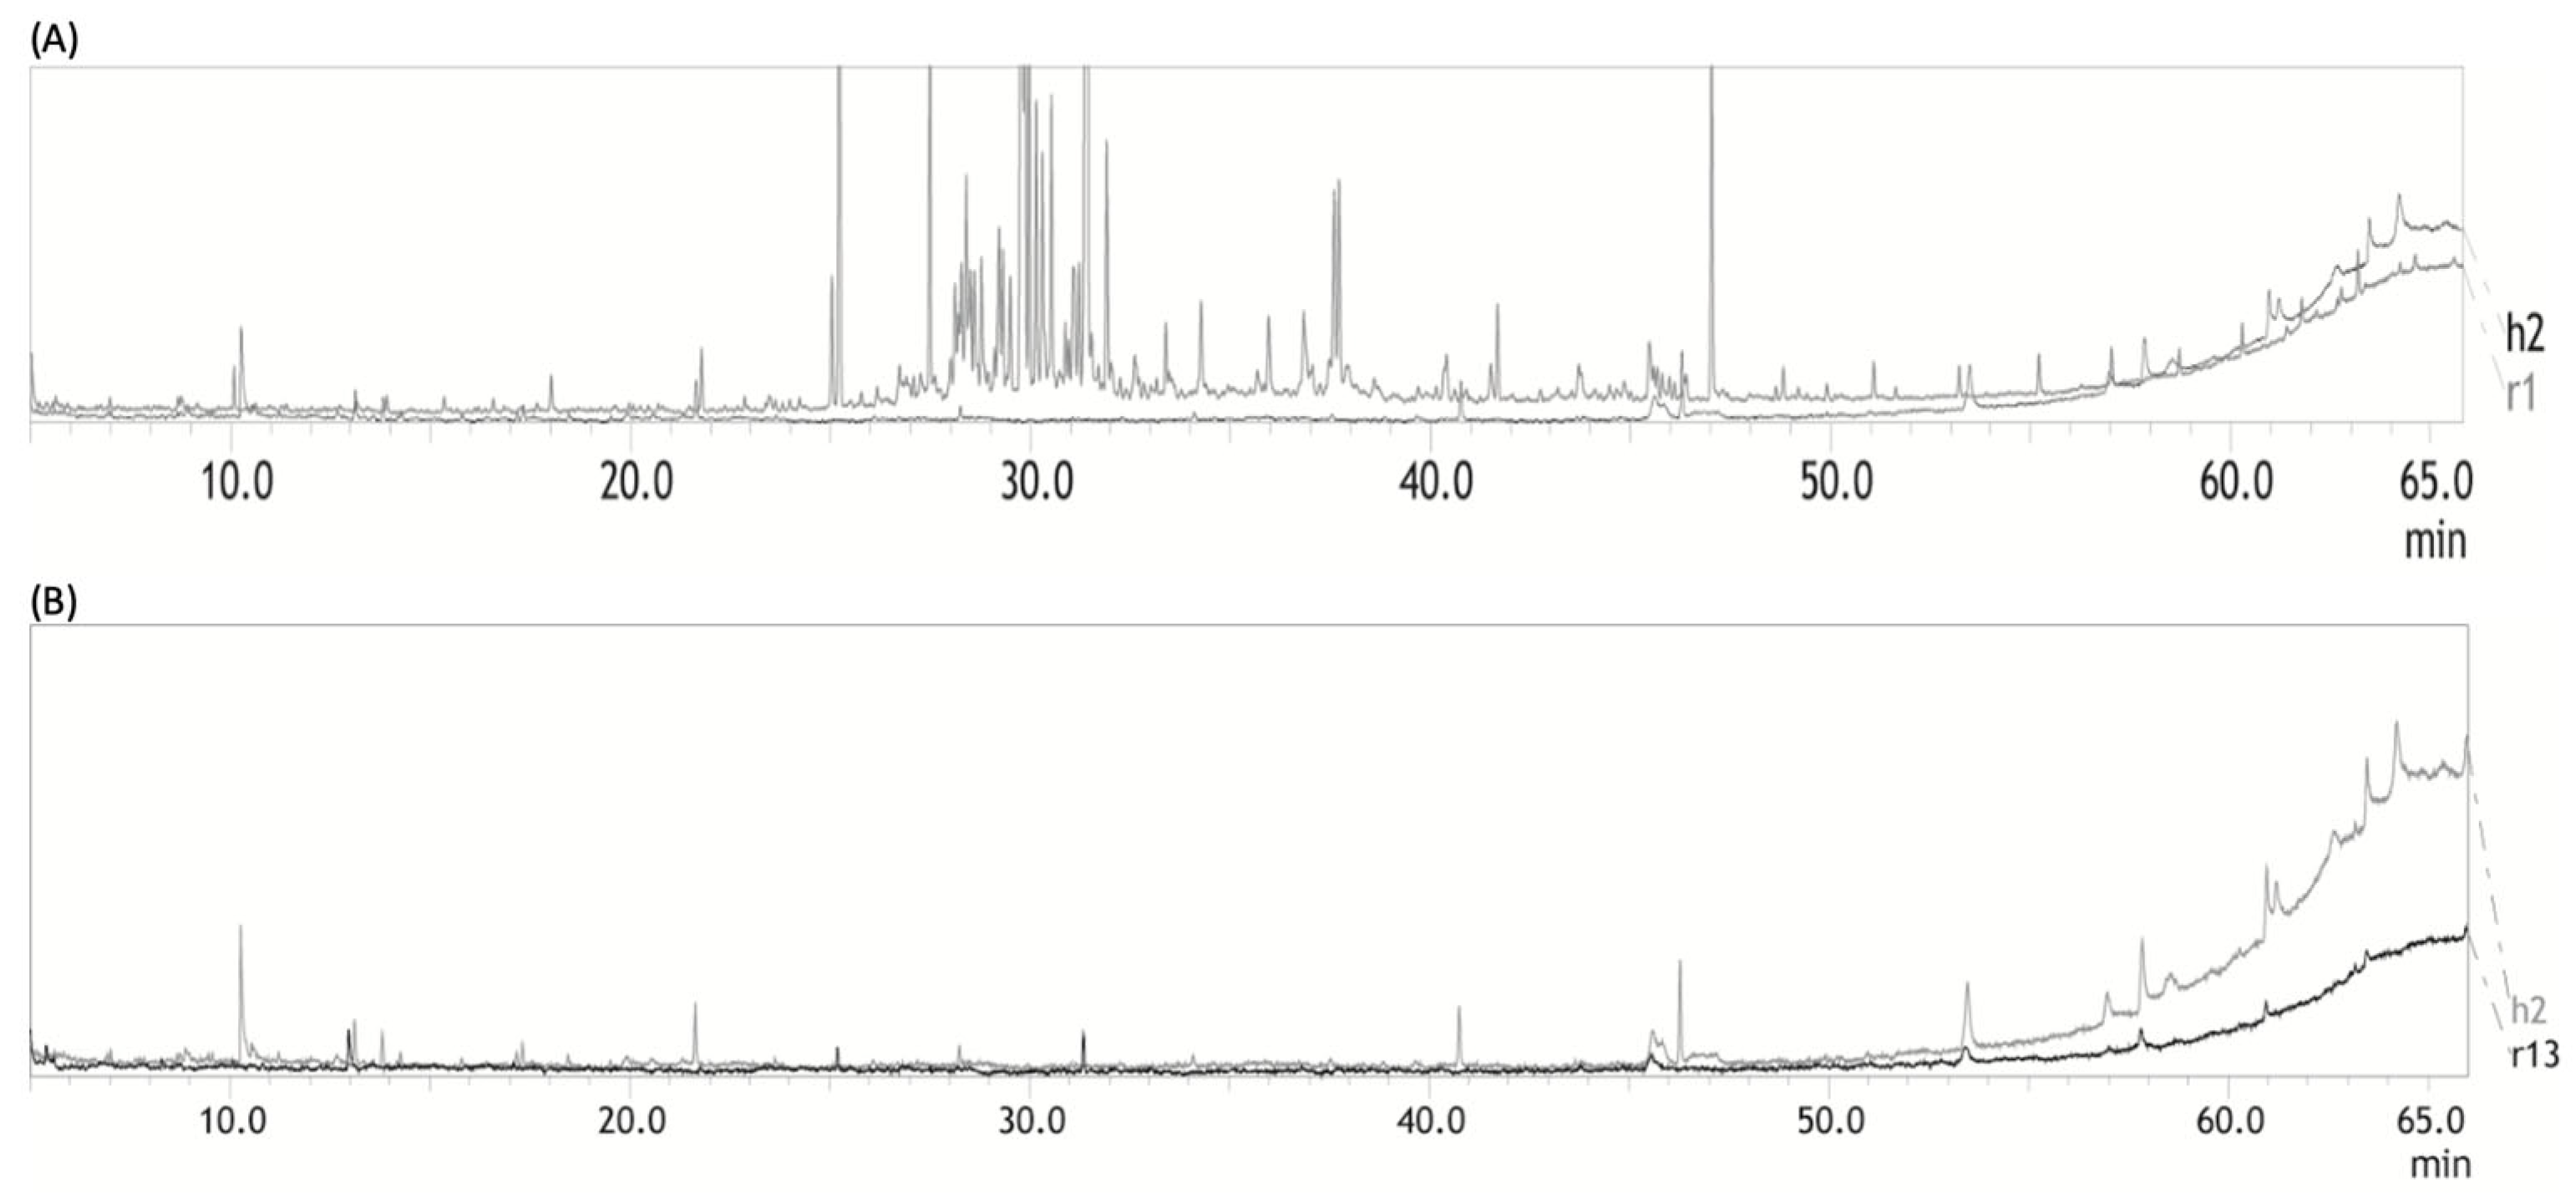
Figure 10A compares the products detected in this reaction (h2) by GCMS analysis, using the same spectroscopic analysis and peak identification parameters used in reactions r1 to r16. The intensity of the peaks in h2 was lower, even though the sample preparation followed the same analyte concentration thresholds used for r1. Overall, only r13 showed a less defined chromatogram than h2, as shown in
Figure 10B. Although the algorithm identified the h2 peaks with a degree of reliability of around 90%, a smaller group of compounds was recorded. It should be noted that the pressure at the end of the hydrogenation process, after cooling the reactor and before opening it, was between 42 and 44 bar. This level was higher than that of the reactions with isopropanol, which reached a final pressure of around 10 bar. This shows a greater loss of material in the form of volatile compounds and indicates that there was another reaction route for h2, which contributed to a bio-oil with a lower number of components.
The highest concentration in h2 was of esters and nitrogen functional groups, corroborating the proposal of a different reaction route for this process, compared to the products identified in r1 to r16, which were mostly hydrocarbons. Regarding the efficiency of this type of hydrogenation, the higher content of oxygenated compounds revealed a lower degree of hydrogenation compared to that in r1. Even compared to the few results from r13 in
Figure 9 (mostly hydrocarbons), the h2 process revealed a lower degree of hydrogenation.
3.8. Comparison with Another Source of Lignin
The most efficient reaction conditions and characterization procedures in this work were also tested with wood (w1). An amount of 17 g of wood in the form of sawdust (a mixture of species belonging to the Pinus genus) and 5 g of Raney nickel were suspended in 100 mL of isopropanol. In this reaction, much of the method developed by Ferrini et al. [
27] was used, with the main differences being a smaller number of reaction steps and a more direct analysis in GCMS. The autogenous pressure at the end of the process was similar to that in R1-R16, showing the same mass loss by volatile compounds. The result of the GCMS analysis of sample w1 is shown in
Figure 11.
The peaks of w1 were identified in the same way as that in samples r1 to r16. There was a greater number of peaks and a greater variety of functional groups, where the percentage relative to the peak integration areas and the reliability with the NIST library are shown in
Table 3.
Some of these results differed from those of Ferrini et al. [
27], mainly in the level of hydrogenation observed. This difference was mainly due to the reduction in the number of steps in the reactor with the solvent and Ni Raney, where the material was first hydrogenolyzed for subsequent hydrogenation and bio-oil formation. The absence of water in the solvolytic medium used in this work also reduced the efficiency of the hydrogenolysis process, which helps to cleave the α-O-4 and β-O-4 bonds in lignin.
These two factors meant that most of the bio-oil compounds in the w1 sample were phenolic compounds and aromatic hydrocarbons. In addition to these two, other structures with various conjugated ether and hydroxyl groups were also the most expressive, showing that the process only allowed the initial stage of lignin breakdown.
It is important to note that this result corroborates the proposal that a large part of the lignin present in CBs already undergoes pyrolytic breakdown when cigarettes are consumed, which makes the process developed in this work feasible to obtain a higher degree of hydrogenation in just one step in the reactor and without the presence of water.
The formation of compounds with functional groups different from those found in r1 to r16 was due to the nature of the plant matrix used, which contained parts of the sap and other plant nutrients that are absent in the pre-treated tobacco leaves used to make cigarettes. In addition, the alkaline pulping and acid precipitation used to obtain the solid used in this study eliminates most of these compounds.
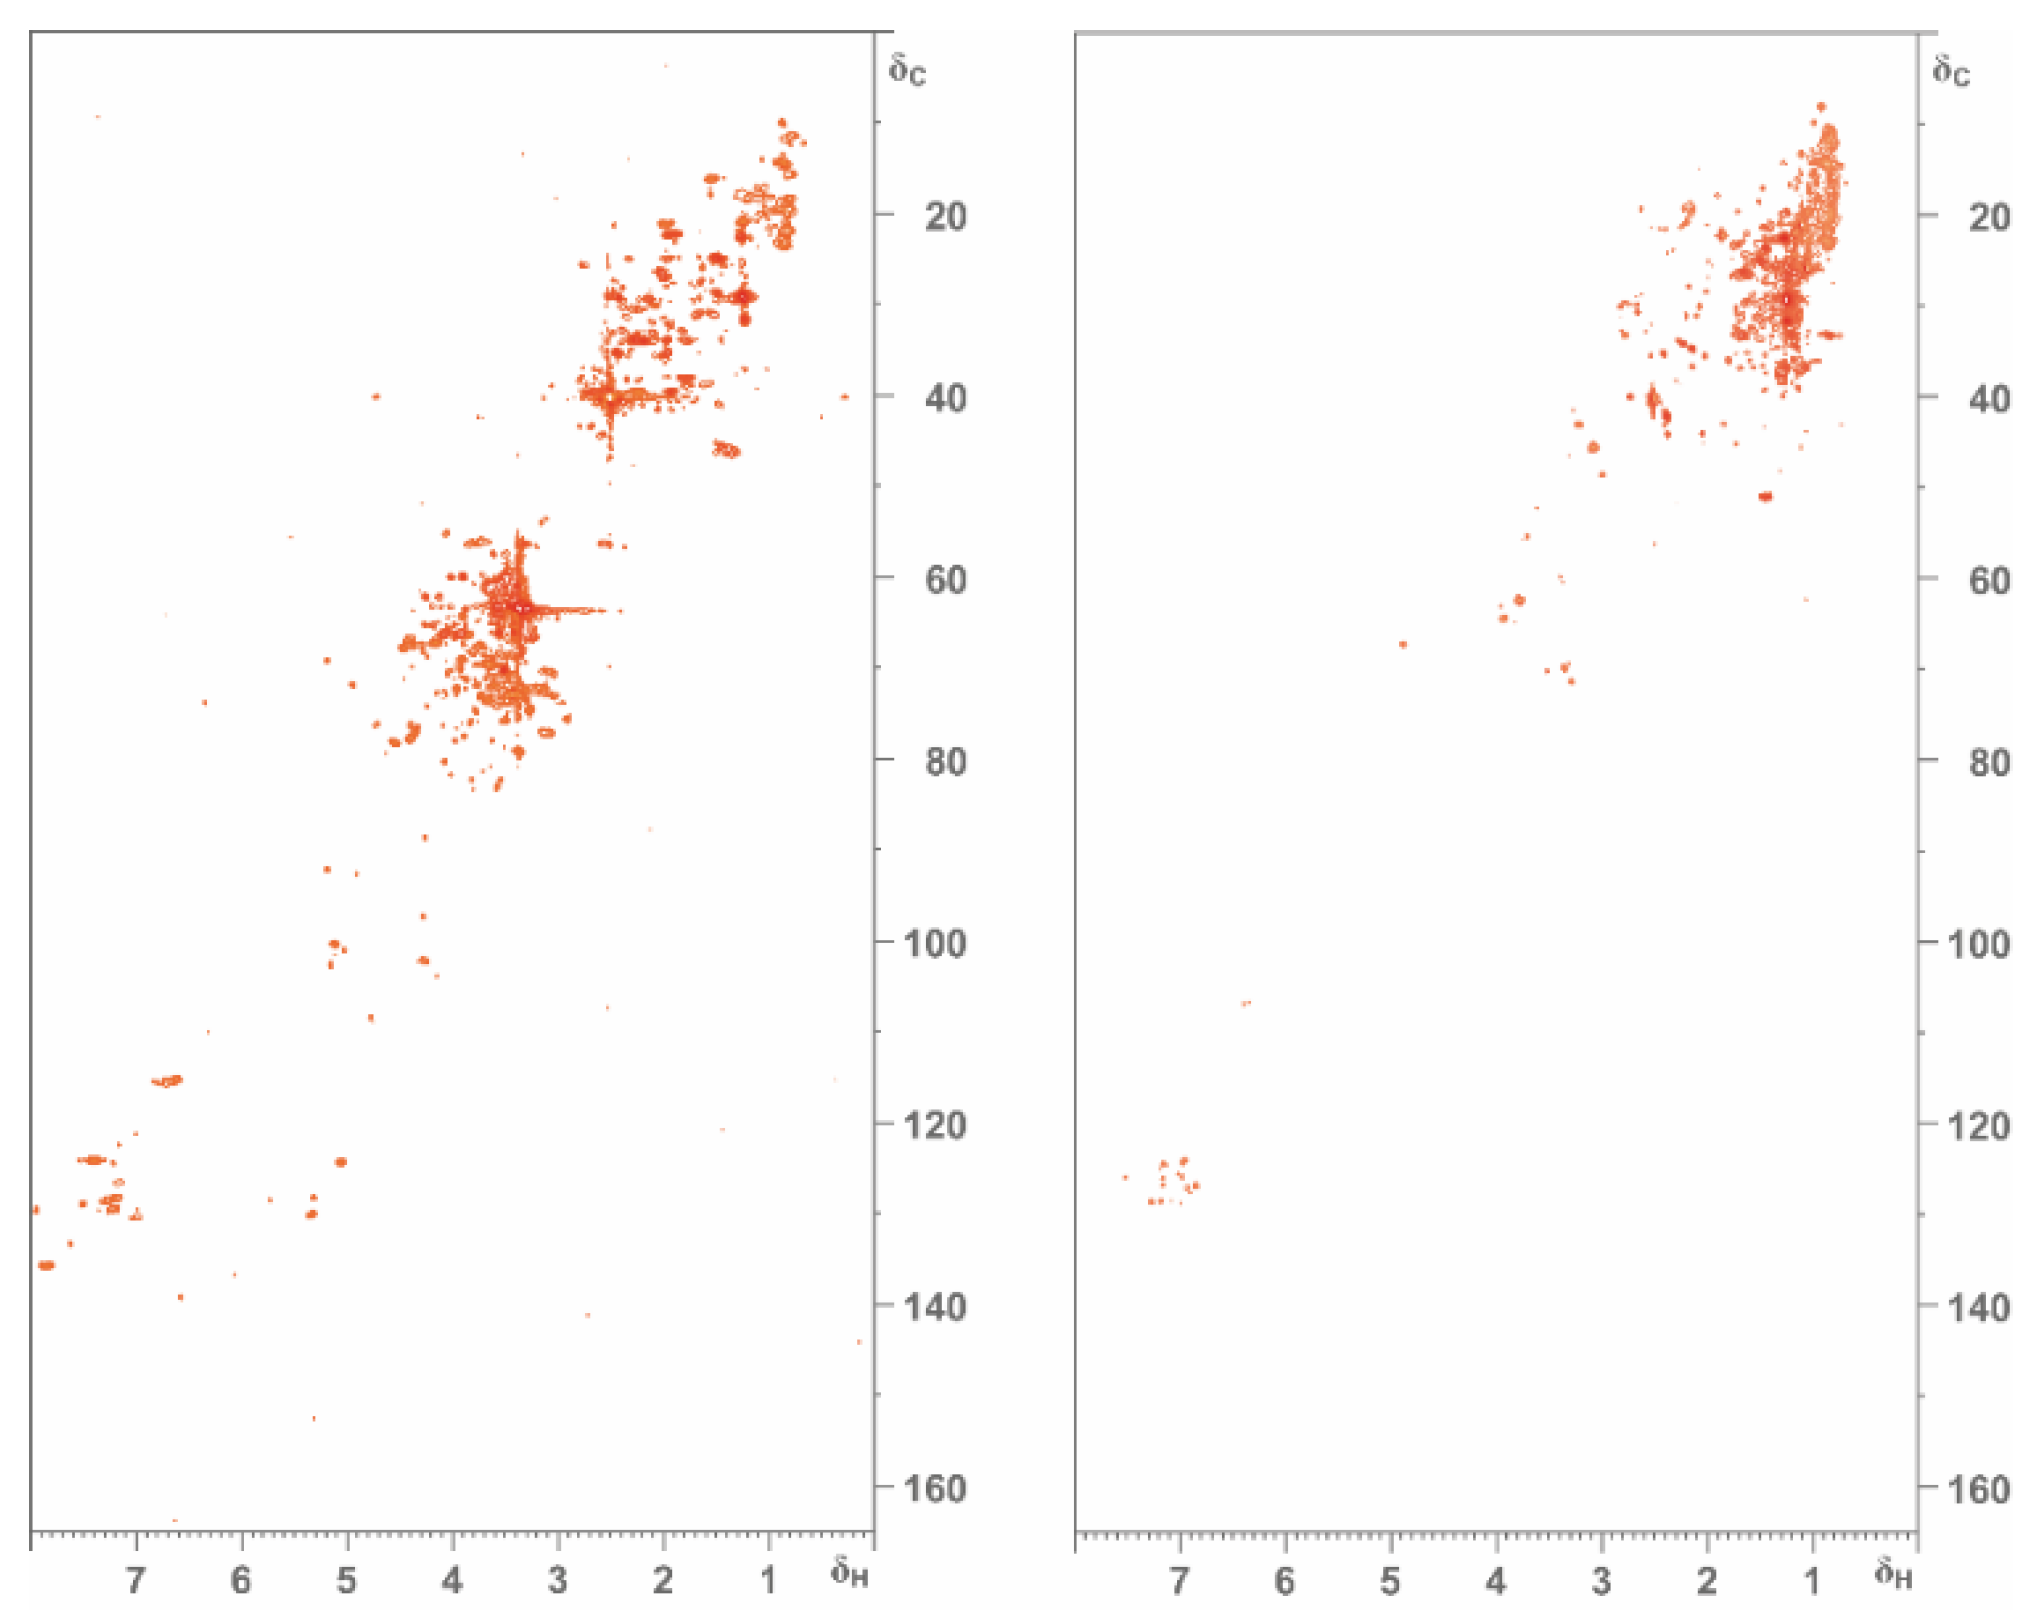
3.9. HSQC RMN Analyses of SSL and Bio-Oil
RMN spectroscopy for complex mixtures provides important additional information about the structures present in the sample. Even though lignocellulosic-based materials have a complex composition, the set of δC–δH signal crossings is widely investigated and a lot of information is available in the literature [
20,
21,
22,
51,
52,
53,
54].
Figure 12 shows the 2D HSQC spectrum of the SSL sample and highlights the three regions of the spectrum that show the characteristic signals of the side chains and unsaturations/aromatics present in the most common constituents of lignin. The spectrum in the figure shows the signals produced by the bio-oil sample.
The comparison between the two spectra is directly related to the level of conversion of the SSL into bio-oil, where it is clear that the intensity of the δC–δH signal crossings characteristic of the S, G and H rings of tobacco lignin is decreasing and the intensity of the δC–δH signal crossings characteristic of the aliphatic C–C and C–H bonds of hydrocarbons is increasing.
It should be noted that the SSL will show differences in the chemical displacements of the bonds of the main tobacco monolignols present in the sample when compared with data from studies that analyzed pure lignin samples or fragments of it extracted without the interference of other materials in the mixture.
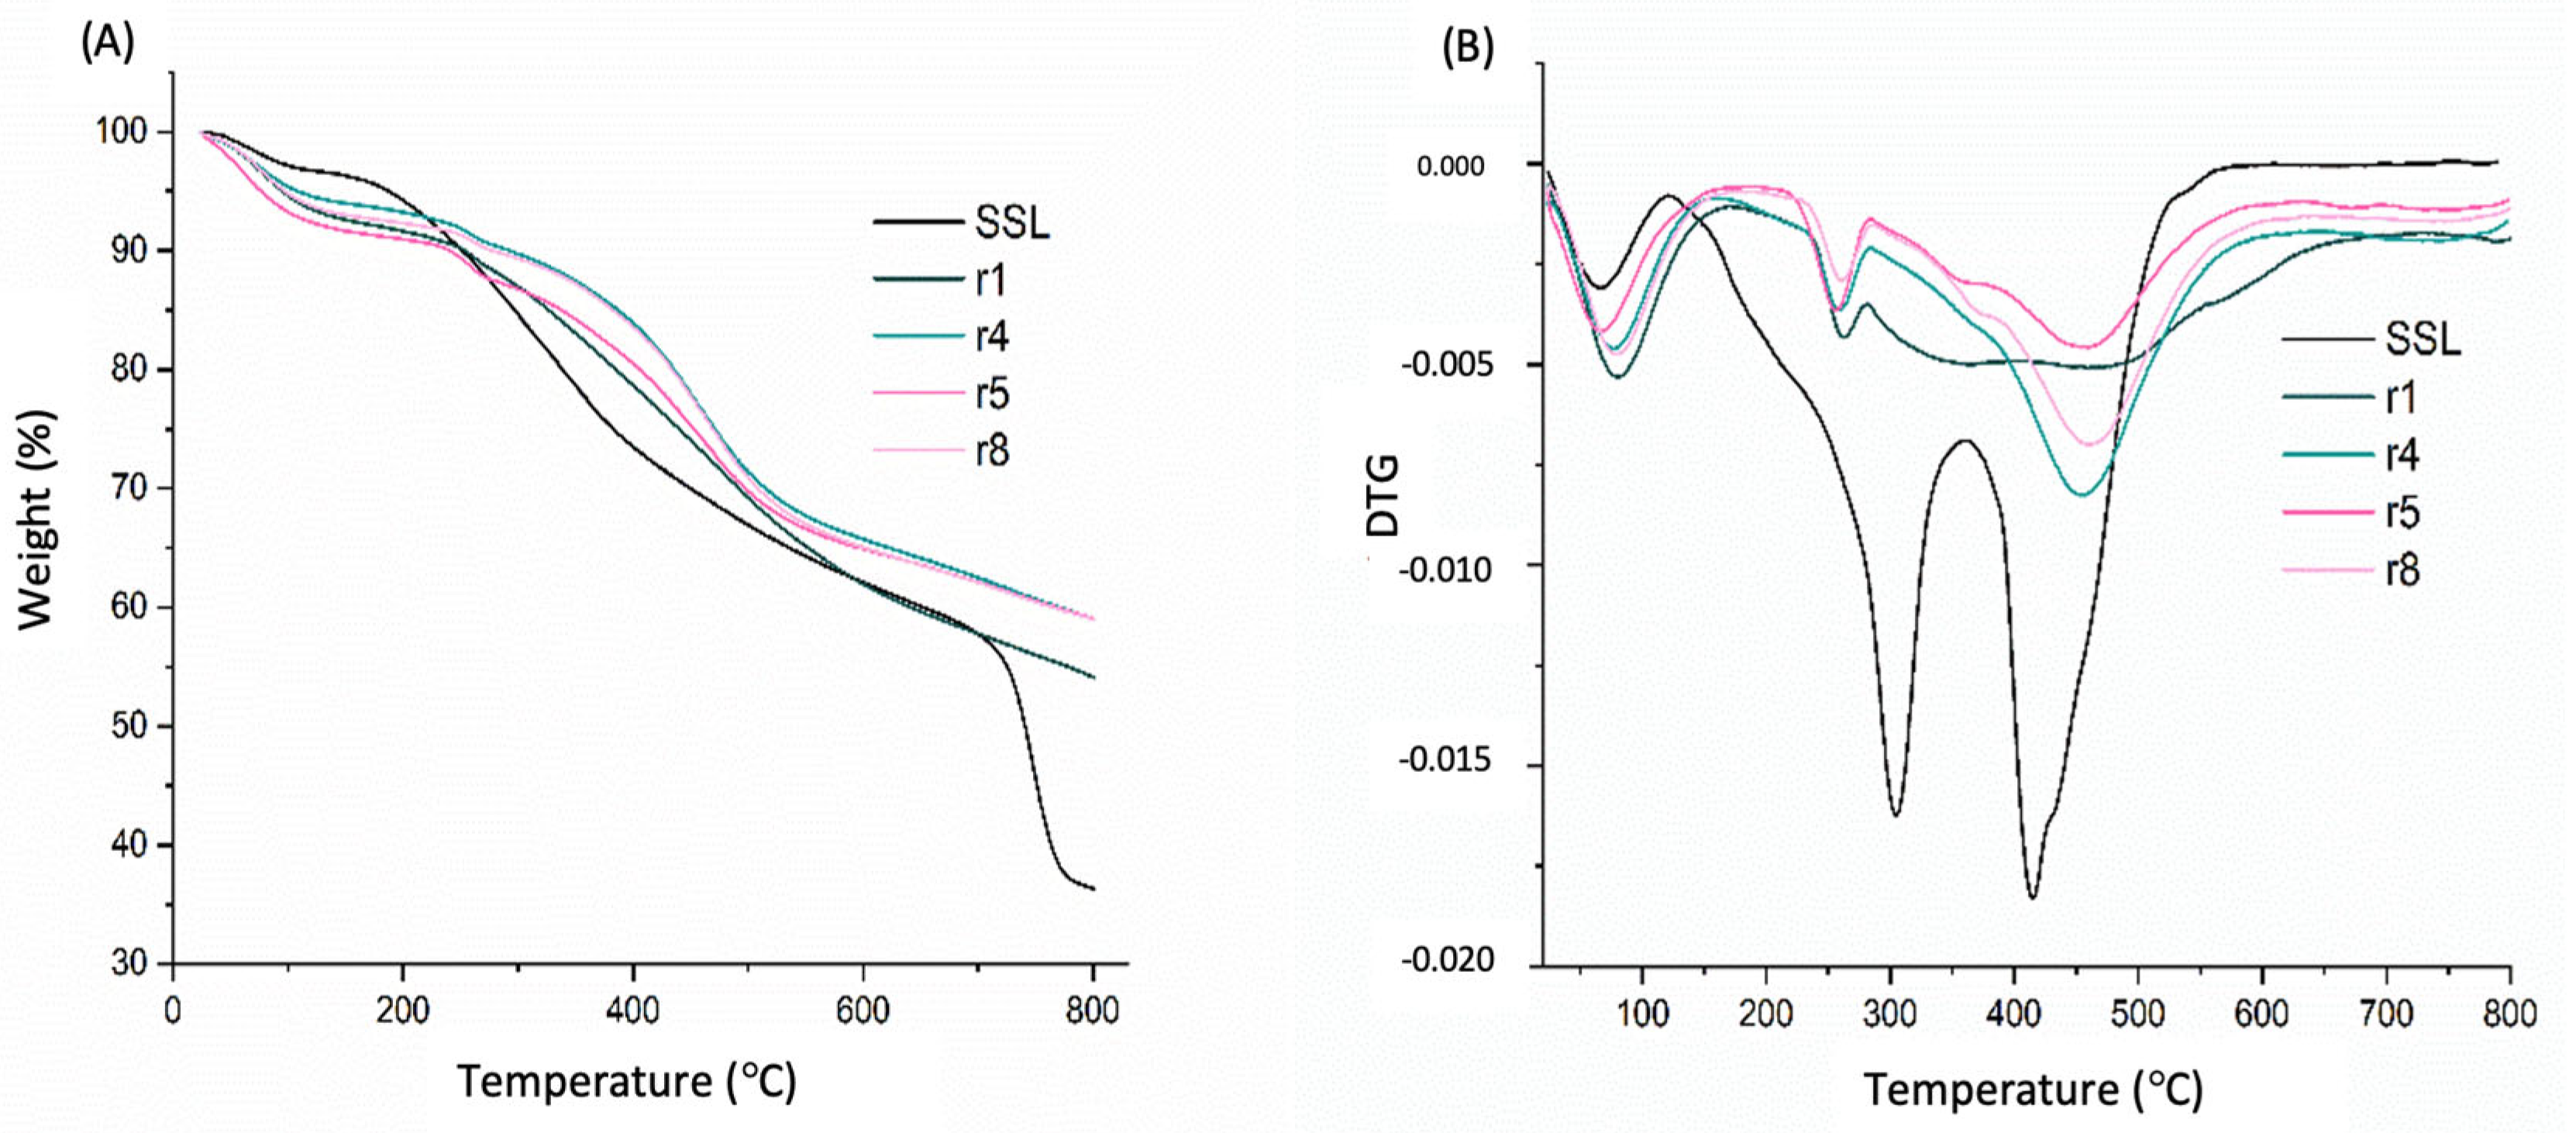
3.10. Thermogravimetric Analyses (TGA and DTG)
The thermal analysis of the SSL will essentially show the behavior of a thermoplastic material and, at the same time, a material rich in phenolic compounds. Given the complexity of this type of matrix, it is expected that the thermal decomposition of a mixture of macromolecules and their fragments will occur simultaneously.
However, attention should be paid to signals regarding the main types of ether bonds (presented in the introduction), the main functional groups of the nitrogen compounds in cigarettes and condensation reactions of macromolecules, such as lignin, for a better understanding of the results. In the case of the products, r1, r4, r5 and r8 (
Figure 13A) were the residual solids from each of the respective reactions to estimate the level of hydrogenation by comparing it with the thermogravimetric behavior of the SSL. The presence of more volatile compounds distributed over a wider temperature range can be seen because of catalytic hydrogenation forming lower molar mass substances in contrast to the macromolecules present in the SSL (
Figure 13A,B).
In the SSL, before 200 °C, there is a loss of mass that is very close to what is characteristic of dehydration and the breaking of β-O-4 bonds in lignin [
51,
52]. In the samples of dehydrogenation products, the same pattern of mass loss can be seen, but to a greater extent. This is due to the presence of various volatile compounds in this temperature range, an expected result of the reaction. In the 200–500 °C range, the SSL sample shows two notable rates of mass loss. It is likely that the breaking of ether bonds and oxidations of other lignin functional groups account for most of these events [
53,
54,
55] in the form of oxygenated and nitrogenous compounds of higher molar masses. In addition, the smoother form of mass loss characterizes the deconstruction of lignin present in the sample, as well as the condensation of fragments that remain and assume greater thermal resistance, which is lost near 800 °C.
Samples r4, 5 and 8 showed several peaks in the 200–600 °C range when looking at the DTG curves in
Figure 13B. This behavior corroborates the possible loss of compounds with different functional groups and chain sizes. In the case of the r1 sample, where the presence of hydrocarbons was more accentuated by the results discussed in
Section 3.4., a strong band can be seen in the DTG curve in the 200–650 °C region, explaining the formation of a wide range of isomer compounds and of varying chain lengths, which corroborates what was observed in the GCMS analyses with regard to the high number of peaks detected. The remaining percentage of the SSL (36%) was practically coal containing inorganic salts and ash. In the case of samples r1, 4, 5 and 8, they had an average residual solid of 58%. From the behavior of the TG curve of some samples, it is likely that above 800 °C, there was still a loss of mass. However, it is also likely that this mass was mostly charcoal and ashes.
The technique developed in this work encourages the sustainable production of an alternative fuel of great importance in the global energy transition. The production of a new source of energy, new alternative materials and chemical compounds as renewable byproducts is a topic of great relevance, as it is directly linked to sustainability. The use and application of lignin as a renewable source introduces a promising new product into the production chain for the production of bio-oil, since this source is one of the byproducts in pulp and paper production.
Compared with the traditional method of bio-oil production (pyrolysis), and the physical–chemical characteristics obtained when using cigarette butts due to the high concentration of lignin, the produced bio-oil has a higher concentration of phenolic and aromatic compounds, due to the complex structure of lignin. The bio-oil produced is more viscous and denser, which provides larger areas of application; in addition, by having better chemical characteristics, it can add value in its applications.
4. Conclusions
This study successfully achieved its primary objective of characterizing the lignin-like solid (LLS) obtained from the catalytic transfer hydrogenation (CTH) of cigarette butts, a lignocellulosic municipal waste. The investigation showed that the LLS derived from this recycling process contains structurally relevant chemical compounds, supporting its potential as a viable feedstock for biorefining applications. The process also enabled the efficient valorization of this under-explored waste type, contributing to the development of alternative strategies for chemical recovery and resource circularity.
The chromatographic method for characterizing bio-oil, combined with the results of the other analyses, shed light on the complex composition of bio-oil, providing valuable information for assessing its destination in industrial applications.
The characteristics of the predominant fraction of bio-oil, cyclic and/or branched hydrocarbons suggest that it could be processed for sectors other than bio-fuel development as a possible source of fine chemical products.
The versatility of the catalyst used in this technique was proven by the high rate of reuse and the ease with which it can be removed from the final mixture, contributing to the low cost of the process. Moreover, the ease with which the reaction promotes hydrogenation by using isopropanol as the H donor can also be proven as a fundamental point. The acid precipitation of SSL and the gas phase of the biorefining product are interesting steps for further study.
If applied on a large scale, they will become topics to be evaluated more closely with the view of applying this technology in specific sectors of industry. Thus, the improvement and use of new solvents, the application of catalysts or raw materials rich in lignin could be promising to improve the proposed technique, as well as to improve the bio-oil production rate.
From an environmental point of view, the nature of this research points to a new technology for obtaining chemical products, raw materials and energy on a larger scale, given the need for an apparatus suited to the regional requirements of responsible and ecological management for the current high demand for MSW, such as cigarette butts.


 and
and 


