Article

Guava (Psidium guajava) Fruit Extract Ameliorates Monosodium Urate-Induced Inflammatory Response

1
Research Institute of Biotechnology, Hungkuang University, Shalu District, Taichung 433304, Taiwan
2
Department of Chemistry, Tunghai University, Xitun District, Taichung 407224, Taiwan
3
SYi Biotek, 2F, No. 26, Keyuan Rd., Xitun District, Taichung 407734, Taiwan
4
Department of Microbiology and Immunology, Graduate Institute of Biomedical Sciences, College of Medicine, Chang Gung University, Guishan District, Taoyuan 333323, Taiwan
*
Author to whom correspondence should be addressed.
Chemistry 2025, 7(3), 73; https://doi.org/10.3390/chemistry7030073
Submission received: 10 March 2025 / Revised: 17 April 2025 / Accepted: 22 April 2025 / Published: 1 May 2025
(This article belongs to the Section Food Science)

Abstract

:
Hyperuricemia, induced by monosodium urate (MSU) crystals that accumulate in articular joints and periarticular soft tissues, can impair macrophages. Possible causes of macrophage injury include uric acid-induced oxidative stress or inflammation. This study examined the dried fruits of guava (DFG) as a complementary medicine with urate-lowering properties, utilizing THP-1 macrophages to determine if high uric acid-induced cellular damage could be mitigated through the reduction of oxidative stress and inflammation via treatment with a phytochemical extract. The active extract was prescreened using a xanthine oxidase (XO) inhibition assay coupled with fractionation and component analysis. The DFG extracts were used to identify, through an in vitro study of THP-1 cells. The results indicated that the DFG extracts with the highest total flavonoids (12.08 ± 0.81 mg/g DW) exhibited the XO inhibition activity. High-performance liquid chromatography–tandem mass spectrometry analysis showed that DFG extract contained 85.32% flavonoids, including quercetin and kaempferol derivatives. Furthermore, fractionation results of DFG extracts indicated a significant reduction in MSU-induced cytotoxicity in THP-1 cells obtained from the 75% ethanol-eluted fraction (Fr-75). Additionally, kaempferol, an active compound in Fr-75, effectively mitigated MSU-induced NF-κB and NLRP3 gene overexpression. These findings suggest that the prepared Fr-75 is a promising hyperuricemia therapeutic candidate.

1. Introduction

Gout is a chronic inflammatory arthritis caused by hyperuricemia resulting from the overproduction of uric acid during purine metabolism. The hallmark of this disease is joint pain and inflammation due to the deposition of monosodium urate (MSU) crystals in the joint spaces. Clinical treatment of gout using allopurinol, a xanthine oxidase (XO) inhibitor, has been established to reduce serum uric acid concentrations to less than 6 mg/dL [1,2,3]. Currently, for individuals with persistent hyperuricemia and recurrent gout attacks, continuous treatment with XO inhibitors (such as allopurinol) or uricosuric agents (e.g., probenecid and sulfinpyrazone) is recommended [4,5]. However, adverse effects, including pruritic rashes, gastrointestinal discomfort, and allergic reactions, may occur with the administration of allopurinol and probenecid. Furthermore, sulfinpyrazone, although highly effective as a uricosuric agent, may precipitate the early onset of renal stone complications due to its rapid and efficient absorption [6,7]. Given the significant side effects associated with current medications for gout, there is a need to discover new XO inhibitors to treat this condition.
Guava (Psidium guajava L.) grown in tropical regions, such as India, Indonesia, Pakistan, Bangladesh, and South America, is traditionally used to treat a range of ailments, including gastrointestinal and respiratory disorders. Guava leaves, in combination with the pulp and seeds, are used for the management of specific respiratory and gastrointestinal disorders and to increase platelet counts in patients afflicted with dengue fever. Guava leaves are widely known for their antispasmodic, cough-suppressant, anti-inflammatory, anti-diarrheal, anti-hypertensive, anti-obesity, and anti-diabetic effects [8,9].
According to previous studies [10], the treatment of guava shoots and leaves using a low-temperature drying and fermentation process elevated their polyphenol (417.9 ± 12.3 mg/g) and flavonoid (452.5 ± 32.3 mg/g) contents, exhibiting a relatively simple composition profile. Moreover, the active flavonoids quercetin and kaempferol were detected in unripe guava fruits (Table 1) [11,12]. In vitro studies have shown that flavonoids strongly inhibit the XO activity [13]. The ability of guava leaf extract to inhibit XO and scavenge free radicals may contribute to its potential application in the management of gout, primarily attributed to the synergistic effects of flavonoids and phenolic acids present in the extract [12,13,14]. In addition, the guava fruit exhibits significant in vitro antioxidant and XO inhibitory effects [15]. This study aimed to evaluate the significant inhibitory effect of DFG extract on XO and analyze the active components of its fractions. Furthermore, the fraction was explored for the potential effects and underlying molecular mechanisms on THP-1 macrophages in an MSU crystal-induced inflammation model.

2. Materials and Methods

2.1. Materials and Chemicals

High-performance liquid chromatography (HPLC)-grade methanol and acetonitrile, dimethyl sulfoxide (DMSO), trypan blue, 3-(4,5-dimethylthiazol-2-yl)-2,5-diphenyltetrazolium bromide (MTT), allopurinol, benzbromarone, and XO were purchased from Sigma-Aldrich (St. Louis, MO, USA). Deionized water was prepared using a Milli-Q water purification system (Millipore, Bedford, MA, USA). Biological Industries (Beit HaEmek, Israel) supplied the fetal bovine serum (FBS), L-glutamine solution, and penicillin–streptomycin. Dulbecco’s Modified Eagle Medium (DMEM) and trypsin–EDTA solution were purchased from HyClone (Logan, UT, USA).

2.2. Plant Material

Dried fruits of guava (DFG) were purchased from a local Chinese herbal medicine pharmacy (Liang-An, Taichung, Taiwan) and used without further drying. The morphological characteristics of guava flowers and fruits indicated that the axillary flowers were single or in small clusters. Sepals completely enclosed young shoots; lobes were 9 mm long and 5 mm wide, reflexed when the flower was open, and covered with white pubescence. The fruit was light yellow, pink, or dark red, spherical, ovoid, or pear-shaped, 5–10 cm long, with granular flesh, and a juicy white or red central pulp with numerous very hard seeds, each 3 mm in length.

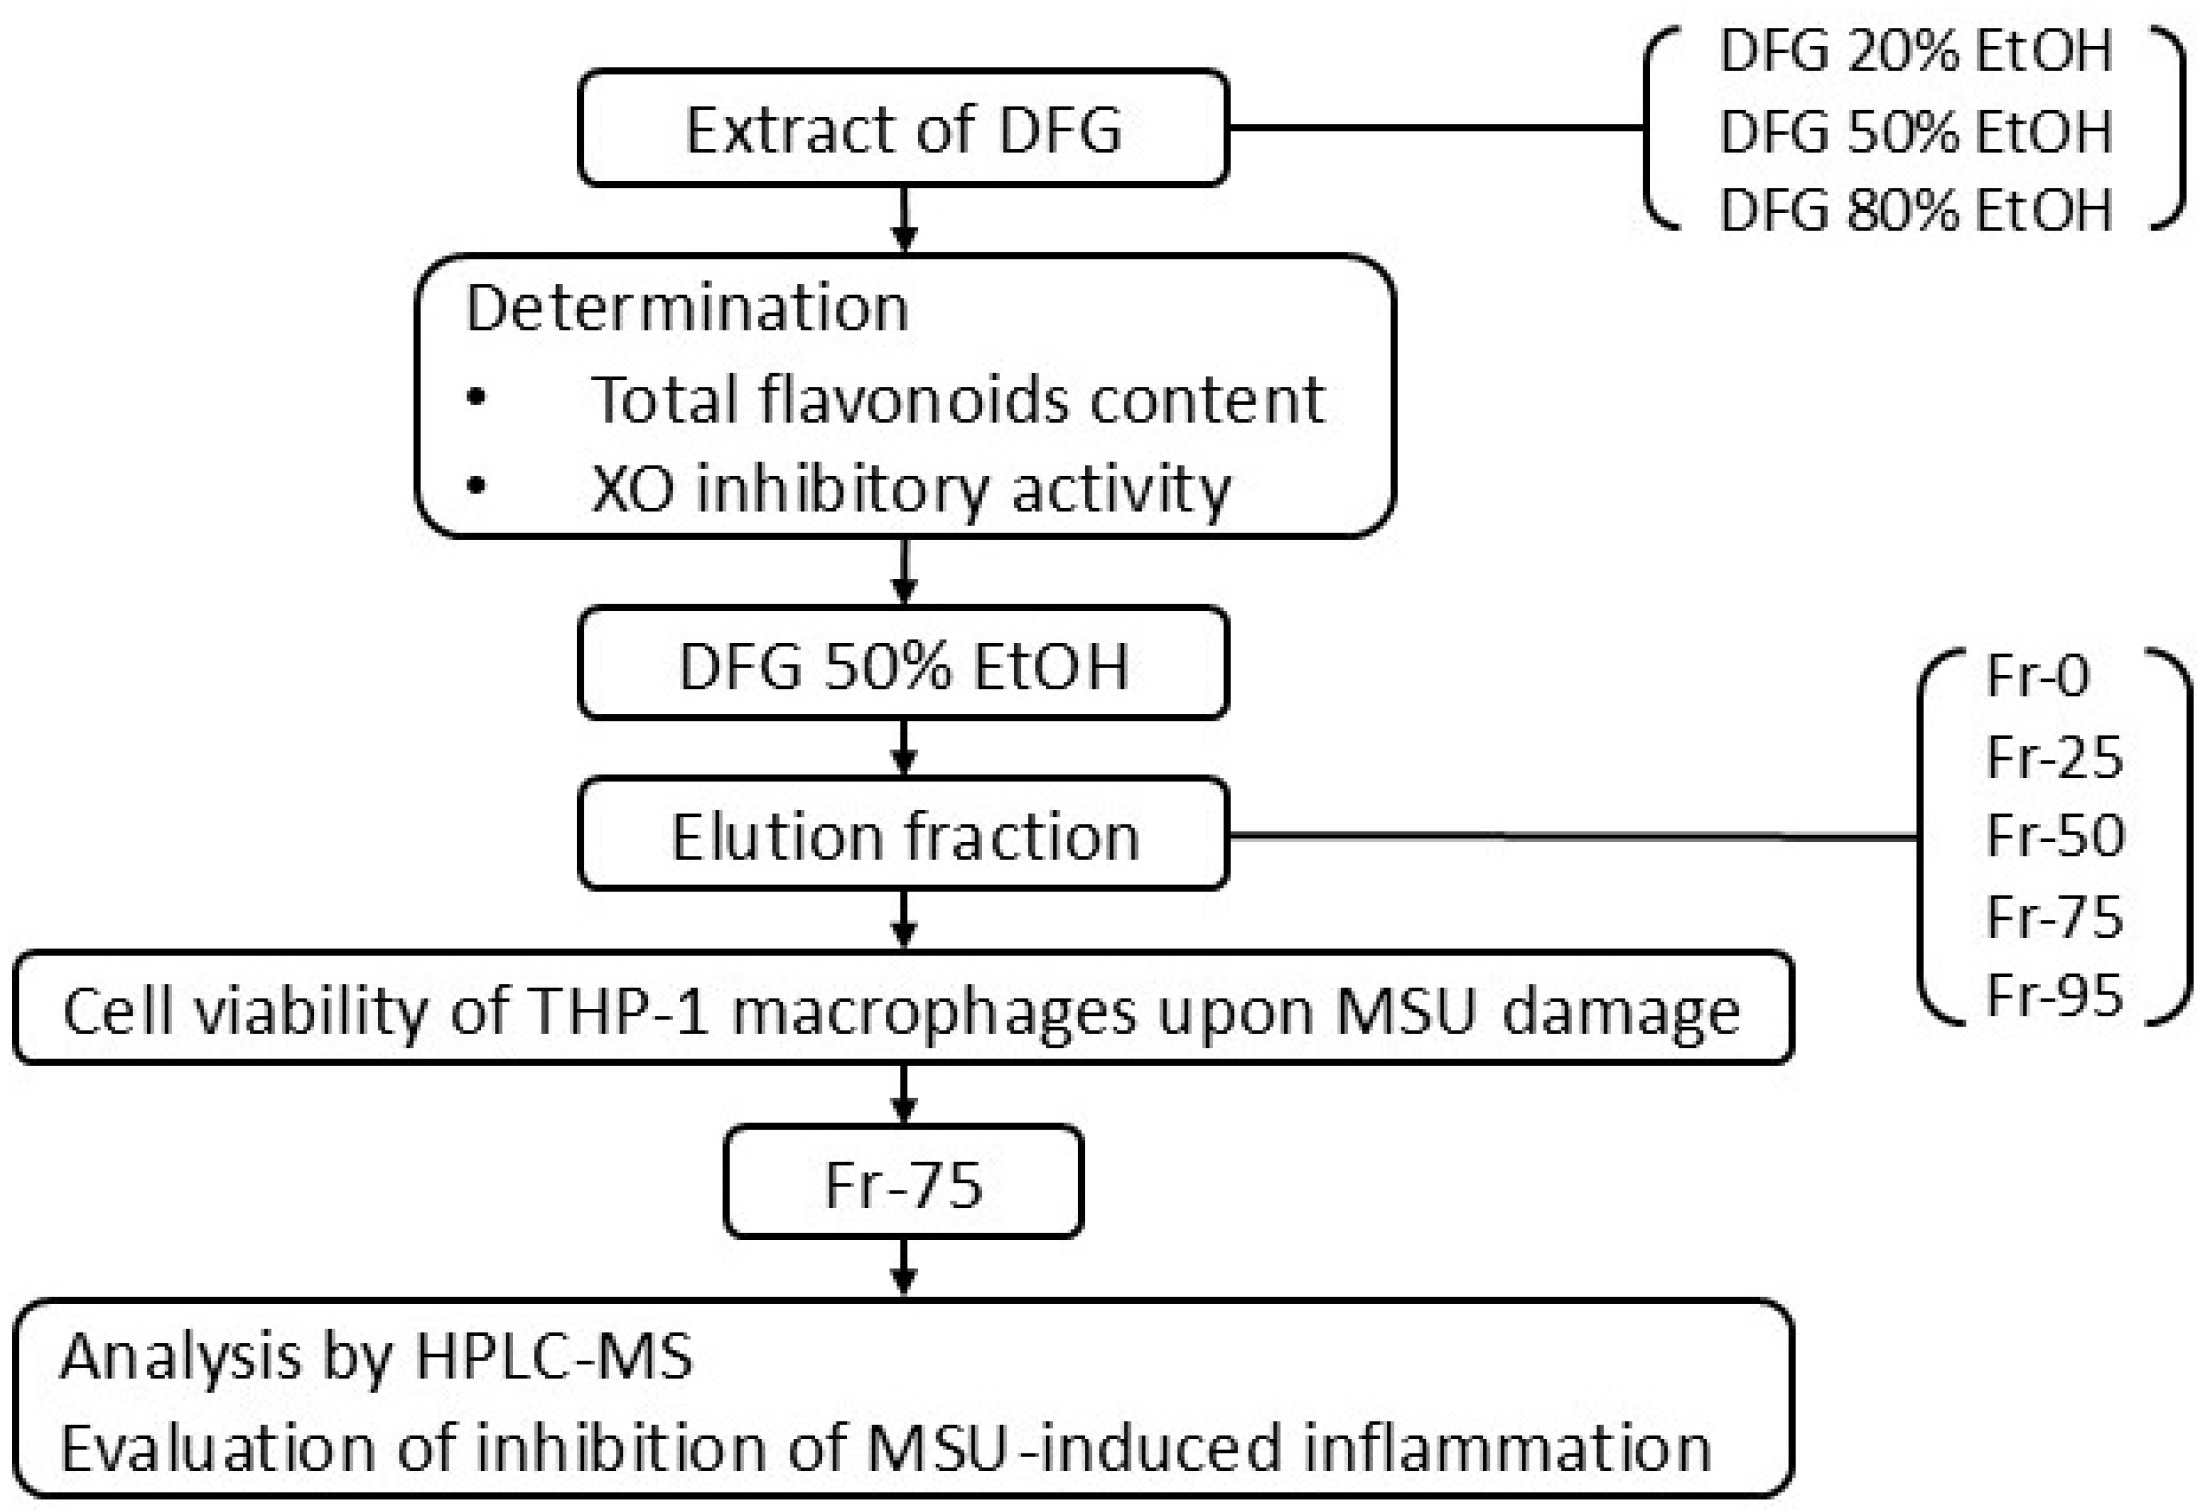
2.3. Preparation of Sample Extract

The DFG (0.1 kg) were extracted with 1 L of 20%, 50%, or 80% (v/v) ethanol at 50 °C for 4 h, respectively. The extracts were performed in triplicate, and each extract was repeated independently three times. The crude ethanolic extracts were concentrated in vacuo using a rotary evaporator at 40 °C and finally lyophilized (Eyela, Tokyo, Japan). The experimental design of this study is shown in Figure 1.

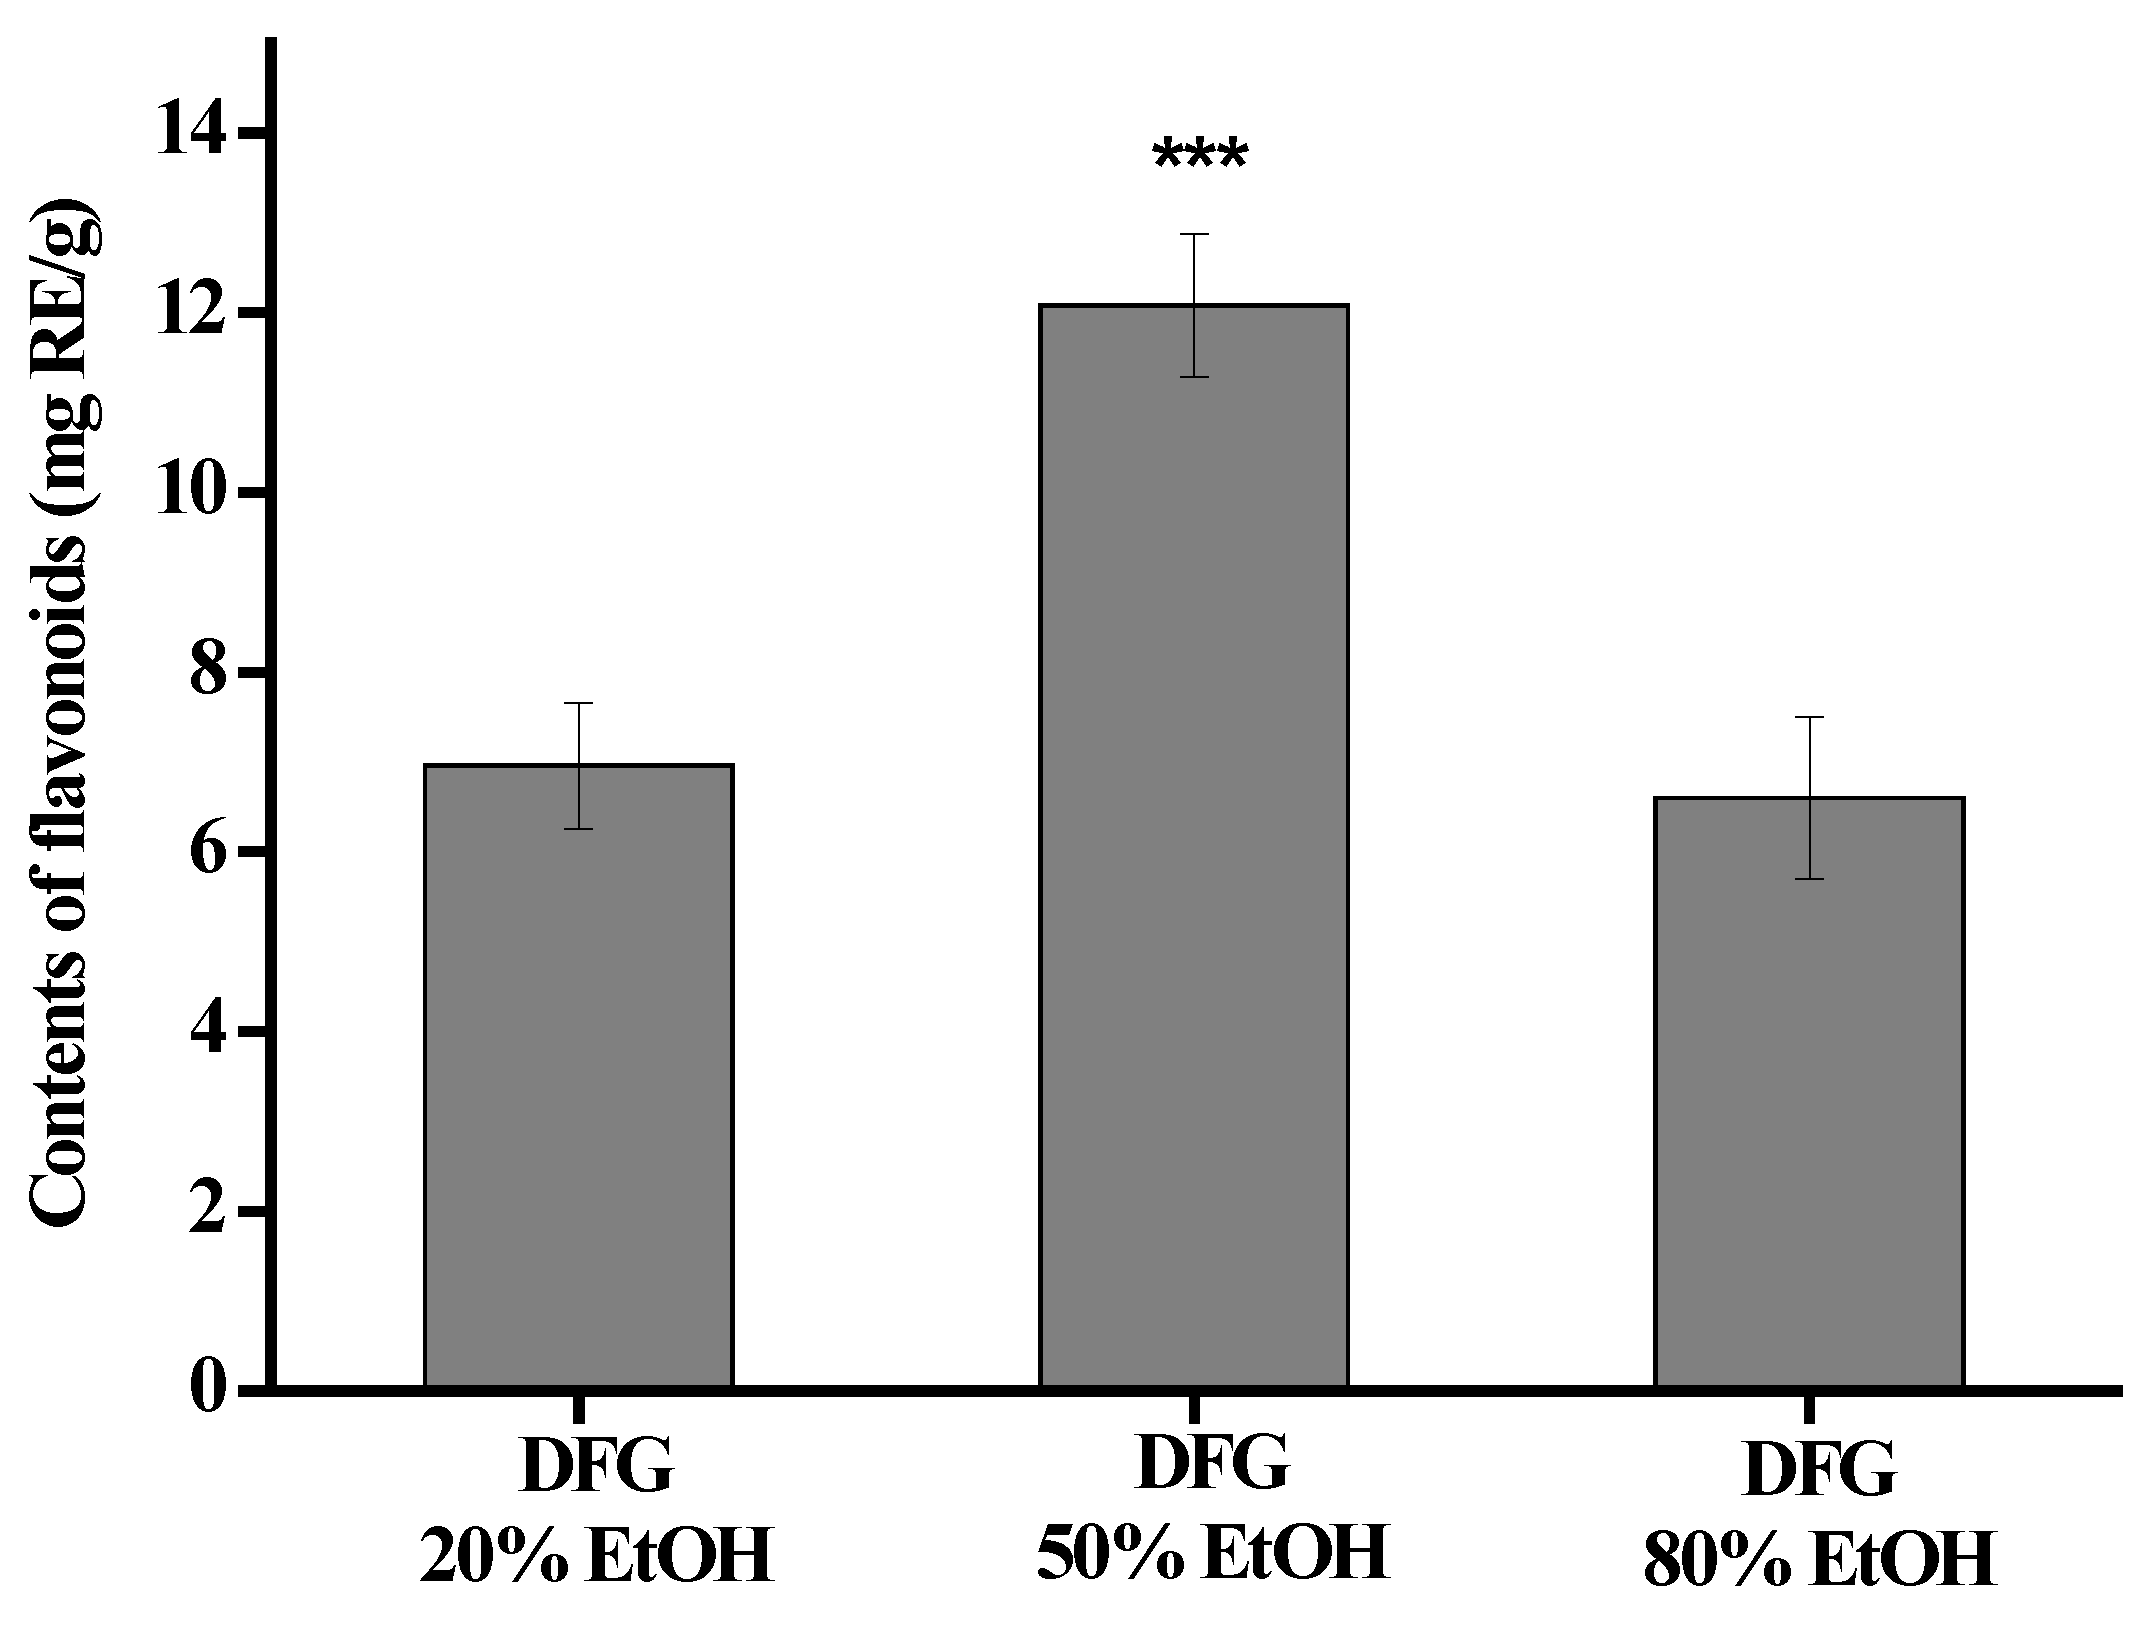
2.4. Determination of Total Flavonoids Content

Briefly, 5 mL of test solution (either standard or sample) was combined with 0.3 mL of 5% (w/v) sodium nitrite and allowed to react for 6 min. Subsequently, 0.3 mL of 5% (w/v) aluminum nitrate was added, and the mixture was left undisturbed for another 6 min. Subsequently, 4 mL of 4% (w/v) sodium hydroxide was added along with 0.4 mL of 30% (v/v) ethanol in water. The final mixture was incubated for 12 min at room temperature. The total flavonoid content (TFC) was assessed by measuring the optical density (OD) at 510 nm. Flavonoid standard solutions with concentrations ranging from 10 to 70 μg/mL were prepared to construct a standard curve based on rutin absorbance values. The TFC was expressed as milligrams of rutin equivalent per gram of dry plant weight (mg RE/g) [16].

2.5. Analysis of Guava Extract by HPLC and HPLC/ESI–MS/MS

The phytochemical profile of the Fr-75 of DFG extract was analyzed using an HPLC system coupled with a triple quadrupole mass spectrometer equipped with an electrospray ionization (ESI) source and a photodiode array detector (DAD), following a previously reported method [17]. Briefly, the HPLC-ESI-MS/MS analysis was conducted using an Agilent 6420 system (Aglient, Santa Clara, CA, USA) equipped with an Agilent 1200 HPLC system (Phenomenex, Inc., Torrance, CA, USA). The components separation was achieved on an ACQUITY HSS T3 C18 column (Waters Corporation, Milford, MA, USA) (100 × 2.1 mm, 1.8 µm) with a matching C18 VanGuard pre-column (2.1 × 5.0 mm, 1.7 µm) from Waters Corporation (Milford, MA, USA). The system was operated under gradient elution conditions, using two mobile phases: Solvent A (water with 0.1% formic acid) and Solvent B (acetonitrile with 0.1% formic acid). The flow rate was maintained at 0.3 mL/min, and the column temperature was set to 35 °C. The gradient program was conducted as follows: 0–10 min (10–25% B), 10–20 min (25–30% B), 20–25 min (30–35% B), 25–30 min (35–95% B), 30–40 min (95% B), and 40–45 min (95–10% B).
The DAD recorded the absorption spectra of the eluted compounds within a wavelength range of 210–600 nm, with peaks observed at 254, 280, 320, and 350 nm. The eluted and separated components were analyzed using an MS/MS system with an ESI source in negative ionization mode. Nitrogen gas at a flow rate of 9 L/min was used as the drying gas, and the nebulizing gas was operated at 35 psi. The drying gas temperature was 325 °C, and a potential of 3500 V was applied across the capillary. The fragmentor voltage was set to 120 V, and the collision voltage was 15 V. The identification of the position and the specific hexoside was conducted by using negative ionization mode in the MS/MS analysis and was referred to previous analysis results for confirming the position and the specific hexoside without standards [18].

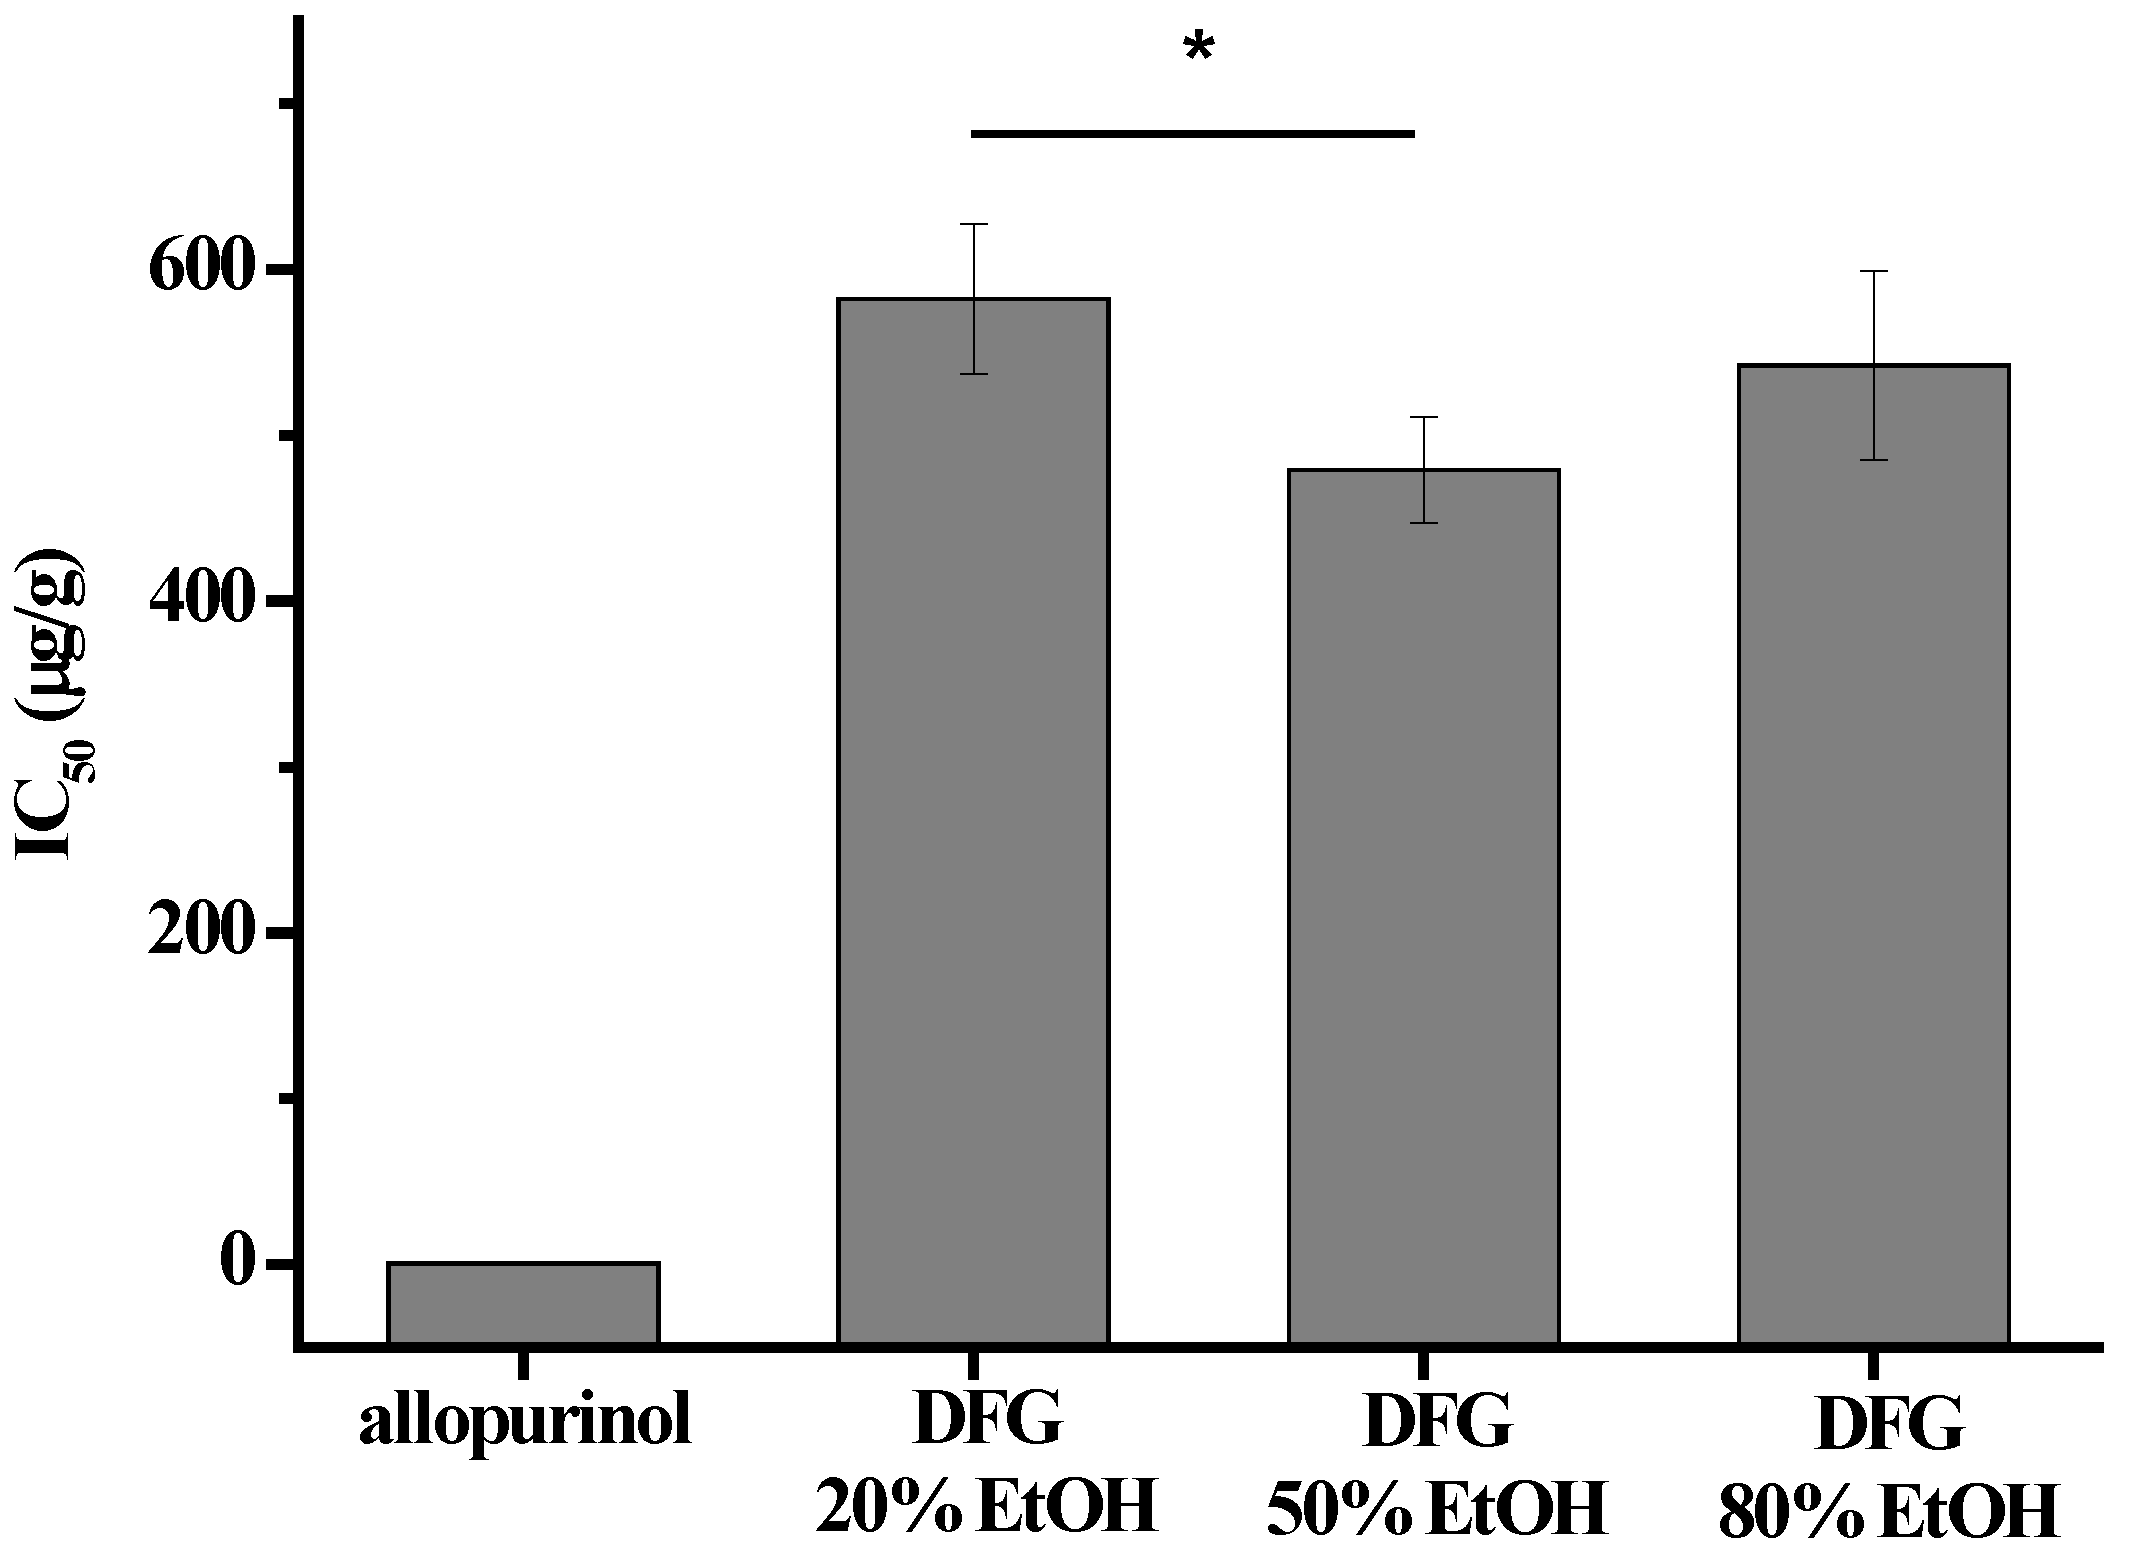
2.6. XO Inhibitory Activity

Allopurinol, a well-established XO inhibitor, was used as the positive control in this assay. A solution of allopurinol was prepared by dissolving 16 mg of the compound in 5.0 mL of 0.2 M phosphate buffer (pH 7.5). XO derived from bovine milk (Sigma, X4500, Sigma-Aldrich chemicals, St. Louis, MO, USA) was used to prepare the enzyme solution by diluting 40 µL of a 5.0 U/0.2 mL stock solution to a total volume of 1.6 mL. The substrate solution was prepared by dissolving 9.5 mg of xanthine in deionized water with the aid of 5 drops of 1.0 M NaOH, making a final volume of 1.0 L. The assay mixture, totaling 3.0 mL, contained varying concentrations of the DFG extract (final concentrations of 2048, 1024, 512, 256, 128, 64, 32, 16, and 8 µg/mL), 0.2 M phosphate buffer (pH 7.5), and 10 µL of 0.625 U/mL XO enzyme solution. After pre-incubating the test solution at 25 °C for 10 min, the reaction was initiated by adding 1 mL of 62.5 µM xanthine substrate solution, followed by thorough mixing.
The assay mixture contained less than 1% DMSO (v/v), ensuring no interference with the enzyme activity assay. All the solutions were freshly prepared prior to use. The negative control (DMSO) and reagent blank were prepared without the extracts or enzyme, respectively. The OD at 295 nm was measured to determine the uric acid concentration using a spectrophotometer (U-2900, Hitachi, Ibaraki, Japan). Allopurinol was administered at a final concentration of 0.25~32 µg/mL. All experiments were performed in triplicate, and the inhibition percentages were calculated as the mean of the three measurements. The IC50 was calculated using GraphPad Prism 5 (GraphPad Software, San Diego, CA, USA) software.
The percentage XO inhibition (XOI) activity was calculated using the formula:
Inhibition % = 1 A 1 A 2 A A 0 × 100 %
where
A: Absorbance of the negative control containing XO.
A0: Absorbance of the negative control without XO.
A1: Absorbance of the sample containing XO.
A2: Absorbance of the sample without XO.
The values were calculated from the regression lines of a plot of the percentage XOI activity versus the sample concentrations [19,20,21,22].

2.7. Macroporous Resin Column Chromatography

A total of 100 g of the concentrated DFG extract was dissolved in water and loaded onto an HPD-100 macroporous resin column for fractionation. Once the adsorption equilibrium was established, the column was initially eluted with deionized water, followed sequentially by desorption using ethanol solutions at concentrations of 25%, 50%, 75%, and 95%. This process resulted in the isolation of the following fractions: water fraction (Fr-0, 685 mg), 25% ethanol fraction (Fr-25, 701 mg), 50% ethanol fraction (Fr-50, 302 mg), 75% ethanol fraction (Fr-75, 52 mg), and 95% ethanol fraction (Fr-95, 25 mg) [23].

2.8. Cell Culture

The human monocytic leukemia cell line THP-1 was obtained from the Bioresource Collection and Research Center (BCRC, Hsinchu, Taiwan). THP-1 cells were maintained in RPMI 1640 medium supplemented with 10% FBS, 10 mM HEPES, 4.5 g/L glucose, 1 mM sodium pyruvate, and 0.05 mM 2-mercaptoethanol. Cultures were incubated at 37 °C in a humidified atmosphere containing 5% CO2.

2.9. Cell Treatment

A slightly modified experimental design was used to evaluate MSU-induced gouty arthritis in THP-1-derived macrophages [24]. THP-1 cell suspension (3 × 10⁵ cells/mL) was seeded into a 24-well plate (0.4 mL/well) and stimulated with 100 ng/mL phorbol myristate acetate (PMA) for 48 h to induce differentiation into macrophages. In previous experiments, different fractions were individually assessed for their toxicity on differentiated THP-1 cells. The results indicated that at the highest concentration of 100 μg/mL, no cytotoxicity was observed on THP-1 cells. The cells were subsequently exposed to control and different fractions (Fr-0, Fr-25, Fr-50, Fr-75, and Fr-95) from DFG extracts at varied concentrations (15, 25, 37.5, 50, and 75 μg/mL) for 24 h. Next, the cells were incubated with MSU (final concentration of 200 μg/mL) for 1 h. The cells were cultured in fresh RPMI 1640 medium for 18 h after removing the MSU-containing medium. After incubation, the cultured medium containing MTT (0.5 mg/mL) was added to each well, and the plate was incubated for another 2 h. Consecutively, the supernatants were removed and 400 μL of DMSO was added to wells. The plates were shaken for 10 min. The absorbance was measured at 570 nm using a plate reader (ELx800; BioTek Instruments Inc., Winooski, VT, USA). The ability of viable cells to reduce MTT to formazan was analyzed as described previously [25].

2.10. Total RNA Extraction

Following the induction of differentiation in THP-1 cells using PMA, they were treated with the Fr-75 fraction of DFG extract (25, 50, and 75 μg/mL) and the active compounds quercetin and kaempferol (40 μM) for 24 h. Subsequently, cells were stimulated with MSU (final concentration 200 μg/mL) for 1 h. After removing the MSU-containing medium, the cells were cultured in fresh medium for 18 h.
THP-1 cells were rinsed twice with ice-cold PBS before being lysed in 1 mL of TRIzol® reagent (Thermo Fisher Scientific, Waltham, MA, USA). The lysate was transferred to a microtube, and 100 μL of 1-bromo-3-chloropropane (BCP, Sigma-Aldrich chemicals, St. Louis, MO, USA) was added to facilitate phase separation. After vortexing for 30 s, the mixture was incubated at 4 °C for 15 min and then centrifuged at 13,000 rpm for 15 min to separate the layers. The clear aqueous phase (400 μL) was carefully collected and transferred to a fresh microtube, followed by the addition of 600 μL of isopropanol. The solution was left to stand at 4 °C for 30 min before centrifuging at 13,000 rpm for 15 min.
The resulting supernatant was discarded, and the RNA pellet was washed with 500 μL of 70% ethanol. After a final centrifugation step at 13,000 rpm for 20 min at 4 °C, the pellet was dissolved in 30 μL of DEPC-treated water DEPC (Sigma-Aldrich chemicals, St. Louis, MO, USA) and stored at −80 °C until further use.

2.11. Quantitative Analysis of mRNA Levels

Quantitative PCR (qPCR) was performed using SYBR® FAST (KAPA Biosystems, Sigma-Aldrich chemicals, St. Louis, MO, USA) following the procedure described in our previous study [24]. Equal amounts of cDNA were used for the analysis. Briefly, a 20 μL reaction mixture was prepared, comprising 9.2 μL of cDNA, 0.4 μL of 10 μM forward and reverse primers (Table 2), and 10 μL of KAPA SYBR FAST qPCR Master Mix (2×). DNA amplification was performed over 40 cycles under the following conditions: enzyme activation at 95 °C for 20 s, denaturation at 95 °C for 3 s, and annealing at 60 °C for 40 s. Gene expression was detected in triplicate using the ABI 7900HT real-time PCR system, and expression fold changes were derived using the comparative CT method, with β-actin serving as an endogenous control. The relative mRNA expression levels were calculated using the 2−∆∆Ct method.

2.12. Statistical Analysis

Values are expressed as means ± SD. The results were analyzed using one-way analysis of variance (ANOVA), followed by a posteriori comparison (Dunnett’s multiple comparisons test).

3. Results

3.1. TFC of Ethanol Extracts from DFG

The results of the determination of the TFC in each extract showed the following order: DFG 50% ethanol extract (12.08 ± 0.81 mg/g) > DFG 20% ethanol extract (6.96 ± 0.73 mg/g) > DFG 80% ethanol extract (6.6 ± 0.92 mg/g) (Figure 2). The 50% ethanol extract of DFG had the highest TFC. Therefore, following studies on the efficacy of antioxidant, anti-hyperuricemic, and anti-inflammatory activities were conducted using the 50% ethanol extract of DFG.

3.2. XOI Activity

XO, the key enzyme that catalyzes the final step in the conversion of purines to uric acid, is instrumental in the development of hyperuricemia, eventually leading to gout inflammation. In this study, XOI using standard allopurinol and DFG extracts was investigated and compared. The percentage inhibition was calculated. The inhibition study revealed that the results for inhibitory components on XOI activity ranged from 8 to 2048 µg/mL. The results showed that the 20%, 50%, and 80% ethanol extracts of DFG possess XOI activity with IC50 values of 542.4 ± 57.1, 479.3 ± 2.0, and 582.1 ± 5.2 µg/mL, respectively (Figure 3). The control drug allopurinol exhibited an IC50 value of 0.769 ± 0.07 µg/mL. In vitro XOI activity of allopurinol showed a higher inhibition rate than that of the ethanol extracts.

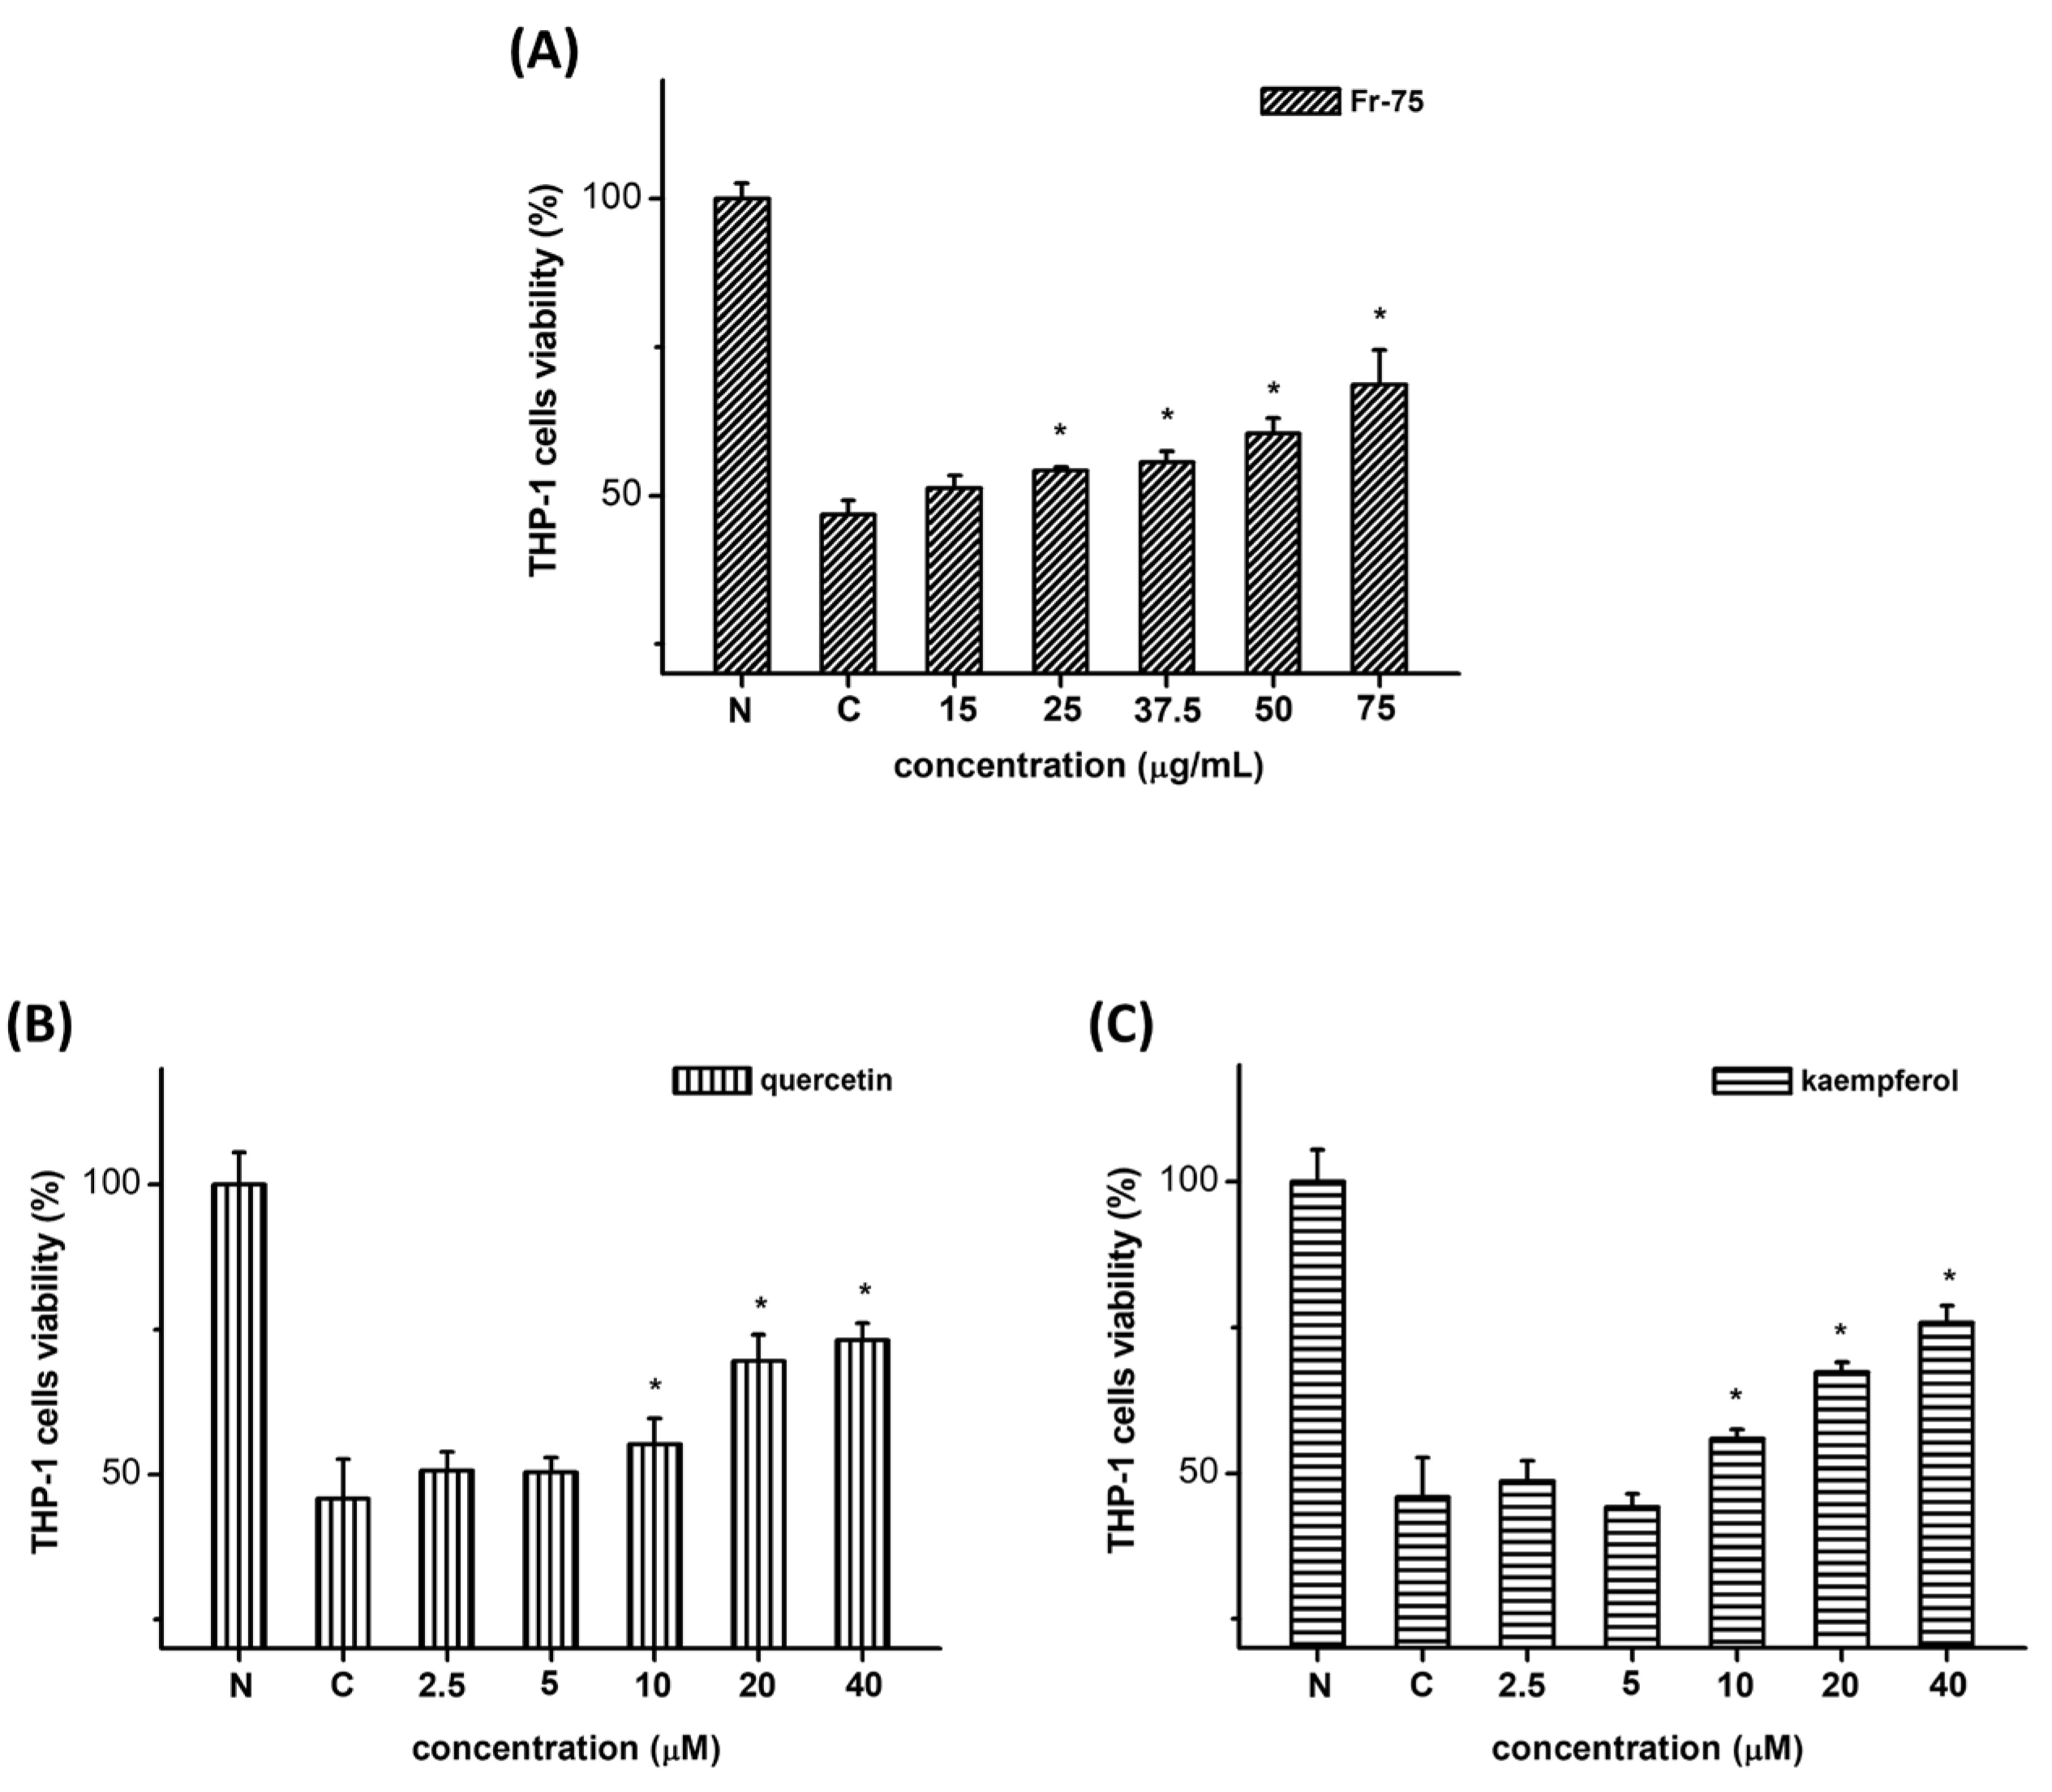
3.3. Effect of DFG Extract on Cell Proliferation of THP-1 Macrophages

The cytotoxicity of the extract on THP-1 macrophages was determined using the MTT assay. To determine the main active components in the 50% DFG extract, fractionation was conducted using HPD-100 resin with different ethanol concentrations as the eluting solvent. The results (Table 3) showed that the majority of the extracts exhibited no obvious cytotoxicity toward the proliferation of THP-1 macrophages at a 15–75 μg/mL dose range. As shown in Table 3, the Fr-75 and Fr-50 showed significant improvement in cell viability in a concentration-dependent manner at 25–75 μg/mL and 50–75 μg/mL, respectively, compared to the MSU group (p < 0.05).
Furthermore, the cytoprotective effects of quercetin and kaempferol, the active compounds in DFG extract, against MSU-induced cytotoxicity were evaluated using cell viability assays. The results showed that quercetin and kaempferol at concentrations higher than 10 μM could effectively alleviate the damage to THP-1 cells caused by MSU in a dose-dependent manner (Figure 4).

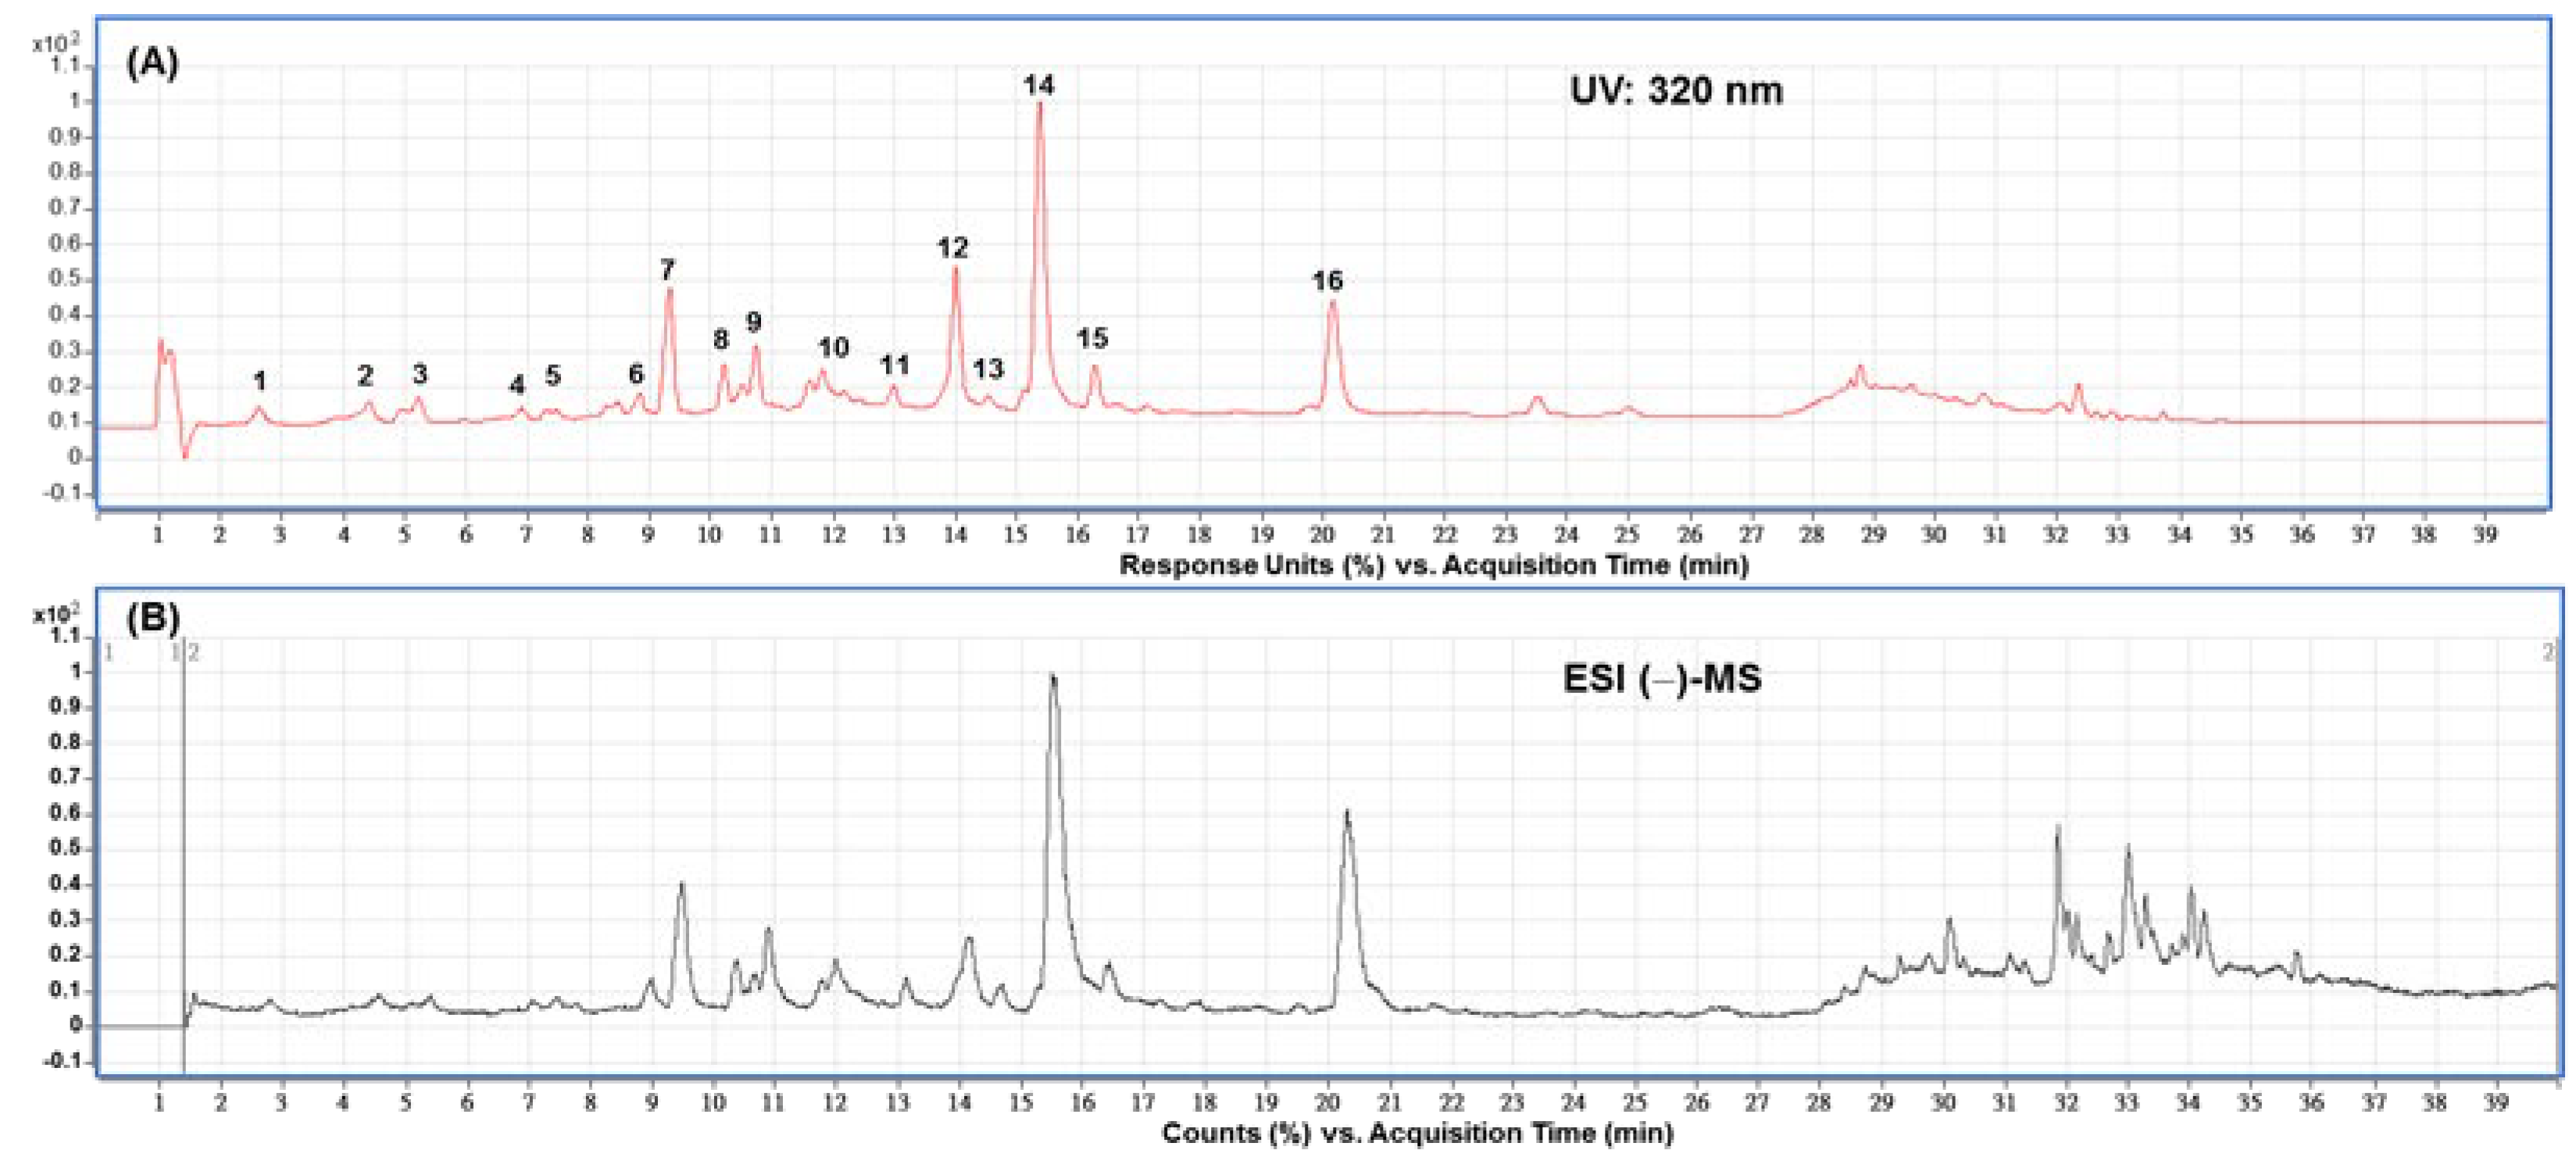
3.4. Main Compounds in Fr-75 of DFG by HPLC and HPLC-MS Analysis

HPLC and MS analyses were performed to study the composition of the active extract. Figure 5 (top panel) illustrates the development of a reversed-phase HPLC, which identified the primary 16 chemicals, followed by mass spectrometry analysis utilizing a total ion chromatogram (TIC) of the extract (Figure 5, bottom panel).
For further elucidation and confirmation of the molecular structure, MS/MS analysis was performed by using the tandem quadruple MS spectrometer. The resultant fragmentation data are presented in Table 4. Furthermore, the retention times, UV–Vis, spectra, and mass spectra were compiled for the identification of compounds. Most of the components in the Fr-75 were derived from the flavonoids, including quercetin and kaempferol derivatives (Table 4).

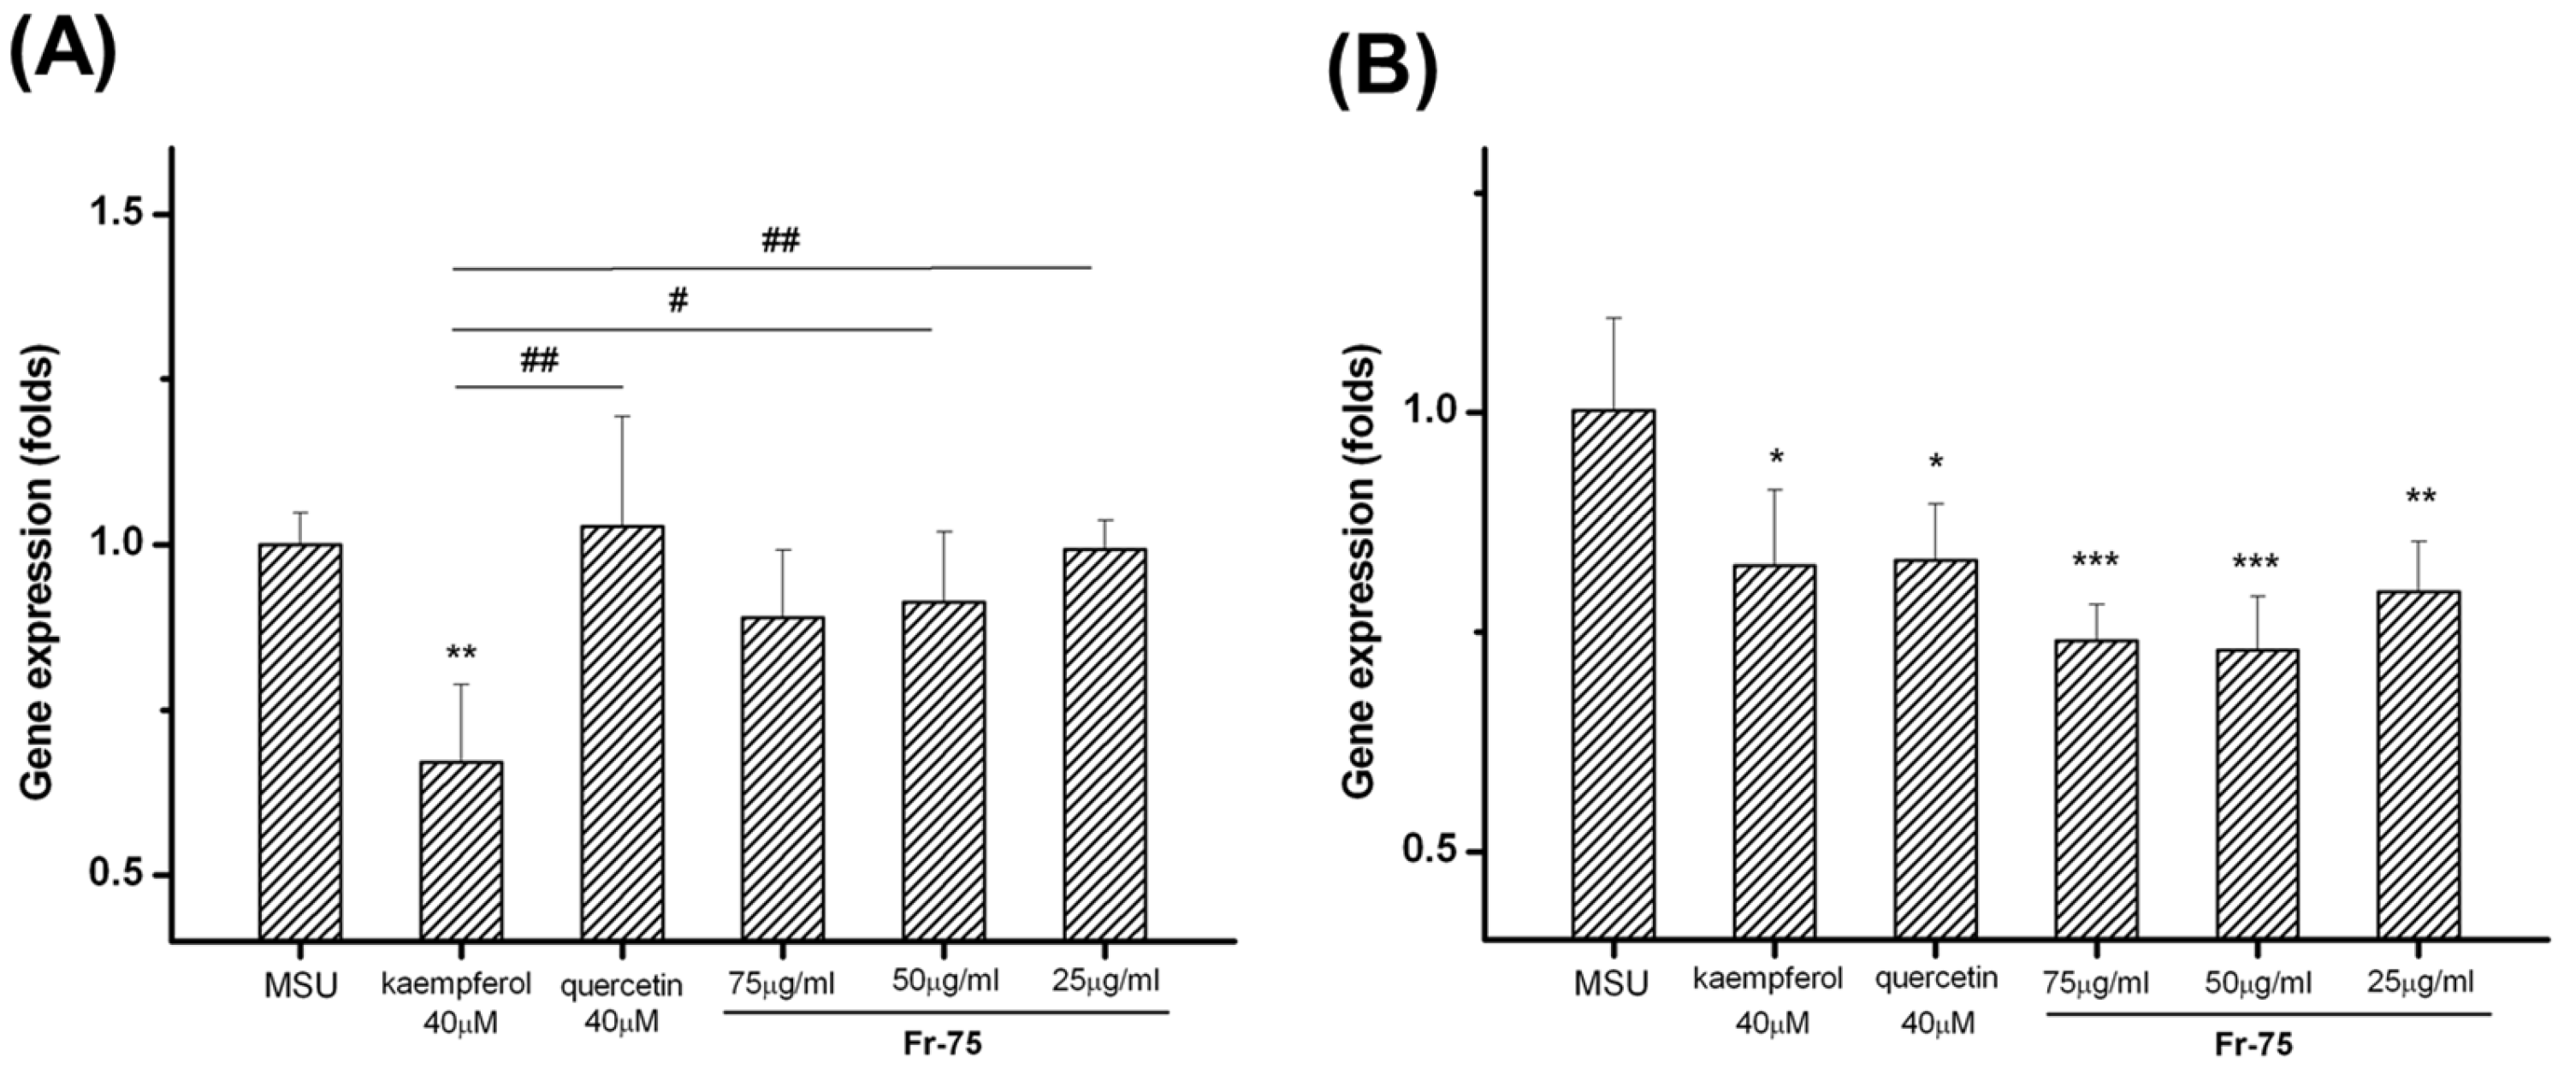
3.5. Effect of Main Compounds in Fr-75 on MSU-Induced Inflammatory Factor

The analysis of NF-κB and NLRP3 gene expression revealed that Fr-75, quercetin, and kaempferol inhibited NLRP3 gene expression in MSU-injured THP-1 cells. Additionally, in the analysis of NF-κB gene expression, only kaempferol was observed to exhibit an inhibitory effect. In this study, the main flavonoids analyzed in the Fr-75 extract, quercetin and kaempferol, were suggested to inhibit MSU-induced inflammatory responses, as shown in Figure 6.

4. Discussion

Recent studies indicate that plant extracts rich in flavonoids and phenolic acids can inhibit XO and offer other health benefits [26]. Such extracts have been shown to exert potent inhibitory effects against enzymes associated with specific pathological conditions, including XO for gout, ACE for hypertension, and α-amylase and α-glucosidase for type 2 diabetes [26,27,28]. Additionally, they demonstrate antioxidant activity, making them valuable for various therapeutic applications [29].
Flavonoids have been shown to have biological activities that reduce oxidative stress and protect cardiovascular health [30]. Studies on plasma concentration–time curves showed that kaempferol was absorbed more adequately than quercetin [31]. This study investigated the biological activities and chemical composition of Fr-75. HPLC-MS/MS analysis was used to characterize the 14 compounds by retention index, UV–visible spectra, and MS/MS spectra. Quercetin and kaempferol are the main compounds in Fr-75. In vitro studies have shown that kaempferol has higher biological activity than quercetin. This may be one of the functional factors contributing to the ability of Fr-75 to reduce MSU-induced damage in THP-1 cells.
XOI is a pivotal clinical strategy for managing hyperuricemia and gout as it helps reduce circulating urate levels and vascular oxidative stress. Polyphenols have been shown to effectively inhibit XO and alleviate hyperuricemia. They are considered safer alternatives to synthetic inhibitors such as allopurinol. Gout encompasses two distinct disease states: (1) metabolic urate accumulation leading to elevated local urate concentration, and (2) MSU crystal formation from increased urate or hyperuricemia, capable of activating the NLRP3/NALP3 inflammasome, which may be implicated in the pathogenesis of gout [32,33]. Previous studies have indicated that the structural attributes of flavonoids, specifically the C-5 and C-7 hydroxyl groups of flavonoids, can substitute the C-2 and C-6 hydroxyl groups of purines at XO active sites to provide flavonoids with the capability to inhibit XO activity [34,35]. This interaction is achieved through the potential interconversion of the carbonyl structures of purines into hydroxyl forms. Quercetin and kaempferol are the major flavonoid subclasses that differ in the presence of hydroxyl (OH) groups. Kaempferol lacks a hydroxyl group at the third position of the B ring. Several studies have reported minimal differences between the inhibitory effects of quercetin and kaempferol on XO activity [34,35].
Guava is a rich source of bioactive compounds, with a total phenolic content of 163.36 mg GAE/g fresh weight [36]. Its values exceed those of other fruits, such as banana, dragon fruit, water apple, lansa, orange, carambola, and mangosteen, with a range of 21–131 mg GAE/g fresh weight [37]. In addition, the TFC of guava is significant, measuring 35.85 mg CE/g fresh weight, which is comparable to other fruits such as apples, raspberries, sweet cherries, white grapes, and peaches, with a range of 15.0–48.6 mg CE/g fresh weight [36,38].
Our findings suggest that the dried fruit guava (DFG) extract (Fr-75) holds potential as a therapeutic candidate for hyperuricemia. However, several limitations should be acknowledged. First, gout is a complex condition influenced not only by elevated uric acid levels but also by genetic predisposition and environmental factors, which were not addressed in this study. Second, our cellular model specifically examined the inflammatory response induced by MSU crystals, which may not fully represent the multifaceted pathophysiology of gout in vivo. Third, this study primarily relied on mRNA expression data without corresponding protein validation, which remains an important area for future investigation. In the present study, guava extract demonstrates promising anti-inflammatory potential; further comprehensive studies, including molecular analyses, animal models, and clinical trials, are necessary to validate the therapeutic efficacy and assess its potential application in gout management.

5. Conclusions

In this study, XOI and anti-inflammatory effects may be the potential mechanisms by which DFG extract and its components exert anti-gout activities. These effects can be attributed to the synergistic effects of the flavonoids in the extract. Therefore, DFG extract can be considered a functional food for relieving gout symptoms. Additionally, the flavonoid-rich fractions could potentially be developed into a novel herbal medicine for the treatment of gout. Further in vivo studies or clinical trials are needed to investigate the potential application of bioactivities in the treatment of hyperuricemia.

Author Contributions

Conceptualization, H.-M.L. and C.-C.C. (Charng-Cherng Chyau); methodology, C.-L.H., C.-J.T. and S.-H.H.; software, C.-L.H. and C.-J.T.; validation, H.-M.L., C.-C.C. (Charng-Cherng Chyau) and C.-H.L.; formal analysis, C.-L.H. and S.-H.H.; investigation, H.-M.L.; resources, C.-C.C. (Chia-Chang Chen); data curation, H.-M.L. and C.-C.C. (Charng-Cherng Chyau); writing—original draft preparation, H.-M.L.; writing—review and editing, H.-M.L. and C.-C.C. (Charng-Cherng Chyau); visualization, C.-C.C. (Chia-Chang Chen); supervision, H.-M.L. and C.-H.L.; project administration, H.-M.L.; All authors have read and agreed to the published version of the manuscript.

Funding

This research received no external funding.

Data Availability Statement

The original contributions presented in this study are included in the article. Further inquiries can be directed to the corresponding author.

Conflicts of Interest

C.-L.H. and C.-J.T. were employed by the SYi Biotek Company. The remaining authors declare that the research was conducted in the absence of any commercial or financial relationships that could be construed as a potential conflict of interest.

References

  1. Hainer, B.L.; Matheson, E.; Wilkes, R.T. Diagnosis, treatment, and prevention of gout. Am. Fam. Physician 2014, 90, 831–836. [Google Scholar] [PubMed]
  2. Dalbeth, N.; Merriman, T.R.; Stamp, L.K. Gout. Lancet 2016, 388, 2039–2052. [Google Scholar] [CrossRef] [PubMed]
  3. Ruoff, G.; Edwards, N.L. Overview of serum uric acid treatment targets in gout: Why less than 6 mg/dL? Postgrad. Med. 2016, 128, 706–715. [Google Scholar] [CrossRef] [PubMed]
  4. Atakul, N.; Demir, H. Gut tedavisinde kullanılan ilaçlar. Türk. Klin. Spec. Top. 2014, 7, 42–47. [Google Scholar]
  5. Bayraktar, A. Hiperürisemi ve gut. TEB Haberler 2010, 2, 22–25. [Google Scholar]
  6. Conaghan, P.G.; Day, R.O. Risks and benefits of drugs used in the management and prevention of gout. Drug Saf. 1994, 11, 252–258. [Google Scholar] [CrossRef]
  7. Strilchuk, L.; Fogacci, F.; Cicero, A.F. Safety and tolerability of available urate-lowering drugs: A critical review. Expert. Opin. Drug Saf. 2019, 18, 261–271. [Google Scholar] [CrossRef]
  8. Laily, N.; Kusumaningtyas, R.W.; Sukarti, I.; Rini, M.R.D.K. The potency of guava Psidium guajava (L.) leaves as a functional immunostimulatory ingredient. Procedia Chem. 2015, 14, 301–307. [Google Scholar] [CrossRef]
  9. Chen, H.Y.; Yen, G.C. Antioxidant activity and free radical-scavenging capacity of extracts from guava (Psidium guajava L.) leaves. Food Chem. 2007, 101, 686–694. [Google Scholar] [CrossRef]
  10. Chang, C.H.; Hsieh, C.L.; Wang, H.E.; Peng, C.C.; Chyau, C.C.; Peng, R.Y. Unique bioactive polyphenolic profile of guava (Psidium guajava) budding leaf tea is related to plant biochemistry of budding leaves in early dawn. J. Sci. Food Agric. 2013, 93, 944–954. [Google Scholar] [CrossRef]
  11. Araújo, H.M.; Rodrigues, F.F.; Costa, W.D.; Nonato Cde, F.; Rodrigues, F.F.; Boligon, A.A.; Athayde, M.L.; Costa, J.G. Chemical profile and antioxidant capacity verification of Psidium guajava (Myrtaceae) fruits at different stages of maturation. EXCLI J. 2015, 14, 1020–1030. [Google Scholar] [PubMed]
  12. Miean, K.H.; Mohamed, S. Flavonoid (myricetin, quercetin, kaempferol, luteolin, and apigenin) content of edible tropical plants. J. Agric. Food Chem. 2001, 49, 3106–3112. [Google Scholar] [CrossRef] [PubMed]
  13. Panche, A.N.; Diwan, A.D.; Chandra, S.R. Flavonoids: An overview. J. Nutr. Sci. 2016, 5, e47. [Google Scholar] [CrossRef] [PubMed]
  14. Irondi, E.A.; Agboola, S.O.; Oboh, G.; Boligon, A.A.; Athayde, M.L.; Shode, F.O. Guava leaves polyphenolics-rich extract inhibits vital enzymes implicated in gout and hypertension in vitro. J. Intercult. Ethnopharmacol. 2016, 5, 122–130. [Google Scholar] [CrossRef]
  15. Mahomoodally, F.; Aumeeruddy-Elalfi, Z.; Venugopala, K.N.; Hosenally, M. Antiglycation, comparative antioxidant potential, phenolic content and yield variation of essential oils from 19 exotic and endemic medicinal plants. Saudi J. Biol. Sci. 2019, 26, 1779–1788. [Google Scholar] [CrossRef]
  16. Ghimire, B.K.; Seo, J.W.; Yu, C.Y.; Kim, S.H.; Chung, I.M. Comparative Study on Seed Characteristics, Antioxidant Activity, and Total Phenolic and Flavonoid Contents in Accessions of Sorghum bicolor (L.) Moench. Molecules 2021, 26, 3964. [Google Scholar] [CrossRef]
  17. Lien, H.M.; Lin, H.T.; Huang, S.H.; Chen, Y.R.; Huang, C.L.; Chen, C.C.; Chyau, C.C. Protective Effect of Hawthorn Fruit Extract against High Fructose-Induced Oxidative Stress and Endoplasmic Reticulum Stress in Pancreatic β-Cells. Foods 2023, 8, 1130. [Google Scholar] [CrossRef]
  18. Zheng, B.; Zhao, Q.; Wu, H.; Wang, S.; Zou, M. A comparative metabolomics analysis of guava (Psidium guajava L.) fruit with different colors. ACS Food Sci. Technol. 2020, 1, 96–106. [Google Scholar] [CrossRef]
  19. Takahama, U.; Koga, Y.; Hirota, S.; Yamauchi, R. Inhibition of Xanthine oxidase activity by an oxathiolanone derivative of quercetin. Food Chem. 2011, 126, 1808–1811. [Google Scholar] [CrossRef]
  20. Fais, A.; Era, B.; Petrillo, A.D.; Floris, S.; Piano, D.; Montoro, P.; Tuberoso, C.I.G.; Medda, R.; Pintus, F. Selected Enzyme Inhibitory Effects of Euphorbia characias Extracts. BioMed Res. Int. 2018, 2018, 1219367. [Google Scholar] [CrossRef]
  21. Park, J.S.; Rho, H.S.; Kim, D.H.; Chang, I.S. Enzymatic Preparation of Kaempferol from Green Tea Seed and Its Antioxidant Activity. J. Agric. Food Chem. 2006, 54, 2951–2956. [Google Scholar] [CrossRef] [PubMed]
  22. Mohamed Isa, S.S.P.; Ablat, A.; Mohamad, J. The Antioxidant and Xanthine oxidase Inhibitory Activity of Plumeria rubra Flowers. Molecules 2017, 23, 400. [Google Scholar] [CrossRef] [PubMed]
  23. Hou, M.; Hu, W.; Xiu, Z.; Jiang, A.; Men, L.; Hao, K.; Sun, X.; Cao, D. Preparative Purification of Total Flavonoids from Sophora tonkinensis Gagnep. by Macroporous Resin Column Chromatography and Comparative Analysis of Flavonoid Profiles by HPLC-PAD. Molecules 2019, 24, 3200. [Google Scholar] [CrossRef] [PubMed]
  24. Meng, Q.; Meng, W.; Bian, H.; Zheng, F.; Gu, H.; Zuo, R.; Miao, X.; Zhou, Z.; Wang, L.; Wen, Z.; et al. Total glucosides of paeony protects THP-1 macrophages against monosodium urate-induced inflammation via MALAT1/miR-876-5p/NLRP3 signaling cascade in gouty arthritis. Biomed. Pharmacother. 2021, 138, 111413. [Google Scholar] [CrossRef]
  25. Mosmann, T. Rapid colorimetric assay for cellular growth and survival: Application to proliferation and cytotoxicity assays. J. Immunol. Methods 1983, 65, 55–63. [Google Scholar] [CrossRef]
  26. Dabeek, W.M.; Marra, M.V. Dietary quercetin and kaempferol: Bioavailability and potential cardiovascular-related bioactivity in humans. Nutrients 2019, 11, 2288. [Google Scholar] [CrossRef]
  27. Li, G.; Zeng, X.; Xie, Y.; Cai, Z.; Moore, J.C.; Yuan, X.; Cheng, Z.; Ji, G. Pharmacokinetic properties of isorhamnetin, kaempferol and quercetin after oral gavage of total flavones of Hippophae rhamnoides L. in rats using a UPLC–MS method. Fitoterapia 2012, 83, 182–191. [Google Scholar] [CrossRef]
  28. Irondi, A.E.; Oboh, G.; Agboola, S.O.; Boligon, A.A.; Athayde, M.L. Phenolics extract of Tetrapleura tetraptera fruit inhibits Xanthine oxidase and Fe2+-induced lipid peroxidation in the kidney, liver, and lungs tissues of rats in vitro. Food Sci. Hum. Wellness 2016, 5, 17–23. [Google Scholar] [CrossRef]
  29. Ademosun, A.O.; Oboh, G.; Passamonti, S.; Tramer, F.; Ziberna, L.; Boligon, A.A.; Athayde, M.L. Phenolics from grapefruit peels inhibit HMGCoA reductase and angiotensin-I converting enzyme and show antioxidative properties in endothelial EA. Hy 926 cells. Food Sci. Hum. Wellness 2015, 4, 80–85. [Google Scholar] [CrossRef]
  30. Irondi, E.A.; Oboh, G.; Akindahunsi, A.A.; Boligon, A.A.; Athayde, M.L. Phenolic composition and inhibitory activity of Mangifera indica and Mucuna urens seeds extracts against key enzymes linked to the pathology and complications of Type 2 diabetes. Asian Pac. J. Trop. Biomed. 2014, 4, 903–910. [Google Scholar] [CrossRef]
  31. Ngoc, T.M.; Khoi, N.M.; Ha, D.T.; Nhiem, N.X.; Tai, B.H.; Don, D.V.; Luong, H.V.; Son, D.C.; Bae, K. Xanthine oxidase inhibitory activity of constituents of Cinnamomum cassia twigs. Bioorg. Med. Chem. Lett. 2012, 22, 4625–4628. [Google Scholar] [CrossRef] [PubMed]
  32. Dalbeth, N.; Gosling, A.L.; Gaffo, A.; Abhishek, A. Gout. Lancet 2021, 15, 1843–1855. [Google Scholar] [CrossRef] [PubMed]
  33. Martinon, F.; Pétrilli, V.; Mayor, A.; Tardivel, A.; Tschopp, J. Gout-associated uric acid crystals activate the NALP3 inflammasome. Nature 2006, 440, 237–241. [Google Scholar] [CrossRef]
  34. Cos, P.; Ying, L.; Calomme, M.; Hu, J.P.; Cimanga, K.; Van Poel, B.; Pieters, L.; Vlietinck, A.J.; Vanden Berghe, D. Structure-activity relationship and classification of flavonoids as inhibitors of Xanthine oxidase and superoxide scavengers. J. Nat. Prod. 1998, 61, 71–76. [Google Scholar] [CrossRef] [PubMed]
  35. Nagao, A.; Seki, M.; Kobayashi, H. Inhibition of Xanthine oxidase by flavonoids. Biosci. Biotechnol. Biochem. 1999, 63, 1787–1790. [Google Scholar] [CrossRef]
  36. Thuaytong, W.; Anprung, P. Bioactive compounds and prebiotic activity in Thailand-grown red and white guava fruit (Psidium guajava L.). Food Sci. Technol. Int. 2011, 17, 205–212. [Google Scholar] [CrossRef]
  37. Lim, Y.Y.; Lim, T.T.; Tee, J.J. Antioxidant properties of several tropical fruits: A comparative study. Food Chem. 2007, 103, 1003–1008. [Google Scholar] [CrossRef]
  38. Marinova, D.; Ribarova, F.; Atanassova, M. Total phenolics and total flavonoids in Bulgarian fruits and vegetables. J. Univ. Chem. Technol. Metall. 2005, 40, 255–260. [Google Scholar]
Figure 1. The flowchart of the experimental design.
Chemistry 07 00073 g001
Figure 2. Contents of flavonoids in various ethanol extracts of DFG. Values are presented as the mean ± SD of three independent experiments. *** p < 0.001 compared to the DFG 20% ethanol extract group.
Chemistry 07 00073 g002
Figure 3. XOI in various ethanol extracts of DFG and allopurinol. Values are presented as mean ± SD of three independent experiments. * p < 0.05 compared to the DFG 20% ethanol extract group.
Chemistry 07 00073 g003
Figure 4. Effects of Fr-75 and its active compounds (quercetin and kaempferol) on MSU-challenged THP-1 cell viability. THP-1 cells were treated with different doses of Fr-75 (15, 25, 37.5, 50, or 75 μg/mL) (A) and different doses of quercetin and kaempferol (2.5, 5, 10, 20 or 40 μM) (B,C) for 24 h followed by MSU (200 μg/mL) stimulation for 18 h. Cell viability was assessed by MTT assay, and the data represent the mean ± SD. * p < 0.05 vs. control group (0.1% DMSO) (n = 4).
Chemistry 07 00073 g004
Figure 5. HPLC-DAD chromatogram at 320 nm (A) and LC–ESI (−)-MS TIC (B) of the 70% ethanol extract of DFG. The peak numbers are referred to in Table 4.
Chemistry 07 00073 g005
Figure 6. Effects of kaempferol, quercetin, and Fr-75 on MSU crystal-induced inflammatory response in gene expressions of NFκB (A) and NLRP3 (B) in THP-1 cells. Values are presented as mean ± standard deviation (n = 4). * p < 0.05, ** p < 0.01, and *** p < 0.001 compared to the MSU group (0.1% DMSO); # p < 0.05 and ## p < 0.01 compared to the kaempferol group.
Chemistry 07 00073 g006
Table 1. Structure of quercetin and kaempferol.
Chemistry 07 00073 i001
CompoundR1R2
QuercetinOHOH
KaempferolHOH
Table 2. Primers for real-time PCR analyses.
Name (Accession No.)Sequence (5′ to 3′)Product
Length (bp)
NFκB
(XM_054350114.1)
F: aacagcagatggcccatacc
R: aacctttgctggtcccacat
175
NLRP3
(NM_001079821.3)
F: attcggagattgtggttggg
R: gagggcgttgtcactcaggt
117
βactin
(NM_001101.5)
F: attggcaatgagcggttc
R: ggatgccacaggactccat
186
F: forward; R: reverse.
Table 3. Effect of fractions of guava extracts on cell viability in THP-1 macrophages a.
% of Cell Viability at Various Concentrations
Group15 μg/mL25 μg/mL37.5 μg/mL50 μg/mL75 μg/mL
Fr-051.11 ± 1.7350.20 ± 3.7151.09 ± 4.3350.63 ± 1.0349.33 ± 2.02
Fr-2548.12 ± 3.7046.07 ± 7.1645.26 ± 3.7848.94 ± 5.8049.41 ± 2.36
Fr-5047.49 ± 1.5750.84 ± 4.6050.04 ± 3.1658.48 ± 6.35 *60.44 ± 2.73 *
Fr-7551.29 ± 2.0354.24 ± 0.61 *55.59 ± 1.79 *60.39 ± 2.61 *68.66 ± 5.96 *
Fr-9538.91 ± 3.1340.07 ± 4.8740.87 ± 2.6745.00 ± 2.4246.50 ± 2.42
1.18 μM2.36 μM4.72 μM9.43 μM18.87 μM
Benzbromarone b46.44 ± 1.9845.37 ± 3.5346.56 ± 4.2357.26 ± 1.35 *64.14 ± 3.88 *
a Cell viability was assessed by MTT assay, and the data represent the mean ± SD. b Benzbromarone is positive control in this assay. * p < 0.05 vs. control group (0.1% DMSO) (n = 4).
Table 4. Identification of the compositions of Fr-75 of DFG extract using HPLC-DAD, LC-MS, and LC-MS-MS.
Peak
No.
Rt
(min)
Compoundλmax (nm)[M−H]MS/MSArea%
12.633-Caffeoylquinic acid a3253531911.90
24.425-Caffeoylquinic acid a3253531912.07
35.23Caffeic acid 220, 3241791352.56
46.91Unidentified220, 270643--1.06
57.31Unidentified220, 300335--0.27
68.83Quercetin-3-O-rutinoside b220, 254, 350609300, 3011.64
79.32Quercetin-3-O-glucoside a220, 254, 350463300, 301, 271, 25510.78
810.22Kaempferol-3-O-rutinoside a220, 265, 345593285, 284, 3262.65
910.75Kaempferol-3-O-glucoside a220, 265, 345447284, 285, 2553.49
1011.83Quercetin derivatives a220, 265, 350601285, 300, 301, 593, 4631.51
1112.98Quercetin derivatives a220, 270, 350593463, 301, 3001.29
1214.00Quercetin-3-O-coumaroyl-galactoside a220, 315, 265609463, 301, 30013.30
1314.52Quercetin-3-O-coumaroyl-glucoside a220, 270609300, 463, 3010.86
1415.36Quercetin b254, 370603301, 179, 15128.57
1516.27Kaempferol-3-O-rutinoside a220, 315, 265593285, 284, 3073.20
1620.16Kaempferol b220, 365, 265285185, 22912.73
Total 87.88
a Compounds were tentatively identified according to mass spectra and matched data from the literature. b Identification was further confirmed using an authentic compound. --, Indicates that it cannot be detected.
Disclaimer/Publisher’s Note: The statements, opinions and data contained in all publications are solely those of the individual author(s) and contributor(s) and not of MDPI and/or the editor(s). MDPI and/or the editor(s) disclaim responsibility for any injury to people or property resulting from any ideas, methods, instructions or products referred to in the content.

