Review

Experimental Methods and Nonlinear Optical Properties of Open-Shell Molecular Species

Nanomaterials Research Institute (NMRI), National Institute of Advanced Industrial Science and Technology (AIST), Ikeda 563-8577, Osaka, Japan
Chemistry 2025, 7(3), 67; https://doi.org/10.3390/chemistry7030067
Submission received: 31 January 2025 / Revised: 22 March 2025 / Accepted: 26 March 2025 / Published: 22 April 2025

Abstract

:
Degenerate third-order nonlinear optical (NLO) responses of organic molecules have a wide range of applications in science and engineering because they relate to the intensity-dependent refractive index (IDRI) and nonlinear absorption (NLA), such as two-photon absorption (TPA). Among the many molecular systems, open-shell molecular species such as intermediate singlet diradicaloids have attracted considerable attention because of their enhanced response, predicted theoretically by Nakano et al. Experimental studies for proofing and evaluating the enhanced nonlinearities play an important role in the development of the field. This tutorial review provides the solid fundamentals of the NLO processes of open-shell molecular species even to those who are not familiar with the experimental works. Its scope ranges from the basics of NLO responses, definitions, and interrelations of the key parameters of the responses, such as hyperpolarizability and TPA cross-section, to the experimental techniques used to evaluate them. Including the recent achievements, the evolution of experimental works on the TPA properties of singlet diradicaloids is also reviewed according to families of molecular structures.

Graphical Abstract

1. Introduction

The nonlinear optical (NLO) responses of organic molecules have a wide range of applications in science and engineering. In particular, the responses originating from third-order nonlinearity are important because they impact the intensity-dependent refractive index (IDRI) and nonlinear absorption (NLA) such as two-photon absorption (TPA). The IDRI is indispensable for understanding the self-focusing and defocusing of laser beams and realizing the optical switch controlled by light [1]. TPA has been used for 3D microfabrication [2,3], 3D fluorescence imaging [4], 3D optical storage [5], optical limiting [6,7], etc. Organic molecular systems are considered to be good third-order NLO materials and are studied extensively. For the last few decades, a large number of molecules have been explored for their large third-order NLO response and to understand the structure–property relationship. Almost all of them have a closed-shell electronic structure, with two valence electrons with antiparallel spin in HOMO of their ground (thus, singlet) state. However, Prof. Masayoshi Nakano opened up a way to a new world. He predicted, in a theoretical manner, that open-shell molecules—more specifically, intermediate singlet diradicaloids—have an enhanced third-order NLO response. His theoretical prediction was supported by experimental works of nonlinear optical measurements. Thus, optical measurements have also played an important role in establishing the concept of “open-shell optical nonlinearity” as he recognized it.
The second hyperpolarizability γ and TPA cross-section σ 2 are key parameters to express the NLO properties of a molecule of interest. Researchers have concentrated and devoted their efforts to enhance these parameters. However, how the parameters are defined, how they are connected to the optical phenomena that we can observe, and how they are experimentally determined are not widely recognized, in spite of the important role of optical measurements. The aim of this tutorial review is to provide the solid fundamentals of optical nonlinearity (basic concept, definitions of the key parameters, and their cross-relations) and basic knowledge on how they are measured for those who are interested in the third-order NLO and TPA properties of open-shell electronic species. Another important aim is compiling the evolution of experimental works on the TPA properties of intermediate open-shell molecules and singlet diradicaloids, including the latest achievements, in an organized manner.
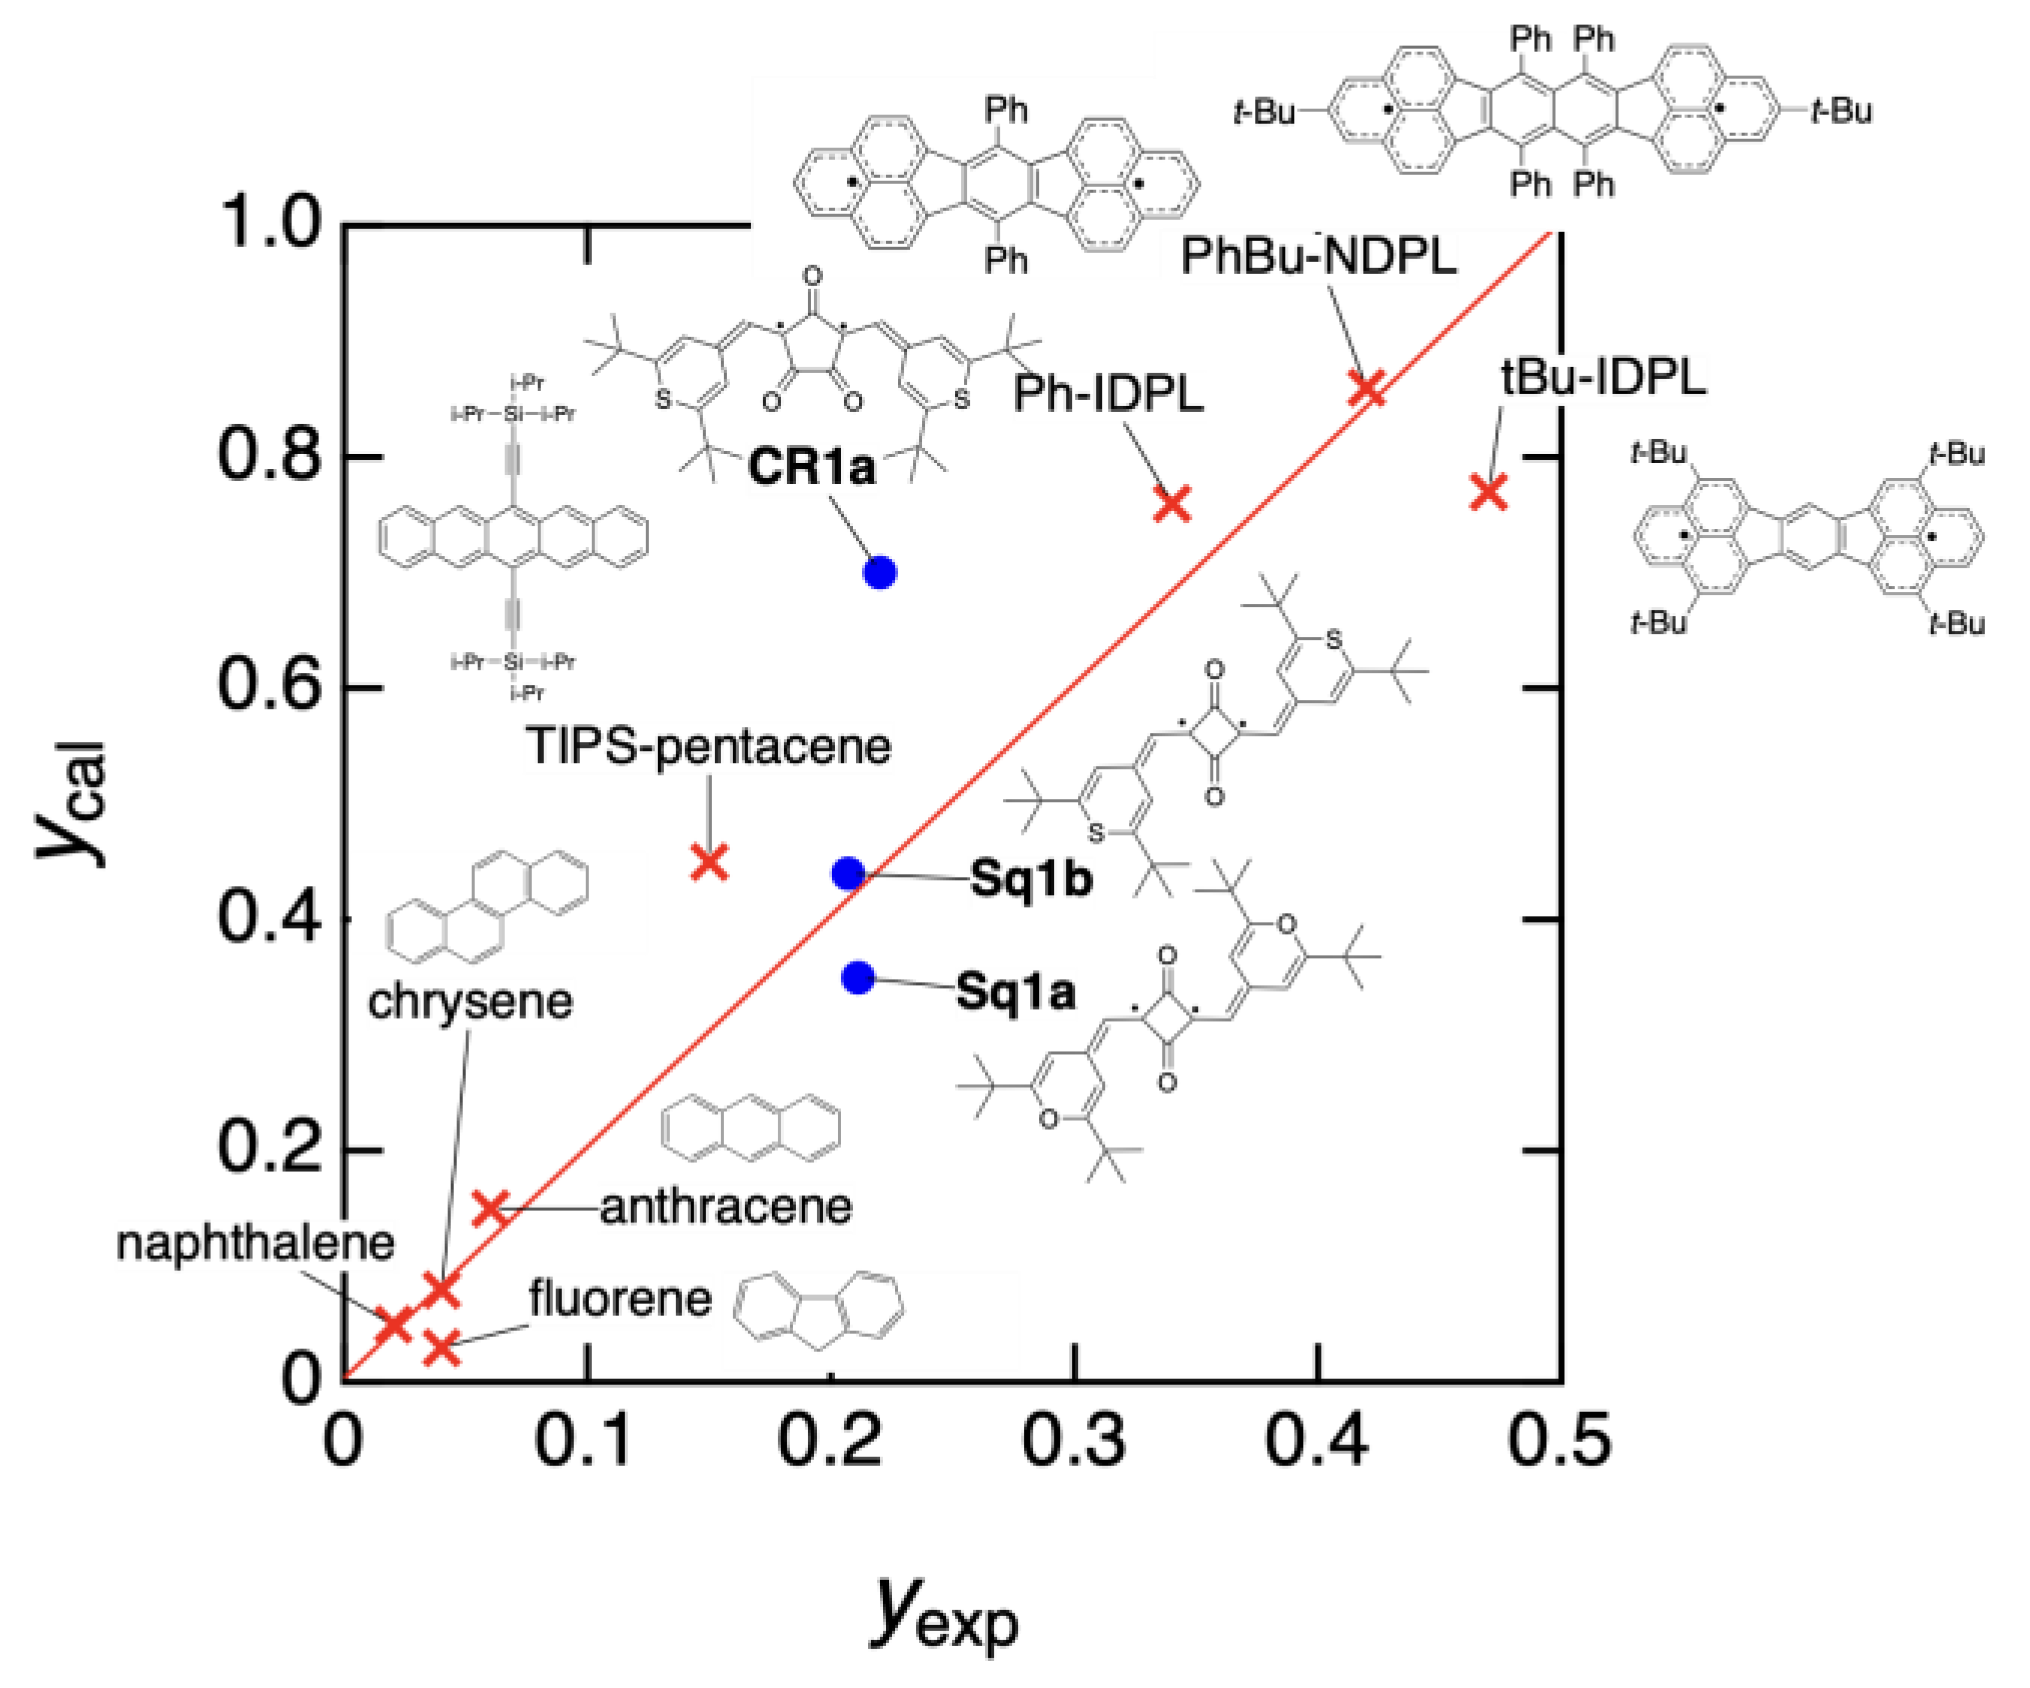
NLO processes are very rich in variety and lead to totally different phenomena depending on the experimental conditions, symmetries, and electronic properties of the materials. Thus, the following sections of this paper are organized as follows. First, the concept of optical nonlinearity, which is the basis of all NLO processes, is summarized (Section 2). In this section, we focus on the degenerate third-order NLO process, introducing complex amplitudes. The real and imaginary parts relate to the IDRI and TPA, respectively, and are two sides of the same coin. In Section 3, the major measurement techniques of the NLO responses are introduced and detailed explanations are given for the open-aperture Z-scan method, the most frequently used method for singlet diradicaloids. They have a small HOMO–LUMO gap and are weak or non-fluorescent. This is one reason that the open-aperture Z-scan method is preferred for the measurements of singlet diradicaloids. Section 4 is devoted to the review of experimental works on the TPA of singlet diradicaloids organized by molecular structure. The section ends with the experimental determination of the diradical character ( y ), a key parameter to describe the degree of diradical nature of a molecule. It also connects the theory and experiments.

2. Theoretical Basis of Measurements of the Nonlinear Optical Properties of Molecules

Here, we consider the optical response of dielectric materials, which are nonconductive, and in which all electrons are bounded by nearby atomic nuclei. Then, the optical responses can be modeled with a collection of harmonic oscillators. Simple physics shows that harmonic oscillators have a restoring force proportional to the displacement induced by the applied field. Light is an electromagnetic wave and consists of an oscillating electric field. Under the applied field of light of a given frequency, the dipole oscillators oscillate at the same frequency (forced oscillation) and no other frequency component is generated. We call this situation in the materials a linear optical response. However, under a strong applied field, i.e., intense light such as laser pulses, the restoring force can no longer hold the proportionality in relation to the displacement, and anharmonicity of the dipole oscillators becomes important. The optical responses originating from the anharmonicity are called nonlinear responses because they are beyond the harmonic (linear) oscillator model. One can imagine a spring connecting two weights as a model of the oscillator. If you pull or push the spring too much, the displacement will not be in proportion to the force applied.
The NLO response of materials can provide many optical functions, for example, the conversion of a wavelength, manipulation of the phase and wavefront of a light beam, and spatially selective excitation. These optical functions cannot be achieved using the liner optical response. Unlike electrons, photons cannot interact with each other directly without the NLO response of materials. Therefore, NLO responses and NLO materials are the key to the advanced use of light.

2.1. Polarization and Optical Response of Materials

Polarization P is the most important parameter to understand the optical response of materials (hereafter, bold letters indicate 3D vector). It is the net displacement of charge in the materials induced by the external electric field E , so it is the ensemble of induced dipole moments of the molecules constituting the material. Most electrically neutral materials, except ferroelectrics, have no permanent polarization; i.e., the center of negative charges (electrons) matches that of positive charges (nuclei) when the external field is absent ( E = 0 ). Even if the material is neutral at the macroscopic scale, it can respond to the electric field because it consists of charged particles, i.e., electrons and nuclei. With the external electric field ( E 0 ), the centers of negative and positive charges move in opposite directions due to their coulombic interaction with E , so the displacements cause polarization (Figure 1).
Light is an electromagnetic wave oscillating at a high frequency of 1014–1015 Hz, so the electric field E oscillates at that frequency and is written as a function of time E ( t ) . Since electric field induces polarization, P also oscillates as P ( t ) . The oscillating polarization P ( t ) acts as a transmission antenna of a new electromagnetic wave E ( t ) (Figure 2). This is because it is the same mechanism as the dipole antenna for radio, although the frequencies are very different. The generated wave E ( t ) overlaps with the incident wave E ( t ) and their sum E t o t t = E t + E ( t ) results in the optical phenomena we can observe (refraction and absorption). P ( t ) and E t o t t obey the wave equation [8]:
× × E t o t t + 1 c 0 2   2 t 2 E t o t t + 1 ε 0 c 0 2   2 t 2 P t = 0 .
This equation suggests that we can predict any optical responses of the material once we know everything about P ( t ) . Knowing P ( t ) is therefore important for understanding the optical responses of the material.
Figure 2. Mechanism of optical response arising from polarization.
Chemistry 07 00067 g002

2.2. Linear and Nonlinear Polarizations

Polarization P is recast into a power series of E :
P = ε 0 χ 1 E + ε 0 K 2 χ 2 E 2 + ε 0 K 3 χ 3 E 3 + ,
and divided into
P = P 1 + P 2 + P 3 + ,
where P n (n = 1, 2, 3…) is the n-th order polarization. By comparing Equations (2) and (3), the first-order (or linear) polarization is
P 1 = ε 0 χ 1 E ,
where ε 0 is the dielectric constant in vacuum and χ 1 is the first-order (or linear) susceptibility, which is a second-rank tensor with nine components because P and E are 3D vectors ( 3 × 3 ). The susceptibility we concentrate on here is “electric” susceptibility. The superscript “(1)” means the first order. Optical responses arising from P 1 are thus called linear optical responses. Clearly, the frequency of the polarization is the same as that of the applied field. This means that the generated light from P 1 has the same wavelength as the incident light, but the phase can be different. This leads to changes in phase and amplitude, resulting in well-known phenomena such as refraction, reflection, and absorption.
The n-th order nonlinear polarization (n > 1) can be written with n-th order susceptibility χ n as
P 2 = ε 0 K 2 χ 2 E 2 ,
P 3 = ε 0 K 3 χ 3 E 3 ,
and
P n = ε 0 K n χ n E n ,
where K n is the numerical factor for the n-th order process, which will be explained in the next section. Like the linear case, the optical responses originating from P n are called nonlinear optical responses, which have a large number of varieties depending on the combination of frequencies applied. For example, P 2 causes the second-order NLO processes such as the second harmonic generation (SHG, ω + ω = 2 ω ), sum–frequency mixing (SFM, ω 1 + ω 2 ), differential–frequency mixing (DFM, ω 1 ω 2 ), optical rectification (OR, ω ω = 0 ), and Pockels effect (also known as the electro-optical effect, ω ± 0 = ω ). In the same way, P 3 causes the third-order NLO processes, such as the third-harmonic generation (THG, ω + ω + ω = 3 ω ), four-wave mixing (FWM, ω 1 ± ω 2 ± ω 3   = ω 4 ), degenerate four-wave mixing (DFWM, ω ω + ω = ω ), intensity-dependent refractive index change and self-focusing/defocusing (also ω ω + ω = ω ), coherent anti-Stokes/Stokes Raman scattering (CARS/CSRS, ω 1 ω 1 + ω 2 = ω 2 ), and two-photon absorption (TPA, ω ω + ω = ω ) . For the higher orders, the number of combinations increases, but the intensity of the response decreases significantly (by 32 orders of magnitude as the nonlinearity increases by 1 order [9]). Further details of the individual NLO processes can be found in text books [9,10]. In this review, we concentrate on the degenerate third-order NLO processes and, in particular, on the TPA process. The term “degenerate” means that all optical frequencies involved are the same. The degenerate third-order NLO process is related to intensity-dependent change in refraction and absorption in single-beam experiments.
If Equation (4) is expressed with their components in the laboratory coordinate system i , j = x , y , z ,
P i 1 = ε 0 χ i j 1 E j .
On the right-hand side, the summation is made over the suffixes that appear repeatedly, i.e., j here (Einstein’s summation notation). Before proceeding to higher-order polarization, it is better to define the complex amplitude. The electric field and the polarization, which are real numbers, are expressed by using complex numbers and their complex conjugates (c.c.), as follows:
E i ( t ) = K A i , ω exp i ω t + c . c . ,
and
P i ( t ) = K P i , ω exp i ω t + c . c . ,
where A i , ω and P i , ω are the complex amplitudes of the electric field and the polarization along i-axis at frequency ω . The numerical factor K is 1/2, but some authors use K = 1 . The choice of K makes no difference to the linear response because the K s in equations cancel each other out. Meanwhile, for n-th-order NLO responses, the choice makes K n 1 -fold difference in the value of the polarization. Thus, the same value must be used in all formulations to obtain a consistent result.
With these complex amplitudes, Equation (8) is rewritten as
P i , ω ( 1 ) = ε 0 χ i j 1 ( ω ; ω ) A j , ω
This equation looks the same as Equation (8), but the parameters are now complex numbers. Complex parameters can represent both changes in phase (the real part of the susceptibility) and amplitude (the imaginary part). The use of complex numbers is beneficial for NLO processes in the later sections. The pair of frequencies in the parentheses “ ( ω ; ω ) ” stands for the output ( ω ) and input ( ω ) frequencies. The sign of the output (i.e., polarization) frequency is taken to be negative so that their sum is zero ( ω + ω = 0 ) .

2.3. Third-Order Optical Nonlinearity

2.3.1. Macroscopic Third-Order Optical Nonlinearity

Like linear polarization, third-order nonlinear polarization is represented with the complex amplitudes as follows:
P i , ω σ 3 = ε 0 K 3 χ i j k l 3 ω σ ; ω 1 , ω 2 , ω 3 A j , ω 1 A k , ω 2 A l , ω 3 .
All information on material response is represented by the third-order nonlinear susceptibility tensor χ i j k l 3 , consisting of 81 components ( 3 × 3 × 3 × 3 ). Here, the frequency of the polarization component ω σ is the sum of the frequencies of all incident waves, ω σ = ω 1 + ω 2 + ω 3 . The [polarization direction, frequency] pairs for the incident light are [j, ω 1 ], [k, ω 2 ], and [l, ω 3 ], and that for the output light is [i, ω σ ].
The numerical factor is an annoying issue. That for the third-order polarization is
K 3 = G K 3 1 D
where G is the expansion factor of series expansion: G = 1 for Bloembergen expansion (i.e., the power expansion) and G = 1/6 for the Taylor expansion ( G = 1/(n!) for the n-th order process). K is the numerical factor in the conventions of complex amplitudes (Equations (9) and (10)) and appears here because of the different orders between the left and right sides of the equation. The exponent “3-1” comes from the difference between the numbers of nonzero input and output frequencies. If we use K = 1 / 2 , then the value of this factor is K 3 1 = 1 / 4 . D is the number of distinguishable orders in input frequencies. Here, D = 3 for the single-beam experiments. A detailed discussion of these numerical factors is available elsewhere [11].
In the degenerate cases, all input and output frequencies are equal to each other. The single-beam experiment is an example. Then, the third-order nonlinear polarization induced by a single beam of [i, ω ] is given by
P i , ω 3 = ε 0 K 3 χ i j k l 3 ω ; ω , ω , ω A j , ω A k , ω * A l , ω ,
where K3 = 3/4 for Bloembergen expansion or 1/8 for Taylor-series expansion.

2.3.2. Microscopic Third-Order Optical Nonlinearity

The microscopic counterpart of the polarization is the induced dipole moment µ i n d , which can be expressed with the power series of the local field F as
µ i n d = α F + β F 2 + γ F 3 + ,
where α is polarizability, β is the first hyperpolarizability, and γ is the second hyperpolarizability. These are tensor quantities that represent the molecular properties of linear and nonlinear optical responses. The second hyperpolarizability is the origin of the third-order NLO responses at the molecular level and is a key physical quantity in this review.
F in Equation (15) is the electric field actually felt by the molecules and differs from the macroscopic applied field E due to the reaction field formed by the surrounding molecules such as solvent molecules. F and E are related to the local field correction factor f as F = f E , where
f = n 2 + 2 3       .
Here, n is the refractive index of the solvent. This is known as the Lorentz–Lorenz correction factor and is obtained by assuming a spherical cavity around the molecule in non-dipolar, homogeneous media [12]. Because of its simplicity, this correction factor is often used also for the media for which the original theory cannot be strictly applied.
Comparing the microscopic relation (Equation (15)) with the macroscopic one (Equation (2)), the following correspondences between the polarizability and susceptibility are obtained: α χ ( 1 ) for the linear optical process and β χ ( 2 ) and γ χ ( 3 ) for the second- and third-order NLO processes. To connect them quantitatively, the orientational average must be considered. For an isotropic material in which the molecules are randomly oriented, the third-order susceptibility is
χ i i i i 3 ω ; ω , ω , ω = N f 4 ε 0 γ ω ; ω , ω , ω ,
where N is the number density and ⟨⬚〉 means the orientational average. The orientational average of γ is written with its tensor components in the molecular coordinate ( ξ , η , ζ ) as
γ = 1 5 ( γ ξ ξ ξ ξ + γ η η η η + γ ζ ζ ζ ζ ) + 1 15 γ ξ ξ η η + γ ξ η ξ η + γ ξ η η ξ + γ η η ξ ξ + γ η ξ η ξ + γ η ξ ξ η + 1 15 γ ξ ξ ζ ζ + γ ξ ζ ξ ζ + γ ξ ζ ζ ξ + γ ζ ζ ξ ξ + γ ζ ξ ζ ξ + γ ζ ξ ξ ζ         + 1 15 γ η η ζ ζ + γ η ζ η ζ + γ η ζ ζ η + γ ζ ζ η η + γ ζ η ζ η + γ ζ η η ζ  
where ξ ,     η , and ζ are the axes in the molecule-fixed coordinate system [13]. For the static hyperpolarizability γ 0 ; 0,0 , 0 , Kleinman’s symmetry rule gives the relation of γ α α β β = γ α β α β = γ α β β α = γ β β α α = γ β α β α = γ β α α β , where α β { ξ , η , ζ } and then Equation (18) is reduced to the following well-known expression:
γ 0 ; 0,0 , 0 = 1 5 γ ξ ξ ξ ξ + γ η η η η + γ ζ ζ ζ ζ + 2 γ ξ ξ η η + 2 γ ξ ξ ζ ζ + 2 γ ζ ζ ξ ξ .
However, for γ ω ; ω , ω , ω , only the permutations between the pairs with the same polarization directions and frequencies are allowed. Thus, γ α α β β = γ β β α α = γ α β β α = γ β α α β γ α β α β = γ β α β α . The orientational average is given as
γ ω ; ω , ω , ω = 1 5 γ ξ ξ ξ ξ + γ η η η η + γ ζ ζ ζ ζ + 4 15 γ ξ ξ η η + γ η η ζ ζ + γ ζ ζ ξ ξ + 2 15 γ ξ η ξ η + γ η ζ η ζ + γ ζ ξ ζ ξ .
If the molecule of interest is assumed to have only one significant component, such as γ ζ ζ ζ ζ , then the orientational averaging is simplified to γ ω ; ω , ω , ω = ( 1 / 5 ) γ ζ ζ ζ ζ . This approximation may be valid for a linear π-conjugate system.

2.4. Nonlinear Index of Refraction

An intense optical field can change the refractive index of a material, known as nonlinear refractivity. The change in refractive index can be described phenomenologically as
n I = n 0 + n 2 I I ,
where n0 is the intensity-independent refractive index, i.e., the linear refractive index, while n 2 I is the so-called nonlinear refractive index. This convention is based on the optical intensity I. There is another convention based on the complex amplitudes, that is,
n I = n 0 + n 2 A i , ω A i , ω *   .
The conversion between the two nonlinear refractive indexes are given by n 2 I = n 2 / K 2 ε 0 n 0 c because the optical intensity is I = 2 ε 0 n 0 c A i , ω A i , ω * for K = 1 or I = 1 / 2 ε 0 n 0 c A i , ω A i , ω * for K = 1/2 in Equation (9).
The nonlinear refractive index is expressed with the real part of the third-order susceptibility as
n 2 = 3 4 n 0   R e χ i i i i 3 ω ; ω , ω , ω ,
or
n 2 I = n 2 K 2 ε 0 n 0 c = 3 4 K 2 ε 0 n 0 2 c R e χ i i i i 3 ω ; ω , ω , ω ,
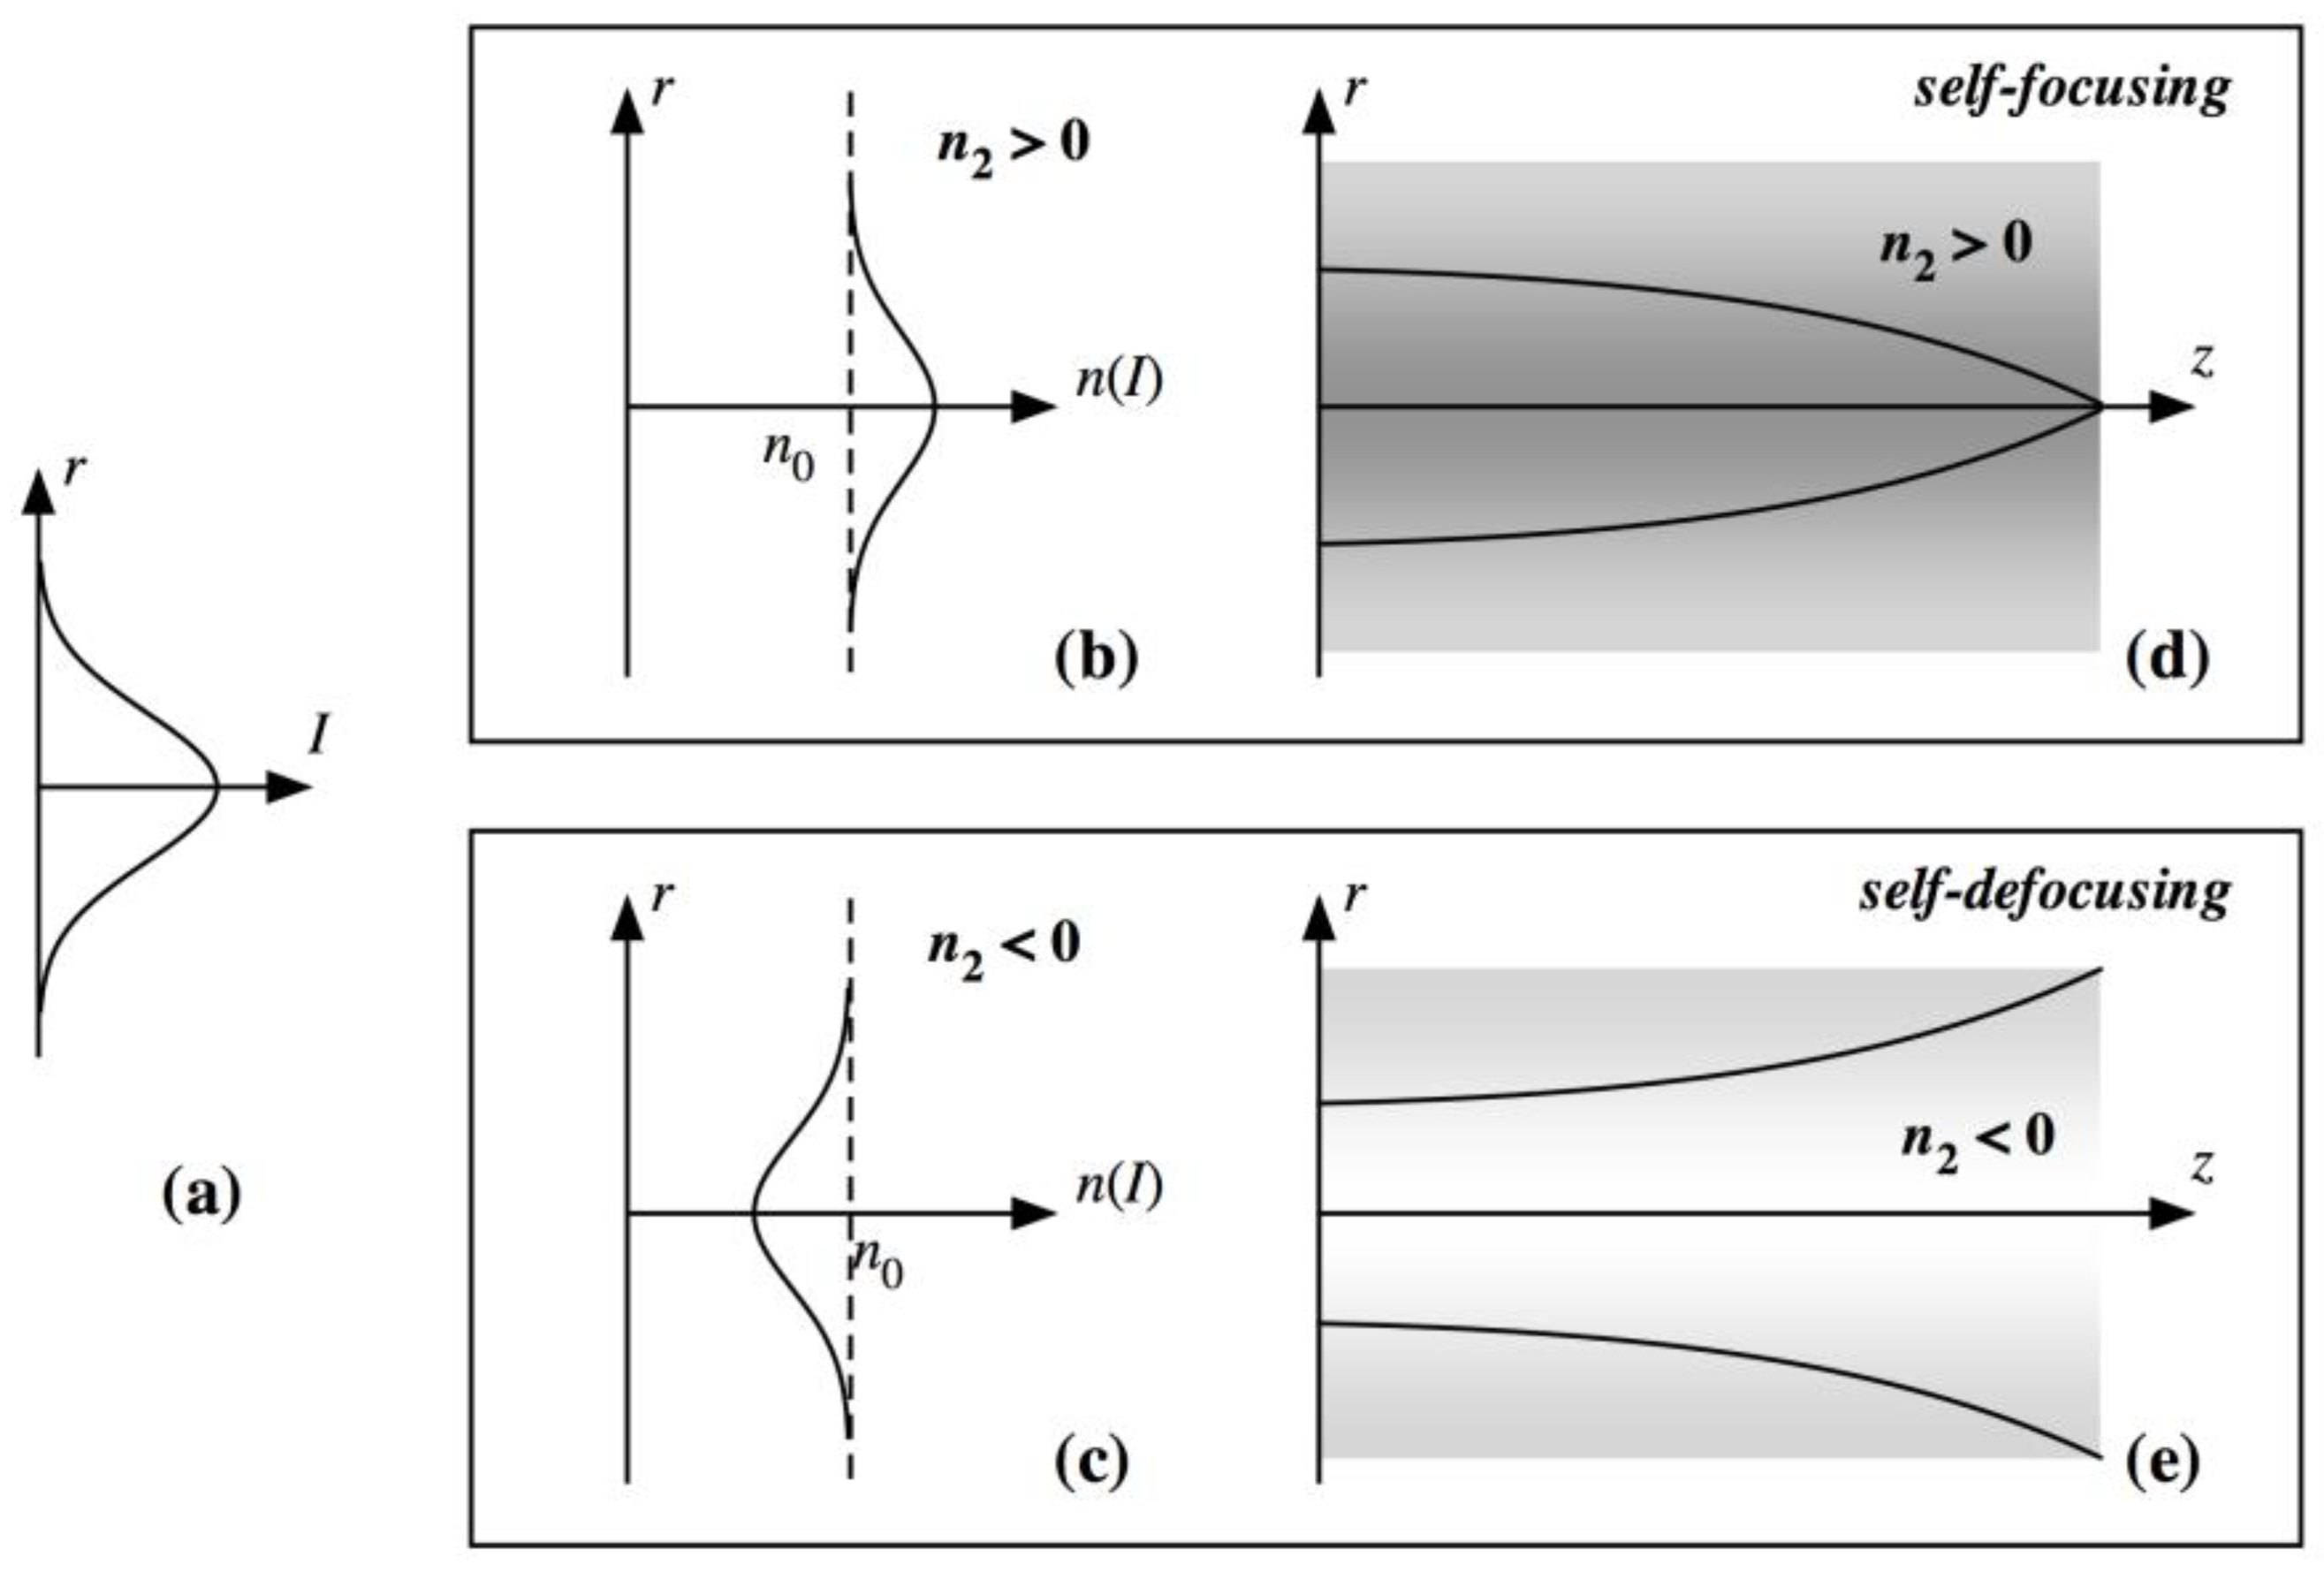
These equations can describe self-action effects. Incident light induces the refractive index change and then it affects the propagation characteristics of the light itself. Typically, a laser beam has a non-uniform transverse intensity profile in which the intensity is strongest at the center of the beam and gradually weakens with increasing distance from the center (Figure 3a). The non-uniform beam produces a non-uniform distribution of refractive index through the n2 term in Equation (22) (or n 2 I term in Equation (21)). When n2 is positive, the refractive index at the center of the beam increases (Figure 3b). Therefore, the refractive index distribution has axial symmetry. The refractive index decreases as the radial direction increases. This refractive index gradient acts as a convex lens. This causes the beam to converge, i.e., self-focusing (Figure 3d). Self-focusing is often observed when an intense pulsed laser beam is irradiated into a thick or long medium. Under certain conditions, the focused beam propagates for a long distance without changing its diameter, which is called filamenting. This phenomenon occurs when the convergence of self-focusing equals the divergence due to diffraction. The laser beam is confined by the refractive index gradient induced by the beam itself.
On the other hand, when n 2 is negative (Figure 3c), the refractive index is reduced at the center of the beam. This opposite gradient can act as a concave lens. The beam diverges as it propagates, so this phenomenon is called a self-defocusing effect (Figure 3e). The most likely mechanism to cause this phenomenon in an absorbing medium is the thermal refractive index change. The absorbed energy of photons raises the local temperature, resulting in the reduction of the refractive index due to volume expansion. This is not a molecular NLO process, but it is the dominant process of self-defocusing in many experiments.
When the second beam is introduced, the refractive index change induced by one beam can be detected by the other beam. This is called a cross-action effect. When combined with a Mach–Zehnder interferometer or other interferometric technique, the transmission of the second beam can be switched by the first beam. This can be used for optical switching.

2.5. Two-Photon Absorption

TPA is the simultaneous absorption of two photons accompanied by a single electronic transition and is a third-order NLO phenomenon. It is a non-elastic process with energy dissipation, so it is described by the imaginary part of the third-order susceptibility. It is also called as a resonant NLO process because it causes a transition that results in a net change in the electron population.
TPA is probably the oldest NLO phenomenon, first predicted by Maria Göppert-Mayer in 1929 [14] in the incunabula of quantum mechanics. For three decades, however, it had remained a theoretical possibility because, as she herself noted, the transition probability was too small to be observed at that time. The invention of the laser in 1960 changed the situation. The following year, Kaiser and Garrett experimentally observed the TPA-induced fluorescence of Eu ions [15]. Since then, TPA has been used as a spectroscopic technique to access so-called forbidden states. In the last two decades, the TPA of organic materials has attracted considerable attention due to its growing application in various fields—biology, photonics, nanotechnology, and medicine such as two-photon microscopy [4,16], 3D microlithography [3,17], optical data storage [5,18], and photodynamic therapy [19].
In the following section, we define the quantities related to TPA and derive the relation between them for quantitative treatment of TPA. First, we define the TPA coefficient, which is a macroscopic quantity and directly obtained by experimentation. Next, we reconsider the same process at the molecular level and then derive the TPA cross-section, which indicates how strongly a molecule shows TPA. The relation between the macroscopic and microscopic quantities is then given. This is followed by the relation with the third-order susceptibility.

2.5.1. Macroscopic Treatment

First, let us think about the change in optical intensity I after transmission through the sample of infinitesimal thickness d z (Figure 4a).
The infinitesimal change in intensity per thickness d I / d z can be expressed by the series expansion of the intensity as
d I d z = α 1 I + α 2 I 2 + α 3 I 3 +  
where the negative sign means a decrease in I . The proportionality factors α 1 , α 2 , and α 3 are the one-, two-, and three-photon coefficients, respectively.
First, we consider one-photon absorption (OPA), which shows the first-order dependence of I . For the case where only OPA exists, Equation (25) is truncated to the first order (the first term on the right-hand side) and is solved under the proper initial conditions (from I 0 to I for I and from 0 to L for z , where L is the sample thickness), which leads to the Beer–Lambert’s law:
I I 0 = exp α 1 L = exp A .
Here, A is Napierian absorbance, defined as
A = α 1 L .
For TPA, Equation (25) is truncated at I 2 -term. When OPA is negligible ( α 1 0 ), the solution is
I I 0 = 1 1 + α 2 I 0 L = 1 1 + q .
This equation gives the transmittance through a medium only having TPA and corresponds to Beer–Lambert’s law of OPA. Unlike Beer–Lambert’s law, this relation is only valid for the continuous plane wave because the temporal and spatial distributions of light intensity affect the strength of the TPA, as discussed in the later section. As an analogy to absorbance for OPA, two-photon absorbance can be defined as
q = α 2 I 0 L .
This simplifies the relation of Equation (28).
When OPA is not negligible ( α 1 > 0 ), Equation (28) can be rewritten as
I I 0 = T L 1 1 + q
where T L = exp A is the linear transmittance (Equation (26)) and q′ is the same as in Equation (29), but L is replaced by the effective path length:
L e f f = 1 A α 1 = 1 exp α 1 L α 1
This parameter represents the effect of the depression by OPA and is shorter than the physical path length L. For the limit α 1 0 , L e f f is reduced to L because L e f f 1 1 α 1 L / α 1 = L using the mathematical approximation of exp x 1 + x . Since T L is independent of the intensity I, Equation (30) is the product of the OPA factor ( T L ) and the TPA factor (the remaining). Decomposition into factors is not easy when three-photon absorption (3PA) is also present, because both TPA and 3PA are intensity-dependent processes. The solution of Equation (25) up to the I 3 term is mathematically complex and is not suitable for the curve-fit analysis of experimental data, although approaches using numerical calculation have been proposed [20].

2.5.2. Microscopic Treatment

Let us consider the same process again, but at the molecular level. Recall that optical intensity is defined as a flow of energy carried by the light per unit area and time. In the particle picture, light intensity is expressed as a flow of photons per unit area and time, i.e., photon flux Φ , multiplied by the photon energy ω as
I = ω Φ .
In the particle picture, absorption can be represented as the collision of a photon with a target molecule in the sample (Figure 4b). The probability of the collision increases with the size of the target. Thus, the probability is expressed as a quantity with the dimension of area, i.e., cross-section. For OPA, the absorption rate, i.e., the photon annihilation rate, is proportional to the photon flux; the proportional constant is the OPA cross-section multiplied by the number density N. For TPA where two photons are absorbed simultaneously, the annihilation rate should be proportional to the square of the flux. Thus, the infinitesimal change in the flux after passing through the sample, i.e., the annihilation rate, is
d Φ d z = N σ 1 Φ + σ 2 Φ 2 + σ 3 Φ 3 +   .
This is the microscopic counterpart of Equation (25). Here, σ 2 is two-photon absorption cross-section, a molecular quantity to show the TPA strength. In the same way, the proportionality constant of the n-th order term gives n-photon absorption cross-section σ n .
By comparing Equations (25) and (33) with the help of Equation (32), one can obtain the correspondence relations between the absorption coefficient and cross-section for OPA:
α 1 = ω N σ 1 Φ I = N σ 1 ,
for TPA:
α 2 = ω N σ 2 Φ 2 I 2 = N σ 2 ω ,
and for the n-photon absorption:
α n = ω N σ n Φ n I n = N σ n ω n 1   .
The units for the absorption coefficients and cross-sections are listed in Table 1. Note that σ 2 (cm4 s photon−1 molecule−1, or simply, cm4 s) does not have the dimension of area while the product of σ 2 and Φ (photon cm−2 s−1) has the dimension of area (cm2). This is readily understood from the fact that each term in Equation (33) has the same dimension. Typical values of σ 2 are close to the order of 10−50 cm4 s photon−1 molecule−1. A non-SI unit called “GM” (1 GM = 10−50 cm4 s photon−1 molecule−1) is frequently used in many papers for convenience. The abbreviation is named after Göppert-Mayer in honor of her pioneering work on TPA [14]. Some researchers like to use another convention of TPA cross-section: α 2 = N δ , with δ in the unit of cm4 W−1 or cm4 GW−1 for convenience. The interconversion between these TPA cross-sections is given by σ 2 = ω δ .

2.6. Relation Between TPA Coefficient and Third-Order Susceptibility

The TPA coefficient and cross-section are defined based on the change in light intensity or photon flux, while the third-order susceptibility, polarization, and the second hyperpolarizability are defined based on the electric field. Thus, the correspondence between these quantities is not straightforward, but it can be bridged by the change in optical intensity. The time derivative of the energy of light per unit volume is identical to the average power per unit volume expended by the field on inducing the polarization [21]:
d d t U V t i m e = E t d d t P 3 t t i m e
where ⟨⬚〉time represents time averaging. This should be equivalent to the intensity change through infinitesimal thin sample by TPA:
d I d z = d d z 1 A d d t U t i m e = d d V d d t U t i m e = d d t U V t i m e .
Here, the spatial uniformity of U over the space is assumed. This equation connects the absorption and the polarization. The right-hand side of Equation (37) is written with the complex amplitudes (Equations (9) and (10)) as
E t d d t P 3 t t i m e = 2 K 2 ω   I m   A i , ω * P i , ω ( 3 ) .
Then, by putting Equation (14) (convention of the third-order polarization of the interest) into Equation (39) and then using Equations (37) and (38), we obtain
d I d z = 2 K 2 ω ε 0 K 3 I m   χ i i i i 3 ω ; ω , ω , ω A i , ω A i , ω * 2 .
Now we have the relation showing that the absorption is proportional to the imaginary part of χ ( 3 ) . In contrast, the real part of the susceptibility is related to the phase change of light, i.e., the refractive index change.
Using the convention of the optical intensity
I = K 2 c n 2 π A i , ω A i , ω *
and Equation (13), then Equation (40) is recast with the optical intensity, as follows:
d I d z = ε 0 G D 8 π 2 c 2 n 2 ω   I m   χ i i i i 3 ω ; ω , ω , ω I 2 .
This is independent of K (the numerical factor of the complex amplitude convention). By comparing this equation with the I 2 term in Equation (25), α 2 I 2 , we finally obtain the relation between the third-order susceptibility and the TPA coefficient:
α 2 = ε 0 G D 8 π 2 c 2 n 2 ω I m   χ i i i i 3 ω ; ω , ω , ω .
Moreover, with Equations (17) and (35), the microscopic relation between the TPA cross-section and the second hyperpolarizability is obtained:
σ 2 = G D 8 π 2 c 2 n 2 ω 2 f 4 I m   γ ω ; ω , ω , ω .
As shown here, the TPA cross-section is usually defined as an orientationally averaged quantity.

3. Measurement Techniques

3.1. Overview of Degenerate Third-Order Nonlinearity Measurement Techniques

There is a wide variety of NLO processes depending on the combination of input and output frequencies and the relative phase of the responses, which give rise to different phenomena. Therefore, it is important to choose an appropriate measurement method suitable for the process of interest. In the following section, we will concentrate on the degenerate third-order NLO processes that arise from χ i j k l 3 ω ; ω , ω , ω .
As shown in the frequency representation of the susceptibility, “degenerate” means that all input and output frequencies are the same (here, ω and ω are considered to be the same frequency). This implies that the NLO processes indicated by the susceptibility are related to the change in refractive index and absorption. The real part of the susceptibility causes the refractive index change, including self-action effects such as self-focusing and self-defocusing. Meanwhile, the imaginary part gives the TPA, as discussed above. Even for the degenerate processes, there are various measurement techniques. Table 2 is the list of common measurement techniques for χ i j k l 3 ω ; ω , ω , ω . These techniques will be briefly explained in the following subsections (Section 3.1.1, Section 3.1.2 and Section 3.1.3).

3.1.1. Degenerate Four-Wave Mixing (DFWM)

This is a multi-beam experiment using two or three input beams (Figure 5). A pair of input beams overlap each other in the sample to be measured with a crossing angle, resulting in an interference pattern whose pitch is defined by the crossing angle and the wavelength. The interference pattern, i.e., the periodic distribution of optical intensity, generates transient grating, which can be a phase grating or a population grating or both, by the real or imaginary part of χ i j k l 3 ω ; ω , ω , ω or both. The third beam (or one of the two input beams itself) is diffracted by the induced grating in the direction defined by the wave vector of k s i g = k 1 k 2 + k 3 and then detected as the signal beam. The name “four-wave” mixing comes from the fact that four (three input and one signal) beams are involved in the process. In the case of the two-beam configuration, one of the two beams plays a dual role.
The signal intensity is proportional to the square of the absolute value of the susceptibility, χ i j k l 3 ω ; ω , ω , ω 2 . Therefore, to obtain the real or imaginary parts separately, additional techniques are needed, such as optical heterodyne detection (OHD) or concentration-dependent measurement with a solvent with no imaginary part of the susceptibility. OHD is a technique that mixes a signal light with another light whose phase is known, called a local oscillator (LO) light (usually a portion of the input beam is used for this purpose). This mixing induces interference as A s i g + A L O 2 = A s i g 2 + A L O 2 + 2 A s i g A L O * , where A s i g and A L O are complex amplitudes of the electric fields of the signal and LO lights. The last term, 2 A s i g A L O * , is the interference term and can be positive or negative depending on the relative phase between A s i g and A L O according to the sign of the susceptibility. The real and imaginary parts of the susceptibility can be measured depending on the relative phase of A L O against that of A s i g (in phase for the real part and π/2 out of phase for the imaginary part). The interference term can be selectively detected by modulating the pump and probe amplitudes at different frequencies ( f 1 and f 2 , for example) and detecting the signal at the sum frequency ( f 1 + f 2 ). Another advantage of OHD is that the signal is largely amplified because A L O is usually much larger than A s i g , so 2 A s i g A L O * A s i g 2 .
In multi-beam experiments, the time evolution of the NLO response can be measured by changing the timing of the pulses in each input beam. Ultrafast measurements with a resolution of 10−13 s or less are possible by using a commercially available femtosecond laser. The time evolution provides rich information about the mechanism of the NLO response. The “electronic” NLO response, which originates from the non-harmonic nature of the induced dipoles, can respond as quickly as a few femtoseconds. Meanwhile, other mechanisms are generally much slower (nuclear motion: 1~100 ps; thermal: 100 ps or longer).

3.1.2. Optical Kerr Effect (OKE)

This technique is a two-beam method, like DFWM, but detects anisotropic changes in the refractive index. It is usually used for measurements of the refractive index change of isotropic samples such as pure liquids, solutions, and glasses. The two-beam configuration allows time-resolved measurement. The name comes from the fact that the technique is used to study the optical Kerr effect, ultrafast change in the refractive index proportional to the incident optical intensity (including both electronic and the nuclear nonlinearities).
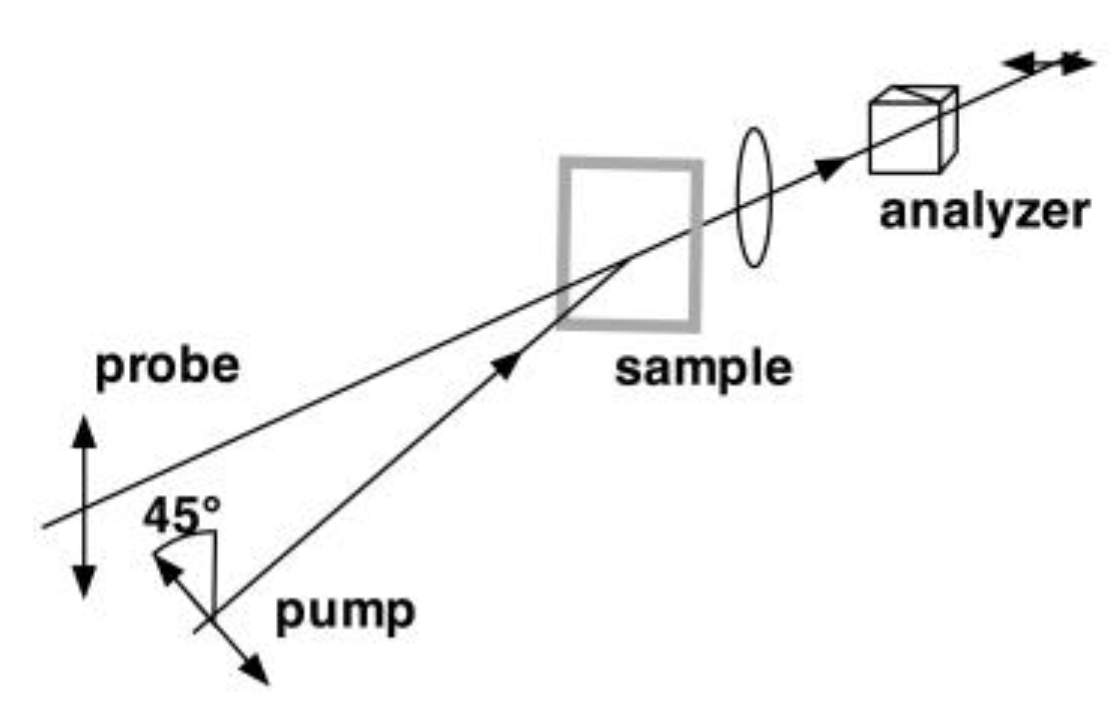
For this technique, two linearly polarized beams (strong pump and weak probe beams) and an isotropic sample are needed. The angle between the polarization directions is set to 45°. First, a pump pulse irradiates the sample and induces the anisotropic change of refractive index in the sample (Figure 6). This anisotropy originates from the anisotropic tensor components of the third-order susceptibility χ x y x y 3 + χ x y y x 3 . Then, a weak probe pulse irradiates the sample. The direction of probe polarization is precisely set to be perpendicular to the transmitting direction of the analyzer polarizer placed after the sample and to be tilted by 45° against that of pump polarization. By passing through the sample in which the anisotropy is induced, the polarization state of the probe pulse changes from linear to elliptical. The generated polarization component, which is perpendicular to that of the pump pulse, can only pass the analyzer polarizer and then detected as signal.
When the polarization directions of the probe pulse and the analyzer are perfectly perpendicular to each other, the signal intensity is quadratic with respect to the pump intensity (homodyne detection). Meanwhile, a small rotation (less than a few degrees) of the polarization direction of the probe from the perpendicular condition enables OHD (see Section 3.1.1), so this configuration is called the OHD-OKE method. The small rotation increases the parallel component to the analyzer polarizer and this component acts as LO light. The OHD-OKE signal intensity is proportional to the LO intensity, which increases the sensitivity and detects the sign of the nonlinearity. Not only the sign, but also the phase of the susceptibility (real or imaginary) can be measured by this method. A variant of OHD-OKE has also been developed using the differential detection between the two perpendicular polarization directions of the probe beam. This configuration was named the differential OKE (DOKE) and allows simultaneous measurements to be made of both real and imaginary parts of the third-order susceptibility [22].

3.1.3. Intensity-Dependent Transmittance Measurement (IDTM) and Open-Aperture Z-Scan

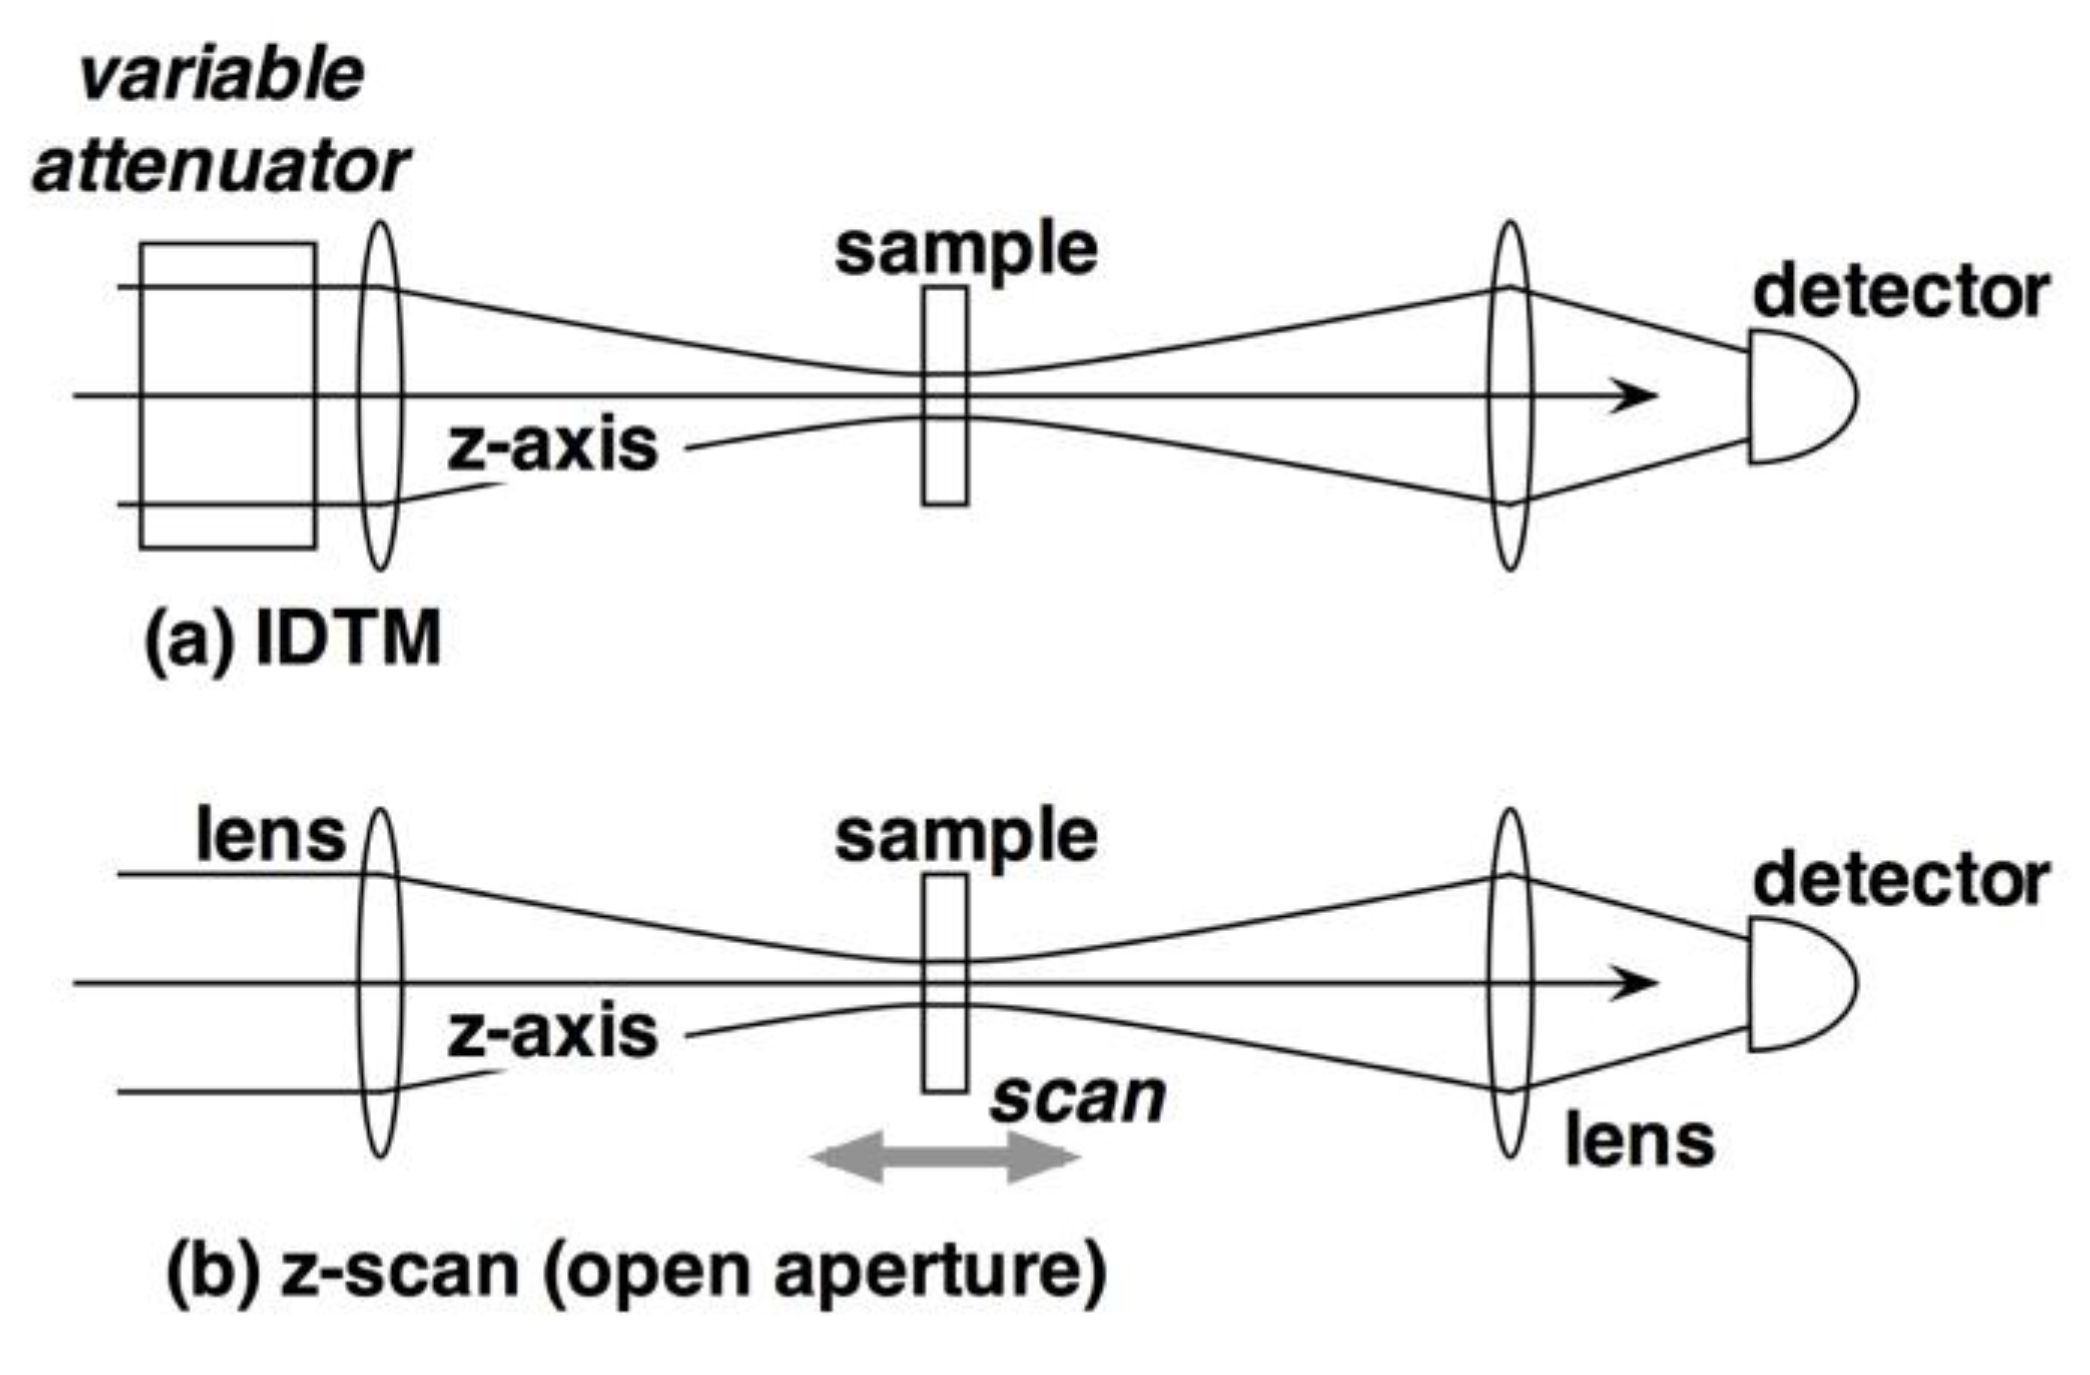
These techniques are single-beam experiments that measure nonlinear absorption as a change in transmittance versus light intensity. The two techniques are the same for the basic setup, but differ in the way the optical intensity is changed (Figure 7a). In IDTM, the sample position is fixed, and light intensity is changed by a variable attenuator such as a neutral density (ND) filter or an optical attenuator consisting of a polarizer and a half-wave plate. Meanwhile, in the Z-scan technique (Figure 7b) developed by Sheik-Bahae et al. [23], the input power is fixed, and the sample is scanned along the propagation axis of the focused laser beam (i.e., z-axis, hence the name). The sample experiences different optical intensities depending on the sample position. The optical intensity is highest at the focal point. This configuration is called an open-aperture Z-scan. This technique will be discussed in detail in the later section. Another method to detect nonlinear absorption is multiphoton-induced fluorescence measurement. The most popular approach is two-photon-induced fluorescence (TPIF) measurement and is widely used to measure TPA cross-sections. This is a sensitive technique, but the sample is limited to fluorescent materials. Singlet diradicaloids tend to be non-fluorescent because of their small HOMO–LUMO gap, so they are difficult to measure using TPIF.
As the other configuration of the Z-scan technique, the refractive index change can be measured when an iris aperture is placed after the sample. This configuration is called a closed-aperture Z-scan and is based on the self-focusing and defocusing effects (Figure 8).
When the sample has a positive nonlinear refractive index ( n 2 > 0 ), self-focusing occurs because the sample acts as a convex lens. At a sample position before the focal point ( z < 0 , (a)), the laser beam converges more tightly (dashed lines) than that without the sample (solid lines) and then obtains a larger beam diameter at the aperture. Thus, the peripheral part of the beam is blocked by the aperture, resulting in a decrease in transmittance ((a) in the bottom-left panel). When the sample is located at the focal point ( z = 0 , (b) in the upper panel), the transmittance is unchanged despite the presence of the sample. Then, at a sample position after the focal point ( z > 0 , (c)), the beam converges again and the aperture-transmitting fraction increases ((c) in the bottom-left panel). Because of these processes, a valley–peak type curve is obtained when the normalized transmittance T N is plotted against the sample position z (the bottom-left panel). Normalized transmittance means that the transmittance is normalized to the value when the sample is placed (ideally) infinitely away from the focal point ( z = ± ). Practically, the transmittance at the sample position where the transmittance is invariant to scan is unity.
Under the thin-sample condition, i.e., the sample thickness L is much smaller than the Rayleigh range  z R , the closed-aperture Z-scan trace is described as
T N ζ , Δ Φ 0 = 1 4 Δ Φ 0 ζ ζ 2 + 9 ζ 2 + 1
where
ζ = z / z R
is the normalized sample position and Δ Φ 0 is the on-axis phase shift at the focal point. Δ Φ 0 is approximately obtained from the difference in normalized transmittance at the valley and peak positions as
Δ T p v 0.406 1 S 0.27 Δ Φ 0
where S is the transmittance of the aperture in the absence of a sample. Finally, the nonlinear refractive index is obtained from the relation
Δ Φ 0 = 2 π λ n 2 I I 0 L e f f
where I0 is the on-axis peak intensity.
Similar to the closed-aperture Z-scan, IDTM has a variant with an aperture after the sample. This configuration is used to measure sample dynamics, for example, as a sensitive detection of the excited state dynamics of the non-fluorescent transient species and of their heat dissipation processes. For such purposes, the technique is known as the population or thermal lens method.

3.2. Nonlinear Absorption Measurements Using the Open-Aperture Z-Scan Method

3.2.1. Dependence of Optical Intensity Along Z-Axis

As briefly mentioned in the previous section, the open-aperture Z-scan is the technique for measuring the dependence of transmittance on the optical intensity varied by scanning the sample position z . For a laser beam with a Gaussian transverse profile,
I r , z = I 0 z exp 2 r 2   w z 2 ,
where the beam radius at z is
w z = w 0 1 + z / z R 2 w ζ = w 0 1 + ζ 2 .
with Equation (46). Here, w 0 is the beam radius at the focal point and is called the beam waist radius. The on-axis intensity at z (and at ζ ) is
I z = π w 0 2 I 00 π   w z 2 I ζ = I 00 1 + ζ 2 .
Here, I 00 is the on-axis intensity at the focal point ( z = 0 ). This equation shows that the on-axis intensity has a Lorentzian dependence on z with the half width at half maximum of z R .

3.2.2. Transmittance Through TPA Media

For OPA, the transmittance, i.e., 1-absorptance, is independent of the intensity as in the Beer–Lambert law, T L = exp A (Equation (26)). The intensity distribution of the laser beam does not affect the transmittance. On the other hand, nonlinear absorption such as TPA depends on the intensity, resulting in an intensity-dependent transmittance, as in Equation (30). The total transmittance is the product of T L and nonlinear (i.e., intensity dependent) transmittance T N , as
T = T L T N .
If TPA is the dominant contribution of the nonlinear absorption processes, T N equals to the transmittance due to TPA ( T N = T T P A ).
In the derivation of Equations (28) and (30), the transverse spatial distribution and the temporal change in the excitation laser pulse are not considered. Thus, they hold for plane (top-hat) and continuous wave (cw). For a cw Gaussian beam, the non-uniformity of the spatial distribution must be considered, and then T N is
T N = ln 1 + q 0 q 0 .
Here, q 0 is the two-photon absorbance at I 00 , i.e., q 0 = α 2 I 00 L e f f (the dash in q in Equation (30) is removed here for simplicity).
For pulsed laser beams, their time profile must be considered. Typical time profiles of mode-locked lasers are sech2 or Gaussian. For a Gaussian laser pulse, T N (defined from the energy transmittance for the pulsed laser beam) for the uniform spatial distribution (top-hat) is
T N = 1 π exp t 2 1 + q 0 exp t 2 d t
and for the Gaussian spatial distribution,
T N = 1 π   q 0 ln 1 + q 0 exp t 2 d t .
The integration range should be sufficient to cover the entire pulse, but it does not have to be from negative infinity to infinity.
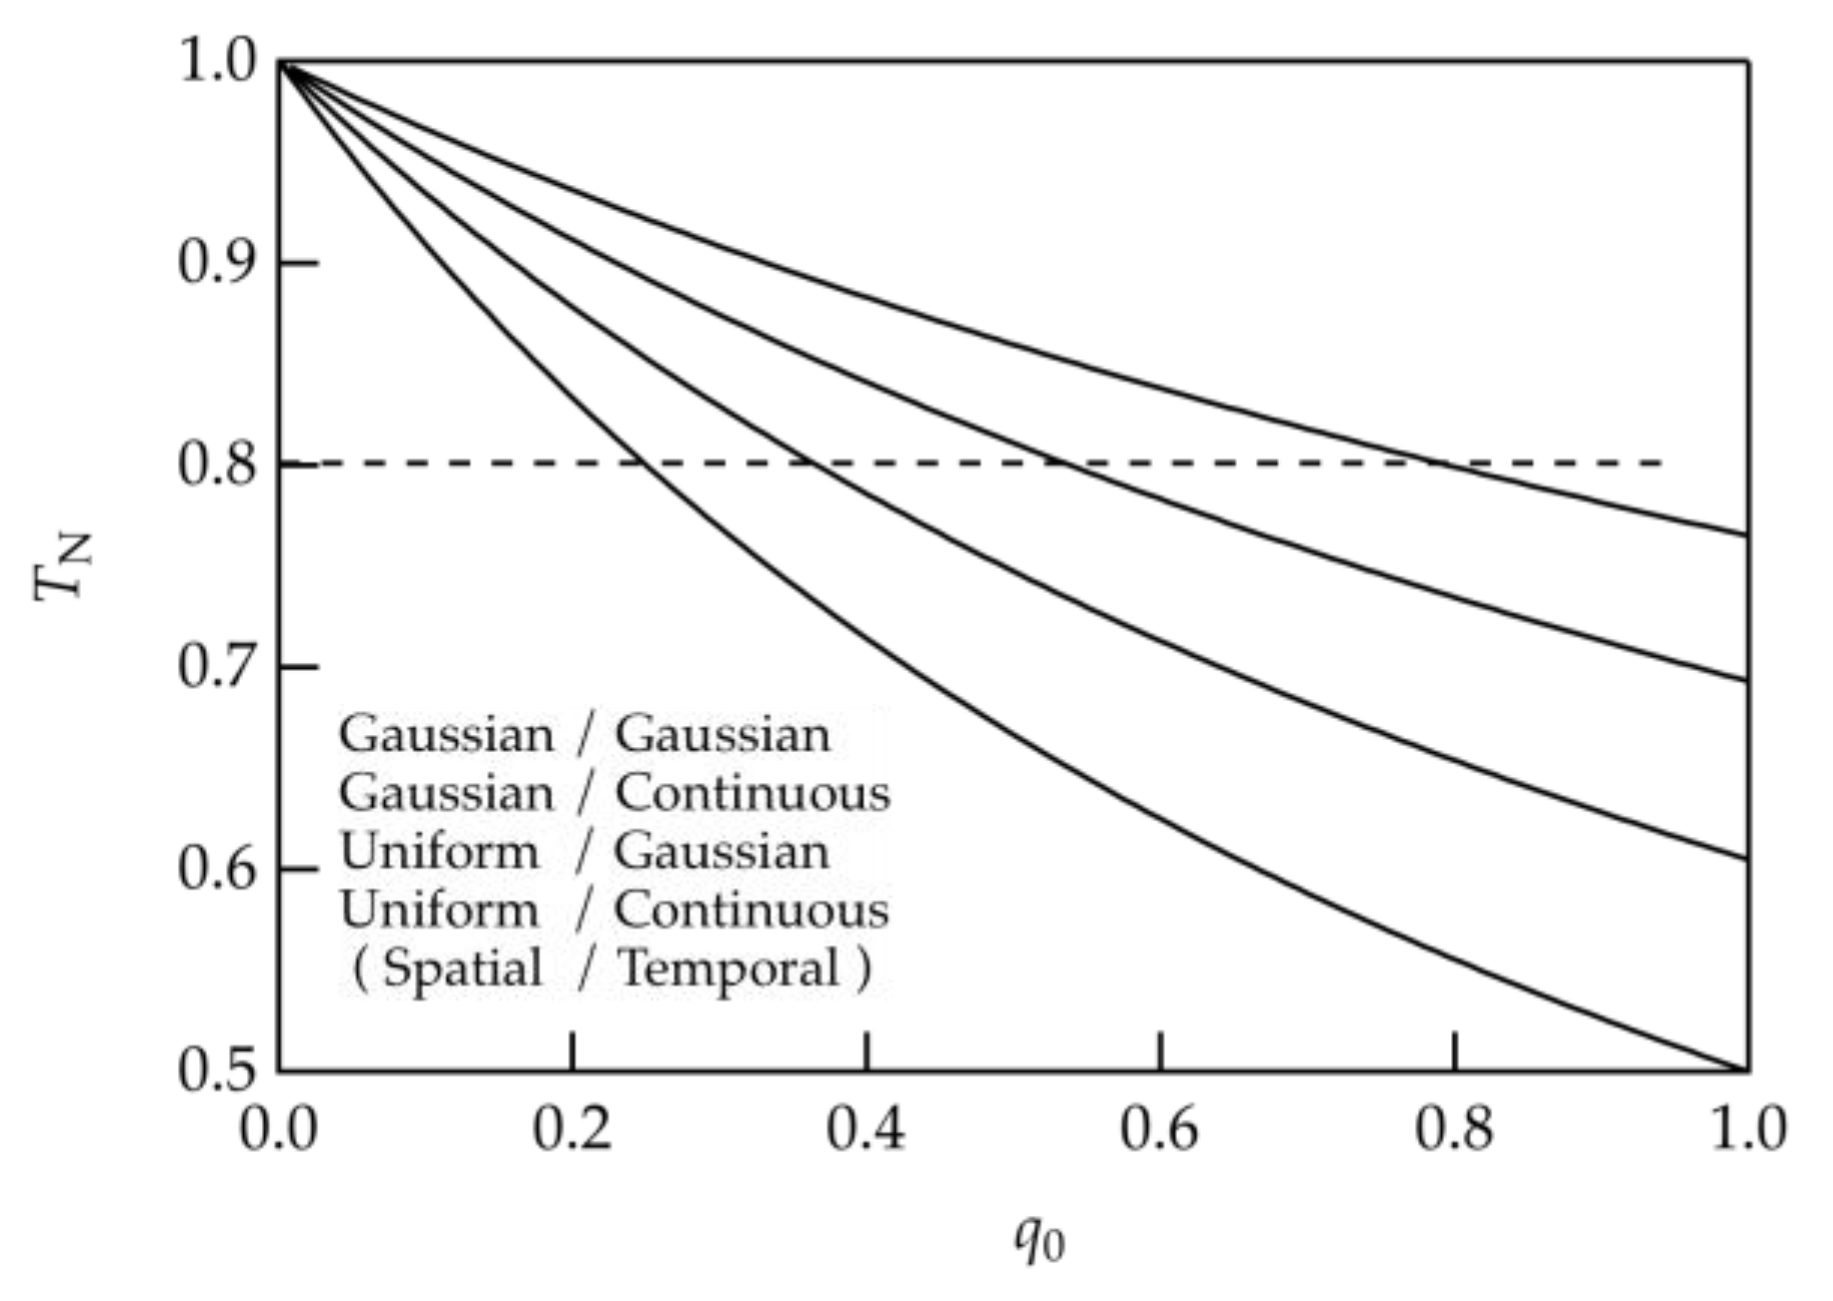
These results are summarized in Table 3. Note that the same transmittance is given by different values of q 0 depending on the spatial and temporal profiles of the laser pulse used (and vice versa). This means that it is important to choose the right equation for the right answer. Figure 9 shows that the difference in T N between the equations is small for a small q 0 , but it increases as q 0   increases. For example, if T N = 0.8, then the Gaussian/Gaussian pulse equation gives q 0 = 0.795, while the uniform/continuous wave (CW) equation gives q 0 = 0.236. If the actual laser pulse has a Gaussian/Gaussian distribution, the analysis with the uniform/CW equation leads to a 3.4-fold underestimation.
The normalized transmittance as a function of the normalized sample position for the Gaussian/Gaussian pulse is given by
T N ζ = 1 π   q 0 ζ ln 1 + q 0 ζ exp t 2 d t .
If q0 < 1, then this equation can be written in the series expansion as
T N ζ = m = 0 1 m q 0 ζ m m + 1 3 / 2   .
This form of series expansion will give a shorter calculation time than Equation (56) for curve fitting to experimental data, but curve fitting by Equations (52) and (56) with numerical integration is reasonably fast with the power of today’s PCs.

3.2.3. Relation Between Optical Power and Intensity

In most practical situations, a laser beam has a non-uniform spatial and temporal variation in its intensity. For a Gaussian/CW beam, the on-axis intensity at the focal point is calculated from the input power P as
I 00 = 2 P π w 0 2   .
For a Gaussian/Gaussian pulsed beam,
I 00 = 4 ln 2   P π 3 / 2   w 0 2   t F W H M   f r     1.789   P π w 0 2   t F W H M   f r .
Here, t F W H M is the full width at half maximum of the laser pulse and f r is the repetition rate of the pulsed laser beam. The results for the other combinations of the spatial and temporal distributions are summarized in Table 3.

3.3. Experimental Details and Data Analysis of the Open-Aperture Z-Scan Method

3.3.1. Optical Setup

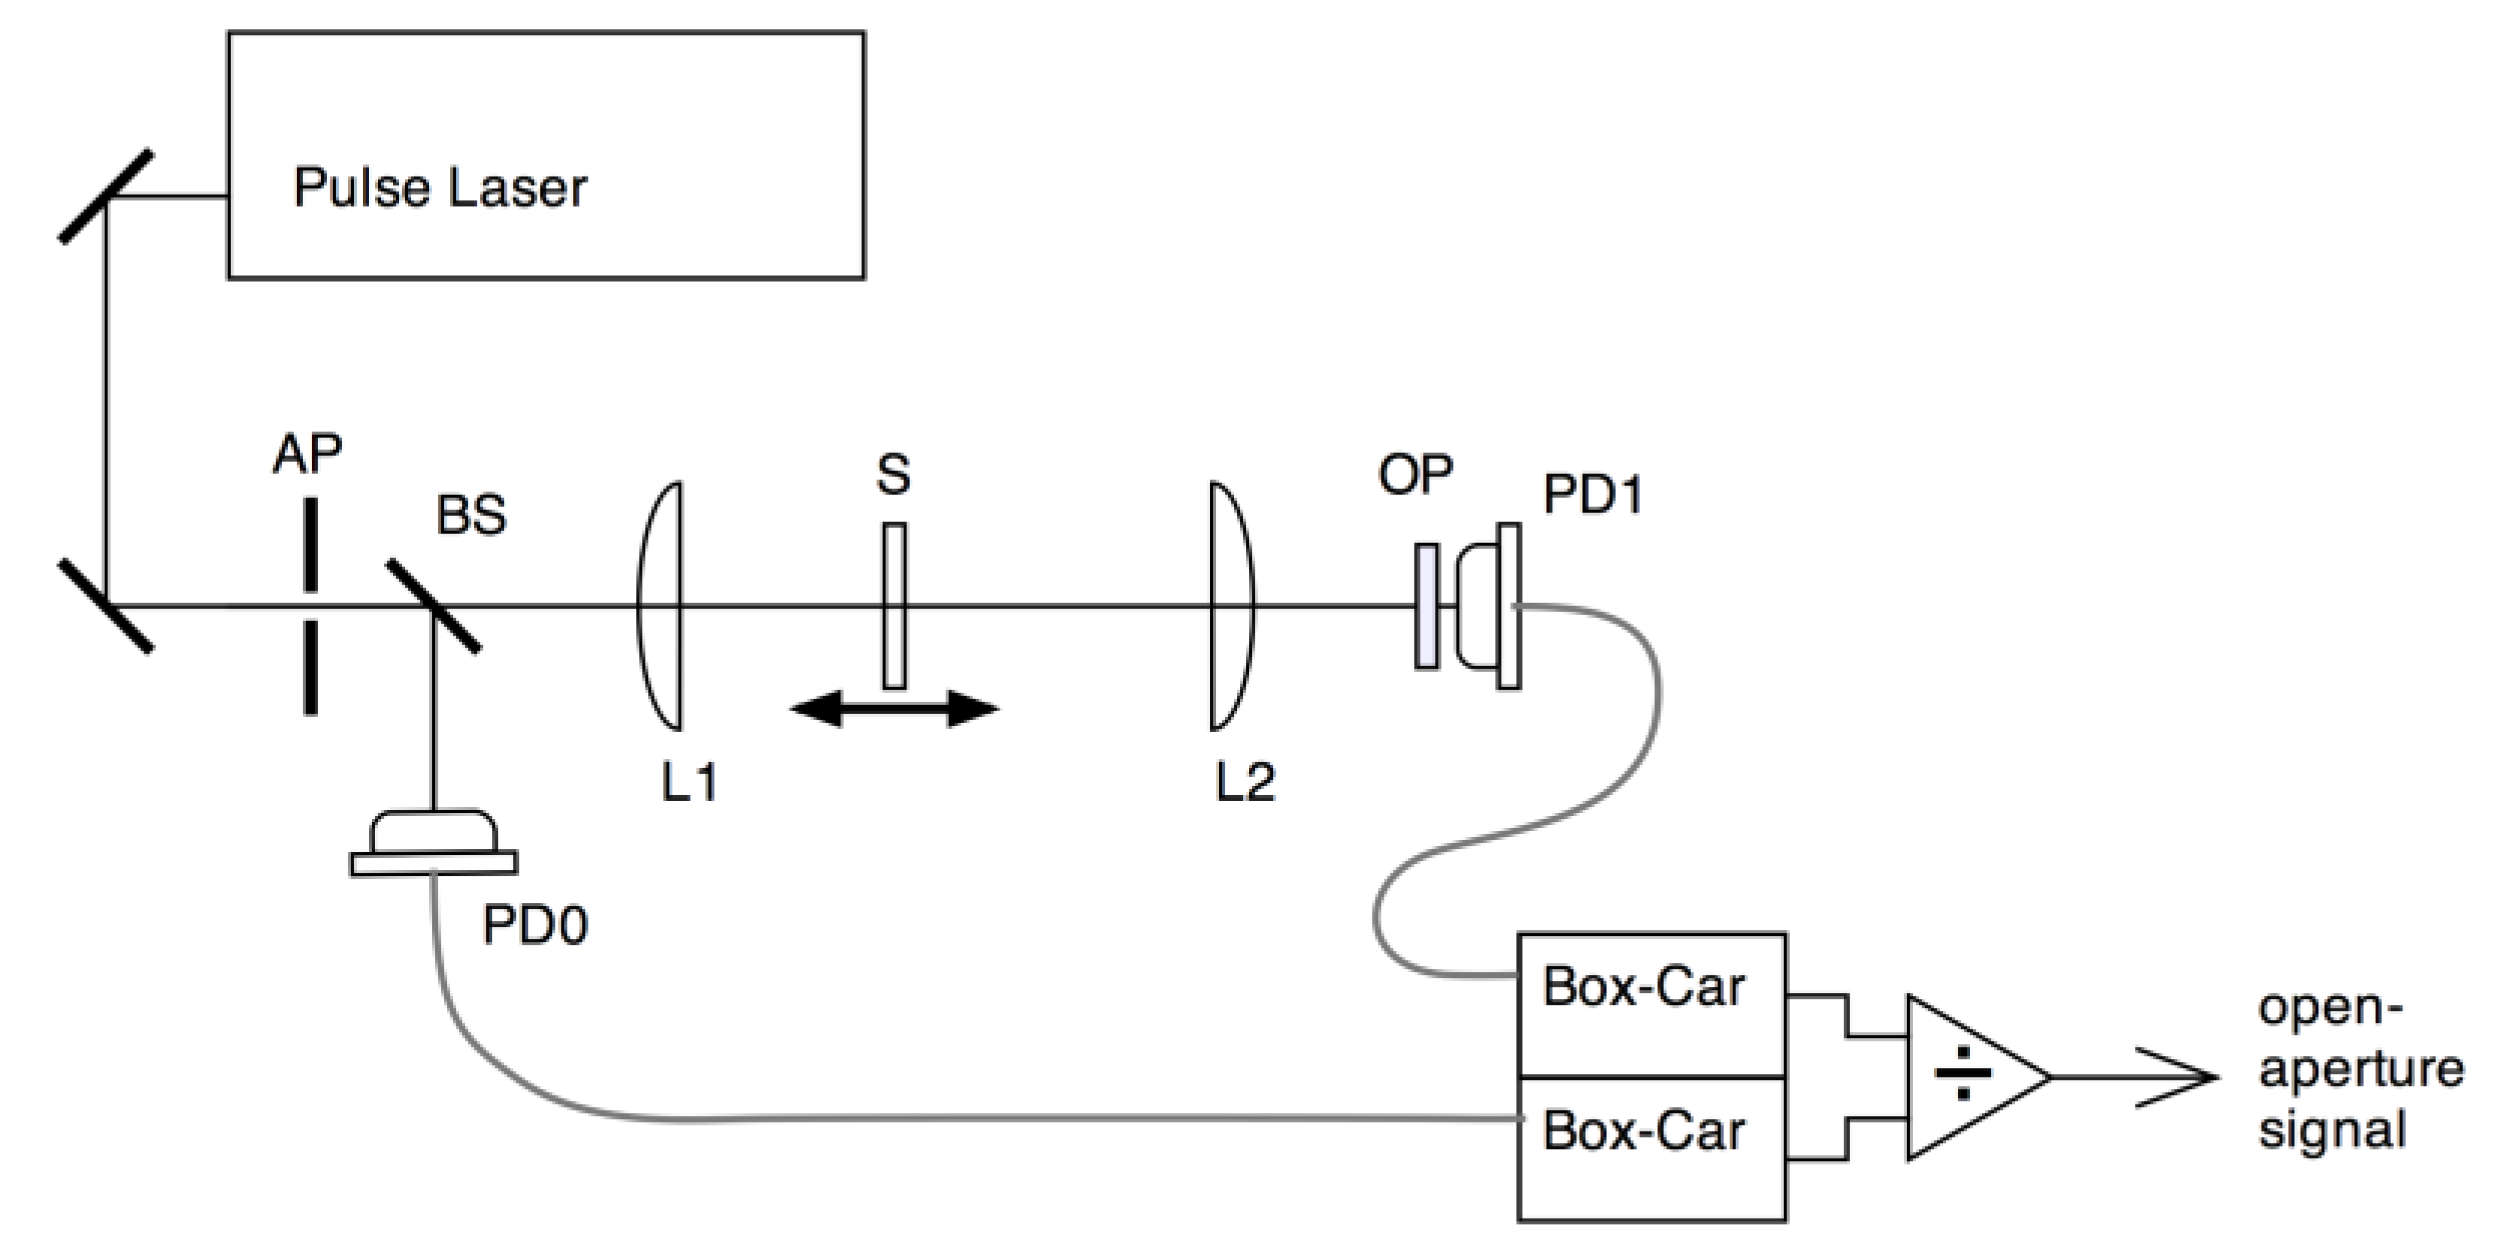
Figure 10 shows a schematic diagram of an example of the experimental setup for the open-aperture Z-scan. The light source is a pulsed laser, such as a Ti–sapphire laser, a Nd–YAG laser, and a wavelength-tunable optical parametric amplifier pumped by the laser. If the laser beam has non-Gaussian spatial profile, reshaping is recommended for better results. A common technique for reshaping is to use a spatial filter, or simply to use an iris with a clear aperture smaller than the beam diameter.
A small fraction of the laser beam is picked up by a beam splitter (BS) and directed to a photodetector (PD0) to monitor the intensity fluctuation of the laser pulses. Meanwhile, the remaining part of the laser beam is focused by a convex lens (L1) along the main optical axis (z-axis) of the Z-scan setup. The sample to be measured (S) is scanned along the z-axis of the focused laser beam. The light passing through the sample is collimated by another lens (L2) and is monitored by the second photodetector (PD1). Note that the entire beam must be monitored by the photodetector. If not, a portion of the beam is blocked, resulting in a deformed trace similar to a closed-aperture trace. The simplest approach to detecting the entire beam is the use of a photodetector with an active area that is much larger than the beam diameter. It should be noted that the divergence of the laser beam changes during a scan due to the self-focusing and defocusing effect, as discussed in Section 3.1.3; therefore, the chosen active area should be large enough. However, this approach is not always possible due to the availability of a large-area photodetector or saturation of the photodetector. Saturation of the photodetector easily occurs with ultrashort pulses (of picoseconds and femtoseconds). An alternative approach is to homogenize the beam intensity and then to detect a portion of it, instead of capturing the entire beam. For this purpose, an integrating sphere is useful. An integrating sphere is an optical element with white scatterer painted on the surface of the spherical cavity inside. A beam entering into the cavity through a small hole in the cavity is randomly reflected on the cavity surface, so the intensity is homogenized after repeated reflection. A less expensive and acceptable alternative is to use a scattering plate such as an opal plate (OP in Figure 10). Focusing on an opal plate homogenizes the intensity distribution of the beam and reduces the effect of self-focusing and defocusing, although the homogenization is not perfect.

3.3.2. Signal Processing

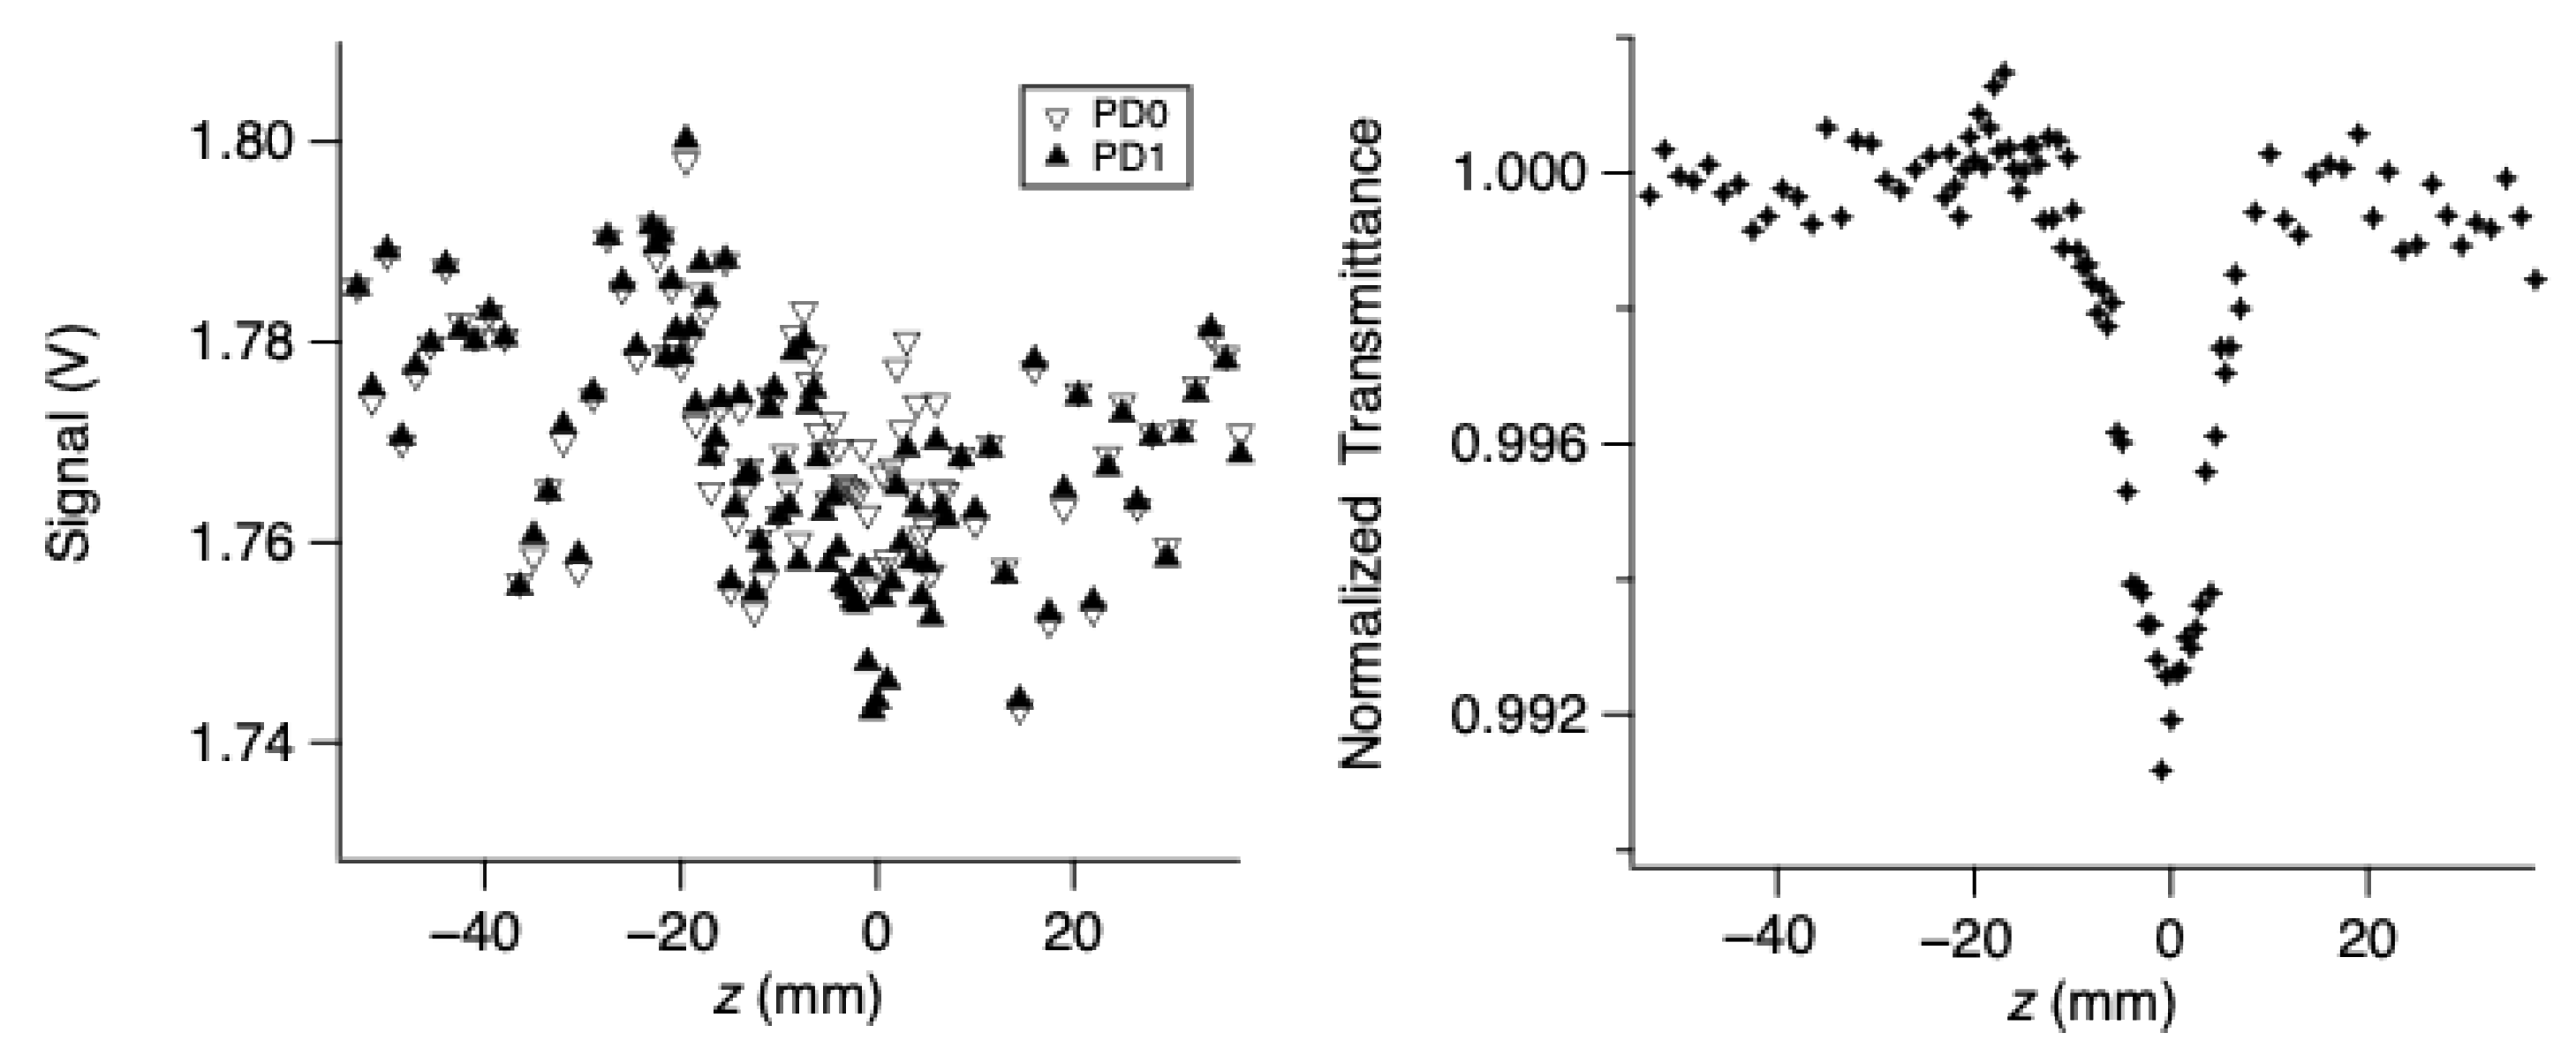
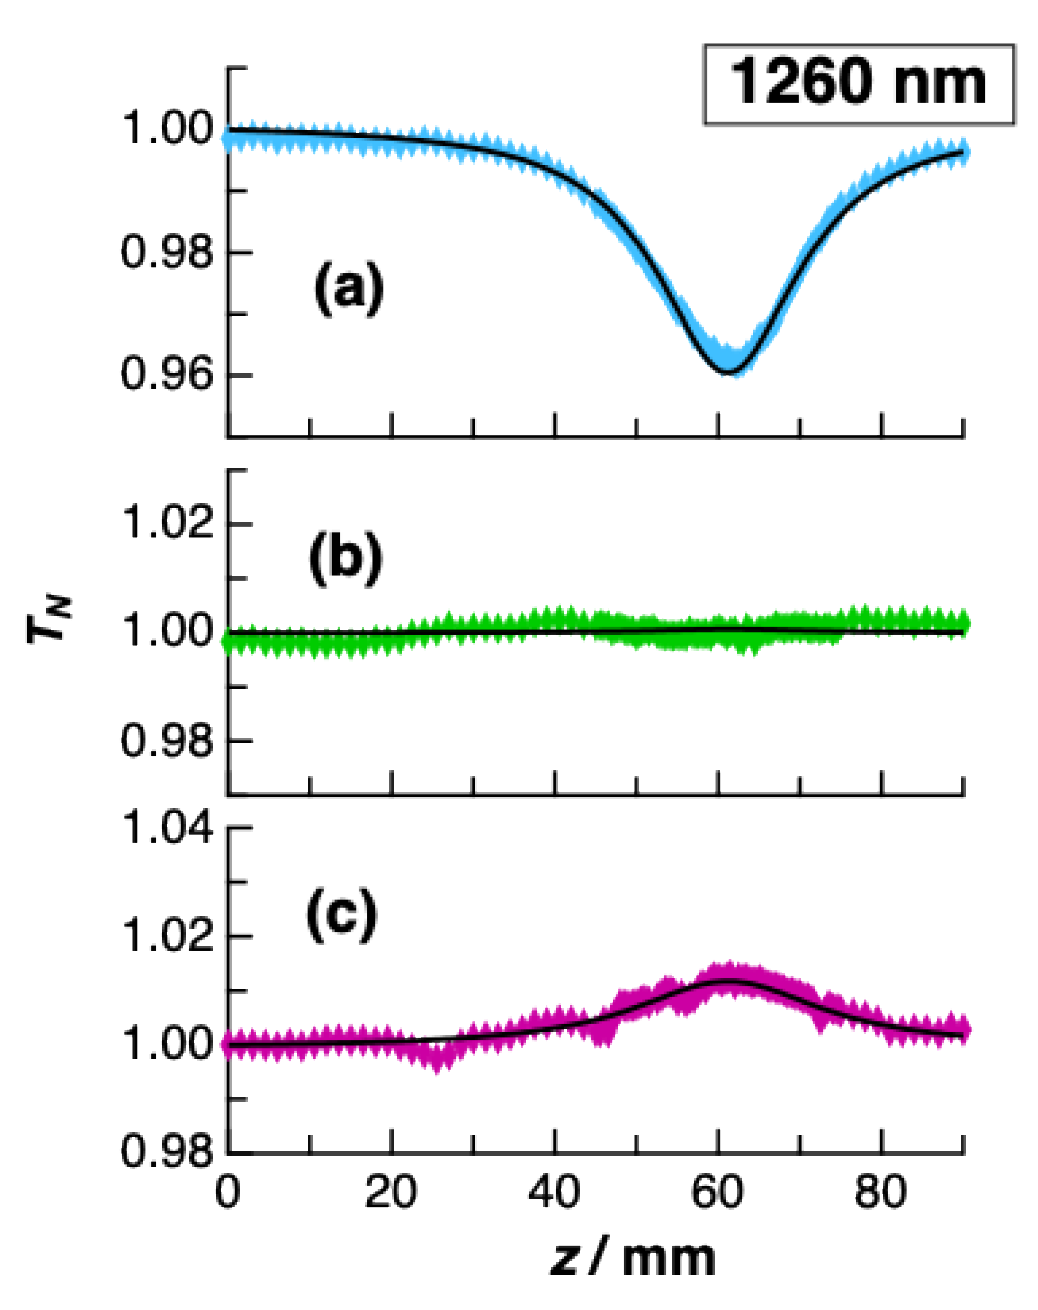
The signal detected by the photodetectors is fed to the boxcar integrator to reduce the background noise. The output of PD1 is divided by that of PD0 to produce a fluctuation-corrected open-aperture signal. The fluctuation of laser pulses is generally too large to ignore (left, Figure 11), so fluctuation correction is very effective in removing the common-mode noise from the open-aperture trace (right, Figure 11). The fluctuation-corrected data show typical features of open-aperture trace. The normalized transmittance is approximately unity at the sample position away from the focal point ( z 0 ). The transmittance decreases as z approaches to zero and reaches the minimum at z = 0 . This dip is the open-aperture signal, and the depth of the dip contains information about the strength of the nonlinear absorption—in this case, TPA.
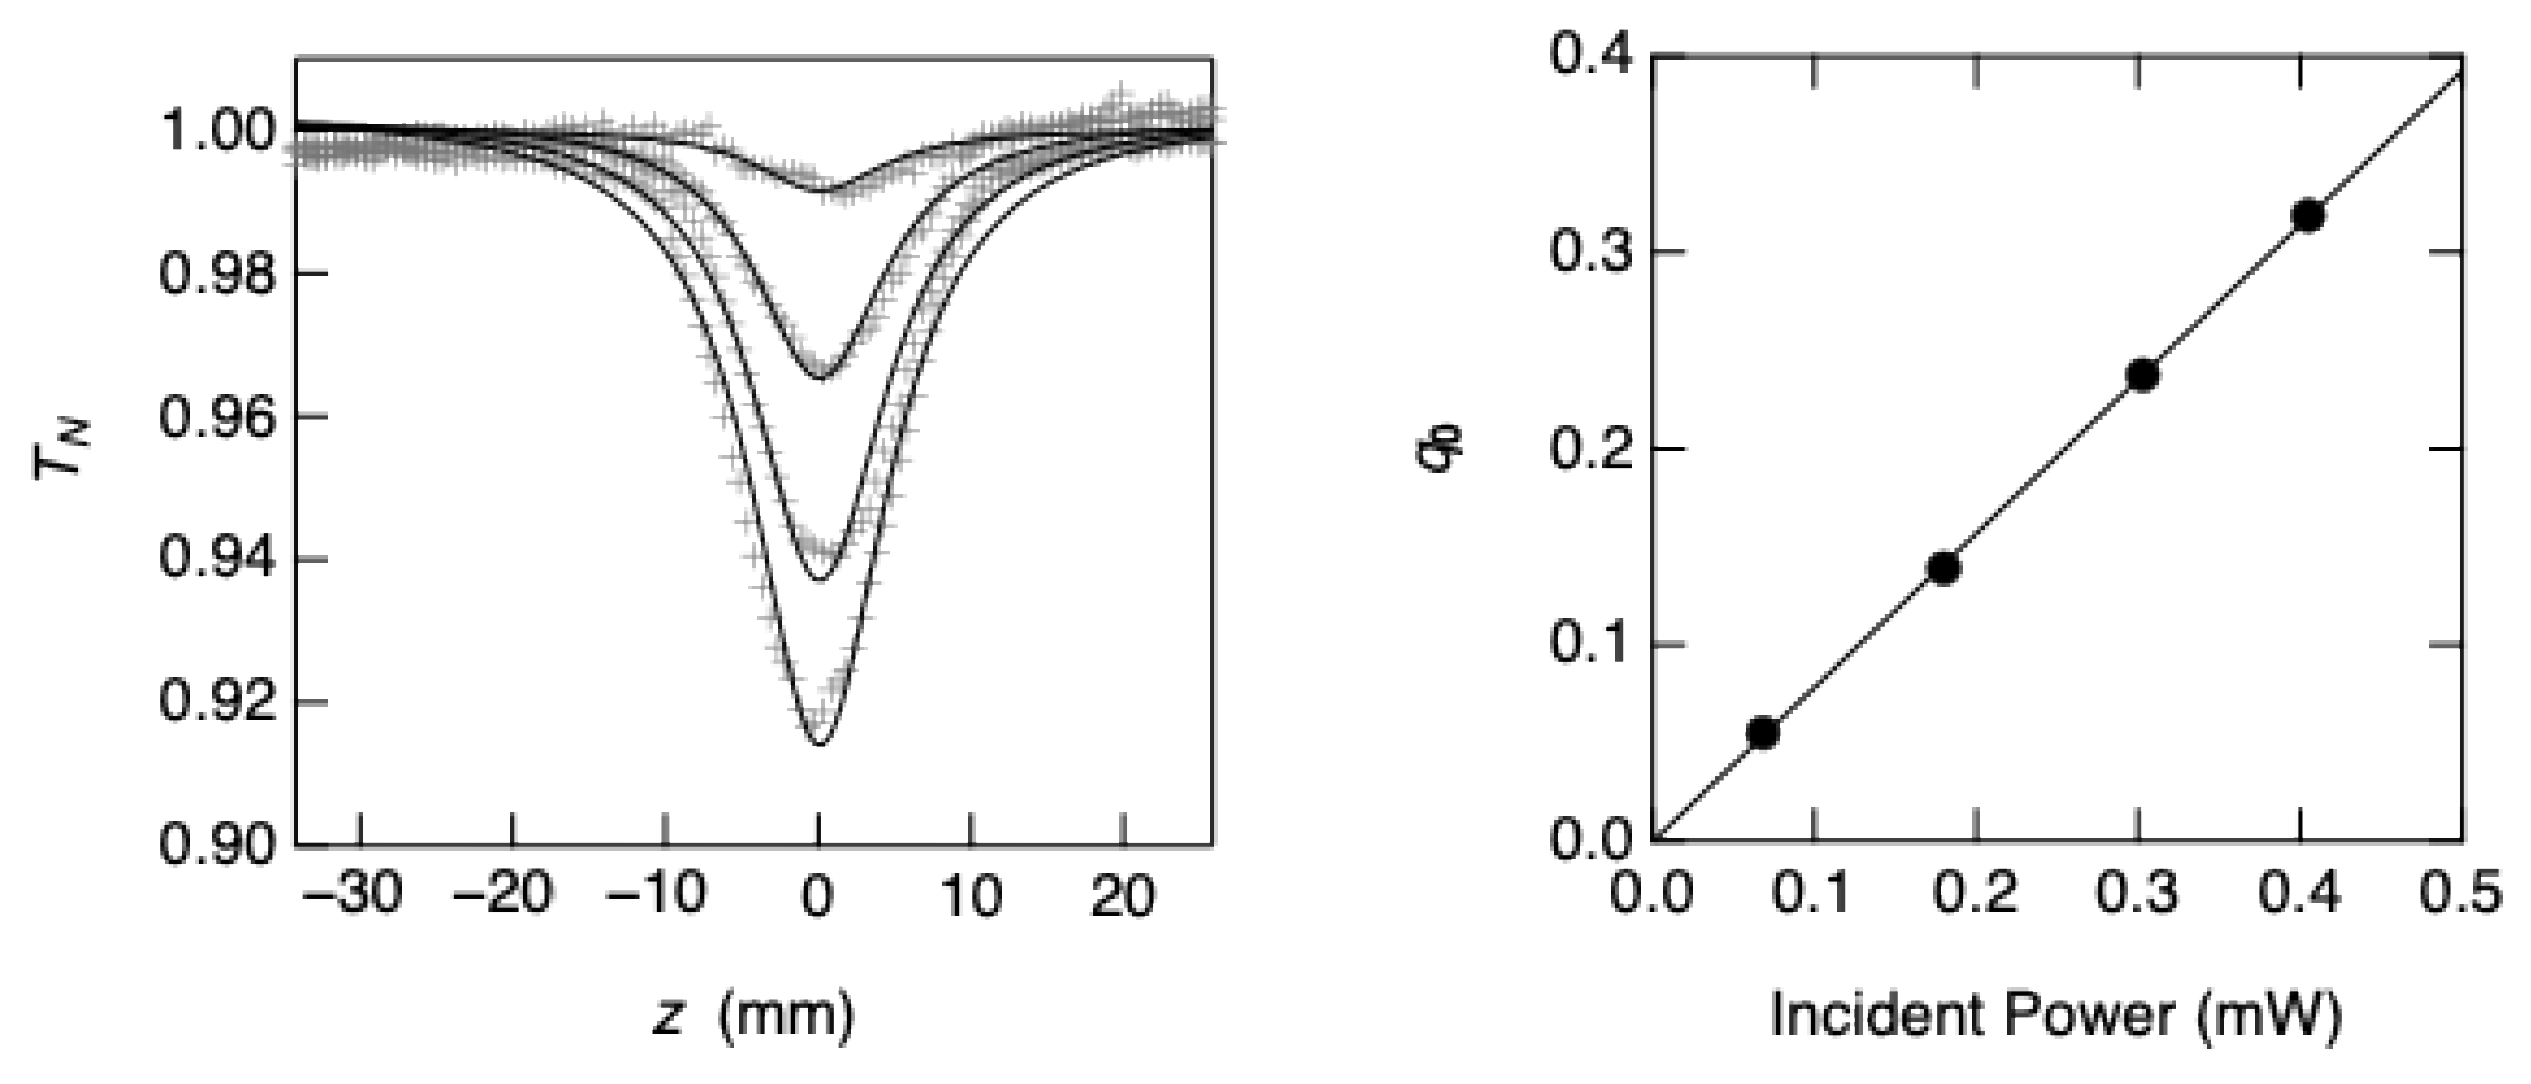
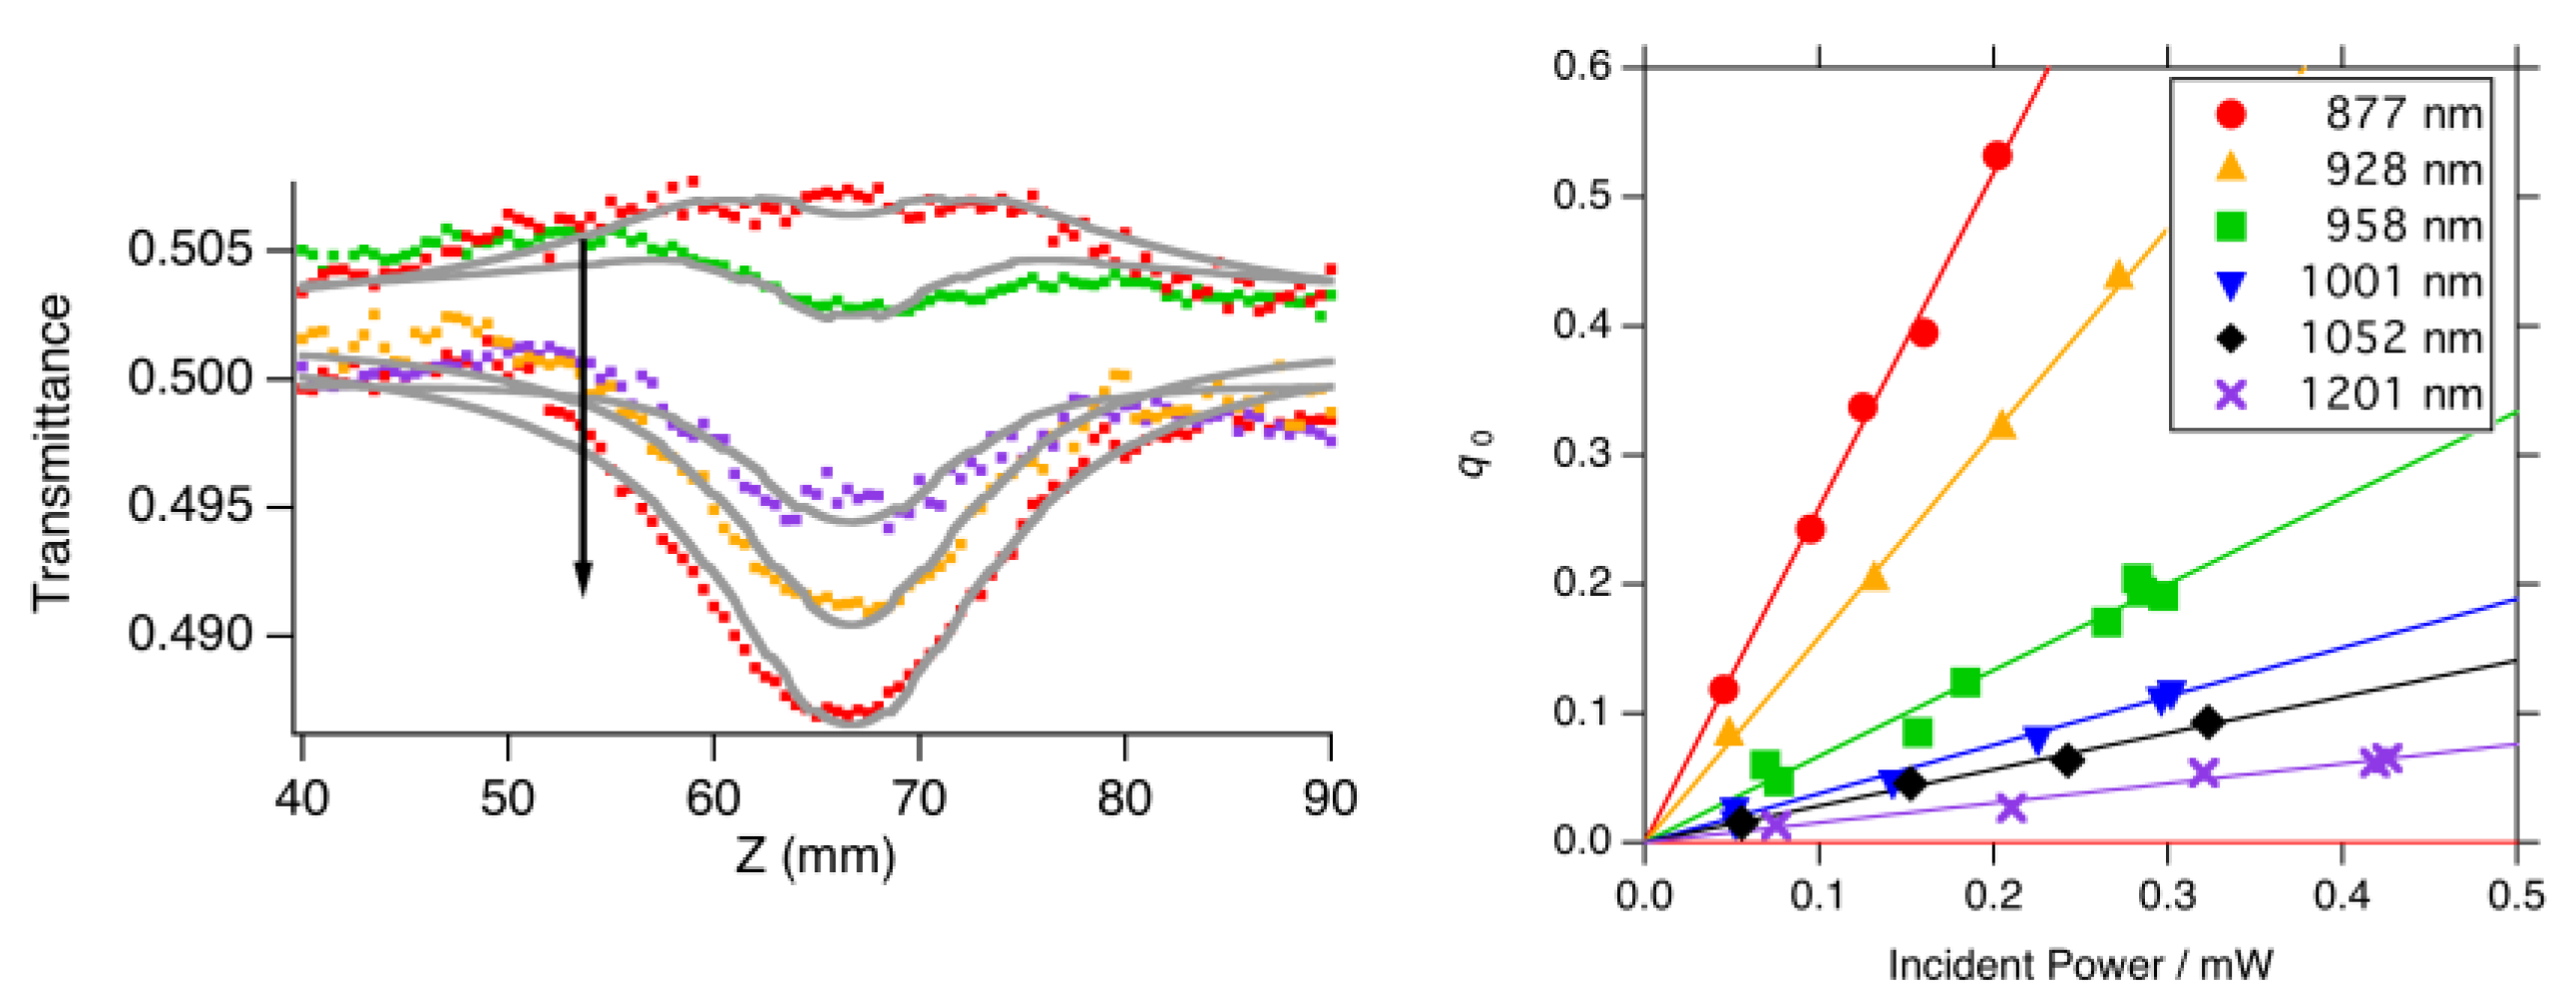
The width of the dip is determined by z R . The curve fit with the theoretical equation (Equation (52) with Equations (56) and (46)) gives the two-photon absorbance q 0 . Figure 12 shows that the curve fits to the experimental data with different incident powers (left) and the plot of the obtained q 0 against the incident power (right), proportional to the on-axis peak intensity, as in Equation (59). The slope of the plot gives the TPA coefficient of the sample and the TPA cross-section is calculated using Equation (35). To obtain the TPA spectrum, the measurements are repeated by changing the wavelength of the light source.

3.3.3. Sample

The sample can be liquid or solid. For liquids (typically solutions), an optical cell is required to hold the sample. Commercially available cells can be used for the Z-scan measurement. Scratches, voids, and burns on the cell wall can sometimes cause a false signal with a shape similar to the open-aperture trace. The false signal has no input power dependence, whereas the true TPA signal does. Therefore, measuring the input power dependence is a good way to distinguish whether the signal obtained is an artifact or not. The choice of the optical path length is also important. The longer the path length is, the larger the signal. However, a thick sample violates the thin sample assumption used to derive the equations, and the signal will saturate. As a guide, it is recommended that the path length be one-half of z R or less for reproducible and consistent results. For solutions, a high concentration is required for the measurements depending on the TPA cross-section of the sample and the signal-to-noise ratio of the system. The required concentration can be estimated as follows. If a 0.3% change in the normalized transmittance (i.e., T N = 0.997) is the minimum signal above the noise, the two-photon absorbance calculated from Equation (56) is q 0 = 0.0085. Thus, the required concentration is calculated using Equations (29) and (35) and the estimated value of the cross-section, in addition to other experimental conditions used, such as the optical path length of the sample or incident powers. Typical concentrations reported for the open-aperture Z-scan experiments are 0.1–10 mM for the cross-section values of 10–1000 GM. These concentrations are relatively higher than those for TPIF measurement. In some cases, where saturated concentration is used for strong signals, sample molecules may precipitate as microcrystals during the measurement due to the temperature change. When microcrystals are formed and suspended in the solution, spike-like noise appears in the open-aperture trace, especially at the sample position around the focal point. This is due to scattering from the suspended microcrystals.

3.3.4. Range of the Scan

The change in light intensity along the z-axis (Equation (51)) is symmetric with respect to the focal point, so the open-aperture z-scan trace is also symmetric. Thus, in principle, scanning one side (either z < 0 or z > 0) is sufficient to extract the information from the sample. However, if the sample degrades or reacts photochemically, the trace becomes asymmetric. Therefore, scanning across the focal point is useful to distinguish whether or not degradation or a reaction is occurring. If so, the use of a flow cell or a small magnetic stirrer to circulate or to stir the sample solution may solve the problem. To obtain the off-focus transmittance close enough to unity, it is recommended that the scan range be at least wider than ± 3 z R , which gives I z < 1 / 1 + 3 2   =1/10 at the scan ends.

3.3.5. Incident Power

The Z-scan technique is a method used to change the optical intensity by changing the sample position, so it is not indispensable to change the input power of the laser beam. However, changing the incident power gives some benefits. As mentioned above, false signals due to voids or scratches on the cell wall can be distinguished by changing the incident power. In addition, it is useful to assign the observed nonlinear absorption process. The right panel of Figure 12 shows the proportionality relation between q 0 and incident power. This is evidence that the observed nonlinear absorption process originates from TPA, as expected by Equation (29). When higher-order NLO processes such as three-photon absorption and the excited state absorption (ESA) occur, the plot deviates upward from the proportionality line with increasing incident power. This criterion is clearer than judging from the quality of the curve fit to the open-aperture Z-scan trace, although both are based on the same principle. If an upward deviation is found, the traces should be reanalyzed under the assumption of a propter theoretical model.
Contrarily, if the plot deviates downward, saturation may occur. One possibility is the saturation of the OPA, i.e., saturable absorption (SA), in which the concentration of the ground state molecule decreases due to a strong one-photon transition. As discussed above (Equation (52)), OPA does not appear when the open-aperture trace is plotted against T N because the linear transmittance T L is a constant regardless of the incident intensity. When SA occurs, the absorption decreases with increasing optical intensity, so T L is no longer constant. Clearly, OPA must be present at the wavelength where SA occurs. This phenomenon is often observed at the wavelength near the tail of the lowest-energy OPA band and will be discussed in detail in the following section. The other is the saturation of TPA, which is the two-photon analog of SA and results in a flat-bottomed dip of the open-aperture Z-scan trace [24]. This requires very strong two-photon absorption and is rarely observed.

3.3.6. Laser Pulse Width

NLO phenomena, including TPA, occur at high optical intensities. If the energy of the light is concentrated within a shorter period of time, the intensity becomes higher. For example, a continuous laser beam delivering 1 mJ of energy per 1 s with a cross-sectional area of 0.1 cm2 (corresponding to a beam radius of 1.7 mm) gives an intensity of 10 mW cm−2, while a 1 ns laser pulse of the same energy with the same area gives an intensity of 1010 mW cm−2 = 10 MW cm−2 (typical values for a Q-switched YAG laser). Similarly, a 100 fs pulse with the same pulse energy and the same area gives 1014 mW cm−2 = 100 GW cm−2, which is a typical value for a femtosecond Ti–sapphire laser. These examples show that the intensity of pulsed excitation can vary by tens of orders of magnitude. Thus, a shorter pulse can induce a more significant NLO effect.
As mentioned above, the open-aperture Z-scan technique can detect not only TPA, but also any other possible nonlinear absorption, including ESA. ESA is a sequence of absorption processes, where TPA is followed by the one-photon absorption from the excited state generated by the TPA, to a higher excited state. Since the strength of the ESA depends on the lifetime of the excited state, it also strongly depends on the laser pulse width. The typical lifetime of the lowest excited state is on the order of 1–100 ns, so a nanosecond pulse can feel the excited state population induced by itself. This results in a strong ESA. Meanwhile, a femtosecond pulse is too short for the population to accumulate. It has been reported that the apparent TPA cross-section measured with nanosecond laser pulses was 102–103 times larger than that measured with femtosecond pulses due to ESA [25].

3.4. Measurement of TPA Coexistenting with Saturable Absorption by the Open-Aperture Z-Scan Method

Saturable absorption (SA) is a decrease in absorption as the optical intensity increases. Thus, the transmittance increases as the sample position approaches the focal point ( z = 0 ) where the on-axis intensity reaches its maximum, resulting not in a dip, but a bump in the open-aperture Z-scan trace. SA depends on the population difference between the ground and excited states and the formulation is not simple except for the two-level model. A phenomenological and practical approach is to treat the absorption coefficient as intensity-dependent [26].
α 1   α 1 I = α 0 1 1 + I / I S ,
where α 0 1 is the intensity-independent absorption coefficient (which is identical to α 1 in the model without SA). I S is the saturation intensity, defined as the intensity at which the absorption coefficient is halved, α 1 I S = α 0 1 / 2 . The above equation can be rewritten as
α 1 I = α 0 1 I S / I + α 0 1 α 0 1 1 + I / I S I S / I = α 0 1 α 0 1 I S / I + 1 ,
and then, α 1 in the linear transmittance T L = exp α 1 L is replaced with the intensity dependent α 1 I :
exp α 1 L exp α 1 I L = exp α 0 1 L + α 0 1 L I S / I + 1 = exp α 0 1 L exp α 0 1 L I S / I + 1 = T L T S A ( I )
Here, T L in the last term is, again, the intensity-independent transmittance and the intensity-dependent part is T S A I = exp α 0 1 L / ( I S / I + 1 ) . Therefore, T L is replaced with T L T S A ( I ) for the case of SA:
T L T L T S A ( I )
By applying this replacement to Equation (52) together with Equation (51) and Equation (46), the total transmittance of a sample exhibiting TPA and SA is obtained as a function of the normalized sample position:
T ζ = T L T S A ( ζ ) T T P A ( ζ )
where T T P A ( ζ ) is the transmittance governed by TPA, as in Table 3. The factor T S A ( ζ ) T T P A ( ζ ) is the intensity-dependent part and corresponds to T N obtained by the measurement. This is an approximation obtained by neglecting complicated inter-dependence. For example, SA affects L e f f from the definition of the effective path length, but the effect is not included in the above discussion.
Some researchers classify SA as a third-order NLO process. This is partially true because SA is caused not only by the third-order response, but also by the higher-order response. That is, Equation (60) can be expanded into the power series of I / I S .
α 1 I = α 0 1 1 I S I + I S I 2 + .
Here, the mathematical identity relation of
1 1 + x = i = 0 x i i 1 ! = 1 x + x 2 1 2 x 3 +
was used for the derivation. Unlike for the pure TPA process, Equation (65) contains not only the first-order term on I / I S , but also the higher-order terms. In fact, the observed shape of the open-aperture traces shows that the width of the bump by SA is wider than that of the dip by TPA. Thus, when both SA and TPA occur at the same time with similar magnitudes, the overlap of the broad bump and narrow dip results in an “M”-like shape of the trace with the double maxima and the single minimum.

4. Two-Photon Absorption Properties of Singlet Diradicaloids

4.1. Two-Photon Absorption and Electronic Excited States

All molecules have TPA, which can be induced using today’s intense pulse lasers, such as a femtosecond laser. However, it is still generally very weak and the typical order of σ 2 is 1–100 GM. A large σ 2 can reduce the required laser intensity and expand its applications. Thus, extensive efforts have been devoted to exploring excellent TPA chromophores with a large σ 2 . To establish the molecular design for such a TPA chromophore, it is important to understand the structure–property relationship of TPA. Kuzyk proposed the fundamental limit of σ 2   [27] and pointed out that there is much room to the limit.
According to the perturbation theory, σ 2 is represented as a function of the excitation angular frequency
σ 2 ω = 16 π 3 ω 3 2 c 2 n 2   k f e · μ ^ k k e · μ ^ g ω k g ω 2 g 2 ω
in the case of single-beam experiments. Here, g , k , and f are the ground, intermediate, and destination (final) states; μ ^ is dipole moment operator; e is unit polarization vector; ω j g is the transition angular frequency between g and j = ( k or f ) ; c is the speed of light in vacuum; n is the refractive index of the sample; and is the reduced Planck constant. g 2 ω is the normalized line shape function as g 2 ω = 1 / π Γ f g / ω f g 2 ω 2 + Γ f g 2 where ω f g and Γ f g are the frequency and linewidth of the two-photon transition between f and g . This equation contains the sum over all intermediate states k, resulting in many cross terms.
This equation is simplified by the diagonal path approximation with single intermediate state, where the transition dipole moments are parallel to each other. For the peak σ 2 for a linear polarized beam, the approximated equation
σ p e a k 2 = 4 π 2 5 2 c 2 n 2 μ f k 2 μ k g 2 ω k g ω f g 1 2 2 Γ f g
is obtained for the centrosymmetric molecules and
σ p e a k 2 = 16 π 2 5 2 c 2 n 2 μ f k 2 μ k g 2 Γ f g
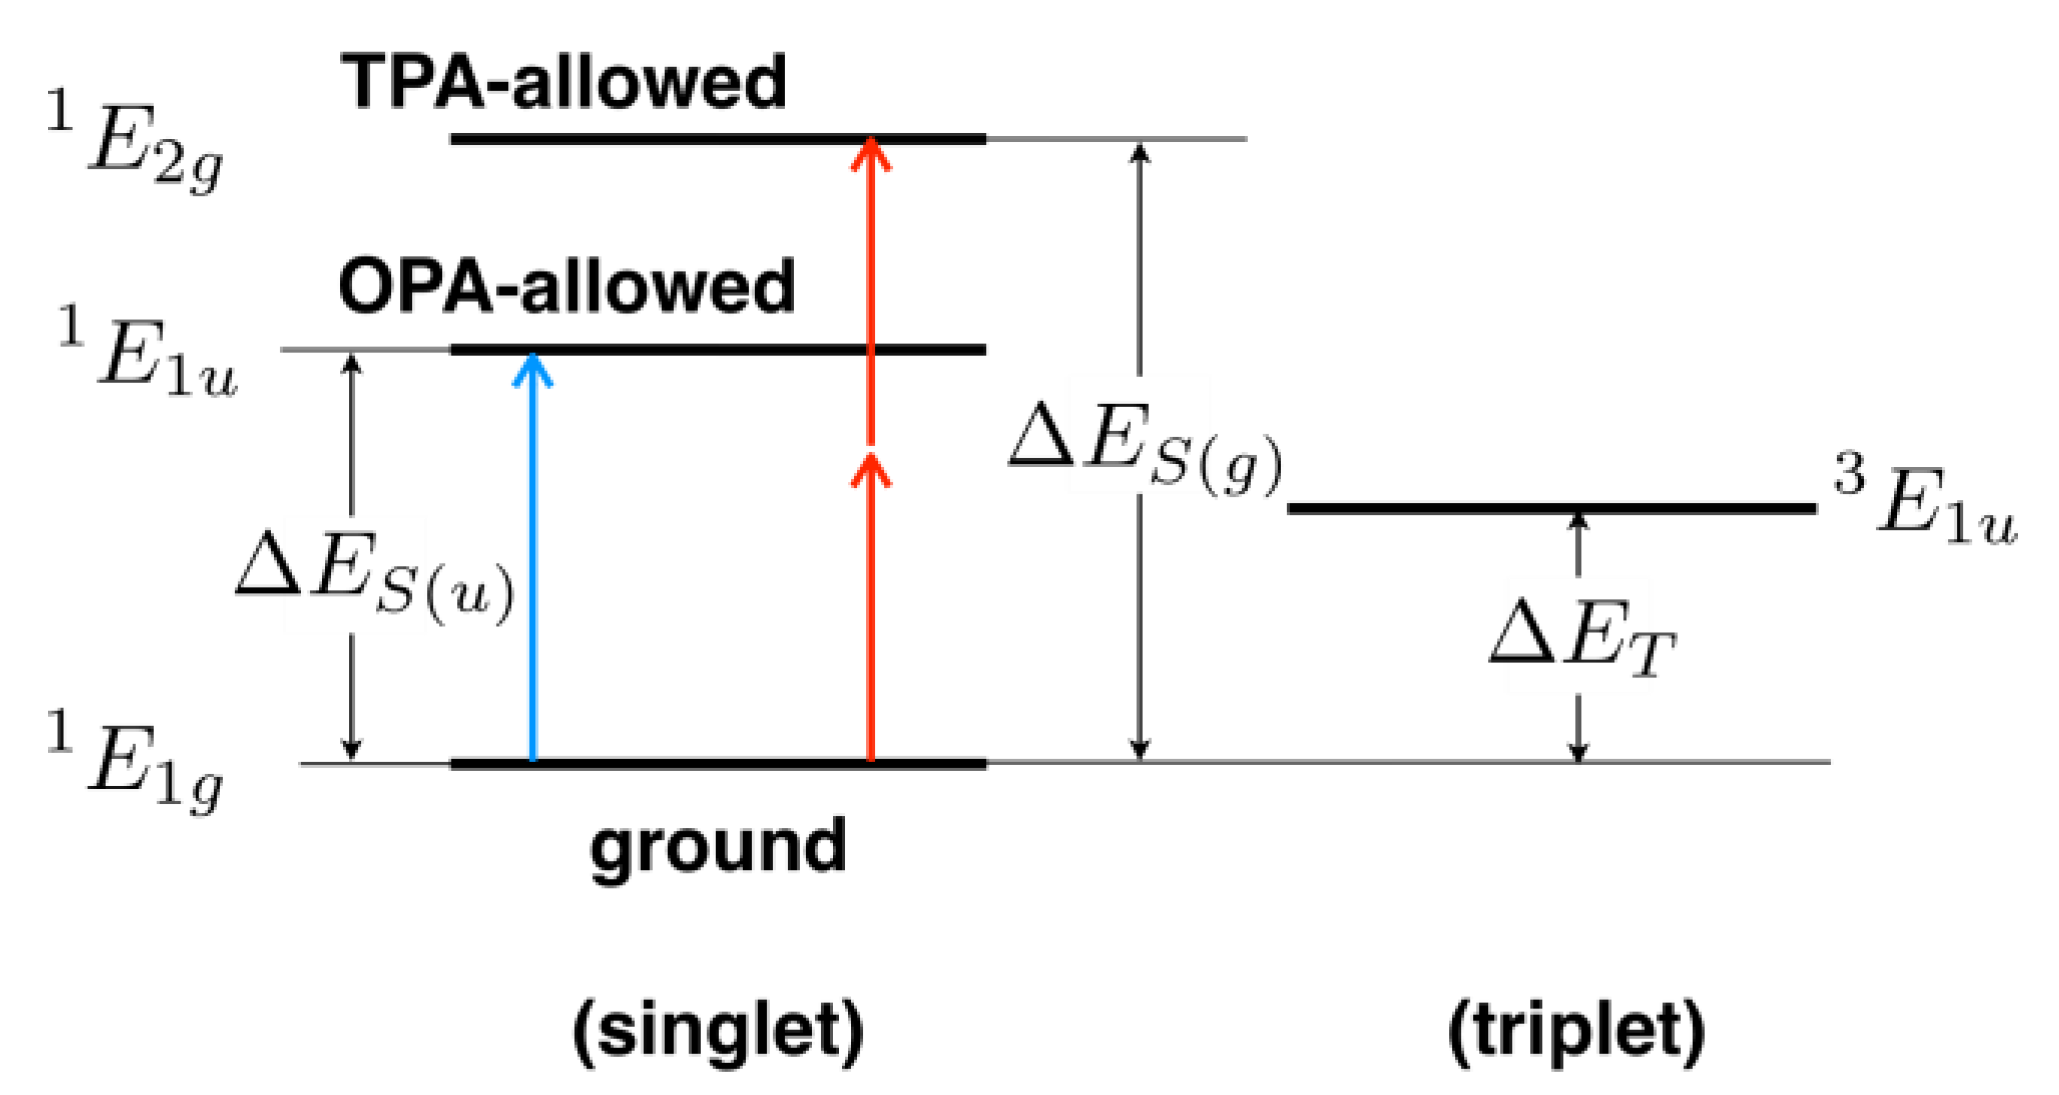
for non-centrosymmetric ones. Equation (69) is derived from the terms where the intermediate state is g or f itself. Here, μ i j and μ i j are the transition dipole moment and the dipole moment difference between state i and j ( i , j = f , k , g ). The term ( ω k g / ω f g 1 / 2 ) is the (normalized) detuning factor. These equations show that σ 2 is governed by the transition dipole moments (and the dipole moment difference for the asymmetric case), the linewidth, and the detuning factor. Larger transition dipole moments and narrower linewidths give larger σ 2 values. Resonance enhancement [28] also occurs when ω k g / ω f g 1 / 2 is close to zero, and it reaches double resonance where the largest σ 2 value is obtained [27], although TPA competes with OPA in this condition.
One of the widely accepted guiding principles for large σ 2 is the introduction of electron donors (D) and/or acceptors (A) at the ends of a π-conjugation system. It is known that symmetric (also called quadrupolar, D-π-A-π-D and A-π-D-π-A) and asymmetric (or dipolar, D-π-A) substitutions increase σ 2 [29]. Among many arrangements in different fashions, the D-π-A-π-D arrangement enjoys wide success [30]. For this symmetric arrangement, the main cause of the enhancement is due to the increase in the transition dipole moments between excited states μ f k . This can be explained by the breaking of the alternancy symmetry by introducing D or A groups in a symmetric manner [31]. Another widely accepted guiding principle is the acceleration of electronic communication by the extension [32] and planarization [33] of the π-conjugation system. The redistribution of π-electrons with larger charge and longer distance tends to give larger transition moments, resulting in larger σ 2 . The excitonic coupling mechanism is also proposed to explain the enhancement found in branched structures [34]. This is based on the interference between the transition dipole moments of substructure units.
In addition to the guiding principles mentioned above, the open-shell nature of the molecule acts as a new axis (Figure 13). Diradicaloids are the molecule with an intermediate nature between the closed shell (two paired electrons are in the HOMO in the ground state and form a covalent bond) and the pure diradical (the bond dissociates into two unpaired electrons). Thus, diradicaloids have a half-dissociated bond. As an intuitive picture, electrons in such a half-dissociated bond are weakly bound to the molecule and easily fluctuate against the applied field. The degree of the singlet diradical nature is represented by the diradical character y , which takes a value between 0 (closed shell) and 1 (pure diradical) [35]. The theoretical evaluations of γ for model molecules [36,37] revealed that γ has a bell-shaped dependence on the diradical character y . Therefore, at some intermediate value of y   0 < y < 1 , γ has the maximum. Recall that σ 2 is the imaginary part of γ (as in Equation (44)), so σ 2 also has a bell-shaped dependence on y . Theoretical considerations have shown that an increase in y leads to a decrease in μ k g but an increase in μ f k . These different dependences on the y of the transition moments are the main cause of the bell-shaped dependence.
In the following sections, the experimental progress on the TPA properties of diradicaloids is reviewed according to compound family. The examples are still limited, but the number is increasing. The diradical character y is a parameter independent of the conventional guiding principles mentioned above. Thus, a synergetic effect with the principles can be expected by tuning y for strong TPA.

4.2. Bis(phenalenyl) Derivatives

Singlet diradicaloids are generally unstable because of their high reactivity, which prevents them from being used in experimental studies. However, thermodynamic stabilization successfully opens up a means of realizing stable diradicaloid compounds that can be isolated and stored under ordinary conditions [38]. Thermodynamic stabilization can be achieved by using spin delocalization through many resonance structures. Figure 14 shows spin delocalization in the phenalenyl ring, which consists of three fused benzene rings.
A phenalenyl ring has a radical center, so a diradical molecule can be formed when two phenalenyl rings are linked together. The linker is key to controlling the properties of the formed molecule. When the linker electronically isolates the two phenalenyl rings from each other, they have a near-perfect diradical character. By using a π-conjugate bridge, both phenalenyl rings are electronically linked, resulting in a weaker independence of the two radicals. Choosing aromatic rings as the π-conjugate linker, a good balance between the correlation and independence of the two radicals can be established due to their aromaticity. Kubo et al. realized such molecules by using an aromatic π-linker (Figure 15) [38]. The central benzo- and naphtho-quinoid moieties contribute to the large diradical character of IDPL and NDPL as a result of the gain of the aromatization energy on the six-membered rings of the central moieties in the diradical forms. The resonance between the closed-shell Kekulé and diradical forms leads to a singlet ground state in the diradicaloid molecules. The values of the diradical character obtained by theoretical studies for the model molecules without peripheral substituents are y = 0.76 for IDPL [39] and 0.86 for NDPL [40], with intermediate values of 0 < y < 1 where the theory predicts a large NLO response. These compounds are stable at room temperature and can be stored for months, even in air.
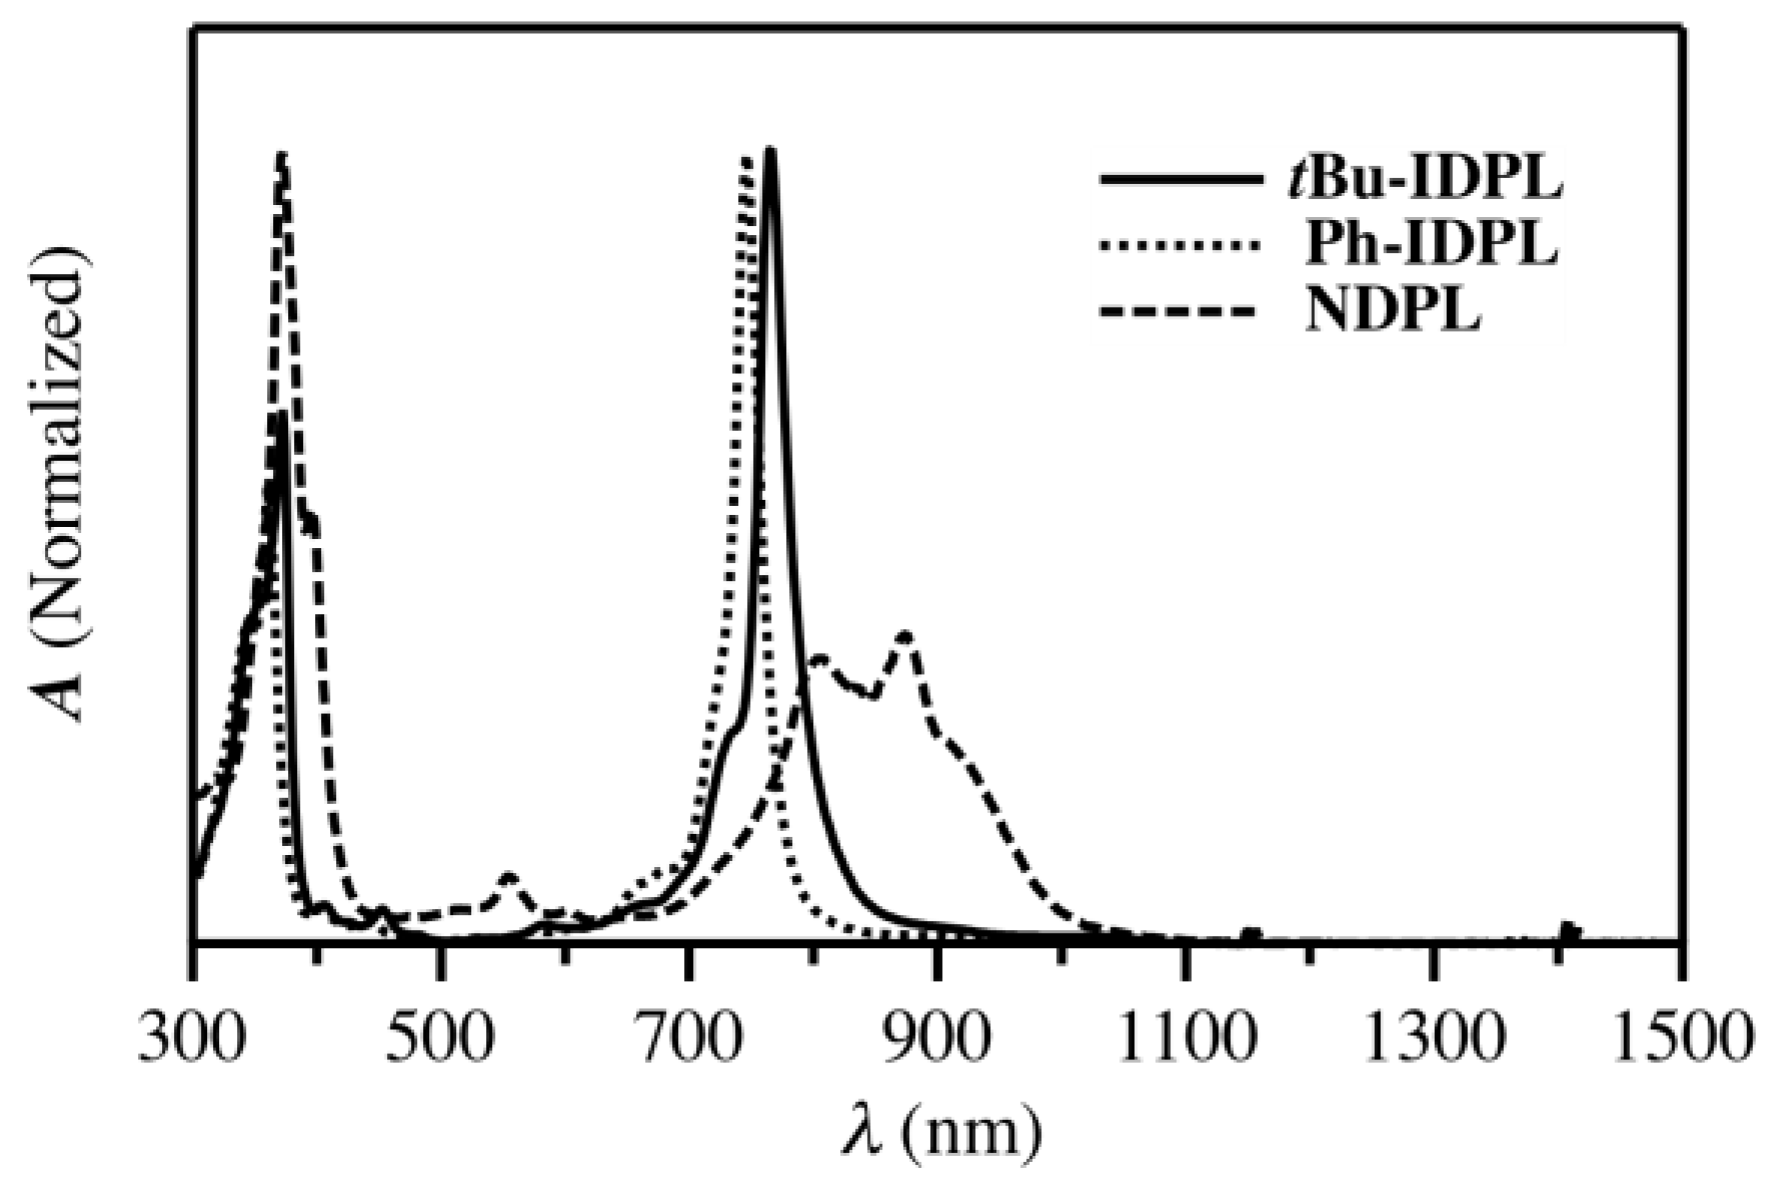
These compounds exhibit intense (one-photon) absorption peaks at 764, 746, and 875 nm for tBu-IDPL, Ph-IDPL, and NDPL, respectively (Figure 16), which can be assigned to HOMO-LUMO transitions [41]. These peaks are at longer wavelengths than expected for conventional closed-shell aromatic compounds of similar size. These low-energy HOMO-LUMO transitions are characteristic of these singlet diradicals.
Solutions of these diradicaloid compounds in chloroform (0.4–2 mM) were measured using the open-aperture Z-scan method with a femtosecond optical parametric amplifier [41]. Sample solutions held in 1 mm quartz cuvettes showed strong TPA over a wide wavelength range. The solutions of IDPLs (tBu- and Ph-) were measured at near-IR wavelengths longer than the OPA peaks. For longer wavelengths (1220–1500 nm), both IDPLs exhibited a single dip around the focal position for each open aperture trace (left panel of Figure 17; note that in the data presented here, the focal position is at z = 60 or 66 mm and the vertical axis is not normalized at z far from the focal point). The theoretical formula, assuming spatially and temporally Gaussian pulses (Equation (56)), gave reasonable fits. The z R also obtained by the curve fit was 6–8 mm, which is sufficiently longer than the optical path length of the sample to satisfy the thin-sample condition. Two-photon absorbance q 0 obtained by curve fitting (left column) shows a good proportionality (right column) with the incident powers (0.1–1.5 mW, corresponding to I 0 of several tens to a hundred GW/cm2).
At shorter wavelengths where the tail of the OPA band exists (960–1022 nm), the shape of the open-aperture traces of Ph-IDPL changed depending on the incident power (left, Figure 18). While a bump was observed at low power, a dip appeared and evolved, resulting in an “M”-like shape of the traces as the incident power increased. Therefore, the bump and M-like shape of the traces can be interpreted in terms of saturable absorption (SA). SA was significant at a low power, but then TPA gradually became dominant as the power increased. The theoretical equations discussed for SA (Equations (62) and (64)) successfully reproduced the shapes of the observed traces. The good proportionality between the obtained q 0 and the incident power for the data with SA (right, Figure 18) confirms the effectiveness of the theoretical equation.
This trend is more pronounced for the naphthalene-linked molecule NDPL, which was measured at wavelengths between 840 and 1500 nm. As in the case of IDPL, the behavior of the observed open-aperture traces was categorized into two types depending on the wavelength region. While a single dip was observed at the longer wavelengths (1200–1500 nm, where the one-photon absorption is negligible), a shape change depending on the incident power was observed at the shorter wavelengths (1055–1150 nm). A clear bump in the shape of the letter Λ was observed at a low incident power and then a dip overlapped the bump as the power increased, resulting in an M-shaped trace (Figure 19). The theoretical equation also reproduced the recorded traces well and the obtained q 0 showed good proportionality with the incident power.
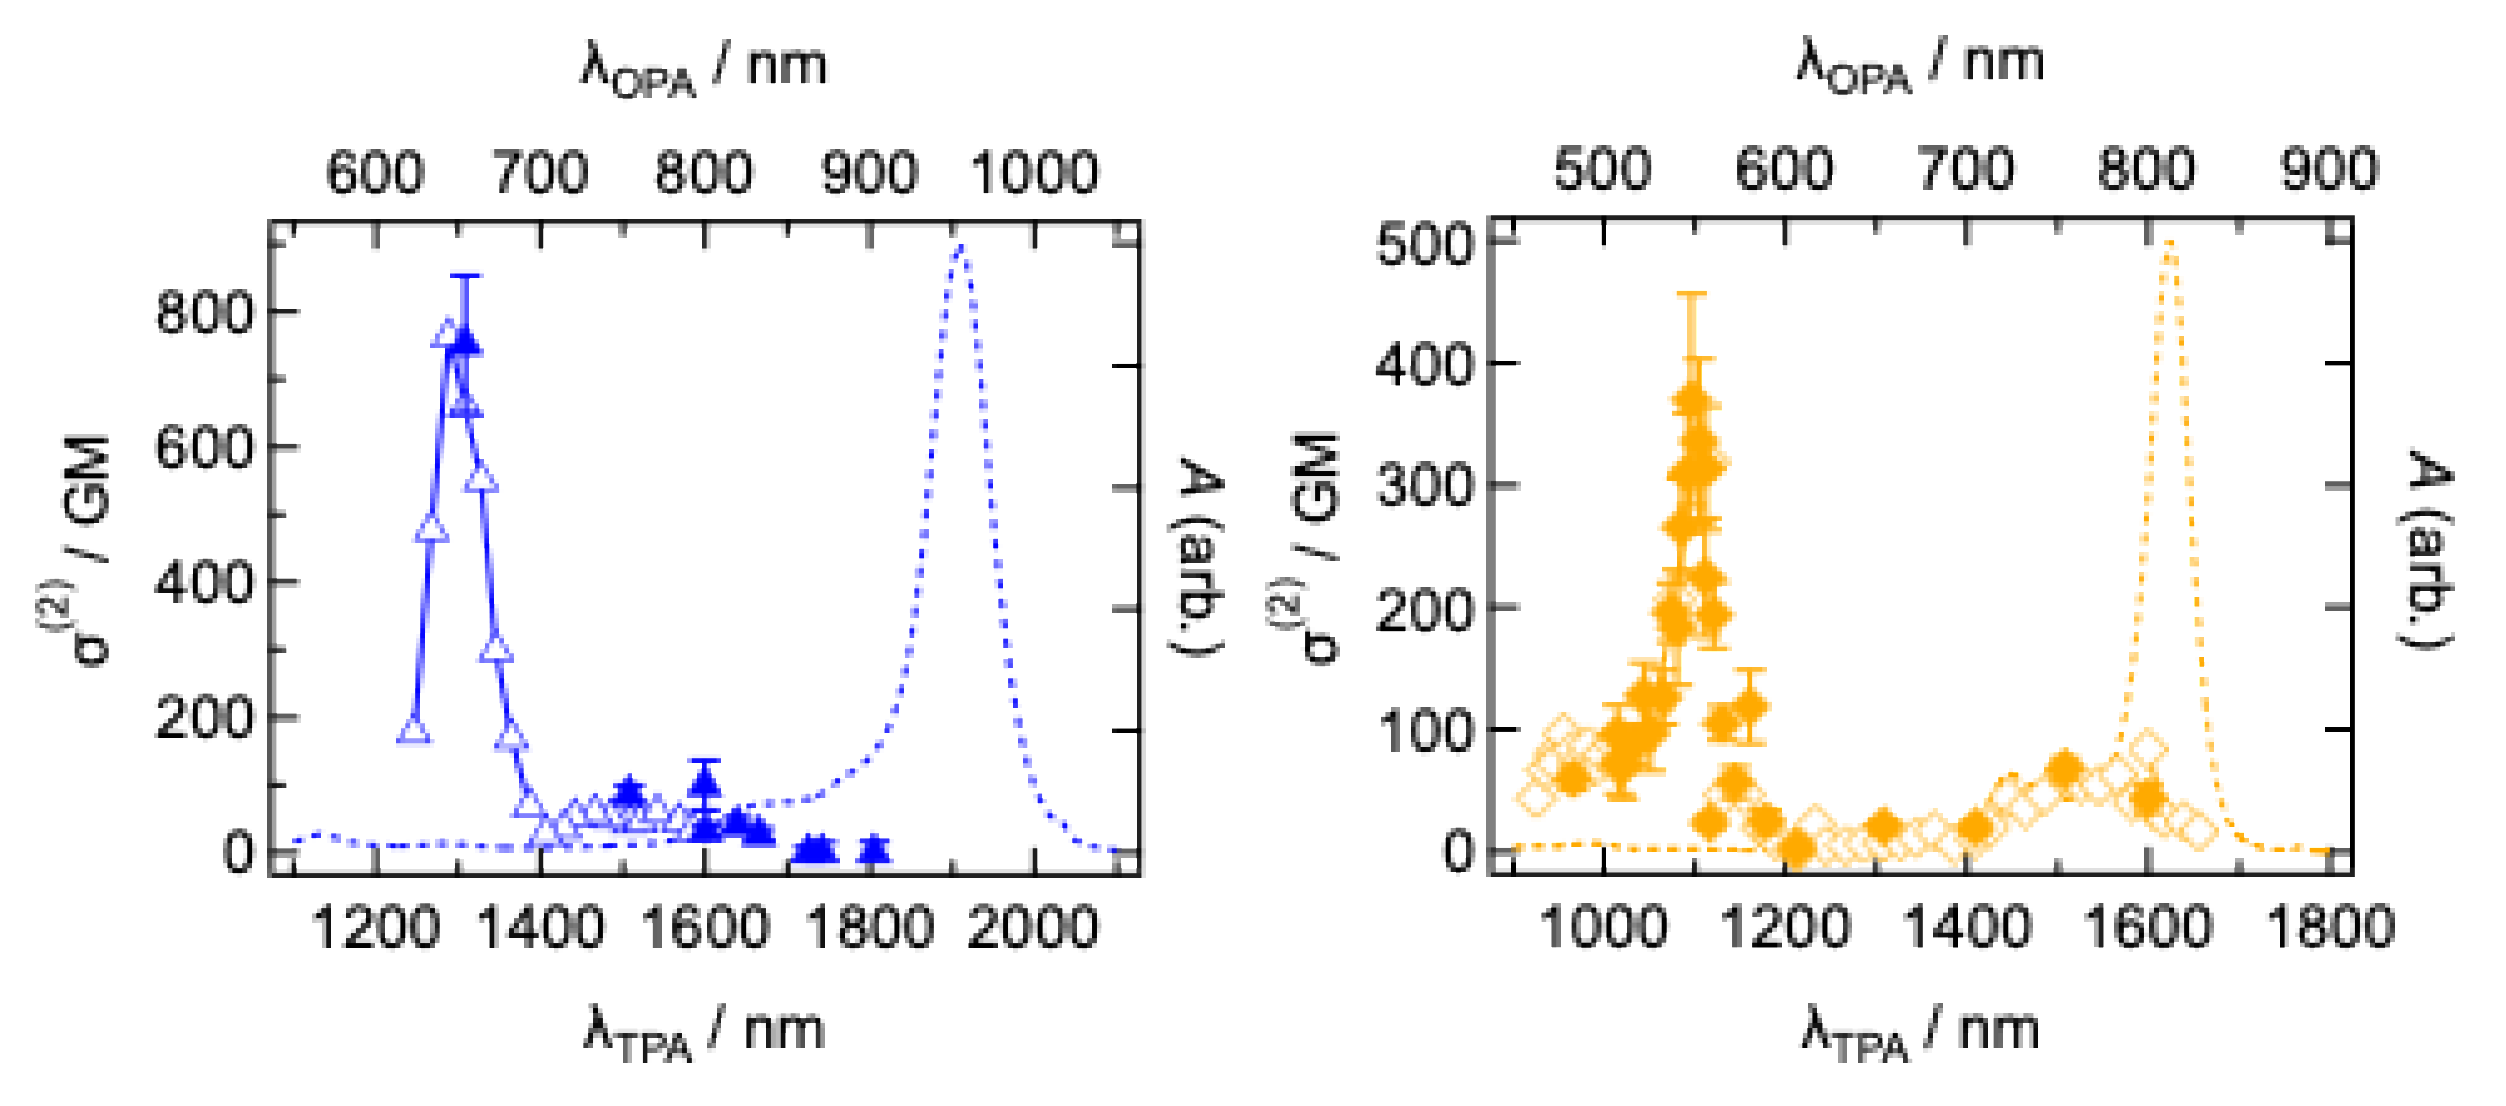
From the slope of the plot between q 0 and the incident power with proper estimation of the on-axis peak intensity, the TPA coefficient α ( 2 ) and the TPA cross-section σ ( 2 ) were obtained using Equations (29) and (35). Figure 20 shows the obtained TPA spectra of the three compounds. IDPLs (tBu- and Ph-) have TPA peaks at 1300 nm and 1425 nm with cross-section values of σ ( 2 ) = 330 GM and 425 GM, respectively. NDPL has a TPA peak at 1610 nm with σ ( 2 ) = 1800 GM. Moreover, the TPA cross-section showed a drastic increase as the incident wavelength decreased to less than 1200 nm, where the OPA starts to appear (for Ph-IDPL and NDPL). Resonance enhancement [28] is a likely cause of the drastic increase near the tail of the OPA band in addition to the sequential TPA process. The maximum TPA cross-section values observed were 5500 GM for the Ph-IDPL and 8300 GM for NDPL.
Pure hydrocarbons had been considered to have relatively weak TPA, although some hydrocarbon substituents, such as methyl and tert-butyl groups, have weak electron donating capability. Therefore, strong D and/or A groups have been introduced for large σ ( 2 ) values [29,30]. For example, bis(o-methylstyryl)benzene was reported to have the maximum σ ( 2 ) values of 66 GM [42] while the p-dibutylamino-substituted derivative, instead of o-methyl groups, was reported to have that of 900 GM [30]. Although IDPLs and NDPL do not have strong D/A substituents, the lowest-energy TPA peaks are comparable to those of reported TPA chromophores with strong D or A peripheral groups. The maximum values are comparable to some porphyrin derivatives with larger conjugation systems [43,44]. The maximum σ ( 2 ) value of NDPL is the highest class of the cross-section reported for pure hydrocarbons on the femtosecond time scale.
These compounds have relatively large intermediate diradical character ( y = 0.75 and 0.86). Similarly sized molecules with less diradical character, i.e., a more closed-shell character, showed much smaller σ ( 2 ) values: 27 GM for a pentacene derivative ( y = 0.45, to be mentioned in the next section) and 61 GM for diphenyloctatetracene [45]. The σ ( 2 ) values of IDPLs and NDPL are significantly larger than those of other hydrocarbons. These results for IDPL and NDPL are the first experimental evidence that TPA is enhanced by the intermediate diradical character y .
The maximum σ ( 2 ) value of NDPL is more than twice the peak values found for IDPL, suggesting that the extension of the π-conjugation by replacing the π-bridge from benzene to naphthalene works well, which is another factor to enhance the σ ( 2 ) (another axis in Figure 13).

4.3. Oligoacenes

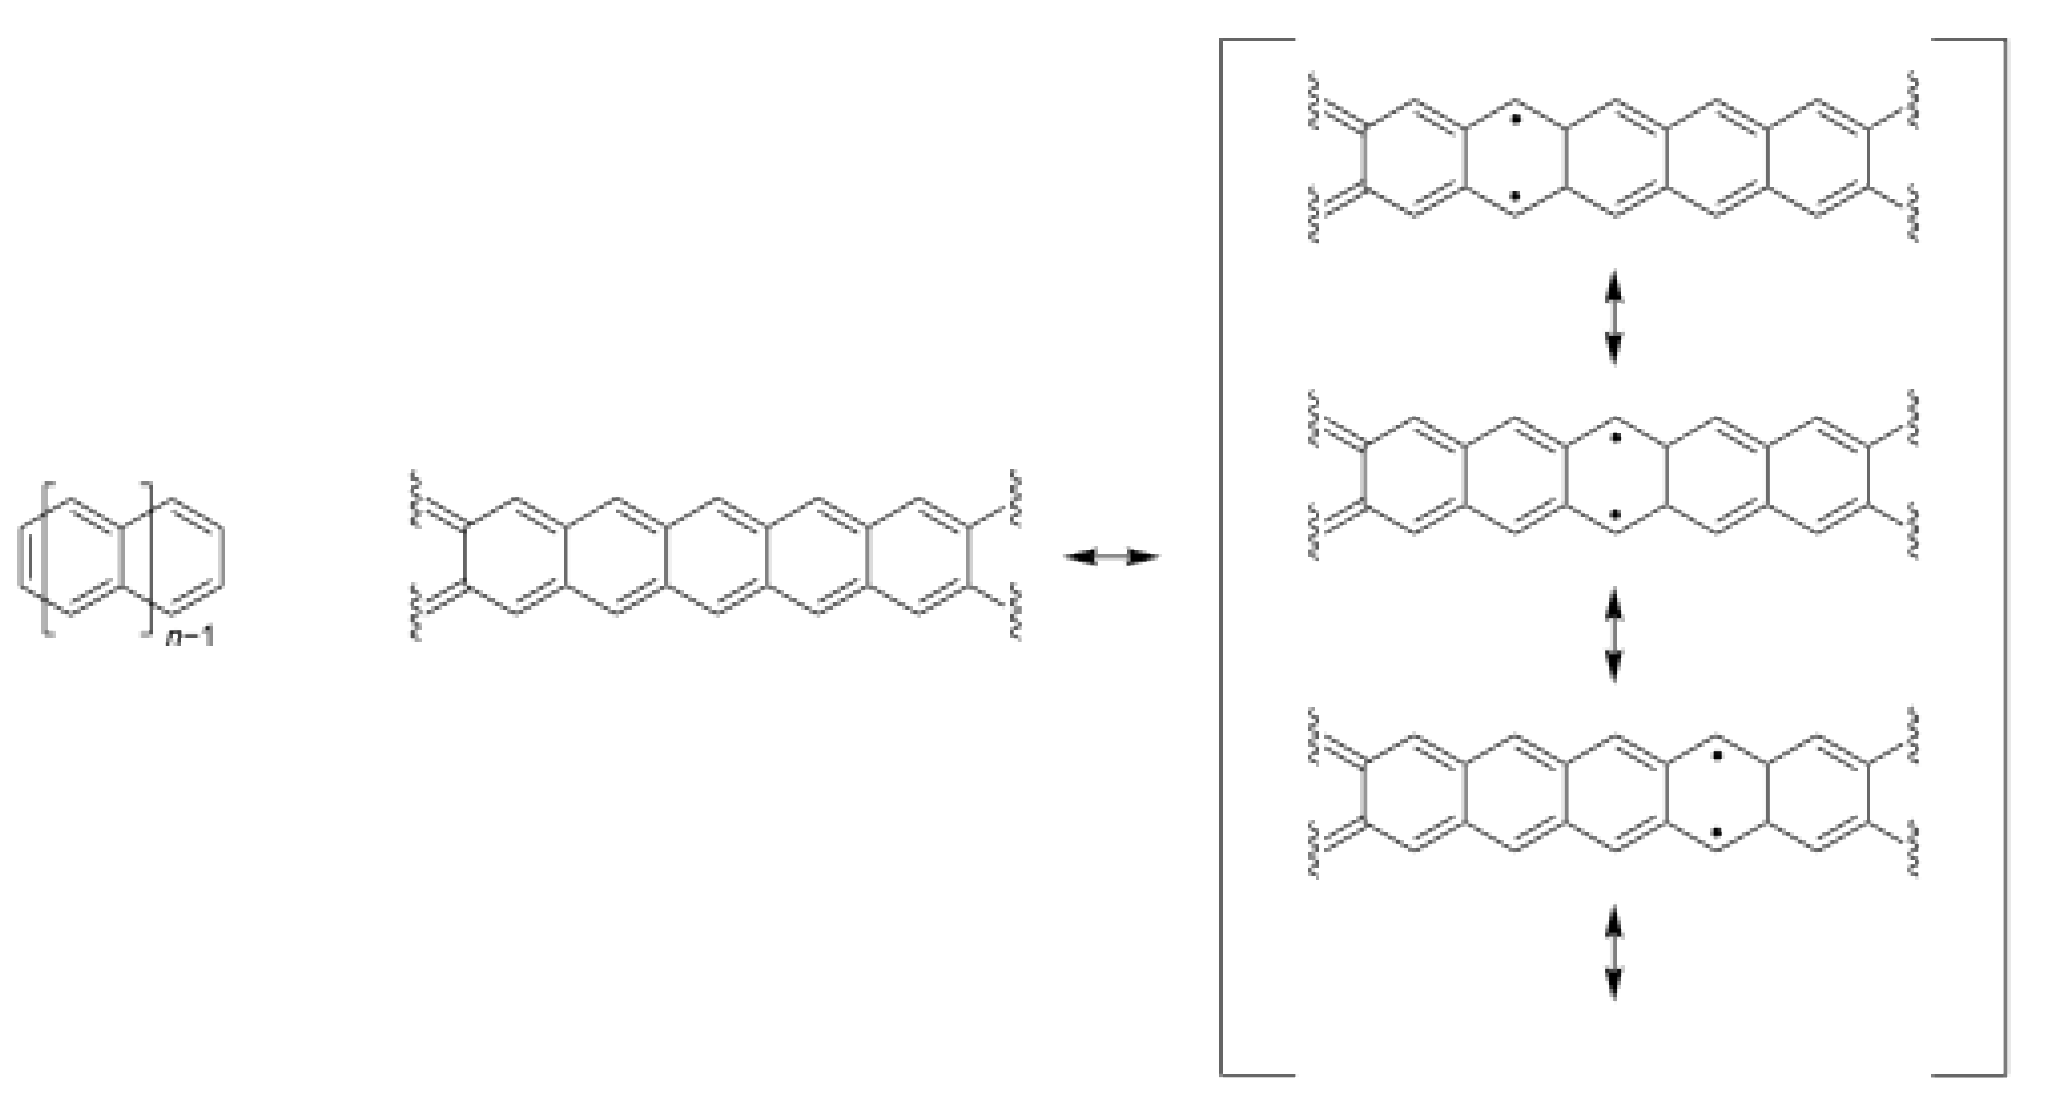
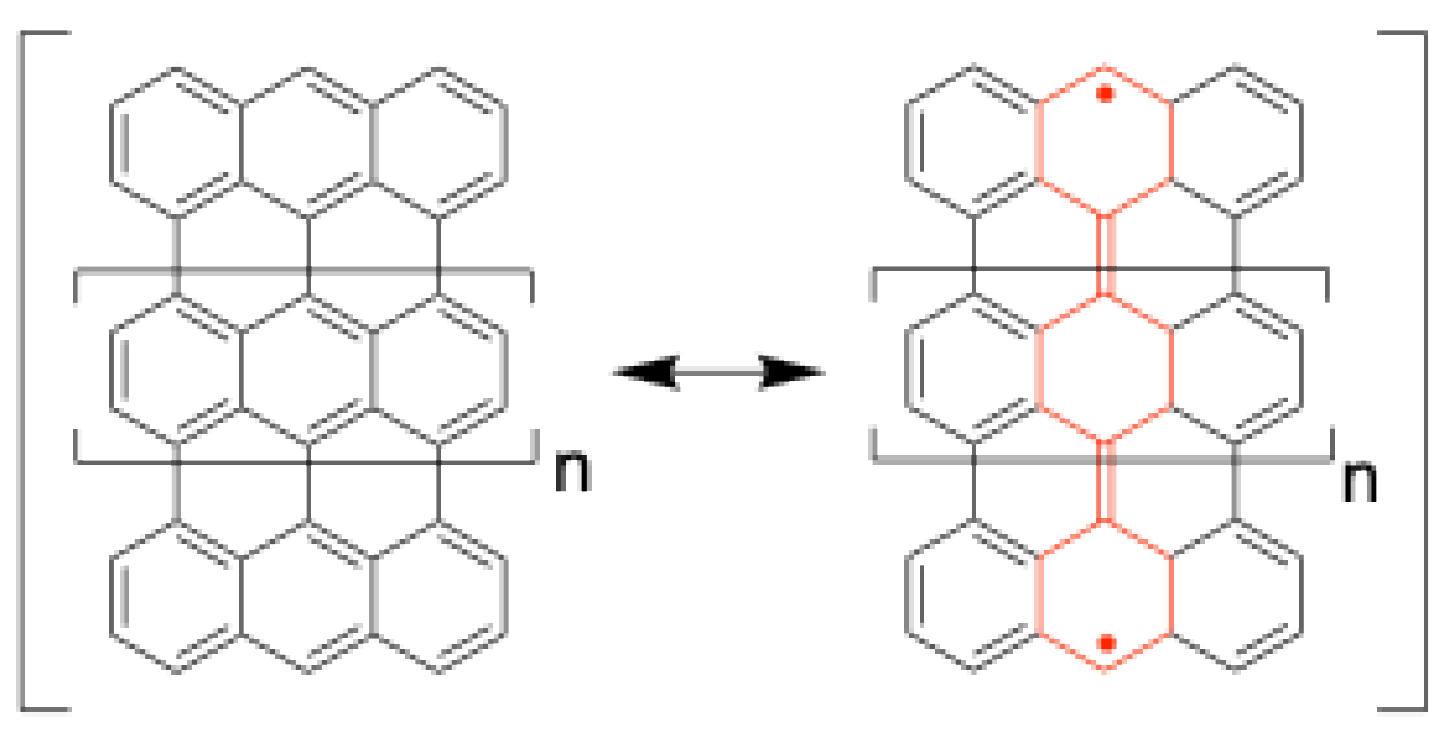
Oligoacenes were considered closed-shell molecules until their diradical nature was theoretically predicted in 2004 [46]. Two radical centers can be located at both sides of the polyene ladder and be delocalized along the acene chain (Figure 21). With increasing chain length, the singlet diradical state is thermodynamically stabilized with a larger number of resonance structures. However, a longer oligoacene ( n > 6 ) is less stable and difficult to obtain as an isolated molecule. Although tetracene ( n = 4 ) and pentacene ( n = 5 ) are expected to have a smaller diradical character than the molecules specifically designed to have a singlet diradical nature, such as bis(phenalenyl), it is still useful to understand the relationship between the diradical character y and the TPA cross-section.
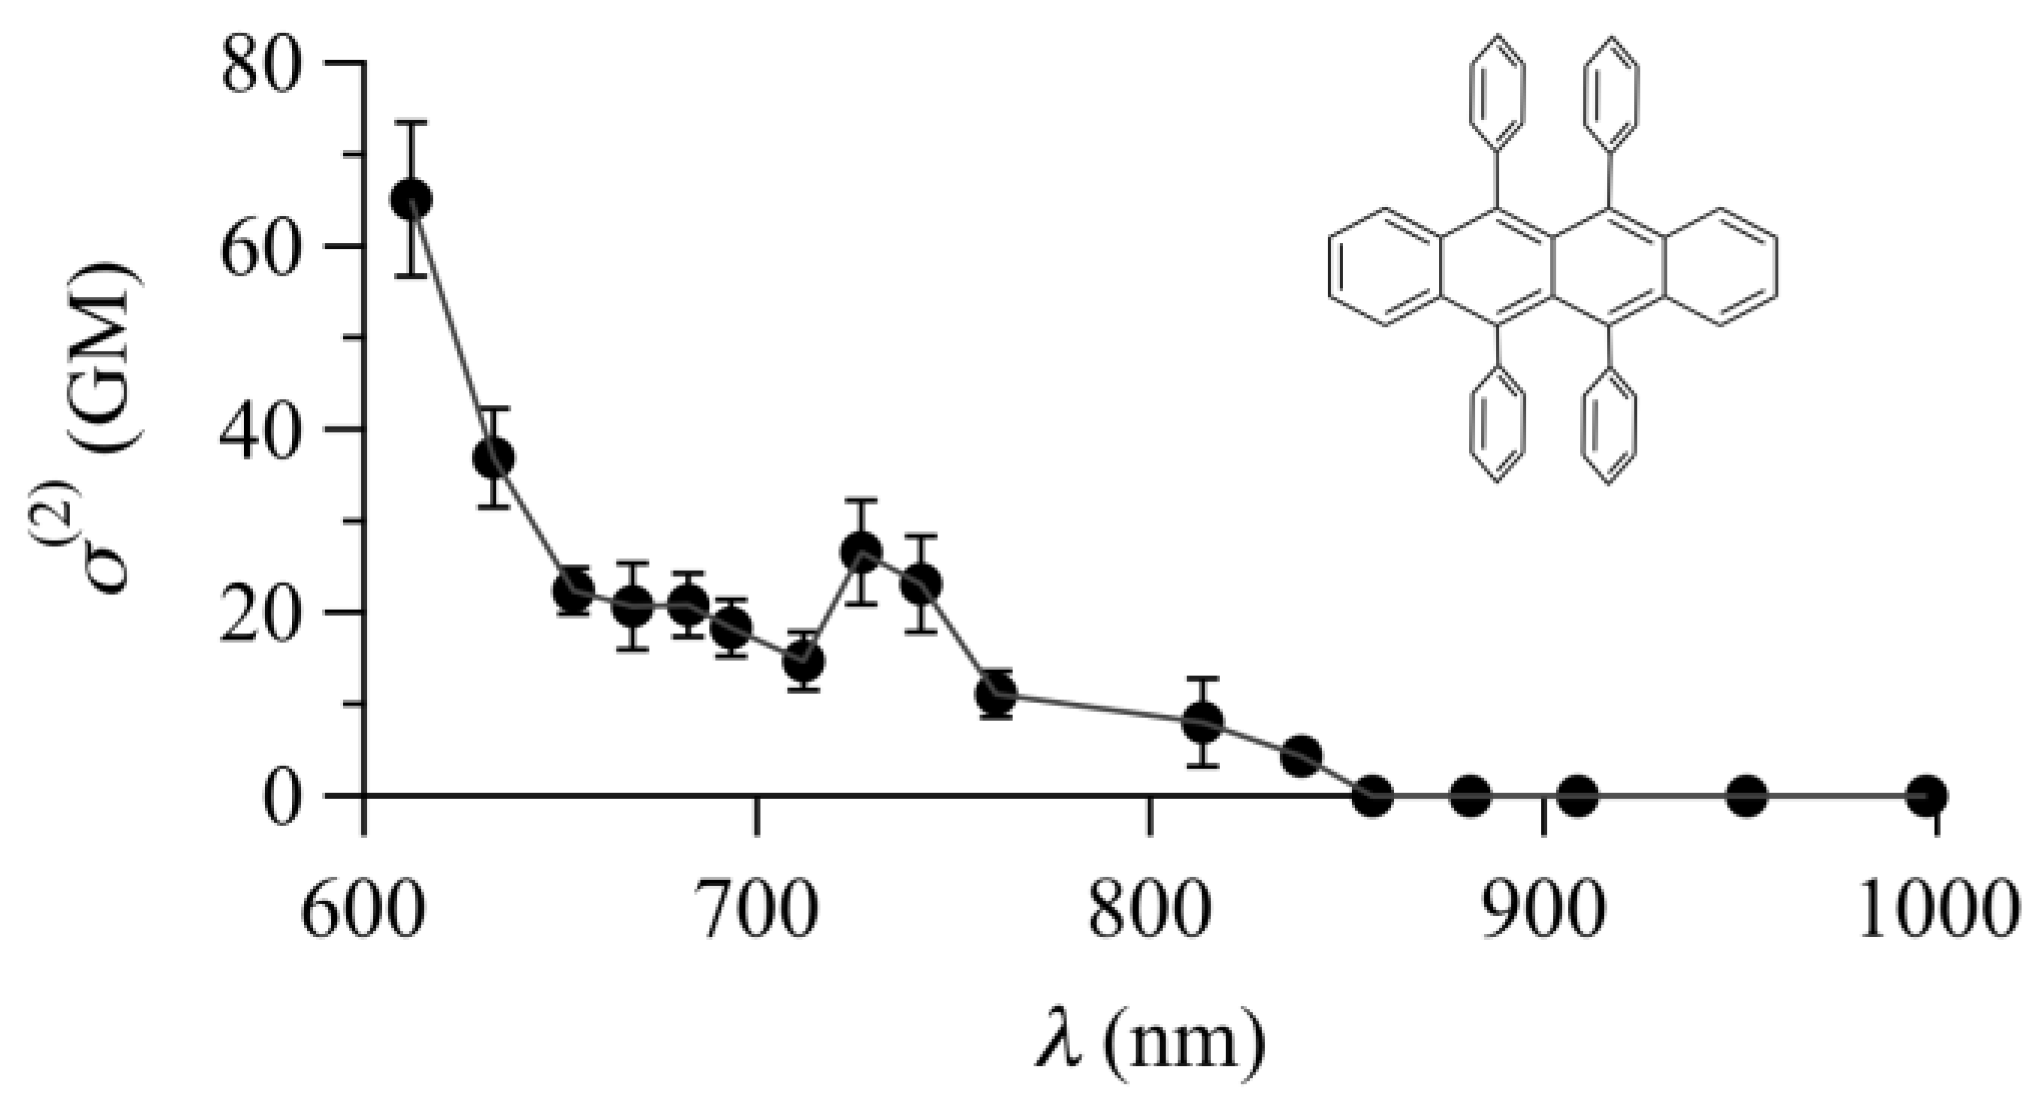
Rubrene, a derivative of tetracene with y = 0.036 obtained via theoretical calculation at the UHF/6-31G level, dissolved in dichloromethane was measured by the femtosecond open-aperture Z-scan technique. Rubrene has TPA at wavelengths shorter than 850 nm (Figure 22) [47]. An isolated peak was observed at 725 nm with shoulders at 680 and 820 nm. The spectral intensity increased as the wavelength shortened to 610 nm, close to the tail of the OPA. The maximum σ ( 2 ) observed was 65 GM at the shortest wavelength of the measurements (610 nm) and the peak σ ( 2 ) at 725 nm was 27 GM. These values are in the same order of magnitude as those of common π-conjugate molecules, which are closed-shell species such as bis(o-methylstylyl)benzene.
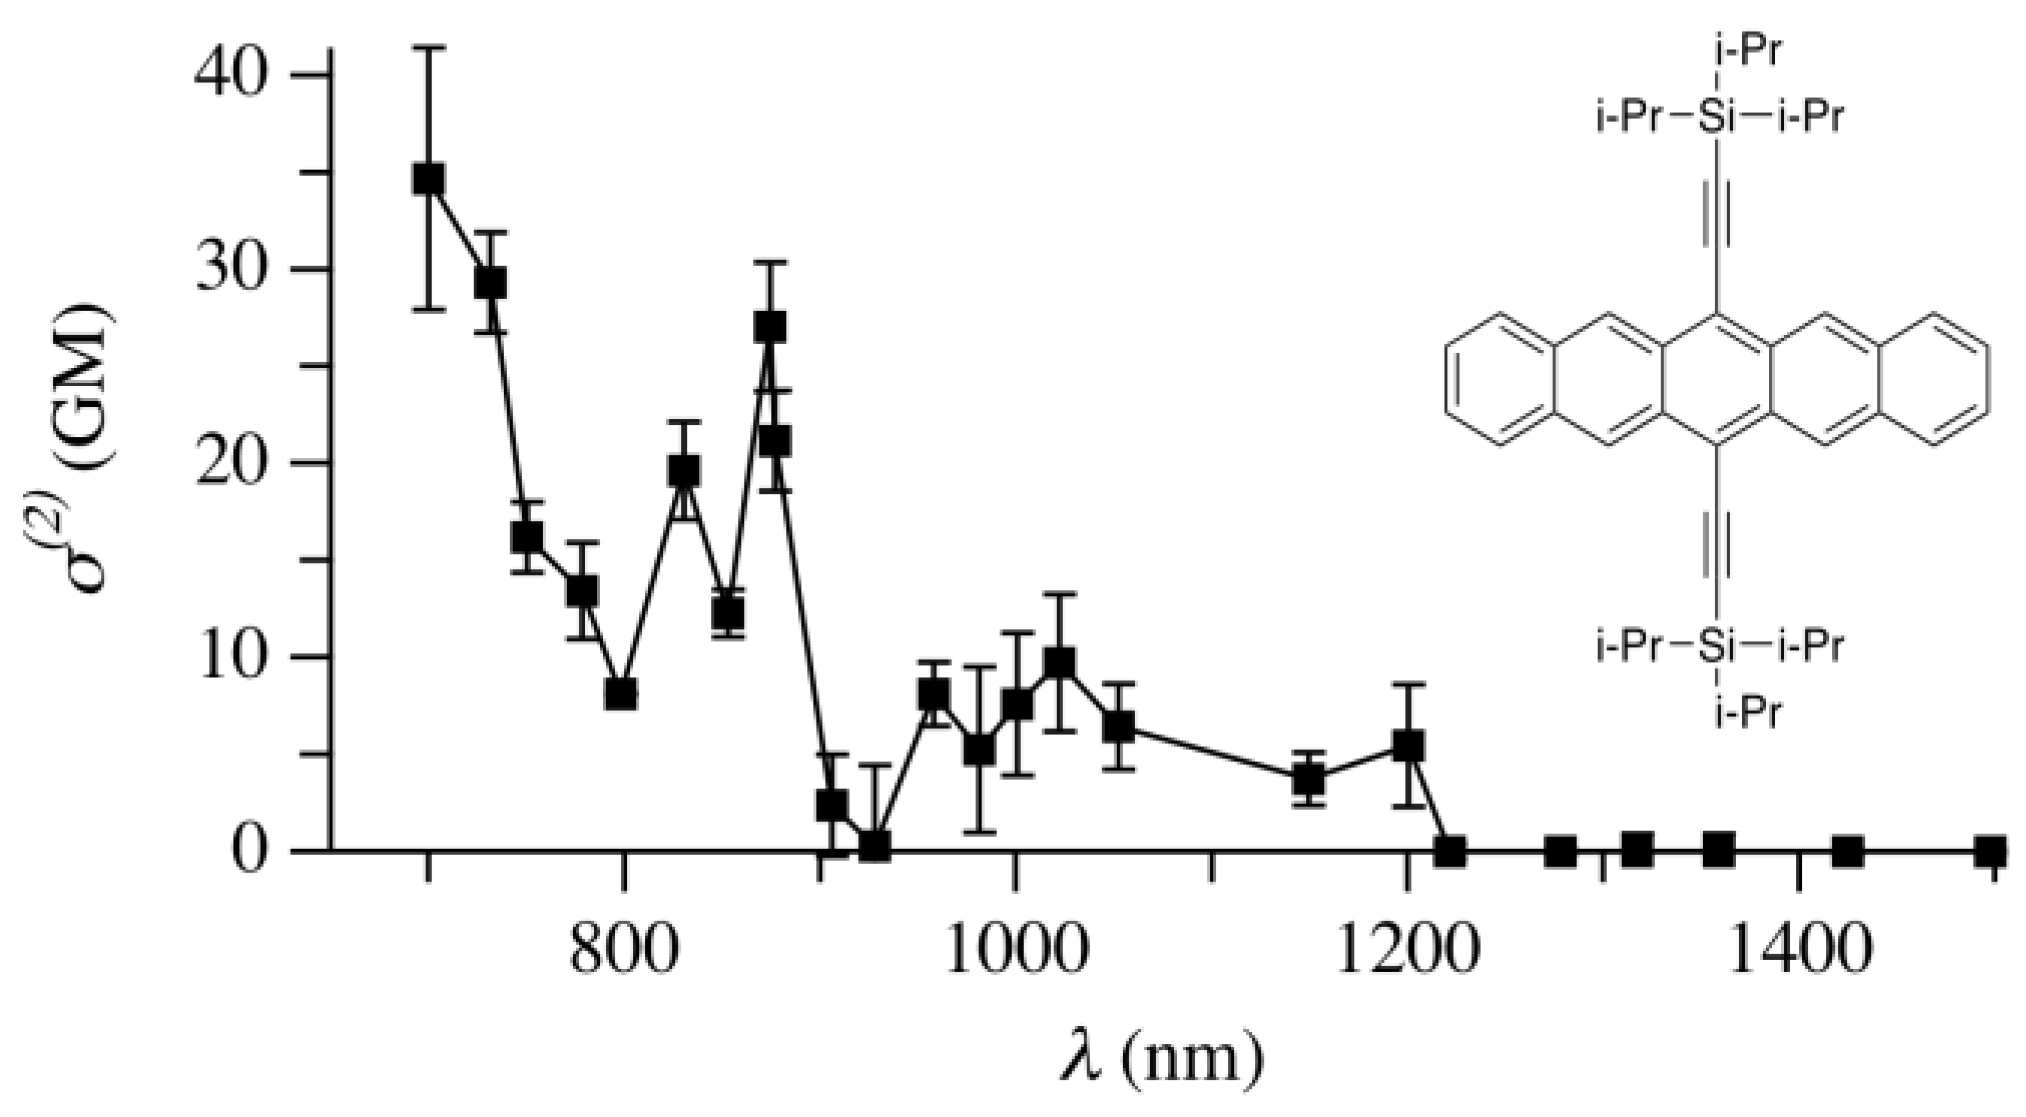
Another example of an oligoacene with a longer chain length is the so-called TIPS-pentacene, 6,13-bis(triisopropylsilylethynyl)-pentacene, a solubilized derivative of pentacene. The value of y was calculated to be y = 0.41 for the model molecule in which the isopropyl groups are replaced by H atoms at the UHF/6-31G** level [40]. A TPA spectrum of TIPS-pentacene in tetrahydrofuran (THF) was reported for 700–1500 nm (Figure 23) [40]. The TPA spectrum has many peaks and is more complicated than that of rubrene. However, the value of σ ( 2 ) is smaller than that of rubrene for the observed wavelength range. The peak at 880 nm is relatively larger (27 GM) and the maximum value obtained at 700 nm ( σ ( 2 ) = 35 GM). The reason why TIPS-pentacene has the similar or smaller σ ( 2 ) values than rubrene is not yet understood, but it is clear that both oligoacenes have much smaller values than the bis(phenalenyl) diradicaloid.
Anthenes are not exactly acenes, but have a related structure (Figure 24). They have the condensed rings extended in the direction perpendicular to the long axis of acenes and a family of graphene nanoflakes. As seen from the resonance structures, the radical centers are located in the center rings of the top and bottom anthracene moieties. This family has an interesting electronic structure. Quateranthene ( n = 2 ) has an equilibrium between the singlet ground state and the triplet excited state (T1), as shown by the temperature-dependent SQUID and OPA spectral measurements [48]. Because of the low-lying excited singlet and triplet states, the OPA spectrum extends to 1300 nm or longer. TPA peaks were observed at 2000 and 2300 nm in the CS2 solution.

4.4. Zethrenes

Zethrene has the molecular structure of two benzene rings fused to a tetracene in a centrosymmetric manner (inset of Figure 25). The fused benzene rings form phenalenyl moieties, so the structure is considered to be two directly linked phenalenyl groups. In this sense, zethrene is one of the smallest bis(phenalenyl) molecules. As mentioned in the previous section, the bis(phenalenyl) molecule shows a larger diradical character with increasing length of the central aromatic linker. Thus, zethrene is considered to have a smaller diradical character than those with linkers due to the smaller distance between the radical centers. The calculated value of the diradical character is y = 0.188 at the UHF/6-31G* level of theory. The lowest-energy OPA peak is sharp and vibrational-structured and is located at 520 nm—as long as that of rubrene. While the OPA peak has clear vibrational progressions, the TPA spectrum of zethrene is broad and structureless (Figure 25) [47]. A small peak was found around 750 nm with σ ( 2 ) = 90 GM, and the maximum, which is probably a peak judging from the spectral shape, was observed at 600 nm with σ ( 2 ) = 1300 GM. These values are much larger than those of rubrene, although both peaks for OPA are located at the same wavelength, suggesting that the larger diradical character y positively influenced TPA.
Derivatives of zethrene, including extended zethrenes with longer acene units, have been extensively studied and their excellent TPA properties have also been reported [49].

4.5. Porphyrinoids

Single-ring porphyrins are known to have weak TPA with σ ( 2 ) values in the order of 10 GM [50]. However, their derivatives with jointed multi-macrorings tend to show intense TPA. Some of them have σ ( 2 ) values a few orders of magnitude larger than the single rings. Many different manners of the extended porphyrins with large σ ( 2 ) have been reported, such as the extension of the π-conjugation through ethynylene-based linkage [43]; self-assembled supramolecular systems of porphyrin–porphyrin [24,51] or porphyrin–phthalocyanine [52] dimers through complementary coordination bonding; and multiporphyrin arrays, such as double-stranded ladder configurations [53], helical configurations around mesomeso linkage assisted by hydrogen bonding [54], or fused multiporphyrin rings [55]. In addition, various porphyrinoids with different geometries have been reported as porphyrin-related compounds, such as Möbius porphyrinoids [56,57].
Osuka and his coworkers [58] successfully synthesized a porphyrinoid with diradical character in the singlet ground state. The porphyrinoid was a corrole dimer, the structure of which is shown in Figure 26 (1, M=Zn). Corrole is a tetrapyrrole molecule with a direct pyrrole–pyrrole bond in its macrocycle. Two corrole rings are directly connected, forming an octagonal core in the center. The octagonal core was found to act as an energetic barrier to prevent electronic communication between two corrole rings. The TPA cross-section of the dimer, measured by the open-aperture Z-scan method, was reported to be σ ( 2 ) = 4600 GM at 2100 nm [59] based on the approximation form of Equation (53). Its free base form (M = H) also showed a singlet diradical character with σ ( 2 ) = 3700 GM at 2100 nm. The radical centers were proposed to be located in the octagonal ring based on its aromaticity suggested by the negative nucleus-independent chemical shift (NICS) value [60].
Another type of porphyrinoid, hexaphyrin, with six pyrroles in the macrocycle (2 in Figure 26), was also found to show a diradical nature in the singlet ground state by the same group. The reaction of the closed-shell compound, meso-free [26] hexaphyrin(1.1.1.1.1.1) (2a) via Ni metalation, gave its diketo form (2c), which was concluded to be a diradicaloid from the temperature-dependent ESR measurements and ab initio molecular orbital calculations [61]. The TPA cross-sections were measured by the same method. The hexaphyrin diradicaloid (2c) has σ ( 2 ) = 3800 GM at 2200 nm [61], similar in magnitude to the corrole dimer diradicaloid (1, M=Zn). However, the σ ( 2 ) value is smaller (1600 GM) at 1600 nm, where the transition energy is higher than the energy levels of the Q-band-like states [60]. The TPA cross-sections of the closed-shell form (2a) and the mono-keto, mono-radical form (2b) have also been reported: σ ( 2 ) = 360 and 600 GM, respectively, at 1600 nm [61]. These results show that the TPA cross-section is significantly enhanced for the diradical form compared to the closed-shell and mono-radical forms, although these structures are not exactly the same as each other and differ in the number of keto groups at the meso position.

4.6. Bis(acridine) Dimer—Chemical Switching of Diradical Character

We have witnessed that singlet diradicaloids tend to have strong TPA. This has been shown not only by theoretical calculations, but also by experimental work, as mentioned above. However, the diradical character y is not the only parameter that determines the magnitude of σ ( 2 ) . The magnitude is also influenced by the other parameters: the π-conjugation length, the strength and symmetry of the charge distribution in the molecule induced by the D/A substitution, and the resonance enhancement depending on whether the level of the excited states and the excitation photon energy are matched. These are parameters that are independent of y . Thus, the comparison under the identical conditions, i.e., between molecules with the same structures but only differing in y , were necessary to clarify the true effect of the intermediate diradical character. Although comparisons of molecules with similar structures have been reported [41,61], such a direct comparison has not been easy for experimental studies because of the difficulty in finding molecules with exactly the same structures for open and closed shells.
Such a comparison was realized with bis(acridine) dimers [62]. The dimers were serendipitously formed from four acridine units, two of which are directly linked to each other, resulting in a coplanar structure between the two, while the other two are orthogonally linked to the planar core. A tetracation species of the dimers was found to be partially diradical in its singlet ground state and can exhibit resonance between the quinoidal (closed shell) and the non-quinoidal (diradical) forms (Figure 27).
Note that the diaminobiphenyl moiety in the center of the tetramer is planar and has resonance structures (shown in red in Figure 27). This is the isoelectronic structure of so-called Chichibabin’s hydrocarbon (Figure 28), which is a famous example of a diradicaloid [63].
In the quinoidal form (left), the bonds of the benzene rings in the central resonance part show bond alternation, while in the non-quinoidal form (right), they are equivalent to each other due to the aromaticity of the benzene ring. Thus, the bond length difference (BLD) between the single and double bonds in the benzene rings depends on the degree of diradical character. From for the results of the X-ray diffraction measurements and the theoretical calculation at the UB3LYP/6-31G(d) level, it was found that the BLD of the tetracation dimer is between that of the closed shell and pure triplet diradical. The visible-NIR OPA spectrum of the tetracation dimer in solution and in the crystalline state clarified its small HOMO–LUMO gap, which is another characteristic feature of the singlet diradicaloid. Moreover, ab initio molecular orbital calculations showed that the most stable state of the tetracation is the partial diradical singlet state rather than the closed-shell singlet state or the diradical triplet state. The diradical character was calculated to be y = 0.685 at the UBHandHLYP/6-31G(d) level, suggesting that the structure has an intermediate diradical nature.
The tetracation diradical was found to interconvert to the dication closed-shell dimer (Figure 29) by oxidation/reduction reactions in good yields. These two dimers differ only in their oxidation states, so they are a suitable pair for comparing between the diradicaloid and closed-shell molecules with the same structure to test the theoretical prediction that molecules with intermediate diradical character (0 < y < 1) have a larger optical nonlinearity than the corresponding closed-shell electronic state (y = 0). Their intermediate oxidation state, trication monoradical, was also obtained by the stepwise reaction from the precursor of the tetracation.
TPA measurements of the three dimers were performed using the femtosecond open-aperture Z-scan method. The excitation wavelength was scanned from 1200 nm to 1300 nm, where the OPA of the samples was relatively small. The open-aperture Z-scan traces of the tetracation diradical solution at 1260 nm showed a clear dip, a strong nonlinear absorption signal (top, Figure 30). On the other hand, the trication monoradical shows almost no signal (middle) and the dication closed-shell gives a concave curve, i.e., an SA signal (bottom). Although the tetracation diradical sample contains residual trication monoradical species, the effect is clearly negligible for TPA.
After correction for the residual trication species, the TPA cross-section of the diradical tetracation was found to be σ ( 2 ) = 3600 GM at 1200 nm. In contrast, the closed-shell dication did not show any notable TPA: σ ( 2 ) < 9 GM at the same wavelength. The σ ( 2 ) value was found to vary by at least two orders of magnitude between a singlet diradicaloid ( y = 0.682) and its closed-shell counterpart ( y = 0.000) with the same backbone structure and atomic composition. The experimental results clarify the drastic y -dependency of the TPA cross-section under the same condition. Therefore, this directly substantiates the theoretical prediction that molecules with intermediate diradical character have large third-order nonlinearity, including TPA. It is also noted here that this result suggests the possibility of switching the TPA magnitude by using redox reactions, as reported for condensed-ring fluorene derivatives [64].

4.7. Oxocarbons

Oxocarbons (C=O)n are cyclic oligomers of polycarbonyls and variations of radialenes (Figure 31a). They have attracted the attention of chemists for more than a century because of their highly symmetrical structure and unique properties. Among the family, n = 4 and 5 derivatives, respectively, squaric acid and croconic acid (Figure 31b) are known as functional dyes with absorption in the long wavelengths (deep red to NIR). In the late 1980s, Fabian et al. pointed out that they have diradical nature from bathochromic shifts of the absorption peaks and they have non-Kekulé structures [65].
However, the experimental evidence of their diradical nature has not been reported until very recently. In 2023, Maeda et al. synthesized the croconaine and squaraine derivatives with extended π-conjugation by involving cyanine-like chalcogenopyrylium moieties (Figure 31c,d) and found that they have a diradical nature, as predicted by BLD analysis and temperature-dependent NMR, ESR, and SQUID studies [66]. The degree of diradical nature was stronger with the heavier chalcogen atom (X = S) in the chalcogenopyrylium moiety than that with the lighter one (X = O). They show good absorption properties as NIR dyes (700–970 nm) and also have very sharp and characteristic TPA bands to higher excited states in the wavelength range of 950–1300 nm, as revealed by a Z-scan study (Figure 32). In particular, the compounds with thiopyrylium groups (X = S) showed larger σ ( 2 ) values (750 GM at 1310 nm for the croconaine dye and 370 GM at 1100 nm for the squaraine dye) than those of the compounds with pyrylium groups (X = O). These results with the heavier chalcogen atom agree with the tendency found for the diradical nature.

4.8. TPA Cross-Section and Transition Wavelength

The TPA cross-section can be enhanced by π-conjugation extension, D/A substitution, and intermediate diradical character (Figure 13). These factors cause the red shift of the TPA transition. The longer π-conjugation (including better planarity of the π-plane) leads to larger transition dipole moments due to the longer travel distance of the π-electron and reduces the HOMO-LUMO gap. D (or A) substitution increases the electron density at both ends of the π-conjugation in HOMO and HOMO-1 (or LUMO and LUMO+1 for A). This results in larger transition dipole moments through the better overlap between the orbitals and also reduces the HOMO-LUMO gap by pushing up the HOMO and pulling down the LUMO by coupling with the HOMO and LUMO levels of the D and A groups. As y increases from 0, the transition dipole moment between the excited states increases due to the increasing ionic character of the TPA-allowed state [37]. This also decreases the HOMO-LUMO gap. Therefore, the enhancement of TPA by these strategies correlates with the red shift of the TPA transition. In other words, the larger σ ( 2 ) values tend to be found at longer wavelengths. However, it is not easy to determine at which wavelength the largest σ ( 2 ) is obtained, because the transition wavelength and σ ( 2 ) are affected not only by the combination of these three factors, but also by others. It should also be noted that, from an application point of view, the wavelength required for TPA depends on the application. For example, blue or shorter wavelengths are preferred for optical storage because of high storage density and compatibility with existing devices [5], and NIR is preferred for PDT application because of the better penetration depth in biological tissues through the optical window.

4.9. Diradical Parameter from Experimentally Available Values

Diradical character y is the parameter that represents the degree of the singlet diradical character of molecules and is defined by y = 1 2 T / 1 + T 2 , where T = n H n L / 2 , which is a half of the difference in the occupation numbers between the HOMO and the LUMO, n H and n L , respectively [67]. For the closed shell, n H = 2 and n L = 0 (two antiparallel electrons are in the bonding orbital (HOMO) and no electron is in the antibonding orbital (LUMO)), so T = 1 and y = 0 . On the other hand, for the pure singlet diradical, n H = n L = 1 (one electron is in the bonding orbital and the other is in the antibonding orbital), so T = 0 and y = 1 . Hence 1 y indicates the effective bond order. In other words, an intermediate value of y means partial dissociation of the chemical bond, resulting in a loosely bound electron in the bond. Qualitatively, such a loosely bound electron can easily deform its orbital shape according to the external applied field, causing a large optical nonlinearity. This intuitive understanding evolves into a rigorous manner: it has been clarified theoretically that the second hyperpolarizability γ exhibits bell-shaped dependence as a function of y . Experimental studies have supported the theoretical prediction by observing the large optical nonlinearity of singlet diradicaloids (mostly by the TPA measurements, as shown in the previous sections, but also by the third-harmonic generation (THG) measurements [68]).
As can be seen from these results, the diradical character is a key factor that determines chemical reactivity and physical properties (not only of NLO, but also of electronic, linear optical, magnetic, etc.), but the value was defined in a purely theoretical manner until the relationship between y and the measured quantities was proposed [40], which allows one to determine y from the experimental data.
The theoretical basis of the relationship uses the two-site system (A–B) model with two electrons in two orbitals [36]. With localized natural orbitals (LNO), a (at site A) and b (at site B), there are four states: two are neutral, a b ¯ and b ¯ a , where one electron is at A and the other is at B; and the other two are ionic, a a ¯   and b b ¯ , where two unpaired electrons are at either A or B. The bar indicates the β spin. The configuration interaction of these four states results in the following four electronic states:
S 1 g —neutral, lowest-energy singlet state of gerade ( g ) symmetry;
S 1 u —ionic excited singlet state of ungerade ( u ) symmetry;
S 2 g —partially ionic excited singlet state of g -symmetry;
T 1 u —neutral triplet state of u -symmetry.
The energy level of these states is shown in Figure 33.
The analytical form of the diradical character y was given as y = 1 4 t / U 2 + 16 t 2 , where U represents the difference between the on-site and inter-site Coulomb integrals and t is a transfer integral using the localized natural orbital basis. This formula is rewritten with the energy levels of the four states ( E 1 g 1 , E 1 u 1 , E 2 g 1 , and E 1 u 3 for S 1 g , S 1 u , S 2 g , and T 1 u , respectively) as in [40].
y = 1 1 E 1 u 1 E 1 u 3 E 2 g 1 E 1 g 1 2 = 1 1 Δ E S u Δ E T Δ E S g 2
The right-hand side of the first equal sign contains the energy gap between S 1 u and T 1 u (i.e., the singlet-triplet gap E 1 u 1 E 1 u 3 ) and that between S 2 g and S 1 g (i.e., the energy gap between the excited states E 2 g 1 E 1 g 1 ). If U 0 , then E 1 u 1 E 1 u 3 0 , and thus y 0 . If U t , then E 1 u 1 E 1 u 3 E 2 g 1 E 1 g 1 U , and thus y 1 . The rightmost side of Equation (70) is expressed with the energy differences based on the ground state, i.e., Δ E S g , Δ E S u , and Δ E T . Obviously, these three energy differences are experimentally accessible. Δ E S g and Δ E S u can be determined from the lowest-energy TPA and OPA peaks, and Δ E T is obtained from the phosphorescence peak or the temperature-dependent ESR measurements.
Figure 34 shows the correlation between the experimentally obtained y values from Equation (70) and the theoretically calculated y for several compounds. There is a good correlation between the experimental and theoretical results for all compounds, despite the different scales between the axes. The experimentally obtained value y e x p is almost half of the theoretical value y c a l , which can be attributed to several factors, including the effects of the environment (solvation or crystal packing), inconsistencies between the different experimental methods, the approximate nature of the valence configuration interaction (VCI) model, and the overestimation of the stability of the triplet level by the DFT calculation. In spite of the difference in scale, the good correlation between the experimental and theoretical values of y supports the validity of Equation (70). Although further tests, including the use of other levels of calculation such as CC2 [69] and more experiments for wide range of molecules, are still needed for the comprehensive applicability, this equation makes the diradical character y more than a theoretical entity.

5. Conclusions

In this tutorial review, the progress of the experimental works on the TPA of singlet diradicaloid molecular systems was overviewed. Prof. Masayoshi Nakano opened the field with his predictive theoretical view and close collaboration with experimentalists. When he began to focus on the important role of singlet diradicals, no one could have imagined how popular this concept would become in chemistry. Today, the contribution of singlet diradicals is an indispensable concept for understanding the reactivity and stability of compounds and their electric and magnetic responses. However, the relationship between the electronic structure and the optical response, especially the NLO response, is unfamiliar to many chemists. Thus, much attention has been paid here to the fundamentals of NLO to connect the electronic structure to the optical response. It will help readers to understand why parameters such as nonlinear susceptibility, hyperpolarizability, and TPA cross-section are so important, and how they are connected to the optical phenomena we observe and how they relate to applications.
First, the fundamentals of nonlinear optics were revisited. The importance of polarization as the source of all optical phenomena was emphasized. Then, nonlinear susceptibility was introduced to describe the magnitude of the NLO process of interest. In contrast to macroscopic quantities, their microscopic counterparts, induced dipole and hyperpolarizability, were introduced to connect the material response with the molecular response. Among many NLO processes, we focused on the degenerate third-order NLO processes induced by χ 3 ω ; ω , ω , ω or γ ω ; ω , ω , ω . These processes include the intensity-dependent refractive index change and nonlinear absorption exemplified by TPA, which have broad applications. By using the concept of complex amplitudes, χ 3   and γ are treated as complex numbers and it is shown that the real and imaginary parts of these parameters relate to refractive and absorptive phenomena, respectively. Multiphoton absorption, particularly TPA, was considered in detail from both macroscopic and microscopic points of view, and the relationship between TPA coefficient α 2 and TPA cross-section σ 2 was presented. Furthermore, the interrelations between α 2 and χ 3 ω ; ω , ω , ω and between σ 2 and γ ω ; ω , ω , ω were introduced, which are rarely described in the existing literature. Then, the major experimental techniques for measuring the degenerate third-order NLO process were reviewed, followed by a detailed discussion of the Z-scan technique, which can measure both the real and imaginary parts of the process, i.e., the refractive index change and the TPA, respectively. In addition, the influence of the saturable absorption of OPA was also discussed. Then, the evolution of experimental studies on TPA enhancement of the singlet diradicaloids was classified according to the compound family.
Our study [41] is the first report to experimentally demonstrate the enhancement of TPA for the singlet diradicaloid. The work was achieved through a close triangular collaboration between theory, synthesis, and measurement. Thereafter, many examples and more detailed studies have been carried out by us and other groups that followed. The number of experimental studies is increasing, but still limited. The concept of open-shell electronic states is a new axis to the existing axes of parameters (Figure 13). The new axis will open up new directions. The chemistry of the singlet diradicaloid and open-shell electronic states put forth by Prof. Nakano is just beginning.

Funding

This work was partially supported by Grant-in-Aid for Scientific Research (KAKENHI), grant number JP23K04701 from JSPS.

Conflicts of Interest

The authors declare no conflicts of interest.

References

  1. Wu, J.; Li, Z.A.; Luo, J.; Jen, A.K.Y. High-performance organic second- and third-order nonlinear optical materials for ultrafast information processing. J. Mater. Chem. C 2020, 8, 15009–15026. [Google Scholar] [CrossRef]
  2. Cumpston, B.H. Two-photon polymerization initiators for three-dimensional optical data storage and microfabrication. Nature 1999, 398, 51–54. [Google Scholar] [CrossRef]
  3. Kawata, S.; Sun, H.B.; Tanaka, T.; Takada, K. Finer features for functional microdevices. Nature 2001, 412, 697–698. [Google Scholar] [CrossRef]
  4. Denk, W.; Strickler, J.H.; Webb, W.W. Two-photon laser scanning fluorescence microscopy. Science 1990, 248, 73–76. [Google Scholar] [CrossRef]
  5. Kawata, S.; Kawata, Y. Three-dimensional optical data storage using photochromic materials. Chem. Rev. 2000, 100, 1777–1788. [Google Scholar] [CrossRef]
  6. Pascal, S.; David, S.; Andraud, C.; Maury, O. Near-infrared dyes for two-photon absorption in the short-wavelength infrared: Strategies towards optical power limiting. Chem. Soc. Rev. 2021, 50, 6613–6658. [Google Scholar] [CrossRef]
  7. Senge, M.O.; Fazekas, M.; Notaras, E.G.A.; Blau, W.J.; Zawadzka, M.; Locos, O.B.; Ni Mhuircheartaigh, E.M. Nonlinear optical properties of porphyrins. Adv. Mater. 2007, 19, 2737–2774. [Google Scholar] [CrossRef]
  8. Yariv, A. Quantum Electronics, 3rd ed.; John Wiley & Sons: New York, NY, USA, 1988; pp. 106–135. [Google Scholar]
  9. Shen, Y.R. The Principles of Nonlinear Optics; John Wiley & Sons: New York, NY, USA, 1984. [Google Scholar]
  10. Boyd, R.W. Nonlinear Optics; Academic Press: Boston, MA, USA, 1992. [Google Scholar]
  11. Shi, R.F.; Garito, A.F. Introduction: Conventions and Standards for Nonlinear Optical Processes. In Characterization Techniques and Tabulations for Organic Nonlinear Optical Materials; Kuzyk, M.G., Dirk, C.W., Eds.; Marcel Dekker: New York, NY, USA, 1998; pp. 1–36. [Google Scholar]
  12. Kuzyk, M.G. Relationship between the molecular and bulk response. In Characterization Techniques and Tabulations for Organic Nonlinear Optical Materials; Kuzyk, M.G., Dirk, C.W., Eds.; Marcel Dekker: New York, NY, USA, 1998; pp. 111–220. [Google Scholar]
  13. Pierce, B.M. A theoretical analysis of third-order nonlinear optical properties of linear polyenes and benzene. J. Chem. Phys. 1989, 91, 791–811. [Google Scholar] [CrossRef]
  14. Göppert, M. Über die Wahrscheinlichkeit des Zusammenwirkens zweier Lichtquanten in einen Elementarakt. Naturwissenschaften 1929, 17, 932. [Google Scholar] [CrossRef]
  15. Kaiser, W.; Garrett, C.G.B. Two-photon excitation in CaF2: Eu2+. Phys. Rev. Lett. 1961, 7, 229–231. [Google Scholar] [CrossRef]
  16. Helmchen, F.; Denk, W. Deep Tissue Two-photon microscopy. Nat. Methods 2005, 2, 932–940. [Google Scholar] [CrossRef] [PubMed]
  17. Sun, H.-B.; Kawata, S. Two-photon photopolymerization and 3D lithographic microfabrication. In NMR·3D Analysis·Photopolymerization. Advances in Polymer Science; Springer: Berlin, Germany, 2004; Volume 170, pp. 169–273. [Google Scholar] [CrossRef]
  18. Parthenopoulos, D.A.; Rentzepis, P.M. Three-dimensional optical storage memory. Science 1989, 245, 843–845. [Google Scholar] [CrossRef] [PubMed]
  19. Bhawalkar, J.D.; Kumar, N.D.; Zhao, C.-F.; Prasad, P.N. Two-photon photodynamic therapy. J. Clin. Laser Med. Surg. 1997, 15, 201–204. [Google Scholar] [CrossRef] [PubMed]
  20. Gu, B.; Wang, J.; Chen, J.; Fan, Y.-X.; Ding, J.; Wang, H.-T. Z-scan Theory for material with two- and three-photon absorption. Opt. Express 2005, 23, 9230–9234. [Google Scholar] [CrossRef]
  21. Yariv, A. Quantum Electronics, 3rd ed.; John Wiley & Sons: New York, NY, USA, 1988; pp. 83–105. [Google Scholar]
  22. Slepkov, A.D.; Hegmann, F.A.; Zhao, Y.; Tykwinski, R.R.; Kamada, K. Ultrafast optical Kerr effect measurements of third-order nonlinearities in cross-conjugated iso-polydiacetylene oligomers. J. Chem. Phys. 2002, 116, 3834–3840. [Google Scholar] [CrossRef]
  23. Sheik-Bahae, M.; Said, A.A.; Wei, T.-H.; Hagan, D.J.; Van Stryland, E.W. Sensitive measurement of optical nonlinearities using a single beam. IEEE J. Quant. Electron. 1990, 26, 760–769. [Google Scholar] [CrossRef]
  24. Kamada, K.; Hara, C.; Ogawa, K.; Ohta, K.; Kobuke, Y. Strong Two-photon absorption and its saturation of self-organized dimer of an ethynylene-linked porphyrin tandem. Chem. Commun. 2012, 48, 7988–7990. [Google Scholar] [CrossRef]
  25. Kamada, K. Characterization of two-photon absorption and its resonance enhancement by Z-scan method. Proc. SPIE 2004, 5516, 97–105. [Google Scholar] [CrossRef]
  26. Sutherland, R.L. Characterization of Nonlinear Refractive Index Materials. In Handbook of Nonlinear Optics, 2nd ed.; Marcel Dekker: New York, NY, USA, 2003; p. 463. [Google Scholar]
  27. Kuzyk, M. Fundamental limits on two-photon absorption cross sections. J. Chem. Phys. 2003, 119, 8327–8334. [Google Scholar] [CrossRef]
  28. Kamada, K.; Ohta, K.; Iwase, Y.; Kondo, K. Two-photon absorption properties of symmetric substituted diacetylene: Drastic enhancement of the cross section near the one-photon absorption peak. Chem. Phys. Lett. 2003, 372, 386–393. [Google Scholar] [CrossRef]
  29. He, G.S.; Tan, L.-S.; Zheng, Q.; Prasad, P.N. Multiphoton absorbing materials: Molecular designs, characterizations, and applications. Chem. Rev. 2008, 108, 1245–1330. [Google Scholar] [CrossRef] [PubMed]
  30. Albota, M.; Beljonne, D.; Brédas, J.-L.; Ehrlich, J.E.; Fu, J.-Y.; Heikal, A.A.; Hess, S.E.; Kogej, T.; Levin, M.D.; Marder, S.R.; et al. Design of organic molecules with large two-photon absorption cross sections. Science 1998, 281, 1653–1656. [Google Scholar] [CrossRef] [PubMed]
  31. Ohta, K.; Kamada, K. Theoretical investigation of two-photon absorption allowed excited states in symmetrically substituted diacetylenes by ab initio molecular orbital method. J. Chem. Phys. 2006, 124, 124303. [Google Scholar] [CrossRef] [PubMed]
  32. Eisler, S.; Slepkov, A.D.; Elliott, E.; Luu, T.; McDonald, R.; Hegmann, F.A.; Tykwinski, R.R. Polyynes as a model for carbyne: Synthesis, physical properties, and nonlinear optical response. J. Am. Chem. Soc. 2005, 127, 2666–2676. [Google Scholar] [CrossRef]
  33. Martineau, C.; Anémian, R.; Andraud, C.; Wang, I.; Bouriau, M.; Baldeck, P.L. Efficient initiators for two-photon induced polymerization in the visible range. Chem. Phys. Lett. 2002, 362, 291–295. [Google Scholar] [CrossRef]
  34. Terenziani, F.; Le Droumaguet, C.; Katan, C.; Mongin, O.; Blanchard-Desce, M. Effect of branching on two-photon absorption in triphenylbenzene derivatives. ChemPhysChem 2007, 7, 723–734. [Google Scholar] [CrossRef]
  35. Nakano, M.; Kishi, R.; Nitta, T.; Kubo, T.; Nakasuji, K.; Kamada, K.; Ohta, K.; Yamaguchi, K. Second hyperpolarizability (γ) of biradical system: Dependency of γ on the diradical character. J. Phys. Chem. A 2005, 109, 885–891. [Google Scholar] [CrossRef]
  36. Nakano, M.; Kishi, R.; Ohta, S.; Takahashi, H.; Kubo, T.; Kamada, K.; Ohta, K.; Botek, E.; Champagne, B. Relationships between third-order nonlinear optical properties and magnetic interactions in open-shell systems: A new paradigm for nonlinear optics. Phys. Rev. Lett. 2007, 99, 033001. [Google Scholar] [CrossRef]
  37. Nakano, M.; Yoneda, K.; Kishi, R.; Takahashi, H.; Kubo, T.; Kamada, K.; Ohta, K.; Botek, E.; Champagne, B. Remarkable two-photon absorption in open-shell singlet systems. J. Chem. Phys. 2009, 131, 114316. [Google Scholar] [CrossRef]
  38. Kubo, T.; Shimizu, A.; Sakamoto, M.; Uruichi, M.; Yakushi, K.; Nakano, M.; Shimoi, D.; Sato, K.; Takui, T.; Morita, Y.; et al. Synthesis, intermolecular interaction, and semiconductive behavior of a delocalized singlet biradical hydrocarbon. Angew. Chem. Int. Ed. 2005, 44, 6564–6568. [Google Scholar] [CrossRef]
  39. Nakano, M.; Kubo, T.; Kamada, K.; Ohta, K.; Kishi, R.; Ohta, S.; Nakagawa, N.; Takahashi, H.; Furukawa, S.; Morita, Y.; et al. Second hyperpolarizabilities of polycyclic aromatic hydrocarbons involving phenalenyl radical units. Chem. Phys. Lett. 2006, 418, 142–147. [Google Scholar] [CrossRef]
  40. Kamada, K.; Ohta, K.; Shimizu, A.; Kubo, T.; Kishi, R.; Takahashi, H.; Botek, E.; Champagne, B.; Nakano, M. Singlet diradical character from experiment. J. Phys. Chem. Lett. 2010, 1, 937–940. [Google Scholar] [CrossRef]
  41. Kamada, K.; Ohta, K.; Kubo, T.; Shimizu, A.; Morita, Y.; Nakasuji, K.; Kishi, R.; Ohta, S.; Furukawa, S.; Takahashi, H.; et al. Strong two-photon absorption of singlet diradical hydrocarbons. Angew. Chem. Int. Ed. 2007, 46, 3544–3546. [Google Scholar] [CrossRef] [PubMed]
  42. Overway, K.S.; Lytle, F.E. Fluorescence enzymatic probes suitable for two-photon excitation. Appl. Spectrosc. 1998, 52, 298–302. [Google Scholar] [CrossRef]
  43. Ogawa, K.; Ohashi, A.; Kobuke, Y.; Kamada, K.; Ohta, K. Strong Two-photon absorption of conjugated porphyrin self-assembly. J. Am. Chem. Soc. 2003, 125, 13356–13357. [Google Scholar] [CrossRef]
  44. Drobizhez, M.; Stepanenko, Y.; Dzenis, Y.; Karotki, A.; Rebane, A.; Taylor, P.N.; Anderson, H.L. Understanding strong two-photon absorption in π-conjugated porphyrin dimers via double-resonance enhancement in a three-level model. J. Am. Chem. Soc. 2004, 126, 15352–15353. [Google Scholar] [CrossRef]
  45. Anderson, R.J.M.; Holtom, G.R.; McClain, W.M. Two-photon absorptivities of the all trans α, ω-diphenylpolyenes from stilbene to diphenyloctatetraene via three wave mixing. J. Chem. Phys. 1979, 70, 4310–4315. [Google Scholar] [CrossRef]
  46. Bendikov, M.; Duong, H.M.; Starkey, K.; Houk, K.N.; Carter, E.A.; Wudl, F. Oligoacenes: Theoretical prediction of open-shell singlet diradical ground states. J. Am. Chem. Soc. 2004, 126, 7416–7417. [Google Scholar] [CrossRef]
  47. Minamide, S.; (AIST, Ikeda, Osaka, Japan and Osaka University, Toyonaka, Osaka, Japan); Ohta, K.; (AIST, Ikeda, Osaka, Japan); Nakano, M.; (Osaka University, Toyonaka, Osaka, Japan); Kamada, K.; (AIST, Ikeda, Osaka, Japan). Unpublished work. 2025.
  48. Konishi, A.; Hirao, Y.; Matsumoto, K.; Kurata, H.; Kishi, R.; Shigeta, Y.; Nakano, M.; Tokunaga, K.; Kamada, K.; Kubo, T. Synthesis and characterization of quarteranthene: Elucidating the characteristics of the edge state of graphene nanoribbons at the molecular level. J. Am. Chem. Soc. 2013, 135, 1430. [Google Scholar] [CrossRef]
  49. Sun, Z.; Zeng, Z.; Wu, J. Zethrenes, extended π-quinodimethanes, and periacenes with a singlet biradical ground state. Acc. Chem. Res. 2014, 47, 2582–2591. [Google Scholar] [CrossRef]
  50. Karotki, A.; Drobizhez, M.; Kruk, M.; Spangler, C.; Nickel, E.; Mamardashvili, N.; Rebane, A. Enhancement of two-photon absorption in tetrapyrrolic compounds. J. Opt. Soc. Am. B 2003, 20, 321–332. [Google Scholar] [CrossRef]
  51. Dy, J.; Ogawa, K.; Kamada, K.; Ohta, K.; Kobuke, Y. Stepwise elongation effect on the two-photon absorption of self-assembled butadiyne porphyrins. Chem. Commun. 2008, 3411–3413. [Google Scholar] [CrossRef] [PubMed]
  52. Morisue, M.; Ogawa, K.; Kamada, K.; Ohta, K.; Kobuke, Y. Antiparallel dimer of porphyrin–phthalocyanine tandem toward strong two-photon and three-photon absorptions. Chem. Commun. 2010, 46, 2121–2123. [Google Scholar] [CrossRef]
  53. Drobizhez, M.; Stepanenko, Y.; Rebane, A.; Wilson, C.J.; Screen, T.E.O.; Anderson, H.L. Strong cooperative enhancement of two-photon absorption in double-strand conjugated porphyrin ladder arrays. J. Am. Chem. Soc. 2006, 128, 12432–12433. [Google Scholar] [CrossRef]
  54. Ikeda, C.; Yoon, Z.S.; Park, M.; Inoue, H.; Kim, D.; Osuka, A. Helicity induction and two-photon absorbance enhancement in zinc(II) meso-meso linked porphyrin oligomers via intermolecular hydrogen bonding interactions. J. Am. Chem. Soc. 2005, 127, 534–535. [Google Scholar] [CrossRef]
  55. Ahn, T.K.; Kwon, J.H.; Kim, D.Y.; Cho, D.W.; Jeong, D.H.; Kim, S.K.; Suzuki, M.; Shimizu, S.; Osuka, A.; Kim, D. Comparative photophysics of [26]- and [28] Hexaphyrins (1.1.1.1.1.1): Large two-photon absorption cross section of aromatic [26] hexaphyrins (1.1.1.1.1.1). J. Am. Chem. Soc. 2005, 127, 12856–12861. [Google Scholar] [CrossRef]
  56. Rath, H.; Sankar, J.; PrabhuRaja, V.; Chandrashekar, T.K.; Nag, A.; Goswami, D. Core-modified expanded porphyrins with large third-order nonlinear optical response. J. Am. Chem. Soc. 2005, 127, 11608–11609. [Google Scholar] [CrossRef]
  57. Lim, J.M.; Shin, J.Y.; Tanaka, Y.; Saito, S.; Osuka, A.; Kim, D. Protonated [4n] π and [4n+2] π octaphyrins choose their Möbius/Hückel aromatic topology. J. Am. Chem. Soc. 2010, 132, 3105–3114. [Google Scholar] [CrossRef]
  58. Hiroto, S.; Furukawa, K.; Shinokubo, H.; Osuka, A. Synthesis and biradicaloid character of doubly linked corrole dimers. J. Am. Chem. Soc. 2006, 128, 12380–12381. [Google Scholar] [CrossRef]
  59. Cho, S.; Lim, J.M.; Hiroto, S.; Kim, P.; Shinokubo, H.; Osuka, A.; Kim, D. Unusual interchromophoric interactions in β,β’ directly and doubly linked corrole dimers: Prohibited electronic communication and abnormal singlet ground states. J. Am. Chem. Soc. 2009, 131, 6412–6420. [Google Scholar] [CrossRef]
  60. Ishida, M.; Shin, J.; Lim, J.M.; Lee, B.S.; Yoon, M.; Koide, T.; Sessler, J.L.; Osuka, A.; Kim, D. Neutral radical and singlet biradical forms of meso-free, -keto, and -diketo hexaphyrins (1.1.1.1.1.1): Effects on aromaticity and photophysical properties. J. Am. Chem. Soc. 2011, 133, 15533–15544. [Google Scholar] [CrossRef] [PubMed]
  61. Koide, T.; Furukawa, K.; Shinokubo, H.; Shin, J.-Y.; Kim, K.S.; Kim, D.; Osuka, A. A stable non-Kekulé singlet biradicaloid from meso-free 5,10,20,25-tetrakis (pentafluorophenyl)-substituted [26] hexaphyrin (1.1.1.1.1.1). J. Am. Chem. Soc. 2010, 132, 7246–7247. [Google Scholar] [CrossRef] [PubMed]
  62. Kamada, K.; Fuku-en, S.; Minamide, S.; Ohta, K.; Kishi, R.; Nakano, M.; Matsuzaki, H.; Okamoto, H.; Higashikawa, H.; Inoue, K.; et al. Impact of diradical character on two-photon absorption: Bis(acridine) dimers synthesized from an allenic precursor. J. Am. Chem. Soc. 2013, 135, 232–241. [Google Scholar] [CrossRef] [PubMed]
  63. Montgomery, L.W.; Huffman, J.C.; Jurczak, E.A.; Grendze, M.P. The molecular structures of Thiele’s and Chichibabin’s hydrocarbons. J. Am. Chem. Soc. 1986, 108, 6004–6011. [Google Scholar] [CrossRef]
  64. Cho, N.; Zhou, G.; Kamada, K.; Kim, R.H.; Ohta, K.; Jin, S.-H.; Müllen, K.; Lee, K.-S. The impact of charge defect and resonance enhancement on the two-photon absorption cross section of ladder-type pentaphenylene and spirofluorene derivatives. J. Mater. Chem. 2012, 22, 185–191. [Google Scholar] [CrossRef]
  65. Fabian, J.; Zahradník, R. The search for highly colored organic compounds. Angew. Chem. Int. Ed. Engl. 1989, 28, 677–694. [Google Scholar] [CrossRef]
  66. Maeda, T.; Oka, T.; Sakamaki, D.; Fujiwara, H.; Suzuki, N.; Yagi, S.; Konishi, T.; Kamada, K. Unveiling a new aspect of oxocarbons: Open-shell character of 4- and 5-membered oxocarbon derivatives showing near-infrared absorption. Chem. Sci. 2023, 14, 1978. [Google Scholar] [CrossRef]
  67. Yamaguchi, K. Self-Consistent Field: Theory and Applications; Carbo, R., Klobukowski, M., Eds.; Elsevier: Amsterdam, The Netherlands, 1990; p. 727. [Google Scholar]
  68. Kishida, H.; Hibino, K.; Nakamura, A.; Kato, D.; Abe, J. Third-order nonlinear optical properties of a π-conjugated biradical molecule investigated by third-harmonic generation spectroscopy. Thin Solid Films 2010, 519, 1028–1030. [Google Scholar] [CrossRef]
  69. Beerepoot, M.T.; Friese, D.H.; List, N.H.; Kongsted, J.; Ruud, K. Benchmarking two-photon absorption cross sections: Performance of CC2 and CAM-B3LYP. Phys. Chem. Chem. Phys. 2015, 17, 19306–19314. [Google Scholar] [CrossRef]
Figure 1. Induction of polarization by the applied electric field.
Chemistry 07 00067 g001
Figure 3. Typical transverse intensity profile of laser beam (a). Induced distribution of refractive index of NLO media with positive (b) and negative (c) nonlinear refractive index. Change in divergence of laser beam propagating through the media: self-focusing (d) and self-defocusing (e). The gray color in the illustrations represents the change in the refractive index: the refractive index is high for the dark color and low for the light color.
Chemistry 07 00067 g003
Figure 4. Schematics for absorption process in macroscopic (a) and microscopic (b) pictures.
Chemistry 07 00067 g004
Figure 5. Optical geometries of degenerate four-wave mixing (DFWM). Two-beam configuration (a), two three-beam configurations (forwarded box-CARS (b) and counter-propagating (or phase-conjugate) (c)).
Chemistry 07 00067 g005
Figure 6. Optical geometries of optical Kerr effect (OKE).
Chemistry 07 00067 g006
Figure 7. Optical geometries of the intensity-dependent transmittance measurement (a) and the open-aperture Z-scan (b).
Chemistry 07 00067 g007
Figure 8. Optical geometries of the closed-aperture z-scan (top) and the closed-aperture traces for n2 > 0 (bottom left) and n2 < 0 (bottom right). The sample is located (a) before, (b) at, and (c) after the focal point of the laser beam along its propagation direction.
Chemistry 07 00067 g008
Figure 9. Influence of the spatial and temporal distribution of the laser pulse on the relation between normalized transmittance T N and the on-axis two-photon absorbance at the focal point q 0 .
Chemistry 07 00067 g009
Figure 10. Schematic diagram of an experimental setup for the open-aperture Z-scan.
Chemistry 07 00067 g010
Figure 11. An example of common-mode noise reduction in the recorded data of the open-aperture Z-scan. (Left): Unprocessed signals from the detectors (PD0, PD1: see Figure 10). (Right): Fluctuation-corrected open-aperture trace calculated from the same data as PD1/PD0.
Chemistry 07 00067 g011
Figure 12. (Left): Typical open-aperture traces by varying the incident power (symbols) together with theoretical curve fits based on Equation (56) (solid line). (Right): Plot of the two-photon absorbance q 0 obtained from the curve fit against the incident power.
Chemistry 07 00067 g012
Figure 13. Conceptual illustration of the three axes of TPA enhancement. The third axis of intermediate diradical character adds another dimension to the plane of the conventional axes of π-conjugation extension and D/A substitution.
Chemistry 07 00067 g013
Figure 14. Spin delocalization in a phenalenyl ring.
Chemistry 07 00067 g014
Figure 15. Stable diradicaloid molecules: IDPLs and NDPL.
Chemistry 07 00067 g015
Figure 16. Normalized one-photon absorption spectra of bis(phenalenyl)-based diradicaloid compounds, IDPL (tBu- and Ph-), and NDPL in chloroform. Reprinted with permission from Ref. [41]. Copyright © 2007 WILEY-VCH Verlag GmbH & Co. KGaA, Weinheim.
Chemistry 07 00067 g016
Figure 17. (Left column): Open-aperture Z-scan traces at different incident powers of tBu-IPDL (left top) and Ph-IDPL (left bottom) in chloroform at 1450 and 1425 nm, respectively. The dots are experimental data, and the gray lines are fitting curves. The power increases as indicated by the arrow. (Right column): power-dependence of the two-photon absorbance q0 at different wavelengths for tBu-IDPL (right top) and Ph-IDPL (right bottom). Reproduced with permission from Ref. [41] with modification. Copyright © 2007 WILEY-VCH Verlag GmbH & Co. KGaA, Weinheim.
Chemistry 07 00067 g017
Figure 18. (Left): Open-aperture Z-scan traces showing TPA (dip) and saturable absorption (bump) depending on the incident powers (increasing in the direction of the arrow) observed at 960 nm for Ph-IDPL. (Right): Plot of the two-photon absorbance q 0 of Ph-IDPL versus the incident power at different wavelengths, including the fitting data in the left panel. Reproduced with permission from Ref. [41] with modification. Copyright © 2007 WILEY-VCH Verlag GmbH & Co. KGaA, Weinheim.
Chemistry 07 00067 g018
Figure 19. Open-aperture Z-scan traces of NDPL solution in chloroform at 1055 nm. With increasing incident power (toward the direction of the arrow), a Λ-shaped trace (bump), where the response is dominated by saturable absorption SA, changes to an M-shaped trace, where both SA and TPA contribute to the response. The dots are the experimental data, and the gray lines are the theoretical fits considering both processes. Reproduced with permission from Ref. [41] with modification. Copyright © 2007 WILEY-VCH Verlag GmbH & Co. KGaA, Weinheim.
Chemistry 07 00067 g019
Figure 20. Two-photon absorption spectra of tBu-IDPL (circles), Ph-IDPL (triangles) (left), and NDPL (squares) (right). Reprinted with permission from Ref. [41] (left). Copyright © 2007 WILEY-VCH Verlag GmbH & Co. KGaA, Weinheim. Reproduced with permission from Ref. [40] (right). Copyright © 2010, American Chemical Society.
Chemistry 07 00067 g020
Figure 21. Structure of oligoacene and possible resonance structures.
Chemistry 07 00067 g021
Figure 22. Two-photon absorption spectrum of rubrene in dichloromethane and its structure.
Chemistry 07 00067 g022
Figure 23. Two-photon absorption spectrum of TIPS-pentacene in tetrahydrofuran and its structure. Reprinted with permission from Ref. [41]. Copyright © 2007 WILEY-VCH Verlag GmbH & Co. KGaA, Weinheim.
Chemistry 07 00067 g023
Figure 24. Resonance structure of anthenes.
Chemistry 07 00067 g024
Figure 25. TPA spectrum of zethrene in dichloromethane and its structure.
Chemistry 07 00067 g025
Figure 26. Singlet diradical porphyrinoids.
Chemistry 07 00067 g026
Figure 27. Resonance structure of tetracation, diradicaloid bis(acridine) dimer.
Chemistry 07 00067 g027
Figure 28. Chichibabin’s hydrocarbon.
Chemistry 07 00067 g028
Figure 29. Three bis(acridine) dimers that differ in their oxidation states.
Chemistry 07 00067 g029
Figure 30. Open-aperture Z-scan traces (symbols) of the solutions of (a) tetracation, (b) trication, and (c) dication dimers in dichloromethane at 1260 nm with their theoretical fits (solid curve). The focal point was at z = 61 mm. Reprinted with permission from Ref. [62] with modification. Copyright © 2012 American Chemical Society.
Chemistry 07 00067 g030
Figure 31. (a) Neutral oxocarbons (CO)n and (b) conjugated acids of oxocarbon dianions (CO)n2−. Resonance structures of zwitterionic, mesomeric, and non-Kekulé forms of π-conjugation extended (c) croconaine and (d) squaraine dyes. The diradical structures are shown in red.
Chemistry 07 00067 g031
Figure 32. TPA spectra (symbols with line, left and bottom axes) and OPA spectrum (dashed line, right and top axes) of thiopyrylium croconaine (left) and squaraine (right) dyes in chloroform measured by the open-aperture Z-scan method. Reproduced with permission from Ref. [66] with modification. Copyright © 2023 Royal Society of Chemistry.
Chemistry 07 00067 g032
Figure 33. Energy level diagram of the states involved in Equation (70).
Chemistry 07 00067 g033
Figure 34. Correlation of the y value from the experimental data with Equation (70) with that from the theoretical calculation. The red line is an eye guide showing the correlation. Reproduced with permission from ESI of Ref. [66] with modification. Copyright © 2023 Royal Society of Chemistry.
Chemistry 07 00067 g034
Table 1. Units of absorption coefficients and cross-sections of n-photon absorption processes.
n α n , Macroscopic
n-Photon Absorption Coefficient
σ n , Microscopic
n-Photon Absorption Cross-section
SI cgsSI cgs
1102 m−1=1 cm−1=1 cm−110−2 cm2=1 cm2
210−2 m W−1=1 cm W−1=10−7 cm sec erg−110−8 cm4 s=1 cm4 s *
310−6 m3 W−2=1 cm3 W−2=10−14 cm3 sec2 erg−210−12 cm6 s2=1 cm6 s2 *
* Often written as “cm4 s photon−1 molecule−1” and “cm6 s2 photon−2 molecule−1” to emphasize that the quantity is per photon per molecule.
Table 2. Common measurement techniques of the degenerate third-order NLO process.
Measurement TechniqueThird-Order Susceptibility
Degenerate Four-Wave Mixing (DFWM)Abs, Re/Im (OHD)
Optical Kerr Effect (OKE)Abs, Re/Im (OHD, DOKE)
Intensity-Dependent Transmittance Measurement (IDTM)Re
Z-scanRe (CA), Im (OA)
Two-Photon Induced Fluorescence (TPIF)Im
Abs: absolute value of the complex susceptibility, Re: real part, Im: imaginary part, OHD: optically heterodyne detection, DOKE: differential OKE, CA: closed-aperture configuration, OA: open-aperture configuration.
Table 3. Equations for transmittance by TPA ( T T P A ) and on-axis intensity at the focal point I 00 for different spatial/temporal intensity distributions of incident laser light.
Distribution * T T P A ** I 00 ***
uniform/CW 1 1 + q 0 P π w 0 2   1.000
Gaus/CW ln 1 + q 0 q 0 2 P π w 0 2   2.000
uniform/Gaus 1 π exp t 2 1 + q 0 exp t 2 d t 2 ln 2   P π 3 / 2   w 0 2   t F W H M   0.939
Gaus/Gaus 1 π   q 0 ln 1 + q 0 exp t 2 d t 4 ln 2   P π 3 / 2   w 0 2   t F W H M   f r   1.879
* Space/Time. CW: continuous wave, Gaus: Gaussian profile (spatial or temporal). ** The total transmittance is obtained by T = T L T T P A , where T L = exp A is the linear transmittance. *** w 0 is taken for the e 2 -radius for Gaussian spatial distribution. The numbers in ( ) are the relative magnitude to the same P .
Disclaimer/Publisher’s Note: The statements, opinions and data contained in all publications are solely those of the individual author(s) and contributor(s) and not of MDPI and/or the editor(s). MDPI and/or the editor(s) disclaim responsibility for any injury to people or property resulting from any ideas, methods, instructions or products referred to in the content.