Article

Isolation and Characterisation of Two New Lactones from the Atacama Desert-Derived Fungus Chrysosporium merdarium

by
Ahlam Haj Hasan
1,2,†,
Gagan Preet
1,†,
Rishi Vachaspathy Astakala
1,
Meshari Al-Furayh
1,3,
Emmanuel Tope Oluwabusola
1,
Rainer Ebel
1 and
Marcel Jaspars
1,*
1
Marine Biodiscovery Centre, Department of Chemistry, University of Aberdeen, Aberdeen AB24 3UE, UK
2
The Medicinal Chemistry and Pharmacognosy Department, Faculty of Pharmacy, Jordan University of Science and Technology, Irbid 22110, Jordan
3
The School of Pharmacy, King Saud University, Riyadh 11451, Saudi Arabia
*
Author to whom correspondence should be addressed.
These authors contributed equally to this work.
Chemistry 2025, 7(3), 101; https://doi.org/10.3390/chemistry7030101
Submission received: 6 May 2025 / Revised: 16 June 2025 / Accepted: 17 June 2025 / Published: 19 June 2025
(This article belongs to the Section Biological and Natural Products)

Abstract

:
The Atacama Desert, an unexplored habitat, offers intriguing potential for natural product chemistry due to the unique adaptations of microorganisms to aridity, extreme salinity, and high UV radiation. Over several years, soil samples were collected from various locations across the desert, leading to the isolation of diverse microorganisms. This paper presents the isolation and structural characterisation of two new 10-membered lactones, curvulalide B and C (3 and 4). These compounds are epimers of each other and are produced by one of the fungi isolated from the samples collected, using LC–MS and 1D and 2D NMR techniques. The compounds were tested against the ESKAPE pathogens, bovine mastitis pathogens, and Cryptococcus neoformans but were inactive against them.

1. Introduction

The bioactivity and variety of chemical scaffolds found in microbial natural products are well documented. As a result, they have drawn attention since many of them have industrial, medicinal, and agricultural significance [1]. The Atacama Desert, the oldest and driest desert in the world, has been the subject of most of the research on microorganisms in deserts [2,3]. The Atacama Desert, situated on the Pacific coast of Chile and Peru, includes arid and hyper-arid areas, which are known for their high salinity level, low levels of organic carbon, high levels of UV radiation, extreme temperature variations, and high solar radiation. Despite these characteristics, the Atacama Desert harbours great microbial taxonomic diversity with a gradient increase from the south to the north [4,5,6]. The Atacama Desert is considered a rich source of novel actinomycetes, including Streptomycetes, which produce new bioactive secondary metabolites. Numerous bioactive natural compounds have been identified from microorganisms found in the Atacama Desert [7]. Among them is Mutactimycin AP (1), an anthracycline antibiotic isolated from a Saccharothrix sp. recovered from the hyper-arid region of the Atacama Desert (shown in Figure 1). Mutactimycin AP (1) displayed activity against Methicillin-resistant Staphylococcus aureus and bovine mastitis-causing pathogens, including Enterococcus pseudoavium and Staphylococcus aureus subsp. Aureus [8]. In addition, Abenquine A (2), a compound incorporating a rare combination of structural moieties, a benzoquinone and an amino acid, was isolated from a Streptomyces strain and showed moderate inhibitory activity against phosphodiesterase type 4b (PDE4b) and poor inhibitory activity against B. subtilis and the following dermatophytic fungi: T. rubrum, T. mentagrophytes, and M. canis [9].
This paper reports the isolation and structural characterisation of two new inseparable compounds, 3 and 4 (named curvulalide B and C, respectively) from Chrysosporium merdarium, a fungal strain isolated from the Atacama Desert and cultivated on rice (shown in Figure 2). Curvulalides B and C are epimers and new analogues of the known natural product, curvulalide (5), a macrolide isolated from the sea fan-derived fungus Curvularia sp. PSU F22 [10]. Curvulalide shows no antimicrobial activity against both methicillin-resistant and susceptible Staphylococcus aureus and Microsporum gypseum. This paper also reports the isolation and structural elucidation of a known compound modiolide A (6), which is also a 10-membered lactone isolated from the same fungus (shown in Figure 2). Modiolide A was first isolated from a marine-derived fungal strain, Paraphaeosphaeria sp. (N-119) [11]. The mixture of compounds 3 and 4 was tested against the ESKAPE pathogens, the leading cause of nosocomial infections worldwide, which contribute to an increase in morbidity and mortality rates and an increase in the cost of treatment. It was also tested against a panel of pathogens related to bovine mastitis, a worldwide disease affecting dairy cattle health and milk production and causing significant economic losses in the dairy industry. According to recent estimates, the European Union suffers an annual economic loss of EUR 2 billion because of bovine mastitis and the same figures were estimated in the United States [12]. In addition, it was tested against the fungus Cryptococcus neoformans, which causes cryptococcosis infection that commonly affects immunocompromised patients [13]. Modiolide A (6) was tested against the ESKAPE pathogens alone.

2. Materials and Methods

2.1. Isolation and Identification of the Fungus

The Chrysosporium merdarium fungus was isolated from the Atacama Desert soil sample, which was recovered from high altitude and hyper-arid region as previously described [14]. The fungus was sent to NCIMB (Aberdeen, UK) for identification; however, the MicroSeq database did not provide a high enough species-level match. Therefore, the non-validated EMBL public database was used for similarity checks, which showed that Chrysosporium merdarium is the top-matched species.

2.2. Cultivation of the Fungus and Isolation of the Compounds

The Chrysosporium merdarium fungus was cultured at room temperature for 4 weeks on two flasks containing 100 g of rice autoclaved at 121 °C for 20 min with 100 mL of milli-Q water. The fungal culture was extracted three times per flask with 200 mL of methanol, followed by two extractions with 200 mL of ethyl acetate. The combined extracts were dried under vacuum, redissolved in methanol, and purified via flash chromatography using a Buchi Reveleris X2 system (Suffolk, UK) with a C-18 column (80 g, 50 μm spherical, 3.5 cm diameter, and 21 cm length, pore size 92–108 Å). A water–methanol gradient (95:5 H2O/MeOH isocratic elution for 25 min, a 30 min gradient, 10 min isocratic at 50% MeOH, a 30 min linear gradient to 100% MeOH, and 35 min at 100% MeOH, all at 10 mL/min flow rate) yielded four fractions, with the fourth undergoing semi-preparative HPLC (a linear gradient starting from 98:2 H2O/MeOH to 100% MeOH for 60 min at 2 mL min−1) on an Agilent 1100 system (Cheshire, UK), yielding 3.5 mg of the mixture.

2.3. Identification and Characterisation of the Compounds

MS spectra of compounds 3 and 4 were acquired on a Thermo Scientific Orbitrap IQ-X MS (Frankfurt, Germany) connected to the Thermo Instruments UPLC system (Frankfurt, Germany) via electrospray ionisation. The Orbitrap was operated under the following conditions: capillary temperature 275 °C, auxiliary gas flow 10 Arb, sheath gas flow 50 Arb, sweep gas 1 (Arb), ion transfer tube 275 °C, vaporiser 350 °C, and spray voltage +3.5 kV, with lock mass correction set to RunStart EASY-IC. Full MS scans were collected over m/z 150–2000 at 60,000 resolution (RF Lens 35%, AGC target 4.0 × 10⁵, Auto max IT) in centroid mode with data-dependent acquisition (Top Speed). Assisted CID (Collision Induced Dissociation) fragmentation was performed at 15, 30, and 45% collision energy (10 ms activation) at 30,000 resolution. Raw data were processed using Thermo Xcalibur software for peak integration and compound identification.
A stationary column of the LC system consists of a diode array detector (DAD) with a variable wavelength detection range of 200–800 nm, an analytical Kinetex 2.6 µm EVO C18 column (Frankfurt, Germany) (100 Å, 100 × 2.1 mm), and a mobile phase gradient of 0.1% formic acid in LC–MS grade H2O/acetonitrile from 5% to 95% in 13 min, and isocratic elution at 95% for 5 min at a flow rate of 300 µL/min with MS acquisition for 17 min was employed in the UPLC and MS system.
LC–MS analyses for modiolide A (6) were performed on an Agilent 1290 Infinity UHPLC system (Edinburgh, UK) fitted with a Phenomenex Kinetex XB-C18 column (Macclesfield, UK) (100 × 2.1 mm2, 2.6 µm). Chromatographic separation was achieved using a binary gradient from 5% acetonitrile/0.1% formic acid/95% water to 100% acetonitrile/0.1% formic acid over a 15 min run, with a brief re-equilibration at initial conditions before each injection. The column compartment was maintained at 30 °C, and a 10 µL aliquot of each sample was introduced by autosampler. Mass spectrometric detection was carried out on a Bruker MaXis Q-TOF II (Coventry, UK) in positive mode, employing a 4.5 kV capillary voltage, 4 bar nebuliser pressure, 9 L min−1 dry gas flow at 220 °C, and daily mass calibration to ensure ≤4 ppm accuracy. Auto MS/MS acquisition used a stepped collision energy ramp from 80% to 200% to generate high-resolution fragmentation spectra.
NMR data were obtained at 25 °C using Bruker Avance III HD 400 MHz (Coventry, UK) operating with a double-resonance broadband multinuclear SmartProbe and the Bruker Avance III HD 600 MHz equipped with a highly sensitive cooled Prodigy cryoprobe.

2.4. Antimicrobial Assay

The antimicrobial activity of the mixture of compounds 3 and 4 was assessed against a panel of clinically relevant ESKAPE pathogens—Enterococcus faecium (DSM 17050), Staphylococcus aureus (DSM 2569), Klebsiella pneumoniae (DSM 681), Acinetobacter baumannii (DSM 30008), Pseudomonas aeruginosa (DSM 1117), and Enterobacter cloacae subsp. cloacae (DSM 30054)—all obtained from the DSMZ-German Collection of Microorganisms and Cell Cultures GmbH (Braunschweig, Germany). Test strains were grown to mid-log phase in Mueller–Hinton broth, adjusted to 0.5 McFarland turbidity, and swabbed uniformly onto agar plates. The compounds were dissolved in dimethyl sulphoxide (DMSO), ThermoFisher Scientific Ltd. (Cambridge, UK), at a concentration of 100 µg mL−1. Sterile 6 mm paper disks were loaded with the compound mixture and placed alongside a 10 μg gentamicin disc (ThermoFisher Scientific Ltd., Cambridge, UK) as the positive control and DMSO solvent as the negative control. Plates were then incubated at 37 °C for 18 h, and zones of inhibition were measured to evaluate antibacterial efficacy using the previously described disc diffusion method [15,16]. Modiolide A (6) was also tested against the ESKAPE pathogens at a concentration of 100 µg mL− 1 using the same method as mentioned above.
The antimicrobial activity of the mixture of compounds 3 and 4 was assessed against a panel of bacterial pathogens commonly implicated in bovine mastitis—Enterococcus pseudoavium (NCIMB 13084), Escherichia coli (NCIMB 701266), Klebsiella oxytoca (NCIMB 701361), Staphylococcus aureus subsp. aureus (NCIMB 701494), and Streptococcus bovis (NCIMB 702087)—all sourced from NCIMB Ltd., Aberdeen, UK and evaluated using the previously described disc diffusion method [15].
The antifungal activity of the mixture of compounds 3 and 4 was tested against Cryptococcus neoformans using the disc diffusion method as mentioned above, and a 25 μg fluconazole disc, ThermoFisher Scientific Ltd., Cambridge, UK, was used as the positive control.

3. Results

The fungus Chrysosporium merdarium was cultured on rice, dried, ground, and exhaustively extracted three times with methanol and ethyl acetate, yielding 3.5 g of crude extract. The 3.5 g extract was subjected to reverse-phase flash chromatography using a step gradient of water–MeOH, yielding four fractions. Fraction 4 (400 mg), in order of polarity, was subjected to reverse-phase HPLC on a C18 column with a water–methanol gradient, resulting in 3.5 mg of a mixture of compounds 3 and 4 and 4.0 mg of compound 6. High-resolution ESI Orbitrap MS gave an [M + H]+ ion at m/z 214.1073 for compounds 3 and 4, with a predicted formula C10H16O4N (Δ 0.35 ppm) (shown in Figure 3).
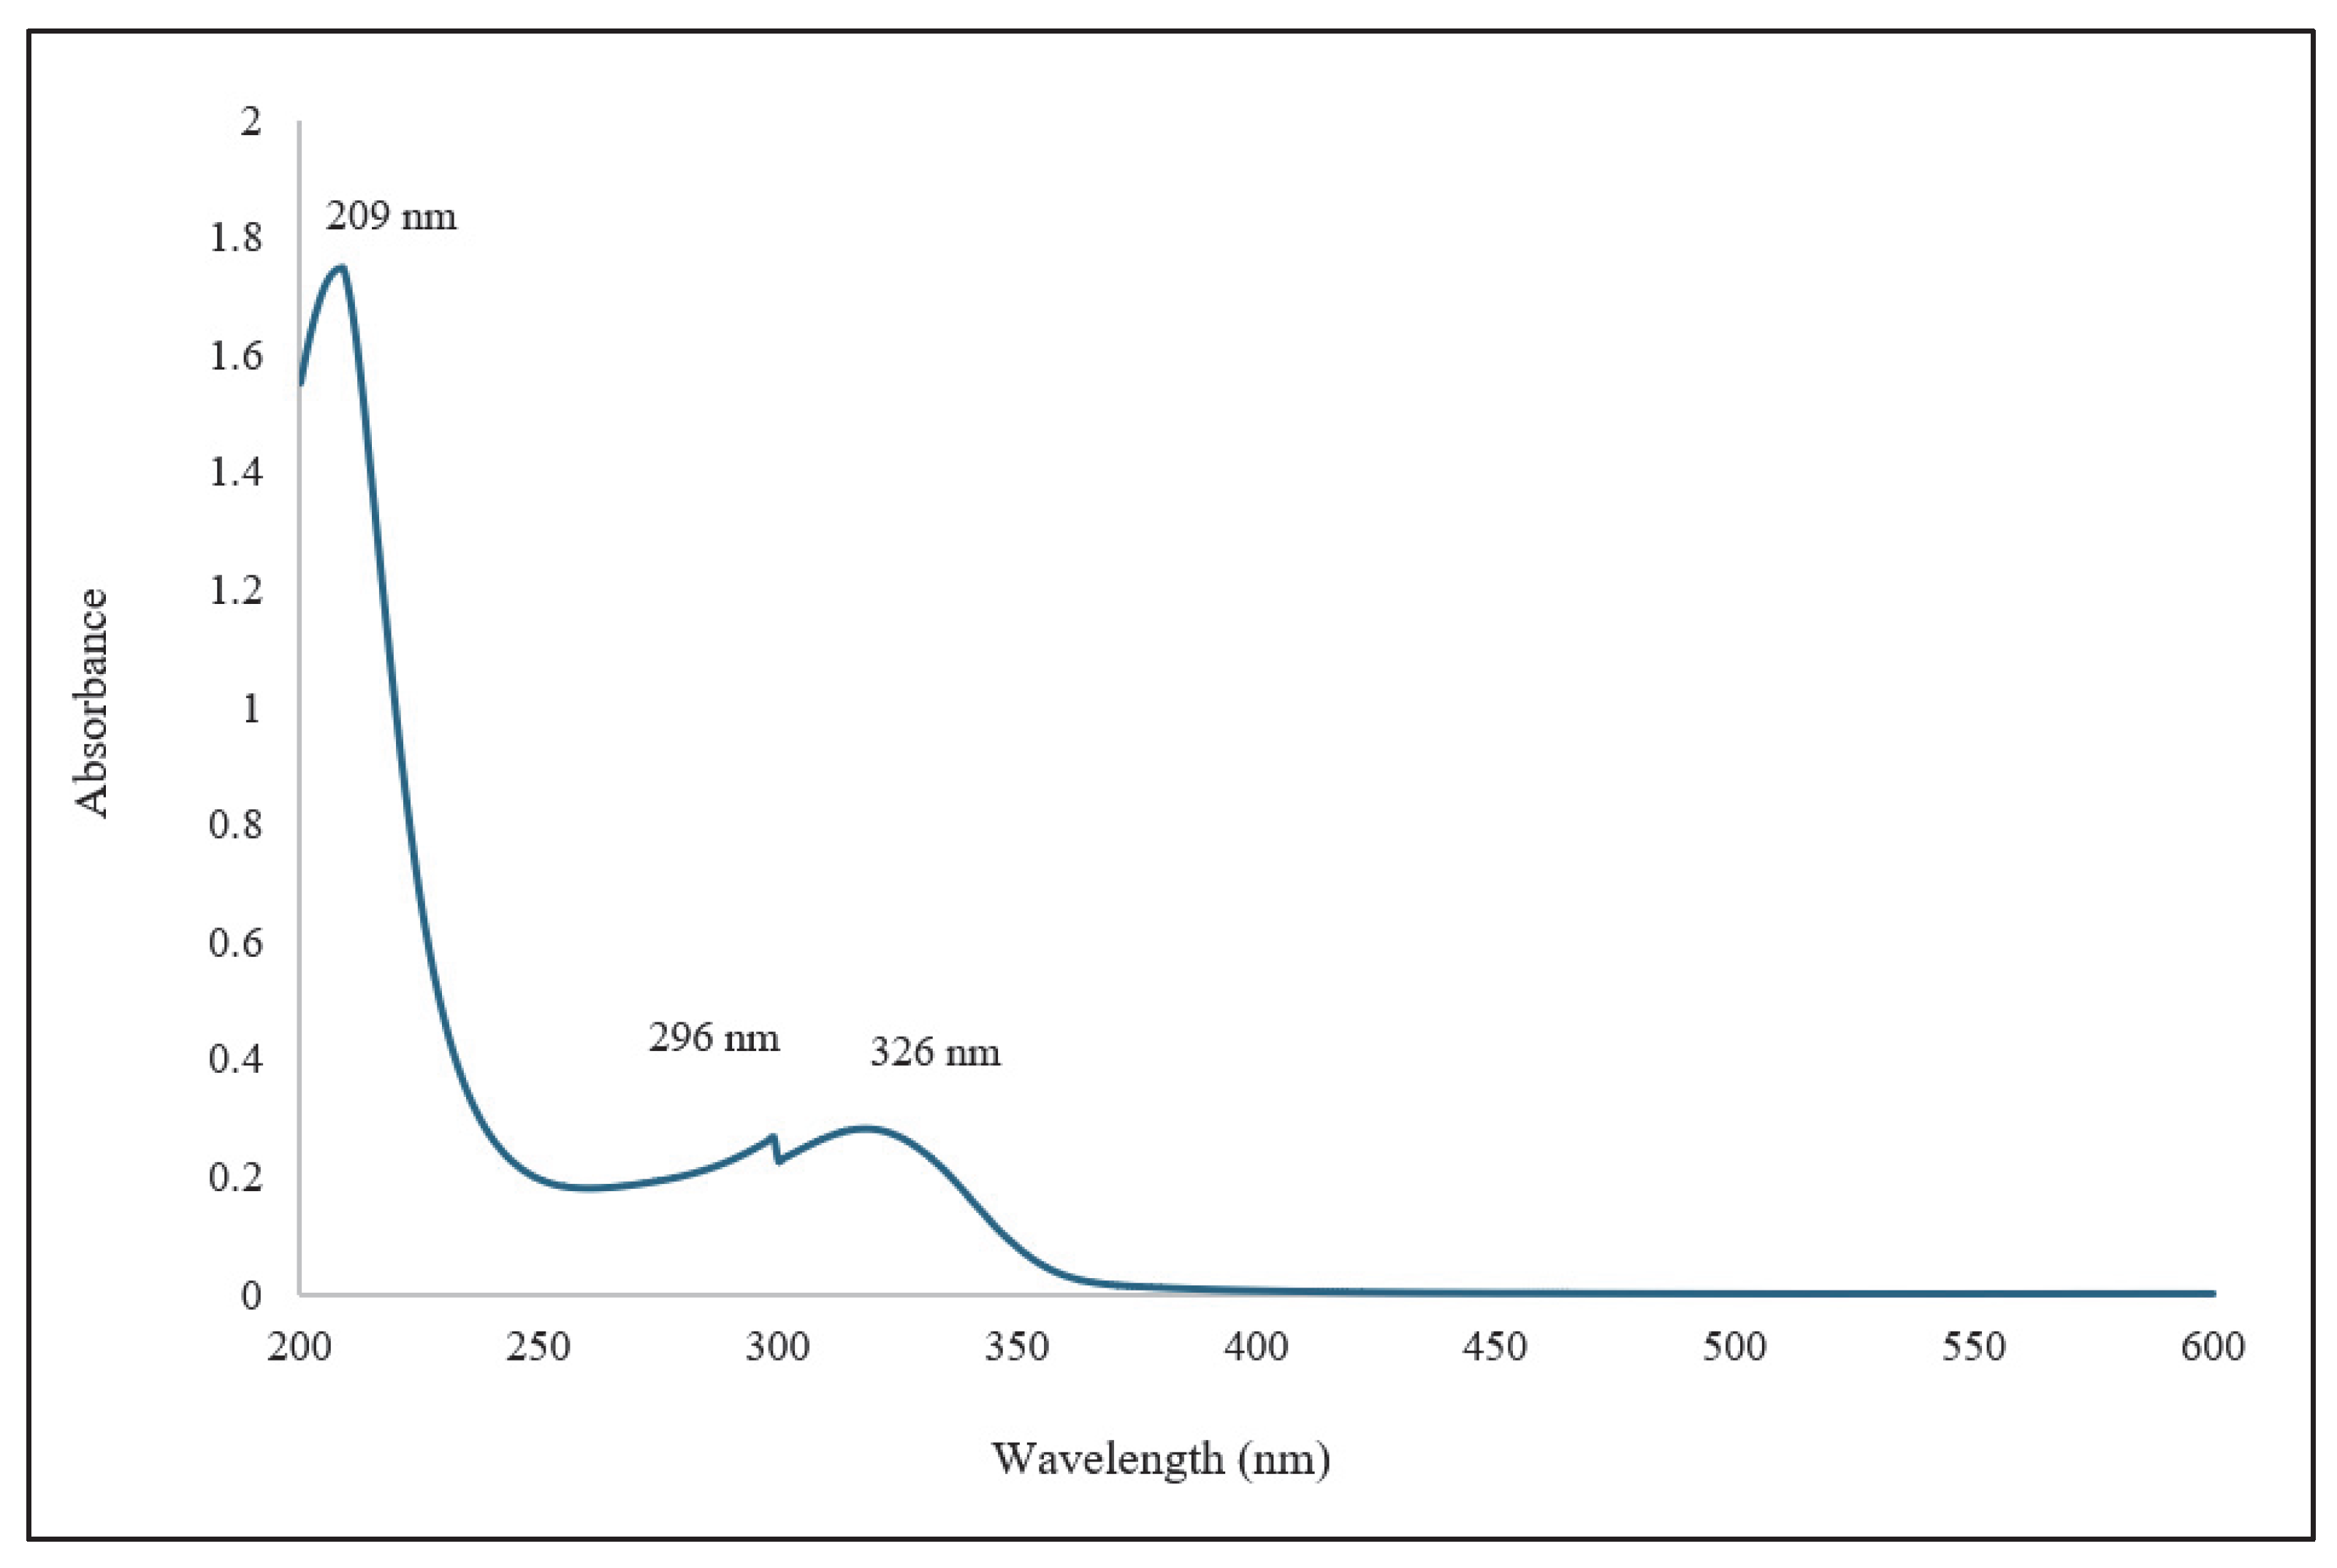
The UV–Vis spectrum of the mixture showed maxima at 209, 296, and 326 nm, where the former maximum indicates a π→π * and the latter maxima n→π * transitions, respectively. This confirms the α, β-unsaturated ester chromophore with extended conjugation (shown in Figure 4).
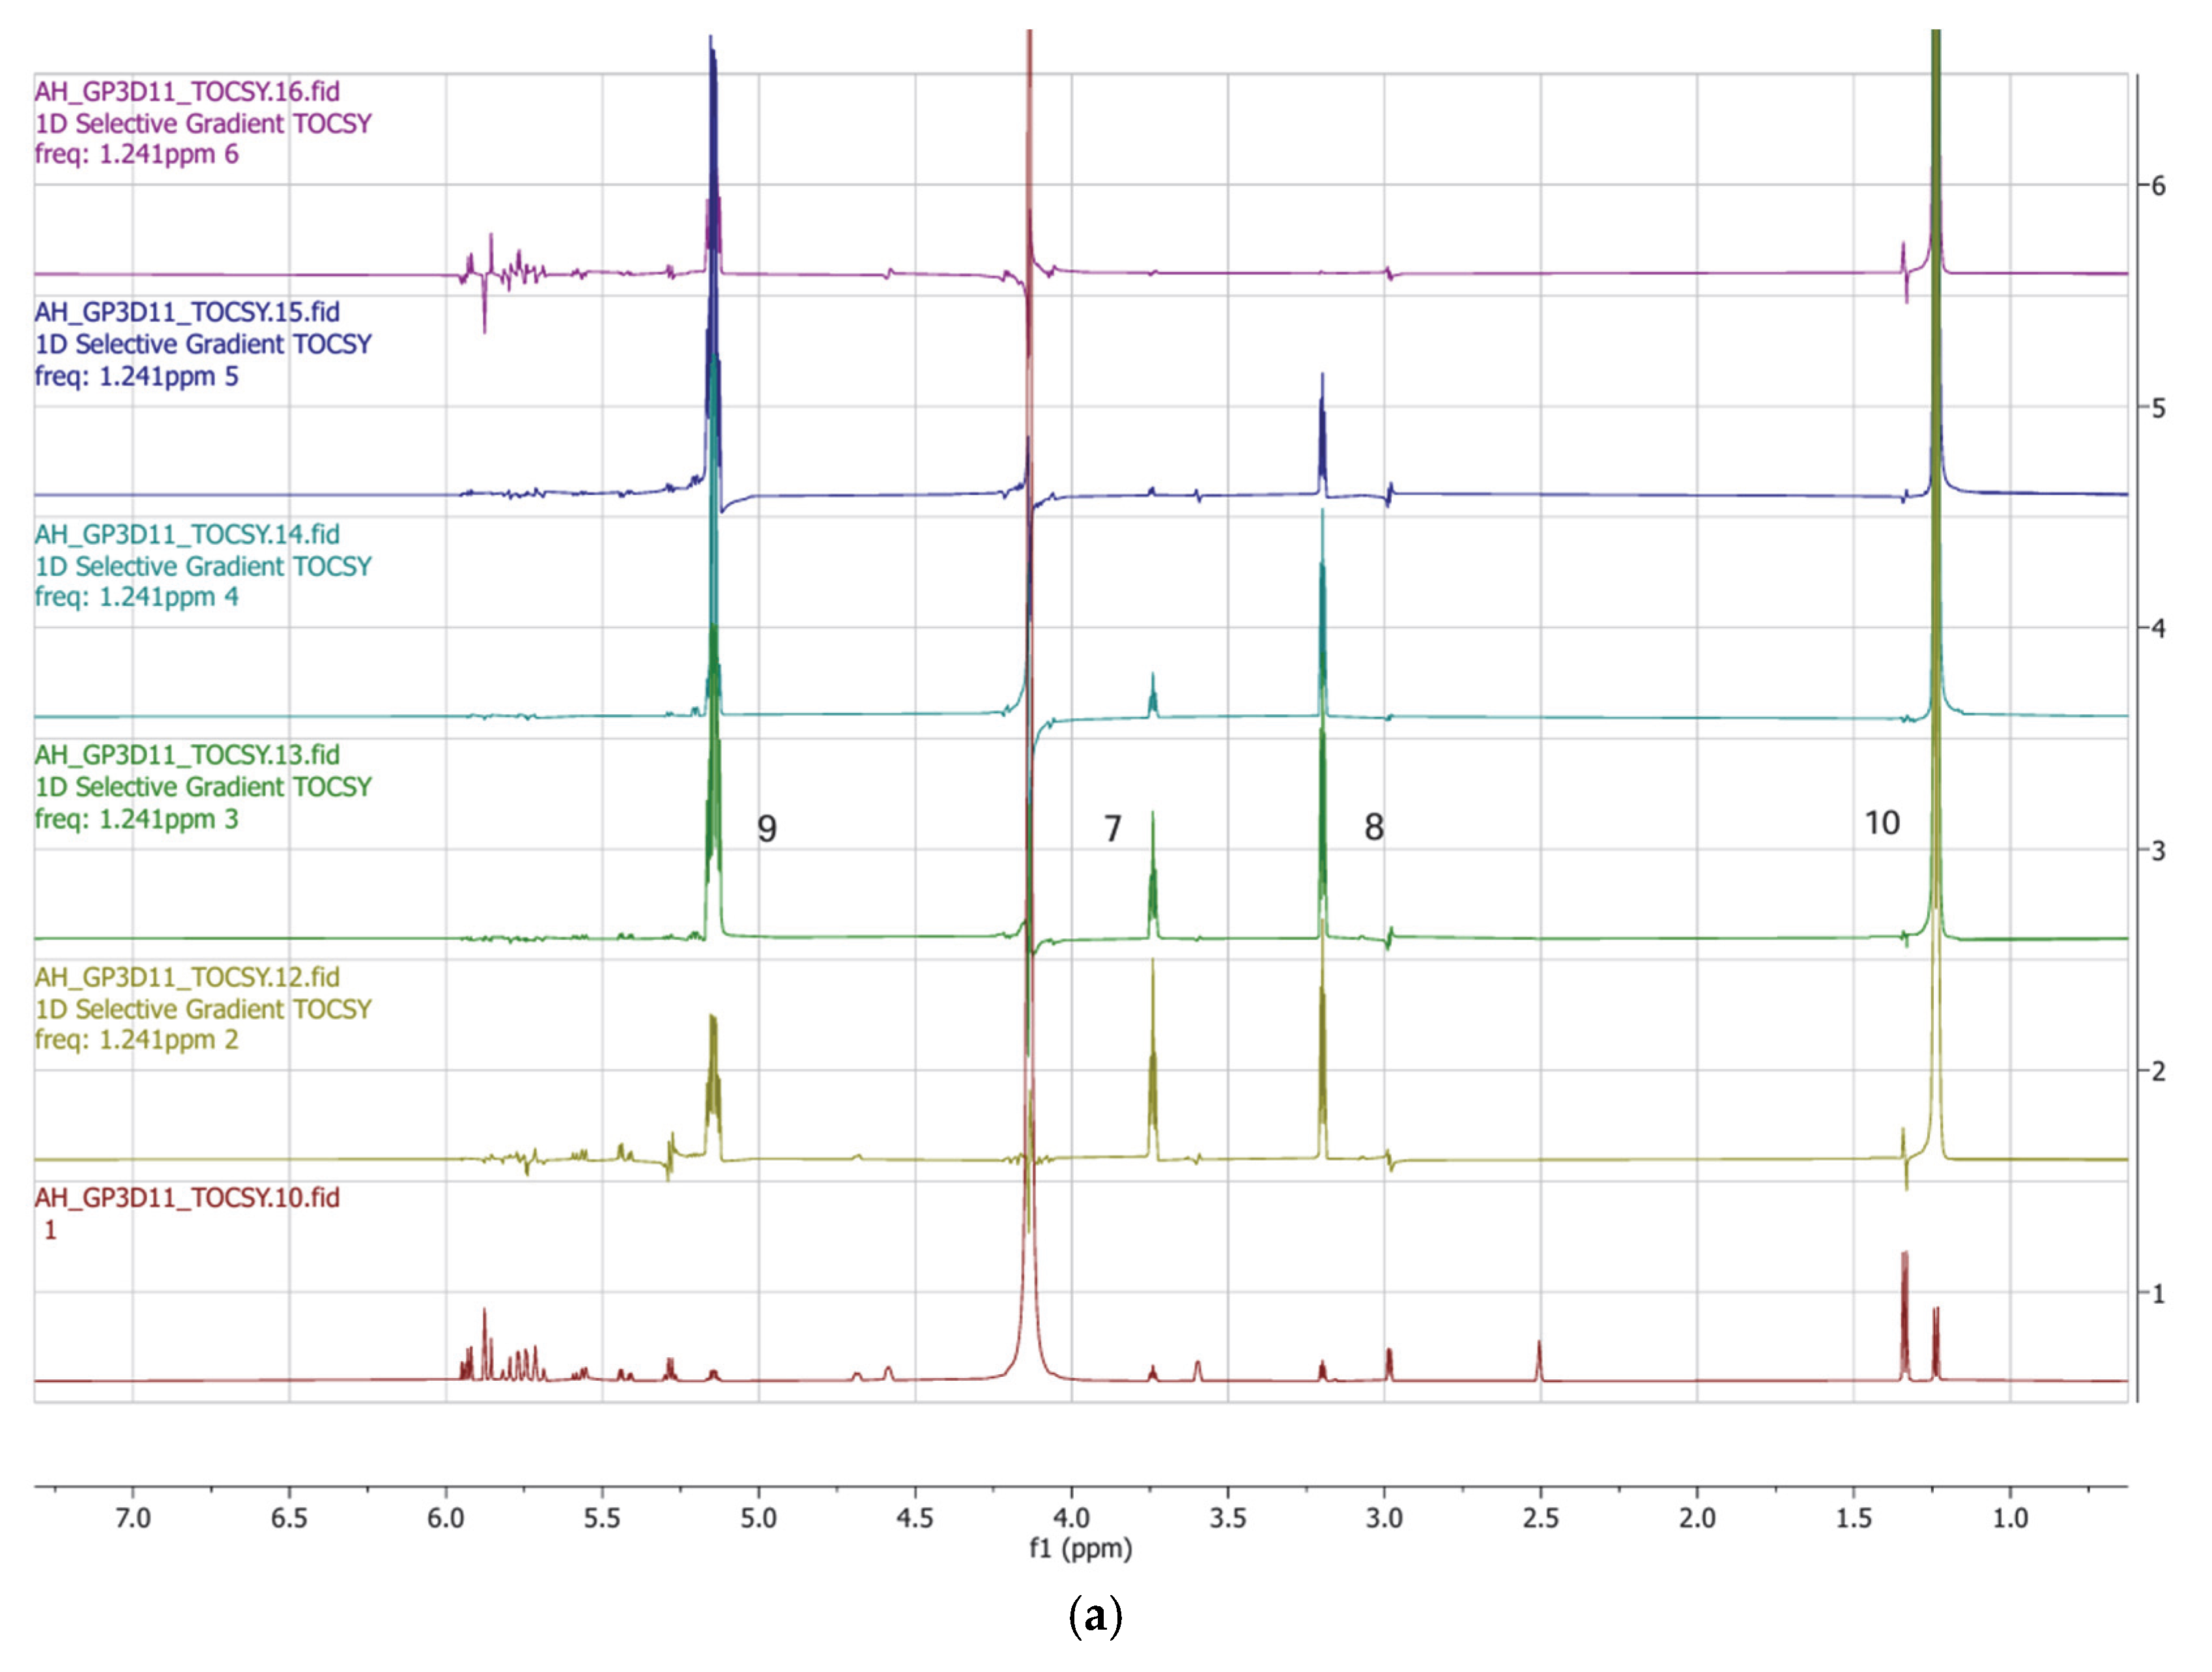
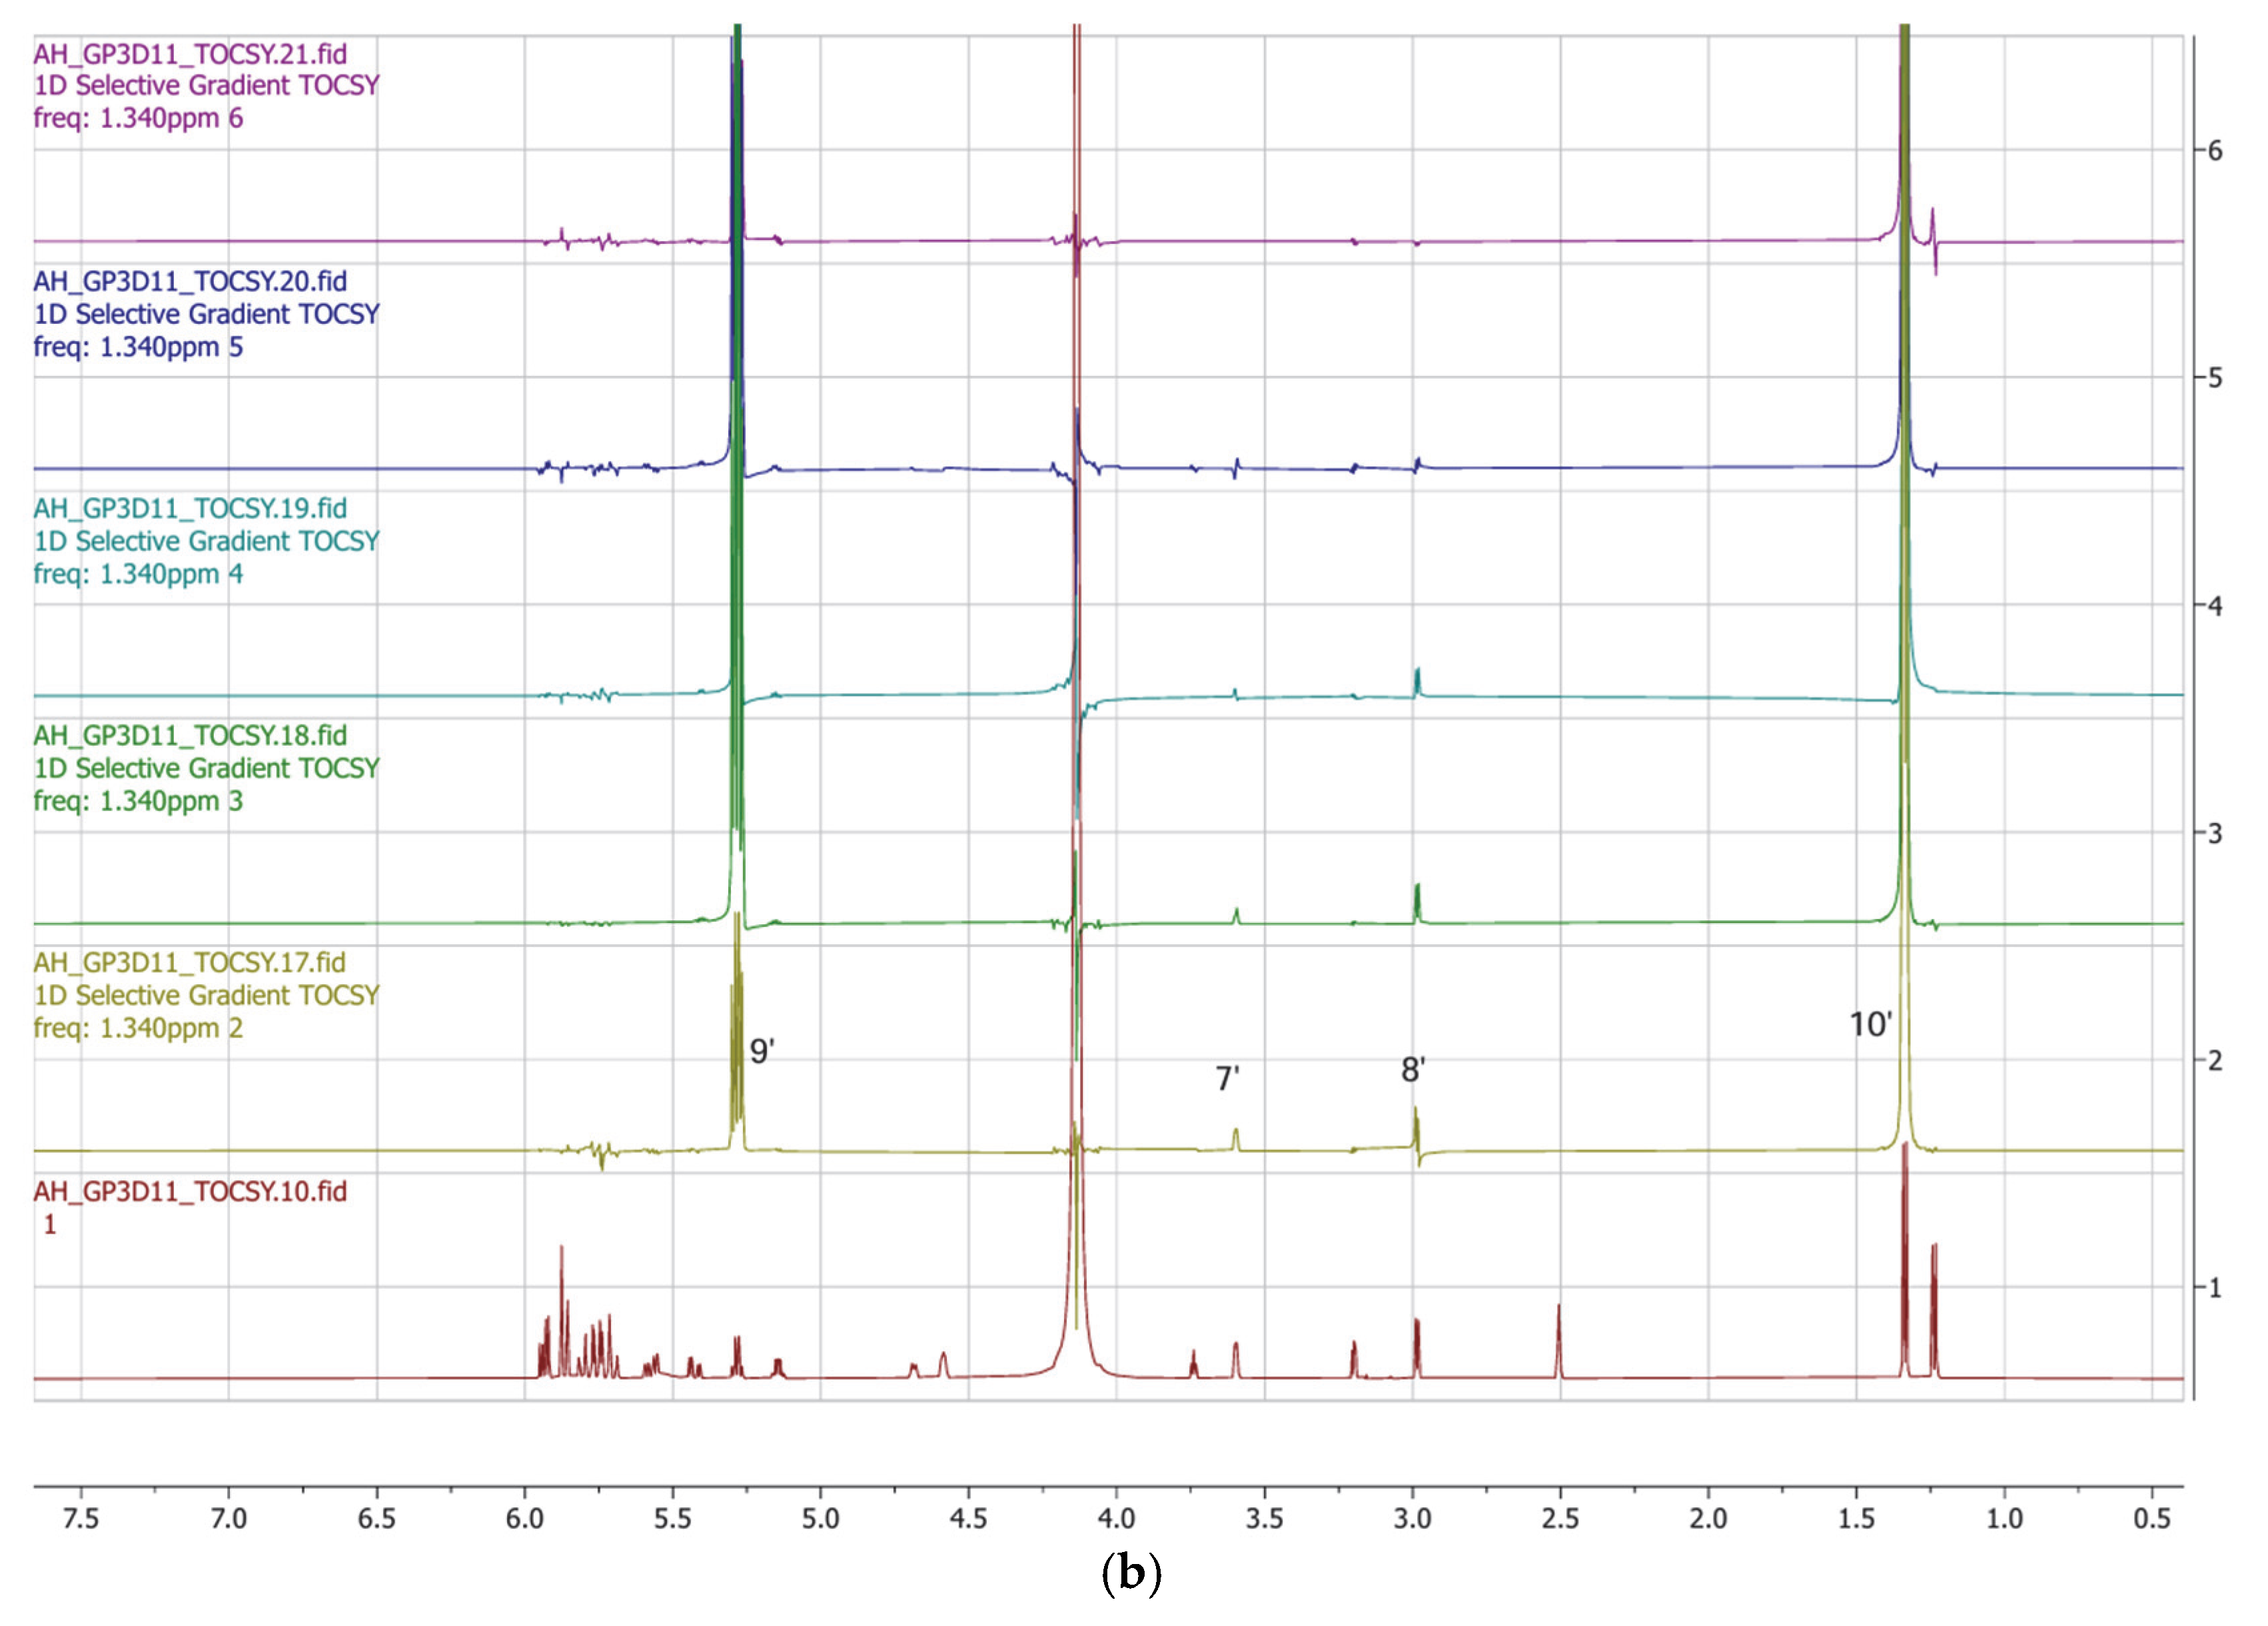
The 1H spectrum of the mixture of compounds 3 and 4 (shown in Figure S1) showed several distinct signals, which were virtually “separated” into two different datasets (Table 1 and Table 2 show the complete data) using selective 1D-TOCSY (shown in Figure 5). For clarity, the positions in compound 4 will be referred to as primes of the positions in compound 3.
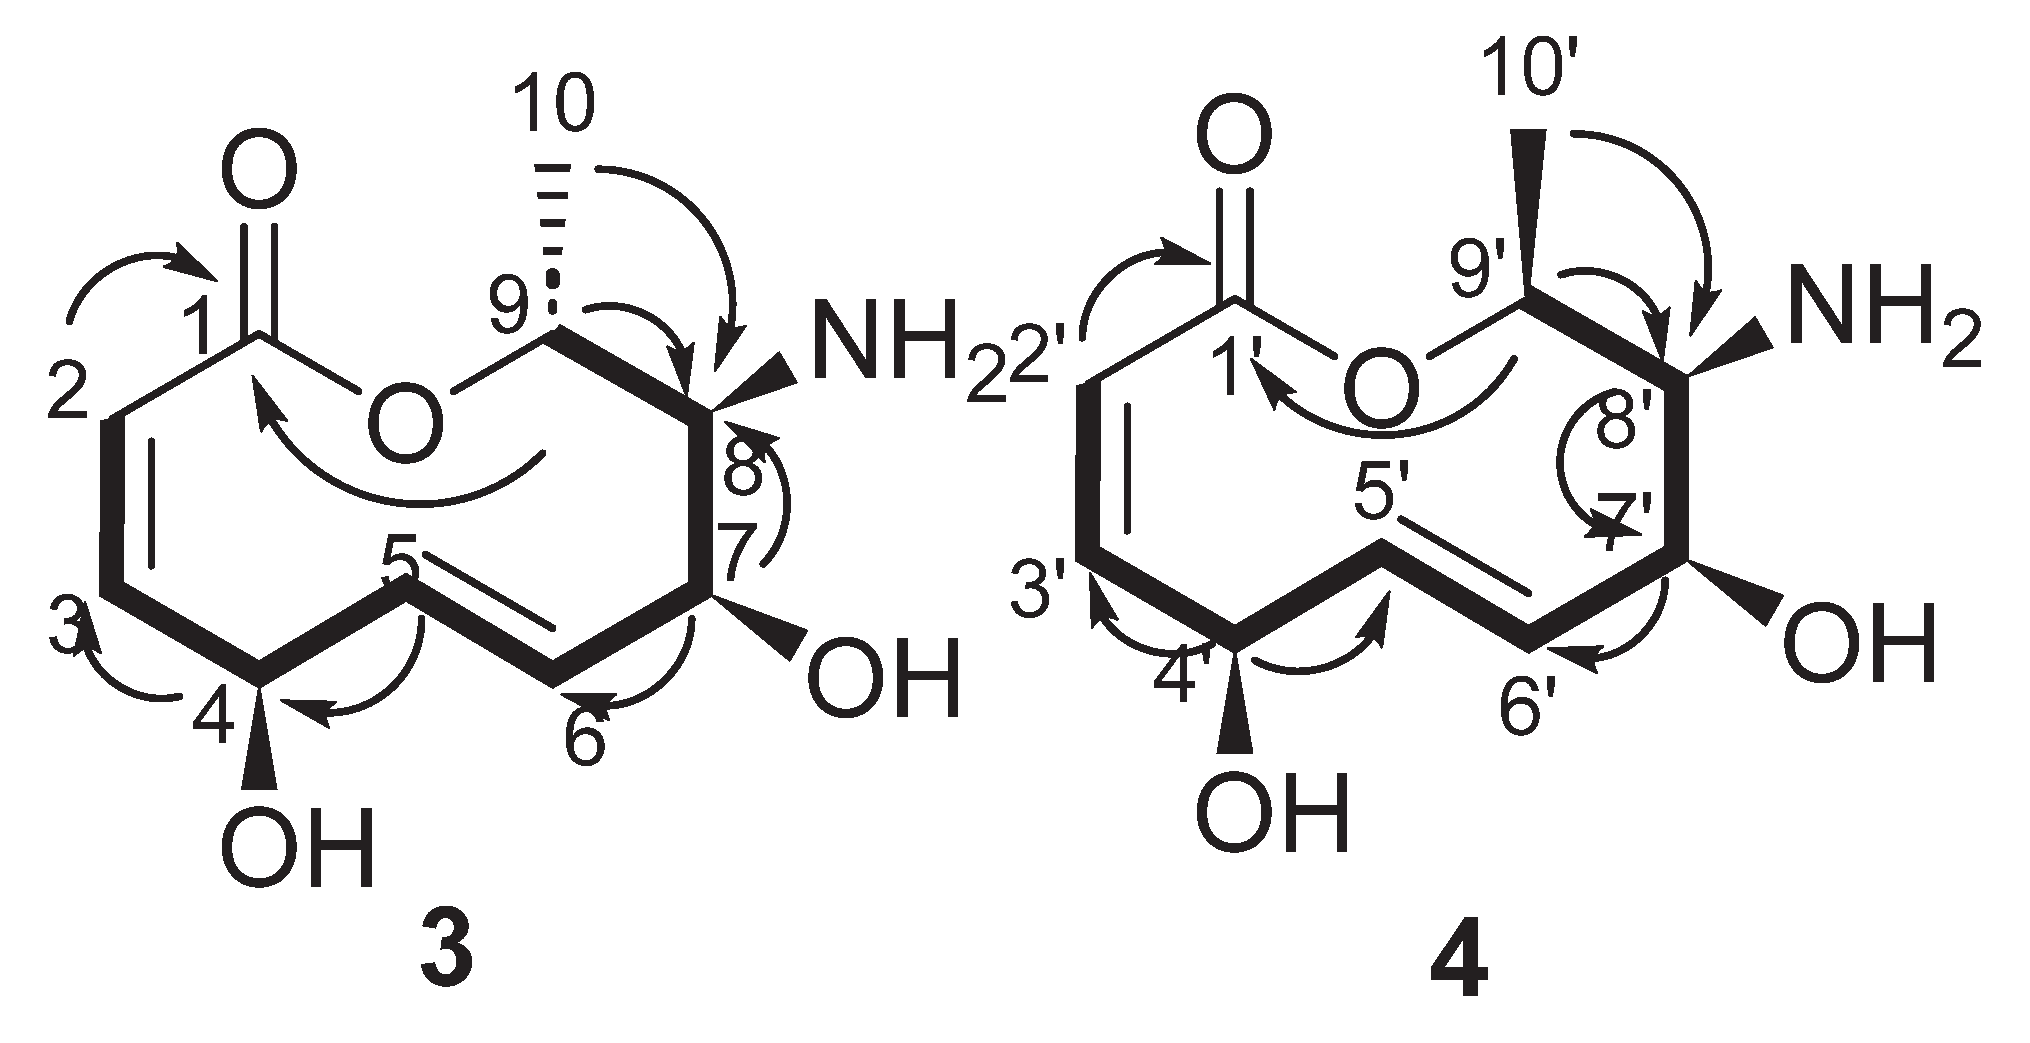
The COSY spectrum (Figure S2) revealed a single spin system (illustrated in Figure 4) beginning at H-2 (δH 5.85) and extending to the terminal methyl group H3-10 (δH 1.27). HMBC correlations (with supporting 13C, HSQC, and HMBC spectra shown in Figures S3–S5, and key HMBC correlations in Figure 6) between H-2 and C-1 (δC 167.8) confirmed the position of the double bond adjacent to the carbonyl group. Further correlations—between H-3 (δH 5.78) and C-4 (δC 70.4), and between H-4 (δH 4.70) and C-5 (δC 133.5)—established the hydroxyl group as being located between two double bonds. The amine group was assigned based on correlations between H-7 (δH 3.77) and both C-6 (δC 129.7) and C-8 (δC 55.5), and further supported by the correlation between H-9 (δH 5.17) and C-8. Closure of the lactone ring was confirmed through the correlation between H-9 and C-1, supported by their respective chemical shifts. The position of the methyl group was determined via the correlation between H3-10 and C-8.
Compound 4 exhibited nearly identical key COSY and HMBC correlations, with two exceptions: a correlation between H-5′ (δH 5.80) and C-4′ (δC 65.1), and another between H-7′ (δH 3.61) and C-8′ (δC 55.8). The substituent positions at C-4′ and C-8′ were further confirmed by correlations between H-4′ (δH 4.49) and C-5′ (δC 132.3) and between H-8′ (δH 3.00) and C-7′ (δC 55.3), respectively. Based on the relative intensities of the 13C NMR signals, the compound ratio of 4 to 3 was estimated to be 3:2.
A coupling constant of 17.5 Hz between H-5 and H-6 confirms the presence of a trans double bond in compound 3. Due to signal overlap between H-5′ and H-6′ in compound 4, spectra were recorded in acetone-d6 to resolve the signals (full NMR data for both compounds are presented in Table 3 and Table 4; corresponding 1H, 13C, COSY, HSQC, and HMBC spectra are shown in Figures S6–S10). This revealed a coupling constant of 17.3 Hz between H-5′ and H-6′, indicating a trans configuration for this double bond as well. Similarly, the coupling constants of 12.3 Hz for H-2 and H-3 in compound 3 and 12.1 Hz for H-2′ and H-3′ in compound 4 also support trans configurations. Acetone-d6 was additionally chosen to match the solvent used in the original 1H NMR analysis of curvulalide. As shown in Table 1, Table 2, Table 3 and Table 4, both compounds closely resemble curvulalide (5), differing only by the substitution of an amine group at position 8 in place of the hydroxyl group found in the original structure.
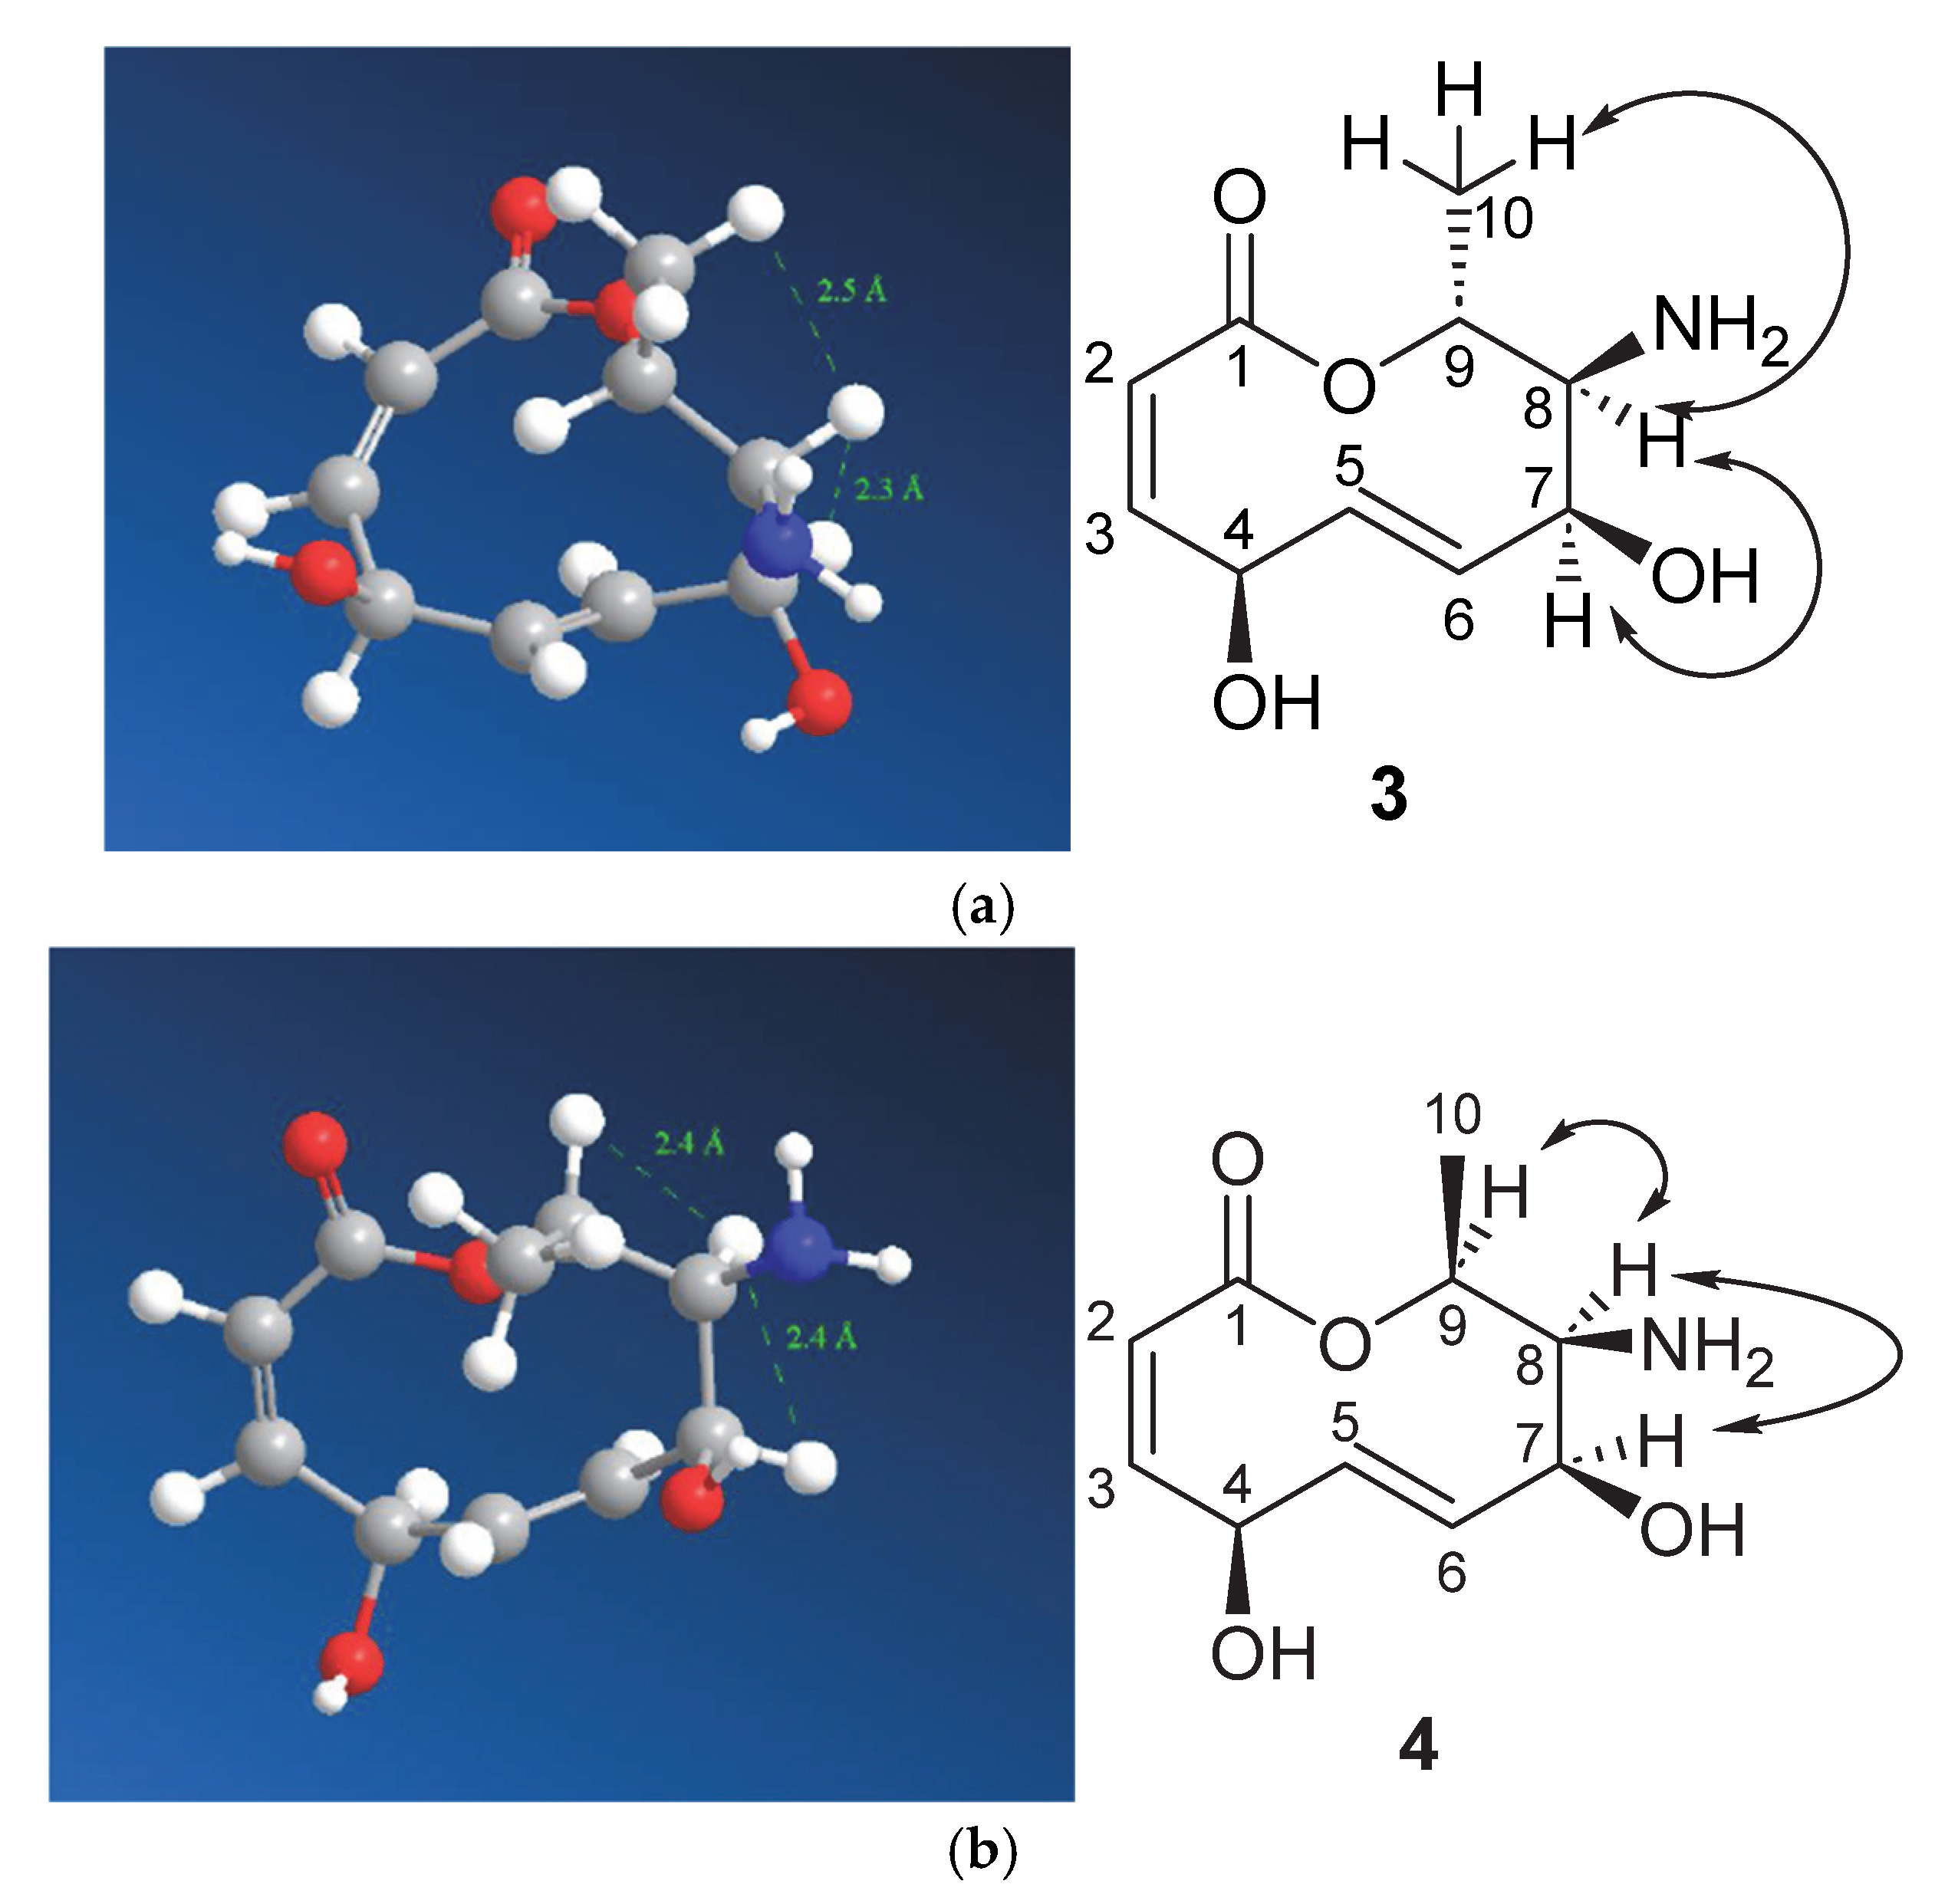
To determine the relative stereochemistry, a ROESY spectrum was recorded for the mixture of compounds 3 and 4 in acetone-d6 (Figure S11). Correlations observed between H-7, H-8, and H3-10 (Figure 7) indicated that these protons are located on the same face of the ring. In contrast, compound 4 showed ROESY correlations between H-7′, H-8′, and H-9′ on the same face, suggesting that compounds 3 and 4 differ in configuration at C-9. These data confirm that compounds 3 and 4 are C-9 epimers.
These compounds were named curvulalide B (3) and curvulalide C (4).
The optical rotation of the mixture was measured to be −0.1° at 20 °C at a concentration of 0.037 g mL−1 in methanol using a cuvette that measured 1 dm. This suggests that the levorotatory isomer dominates the mixture.
The mixture was dissolved in methanol and its IR spectrum was measured (Figure S12), which revealed strong peaks between 3200 and 3500 cm−1 indicating the presence of -OH and -NH2 groups, while the peaks between 2800 and 3000 cm−1 indicate the presence of the alkane C-H stretching. The spectrum also showed a peak at 1720 cm−1, indicating the presence of the ester carbonyl carbon.
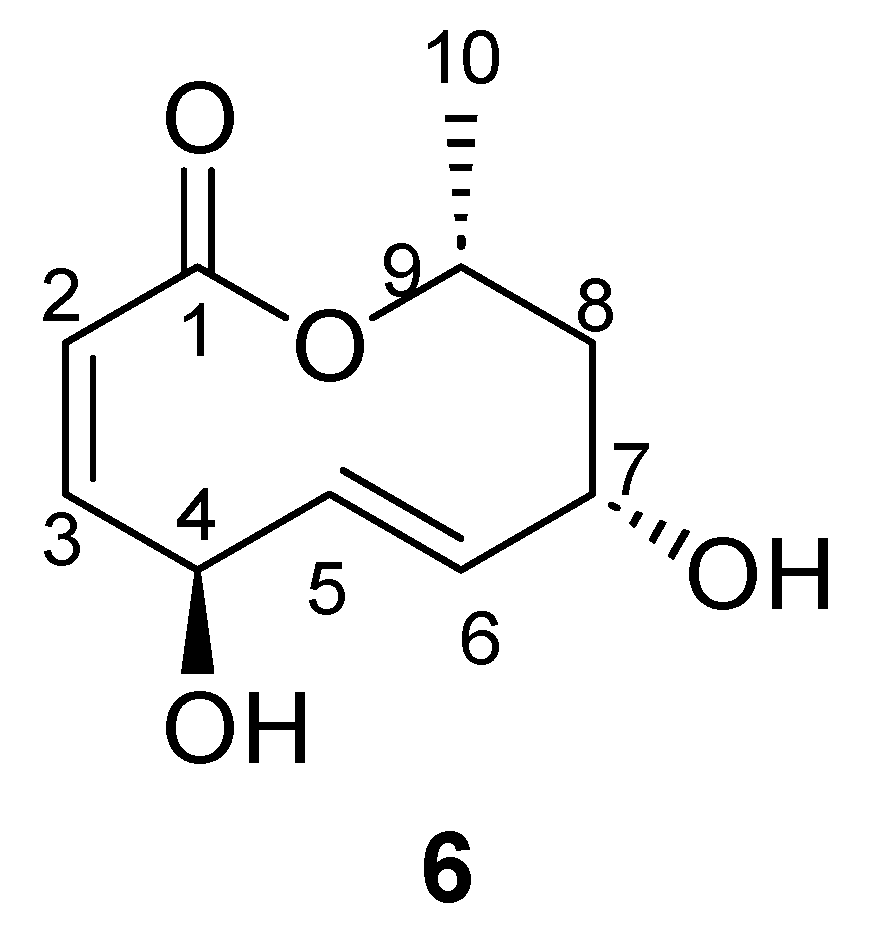
Modiolide A (Compound 6) (shown in Figure 8) was isolated as a white crystalline compound from the Chrysosporium merdarium fungal strain isolated from an Atacama soil sediment cultivated in the same medium as above and following the same isolation procedure as mentioned above. The molecular formula of this compound was established as C10H14O4, requiring 4 degrees of unsaturation based on the positive mode Q-ToF data, which indicated an [M + Na]+, with an m/z of 221.0792 (Δ = −3.7 ppm).
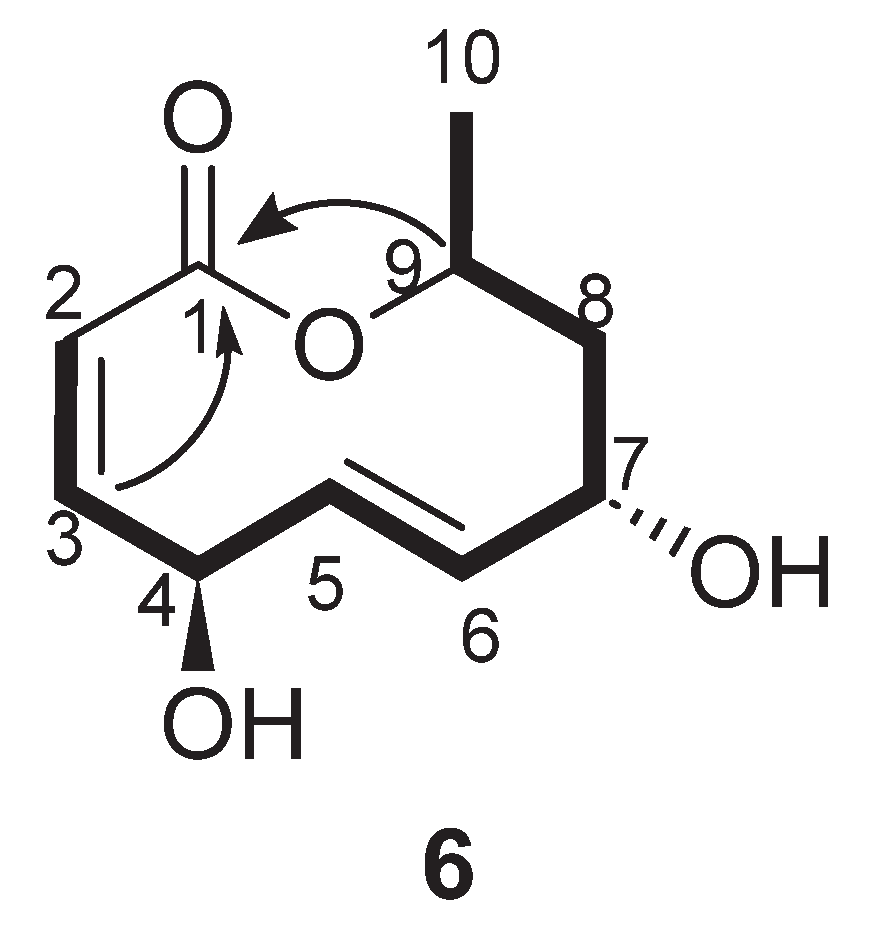
The 1H and 13C NMR data (Table 5), along with the 1H NMR spectrum (Figure S13), HMBC spectrum (Figure S14, from which the 13C data were extracted), and HSQC spectrum (Figure S15), revealed structural features consistent with a 10-membered macrolide. These included an ester carbonyl at δC 168.4 (C-1), four sp2 methines at δC 138.2 (C-3 and C-6), 129.6 (C-5), and 121.5 (C-2), three oxymethines at δC: 71.2 (C-7), 70.6 (C-4), and 68.9 (C-9), one sp3 methylene at δC 43.5 (C-8), and a methyl group at δC 21.7 (C-10). The COSY spectrum (Figure S16) revealed a contiguous spin system extending from H-2 (δH 5.84) to H3-10 (δH 1.14), as shown in Figure 7. A key HMBC correlation from H-2 to C-1 established its connectivity, while the downfield chemical shift of H-9 (δH 5.11) supported its involvement in the ester linkage to C-1. The presence of hydroxyl groups at C-4 and C-7 was indicated by downfield resonances at δH 4.56 (H-4) and δH 3.97 (H2-7), with supporting HMBC and COSY correlations presented in Figure 9. Notably, the structural assignment was complicated by nearly identical chemical shifts observed for H-5 (δH 5.43) and H-6 (δH 5.44), as well as overlapping signals for C-3 and C-6. Collectively, these data support the identification of compound 6 as a 10-membered macrolide.
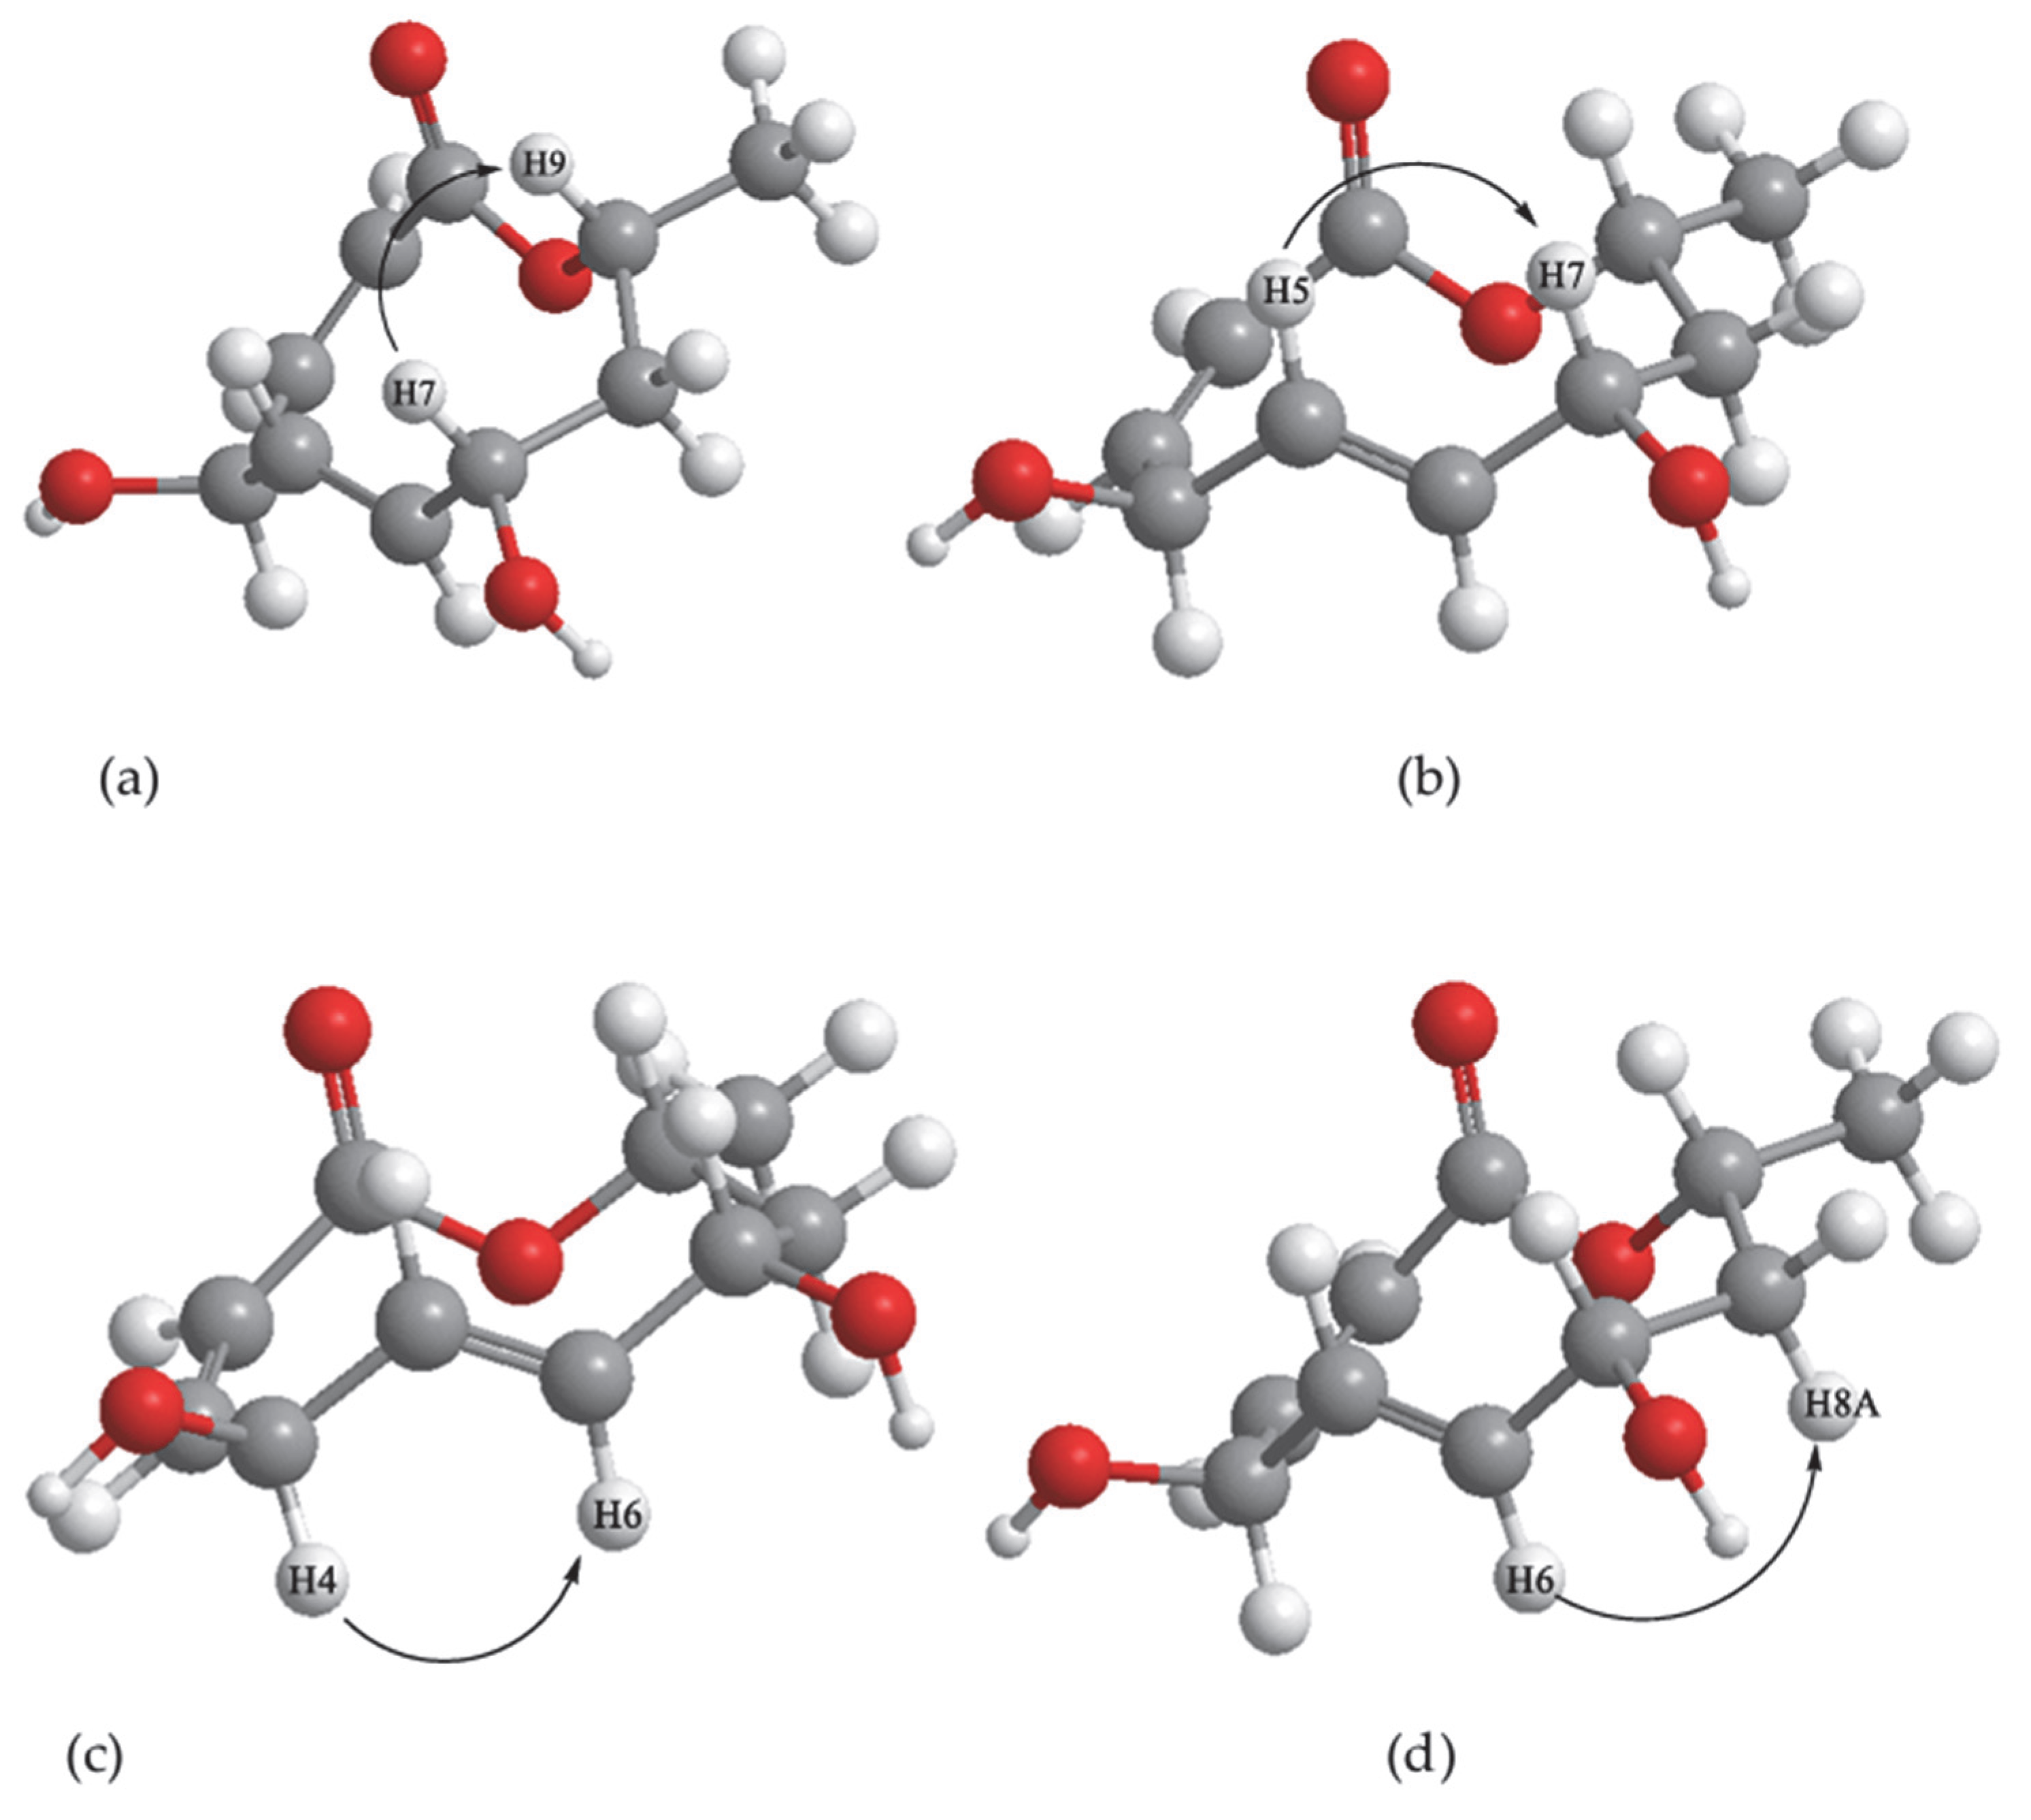
The relative stereochemistry of positions 7 and 9 in compound 6 was determined based on coupling constants and NOESY correlations (detailed in Figure 10). The coupling constants between H-7 and H-8A, and between H-8A and H-9, were both approximately 11 Hz, consistent with axial–axial relationships. This suggests that H-7 and H-9 occupy the same face of the ring. Supporting this assignment, a NOESY correlation between H-7 and H-9 (Figure S17) further confirmed their spatial proximity. In contrast, the stereochemical relationship between H-7 and H-6 was elucidated through NOE correlations observed between H-7 and H-5, H-6 and H-4, and H-6 and H-8A (Figure S17), indicating that H-6 lies on the opposite face of the ring relative to H-7. These stereochemical features are consistent with the configuration previously reported for modiolide A by Tsuda et al. (2003) [11]. Based on these observations, compound 6 was identified as modiolide A.
The mixture of compounds 3 and 4 was tested against the ESKAPE pathogens, the leading cause of nosocomial infections in the world, and against pathogens associated with bovine mastitis, a devastating disease affecting the dairy industry worldwide, causing severe losses. The antimicrobial test was performed at a concentration of 100 µg mL−1, but it showed no inhibitory activity against either panel. The mixture was also tested against Cryptococcus neoformans, a fungal pathogen, but it showed no inhibitory activity.
Compound (6) was tested against the ESKAPE pathogens alone using the disc diffusion assay at a concentration of 100 µg mL−1 but was found to be inactive.
The compounds discussed in this paper belong to the macrolide family, specifically within the nonenolide subclass. Structurally related compounds—such as stagonolides [17], putaminotoxins [18,19], and herbarumins [20]—have been isolated from Stagonospora cirsii, Phoma putaminum, and Phoma herbarum, respectively. They exhibit potential herbicidal properties, with stagonolides demonstrating activity against Cirsium arvense [17], a highly invasive perennial flowering weed native to Europe and Western Asia. These results suggest that the new compounds presented in this paper could also demonstrate these activities.

4. Conclusions

The fungus Chrysosporium merdarium, isolated from hyper-arid Atacama Desert sediments—a promising source of new natural products—was cultured in rice medium for 4 weeks. Two closely related new compounds (3 and 4) were extracted using methanol and ethyl acetate, then separated via flash chromatography and HPLC, but remained inseparable. 1D-TOCSY helped distinguish overlapping signals in their 1H NMR spectra, and structural analysis via HMBC and COSY revealed them as analogues of curvulalide (5), featuring a novel amine at position 8. ROESY showed that they were epimers at position 9, and LC–MS confirmed their molecular weights. The optical rotation of the mixture, along with the IR spectrum, was also measured.
The mixture was tested against ESKAPE pathogens and bovine mastitis-related bacteria, as well as the fungal pathogen Cryptococcus neoformans, but showed no activity. Additionally, another 10-membered lactone, modiolide A (6), was isolated using the same method. Its structure and stereochemistry were confirmed via LC–MS and NMR, but it too was inactive against the ESKAPE pathogens.

Supplementary Materials

The following supporting information can be downloaded at https://www.mdpi.com/article/10.3390/chemistry7030101/s1; Figure S1: Annotated 1H spectrum of the inseparable mixture of 3 and 4 in DMSO-d6 at 400 MHz; Figure S2: Annotated COSY spectrum of compounds 3 and 4 in DMSO-d6 at 400/100 MHz; Figure S3: Annotated 13C spectrum of compounds 3 and 4 in DMSO-d6 at 100 MHz; Figure S4: Annotated HSQC spectrum of compounds 3 and 4 in DMSO-d6 at 400 MHz; Figure S5: Annotated HMBC spectrum of compounds 3 and 4 in DMSO-d6 at 400/100 MHz; Figure S6: 1H spectrum of compounds 3 and 4 in acetome-d6 at 600 MHz; Figure S7: 13C spectrum of compounds 3 and 4 in acetome-d6 at 150 MHz; Figure S8: COSY spectrum of compounds 3 and 4 in acetone-d6 at 600 MHz; Figure S9: HSQC spectrum of compounds 3 and 4 in acetome-d6 at 600/150 MHz; Figure S10: HMBC spectrum of compounds 3 and 4 in acetome-d6 at 600/150 MHz; Figure S11: Annotated ROESY spectrum of compounds 3 and 4 in acetone-d6 at 600 MHz; Figure S12: IR spectrum of compounds 3 and 4 in methanol; Figure S13: 1H spectrum of compound 6 in DMSO-d6 at 400 MHz; Figure S14: Annotated HMBC spectrum of compound 6 in DMSO-d6 at 400 MHz; Figure S15: HSQC spectrum of compound 6 in DMSO-d6 at 400 MHz; Figure S16: Annotated COSY spectrum of compound 6 in DMSO-d6 at 400 MHz; Figure S17: NOESY spectrum of compound 6 in DMSO-d6 at 400 MHz.

Author Contributions

Conceptualisation, G.P., A.H.H., and R.V.A.; methodology, G.P., A.H.H., E.T.O., and R.V.A.; software, G.P. and R.V.A.; validation, E.T.O., R.E., and M.J.; formal analysis, A.H.H.; investigation, G.P. and A.H.H.; resources, G.P., R.V.A., and A.H.H.; data curation, A.H.H. and E.T.O.; writing—original draft preparation, R.V.A. and A.H.H.; writing—review and editing, G.P., M.A.-F., E.T.O., R.E., and M.J.; visualisation, G.P., A.H.H., and R.V.A.; supervision, R.E. and M.J.; project administration, R.E. and M.J.; funding acquisition, A.H.H. All authors have read and agreed to the published version of the manuscript.

Funding

The authors acknowledge the Deanship of Research at Jordan University of Science and Technology (JUST) for their generous financial support. The collection of materials was carried out with financial support from the UK Newton Project for the UK–Chile Collaboration (JIC CA 586) to Professor Mervyn Bibb, John Inness Centre, Norwich, UK. The Thermo Orbitrap Tribrid IQ-X system was funded via BBSRC ALERT-22 grant BB/X019802/1.

Data Availability Statement

The spectroscopic data presented in this study are available as Supplementary Materials. The original contributions presented in this study are included in the article/Supplementary Materials. Further inquiries can be directed to the corresponding author.

Acknowledgments

The authors would like to thank Russell Gray and Ria Desai of the Marine Biodiscovery Centre for their continuous help and support in running the NMR experiments.

Conflicts of Interest

The authors declare no conflicts of interest.

References

  1. Monciardini, P.; Iorio, M.; Maffioli, S.; Sosio, M.; Donadio, S. Discovering new bioactive molecules from microbial sources. Microb. Biotechnol. 2014, 7, 209–220. [Google Scholar] [CrossRef] [PubMed]
  2. Ertekin, E.; Meslier, V.; Browning, A.; Treadgold, J.; DiRuggiero, J. Rock structure drives the taxonomic and functional diversity of endolithic microbial communities in extreme environments. Environ. Microbiol. 2021, 23, 3937–3956. [Google Scholar] [CrossRef]
  3. McKay, C.P.; Friedmann, E.I.; Gómez-Silva, B.; Cáceres-Villanueva, L.; Andersen, D.T.; Landheim, R. Temperature and Moisture Conditions for Life in the Extreme Arid Region of the Atacama Desert: Four Years of Observations Including the El Niño of 1997–1998. Astrobiology 2003, 3, 393–406. [Google Scholar] [CrossRef] [PubMed]
  4. Dorador, C.; Fink, P.; Hengst, M.; Icaza, G.; Villalobos, A.S.; Vejar, D.; Meneses, D.; Zadjelovic, V.; Burmann, L.; Moelzner, J.; et al. Microbial community composition and trophic role along a marked salinity gradient in Laguna Puilar, Salar de Atacama, Chile. Antonie Van Leeuwenhoek 2018, 111, 1361–1374. [Google Scholar] [CrossRef] [PubMed]
  5. Bull, A.T.; Andrews, B.A.; Dorador, C.; Goodfellow, M. Introducing the Atacama Desert. Antonie Van Leeuwenhoek 2018, 111, 1269–1272. [Google Scholar] [CrossRef] [PubMed]
  6. Gomez-Silva, B.; Rainey, F.; Warren-Rhodes, K.; McKay, C.; Navarro-Gonzalez, R. Atacama Desert Soil Microbiology. Microbiol. Extrem. Soils 2008, 13, 117–132. [Google Scholar] [CrossRef]
  7. Rateb, M.E.; Ebel, R.; Jaspars, M. Natural product diversity of actinobacteria in the Atacama Desert. Antonie Van Leeuwenhoek 2018, 111, 1467–1477. [Google Scholar] [CrossRef] [PubMed]
  8. Astakala, R.V.; Preet, G.; Milne, B.F.; Tibyangye, J.; Razmilic, V.; Castro, J.F.; Asenjo, J.A.; Andrews, B.; Ebel, R.; Jaspars, M. Mutactimycin AP, a New Mutactimycin Isolated from an Actinobacteria from the Atacama Desert. Molecules 2022, 27, 7185. [Google Scholar] [CrossRef] [PubMed]
  9. Schulz, D.; Beese, P.; Ohlendorf, B.; Erhard, A.; Zinecker, H.; Dorador, C.; Imhoff, J.F. Abenquines A–D: Aminoquinone derivatives produced by Streptomyces sp. strain DB634. J. Antibiot. 2011, 64, 763–768. [Google Scholar] [CrossRef] [PubMed]
  10. Trisuwan, K.; Rukachaisirikul, V.; Phongpaichit, S.; Preedanon, S.; Sakayaroj, J. Modiolide and pyrone derivatives from the sea fan-derived fungus Curvularia sp. PSU-F22. Arch. Pharm. Res. 2011, 34, 709–714. [Google Scholar] [CrossRef]
  11. Tsuda, M.; Mugishima, T.; Komatsu, K.; Sone, T.; Tanaka, M.; Mikami, Y.; Kobayashi, J. Modiolides A and B, Two New 10-Membered Macrolides from a Marine-Derived Fungus. J. Nat. Prod. 2003, 66, 412–415. [Google Scholar] [CrossRef] [PubMed]
  12. Wang, J.; Qu, Q.; Liu, X.; Cui, W.; Yu, F.; Chen, X.; Xing, X.; Zhou, Y.; Yang, Y.; Bello-Onaghise, G.; et al. 1-Hydroxyanthraquinone exhibited antibacterial activity by regulating glutamine synthetase of Staphylococcus xylosus as a virulence factor. Biomed. Pharmacother. 2020, 123, 109779. [Google Scholar] [CrossRef] [PubMed]
  13. Srikanta, D.; Santiago-Tirado, F.H.; Doering, T.L. Cryptococcus neoformans: Historical curiosity to modern pathogen. Yeast 2014, 31, 47–60. [Google Scholar] [CrossRef]
  14. Preet, G.; Astakala, R.V.; Rajakulendran, J.E.; Oluwabusola, E.T.; Ebel, R.; Jaspars, M. (E)-N-(3-(5-(3-Acetamidopropyl)-3,6-dioxopiperazin-2-yl)propyl)-5-hydroxy-3-methylpent-2-enamide. Molbank 2023, 2023, M1680. [Google Scholar] [CrossRef]
  15. Siddharth, S.; Vittal, R. Evaluation of Antimicrobial, Enzyme Inhibitory, Antioxidant and Cytotoxic Activities of Partially Purified Volatile Metabolites of Marine Streptomyces sp.S2A. Microorganisms 2018, 6, 72. [Google Scholar] [CrossRef] [PubMed]
  16. Haj Hasan, A.; Preet, G.; Astakala, R.V.; Al-Adilah, H.; Oluwabusola, E.T.; Ebel, R.; Jaspars, M. Antibacterial activity of natural flavones against bovine mastitis pathogens: In vitro, SAR analysis, and computational study. In Silico Pharmacol. 2024, 12, 78. [Google Scholar] [CrossRef] [PubMed]
  17. Evidente, A.; Cimmino, A.; Berestetskiy, A.; Andolfi, A.; Motta, A. Stagonolides G−I and Modiolide A, Nonenolides Produced by Stagonospora cirsii, a Potential Mycoherbicide for Cirsium arvense. J. Nat. Prod. 2008, 71, 1897–1901. [Google Scholar] [CrossRef]
  18. Evidente, A. Putaminoxin, a phytotoxic nonenolide from Phoma putaminum. Phytochemistry 1995, 40, 1637–1641. [Google Scholar] [CrossRef]
  19. Evidente, A.; Lanzetta, R.; Capasso, R.; Andolfi, A.; Vurro, M.; Zonno, M.C. Putaminoxins B and C from Phoma putaminum. Phytochemistry 1997, 44, 1041–1045. [Google Scholar] [CrossRef]
  20. Rivero-Cruz, J.F.; Macías, M.; Cerda-García-Rojas, C.M.; Mata, R. A New Phytotoxic Nonenolide from Phoma herbarum. J. Nat. Prod. 2003, 66, 511–514. [Google Scholar] [CrossRef] [PubMed]
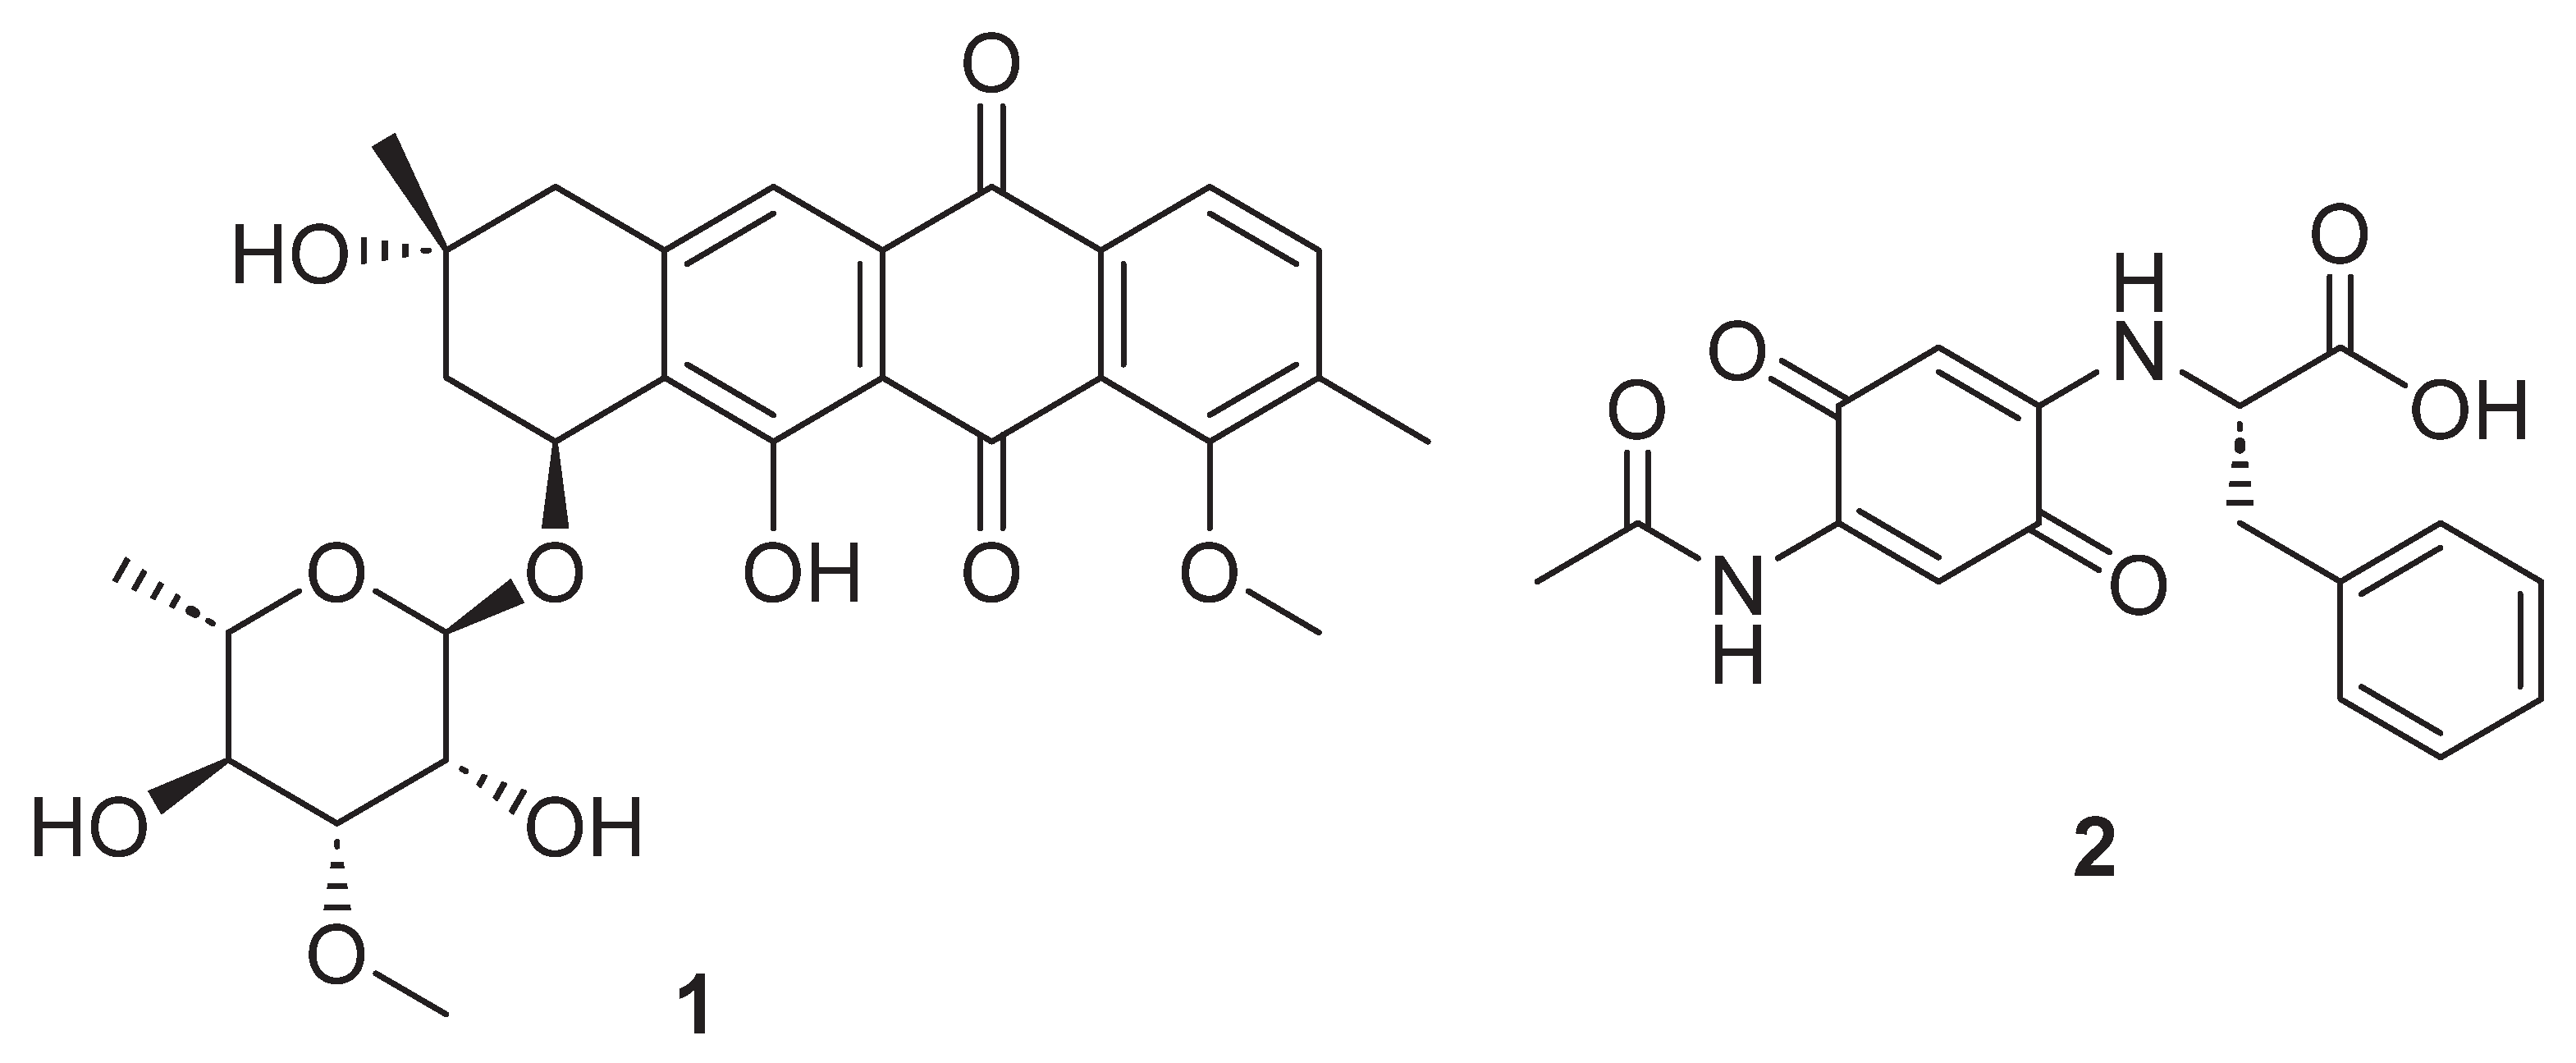
Figure 1. Chemical structures of compounds, mutactimycin AP (1) and chaxamycin D (2) isolated from the Atacama Desert.
Chemistry 07 00101 g001
Figure 2. Structures of compounds presented in this paper (3 and 4) and the structure of curvulalide (5), along with modiolide A (6). The stereochemistry shown for 3 and 4 refers only to their relative stereochemistry.
Chemistry 07 00101 g002
Figure 3. LC–MS spectrum of compounds 3 and 4 (a) shows the predicted formula and (b) the base peak.
Chemistry 07 00101 g003
Figure 4. The UV absorbance spectrum of the mixture of compounds 3 and 4.
Chemistry 07 00101 g004
Figure 5. 1D-TOCSY spectra used to differentiate between the signals belonging to compound 3 (a) and compound 4 (b). For clarity, positions in compound 4 are labelled as primes of those in compound 3.
Chemistry 07 00101 g005aChemistry 07 00101 g005b
Figure 6. The arrows show key HMBC correlations (H→C) for 3 and 4, and bold bonds show COSY correlations.
Chemistry 07 00101 g006
Figure 7. 3D representations and ROESY correlations (double-sided arrows) for 3 (a) and 4 (b).
Chemistry 07 00101 g007
Figure 8. Structure of modiolide A (6).
Chemistry 07 00101 g008
Figure 9. Key COSY correlations (bold bonds) and HMBC correlations (arrows) of modiolide A (6).
Chemistry 07 00101 g009
Figure 10. NOESY correlations (double-sided arrows) confirming the relative stereochemistry between (a) H-7 and H-9, (b) H-5 and H-7, (c) H-4 and H-6, and (d) H-6 and H-8A.
Chemistry 07 00101 g010
Table 1. 1H and 13C NMR data of compound 3 in DMSO-d6 at 400 MHz/100 MHz. The reference data are that of curvulalide (5).
Positionδ13C, Typeδ1H, Multiplicity (J in Hz) *COSY (H→H)HMBC (H→C)Reference δ13C, Type ** [10]Reference δ1H, Multiplicity (J in Hz) *** [10]
1167.8, C 167.8, C
2120.7, CH5.85, m3, 41, 4122.4, CH5.84, dd (12.6,
1.5)
3138.6, CH5.78, m2, 41, 4136.8, CH5.88, dd (12.6,
3.0)
470.4, CH4.70, d (7.1)5, 63, 5, 671.2, CH5.01, d (7.5)
5133.5, CH5.61, dd (17.5, 7.2)4, 64131.5, CH5.93, ddd (15.6,
7.5, 1.5)
6129.7, CH5.48, dd (17.5, 5.1)4, 5, 74128.0, CH6.29, dd (15.6,
3.3)
754.8, CH3.77, t (4.8)6, 85, 6, 858.8, CH4.87, d (5.3)
7-OH 4.00, m 7
855.5, CH3.23, t (4.1)7, 96, 7, 976.0, CH3.87, dd (5.3, 2.5)
967.3, CH5.17, qd (6.8, 3.7)8, 10 1, 8, 1068.1, CH5.64, dq (6.6, 2.5)
1015.7, CH31.27, d (7.0)98, 917.2, CH31.29, d (6.6)
* Shifts based on 1D TOCSY (Figure 3a). ** Measured in CDCl3 at 75 MHz. *** Measured in acetone-d6 at 300 MHz.
Table 2. 1H and 13C NMR data of compound 4 in DMSO-d6 at 400 MHz/100 MHz. The reference data are that of curvulalide (5).
Positionδ13C, Typeδ1H, Multiplicity (J in Hz) *COSY (H→H)HMBC (H→C)Reference δ13C, Type ** [10]Reference δ1H, Multiplicity (J in Hz) *** [10]
1′166.9, C 167.8, C
2′124.3, CH5.91, m4′1′122.4, CH5.84, dd (12.6,
1.5)
3′134.9, CH5.94, d (5.3)4′1′136.8, CH5.88, dd (12.6,
3.0)
4′65.1, CH4.49, br s3′, 5′2′, 3′, 5′, 6′ 71.2, CH5.01, d (7.5)
5′132.3, CH5.80, d (3.7)4′, 6′6′131.5, CH5.93, ddd (15.6,
7.5, 1.5)
6′119.4, CH5.78, m7′5′128.0, CH6.29, dd (15.6,
3.3)
7′55.3, CH3.61, m8′5′, 6′58.8, CH4.87, d (5.3)
8′55.8, CH3.00, dd (4.5, 0.8)7′6′, 7′, 9′76.0, CH3.87, dd (5.3, 2.5)
9′65.3, CH5.32, qd (6.8, 1.1)10′ 1′, 8′68.1, CH5.64, dq (6.6, 2.5)
10′18.2, CH31.37, d (7.0)9′8′, 9′17.2, CH31.29, d (6.6)
* Shifts based on 1D TOCSY (Figure 3b). ** Recorded in CDCl3 at 75 MHz. *** Recorded in acetone-d6 at 300 MHz.
Table 3. NMR data of 3 in acetone-d6 at 600/150 MHz.
Positionδ13C, Typeδ1H, Multiplicity (J in Hz) ROESY (H→H)HMBC (H→C)
1168.5, C
2121.6, CH5.80, dd (12.3, 2.0)41,3, 4, 5
3138.7, CH5.85, dd (12.3, 2.9)45
471.7, CH4.80, d (6.5)2,3,52, 3, 6
4-OH 4.58 brs
5133.8, CH5.69, ddd (17.3, 7.5, 1.2)4, 6, 77
6130.6, CH5.52, ddd (17.3, 5.3, 1.0)4, 5, 74
755.3, CH3.72, td (5.5, 1.4)5, 6, 85, 6
855.8, CH3.20, t (4.0)7, 107, 9
967.8, CH5.22, qd (6.7, 3.6)10 10
1015.7, CH31.32, d (6.8)99
Table 4. NMR data of 4 in acetone-d6 at 600/150 MHz.
Positionδ13C, Typeδ1H, Multiplicity (J in Hz) ROESY (H→H)HMBC (H→C)
1′167.5, C
2′125.1, CH5.87, dd (12.1, 1.7)3′1′,3′, 4′
3′135.1, CH6.01, dd (12.1, 6.1)2′1′, 2′, 5′
4′66.5, CH4.71, brs5′2′, 5′, 6′
4′-OH 4.30 brs4′
5′132.9, CH5.95, ddd (15.6, 3.1, 1.1)4′2′, 4′, 6′
6′120.3, CH5.86, m 7′5′
7′55.9, CH3.58, m6′, 8′5′, 6′. 8′
8′56.6, CH2.99, dd (4.4, 1.1)7′, 9′5′
9′65.9, CH5.38, qd (6.8, 1.2)8′, 10′ 1′, 8′, 10′
10′18.3, CH31.42, d (6.8)9′9′
Table 5. 1H, 13C, COSY, and HMBC NMR data of compound 6 in DMSO-d6 (100/400 MHz).
Positionδ13C, Typeδ1H, Multiplicity (J in Hz) *COSY (H→H)HMBC (H→C)Reference δ13C, Type ** [11]Reference δ1H, Multiplicity (J in Hz) ** [11]
1168.4, C 170.0, C
2121.5, CH5.84 dd (12.6, 1.8)3,1, 3, 4, 5123.7, CH5.85, dd (1.5, 12.3)
3138.2, CH a5.76 dd (12.6, 3.2)2, 41, 4, 5138.7, CH5.83, dd (3.5, 12.3)
470.6, CH4.56 m3, 53, 5, 673.0, CH4.68, dd (3.5, 7.3)
5129.6, CH5.43 m4, 63, 4, 6, 7131.8, CH5.61, dd (7.3, 15.8)
6138.2, CH a5.44 m5, 74, 5, 7, 8139.4, CH5.56, dd (7.5, 15.8)
771.2, CH3.97 ddd (11.0, 7.8, 3.3)6, 8573.6, CH4.12, ddd (2.5, 7.5, 11.4)
843.5, CH2A 1.78 mB 1.58, dt (13.9, 11.1)8B7, 8A, 96, 7, 9, 1044.7, CHA 1.71, dt (14.0, 11.4)B 1.87, dt (14.0, 2.5)
968.9, CH5.11 m8B, 10 1, 7, 8, 1070.9, CH5.25, ddq (2.5, 11.4, 6.7)
1021.7, CH31.14 d (6.3)97, 8, 922.4, CH31.22, d (6.7)
a Overlapping signals. * Spectra recorded in DMSO-d6. ** Spectra recorded in methanol-d4.
Disclaimer/Publisher’s Note: The statements, opinions and data contained in all publications are solely those of the individual author(s) and contributor(s) and not of MDPI and/or the editor(s). MDPI and/or the editor(s) disclaim responsibility for any injury to people or property resulting from any ideas, methods, instructions or products referred to in the content.