Abstract
This study presents a comprehensive analysis of the chemical composition and bioactive properties of six newly cultivated varieties of pigmented and non-pigmented rice: Neunkeunheukchal (NKH), Neunkeunssal, Heukjagwang 709 (H709), Heukjagwang 1601, Hongjinju, and Hongchapssal (HCS). This study aims to characterize the chemical information and the industrial potential of lesser-known rice varieties. Significant differences were observed in the levels of phenolic compounds, flavonoids, γ-oryzanol, and free amino acids among these varieties, correlating with their antioxidant capacities. Among these varieties, NKH consistently exhibited the highest total phenolic, flavonoid, and γ-oryzanol contents, along with the strongest radical-scavenging activities, indicating its potential as a valuable functional food ingredient. Additionally, H709 and HCS demonstrated significant antioxidant activities, highlighting their potential roles in health-promoting applications. These findings highlight the potential of these varieties for functional food and nutraceutical applications. Future research should investigate the effects of cultivation conditions and processing methods on bioactive compound levels while conducting clinical trials to validate these health benefits in human models. The findings suggest that NKH, given its rich bioactive profile, may be particularly effective in managing oxidative stress and associated chronic diseases. Furthermore, the γ-oryzanol contents, the highest in NKH, highlight its potential for metabolic health benefits. This study lays the groundwork for future investigations into the development of functional foods and nutraceuticals derived from the unique characteristics of pigmented and non-pigmented rice varieties.
1. Introduction
Oryza sativa L., commonly known as rice, is a staple food that nourishes > 50% of the global population, with a particularly prominent role in the cultural and dietary practices of Asia [1,2]. It is a member of the Poaceae family, alongside other crops such as maize, oats, and wheat [3]. In Korea, rice is believed to have been introduced from China during the Bronze Age [4]. Rice is now produced at a rate of about 567 million tons globally and is recognized as a rich source of protein, comprising four distinct protein fractions [5,6].
While white rice is widely consumed globally, interest in pigmented rice varieties is increasing, particularly in several Asian countries [7]. These pigmented varieties, which include black, red, orange, and brown rice, derive their diverse colors from flavonoids such as anthocyanins and proanthocyanidins [8]. Anthocyanins, a class of water-soluble flavonoids, include cyanidin 3-glucoside, malvidin 3-galactoside, and peonidin 3-glucoside in pigmented rice varieties [9]. The biosynthesis of these compounds involves several key genes, such as OsUGT88C3 [10]. Among these compounds, cyanidin 3-glucoside is the most abundant in black and red rice [11]. Aside from anthocyanins, pigmented rice is rich in vitamins and carotenoids [12].
A study by Irakli et al. demonstrated that pigmented rice varieties contain higher levels of total phenolic and flavonoid compounds and exhibit stronger antioxidant capacities than non-pigmented rice [13]. Furthermore, polyphenols in pigmented rice have shown potential in reducing oxidative stress related to obesity [14]. Previous studies have investigated the food applications of these varieties. For example, Han et al. reported that “Yakju” made from “Nuruk” derived from pigmented rice exhibited higher enzymatic activities, including β-amylase and protease, than those from white rice [15]. Other studies have explored the use of black rice in various food products, such as noodles and mayonnaise [16,17]. Additionally, Samyor et al. highlighted the potential of underutilized pigmented rice cultivars from Arunachal Pradesh, India, for applications in the pharmaceutical industry [18].
Therefore, this study aims to evaluate the industrial potential of six newly cultivated pigmented and non-pigmented rice varieties by analyzing their chemical composition and antioxidant properties. This study lays the groundwork for future investigations into the functional uses of newly grown colored rice varieties by providing a thorough chemical analysis of them. The findings can direct industrial uses in food, medicine, and cosmetics.
2. Materials and Methods
2.1. Plant Materials
Rice samples from six varieties—Neunkeunheukchal (NKH), Neunkeunssal (NKS), Heukjagwang 709 (H709), Heukjagwang 1601 (H1601), Hongjinju (HJJ), and Hongchapssal (HCS)—were obtained from Sandeul Agro Farm, Gwangju, Korea (Figure 1). These are all of the japonica type. Polishing was carried out using a rice polishing machine. NKH and NKS are large-embryo rice varieties, which are not considered pigmented rice. H709 and H1601 are black-pigmented rice breeding lines developed by Sandeul Agro Farm, Gwangju, Korea, while HJJ and HCS are red-pigmented varieties. All seed samples have been deposited at the Department of Plant Science and Technology, Chung-Ang University, Anseong, Korea.
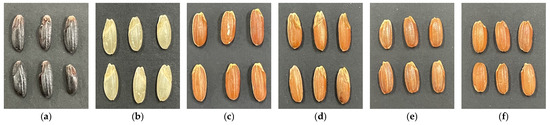
Figure 1.
Pigmented and non-pigmented rice of NKH (a), NKS (b), H709 (c), H1601 (d), HJJ (e), and HCS (f).
2.2. Chemicals and Reagents
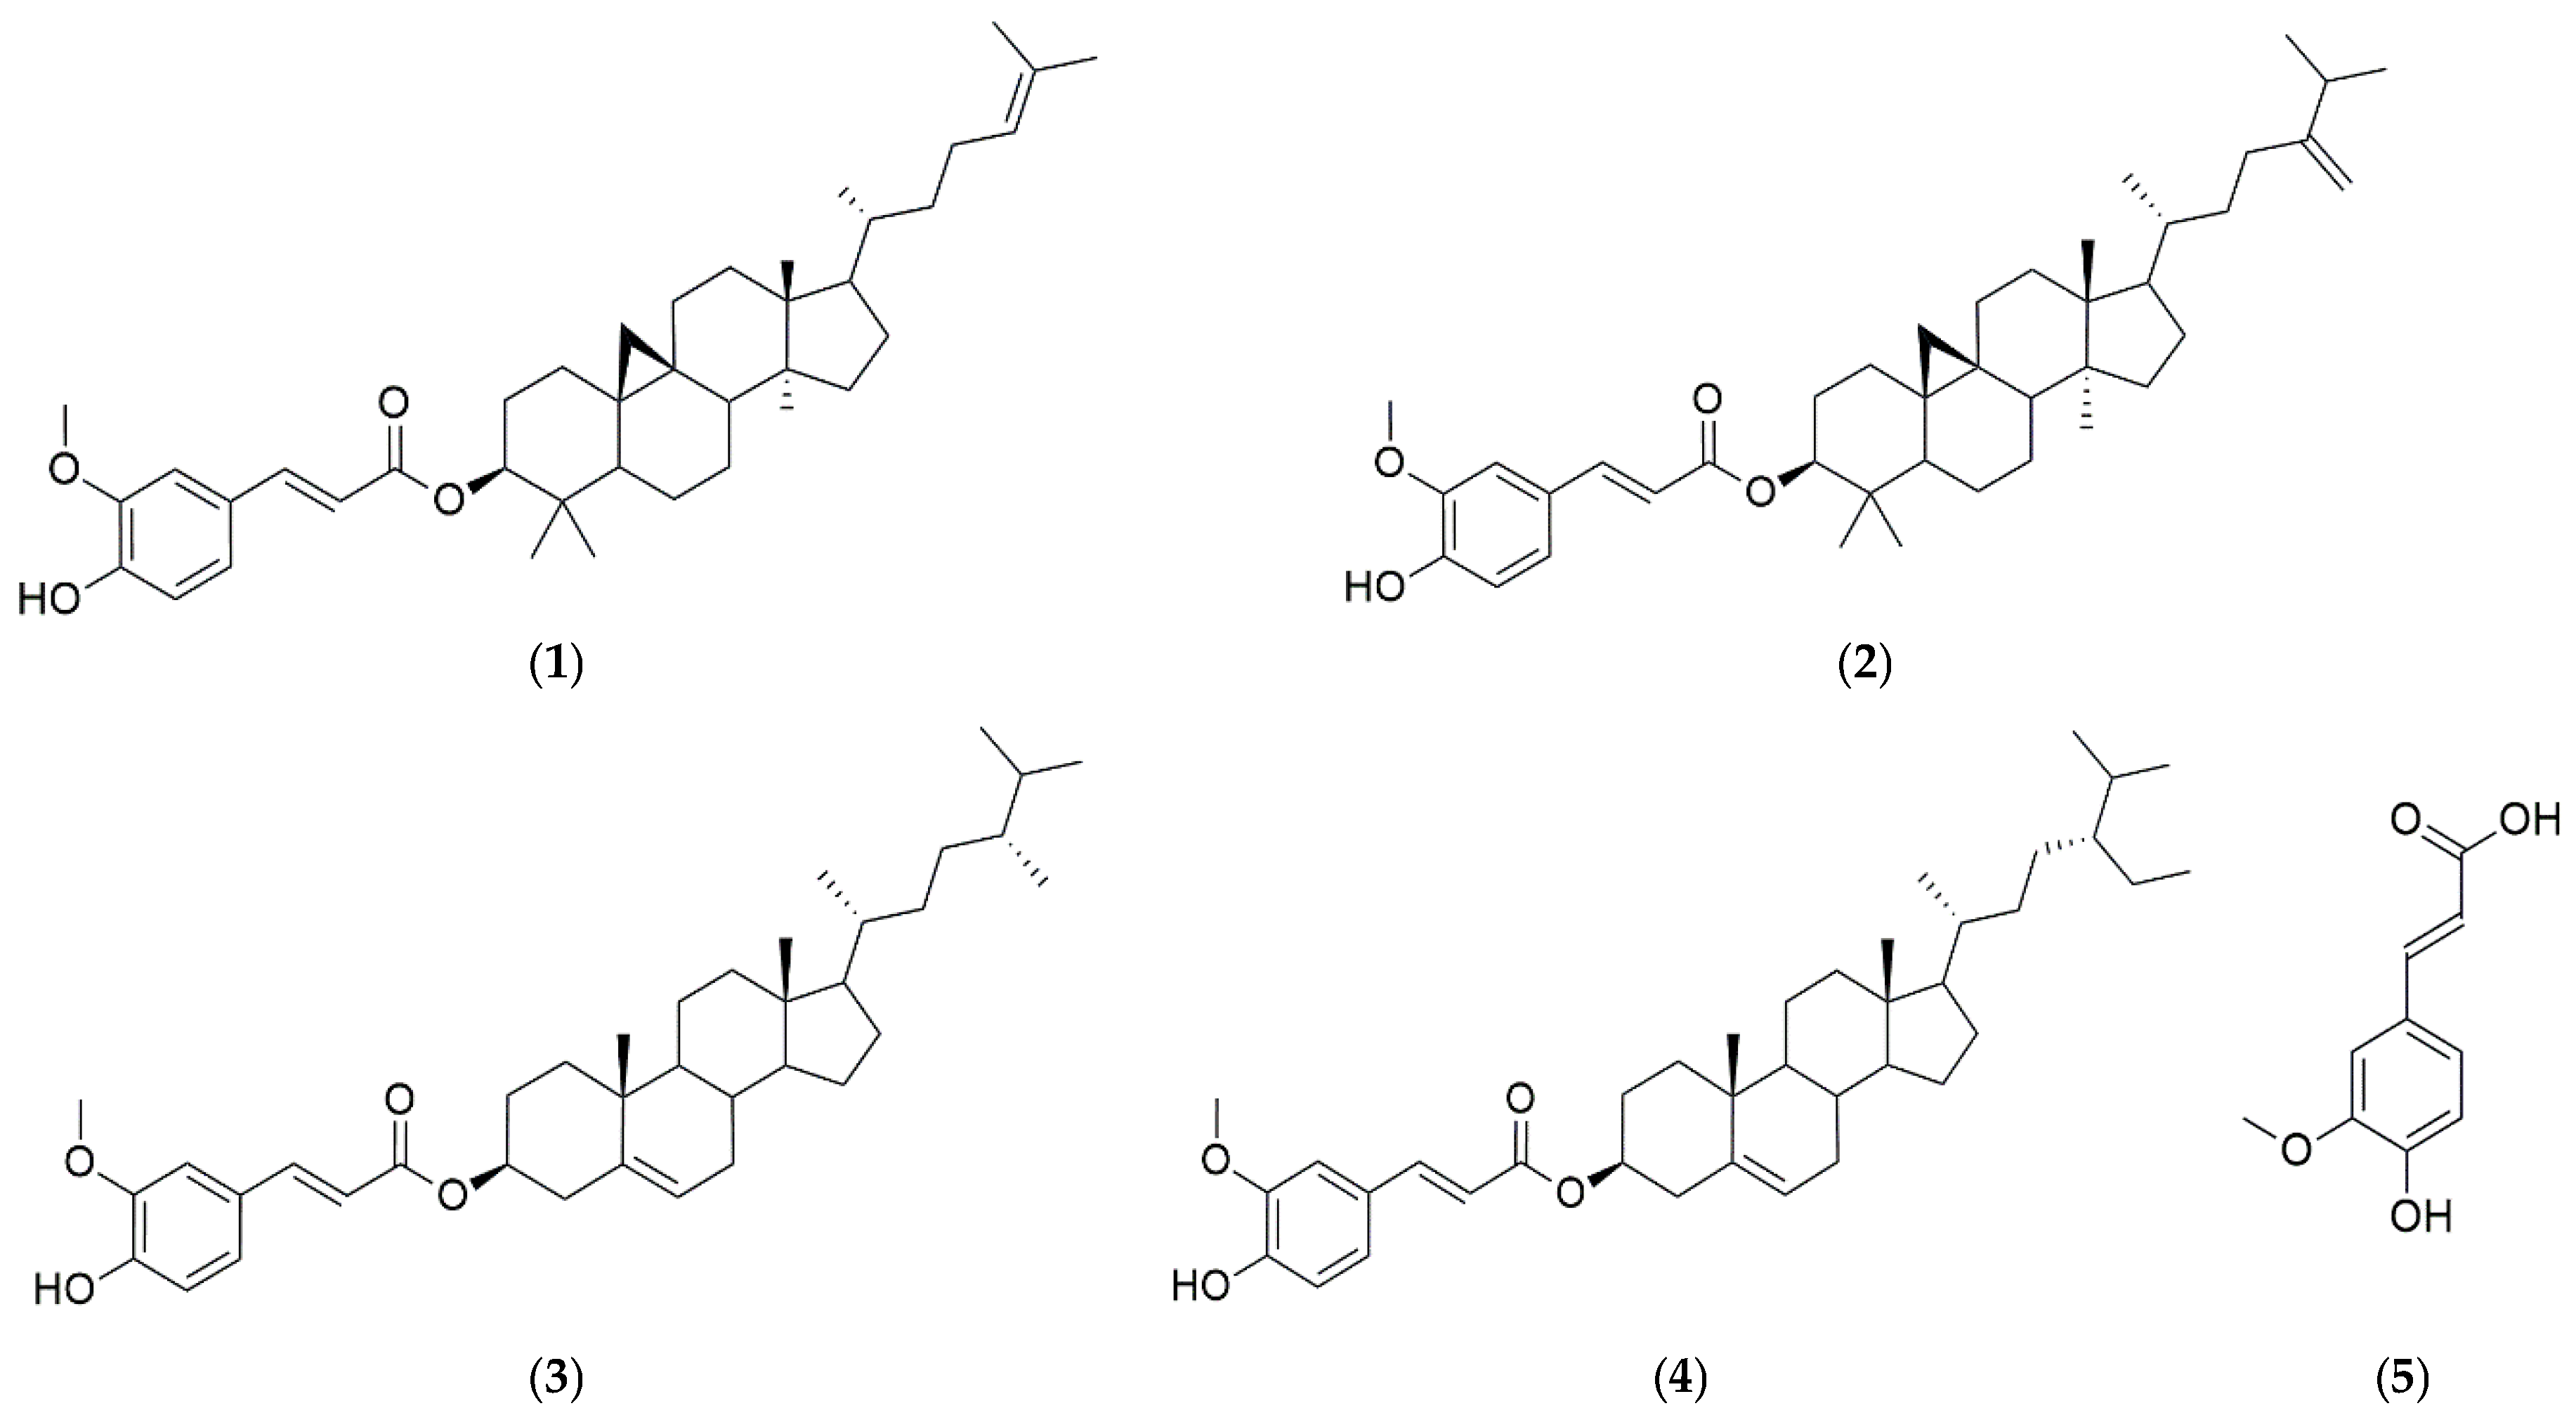
HPLC-grade water, acetonitrile (ACN), methanol (MeOH), and ethanol (EtOH) were purchased from J. T. Baker (Phillipsburg, PA, USA), while acetic acid was obtained from Thermo Fisher Scientific (Loughborough, Leics, UK). The amino acid analyzer buffer (PF-1, 2, 3, 4, RG) was purchased from Hitachi High-Tech Science Corporation (Tokyo, Japan) and used as the elution buffer for free amino acid analysis, while the Wako Ninhydrin Coloring Solution Kit from Wako Chemicals (Richmond, VA, USA) was used as the coloring solution. The phenol reagent developed using Folin & Ciocalteu, aluminum chloride hexahydrate, and sodium carbonate was purchased from Sigma-Aldrich (Saint Louis, MO, USA). Tannic acid (Catalog No. 403040) and quercetin (Catalog No. Q4951) were also purchased from Sigma-Aldrich (Saint Louis, MO, USA). The compounds 2,2′-azino-bis-(3-ethylbenzothiazoline-6-sulfonic) acid (ABTS) and 2,2-diphenyl-1-picrylhydrazyl (DPPH) were obtained from Thermo Fisher Scientific Inc. (Waltham, MA, USA). Standards for γ-oryzanol (CAS No. 11042-64-1, 99.96%) and ferulic acid (CAS No. 1135-24-6, 99.99%) were obtained from Natural Product Institute of Science and Technology (www.nist.re.kr, accessed on 11 July 2024), Anseong, Korea (Figure 2).
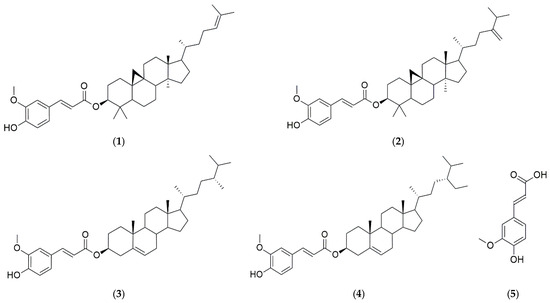
Figure 2.
Chemical structures of γ-oryzanol [oryzanol A (1), oryzanol C (2), campesteryl ferulate (3), and sitosteryl ferulate (4)], and ferulic acid (5).
2.3. Instruments
A Waters Alliance 2695 Separations Module (Milford, MA, USA), equipped with a Waters 2489 UV/Vis Detector (Milford, CT, USA), was used to analyze γ-oryzanol via high-performance liquid chromatography (HPLC) with ultraviolet (UV) detection, and separation was conducted using a YMC Pack Pro C18 column (4.6 × 250 mm, 5 μm) that was purchased from YMC Co., Ltd. (Asan, Republic of Korea). An HPLC system (Agilent Technologies 1260 Infinity II Quat Pump, Santa Clara, CA, USA) equipped with an Agilent Variable Wavelength (VW) UV Detector (Santa Clara, CA, USA) was used for analyzing ferulic acid, employing the same C18 column used for γ-oryzanol analysis. A Hitachi L-8900 Amino Acid Analyzer from Hitachi High-Tech Science Corporation (Tokyo, Japan) equipped with Hitachi HPLC Packed Column (#2622PF, 4.6 × 60 mm), which is an ion exchanging column, was used for analyzing free amino acids (Eyela, Tokyo, Japan).
2.4. Extraction of Pigmented and Non-Pigmented Rice Samples
Six pigmented and non-pigmented rice varieties (NKH, NKS, H709, H1601, HJJ, and HCS) were ground into a fine powder. Ten grams of each powdered sample was extracted using a Soxhlet reflux extractor with 200 mL of ethanol (EtOH). This extraction procedure was chosen as per the comparison of brown rice extraction methods conducted by Cho et al. and repeated three times for each sample to maximize yield [19]. Subsequently, the collected extracts were concentrated to dryness using a rotary evaporator.
2.5. Total Phenolic Contents
The total phenolic contents assay was conducted by referring to a previously performed study [20]. To measure total phenolic contents, 10 mg of EtOH extract from pigmented and non-pigmented rice was dissolved in 5 mL of deionized water to prepare the test solution. Tannic acid was used as the standard compound, with 1 mg dissolved in deionized water and sequentially diluted to create a calibration curve. Three concentrations of the extracts were selected for analysis based on the standard curve. The working solution of sodium carbonate was prepared by mixing 7.5 g of sodium carbonate with 92.5 g of distilled water. A volume of 60 µL of the test or standard solution was added to a 96-well plate, followed by the addition of 40 µL of 2N of the phenol reagent using Folin–Ciocalteu and 100 µL of 7.5% sodium carbonate solution. The mixture was incubated in the dark for 30 min to facilitate color development. Subsequently, absorbance was measured at 760 nm using a microplate reader (BioTek, Winooski, VT, USA).
2.6. Total Flavonoid Contents
Quercetin was used as the standard for the total flavonoid content assay, which was conducted using a method described in a previous study [20]. One milligram of quercetin was dissolved in 80% EtOH to prepare the standard solution. Similarly, 10 mg of the EtOH extracts from pigmented and non-pigmented rice were dissolved in 5 mL of 80% EtOH to prepare the test solutions. The working solution of 2% aluminum chloride hexahydrate reagent was prepared by mixing 6 g of aluminum chloride hexahydrate in 294 g of distilled water. A volume of 100 μL of the test solution or the standard solution was added to a 96-well plate, followed by the addition of 100 μL of 2% aluminum chloride hexahydrate reagent. Subsequently, the plate was incubated in the dark for 10 min to prevent light-induced degradation, while the absorbance was measured at a wavelength of 430 nm using a microplate reader. The total flavonoid contents were calculated based on three different concentrations of the test solution and the standard calibration curve.
2.7. ABTS•+ Radical-Scavenging Activity
A total of 50 milligrams of pigmented and non-pigmented rice EtOH extracts were dissolved in 1 mL of MeOH and subsequently filtered through a polyvinylidene fluoride (PVDF) filter to prepare the test solution. The ABTS•+ stock solution was prepared by dissolving the reagents in water to a final volume of 100 mL, resulting in concentrations of 7.4 mM of ABTS and 2.6 mM of potassium persulfate. The solution was stored in darkness at 4 °C for 24 h before use. Six milliliters of the stock solution was then diluted with 260 mL of water to create the ABTS•+ working solution. Before being used, the absorbance was kept at 4 °C and adjusted to around 1.0 at 734 nm via further dilution if needed. In a 96-well plate, 10 µL of each sample was added, followed by the addition of 200 µL of the ABTS•+ working solution. For the blank sample, 200 µL of water was used instead of the ABTS•+ working solution. After incubating the plate in the dark for 30 min, the optical density (OD) was measured at a wavelength of 734 nm using a microplate reader. Ascorbic acid solution in water was diluted to concentrations of 200, 160, 120, 80, and 40 µg/mL and was used as a positive control.
2.8. DPPH• Radical-Scavenging Activity
To measure the DPPH• radical-scavenging activity of the pigmented and non-pigmented rice extracts, 50 mg of EtOH extract was dissolved in 1 mL of EtOH and filtered through a PVDF filter to prepare the test solutions. The DPPH• working solution of 0.2 mM was prepared prior to the experiment. Subsequently, 10 µL of each test solution was added to a 96-well plate, followed by the addition of 200 µL of DPPH• working solution. The plate was incubated in the dark for 30 min, after which the OD was measured at a wavelength of 514 nm using a microplate reader.
2.9. Preparation Conditions for Free Amino Acid Analysis
Prior to analyzing free amino acids, 100 µL of the free amino acid standard solution and 100 µL of the test solution were each transferred into separate test tubes. Subsequently, 1 mL of ninhydrin reagent and 1 mL of PF-1 buffer were added to each tube. Subsequently, the mixtures were boiled at 100 °C for 30 min. Absorbance was measured at a wavelength of 570 nm, and the absorbance values of the test solutions were compared to those of the standard solution to determine the appropriate dilution rate.
2.10. Preparation of Standard and Sample Solutions for Three HPLC Analyses
To analyze γ-oryzanol and ferulic acid, 30 mg of pigmented and non-pigmented rice extracts were dissolved in 2 mL of EtOH and filtered through a PVDF filter to prepare the test solutions. One milligram each of γ-oryzanol and ferulic acid standards was dissolved in 1 mL of EtOH to prepare the standard solutions. To analyze free amino acids, the sample solutions were subsequently diluted at a 1:100 ratio. The pigmented and non-pigmented rice extracts were first dissolved in distilled water and deproteinized using an equal volume of 5% trichloroacetic acid (TCA) to remove interfering substances such as proteins and peptides. Next, the solution was treated with n-hexane to remove non-polar substances, including lipids and pigments, and subsequently filtered through a 0.2 µm syringe filter to obtain the final test solutions.
2.11. HPLC Determination of γ-Oryzanol, Ferulic Acid, and Free Amino Acids
The quantitative analysis of γ-oryzanol and ferulic acid was conducted using a YMC Pack Pro C18 column (4.6 × 250 mm, 5 μm). The HPLC conditions for both analyses were established with a flow rate of 1 mL/min, an injection volume of 10 µL, and a column oven temperature of 35 °C. However, the analyses were conducted separately since different mobile phases were utilized. The methods to analyze γ-oryzanol and ferulic acid were set by referring to or modifying previously analyzed studies [21,22]. For γ-oryzanol, the detection wavelength was set to 325 nm (UV max). MeOH (A) and ACN (B) were used as the mobile phase in a gradient elution system. The elution gradient of a 45 min process was programmed as follows: 50% A at 0 min, 65% A at 10 min, 100% A at 20 min, 55% B at 25 min, and 50% A from 30 to 45 min. γ-Oryzanol was detected in a retention time of 25.5, 28.0, 30.5, and 34.7 min. The quantification was performed by summing the peak areas of these four components. To analyze ferulic acid, the detection wavelength was set to 324 nm (UV max). The mobile phases comprised 0.25% acetic acid in water (A) and ACN (B). The gradient elution parameters of a 50 min process were as follows: 90% A from 0 to 5 min, 70% A at 20 min, 50% A at 25 min, 100% B from 30 to 35 min, and 90% A from 40 to 50 min. Ferulic acid was detected in a retention time of 20.1 min. The analysis of free amino acids was conducted using a post-reaction method with ninhydrin reagent. Two pumps were used in the system: the first pump facilitated buffer elution, while the mobile phase comprised six solvents: PF-1 (B1), PF-2 (B2), PF-3 (B3), PF-4 (B4), water (B5), and PF-RG (B6). The second pump was employed for reagent elution utilizing a mobile phase composed of three solvents: ninhydrin reagent (R1), Nin-Buffer (R2), and 5% EtOH (R3). The gradient elution system for the buffer solution was programmed as follows: 100% B1 from 0 to 22.9 min, 80% B1 and 20% B2 at 23.0 min, 70% B1 and 30% B2 at 35.6 min, 10% B1 and 90% B2 from 35.7 to 46.2 min, 100% B2 from 46.3 to 53.7 min, 100% B3 from 53.8 to 73.9 min, 60% B1 and 40% B4 from 74.0 to 79.7 min, 100% B4 from 79.8 to 87.2 min, 20% B2 and 80% B4 from 87.3 to 105.8 min, 100% B6 from 119.7 to 129.2 min, and 100% B1 from 129.3 to 157.3 min. The flow rate was maintained at 0.35 mL/min for the analysis. The gradient elution system for the reagent was programmed as follows: 50% R1 and 50% R2 from 0 to 123.3 min, 100% R3 from 123.4 to 133.9 min, and 50% R1 and 50% R2 from 134.0 to 157.3 min. The flow rate for the reagent system was set at 0.30 mL/min. The column temperature was adjusted using a gradient program as follows: 38 °C at 0 min, decreasing to 30 °C at 2.1 min, gradually increasing to 60 °C at 23.0 min, decreasing to 40 °C at 38.8 min, then rising to 70 °C at 53.7 min, decreasing to 45 °C at 98.3 min, and finally adjusting to 38 °C from 132.9 to 157.3 min.
2.12. Limit of Detection (LOD) and Limit of Quantification (LOQ)
The LOD and LOQ were used to validate the HPLC method employed. The LOD and LOQ were determined by fitting the calibration curve of the reference compound using the standard deviation values of the slope (S) and the intercept (σ). The LOQ indicates the smallest quantity of the analyte that can be measured with respectable repeatability and accuracy, whereas the LOD indicates the lowest concentration or amount of the analyte that can be consistently separated from the baseline. The following formulae were used to determine the LOD and LOQ values: LOD = 3.3 (σ/S) and LOQ = 10 (σ/S).
2.13. Calibration Curves
To construct a calibration curve (Table 1), the γ-oryzanol solution was sequentially diluted to concentrations of 250, 125, 62.5, 31.2, 15.6, and 7.8 ppm. Similarly, the ferulic acid solution was sequentially diluted to concentrations of 7.8, 3.9, 2.0, 1.0, 0.5, and 0.2 ppm. The contents of γ-oryzanol and ferulic acid (mg/g) were calculated using the following formula:
where C = standard concentration (ppm), V = total volume of the test solution (mL), D = dilution factor, P = purity of the standard, and W = weight of the sample (g).

Table 1.
Calibration curves of phytochemicals.
The X-axis of the calibration curve represents the standard concentration (µg/L), while the Y-axis denotes the area under the standard peak (AU, mAU). The contents of γ-oryzanol and ferulic acid were calculated by comparing the area under the standard peak to the area under each sample peak.
2.14. Statistical Analysis
The results of experiments are exhibited as the mean and standard deviation. Minitab 16 software (Minitab LCC, State College, PA, USA) was utilized to evaluate the statistical significance, with an analysis of variance (ANOVA) for comparison of mean differences within multiple groups, followed by Duncan’s multiple range test for identifying specific group variations. Parametric tests were utilized to provide statistical strength when the presumptions of results were satisfied.
3. Results
3.1. Total Phenolic and Flavonoid Contents
Total phenolic and flavonoid content assays were conducted to provide an overview of the chemical composition (Table 2). The results showed that NKH exhibited the highest levels of total polyphenols and flavonoids, measuring 26.5 mg of tannic acid equivalent (TAE)/g and 9.5 mg of quercetin equivalent (QE)/g of extract, respectively. H709 exhibited the second-highest total polyphenol contents, measuring 19.0 mg TAE/g of extract and total flavonoid contents of 7.4 mg QE/g of extract. In contrast, NKS exhibited the lowest total polyphenol contents at 6.2 mg TAE/g of extract but demonstrated relatively high flavonoid contents at 8.3 mg QE/g of extract. The total polyphenol contents for H1601, HJI, and HCS were 15.7 mg TAE/g, 13.5 mg TAE/g, and 17.8 mg TAE/g of extract, respectively. Their total flavonoid contents were measured at 4.9 mg QE/g, 5.8 mg QE/g, and 7.7 mg QE/g of extract.
Table 2.
Total polyphenol and flavonoid contents in six pigmented and non-pigmented rice varieties.
3.2. Antioxidant Activity
To assess the bioactive properties of the pigmented and non-pigmented rice varieties, ABTS•+ and DPPH• radical-scavenging assays were conducted (Table 3). Consistent with the phenolic and flavonoid content analyses, NKH demonstrated the highest scavenging activity for both radicals, with IC50 values of 1.34 mg/mL and 2.51 mg/mL for ABTS•+ and DPPH•, respectively. Furthermore, H709 and HCS exhibited significant antioxidant capacities, though less pronounced than NKH, indicating their potential application in health-promoting functional foods. HCS exhibited the second-highest ABTS•+ scavenging activity (IC50, 1.78 mg/mL); however, its DPPH•-scavenging activity was relatively low (IC50, 3.41 mg/mL). In contrast, NKS exhibited the lowest scavenging activity for both radicals, with IC50 values of 13.14 mg/mL and 35.77 mg/mL for ABTS•+ and DPPH•, respectively.
Table 3.
ABTS•+ and DPPH• radical-scavenging activities of six pigmented and non-pigmented rice varieties.
3.3. Contents of γ-Oryzanol and Ferulic Acid
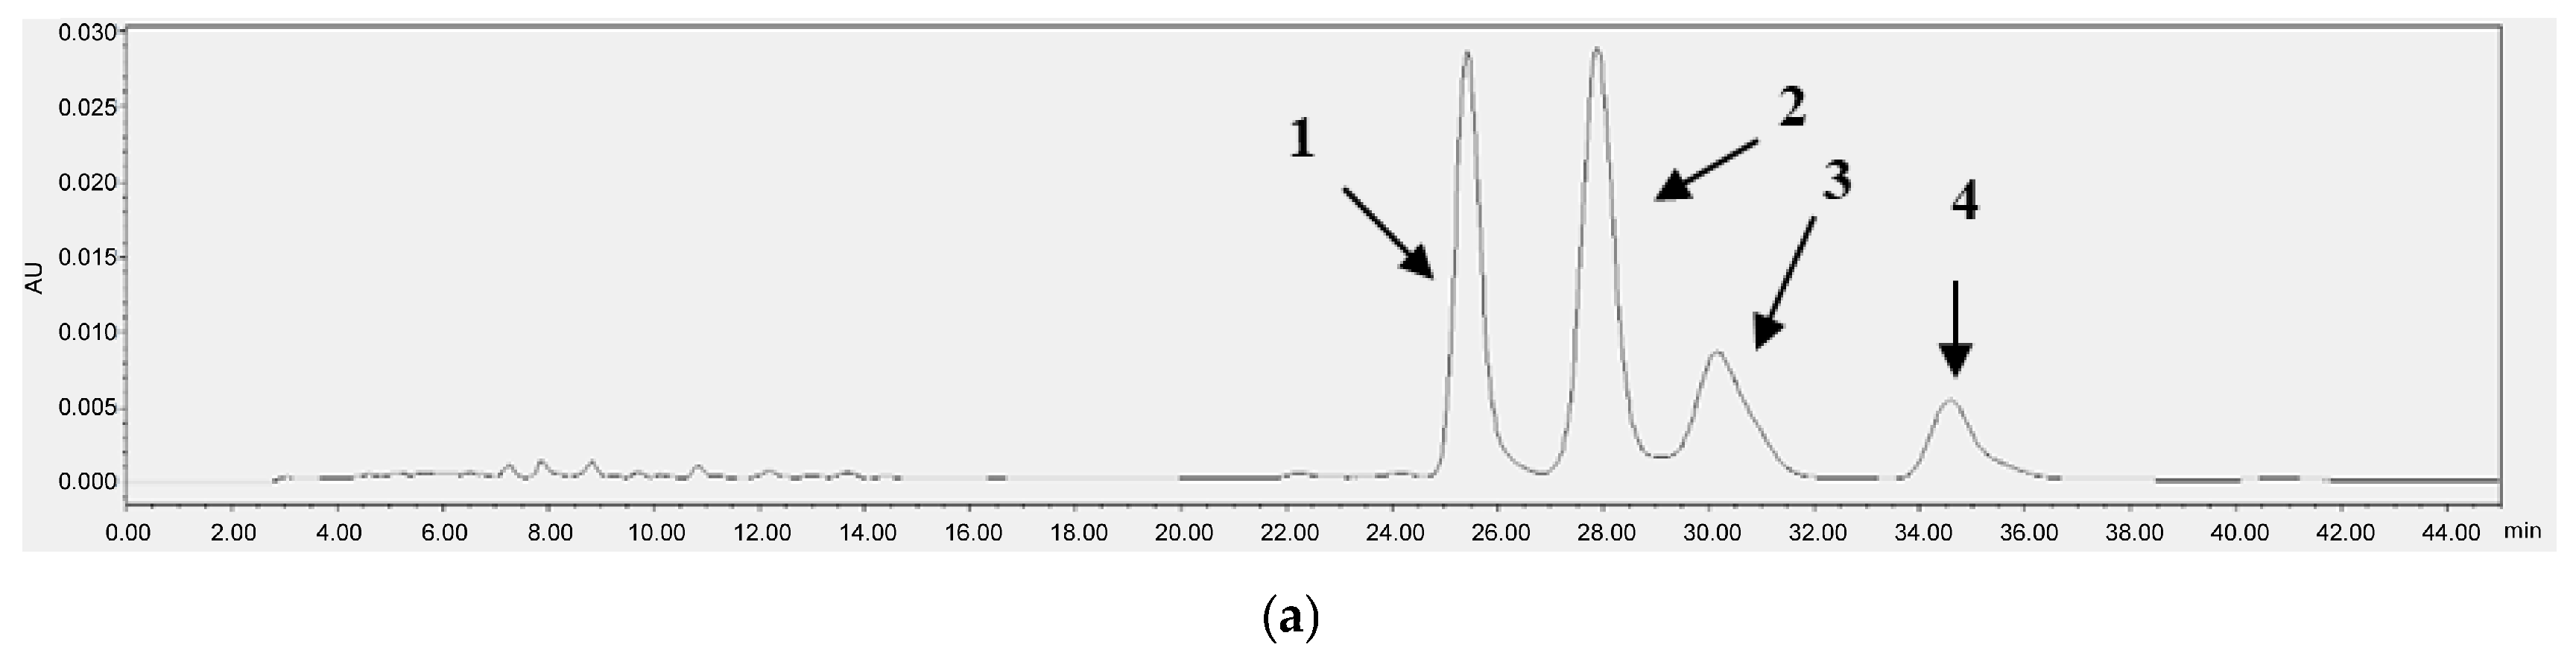
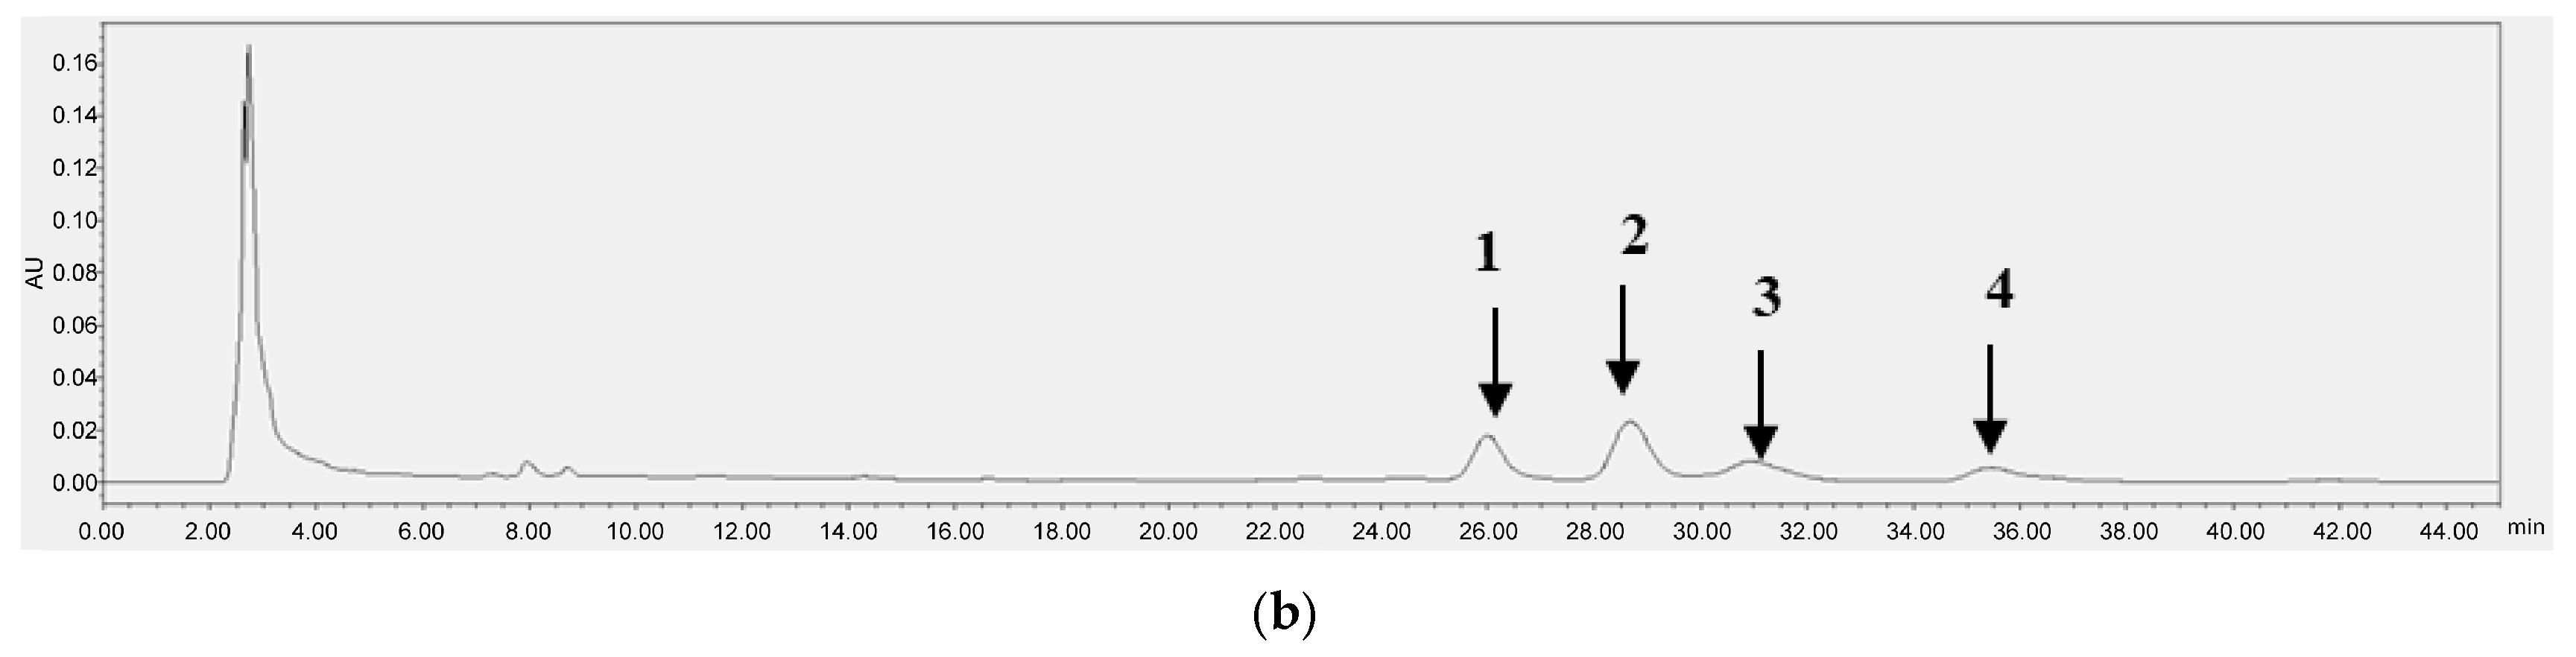
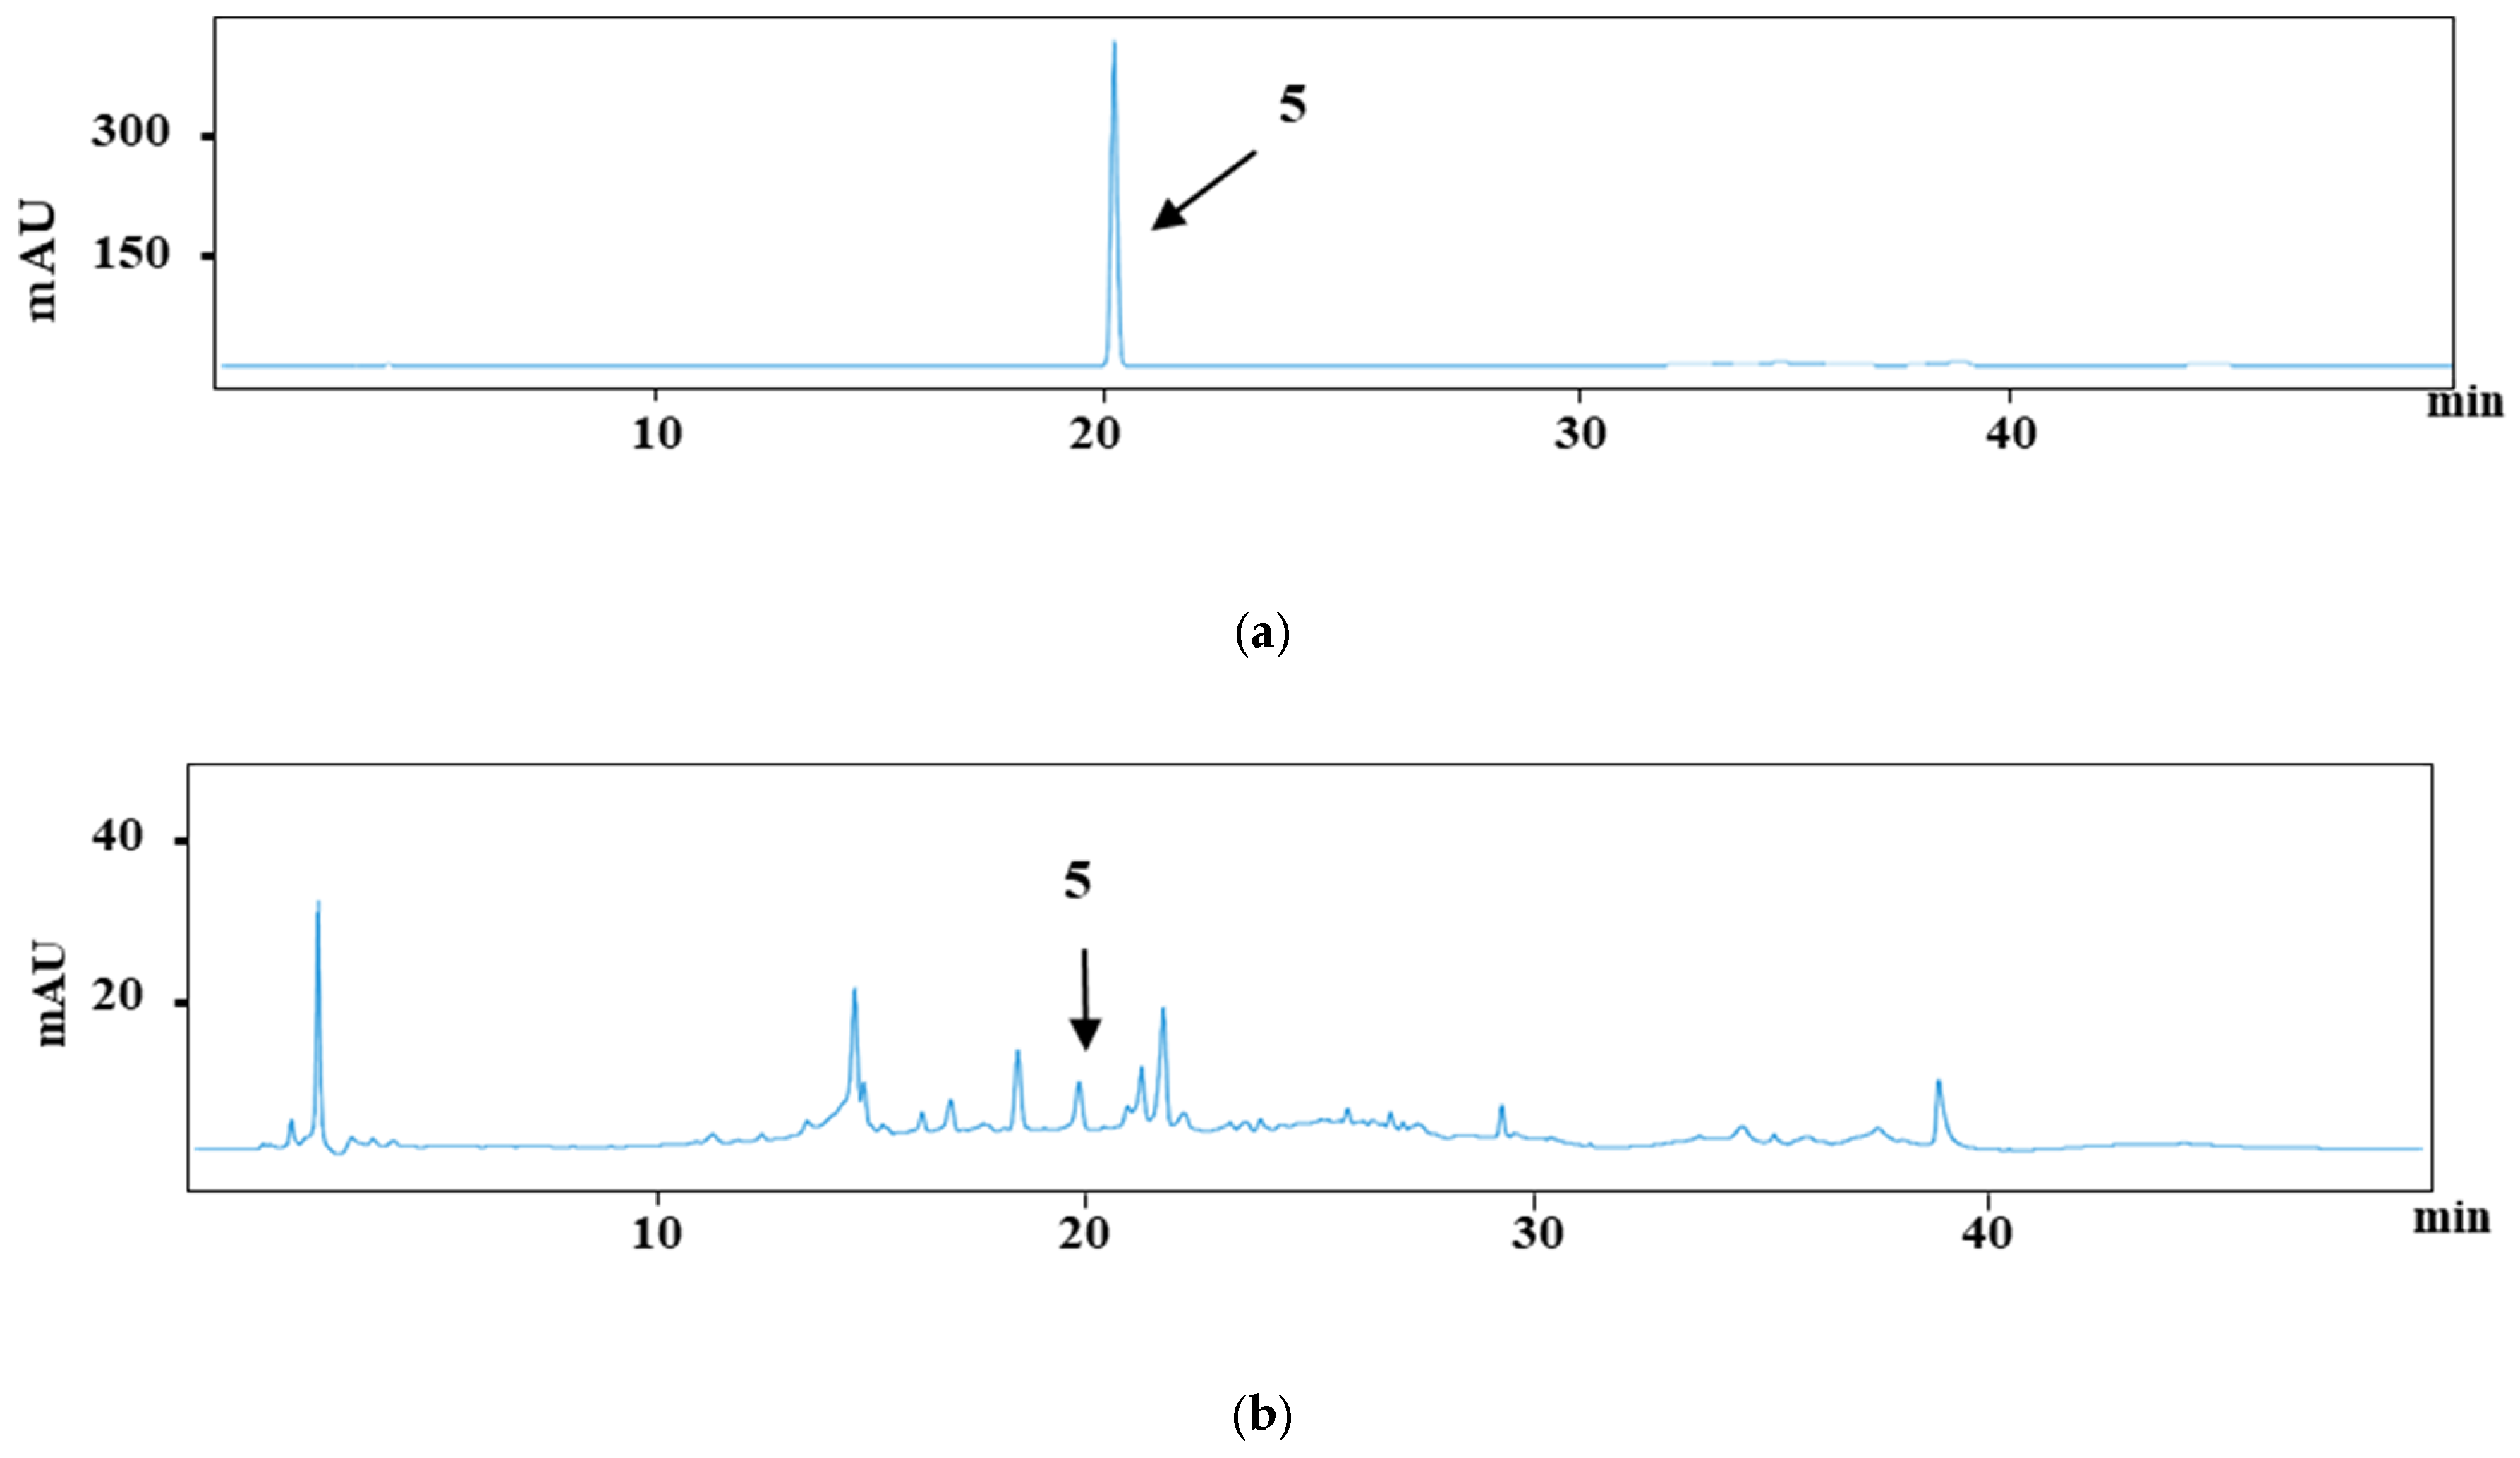
Figure 3 and Figure 4 each present the chromatograms of γ-oryzanol, ferulic acid, and the samples. This study revealed the ferulic acid contents in pigmented and non-pigmented rice (Figure 4), ranging from 0.020 mg/g to 0.044 mg/g. The calibration curves of standards exhibited good linearity. In this study, NKH exhibited the highest γ-oryzanol contents (10.625 mg/g), followed by H709 (8.270 mg/g), NKS (6.972 mg/g), HJJ (5.224 mg/g), H1601 (5.086 mg/g), and HCS (4.058 mg/g) (Table 4).
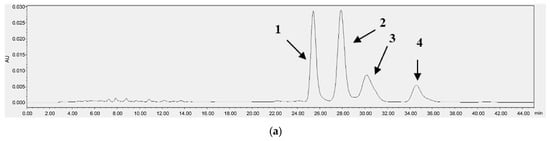

Figure 3.
HPLC chromatograms of γ-oryzanol [oryzanol A (1), 25.5 min; oryzanol C (2), 28.0 min; campesteryl ferulate (3), 30.5 min; sitosteryl ferulate (4), 34.7 min] (a) and NKH (b).
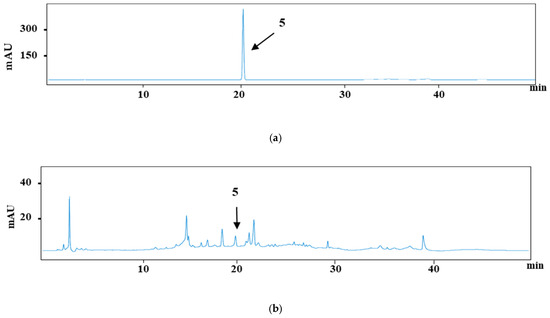
Figure 4.
HPLC chromatograms of ferulic acid (5) (20.1 min) (a) and H709 (b).
Table 4.
γ-Oryzanol and ferulic acid contents in six pigmented and non-pigmented rice varieties.
H709 exhibited the highest contents at 0.044 mg/g, followed by H1601 (0.037 mg/g), NKS (0.033 mg/g), HJJ (0.029 mg/g), NKH (0.025 mg/g), and HCS (0.020 mg/g) (Table 4). The results showed that our analytical technique was very sensitive, with the LOD of γ-oryzanol and ferulic acid being 0.161 μg/mL and 0.019 μg/mL, respectively, and the LOQ being 0.489 μg/mL and 0.057 μg/mL, respectively.
3.4. Free Amino Acid Contents
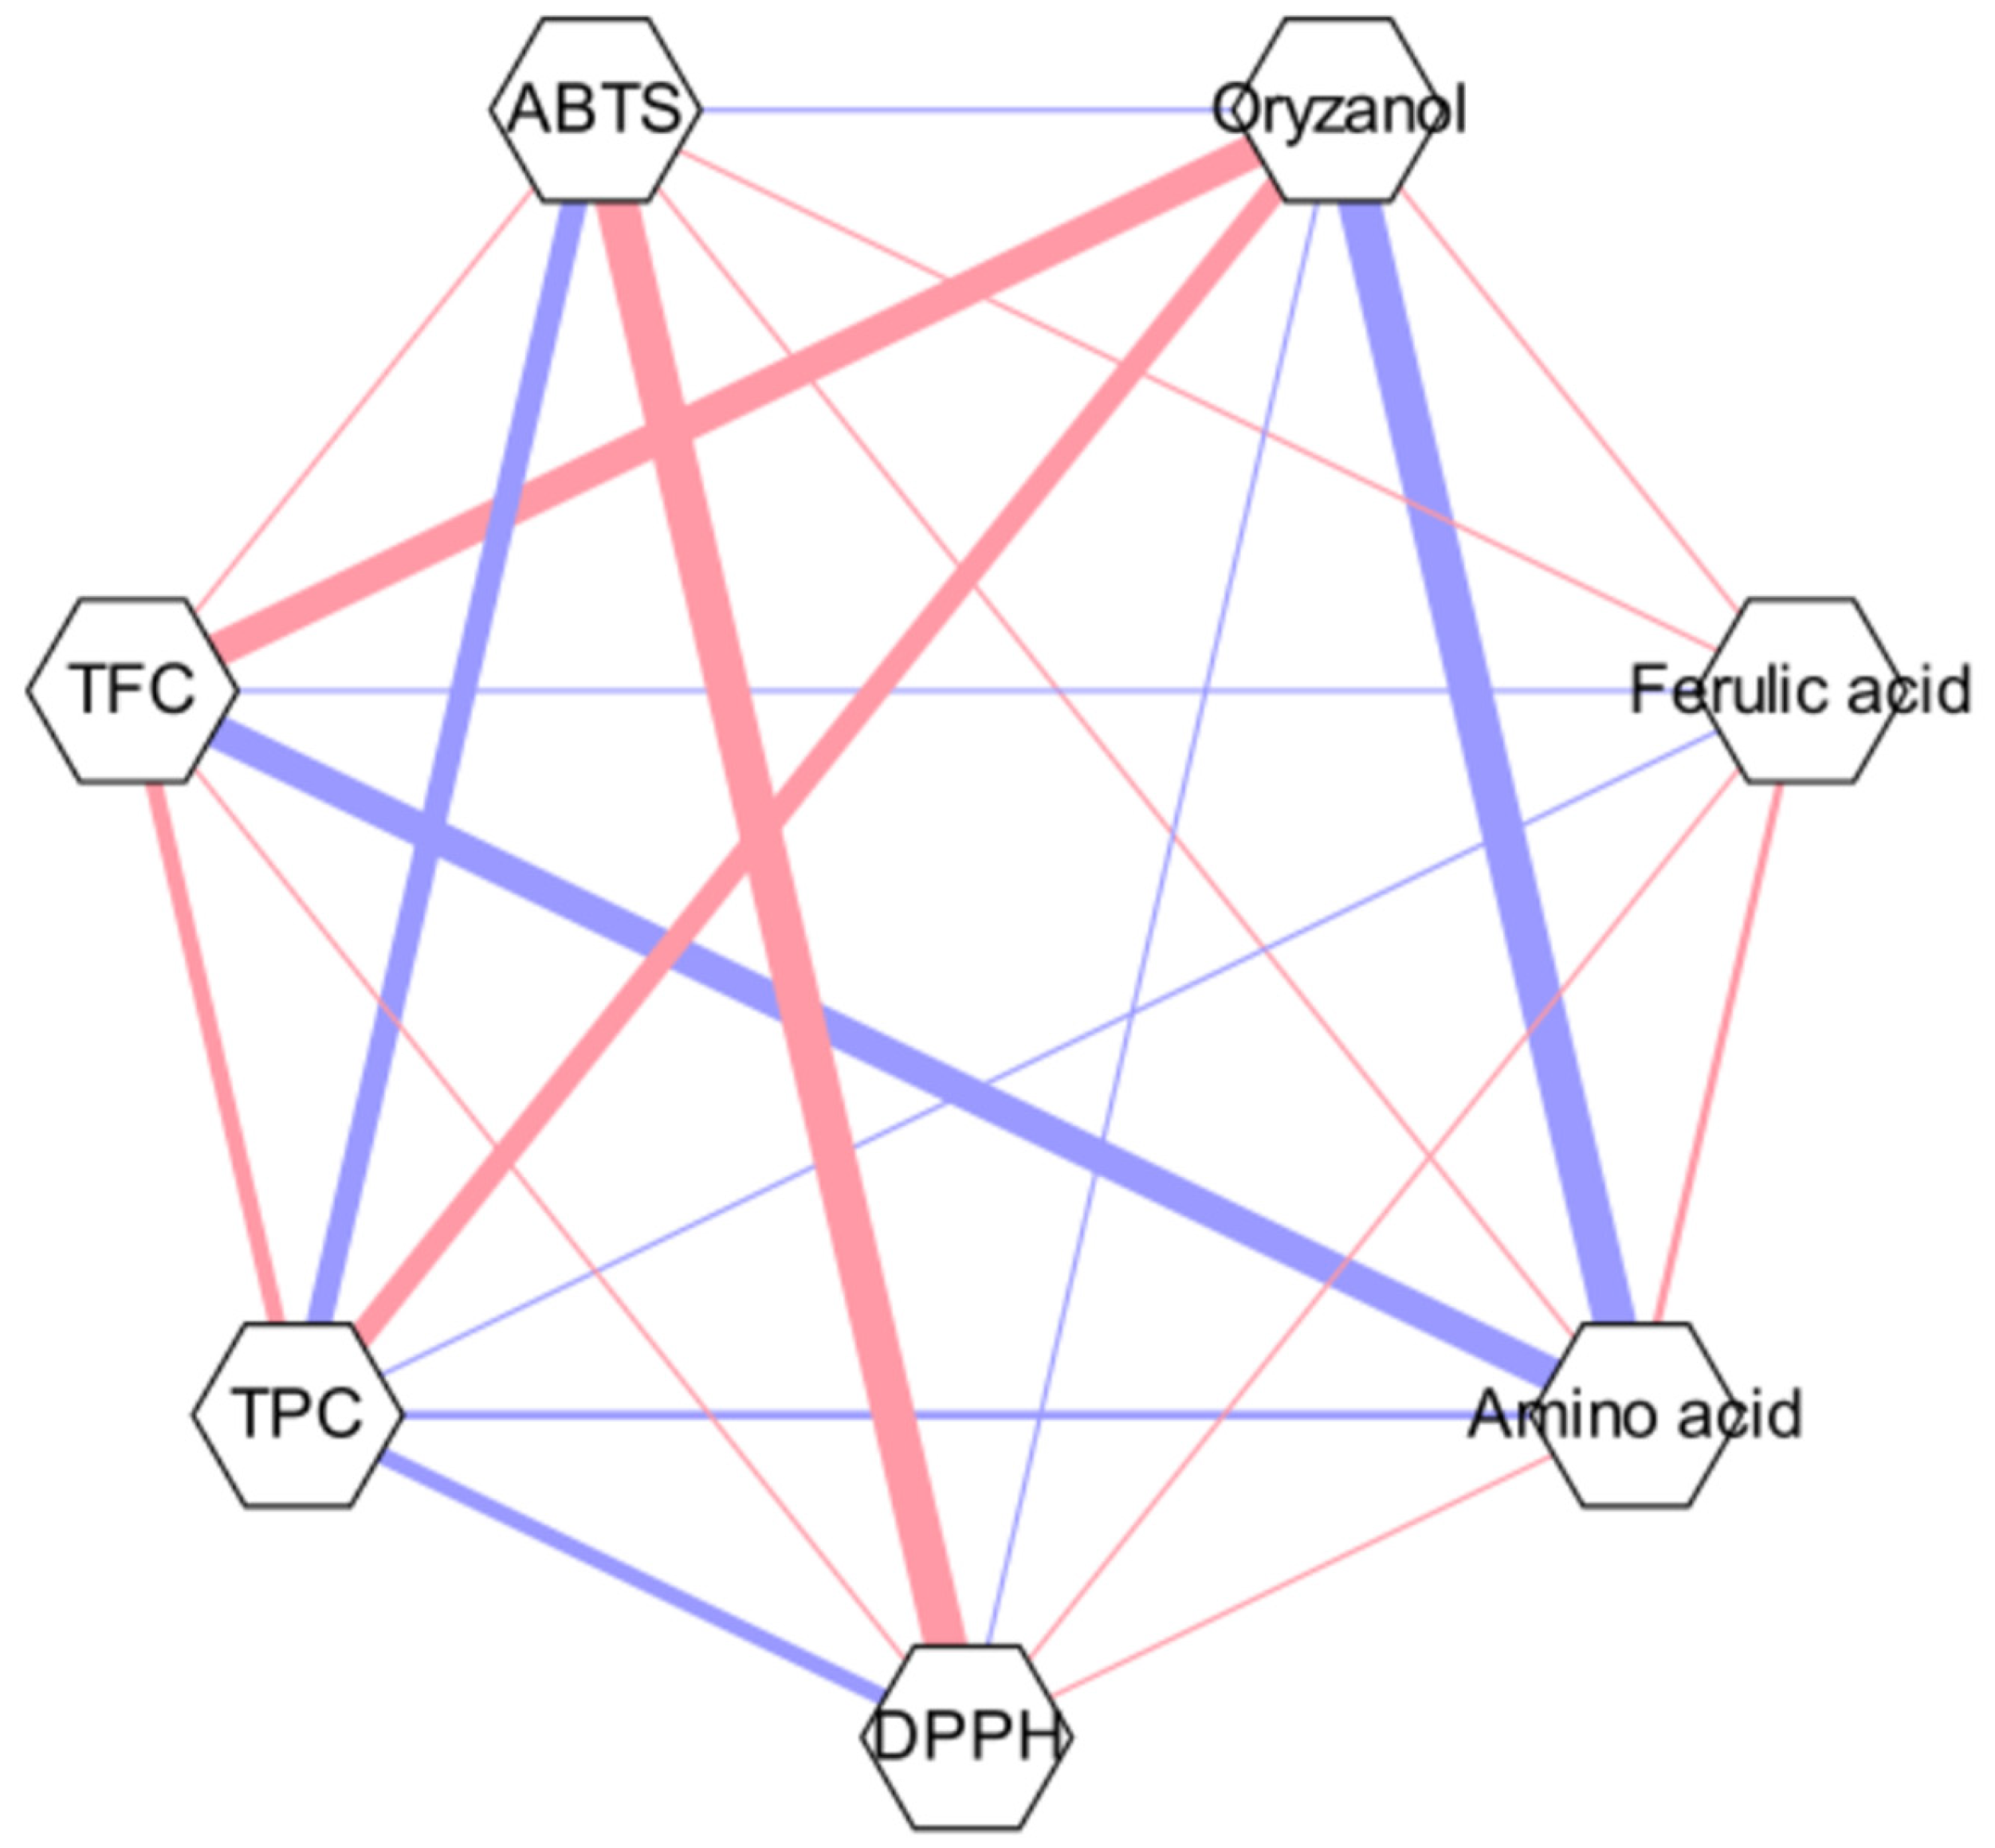
The results of the free amino acid analysis showed the total contents of 37 free amino acid compounds (Table 5). A strong correlation was observed between the ABTS•+ and DPPH• radical-scavenging activities alongside free amino acids and γ-oryzanol, according to the result of Pearson’s coefficient (Figure 5), where the relationship between each two metrics is represented by thick lines.
Table 5.
Free amino acid contents in six pigmented and non-pigmented rice varieties.

Figure 5.
Pearson’s correlation coefficient network.
H1601 exhibited the highest total free amino acid contents of 281.169 µg/g, comprising 37 free amino acids, followed by HCS (263.715 µg/g), JHH (261.455 µg/g), H709 (242.375 µg/g), NKS (222.471 µg/g), and NKS (139.913 µg/g). The γ-aminobutyric acid (GABA) contents ranged from 3.432 µg/g to 12.508 µg/g, with NKS showing a concentration of 12.508 µg/g, followed by HCS (10.140 µg/g), H1601 (7.330 µg/g), HJJ (5.895 µg/g), and NKH (3.948 µg/g). H709 exhibited the lowest GABA contents (3.432 µg/g).
4. Discussion
This study offers a comprehensive analysis of the chemical composition and bioactive properties of six newly cultivated pigmented and non-pigmented rice varieties, including NKH, NKS, H709, H1601, HJJ, and HCS. Significant differences were observed in the levels of phenolic compounds, flavonoids, γ-oryzanol, and free amino acids among these varieties, which were closely associated with their antioxidant capacities. Studies have explored strategies to expand the market for pigmented and non-pigmented rice, such as through organic labeling and the promotion of its nutritional health benefits [23].
The radical-scavenging results suggest that NKH possesses potent antioxidant properties, which may contribute to reducing oxidative stress and preventing chronic diseases associated with oxidative damage, such as cardiovascular diseases, cancer, and neurodegenerative disorders [24]. Similar findings were reported in other studies. For example, Samyor et al. demonstrated that two red rice cultivars exhibited stronger radical-scavenging activities against DPPH• and hydrogen peroxide than a white rice cultivar [18]. Similarly, Biswas et al. reported that black rice exhibited the highest radical-scavenging activities, followed by red and white rice, which has been assumed to be an effect of phenolic compounds such as anthocyanins and non-phenolic compounds [25]. This result is consistent with the observation that NKH exhibited stronger radical scavenging activity compared to H709, H1601, HJJ, and HCS, so if further comparison with the results of white rice varieties is made, similar trends are expected as well.
γ-Oryzanol, a mixture of ferulic acid esters and phytosterols, comprises essential components such as cycloartenyl ferulate, 24-methylenecycloartanyl ferulate, campesteryl ferulate, and sitosteryl ferulate [26]. Rice bran is known as the richest natural source of γ-oryzanol [27]. Several studies have highlighted its health benefits, including antioxidant [28] and antiadipogenic effects [29]. It reduced lipid accumulation and the activity of glycerol-3-phosphate dehydrogenase in adipocytes [29]. These findings align with those of previous studies highlighting the potential of γ-oryzanol to reduce oxidative damage, improve insulin sensitivity, and inhibit lipid accumulation, thereby offering various health benefits. This suggests that NKH, in particular, may serve as a valuable source of γ-oryzanol for developing dietary supplements or nutraceuticals targeting conditions such as diabetes and obesity. Previously, Tsuzuki et al. analyzed the γ-oryzanol contents of 20 samples of colored rice from Japan and found that the average contents of the black-purple, red, green, and brown varieties were 54.2, 47.3, 44.3, and 43.3 mg of γ-oryzanol equivalent/100 g of dry weight [30]. In comparison, the results of the current study exhibited higher overall contents, and although the highest contents were found in NKH, the γ-oryzanol contents of NKS were higher than H1601, HJJ, and HCS, which is different from the previous study results.
Ferulic acid, a derivative of caffeic acid, is known to be rich in foods and vegetables [31,32,33]. Its antioxidant potential has been related to its molecular structure, particularly the presence of an unsaturated side chain [34]. A study on 12 Thai rice varieties revealed that the total free phenolic contents in the husks of pigmented rice varieties (1.08–2.56 mg of gallic acid equivalent/g of extract) were higher than those of non-pigmented varieties (0.69–1.06 mg gallic acid equivalent/g of extract), especially because of ferulic acid [35]. Based on the results, it is predicted that the samples would be higher in ferulic acid as well as total phenolic contents if compared to white rice varieties in the current study as well. Therefore, if the study were to add a comparison with white rice varieties for further research, the differences would be more clearly visible.
Among free amino acids, GABA is known to be induced in response to stress factors in flooded soils, such as oxygen deficiency, and is found in rice [36,37]. GABA is recognized for its various bioactive functions, including enhancing immunity, exhibiting hypotensive activity, and playing roles in brain function [38]. Additionally, GABA modulates the immune system by triggering or suppressing cytokine production [39,40]. This study demonstrated that the GABA contents were relatively low across all rice varieties when measured against γ-oryzanol and ferulic acid levels, with NKS exhibiting the highest GABA contents. While the lower levels of GABA observed in these rice samples were unexpected, the bioavailability and health benefits associated with even small amounts of GABA should not be underestimated. Future studies should investigate the factors influencing GABA contents in pigmented rice, such as cultivation conditions, soil quality, and genetic variations, to enhance understanding of how to optimize its levels.
Aspartic acid was found to be particularly abundant in H1601 (54.947 µg/g), and it has been studied for its role as a neurotransmitter [41]. Glutamic acid, which has been studied to possess a relationship with umami taste, was found in relatively high contents in HJJ (32.087 µg/g) and HCS (26.333 µg/g) [42]. Alanine is a compound that is known for its impact on glucose metabolism and has been found to be the highest in H1601 (74.384 µg/g) and HCS (72.396 µg/g) [43].
The correlations between the chemical composition and functional characteristics are expressed as Pearson’s correlation coefficient network (Figure 5). The red color indicates a positive correlation, while the blue color indicates a negative correlation. For instance, a strong correlation was found between the two radical scavenging results. Such a trend was also found in a previous study of spring barley and malt, where malt (2.7–3.0 μmol/g for ABTS and 1.8–2.6 μmol/g for DPPH) tended to possess higher total antioxidant capacity ranges for both radicals compared to spring barley (2.1–2.5 μmol/g for ABTS and 1.2–1.7 μmol/g for DPPH) [44].
γ-Oryzanol and free amino acids also exhibited a correlation, which can be related to the effect of oryzanol in free amino acid metabolism, which can result in concentration differences [45]. However, contrary to expectations, it was found that the results of γ-oryzanol contents and both radical scavenging activities in the current study have not shown a strong correlation. Such results also contradict the results found by Lee et al., where significant positive relationships were seen between antioxidant activity and γ-oryzanol contents [46]. Since there have been numerous studies regarding the mechanism between the two, this phenomenon has been assumed to be related to the synergistic and antagonistic effects of the mixture of different compounds [47]. Since γ-oryzanol is a mixture of four compounds, its antioxidant activity may vary depending on its specific interaction with other compounds. However, research on exactly what kind of relationship exists is still limited. Therefore, further study regarding the antioxidant mechanisms, interactions with compounds, and methodological differences in extraction as well is needed to clarify such effects.
These findings offer valuable insights into the current understanding of the nutritional and functional properties of pigmented rice, particularly the lesser-known cultivars examined in this study. The diversity in bioactive compound contents among these rice varieties highlights their potential for targeted applications in health applications. For example, varieties rich in phenolic and flavonoid compounds, such as NKH, may be particularly effective in products designed to enhance antioxidant defenses. In contrast, rice varieties with higher levels of γ-oryzanol could be developed for metabolic health applications. This study is significant and distinct from previous studies because NKH consistently exhibited the highest values for total polyphenol and flavonoid contents, radical-scavenging activity, and γ-oryzanol contents.
Therefore, this study highlights the potential for this lesser-known variety of rice to be used in the food industry and beyond. However, this study has some limitations. The analysis primarily focused on chemical composition and in vitro bioactive properties, which, while valuable, do not fully capture the complex interactions that may occur in human physiology. We recognize that a direct comparison with previously studied varieties or white rice as a control would provide additional context, even though the focus of this study is on the characterization of newly cultivated pigmented rice varieties. Future research should include such comparisons to better understand the influence of pigmentation on chemical composition and antioxidant activity. Additionally, this study did not account for potential environmental factors, such as soil quality, weather conditions, and agricultural practices, which may significantly affect the levels of bioactive compounds in rice. Further research is required to assess these factors and their effect on the levels of bioactive compounds. Future studies should incorporate clinical trials to validate the health benefits observed in vitro and to explore the bioavailability and metabolism of these compounds in the human body. Investigating the synergistic effects of different bioactive compounds present in pigmented rice could offer novel insights into their interactions and the resulting health benefits. Additionally, examining the effect of different processing methods (such as cooking, fermentation, or milling) on the stability and efficacy of these bioactive compounds could further enhance the utilization of pigmented rice in the food industry [48,49,50]. Regardless of embryo size, pigmented rice possesses unique components inherent to its variety. The content of bioactive compounds in large-embryo pigmented rice is higher than when the rice is either only large-embryo or only pigmented. Furthermore, while anthocyanins are key flavonoids that are responsible for the pigmentation in rice, the current study primarily focuses on γ-oryzanol, ferulic acid, and free amino acids. Also, the various colors of the samples have also been anticipated as a result of carotenoids. Therefore, the quantification of anthocyanins and carotenoids would be considered in future research to provide a more comprehensive analysis of pigmented rice varieties.
5. Conclusions
This study presents a comprehensive analysis of the chemical composition and bioactive properties of six newly cultivated varieties of pigmented and non-pigmented rice: NKH, NKS, H709, H1601, HJJ, and HCS. Among these, NKH consistently exhibited the highest levels of phenolic compounds, flavonoids, and γ-oryzanol, alongside the strongest antioxidant activities, which emphasizes the role of bioactive compounds in determining functional properties, indicating its potential as a valuable functional food ingredient. These findings underscore the correlation between bioactive compound contents and antioxidant activity, demonstrating that higher levels of these compounds contribute to enhanced radical scavenging properties. These findings suggest that NKH, along with other promising varieties such as H709 and HCS, may be particularly effective in health applications targeting oxidative stress and related chronic diseases. Contrary to earlier research, the data showed no significant correlation between γ-oryzanol levels and radical scavenging activities. Our results imply that various synergistic or antagonistic effects among bioactive substances may impact the total radical scavenging capacity, even if other studies have demonstrated a strong positive association between γ-oryzanol and antioxidant activity. To elucidate the reasons behind these variances, future research should look more closely at these relationships. Clinical trials should be used to confirm the health effects of bioactive compounds and investigate how cultivation conditions affect their amounts. Additionally, examining the effects of different processing techniques may maximize their application in nutraceuticals and functional meals, boosting their economic viability. Future research should investigate the effects of cultivation conditions and processing methods on bioactive compound levels while conducting clinical trials to validate these health benefits in human models.
Author Contributions
Investigation, N.Y. and Y.K.; resources, J.H.C.; data curation, J.H.C.; writing—original draft, S.L.; Writing—review & editing, S.L. All authors have read and agreed to the published version of the manuscript.
Funding
This work was supported by the National Research Foundation of Korea (NRF) grant funded by the Korea government (MSIT) (RS-2024-00343462) and the Natural Product Institute of Science and Technology (2025), Republic of Korea.
Data Availability Statement
The original contributions presented in the study are included in the article; further inquiries can be directed to the corresponding author.
Acknowledgments
We express our gratitude to Sandeul Agro Farm (Gwangju, Republic of Korea) for generously gifting the six rice variety samples.
Conflicts of Interest
The authors declare no conflicts of interest.
References
- Chaudhari, P.R.; Tamrakar, N.; Singh, L.; Santhakumar, A.B. Rice nutritional and medicinal properties: A review article. J. Pharmacogn. Phytochem. 2018, 7, 150–156. [Google Scholar]
- Son, J.S.; Do, V.B.; Kim, K.O.; Cho, M.S.; Suwonsichon, T.; Valentin, D. Understanding the effect of culture on food representations using word associations: The case of “rice” and “good rice”. Food Qual. Prefer. 2014, 31, 3848. [Google Scholar] [CrossRef]
- Khan, M.N.; Ali, S.; Yaseen, T.; Ullah, S.; Zaman, A.; Iqbal, M.; Shah, S. Eco-taxonomic study of family Poaceae (Gramineae). RADS J. Biol. Res. Appl. Sci. 2020, 10, 63–75. [Google Scholar] [CrossRef]
- Jeong, O.Y.; Park, H.S.; Baek, M.K.; Kim, W.J.; Lee, G.M.; Lee, C.M.; Bombay, M.; Ancheta, M.B.; Lee, J.H. Review of rice in Korea: Current status, future prospects, and comparisons with rice in other countries. J. Crop Sci. Biotechnol. 2020, 24, 1–11. [Google Scholar] [CrossRef]
- Nigudenm, B.A.; Hashim, M.; Shamsudin, R.; Che Man, H. Rice for food security: Revisiting its production, diversity, rice milling process and nutrient content. Agriculture 2022, 12, 741. [Google Scholar] [CrossRef]
- Amagliani, L.; O’Regan, J.; Kelly, A.L.; O’Mahony, J.A. The composition, extraction, functionality and applications of rice proteins: A review. Trends Food Sci. Technol. 2017, 64, 1–12. [Google Scholar] [CrossRef]
- Samyor, D.; Das, A.B.; Deka, S.C. Pigmented rice a potential source of bioactive compounds: A review. Int. J. Food Sci. Technol. 2017, 52, 1073–1081. [Google Scholar]
- Mbanjo, E.G.N.; Kretzschmar, T.; Jones, H.; Ereful, N.; Blanchard, C.; Boyd, L.A.; Sreenivasulu, N. The genetic basis and nutritional benefits of pigmented rice grain. Front. Genet. 2020, 11, 229. [Google Scholar] [CrossRef]
- Lee, H.Y.; Cho, D.Y.; Jeong, J.B.; Lee, J.H.; Lee, G.Y.; Jang, M.Y.; Lee, J.H.; Cho, K.M. Chemical compositions before and after lactic acid fermentation of isoflavone-enriched soybean leaves and their anti-obesity and gut microbiota distribution effects. Nutrients 2024, 16, 1693. [Google Scholar] [CrossRef]
- Zhao, S.; Fu, S.; Cao, Z.; Liu, H.; Huang, S.; Li, C.; Zhang, Z.; Yang, H.L.; Wang, S.; Luo, J.; et al. OsUGT88C3 encodes a UDP-glycosyltransferase responsible for biosynthesis of malvidin 3-O-galactoside in rice. Plants 2024, 13, 697. [Google Scholar] [CrossRef]
- Xia, D.; Zhou, H.; Wang, Y.; Li, P.; Fu, P.; Wu, B.; He, Y. How rice organs are colored: The genetic basis of anthocyanin biosynthesis in rice. Crop J. 2021, 9, 598–608. [Google Scholar] [CrossRef]
- Lakshmi, S.; Goudar, G.; Singh, M.; Dhaliwal, H.S.; Sharma, P.; Longvah, T. Variability in resistant starch, vitamins, carotenoids, phytochemicals and in-vitro antioxidant properties among diverse pigmented grains. J. Food Meas. Charact. 2021, 15, 2774–2789. [Google Scholar] [CrossRef]
- Irakli, M.N.; Samanidou, V.F.; Katsantonis, D.N.; Biliaderis, C.G.; Papadoyannis, I.N. Phytochemical profiles and antioxidant capacity of pigmented and non-pigmented genotypes of rice (Oryza sativa L.). Cereal Res. Commun. 2016, 44, 98–110. [Google Scholar] [CrossRef]
- Callcott, E.T.; Blanchard, C.L.; Snell, P.; Santhakumar, A.B. The anti-inflammatory and antioxidant effects of pigmented rice consumption in an obese cohort. Food Funct. 2019, 10, 8016–8025. [Google Scholar] [CrossRef]
- Han, H.B.; Lee, H.W.; Kim, B.S.; Kim, C.M.; Woo, H.G.; Jeong, J.H.; Kim, S.M.; Huh, C.K. Quality and antioxidant characteristics of “Yakju” prepared with pigmented rice flour “Nuruk”. Korean J. Food Preserv. 2021, 28, 240–251. [Google Scholar] [CrossRef]
- Park, J.; Park, H.Y.; Kim, H.S.; Choi, H.S.; Chung, H.J.; Oh, S.K. Effects of using black rice on quality and functional properties of “Dodamssal” rice noodles containing resistant starch. J. Korean Soc. Food Sci. Nutr. 2021, 50, 10401048. [Google Scholar] [CrossRef]
- Rahim, M.A.; Umar, M.; Habib, A.; Imran, M.; Khalid, W.; Lima, C.M.G.; Shoukat, A.; Itrat, N.; Nazir, A.; Ejaz, A. Photochemistry, functional properties, food applications, and health prospective of black rice. J. Chem. 2022, 1, 2755084. [Google Scholar] [CrossRef]
- Samyor, D.; Deka, S.C.; Das, A.B. Phytochemical and antioxidant profile of pigmented and non-pigmented rice cultivars of Arunachal Pradesh, India. Int. J. Food Prop. 2015, 19, 1104–1114. [Google Scholar] [CrossRef]
- Cho, E.K.; Jung, K.I.; Jung, K.I.; Choi, Y.J. Anti-inflammatory and antidiabetic effects of brown rice (Oryza sativa L.). J. Life Sci. 2012, 22, 126–131. [Google Scholar] [CrossRef]
- Lee, C.D.; Yu, H.; Uy, N.P.; Yu, H.; Lee, C.H.; Kim, H.; Lee, S. Phytochemical characterization and bioactive potential of Daphne jejudoensis. Chem. Pap. 2025, 79, 1915–1925. [Google Scholar] [CrossRef]
- Liu, C.; Xi, X.; Liu, Y.; Che, F.; Gu, Y.; Yu, Y.; Li, H.; Liu, J.; Wei, Y. Isolation of four major compounds of γ-oryzanol from rice bran oil by ionic liquids modified high-speed countercurrent chromatography and antimicrobial activity and neuroprotective effect of cycloartenyl ferulate in vitro. Chromatographia 2021, 84, 635644. [Google Scholar] [CrossRef]
- Yoon, N.; Lee, H.D.; Na, U.; Yu, A.R.; Bae, M.J.; Park, G.; Lee, S. Total polyphenol and ferulic acid analysis of a new variety of corn, Bandiburichodang, according to steaming time and roasting temperature. J. Appl. Biol. Chem. 2023, 66, 305–310. [Google Scholar] [CrossRef]
- Ismoyowati, D.; Wuryandani, S.; Wijayanti, F.K. Pigmented rice niche market expansion: Green consumer attitudes and purchase intention to be considered. In International Conference on Sustainable Environment, Agriculture and Tourism (ICOSEAT 2022); Atlantis Press: Paris, France, 2022; pp. 524–531. [Google Scholar] [CrossRef]
- Jomová, K.; Raptova, R.; Alomar, S.Y.; Alwasel, S.; Nepovimova, E.; Kuca, K.; Valko, M. Reactive oxygen species, toxicity, oxidative stress, and antioxidants: Chronic diseases and aging. Arch. Toxicol. 2023, 97, 2499–2574. [Google Scholar] [CrossRef]
- Biswas, S.K.; Kim, D.-E.; Keum, Y.-S.; Saini, R.K. Metabolite profiling and antioxidant activities of white, red, and black rice (Oryza sativa L.) grains. J. Food Meas. Charact. 2018, 12, 2484–2492. [Google Scholar] [CrossRef]
- Minatel, I.O.; Francisqueti, F.V.; Corrêa, C.R.; Lima, G.P.P. Antioxidant activity of γ-oyzanol: A complex network of interactions. Int. J. Mol. Sci. 2016, 17, 1107. [Google Scholar] [CrossRef]
- Sawada, K.; Nakagami, T.; Rahmania, H.; Matsuki, M.; Ito, J.; Mohri, T.; Ogura, Y.; Kuwahara, S.; Hashimoto, H.; Nakagawa, K. Isolation and structural elucidation of unique γ-oryzanol species in rice bran oil. Food Chem. 2021, 337, 127956. [Google Scholar] [CrossRef]
- Toorani, M.R.; Golmakani, M.T. Effect of triacylglycerol structure on the antioxidant activity of γ-oryzanol. Food Chem. 2022, 370, 130974. [Google Scholar] [CrossRef]
- Minatel, I.O.; Lee, Y.M.; Yoon, H.; Yoon, Y.; Han, S.I.; Correa, C.R.; Fecchio, D.; Yeum, K.J. Antiadipogenic activity of γ-oryzanol and its stability in pigmented rice. J. Med. Food 2016, 19, 710–715. [Google Scholar] [CrossRef]
- Mancuso, C.; Santangelo, R. Ferulic acid: Pharmacological and toxicological aspects. Food Chem. Toxicol. 2014, 65, 185–195. [Google Scholar] [CrossRef]
- Choi, J.; Lee, H.-D.; Cho, H.; Lee, C.-D.; Tran, G.H.; Kim, H.; Moon, S.-K.; Lee, S. Antioxidative phenolic compounds from the aerial parts of Cyperus exaltatus var. iwasakii and their HPLC analysis. Appl. Biol. Chem. 2023, 66, 61. [Google Scholar] [CrossRef]
- Kim, H.J.; Shin, K.J.; Kim, H.S.; Kim, D.; Kim, H.J.; Hong, Y.D.; Yoon, K.D. A new bicyclic megastigmane derivative from by-product of ginseng berry extract. Nat. Prod. Sci. 2023, 29, 268–275. [Google Scholar] [CrossRef]
- Pyrzynska, K. Ferulic acid-a brief review of its extraction, bioavailability and biological activity. Separations 2024, 11, 204. [Google Scholar] [CrossRef]
- Butsat, S.; Siriamornpun, S. Phenolic acids and antioxidant activities in husk of different Thai rice varieties. J. Food Sci. Technol. Int. 2010, 16, 329–336. [Google Scholar] [CrossRef]
- Tsuzuki, W.; Komba, S.; Kotake-Nara, E. Diversity in γ-oryzanol profiles of Japanese black-purple rice varieties. J. Food Sci. Technol. 2019, 56, 2778–2786. [Google Scholar] [CrossRef]
- Mancuso, A.; Cristiano, M.C.; Pandolfo, R.; Greco, M.; Fresta, M.; Paolino, D. Improvement of ferulic acid antioxidant activity by multiple emulsions: In vitro and in vivo evaluation. Nanomaterials 2021, 11, 425. [Google Scholar] [CrossRef]
- Ding, J.; Yang, T.; Feng, H.; Dong, M.; Slavin, M.; Xiong, S.; Zhao, S. Enhancing contents of γ-aminobutyric acid (GABA) and other micronutrients in dehulled rice during germination under normoxic and hypoxic conditions. J. Agric. Food Chem. 2016, 64, 1094–1102. [Google Scholar] [CrossRef]
- Diana, M.; Quílez, J.; Rafecas, M. Gamma-aminobutyric acid as a bioactive compound in foods: A review. J. Funct. Foods 2014, 10, 407–420. [Google Scholar] [CrossRef]
- Bhandage, A.K.; Barragan, A. GABAergic signaling by cells of the immune system: More the rule than the exception. Cell. Mol. Life Sci. 2021, 78, 5667–5679. [Google Scholar] [CrossRef]
- Tian, J.; Kaufman, D.L. The GABA and GABA-receptor system in inflammation, anti-tumor immune responses, and COVID-19. Biomedicines 2023, 11, 254. [Google Scholar] [CrossRef]
- D’Aniello, S.; Somorjai, I.; Garcia-Fernàndez, J.; Topo, E.; D’Aniello, A. D-Aspartic acid is a novel endogenous neurotransmitter. FASEB J. 2011, 25, 1014–1027. [Google Scholar] [CrossRef]
- Oruna-Concha, M.J.; Methven, L.; Blumenthal, H.; Young, C.; Mottram, D.S. Differences in glutamic acid and 5′-ribonucleotide contents between flesh and pulp of tomatoes and the relationship with umami taste. J. Agric. Food Chem. 2007, 55, 5776–5780. [Google Scholar] [CrossRef] [PubMed]
- Adeva-Andany, M.M.; Pérez-Felpete, N.; Fernández-Fernández, C.; Donapetry-García, C.; Pazos-García, C. Liver glucose metabolism in humans. Biosci. Rep. 2016, 36, e00416. [Google Scholar] [CrossRef] [PubMed]
- Mareček, V.; Mikyška, A.; Hampel, D.; Čejka, P.; Neuwirthová, J.; Malachová, A.; Cerkal, R. ABTS and DPPH methods as a tool for studying antioxidant capacity of spring barley and malt. J. Cereal Sci. 2017, 73, 4045. [Google Scholar] [CrossRef]
- Yan, S.; Chen, J.; Zhu, L.; Guo, T.; Qin, D.; Hu, Z.; Han, S.; Zhou, Y.; Akan, O.D.; Wang, J.; et al. Oryzanol attenuates high fat and cholesterol diet-induced hyperlipidemia by regulating the gut microbiome and amino acid metabolism. J. Agric. Food Chem. 2022, 70, 6429–6443. [Google Scholar] [CrossRef]
- Lee, J.S.; Farooq, M.; Lee, D.J. Relationship of soluble phenolics and γ-oryzanol contents with antioxidant activity in pigmented rice. Crop Environ. 2011, 2, 8–14. [Google Scholar]
- Chen, X.; Li, H.; Zhang, B.; Deng, Z. The synergistic and antagonistic antioxidant interactions of dietary phytochemical combinations. Crit. Rev. Food Sci. Nutr. 2022, 62, 5658–5677. [Google Scholar] [CrossRef]
- Saubade, F.; Hemery, Y.M.; Guyot, J.P.; Humblot, C. Lactic acid fermentation as a tool for increasing the folate content of foods. Crit. Rev. Food Sci. Nutr. 2016, 57, 3894–3910. [Google Scholar] [CrossRef]
- Syafutri, M.I.; Pratama, F.; Syaiful, F.; Faizal, A. Effects of varieties and cooking methods on physical and chemical characteristics of cooked rice. Rice Sci. 2016, 23, 282–286. [Google Scholar] [CrossRef]
- Zhang, S.; Ma, Q.; Dong, L.; Jia, X.; Liu, L.; Huang, F.; Liu, G.; Sun, Z.; Chi, J.; Zhang, M.; et al. Phenolic profiles and bioactivities of different milling fractions of rice bran from black rice. Food Chem. 2022, 378, 132035. [Google Scholar] [CrossRef]

Disclaimer/Publisher’s Note: The statements, opinions and data contained in all publications are solely those of the individual author(s) and contributor(s) and not of MDPI and/or the editor(s). MDPI and/or the editor(s) disclaim responsibility for any injury to people or property resulting from any ideas, methods, instructions or products referred to in the content. |
© 2025 by the authors. Licensee MDPI, Basel, Switzerland. This article is an open access article distributed under the terms and conditions of the Creative Commons Attribution (CC BY) license (https://creativecommons.org/licenses/by/4.0/).