
Synthesis of Spherical and Layered Ag-SiO2-TiO2/TiO2-Ag Structures


Abstract

1. Introduction
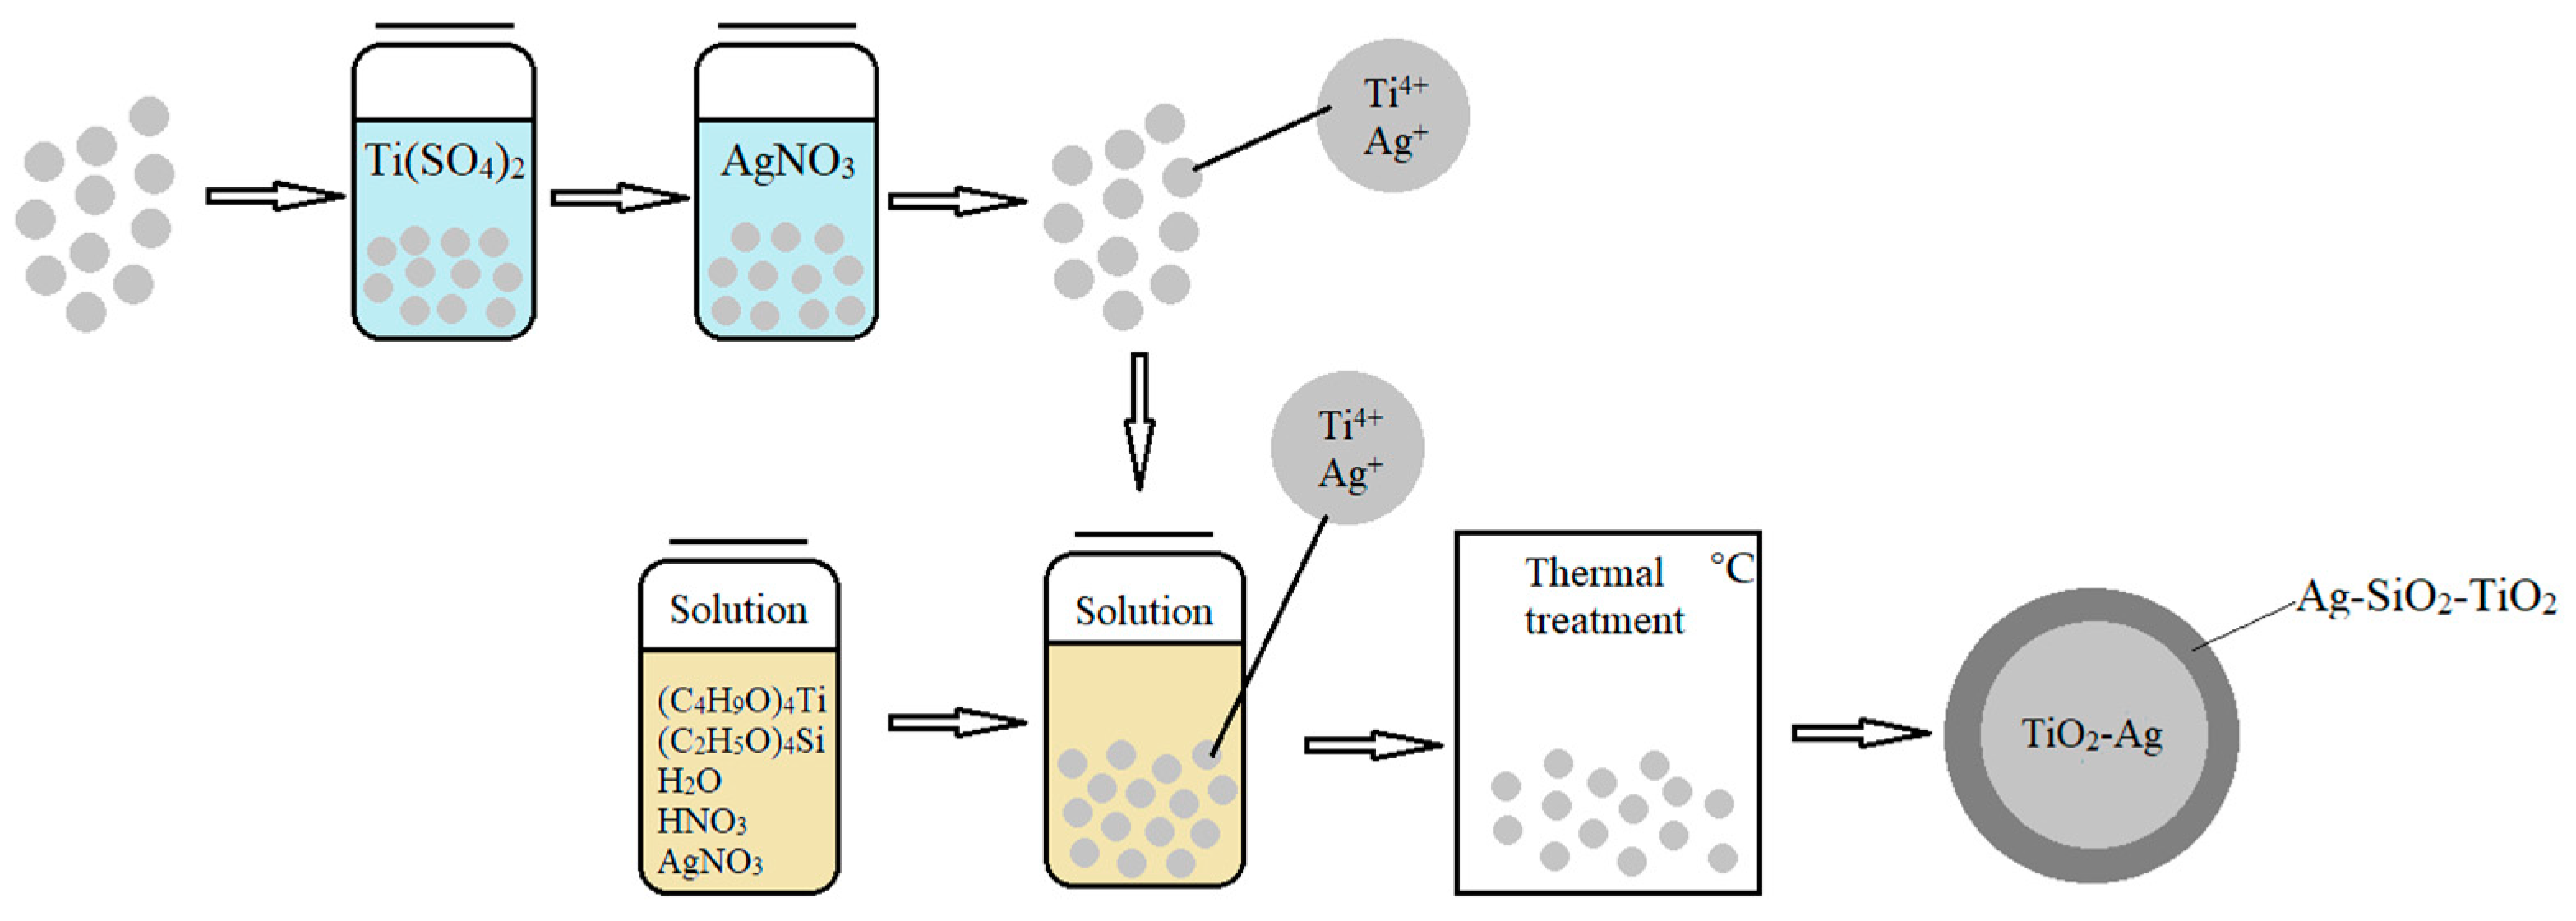
- In the present research work, for obtaining spherical, layered Ag-SiO2-TiO2/TiO2-Ag structures, we developed an approach that combines the sol–gel and template synthesis methods using thermal treatment. This process involves the following steps (Figure 1):
- Spherical template preparation;
- Preparation of stable Ti-Si-Ag-containing film-forming solution and coating the prepared template;
- Thermal treatment.
2. Materials and Methods
2.1. Template Preparation
2.2. Preparation of Ti-Si-Ag-Containing Film-Forming Solution and Its Application on the Prepared Template
2.3. Heat Treatment
2.4. Physicochemical Methods of Analysis
3. Results and Discussion
3.1. Template Preparation
3.2. Preparation of Film-Forming Solution
3.3. Destruction of the Template
4. Conclusions
Author Contributions
Funding
Data Availability Statement
Conflicts of Interest
References
- Lv, Z.; Shang, W. Impacts of intelligent transportation systems on energy conservation and emission reduction of transport systems: A comprehensive review. Green Technol. Sustain. 2023, 1, 100002. [Google Scholar] [CrossRef]
- Ogunkunle, O.; Ahmed, N.A. Overview of Biodiesel Combustion in Mitigating the Adverse Impacts of Engine Emissions on the Sustainable Human–Environment Scenario. Sustainability 2021, 13, 5465. [Google Scholar] [CrossRef]
- Khodaparastan, M.; Mohamed, A.A.; Brandauer, W. Recuperation of regenerative braking energy in electric rail transit systems. IEEE Trans. Intell. Transp. Syst. 2018, 20, 2831–2847. [Google Scholar] [CrossRef]
- Ren, H.; Koshy, P.; Chen, W.-F.; Qi, S.; Sorrell, C.C. Photocatalytic materials and technologies for air purification. J. Hazard. Mater. 2017, 325, 340–366. [Google Scholar] [CrossRef] [PubMed]
- Tee, G.T.; Gok, X.Y.; Yong, W.F. Adsorption of pollutants in wastewater via biosorbents, nanoparticles and magnetic biosorbents: A review. Environ. Res. 2022, 212, 113248. [Google Scholar] [CrossRef]
- Zhu, L.; Shen, D.; Luo, K.H. A critical review on VOCs adsorption by different porous materials: Species, mechanisms and modification methods. J. Hazard. Mater. 2020, 289, 122102. [Google Scholar] [CrossRef] [PubMed]
- Bui, V.K.H.; Nguyen, T.N.; Tran, V.V.; Hur, J.; Kim, I.T.; Park, D.; Lee, Y.-C. Photocatalytic materials for indoor air purification systems: An updated mini-review. Environ. Technol. Innov. 2017, 22, 101471. [Google Scholar] [CrossRef]
- Mamaghani, A.L.; Haghighat, F.; Lee, C.-S. Photocatalytic oxidation technology for indoor environment air purification: The state-of-the-ar. Appl. Catal. B Environ. 2017, 203, 247–269. [Google Scholar] [CrossRef]
- Xiong, L.; Tang, J. Strategies and Challenges on Selectivity of Photocatalytic Oxidation of Organic Substances. Adv. Energy Mater. 2021, 11, 2003216. [Google Scholar] [CrossRef]
- Kang, X.; Liu, S.; Dai, Z.; He, Y.; Song, X.; Tan, Z. Titanium Dioxide: From Engineering to Applications. Catalysts 2019, 9, 191. [Google Scholar] [CrossRef]
- Li, R.; Li, T.; Zhou, Q. Impact of Titanium Dioxide (TiO2) Modification on Its Application to Pollution Treatment—A Review. Catalysts 2020, 10, 804. [Google Scholar] [CrossRef]
- Lettieri, S.; Pavone, M.; Fioravanti, A.; Santamaria Amato, L.; Maddalena, P. Charge Carrier Processes and Optical Properties in TiO2 and TiO2-Based Heterojunction Photocatalysts: A Review. Materials 2021, 14, 1645. [Google Scholar] [CrossRef] [PubMed]
- Ahmed, R.M.; Hasan, I. A review on properties and applications of TiO2 and associated nanocomposite materials. Mater. Today Proc. 2023, 81, 1073–1078. [Google Scholar] [CrossRef]
- Yang, H.; Yang, B.; Chen, W.; Yang, J. Preparation and Photocatalytic Activities of TiO2-Based Composite Catalysts. Catalysts 2022, 12, 1263. [Google Scholar] [CrossRef]
- Nasirian, M.; Lin, Y.P.; Bustillo-Lecompte, C.F.; Mehrvar, M. Enhancement of photocatalytic activity of titanium dioxide using non-metal doping methods under visible light: A review. Int. J. Environ. Sci. Technol. 2018, 15, 2009–2032. [Google Scholar] [CrossRef]
- Deng, Y.; Chen, M.; Chen, G.; Zou, W.; Zhao, Y.; Zhang, H.; Zhao, Q. Visible–Ultraviolet Upconversion Carbon Quantum Dots for Enhancement of the Photocatalytic Activity of Titanium Dioxide. ACS Omega 2021, 6, 4247–4254. [Google Scholar] [CrossRef] [PubMed]
- Jeon, J.-P.; Kweon, D.H.; Jang, B.J.; Ju, M.J.; Baek, J.-B. Enhancing the Photocatalytic Activity of TiO2 Catalysts. Adv. Sustain. Syst 2020, 4, 2000197. [Google Scholar] [CrossRef]
- Kumar, A.; Choudhary, P.; Kumar, A.; Camargo, P.H.C.; Krishnan, V. Recent Advances in Plasmonic Photocatalysis Based on TiO2 and Noble Metal Nanoparticles for Energy Conversion, Environmental Remediation, and Organic Synthesis. Small 2022, 18, 2101638. [Google Scholar] [CrossRef]
- Montoya, A.T.; Gillan, E.G. Enhanced Photocatalytic Hydrogen Evolution from Transition-Metal Surface-Modified TiO2. ACS Omega 2018, 8, 2947–2955. [Google Scholar] [CrossRef] [PubMed]
- Salomatina, E.V.; Fukina, D.G.; Koryagin, A.V.; Titaev, D.N.; Suleimanov, E.V.; Smirnova, L.A. Preparation and photocatalytic properties of titanium dioxide modified with gold or silver nanoparticles. J. Environ. Chem. Eng. 2021, 9, 106078. [Google Scholar] [CrossRef]
- Jung, H.-Y.; Yeo, I.-S.; Kim, T.-U.; Ki, H.-C.; Gu, H.-B. Surface plasmon resonance effect of silver nanoparticles on a TiO2 electrode for dye-sensitized solar cells. Appl. Surf. Sci. 2018, 432, 266–271. [Google Scholar] [CrossRef]
- Low, J.; Qiu, S.; Xu, D.; Jiang, C.; Cheng, B. Direct evidence and enhancement of surface plasmon resonance effect on Ag-loaded TiO2 nanotube arrays for photocatalytic CO2 reduction. Appl. Surf. Sci. 2018, 434, 423–432. [Google Scholar] [CrossRef]
- Kozlov, D.A.; Lebedev, V.A.; Polyakov, A.Y.; Khazova, K.M.; Garshev, A.V. The microstructure effect on the Au/TiO2 and Ag/TiO2 nanocomposites photocatalytic activity. Nanosyst. Phys. Chem. Math. 2018, 9, 266–278. [Google Scholar] [CrossRef]
- Kojima, T.; Sugimoto, H.; Fujii, M. Size-Dependent Photocatalytic Activity of Colloidal Silicon Quantum Dot. J. Phys. Chem. C 2018, 122, 1874–1880. [Google Scholar] [CrossRef]
- Molinari, R.; Lavorato, C.; Argurio, P. Visible-Light Photocatalysts and Their Perspectives for Building Photocatalytic Membrane Reactors for Various Liquid Phase Chemical Conversions. Catalysts 2020, 10, 1334. [Google Scholar] [CrossRef]
- Alalm, M.G.; Djellabi, R.; Meroni, D.; Pirola, C.; Bianchi, C.L.; Boffito, D.C. Toward Scaling-Up Photocatalytic Process for Multiphase Environmental Applications. Catalysts 2021, 11, 562. [Google Scholar] [CrossRef]
- Zharkova, V.V.; Bobkova, L.A.; Bektimirova, C.A.; Kozik, V.V. Sorption of Cobalt(II) and Copper(II) Ions by Highly Cross-Linked Carboxyl Cation Exchangers from Natural Waters with High Salt Background. Adv. Mater. Res. 2015, 1085, 68–73. [Google Scholar] [CrossRef]
- Wang, Y.-J.; Chen, S.C.; Lin, Q.-S.; Zhang, X.-M.; Chen, W.-X. Numerical Simulation and Experimental Verification of the Film-Forming Behavior of Falling Film Flow Down Clamped Channels with High-Viscosity Fluid. Ind. Eng. Chem. Res. 2022, 59, 19698–19711. [Google Scholar] [CrossRef]
- Rogacheva, A.O.; Buzaev, A.A.; Brichkov, A.S.; Khalipova, O.S.; Klestov, S.A.; Paukshtis, E.A.; Kozik, V.V. Catalically active composite material based on TiO2/Cr2O3 hollow spherical particles. Kinet. Catal. 2019, 60, 484–489. [Google Scholar] [CrossRef]
- Haider, J.; Harvianto, G.R.; Qyyum, M.A.; Lee, M. Cost- and Energy-Efficient Butanol-Based Extraction-Assisted Distillation Designs for Purification of 2,3-Butanediol for Use as a Drop-in Fuel. ACS Sustain. Chem. Eng. 2018, 6, 14901–14910. [Google Scholar] [CrossRef]
- Brichkov, A.S.; Brichkova, V.Y.; Paukshtis, E.A.; Chen, Y.-W.; Kozik, V.V. Effects of preparation parameters on the characteristics of SiO2- and CoxOy-modified-TiO2 colloids prepared by hydrolysis of titanium alkoxide. J. Sol-Gel Sci. Technol. 2020, 94, 607–615. [Google Scholar] [CrossRef]
- Wang, X.; Pehkonen, S.; Rao, J.; Vaäaen, M.; Highfield, J.; Laasonen, K. Experimental and computational studies of nitrogen doped Degussa P25 TiO2: Application to visible-light driven photo-oxidation of As(III). Catal. Sci. Technol. 2012, 2, 784–793. [Google Scholar] [CrossRef]
- Ren, Y.; Xing, S.; Wang, J.; Liang, Y.; Zhao, D.; Wang, H.; Wang, N.; Jiang, W.; Wu, S.; Liu, S.; et al. Weak-light-driven Ag–TiO2 photocatalyst and bactericide prepared by coprecipitation with effective Ag doping and deposition. Opt. Mater. 2022, 124, 111993. [Google Scholar] [CrossRef]
- Pinho, L.; Rojas, M.; Mosquera, M.J. Ag–SiO2–TiO2 nanocomposite coatings with enhanced photoactivity for self-cleaning application on building materials. Appl. Catal. B Environ. 2015, 178, 144–154. [Google Scholar] [CrossRef]


| Labeling | Organic Matrix | Functional Group | Structure | Average Grain Size, µm |
|---|---|---|---|---|
| GS | styrene-divinylbenzene | sulfogroup | gel | 830 |
| MK | acrylic-divinylbenzene | carboxylic group | macroporous | 950 |
| MS | styrene-divinylbenzene | sulfogroup | macroporous | 830 |
| Product Name | Formula | Mr, g/mol | ρ, g/mL |
|---|---|---|---|
| Tetrabutoxytitanium (ACROS) | Ti(OC4H9)4 | 340.35 | 0.99 |
| Tetraethoxysilane (extra-pure grade) | Si(OC2H5)4 | 208.34 | 0.94 |
| Butyl alcohol (pure for analysis) | C4H9OH | 74.12 | 0.81 |
| Silver nitrate (chemically pure) | AgNO3 | 169.87 | – |
| Nitric acid (extra-pure grade) | HNO3 | 63.01 | 1.40 |
| Name | SC(Ag+), mmol-eq/g | SC(Ti4+), mmol-eq/g | TEC, mmol/g |
|---|---|---|---|
| MK | 3.37 ± 0.20 | 1.62 ± 0.13 | 8.09 ± 0.34 |
| MS | 3.18 ± 0.26 | 1.22 ± 0.15 | 5.60 ± 0.04 |
| GS | 2.85 ± 0.15 | 1.01 ± 0.15 | 4.87 ± 0.54 |
| Name | MK D,·103 mg/mL | MS D,·103 mg/mL | GS D,·103 mg/mL |
|---|---|---|---|
| Ti4+ | 0.75–1.10 | 0.13–0.42 | 0.13–0.25 |
| Ag+ | 1.29–2.59 | 1.10–1.75 | 0.62–0.68 |
| CLTE α ∙ 107, K−1 | T, °C |
|---|---|
| −76 | 25–220 |
| −120 | 220–360 |
| −362 | 360–400 |
| −298 | 400–500 |
| −247 | 500–600 |
| C(H2O) in Solution | pH Value 1 min | pH Value 5 min | pH Value 10 min | pH Value 20 min |
|---|---|---|---|---|
| 0.2 M | 7.71 | 6.42 | 5.22 | 4.65 |
| 0.4 M | 7.67 | 6.39 | 5.31 | 4.58 |
| 0.6 M | 7.61 | 6.31 | 5.18 | 4.52 |
| 0.8 M | 7.56 | 6.26 | 5.15 | 4.54 |
| 1.0 M | 7.49 | 6.20 | 5.07 | 4.59 |
| 1.2 M | 7.52 | 6.36 | 5.16 | 4.62 |
| 1.4 M | 7.50 | 6.24 | 5.28 | 4.51 |
| 1.6 M | 7.47 | 6.18 | 5.25 | 4.55 |
| 1.8 M | 7.55 | 6.29 | 5.12 | 4.58 |
| 2.0 M | 7.59 | 6.31 | 5.23 | 4.57 |
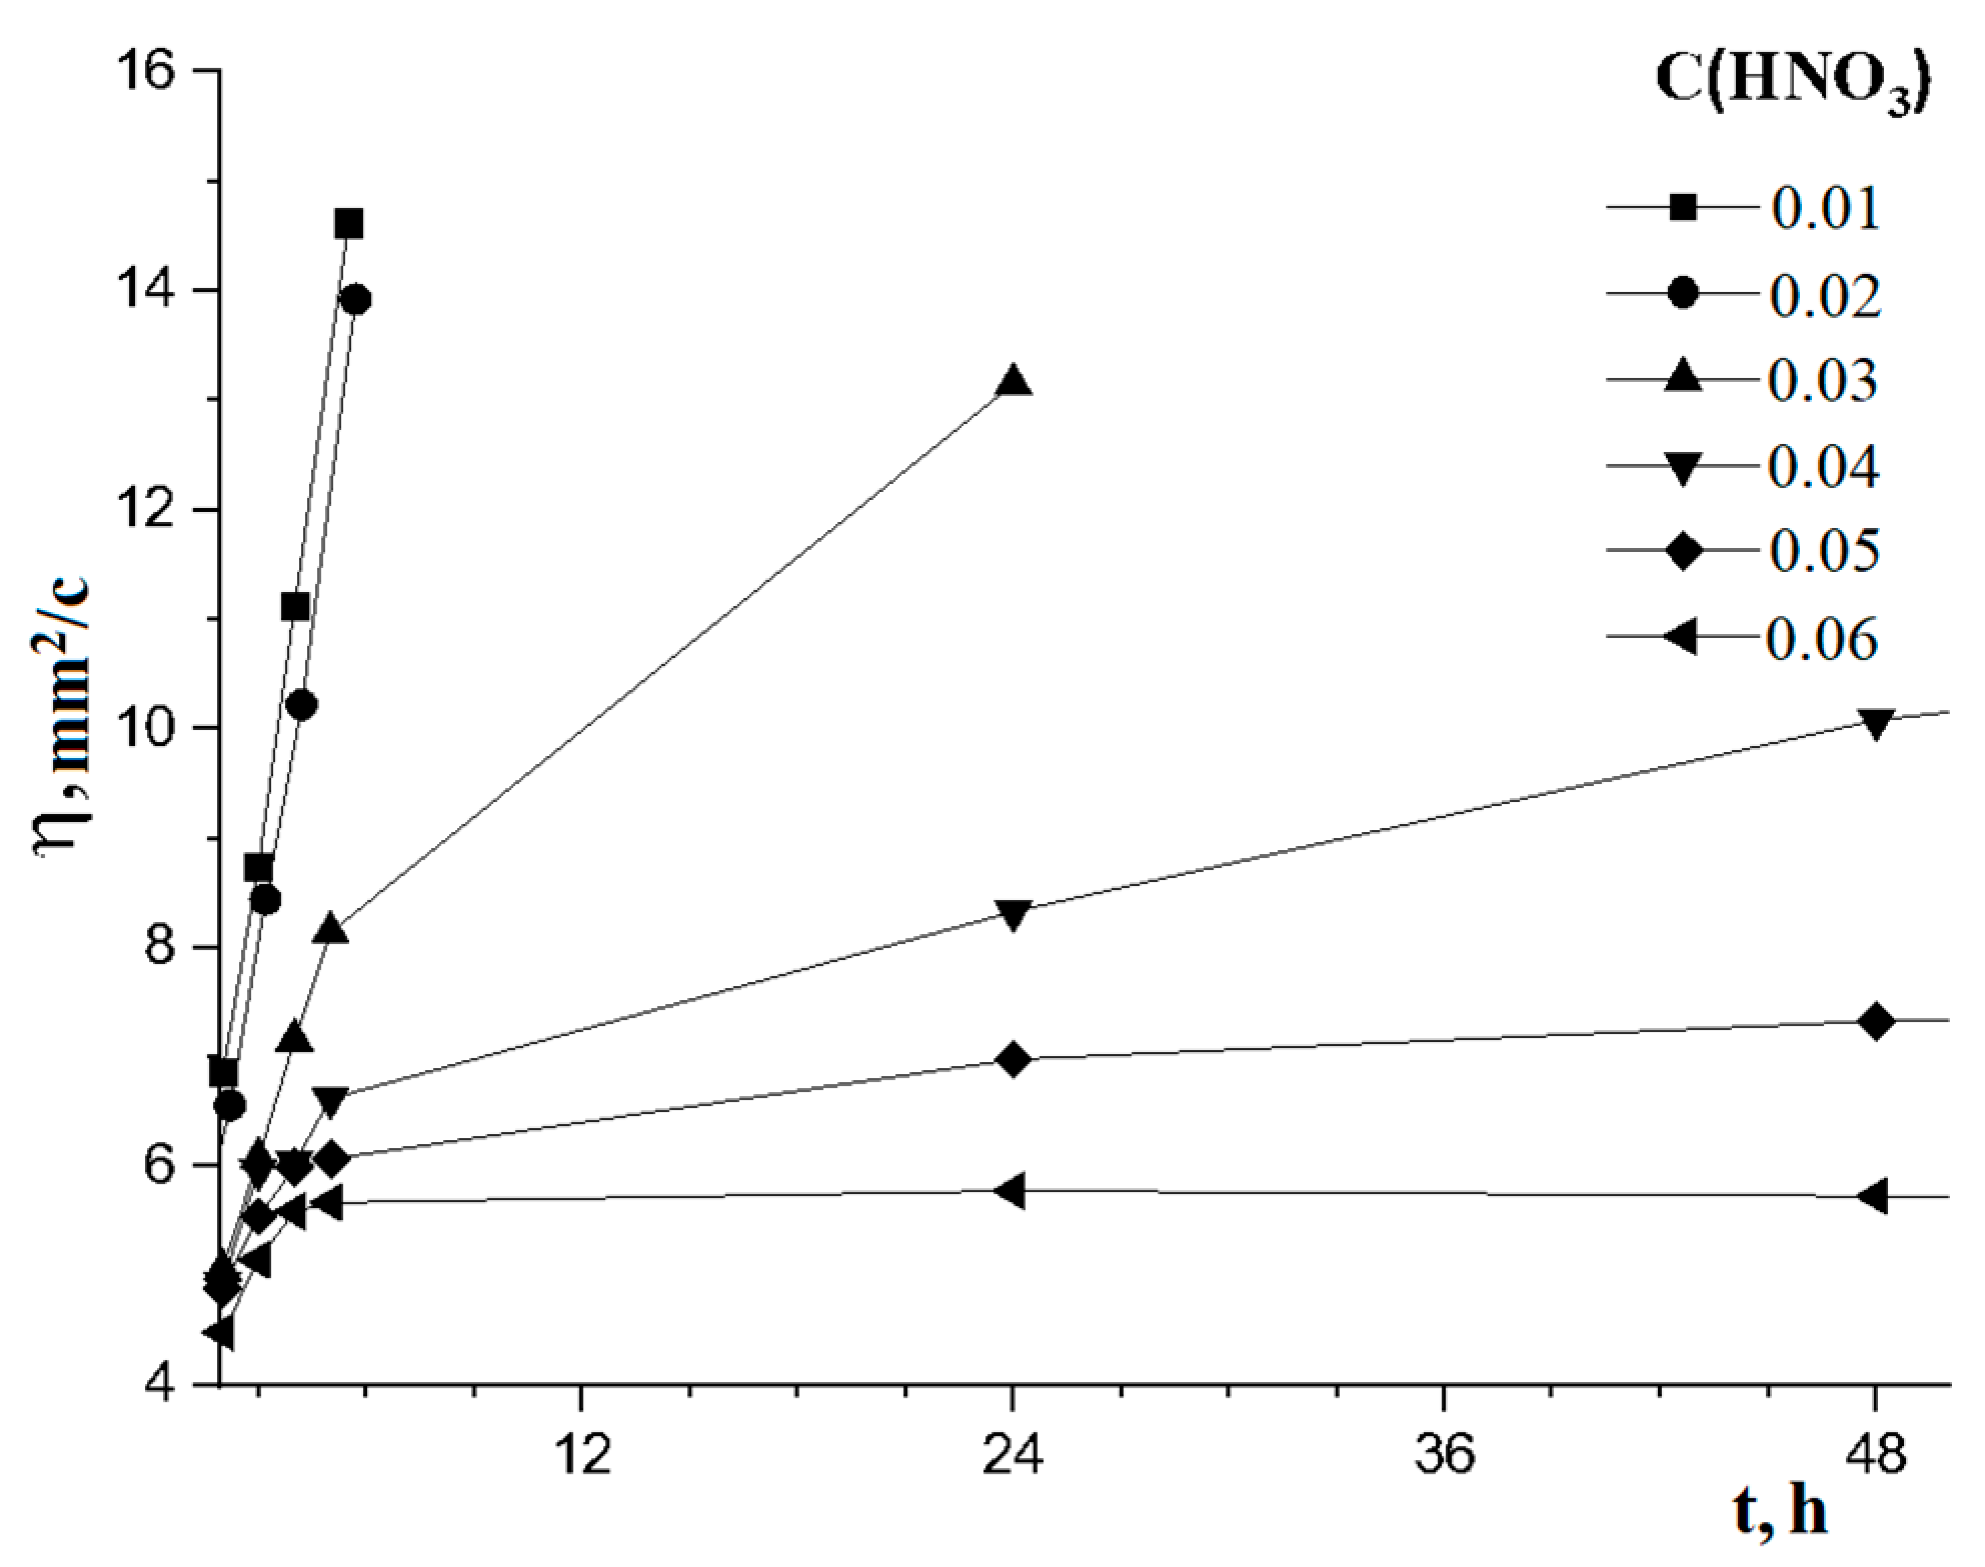
| C(HNO3) in Solution | Time of Solution Stabilization, Hour | Period of Stability, Days |
|---|---|---|
| 0.01 M | more than 24 | - |
| 0.02 M | more than 24 | - |
| 0.03 M | 6 | 28 |
| 0.04 M | 6 | 27 |
| 0.05 M | 6 | 34 |
| 0.06 M | 6 | 42 |
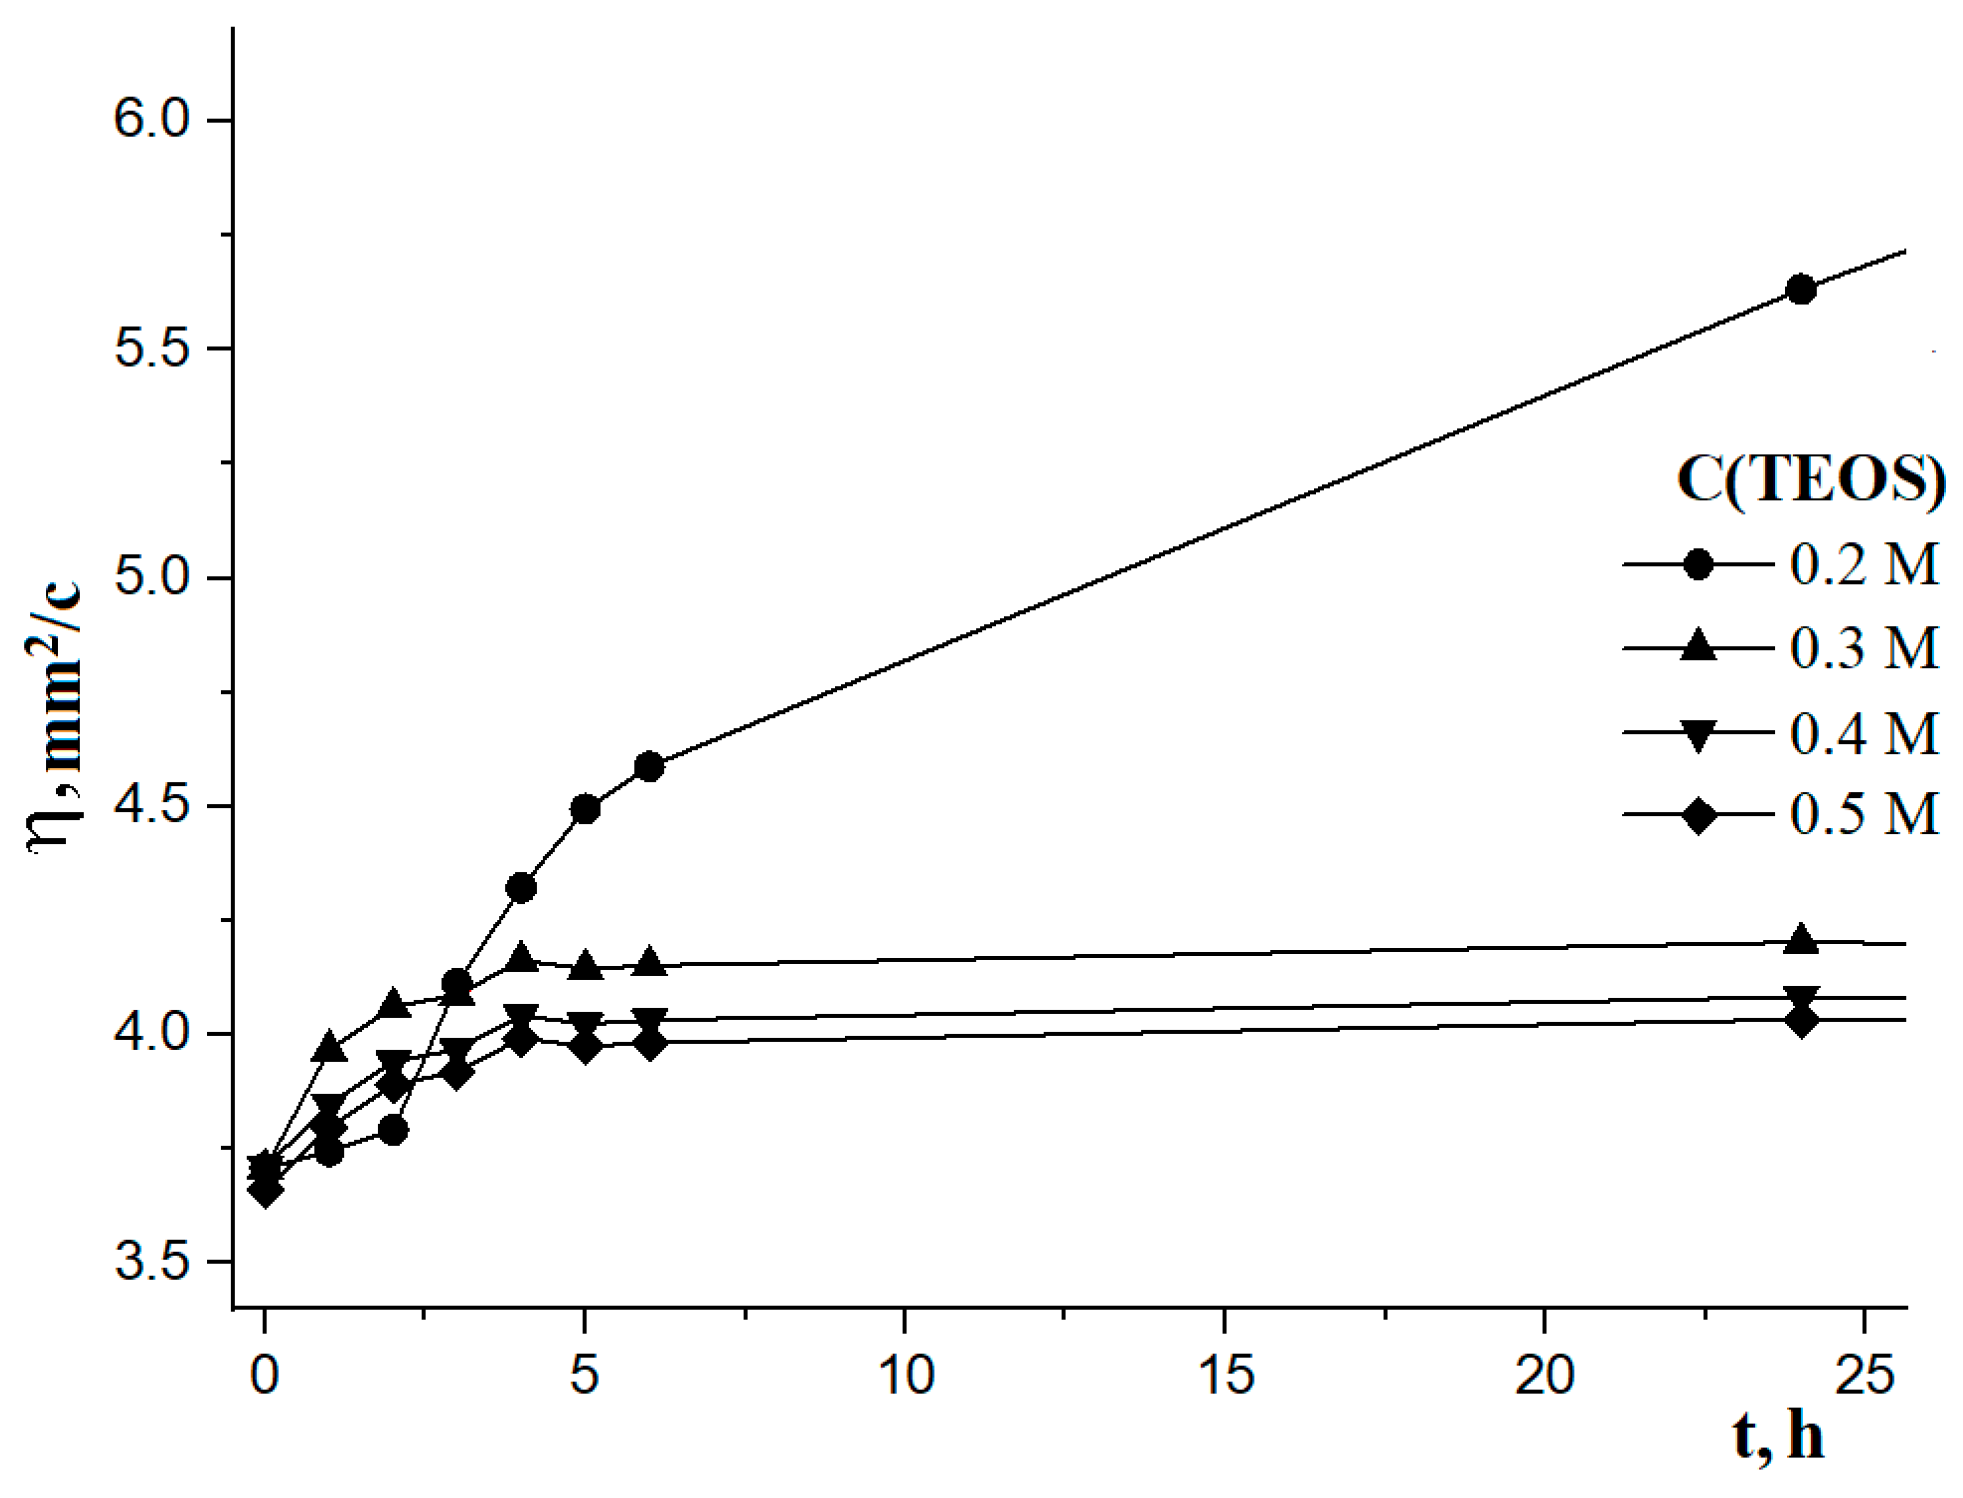
| C(Si(OC2H5)4) in Solution | Time of Solution Stabilization, Hour | Period of Stability, Days |
|---|---|---|
| 0.2 M | 6 | 43 |
| 0.3 M | 6 | 47 |
| 0.4 M | 8 | 56 |
| 0.5 M | 8 | 62 |
| Composition | Particle Size, μm | Specific Surface Area, m2/g | Pore Volume, cm3/g | Absorption Edge, nm | Degree Decomposition of Organic Dyes, % | Decomposition Time, min | Ref |
|---|---|---|---|---|---|---|---|
| Ag-SiO2-TiO2/TiO2-Ag | 442 | 36.0 | 220 | 440 | 100 | 120 | - |
| TiO2 | 0.34 | 54.0 | 0.17 | 365 | 100 | 140 | [32] |
| TiO2-Ag | 0.24 | 30.1 | 0.42 | 449 | 100 | 120 | [33] |
| Ag-SiO2-TiO2 | 0.52 | 56.5 | 0.29 | 440 | 100 | 120 | [34] |
Disclaimer/Publisher’s Note: The statements, opinions and data contained in all publications are solely those of the individual author(s) and contributor(s) and not of MDPI and/or the editor(s). MDPI and/or the editor(s) disclaim responsibility for any injury to people or property resulting from any ideas, methods, instructions or products referred to in the content. |
© 2024 by the authors. Licensee MDPI, Basel, Switzerland. This article is an open access article distributed under the terms and conditions of the Creative Commons Attribution (CC BY) license (https://creativecommons.org/licenses/by/4.0/).
Share and Cite
Buzaev, A.A.; Tkachuk, V.A.; Zakharkiva, A.M.; Borilo, L.P. Synthesis of Spherical and Layered Ag-SiO2-TiO2/TiO2-Ag Structures. Chemistry 2025, 7, 1. https://doi.org/10.3390/chemistry7010001
Buzaev AA, Tkachuk VA, Zakharkiva AM, Borilo LP. Synthesis of Spherical and Layered Ag-SiO2-TiO2/TiO2-Ag Structures. Chemistry. 2025; 7(1):1. https://doi.org/10.3390/chemistry7010001
Chicago/Turabian StyleBuzaev, Aleksander A., Valerya A. Tkachuk, Alexandra M. Zakharkiva, and Lyudmila P. Borilo. 2025. "Synthesis of Spherical and Layered Ag-SiO2-TiO2/TiO2-Ag Structures" Chemistry 7, no. 1: 1. https://doi.org/10.3390/chemistry7010001
APA StyleBuzaev, A. A., Tkachuk, V. A., Zakharkiva, A. M., & Borilo, L. P. (2025). Synthesis of Spherical and Layered Ag-SiO2-TiO2/TiO2-Ag Structures. Chemistry, 7(1), 1. https://doi.org/10.3390/chemistry7010001