Article

Synthesis, Structures and Photophysical Properties of Tetra- and Hexanuclear Zinc Complexes Supported by Tridentate Schiff Base Ligands

1
Institut für Anorganische Chemie, Universität Leipzig, Johannisallee 29, 04103 Leipzig, Germany
2
Willhelm-Ostwald-Institut für Physikalische und Theoretische Chemie, Universität Leipzig, Linnéstraße 2, 04103 Leipzig, Germany
3
Helmholtz-Zentrum Dresden-Rossendorf, Abteilung Ressourcenökologie, Forschungsstelle Leipzig, Permoserstr. 15, 04318 Leipzig, Germany
*
Author to whom correspondence should be addressed.
Chemistry 2023, 5(2), 1028-1045; https://doi.org/10.3390/chemistry5020070
Submission received: 3 April 2023 / Revised: 24 April 2023 / Accepted: 28 April 2023 / Published: 2 May 2023
(This article belongs to the Special Issue Commemorating 150 Years of Justus von Liebig’s Legacy)

Abstract

:
The synthesis, structure and photophysical properties of two polynuclear zinc complexes, namely [Zn6L2(µ3-OH)2(OAc)8] (1) and [Zn4L4(µ2-OH)2](ClO4)2 (2), supported by tridentate Schiff base ligand 2,6-bis((N-benzyl)iminomethyl)-4-tert-butylphenol (HL) are presented. The synthesized compounds were investigated using ESI-MS, IR, NMR, UV-vis absorption spectroscopy, photoluminescence spectroscopy and single-crystal X-ray crystallography. The hexanuclear neutral complex 1 comprises six-, five- and four-coordinated Zn2+ ions coordinated by O and N atoms from the supporting ligand and OH- and acetate ligands. The Zn2+ ions in complex cation [Zn4L4(µ2-OH)2]2+ of 2 are all five-coordinated. The complexation of ligand HL by Zn2+ ions leads to a six-fold increase in the intensity and a large blue shift of the ligand-based 1(π-π)* emission. Other biologically relevant ions, i.e., Na+, K+, Mg2+, Ca2+, Mn2+, Fe2+, Co2+, Ni2+ and Cu2+, did not give rise to a fluorescence enhancement.

Graphical Abstract

1. Introduction

Zinc as an essential trace metal for all living organisms is omnipresent in biogenic systems, such as in the cells of the human body. Meanwhile, it is well-known that Zn2+ greatly contributes to biological processes, for example, as part of the immune system, as an active site or co-factor in enzymes or as a regulator for proteins, and it can also provide a stabilizing function to their structure [1,2,3,4,5,6,7,8,9,10]. The Zn2+ ions can, however, also have toxic effects when toothier concentrations are too high, and it is presumably involved in the biochemical mechanisms of neuronal diseases [4,11]. Proper detection of free zinc, also in living cells, is highly desirable, but it still remains a challenge for common spectroscopic methods, with which free zinc is not obtainable. As a d10 metal, Zn2+ cannot be observed using UV-vis spectroscopy, but it is particularly suitable for fluorescence spectroscopy. For this technique, the CHEF effect (chelation-enhanced fluorescence effect) is exploited for a strong augmentation in the fluorescence intensity of the sensor molecule. Usually, the PET (photoinduced electron transfer) quenches the luminescence of some chemosensors, and it is turned off by the complexation of the closed-shell d10 metal ion [12,13,14,15,16,17,18,19,20,21,22,23]. This combines two important factors: the high sensitivity of fluorescence spectroscopy and the excellent selectivity for Zn2+. A set of molecules, which provide these abilities, were already designed and explored: for example, 8-aminoquinoline-based sensor molecules such as 6-methoxy-(8-p-toluenesulfonamide)quinoline (TSQ), Zinquin (ZQ) and 2-(hydroxmethyl)-4-methyl-6-((quinolinyl-8-imino)methyl)phenol (HMQP) [24,25,26,27,28,29,30]. However, what is often left out from consideration is the influence of different anions that may disturb the mechanism of complexation with zinc and the sensitivity of the method.
Recently, we have reported the synthesis, structures and properties of some discrete four- and five-coordinated Zn2+ complexes supported by salicylaldiminato ligands [31,32,33,34,35]. As an extension, here, we report the synthesis of two zinc complexes derived from new Schiff base ligand HL (Scheme 1) bearing two imine functions and a phenolic oxygen as a N,O,N-donor set. The effect of the metal–ligand ratio variations on the coordination and luminescence properties is reported. The results are supported by accompanying DFT calculations of UV/vis spectra.

2. Materials and Methods

All reagents were purchased and used without any further purification. 4-tert-butyl-2,6-diformylphenol was purchased from Sigma Aldrich. Solvents were of HPLC grade and not additionally purified. UV/vis spectra were recorded with a V-670 spectrophotometer from Jasco and analyzed with Spectra Manager v2.05.03 software. Hellma 110-QS quartz cells with 10 mm path length were used as cuvettes. Measurements were made within the range of 190–650 nm. Fluorescence spectra were recorded on a Perkin Elmer FL6500 spectrometer using a constant slit width. Data acquisition was performed using the FL WinLab v3.00 program from PerkinElmer [36]. Measurements were performed using precision SUPRASIL type 111-10-40-QS fused silica cells (10 mm cell diameter, 3500 μL volume) from Hellma Analytics. The infrared spectra were recorded with a Bruker Vertex 80v FTIR spectrometer utilizing KBr pellets. The OriginPro 8G program from OriginLab Corporation was used for data analysis and a graphical display of the spectra [37]. 1H and 13C NMR spectra measurements were recorded on Bruker model DPX-400 (1H: 400 MHz; 13C: 100 MHz) or Varian Gemini 300 instruments (1H: 300 MHz; 13C: 75 MHz). The solvent signal served as the internal standard. The MestReNova v11.0 program from Mestrelab Research S. L. was utilized for data analyses and graphical displays [38]. ESI mass spectra were recorded using microTOF or Impact II mass spectrometers from Bruker Daltonik GmbH. Elemental analyses were measured using an Elementar Vario EL instrument from Elementar Analysesysteme GmbH.
X-ray crystallography. Single-crystal X-ray diffraction experiments were carried out on a Stoe Stadivari, equipped with an X-ray micro-source (Cu-Kα, λ = 1.54186 Å) and a dectris Pilatus 300K detector at 180(2) K. The diffraction frames were processed with the Stoe X-red software package [39]. The structures were solved by direct methods [40] and refined by full-matrix least-squares techniques on the basis of all data against F2 using ShelXl-2018/3 [41]. Platon was used to search for higher symmetry [42]. All non-hydrogen atoms were refined anisotropically. H atoms were placed in calculated positions and allowed to ride on their respective C atoms and treated isotropically using the 1.2- or 1.5-fold Uiso value of the parent C atoms. All non-hydrogen atoms were refined anisotropically. All calculations were performed using the Olex2 crystallographic platform [43]. ORTEP-3 and POV-Ray were used for the artwork of the structures [44]. CCDC 2248758-2248760 contains the supplementary crystallographic data for this paper.
Crystallographic data for 2,6-(BzN=CH)-4-tBu-C6H2OH. C26H28N2O, Mr = 384.50 g/mol, triclinic, space group P-1, a = 8.3627(2) Å, b = 10.9002(3) Å, c = 11.8113(4) Å, α = 100.761(2)°, β = 94.116(2)°, γ = 91.320(2)°, V = 1054.27(5) Å3, Z = 2, ρcalcd = 1.211 g/cm3, T = 180(2) K, μ(Cu-Kα), λ = 1.54186 Å, crystal size 0.326 × 0.307 × 0.256 mm3, 19,262 reflections measured, 3908 unique, 3518 with I > 2σ(I). Final R1 = 0.0372 (I > 2σ(I)), wR2 = 0.1057 (3908 refl.), 267 parameters and 0 restraints, min./max. residual electron density = −0.181/0.254 e3.
Crystallographic data for 1·3MeCN·0.5H2O. C74H90N7O20.5Zn6, Mr = 1806.88 g/mol, triclinic, space group P-1, a = 9.9260(3) Å, b = 15.0044(5) Å, c = 28.7383(7) Å, α = 98.943(2)°, β = 92.514(2)°, γ = 104.406(2)°, V = 4079.9(2) Å3, Z = 2, ρcalcd = 1.471 g/cm3, T = 180(2) K, μ(Cu-Kα), λ = 1.54186 Å, crystal size 0.160 × 0.090 × 0.050 mm3, 70,648 reflections measured, 14,641 unique, 7769 with I > 2σ(I). Final R1 = 0.0577 (I > 2σ(I)), wR2 = 0.1521 (14641 refl.), 1140 parameters and 402 restraints, min./max. residual electron density = −0.609/1.000 e3. The tert-butyl groups are disordered over two positions (0.66/0.34 and 0.53/0.47) and restrained with SADI, RIGU, DELU, and SIMU. One benzyl group of each ligand is disordered over two positions (0.51/0.49 and 0.72/0.28), restrained with SADI, SIMU, DELU, and RIGU. AFIX 66 was used to fix both benzene rings. One methylene group was constrained with EADP. One MeCN is disordered over two positions (0.74/0.26), restrained with DFIX (1.137 and 2.593), SIMU, and RIGU. The nitrogen atom was constrained with EADP. The solvent water molecule is disordered over a special position and was modeled with PART-1. Crystals of 1·3MeCN·0.5H2O grown by recrystallization of 1.4H2O from MeCN solution quickly lost solvate molecules upon standing in air and became turbid.
Crystallographic data for 2·3MeOH·0.5MeCN. C108H123.5Cl2N8.5O17Zn4, Mr = 2145.03 g/mol, monoclinic, space group P21/n, a = 17.9667(4) Å, b = 30.1926(5) Å, c = 19.4877(4) Å, α = 90°, β = 92.875(2)°, γ = 90°, V = 10,558.0(4) Å3, Z = 4, ρcalcd = 1.349 g/cm3, T = 180(2) K, μ(Cu-Kα), λ = 1.54186 Å, crystal size 0.186 × 0.154 × 0.121 mm3, 101,721 reflections measured, 19,944 unique, 10,877 with I > 2σ(I). Final R1 = 0.0477 (I > 2σ(I)), wR2 = 0.1328 (19,944 refl.), 1403 parameters and 492 restraints, min./max. residual electron density = −0.572/0.767 e3. One tert-butyl group is disordered over two positions (0.72/0.28), restrained with DFIX (1.54), SADI, SIMU, and RIGU. One benzyl group is disordered over two positions (0.72/0.28), restrained with SIMU and RIGU. AFIX 66 was used to fix the benzene rings, and the methylene group was constrained with EADP. The perchlorate ion is disordered over two positions (0.59/0.41) and restrained with SADI, SIMU, and RIGU. Crystals of 2·3MeOH·0.5MeCN grown by the recrystallization of 2.H2O from the MeCN/MeOH solution quickly lost solvate molecules upon standing in air and became turbid.
Synthesis of 2,6-bis-((N-benzyl)iminomethyl)-4-tert-butylphenol (HL). Benzylamine (546 mg, 5.09 mmol, 2.10 eq.) was added to a solution of 5-tert-butyl-2-hydroxybenzene-1,3-dialdehyde (500 mg, 2.42 mmol, 1.00 eq.) in EtOH (20 mL). The resulting yellow solution was stirred for 2 h at ambient temperature to produce a yellow solid, which was isolated by filtration, washed with little cold EtOH and dried at 60 °C. The compound was recrystallized once from EtOH to produce a pure product: yellow X-ray quality crystals. Yield: 915 mg (98.2%). M.p. 122 °C. 1H-NMR (400 MHz, CD2Cl2): δ = 1.32 (s, 9H, CH3-tBu), 4.81 (s, 4H, CH2), 7.24–7.39 (m, 12H, CHar), 8.70 (s, 2H, N=CH), 13.91 (s, 1H, OHar). 13C{1H}-NMR (100 MHz, DMSO, 90 °C): δ = 30.7 (CH3), 33.3 (C(CH3)3), 62.4 (CH2), 120.5 (o-Car), 126.5 (p-Bz-Car), 127.4 (o-Bz-Car), 127.9 (m-Bz-Car), 128.4 (m-Car), 138.7 (ipso-Bz-Car), 140.0 (p-Car-tBu), 158.8 (ipso-Car-OH), 161.4 (HC=N). FT-IR (KBr): ν ˜ /cm–1 = 3083/3059/3028 (w, νC-Har), 2954/2904/2837 (s-w, νC-H), 1633 (s, νC=N), 1598 (w, νC=C), 1472 (s, δasym. -CH3, tBu), 1439 (s, νCar-O), 1388/1372 (w, δsym. -CH3, tBu), 1287 (m), 1260 (m), 1225 (m), 1203 (w), 1118 (w), 1062 (m), 1027 (w), 942 (w), 882 (w), 844 (w), 823 (w), 750 (s), 718 (w), 699 (s). m/z (ESI+, MeCN): C26H29N2O (384.23) [M + H+]+ calcd: 385.24; found 385.23. UV-vis (DCM/MeOH (3:2/v:v); 5.0 × 10⁻⁵ M): λmax/nm (ε/M−1cm−1) = 248 (28,090), 348 (5480), 451 (5610); (MeCN; 2.5 × 10⁻⁵ M): λmax/nm (ε/M−1cm−1) = 193 (56,650), 244 (43,210), 347 (7950), [444 (500)]. Elemental analysis for C26H28N2O (384.51) calc. C 81.21, H 7.34, N 7.29%; found. C 80.92, H 7.36, N 7.23%.
Synthesis [Zn6(L)2(OH)2(OAc)8] (1). A solution of Zn(OAc)2·2H2O (190 mg, 866 mmol, 3.00 eq.) in 3 mL of MeCN was added to a solution of HL (111 mg, 289 mmol, 1.00 eq.) in MeCN (20 mL). The yellow solution intensified its color and was stirred for 30 min at 80 °C. The solution was left to stand for 2 weeks. The resulting solid was isolated by filtration and dried in air. Yield: 420 mg (86.9%). Elemental analysis for [Zn6L2(OH)2(OAc)8]. 4H2O (C68H88N4O24Zn6) (1737.8) calc. C 47.00, H 5.10, N 3.22%; found. C 46.97, H 4.62, N 3.10%. This so isolated powder (1.4H2O) was used for all spectroscopic measurements. 1H-NMR (300 MHz, CD2Cl2): δ = 1.25/1.29 (s, 18H, CH3-tBu), 1.73 (s, 24H, CH3-OAc), 4.84/5.08 (s, 8H, CH2), 7.11–7.42 (m, 20 H, Bz-CHar) 7.47–7.54, (m, 4H, m-CHar), 8.31/8.36 (s, 4H, N=CH) ppm. FT-IR (KBr pellet): ν ˜ /cm–1 = 3029 (w, νC-H, ar), 2961 (w, νC-H), 1604/1580 (s, antisymm. νC-O, COO), 1415 (s, symm. νC-O, COO), 1344 (w), 1233 (w, νCar-O), 1066 (w), 1026 (w), 843 (w), 823 (w), 776 (w), 758 (w), 698 (w), 670 (w). m/z (ESI+, MeCN): For [Zn2L2OAc]+ as C54H57N4O4Zn2+ (956.83) [M]+ calcd: 957.29; found 957.28. UV-vis (DCM/MeOH (3:2 ratio); 2.5 × 10⁻⁵ M): λmax/nm (ε/M−1cm−1) = [221 (16,160)], 260 (30,700), 387 (10,060).
Synthesis of [Zn4L4(OH)2](ClO4)2 (2). A solution of Zn(ClO4)2·6H2O (107 mg, 286 mmol, 1.10 eq.) in a few drops of acetonitrile was added to a solution of HL (100 mg, 260 mmol, 1.00 eq.) in 20 mL of DCM/MeOH (3:2). The yellow solution intensified its colour and was stirred for 2 h at 40 °C. The solution was left to stand for 2 weeks. The resulting solid was isolated by filtration and dried in air. Yield: 456 mg (86.4%). Elemental analysis for [Zn4L4(OH)2](ClO4)2·H2O (2046.50) calc. C 61.04, H 5.52, N 5.48%; found. C 61.15, H 5.81, N 5.61%. This isolated powder (2·H2O) was used for all spectroscopic measurements. 1H-NMR (300 MHz, CD2Cl2): δ = 1.39 (s, 36H, CH3-tBu), 3.55/3.81/4.36 (m, 16H, CH2), 6.38–7.46 (m, 48 H, CHar), 7.83/8.13 (s, 8H, N=CH) ppm. FTIR (KBr): ν ˜ /cm–1 = 3063/3031 (w, νC-H, ar), 2958/2921 (m, νC-H), 1653/1631 (s, νC=N), 1542 (s, νC=C), 1454 (m, δantisymm -CH3), 1398 (w), 1363 (w), 1233 (m, νCar-O), 1090 (s, νCl-O, perchlorate), 928 (w), 878 (w), 840 (w), 759 (m), 700 (m), 625 (s, δCl-O, perchlorate). m/z (ESI+, DCM): For [Zn2L2ClO4]+ as C52H54ClN4O6Zn2+ (997.24) [M]+ calcd: 997.23; found 997.22. UV-vis (DCM/MeOH (3:2 ratio); 2.5 × 10⁻⁵ M): λmax/nm (ε/M−1cm−1) = [228 (18,650)], 257 (27,900), 387 (8800).
Time-dependent density functional theory. All structures were optimized using PBE/TZ2P-D3(BJ) [45,46,47], and the 20 lowest singlet excitations were calculated using TD-DFT [48] at the CAMY-B3LYP [49,50,51] level of the theory, as implemented in AMS [52,53,54]. Implicit solvation model COSMO [55,56,57] was included in all calculations.

3. Results

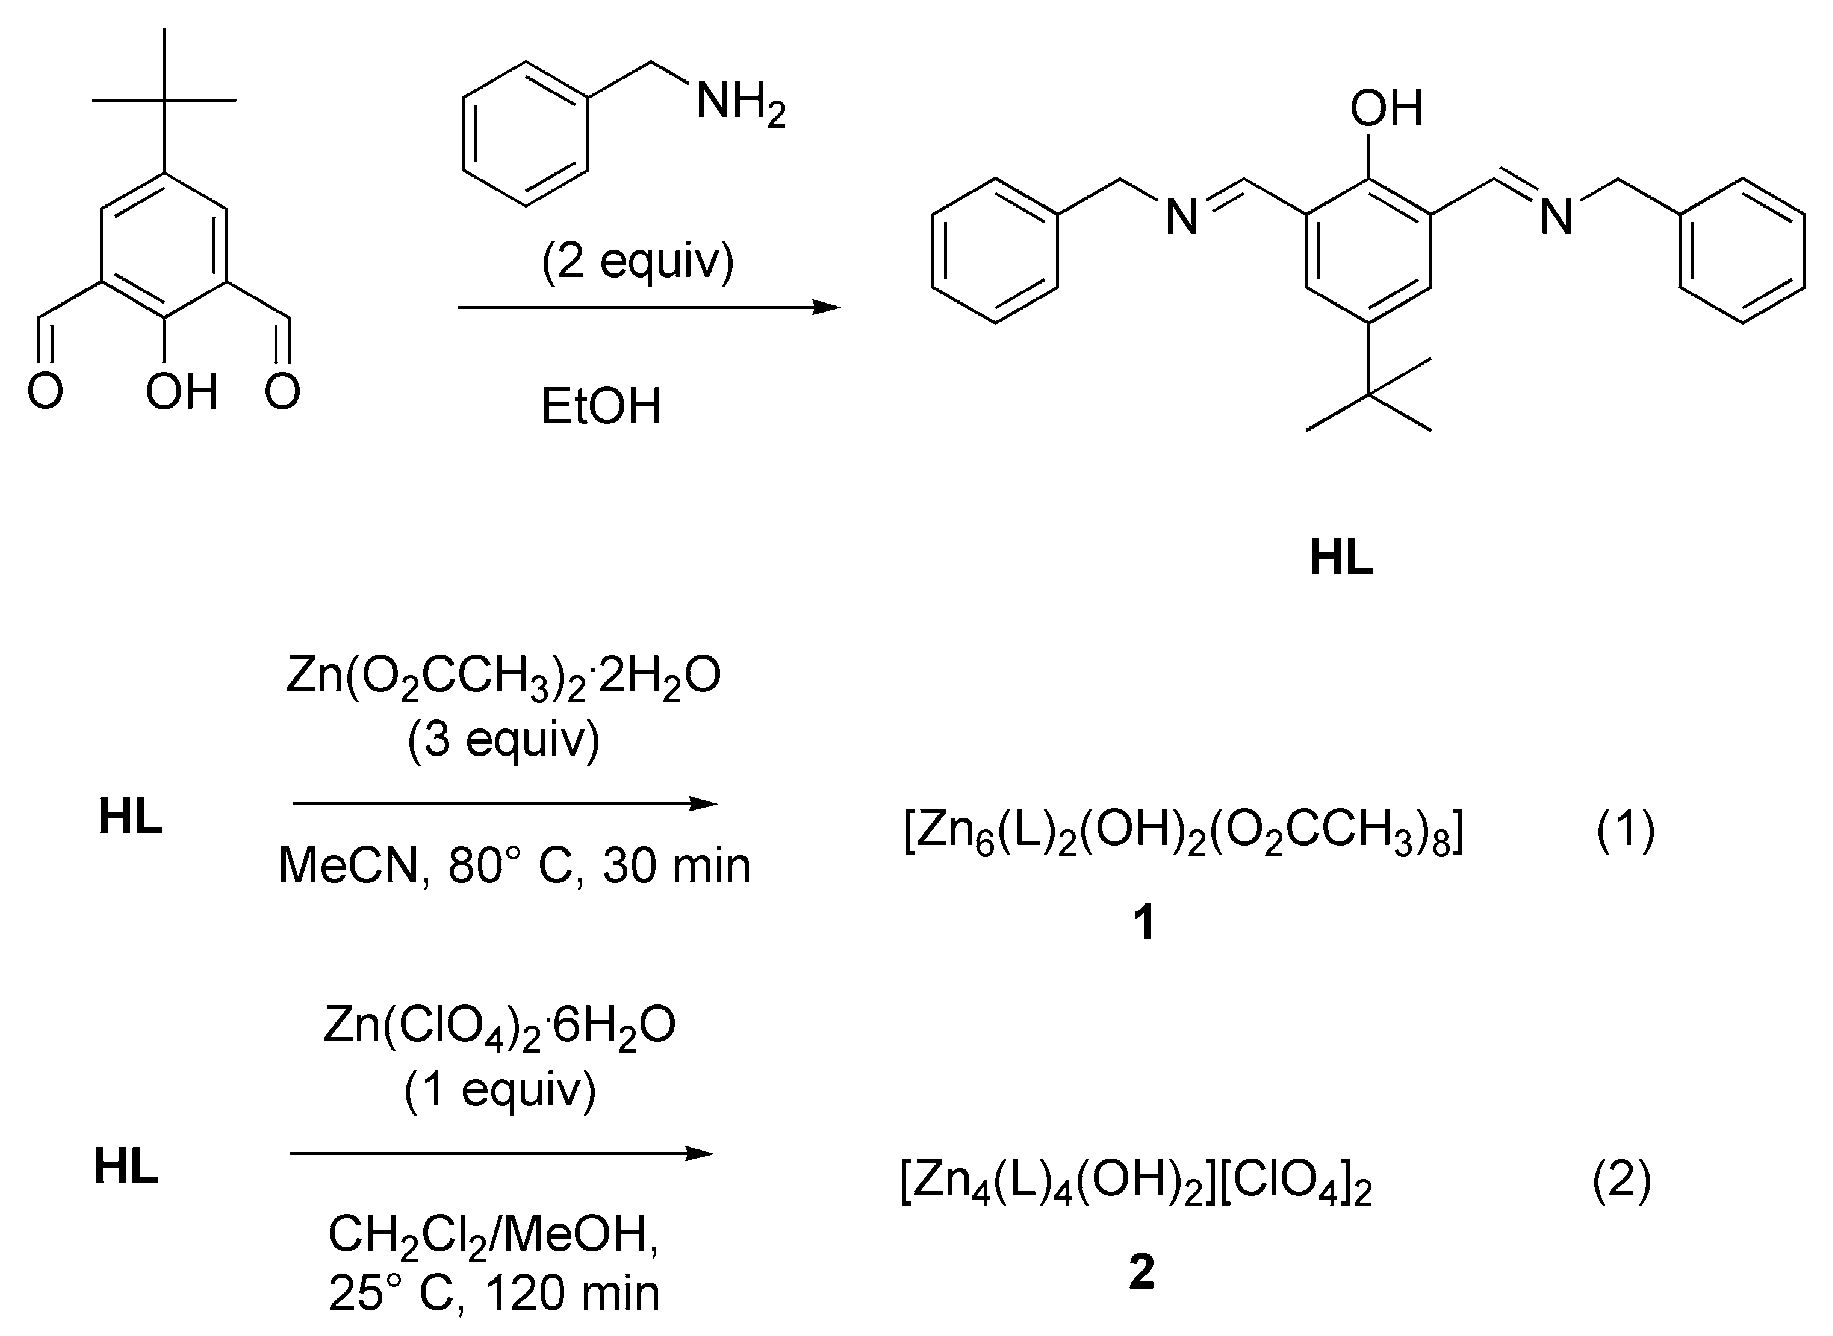
3.1. Synthesis and Characterization of Compounds

The new di-imine ligand HL was prepared according to the route provided in Scheme 1. A mixture of 5-tert-butyl-2-hydroxybenzene-1,3-dialdehyde and two equivalents of benzylamine were allowed to react in a 1:2 molar ratio at room temperature for 2 h in EtOH in order to provide an intense yellow solution, from which the pure product could be isolated as a yellow microcrystalline solid in an almost quantitative yield.
Two new zinc(II) complexes, 1 and 2, were prepared according to the reactions in Scheme 1. The reaction of the ligand HL with Zn(OAc)2.2H2O in a 3:1 ratio in acetonitrile at 80 °C for 30 min produced a pale yellow solution, from which a pale yellow, microcrystalline powder of composition [(Zn6(L)2(OH)2(OAc)8]·4H2O (1) was reproducibly obtained in ca 87% yield. The treatment of HL with Zn(ClO4)2.6H2O in a 1:1 ratio in a CH2Cl2/MeOH/MeCN mixed solvent system furnished a yellow solution, from which a pale yellow solid of composition [Zn4L4(OH)2](ClO4)2·H2O (2) precipitated in an 86% yield. Both complexes exhibit good solubility in acetonitrile, DMSO and dichloromethane, but they are only sparingly soluble in alcohols and various hydrocarbons and virtually insoluble in water. The synthesized compounds resulted in a satisfactory elemental analyses, and their formulation was confirmed by electrospray ionization mass spectrometry (ESI-MS), FT-IR-spectroscopy, UV-vis and NMR spectroscopy as well as single-crystal X-ray diffractometric analyses.
The infrared spectrum of the free ligand shows a prominent band at 1634 cm−1, which can be attributed to the C=N stretching frequencies of the imine groups (Figure S1). The O-H stretching appears as a very broad band with a maximum at around 2600 cm−1, indicating the presence of intramolecular hydrogen bonding interactions between the OH and imine groups. The IR spectrum of zinc complex 1 reveals two bands at 1580 and 1415 cm−1 attributed to the antisymmetric and symmetric stretching vibrations of the acetato ligand (Figure S2). The imine group gives rise to two weak features at 1650 and 1630 cm−1. The IR spectrum of perchlorate salt 2 (Figure S2) reveals two strong absorption bands at 1090 and 625 cm−1, characteristic values for the vibrations of a ClO4 counter anion. Again, as in 1, there are two bands at 1653 and 1631 cm−1 attributable to the stretching vibrations of a coordinated imine group.

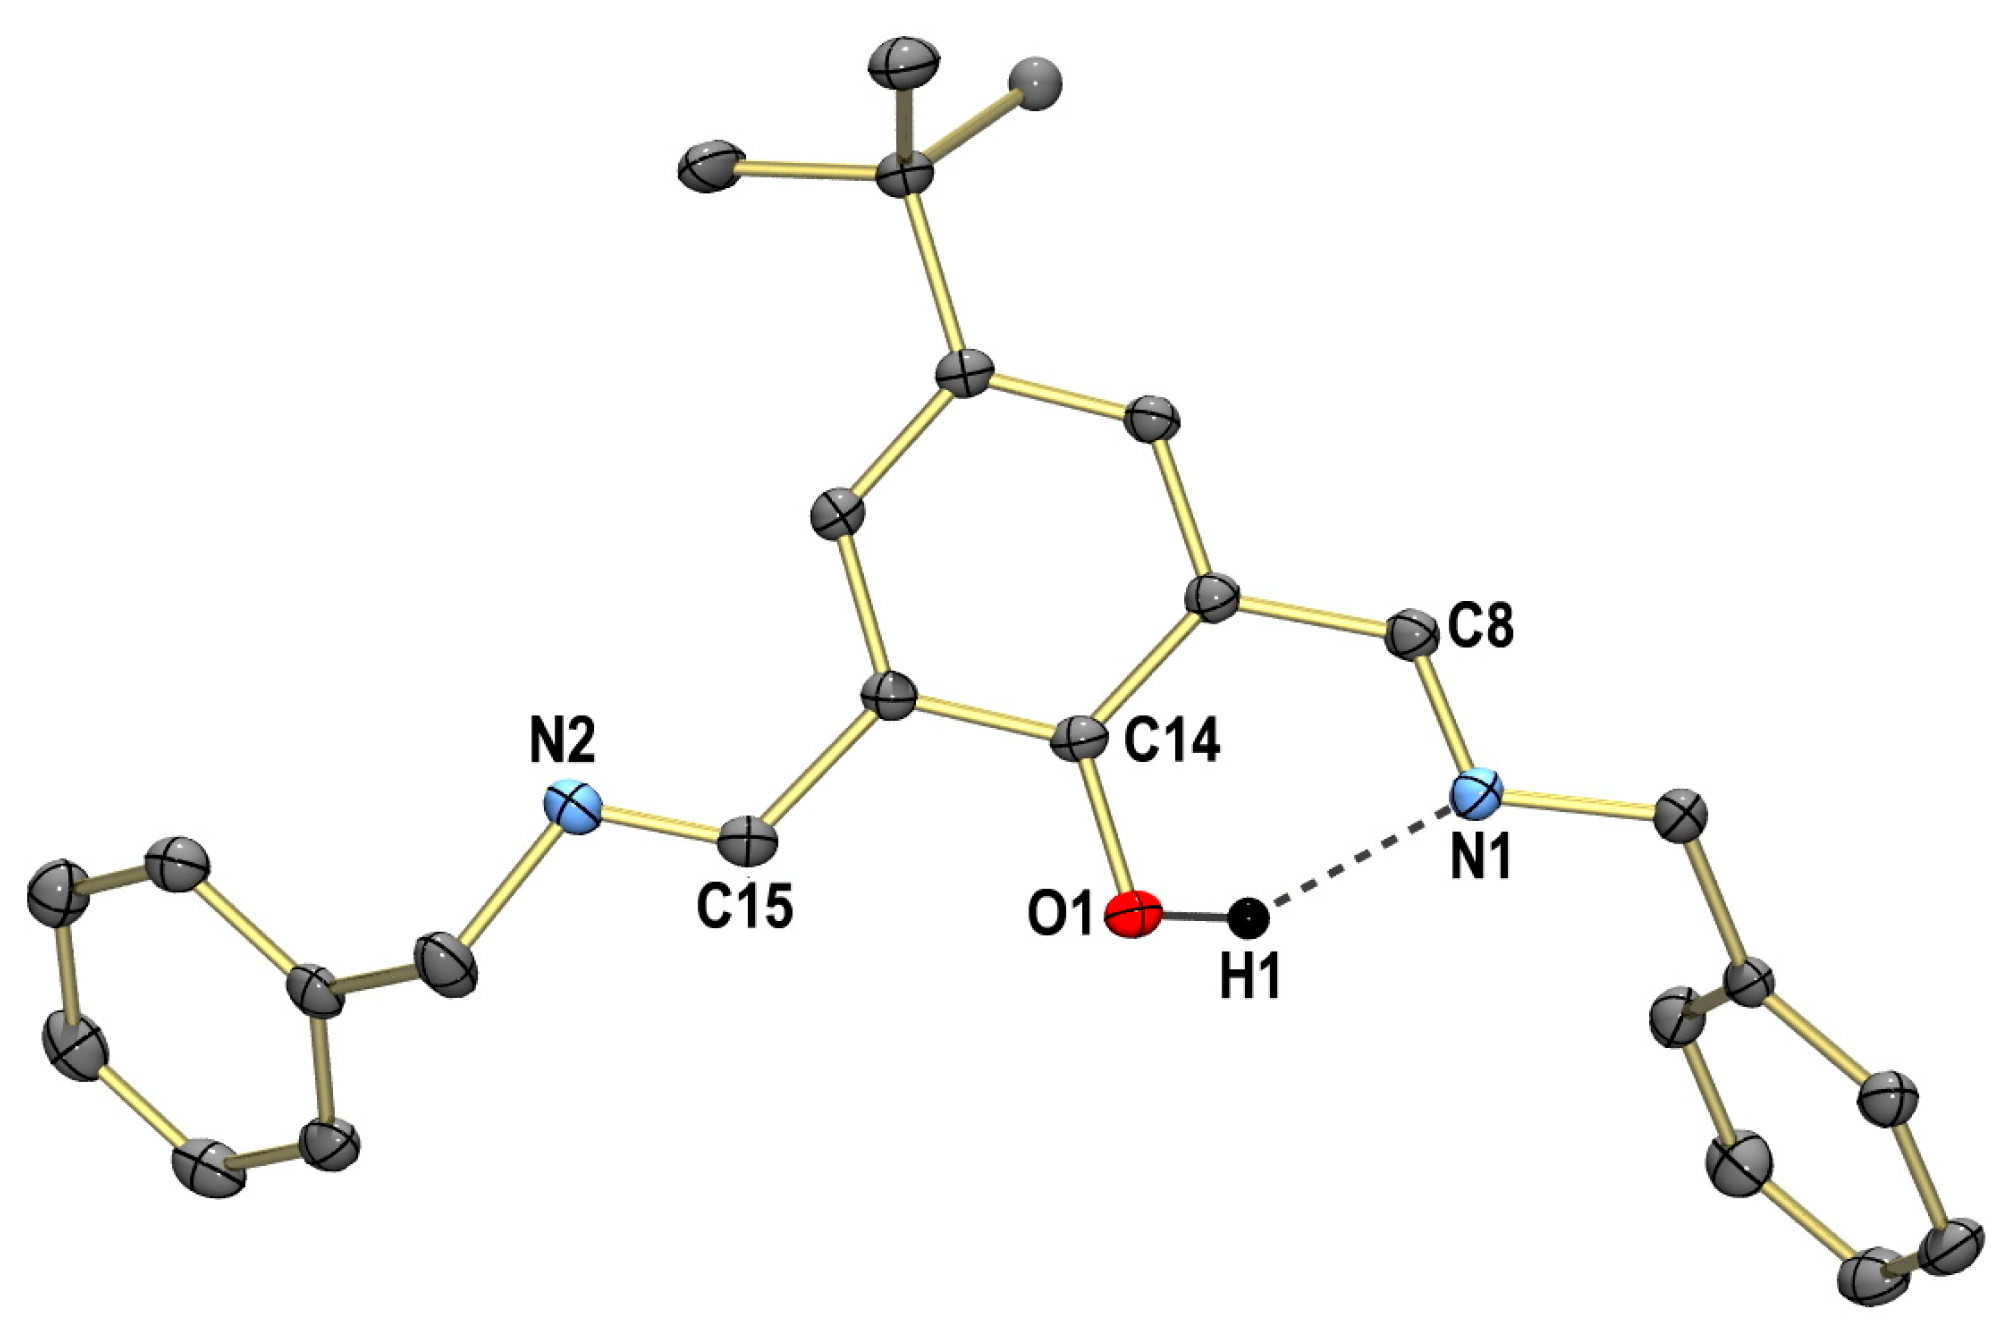
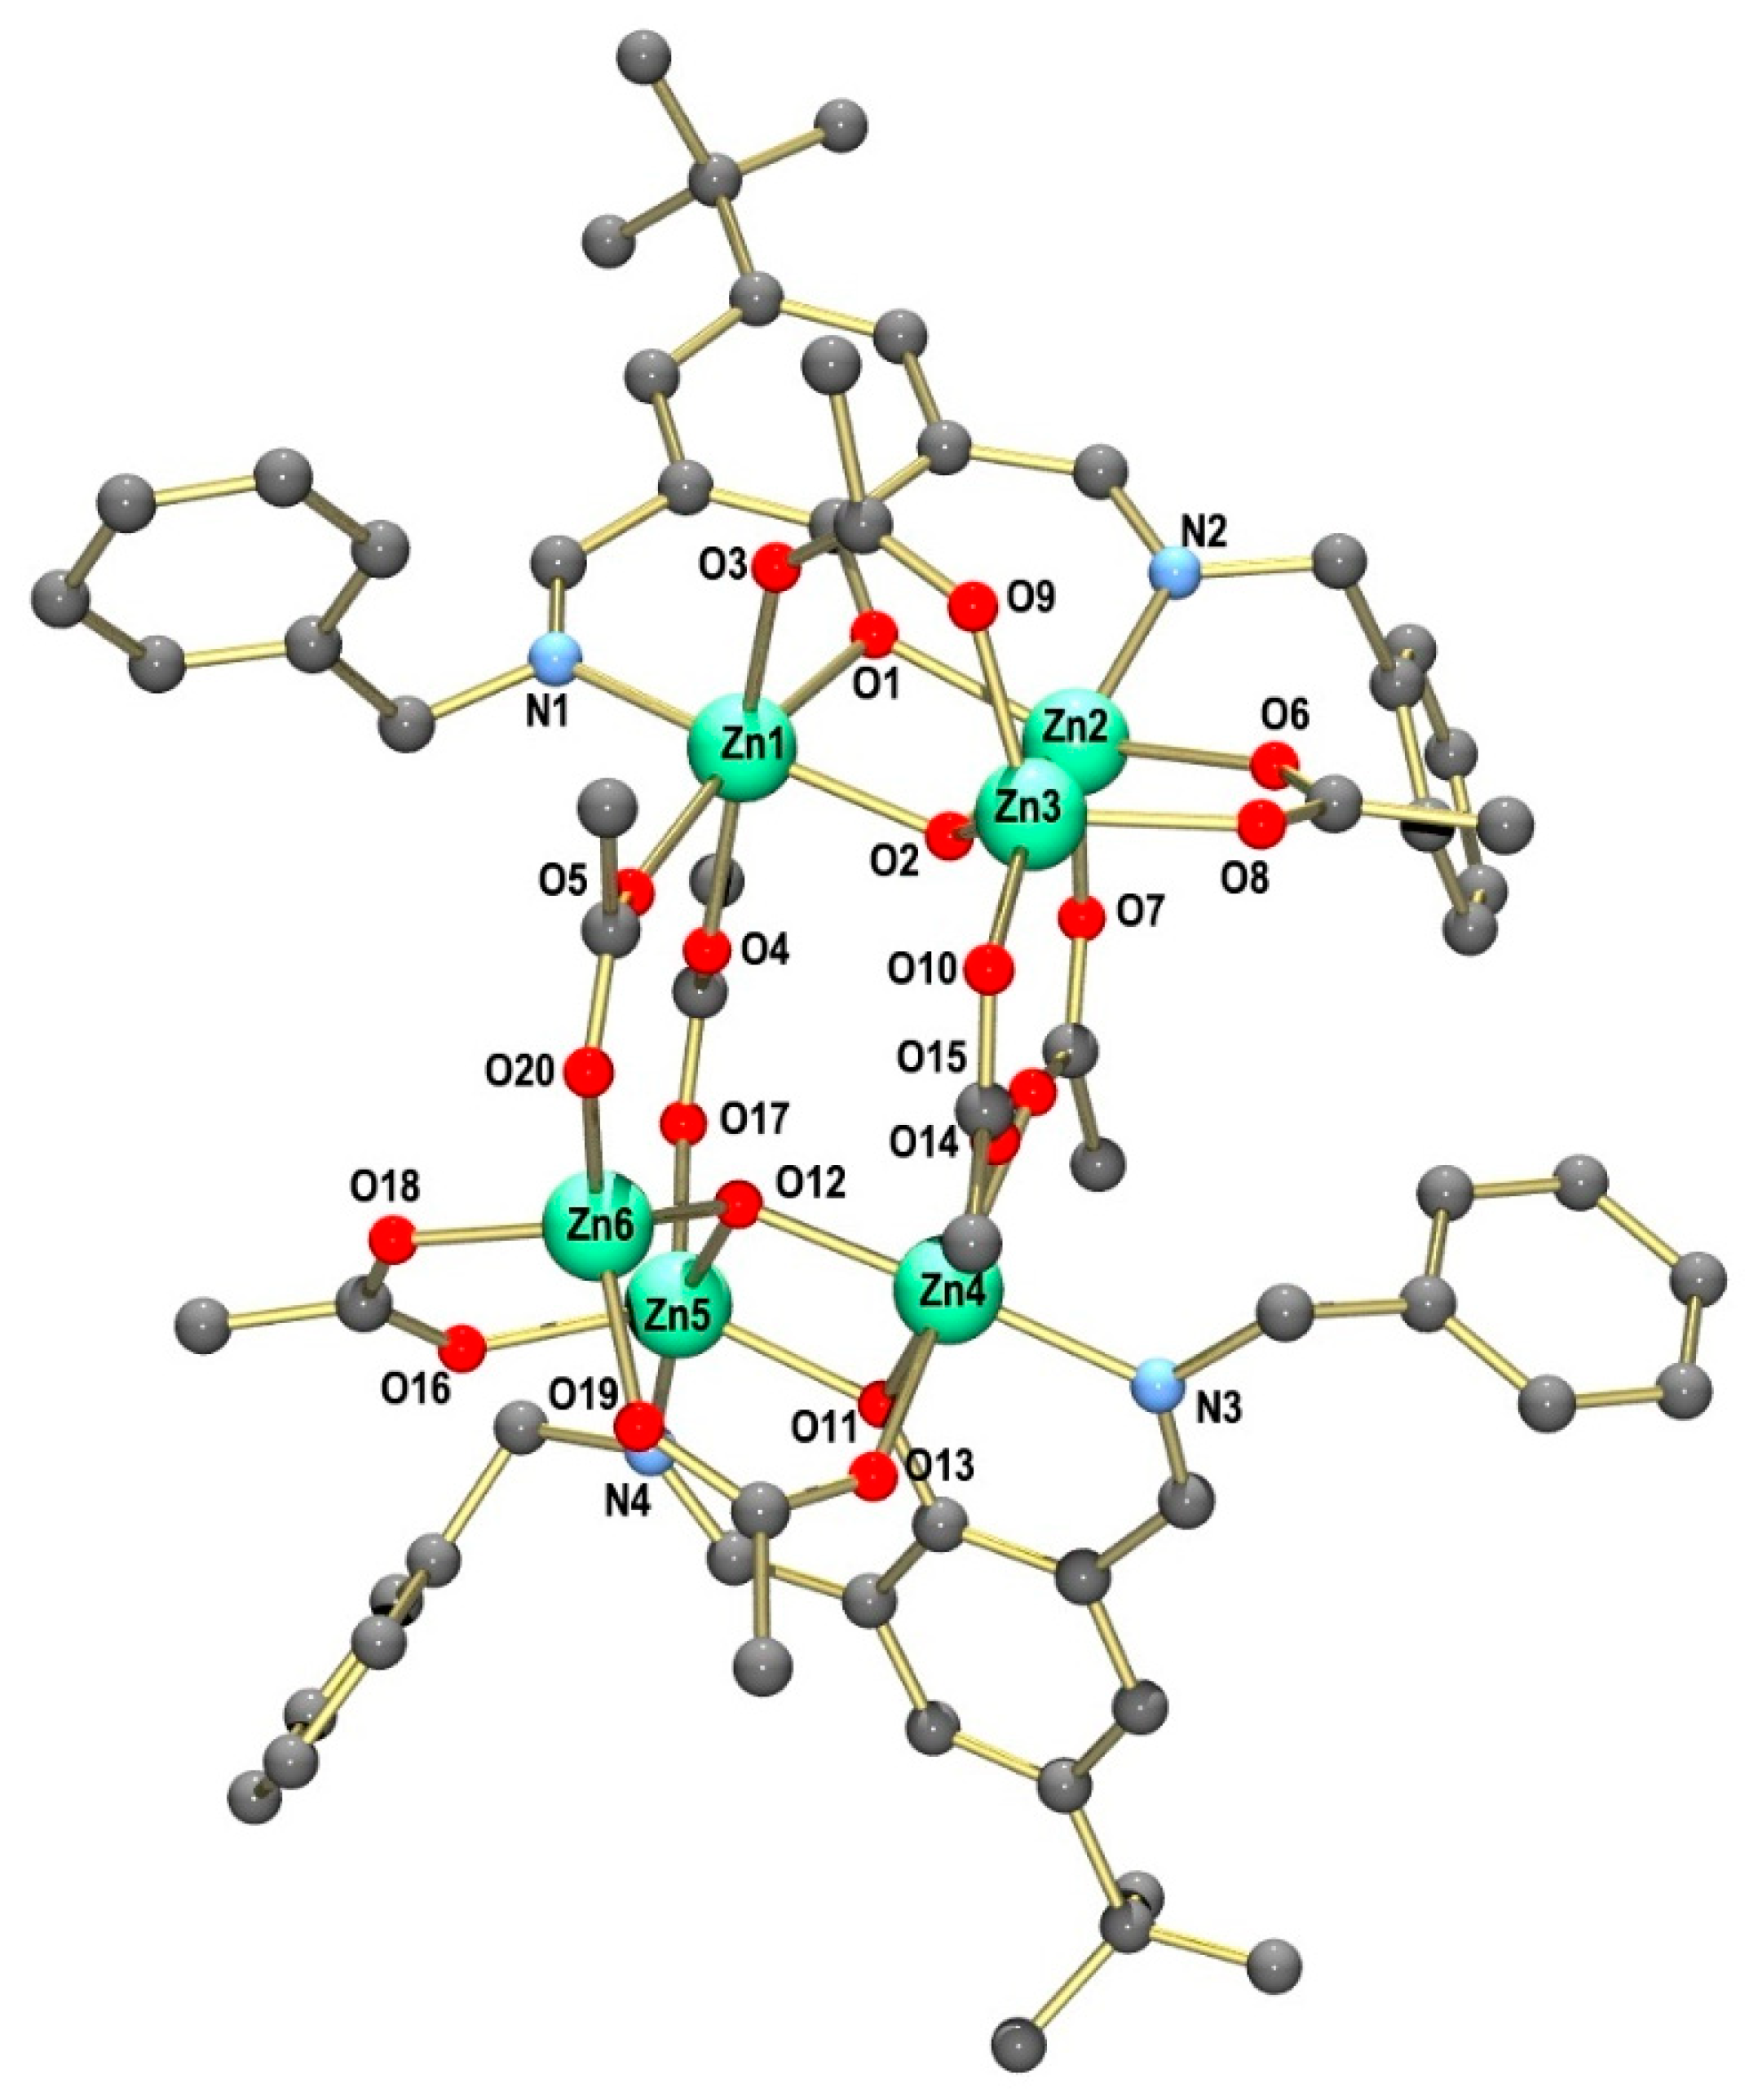
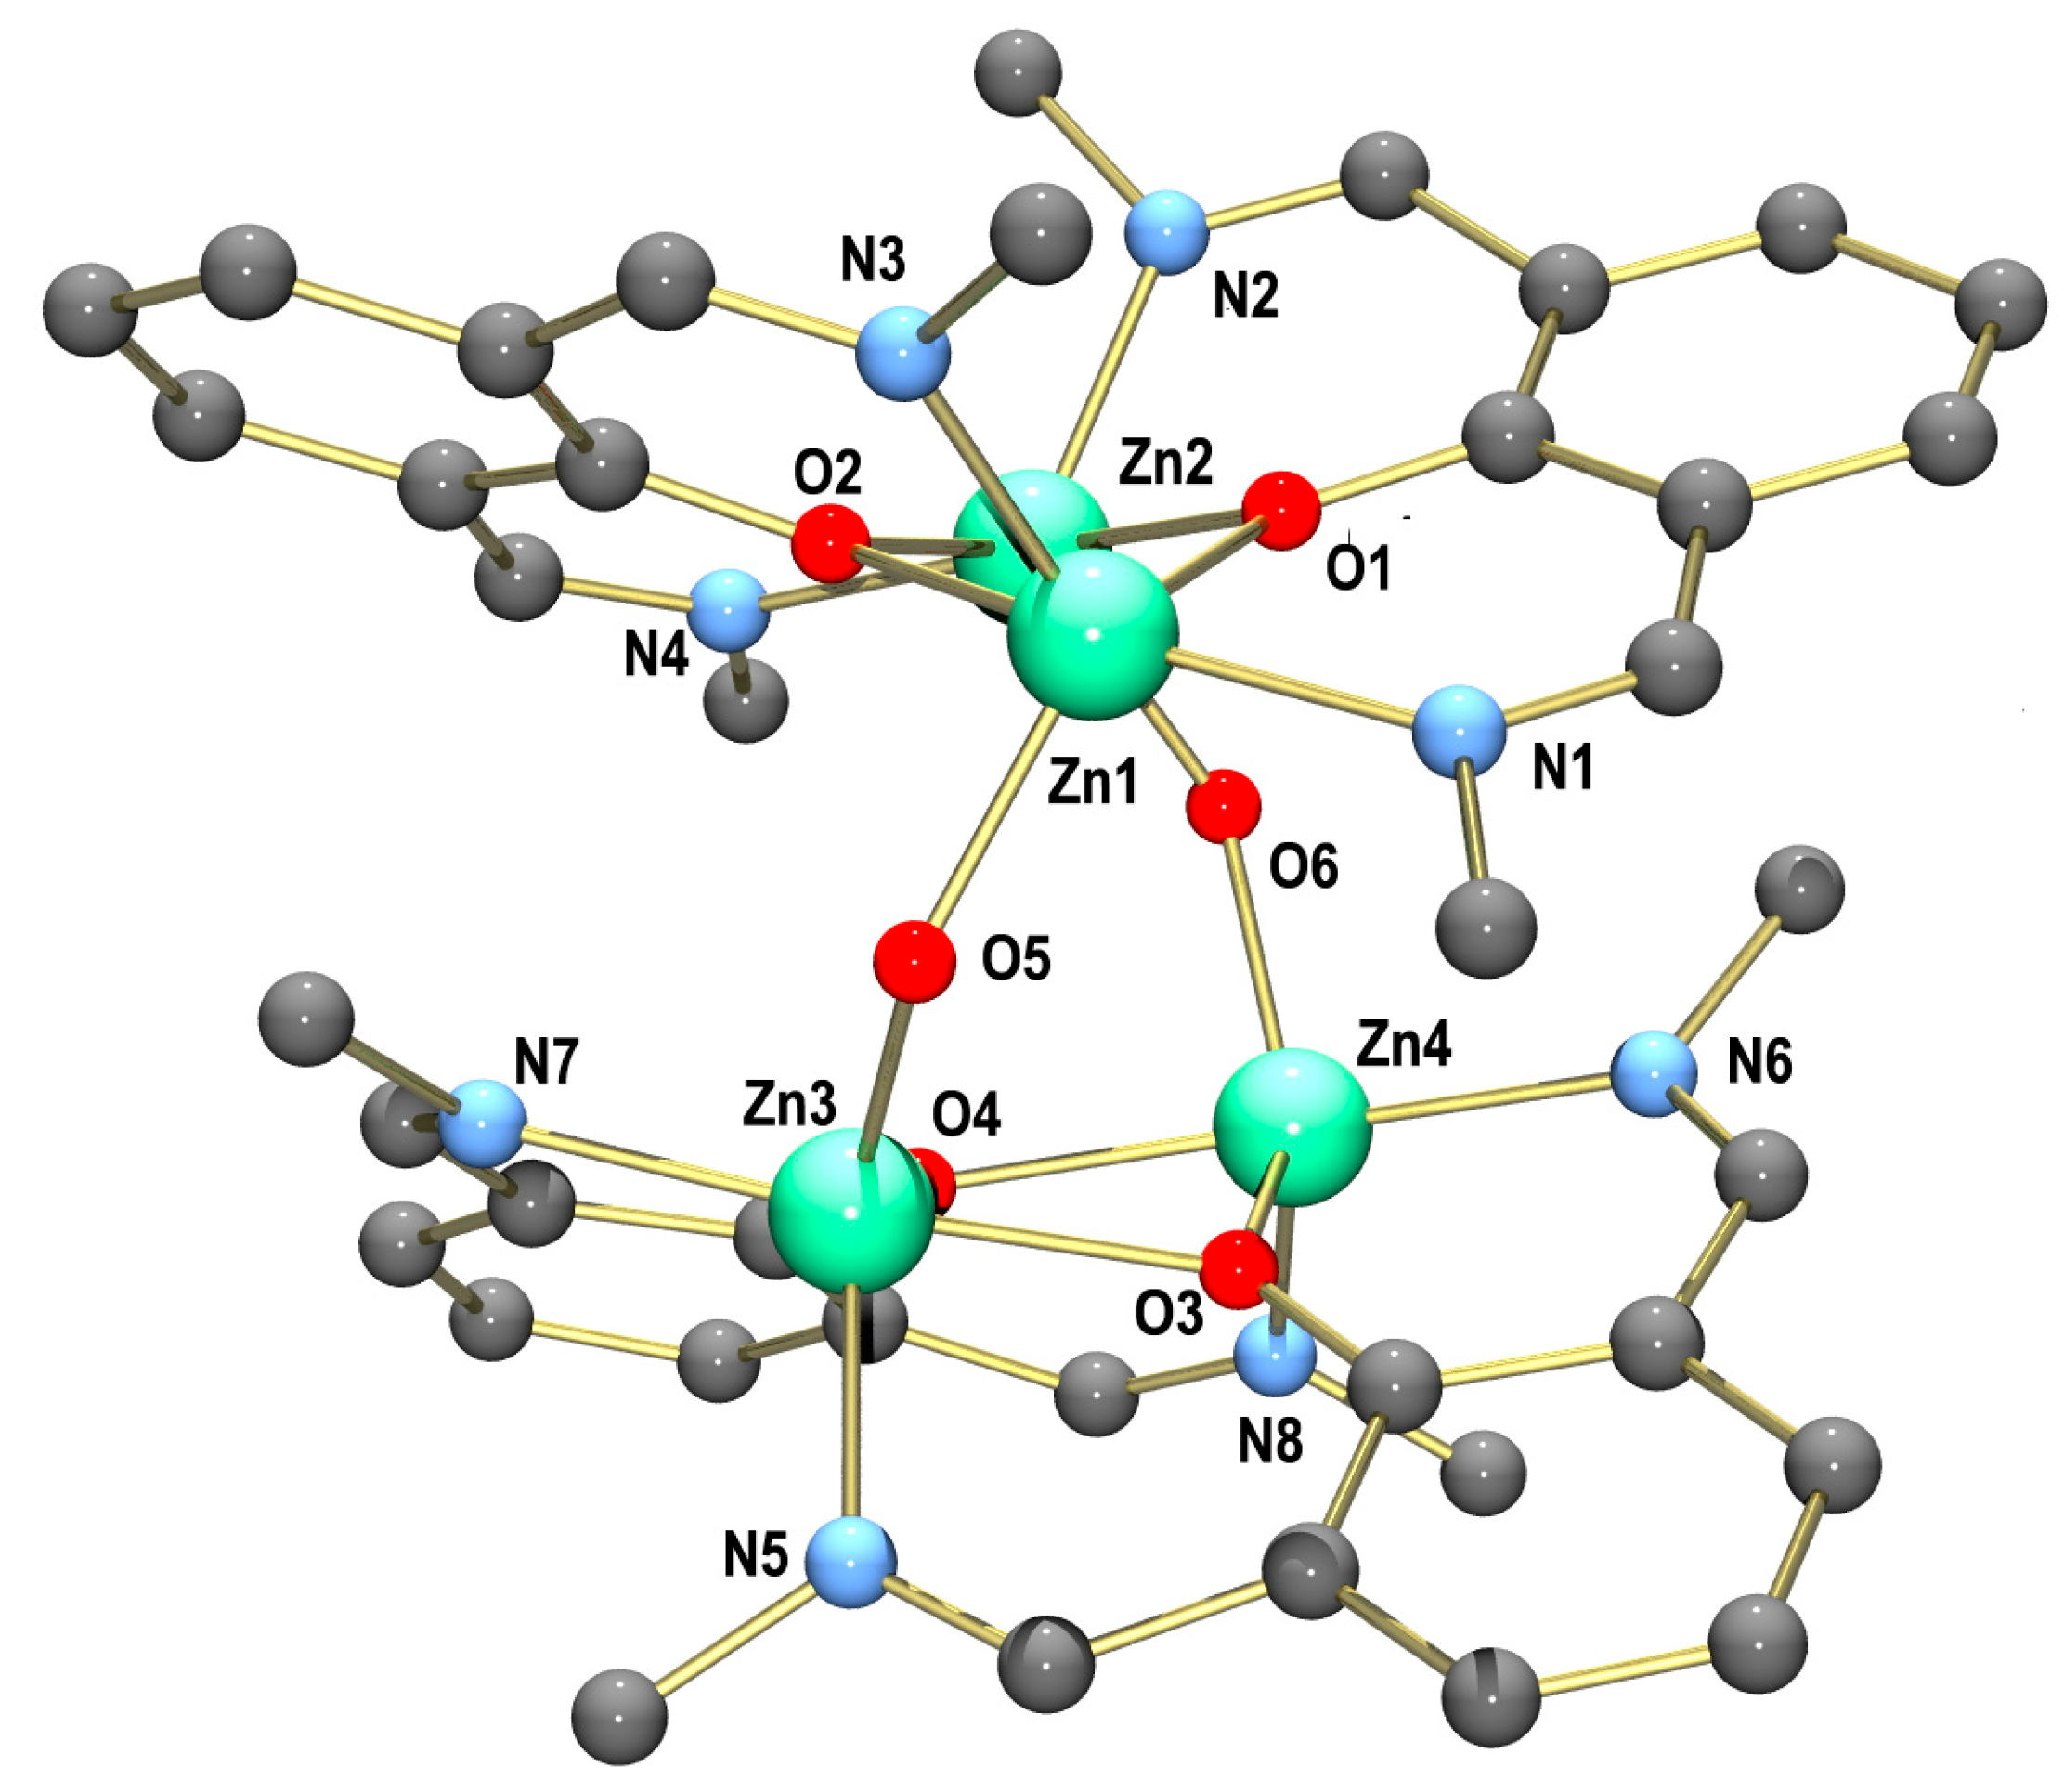
3.2. Crystallographic Characterization

Single crystals of HL obtained from EtOH are triclinic and fall into space group P 1 ¯ . The structure shown in Figure 1 reveals that both imino groups are (E)-configured and coplanar with the phenol ring. The phenolic OH group forms an intramolecular hydrogen bond (O1-H1-N1) with the imine group as observed in other salicylaldimines. Figure S5 displays the packing diagram of HL. As observed, the phenol rings of two adjacent molecules are engaged in face-to-face π–π stacking interactions, as manifested by an interplanar distance of 3.4286(11) Å. The DFT-optimized geometry of the HL ligand at the PBE/TZ2P-D3(BJ) level of theory is in agreement with the experimental data (Figure S16).
Crystals of [Zn6L2(OH)2(OAc)8]·3MeCN·0.5H2O were grown by the slow evaporation of an acetonitrile solution. The crystal structure comprises a discrete, hexanuclear, mixed-ligand complex, [Zn6L2(OH)2(OAc)8] (1), and several co-crystallized MeCN and H2O molecules. Figure 2 shows the structure of the neutral zinc complex. The zinc complex exhibits idealized C2 symmetry (neglecting the four benzyl groups of the supporting ligand). Two nearly isostructural [Zn3L(OH)(OAc)2]2+ moieties are connected by four μ1,3-briding acetate groups.
The three Zn2+ ions within the trinuclear subunits exhibit different coordination environments: Zn1 is six-coordinated by the imine N and phenolate O donors from the supporting ligand, three O atoms from three μ1,3-bridging acetato ligands and one triply bridging OH group in a distorted octahedral fashion. The Zn2 atom, on the other hand, is five-coordinated, being surrounded by imine N and phenolate O donors, two O atoms from two μ1,3-bridging acetates and the OH bridge. The coordination geometry of Zn2 is severely distorted and lies between the ideal trigonal bipyramidal or square pyramidal environments, as suggested by the τ value of 0.49 [58], or the SHAPE symmetry factors (Table S1) [59]. Finally, one Zn atom is coordinated in a distorted tetrahedral geometry by three O atoms from three μ1,3-bridging acetate groups and the triply bridging OH group. A selection of bond lengths and angles is given in Table 1. The bond lengths and angles show no unusual features and compare well with those in other six-, five- and four-coordinated Zn complexes. The corresponding bond lengths and angles within the two trinuclear subunits do not differ much. The angles around Zn1, for example, range from 80.33(16)° to 98.8(2)° and from 78.95(16)° to 98.98(19)° for the corresponding Zn4 atom in the other [Zn3L(OH)(OAc)2]2+ fragment. The structure of 1 is very similar to that of the hexanuclear complex [Zn6L′2(OH)2(OAc)8] supported by the ligand 2,6-bis((N-benzyl)iminomethyl)-4-methylphenol. This complex is also composed of trinuclear [Zn3L(OH)(OAc)2]2+ moieties [11]. Other polynuclear zinc carboxylato complexes are known; basic zinc acetate, Zn4O(CH3COO)6, is a prominent example [60].
Single crystals of [Zn4L4(µ-OH)2](ClO4)2·3MeOH·0.5MeCN (2·3MeOH·0.5MeCN) suitable for X-ray crystallographic analyses were grown by the slow evaporation of a mixed DCM/MeOH/MeCN (3:2:1) solution. The perchlorate salt crystallizes in the monoclinic space group P21/n with four formula units per unit cell. Figure 3 displays the structure of the tetranuclear Zn complex. Selected bond lengths and angles are listed in Table 2. The crystal structure is composed of tetranuclear [Zn4L4(µ-OH)2]2+ complexes, perchlorate ions and co-crystallized MeOH and MeCN molecules. The two [Zn2L2]2+ fragments are joined via two bridging hydroxido ligands to generate the [Zn4L4(µ-OH)2]2+ complex’s dication. The Zn2+ ions are all five-coordinated, and they are surrounded by two imine N and two bridging phenolate O atoms from the supporting ligand and one bridging hydroxido ligand. The τ values range from 0.49 to 0.52, indicating that the coordination geometries of the Zn2+ ions lie in between the ideal trigonal bipyramidal or square pyramidal environments. This is also supported by the SHAPE symmetry factors given in Table S1. The Zn-N bond distances between 2.048(3) and 2.118(3) Å as well as the Zn-O distances between 1.962(2) and 2.154(2) Å are all within the usual ranges for such complexes.

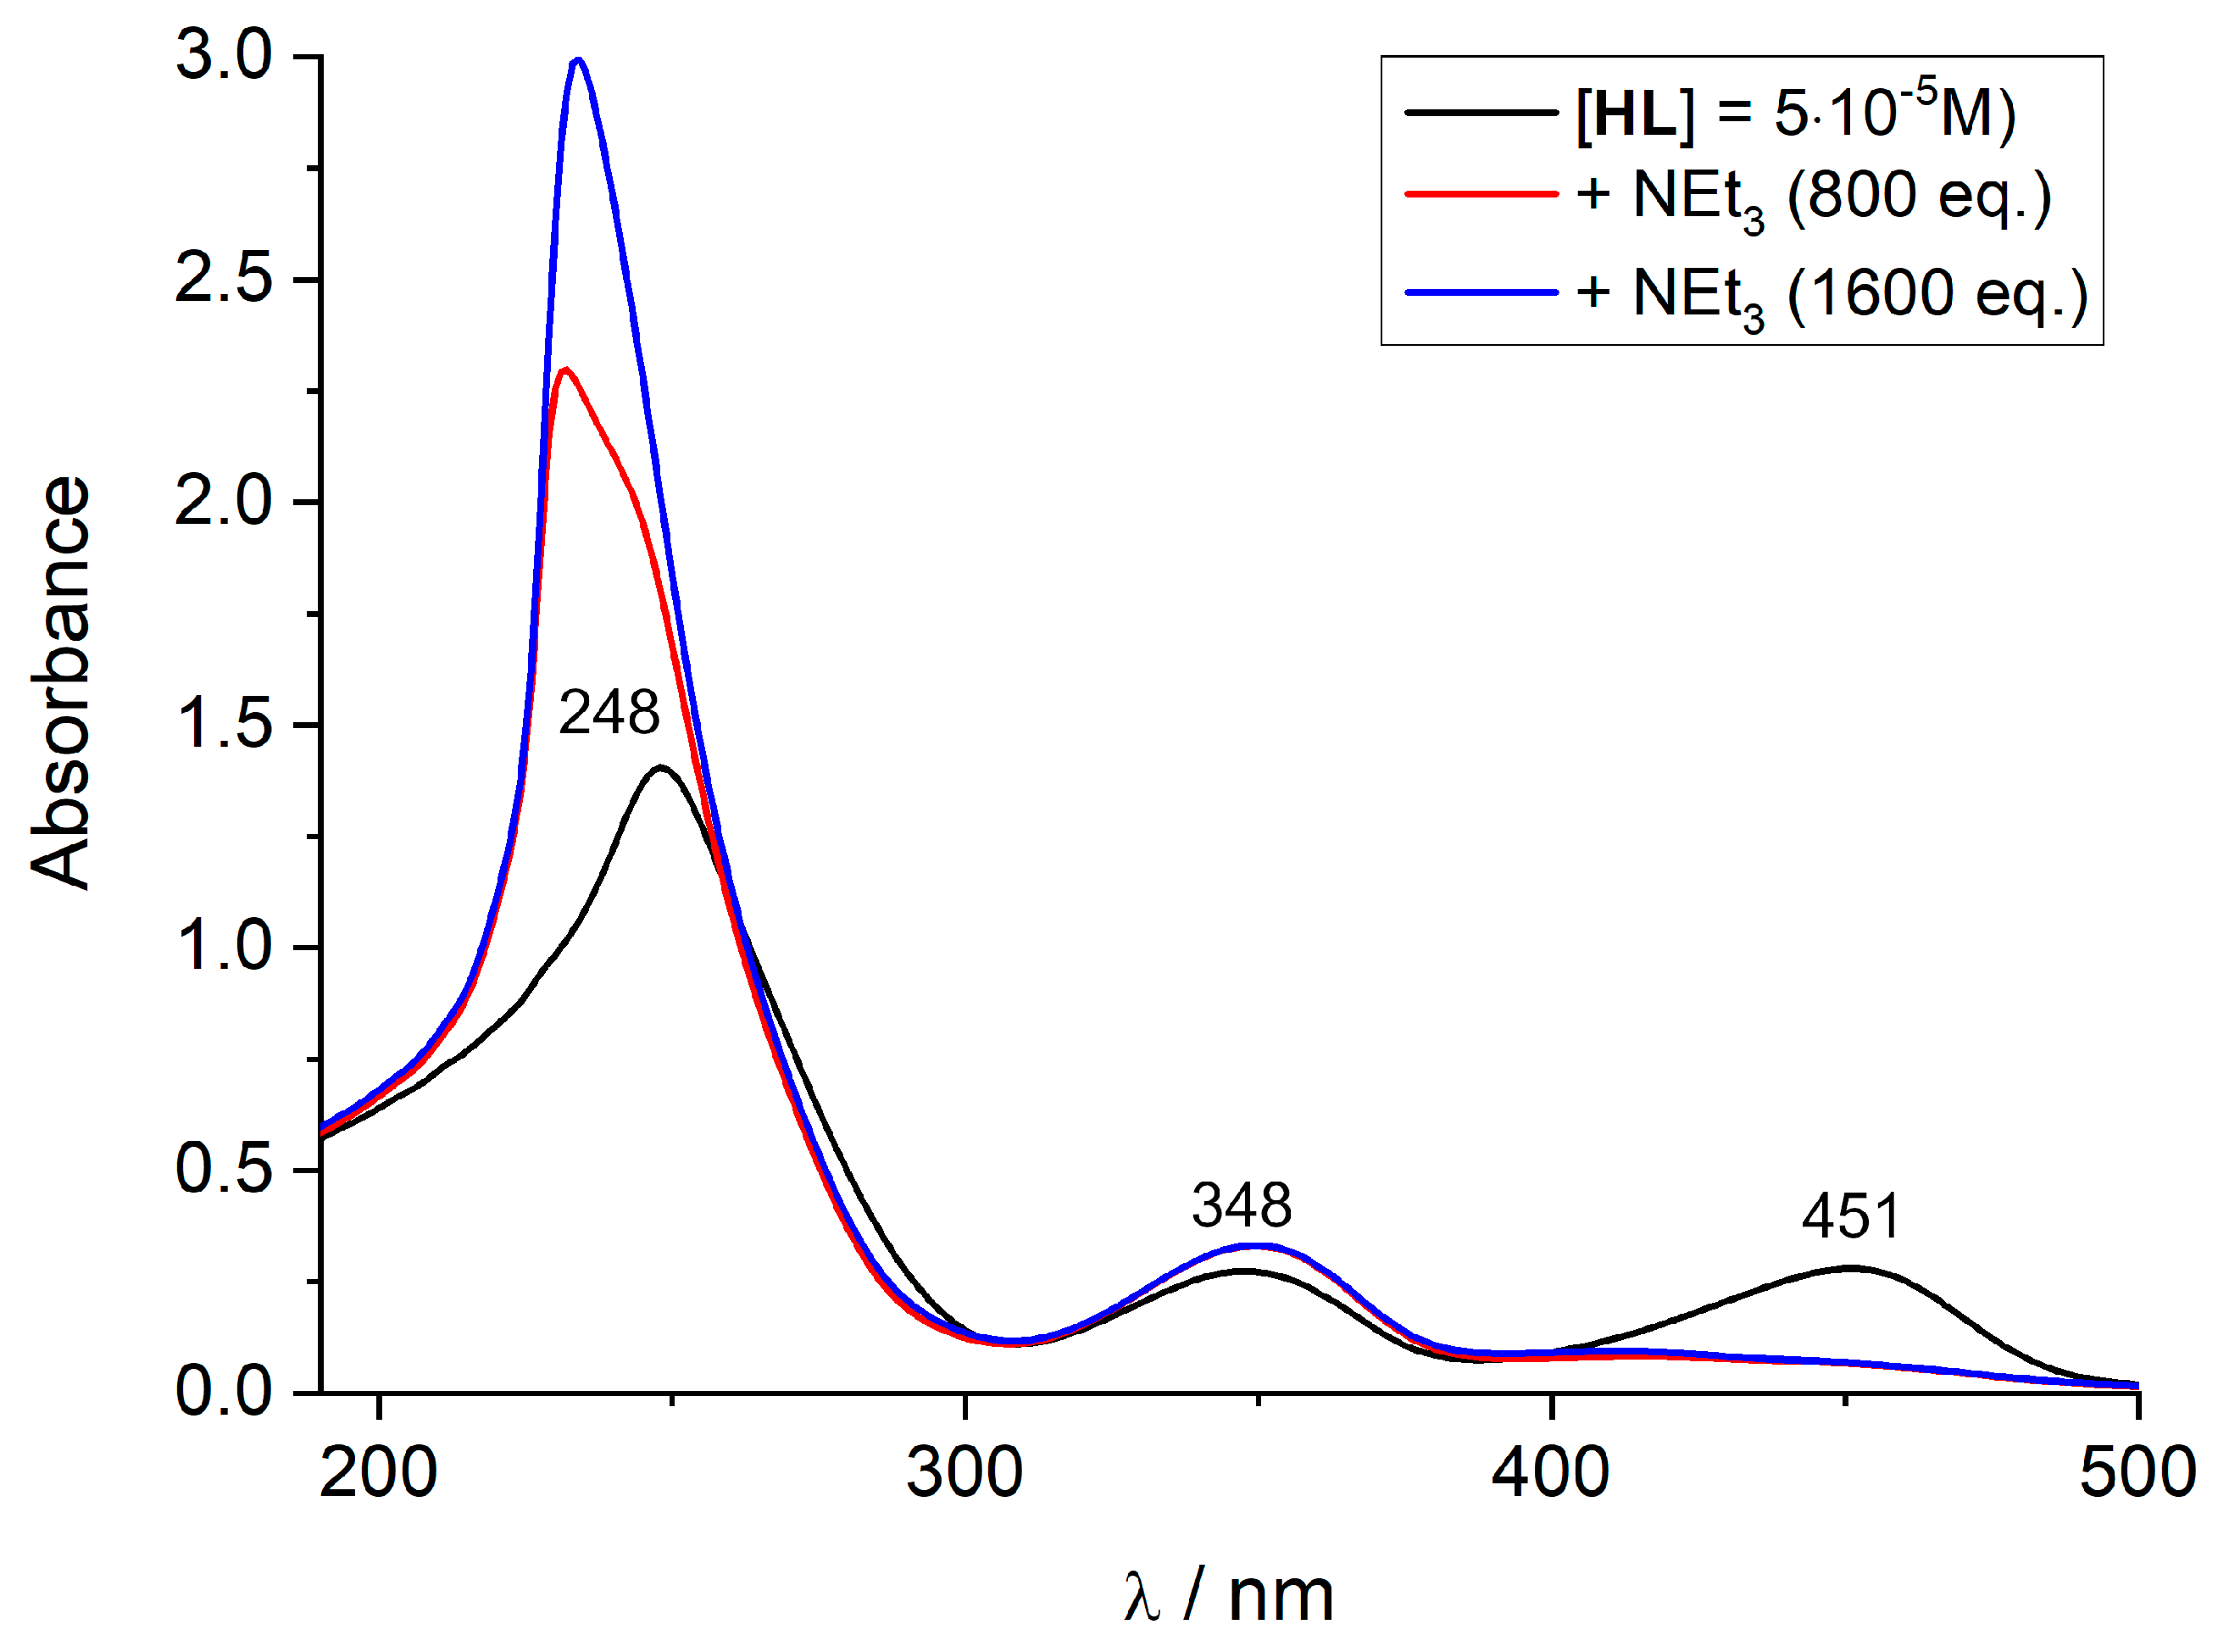
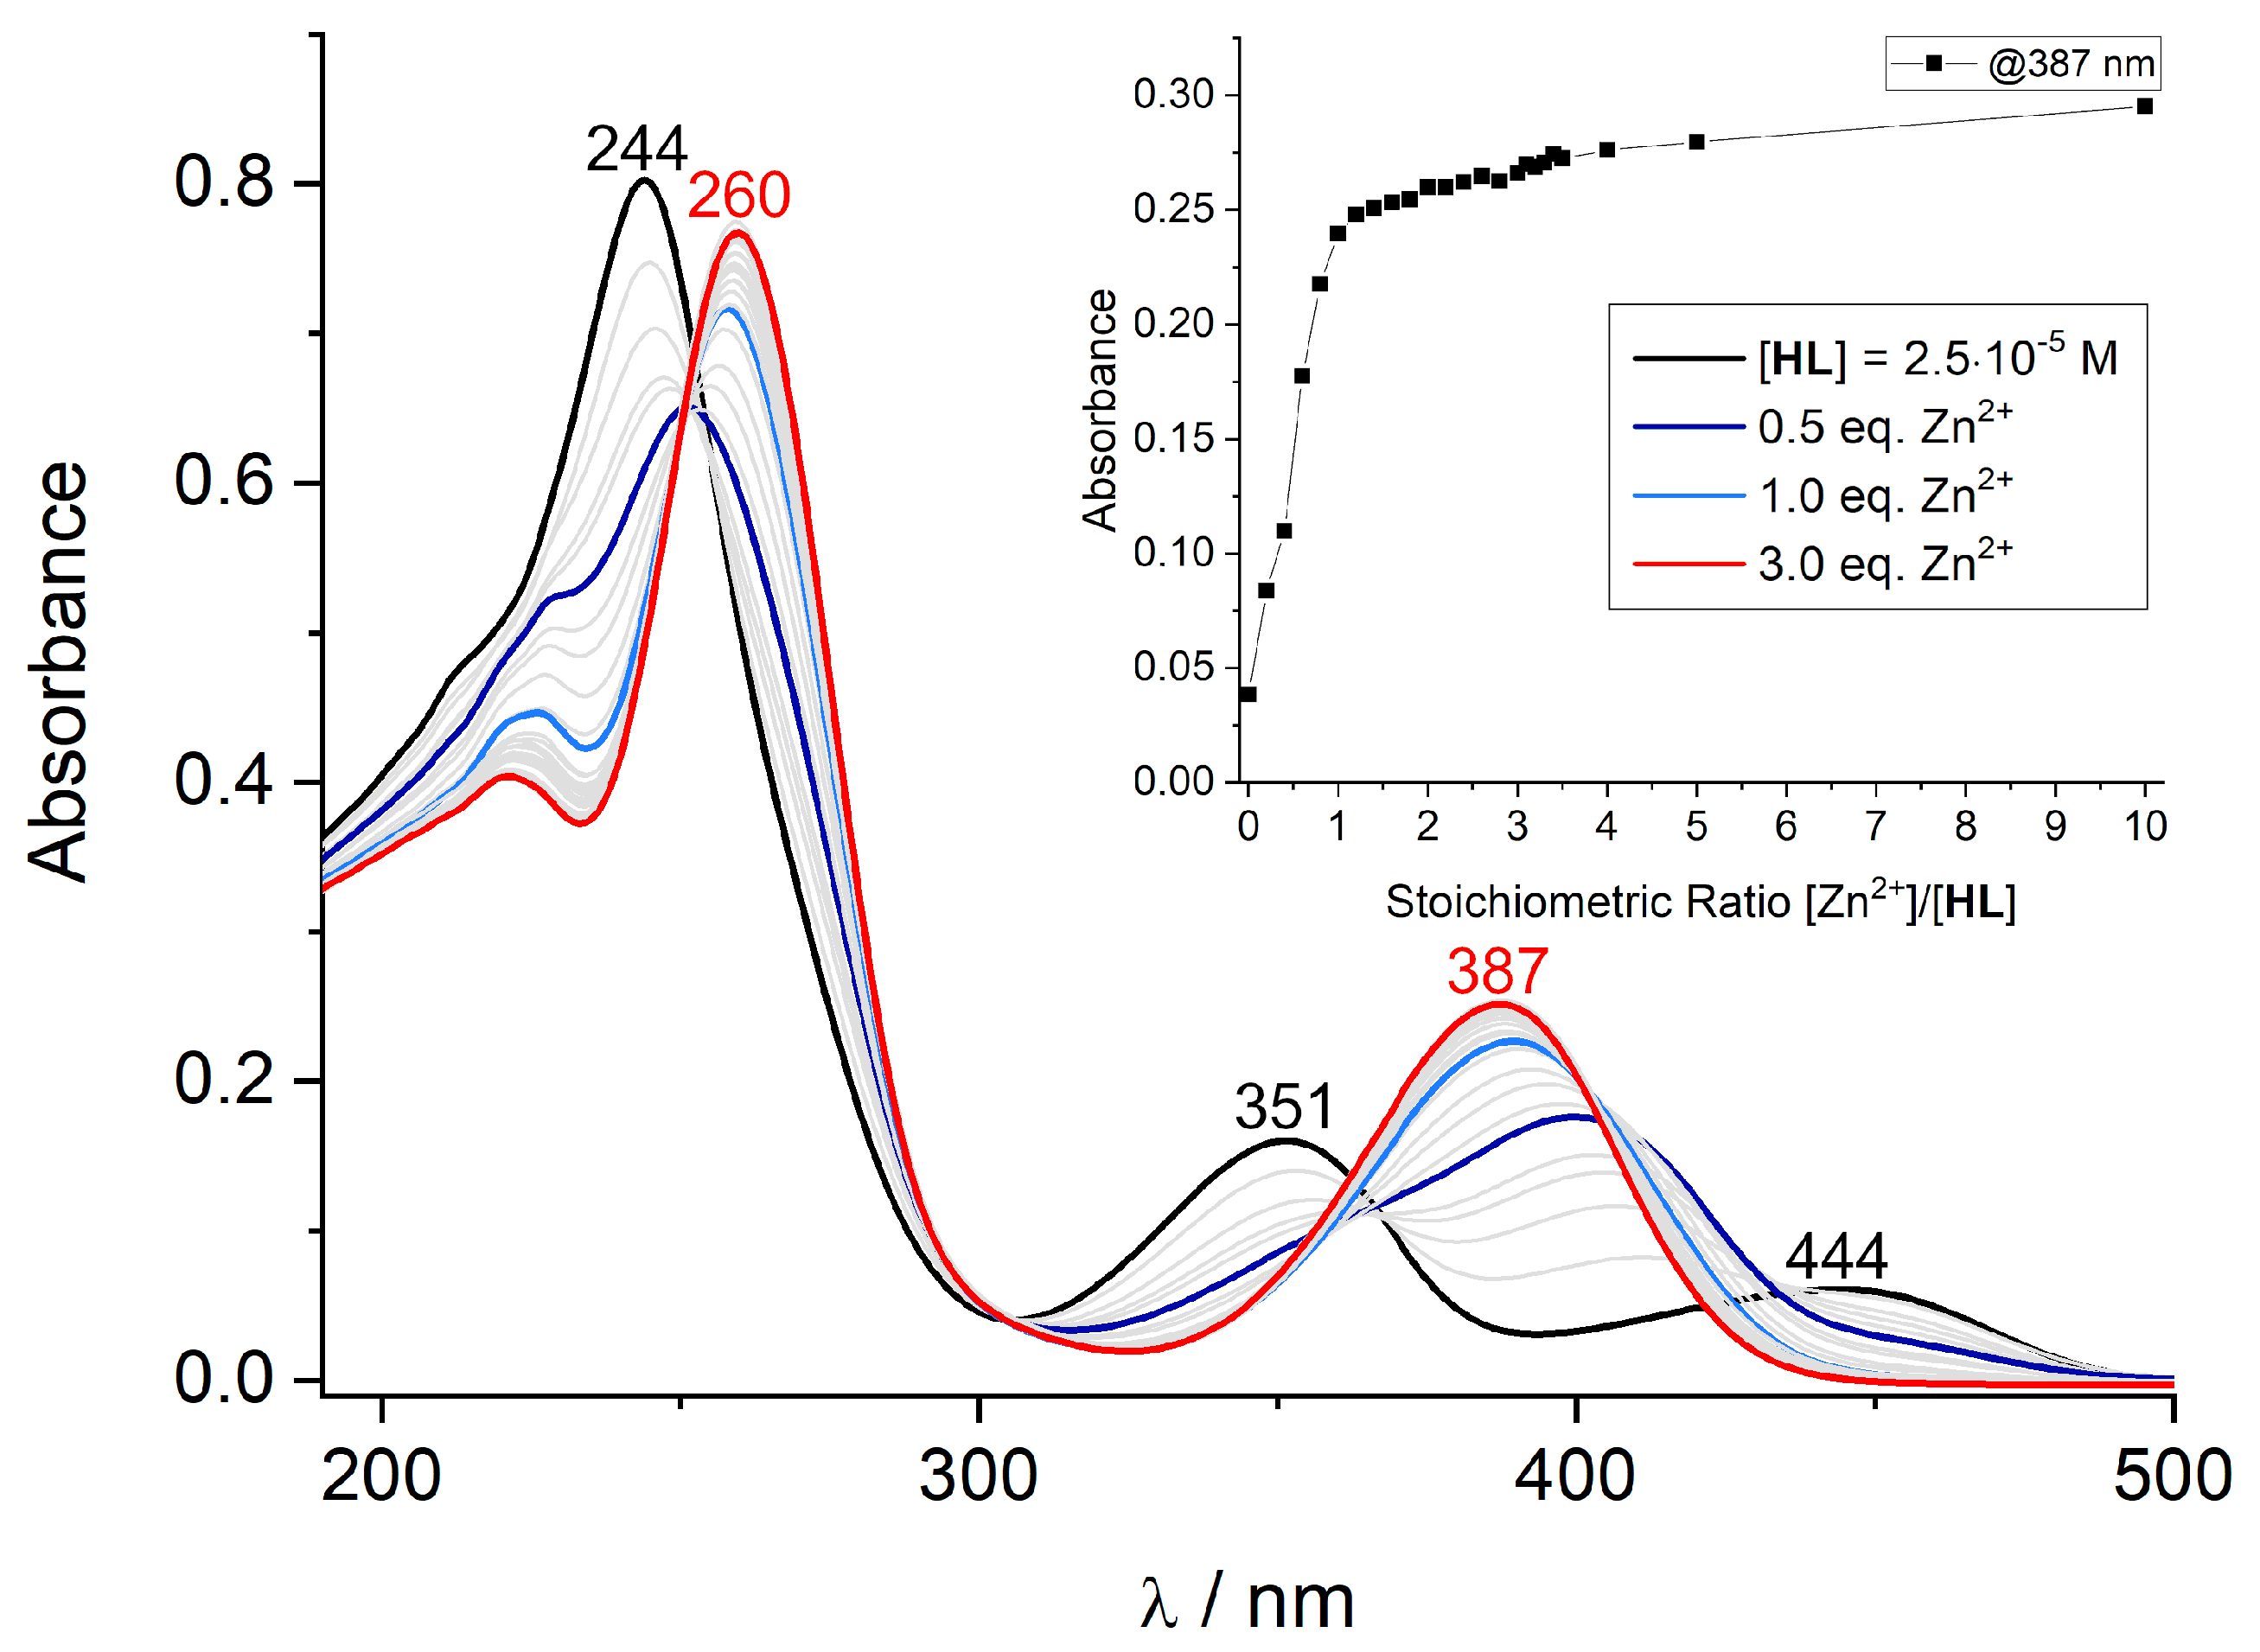
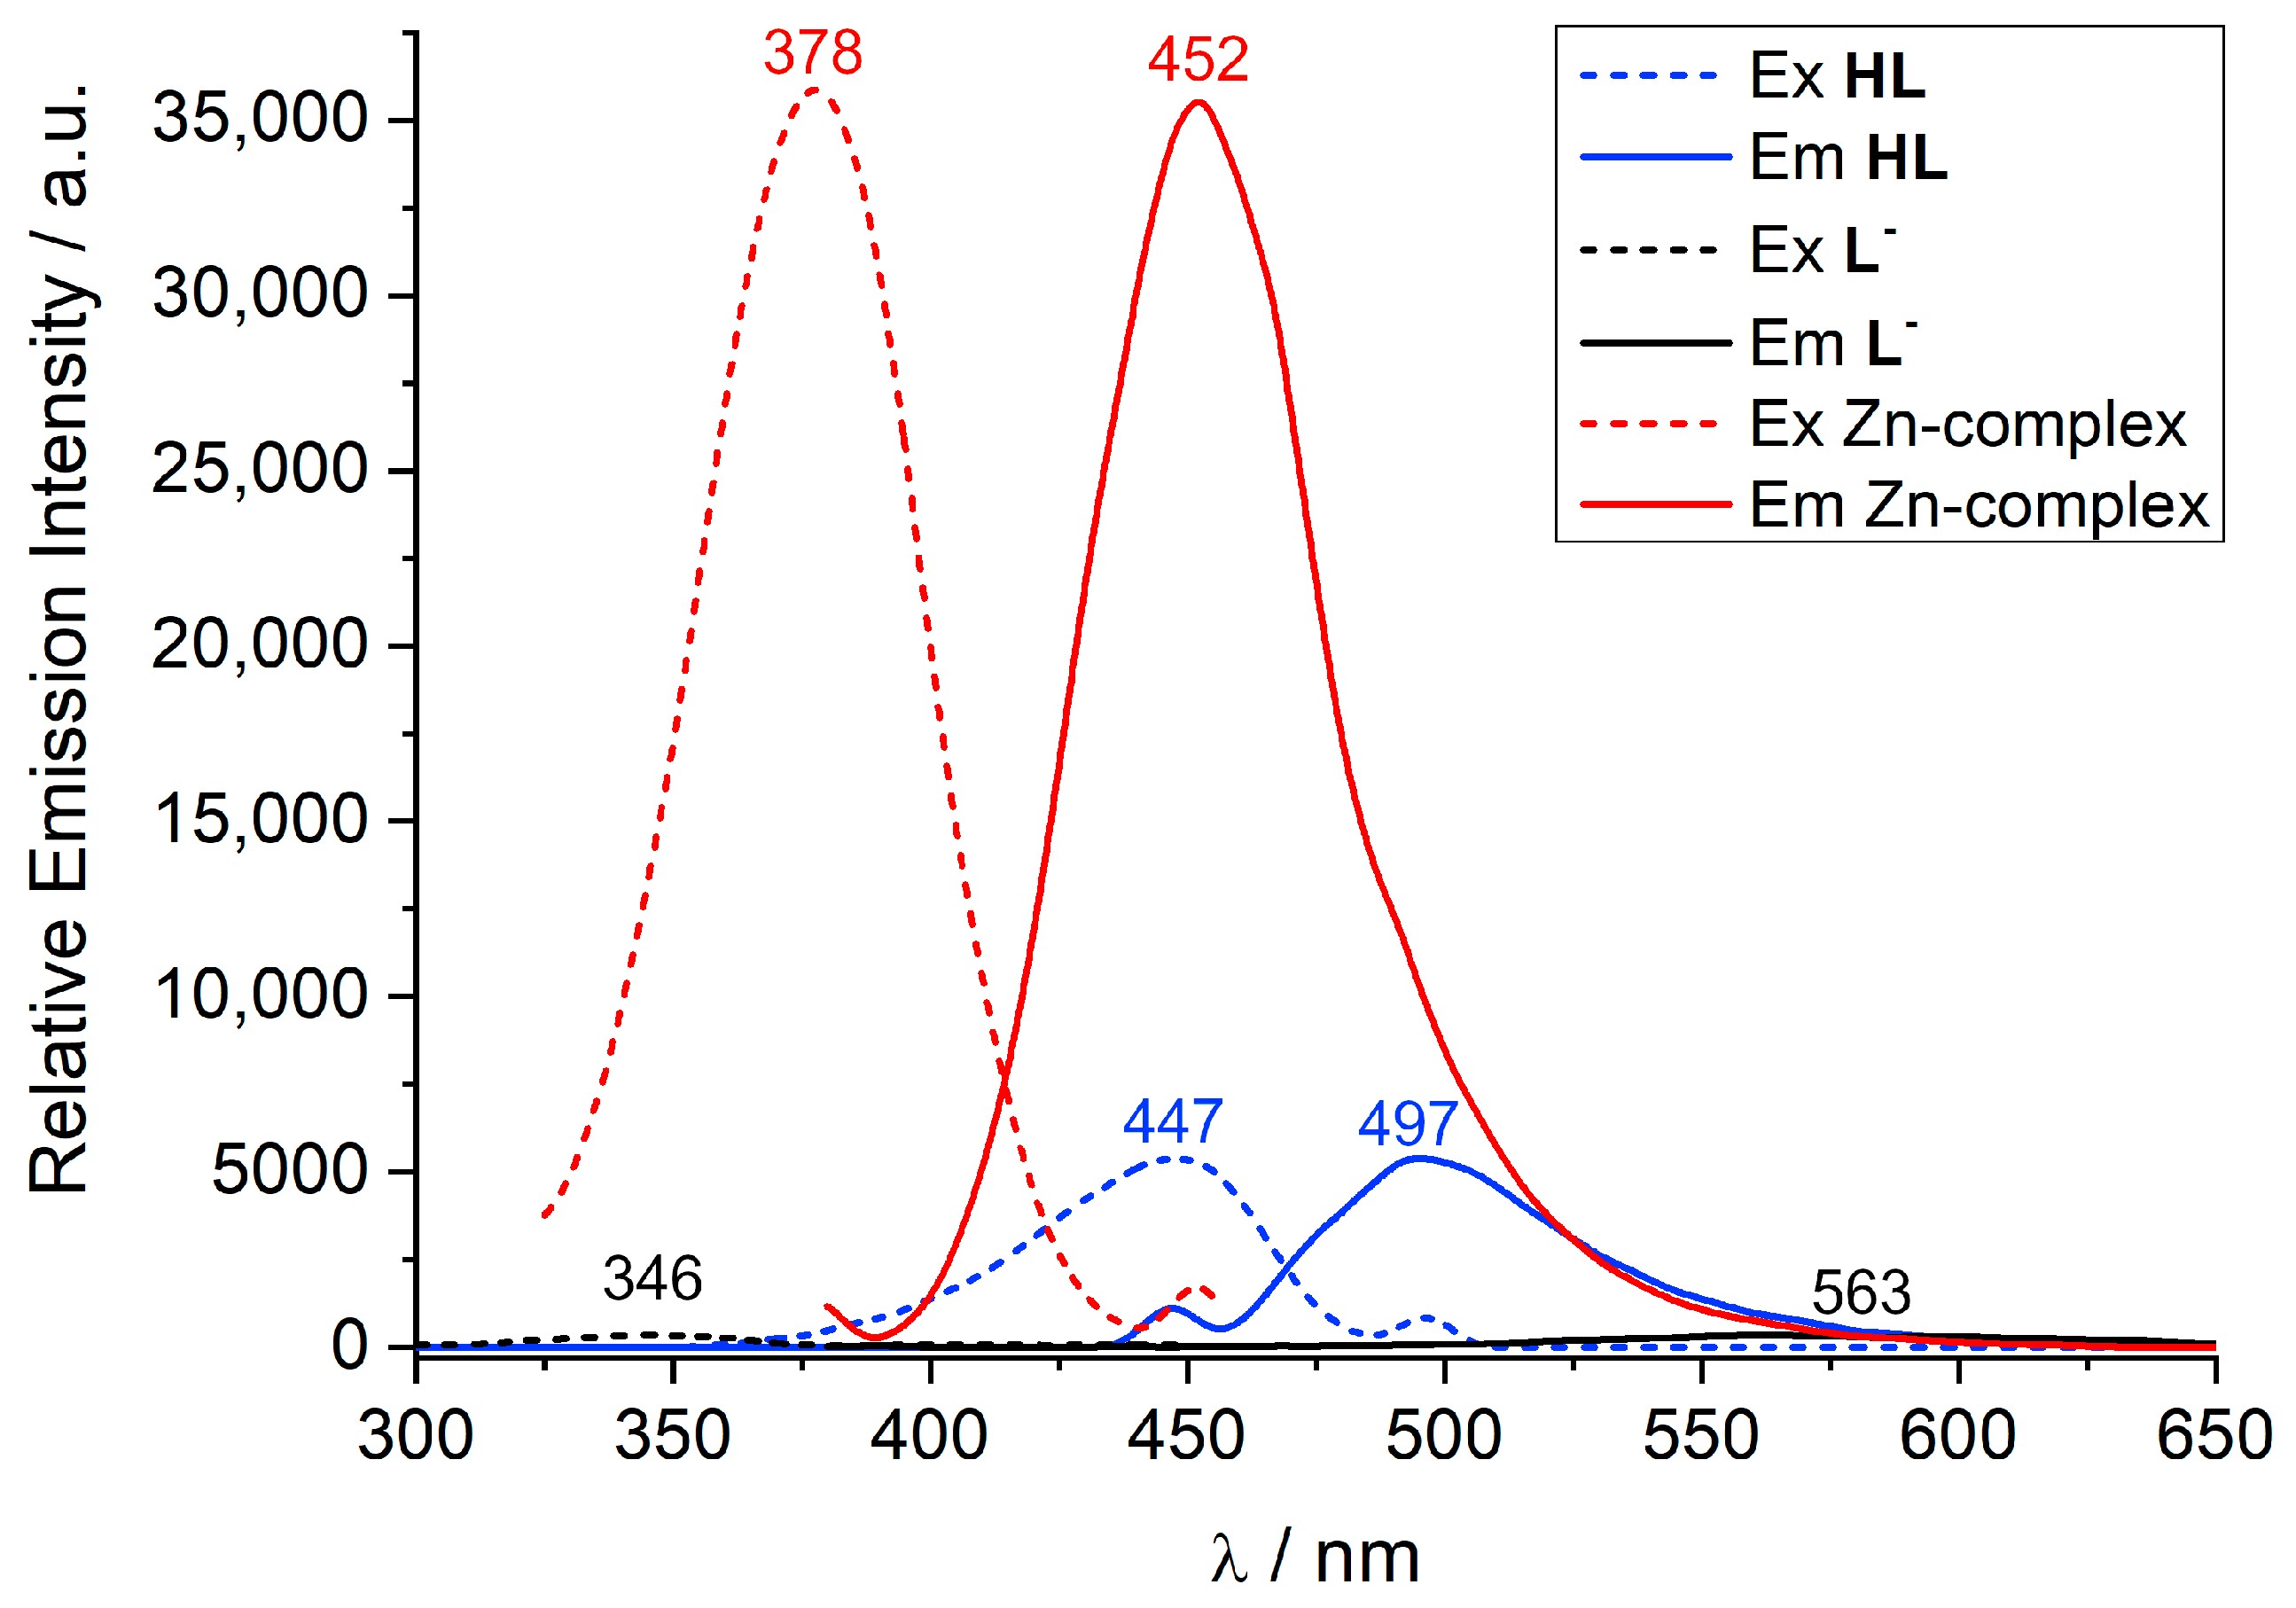
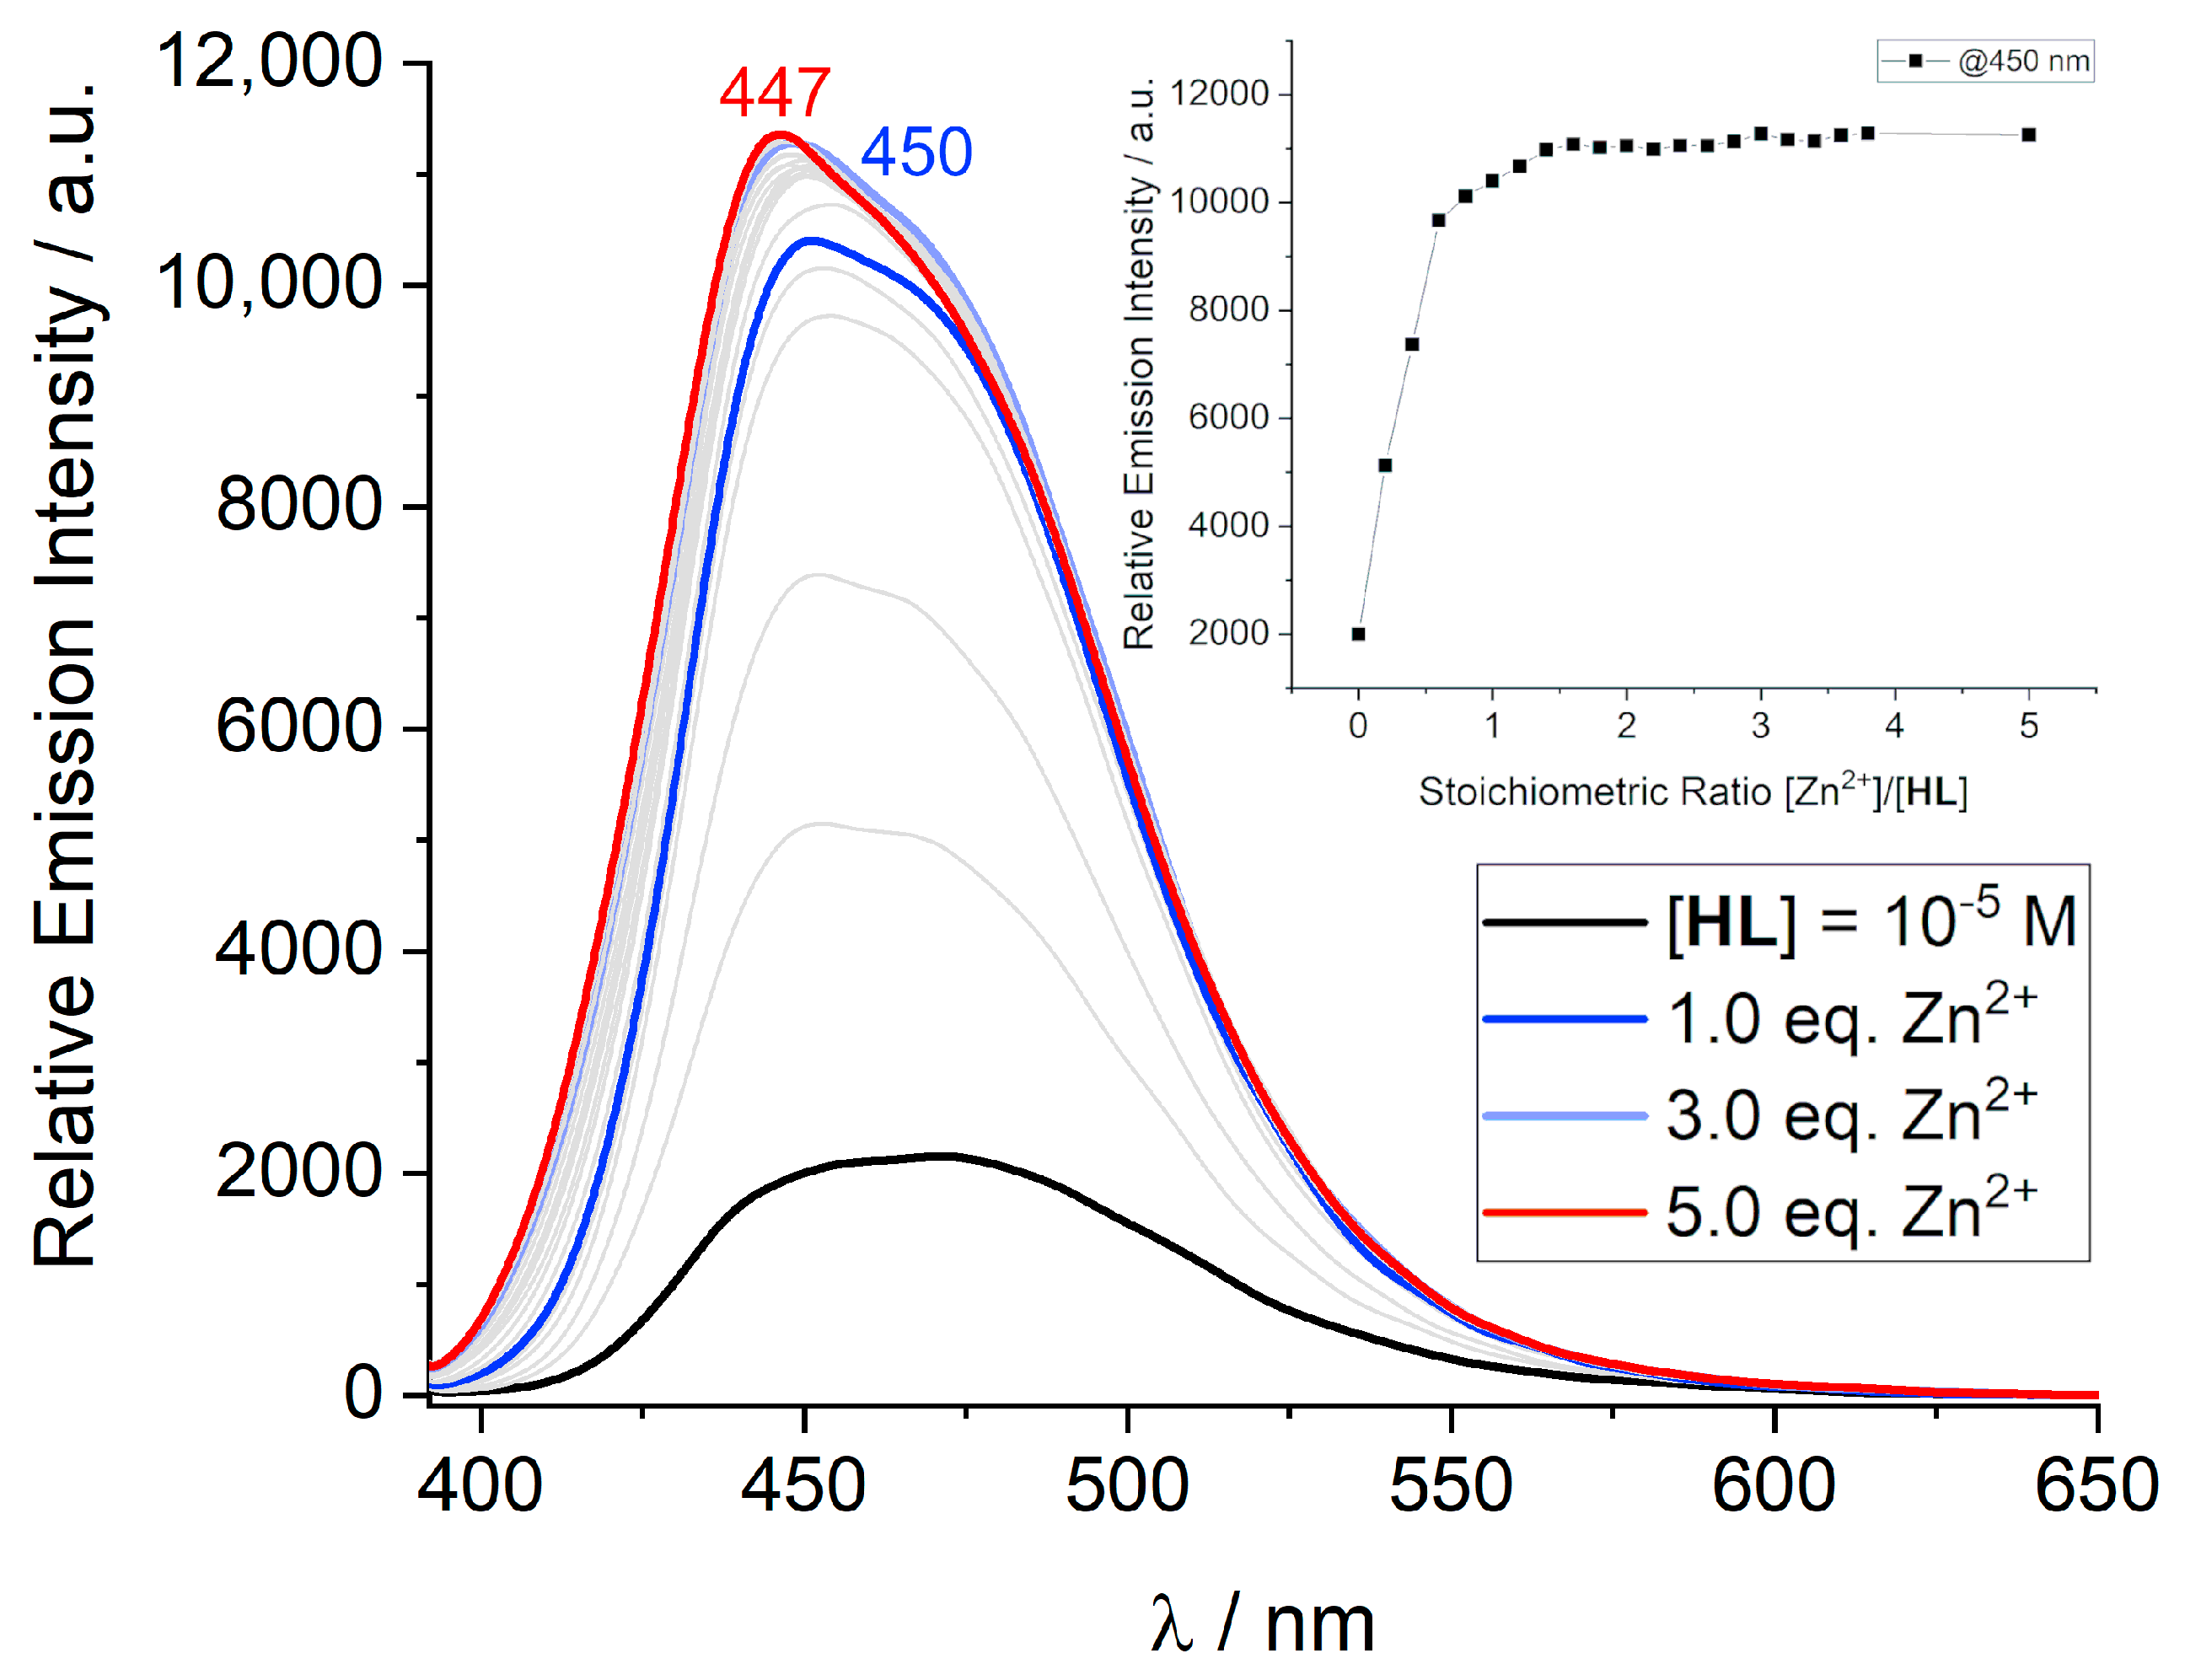
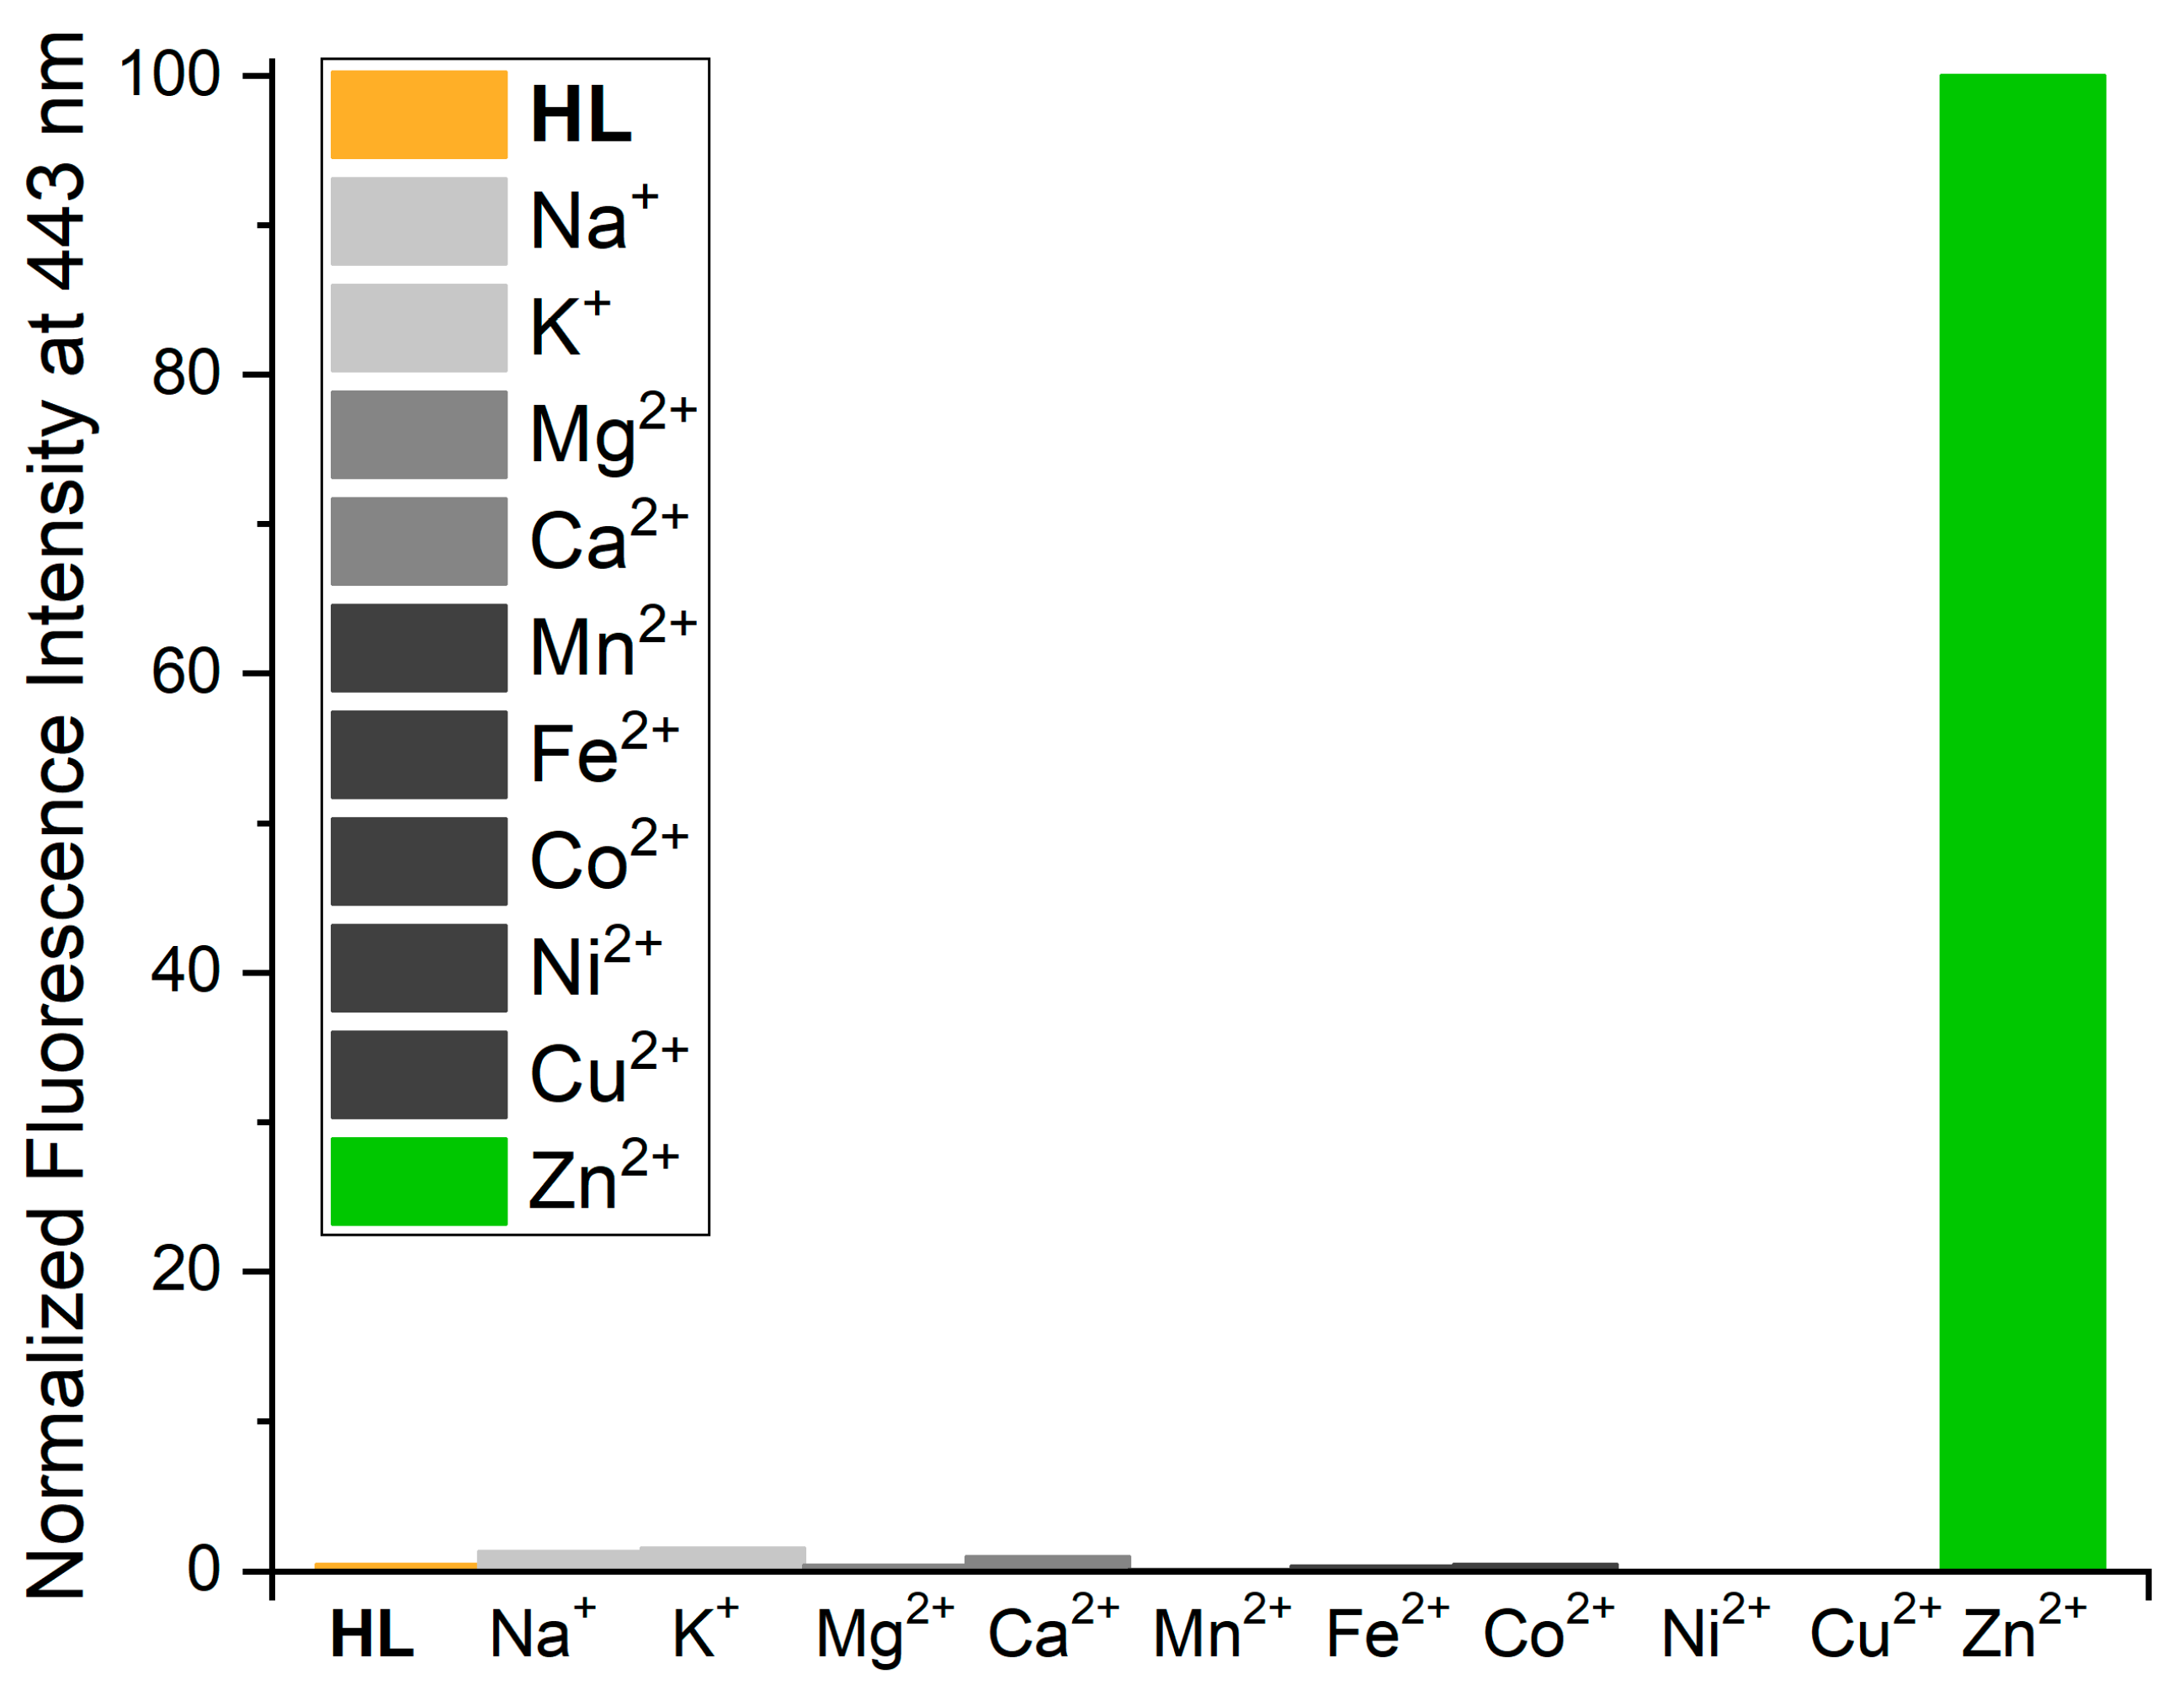
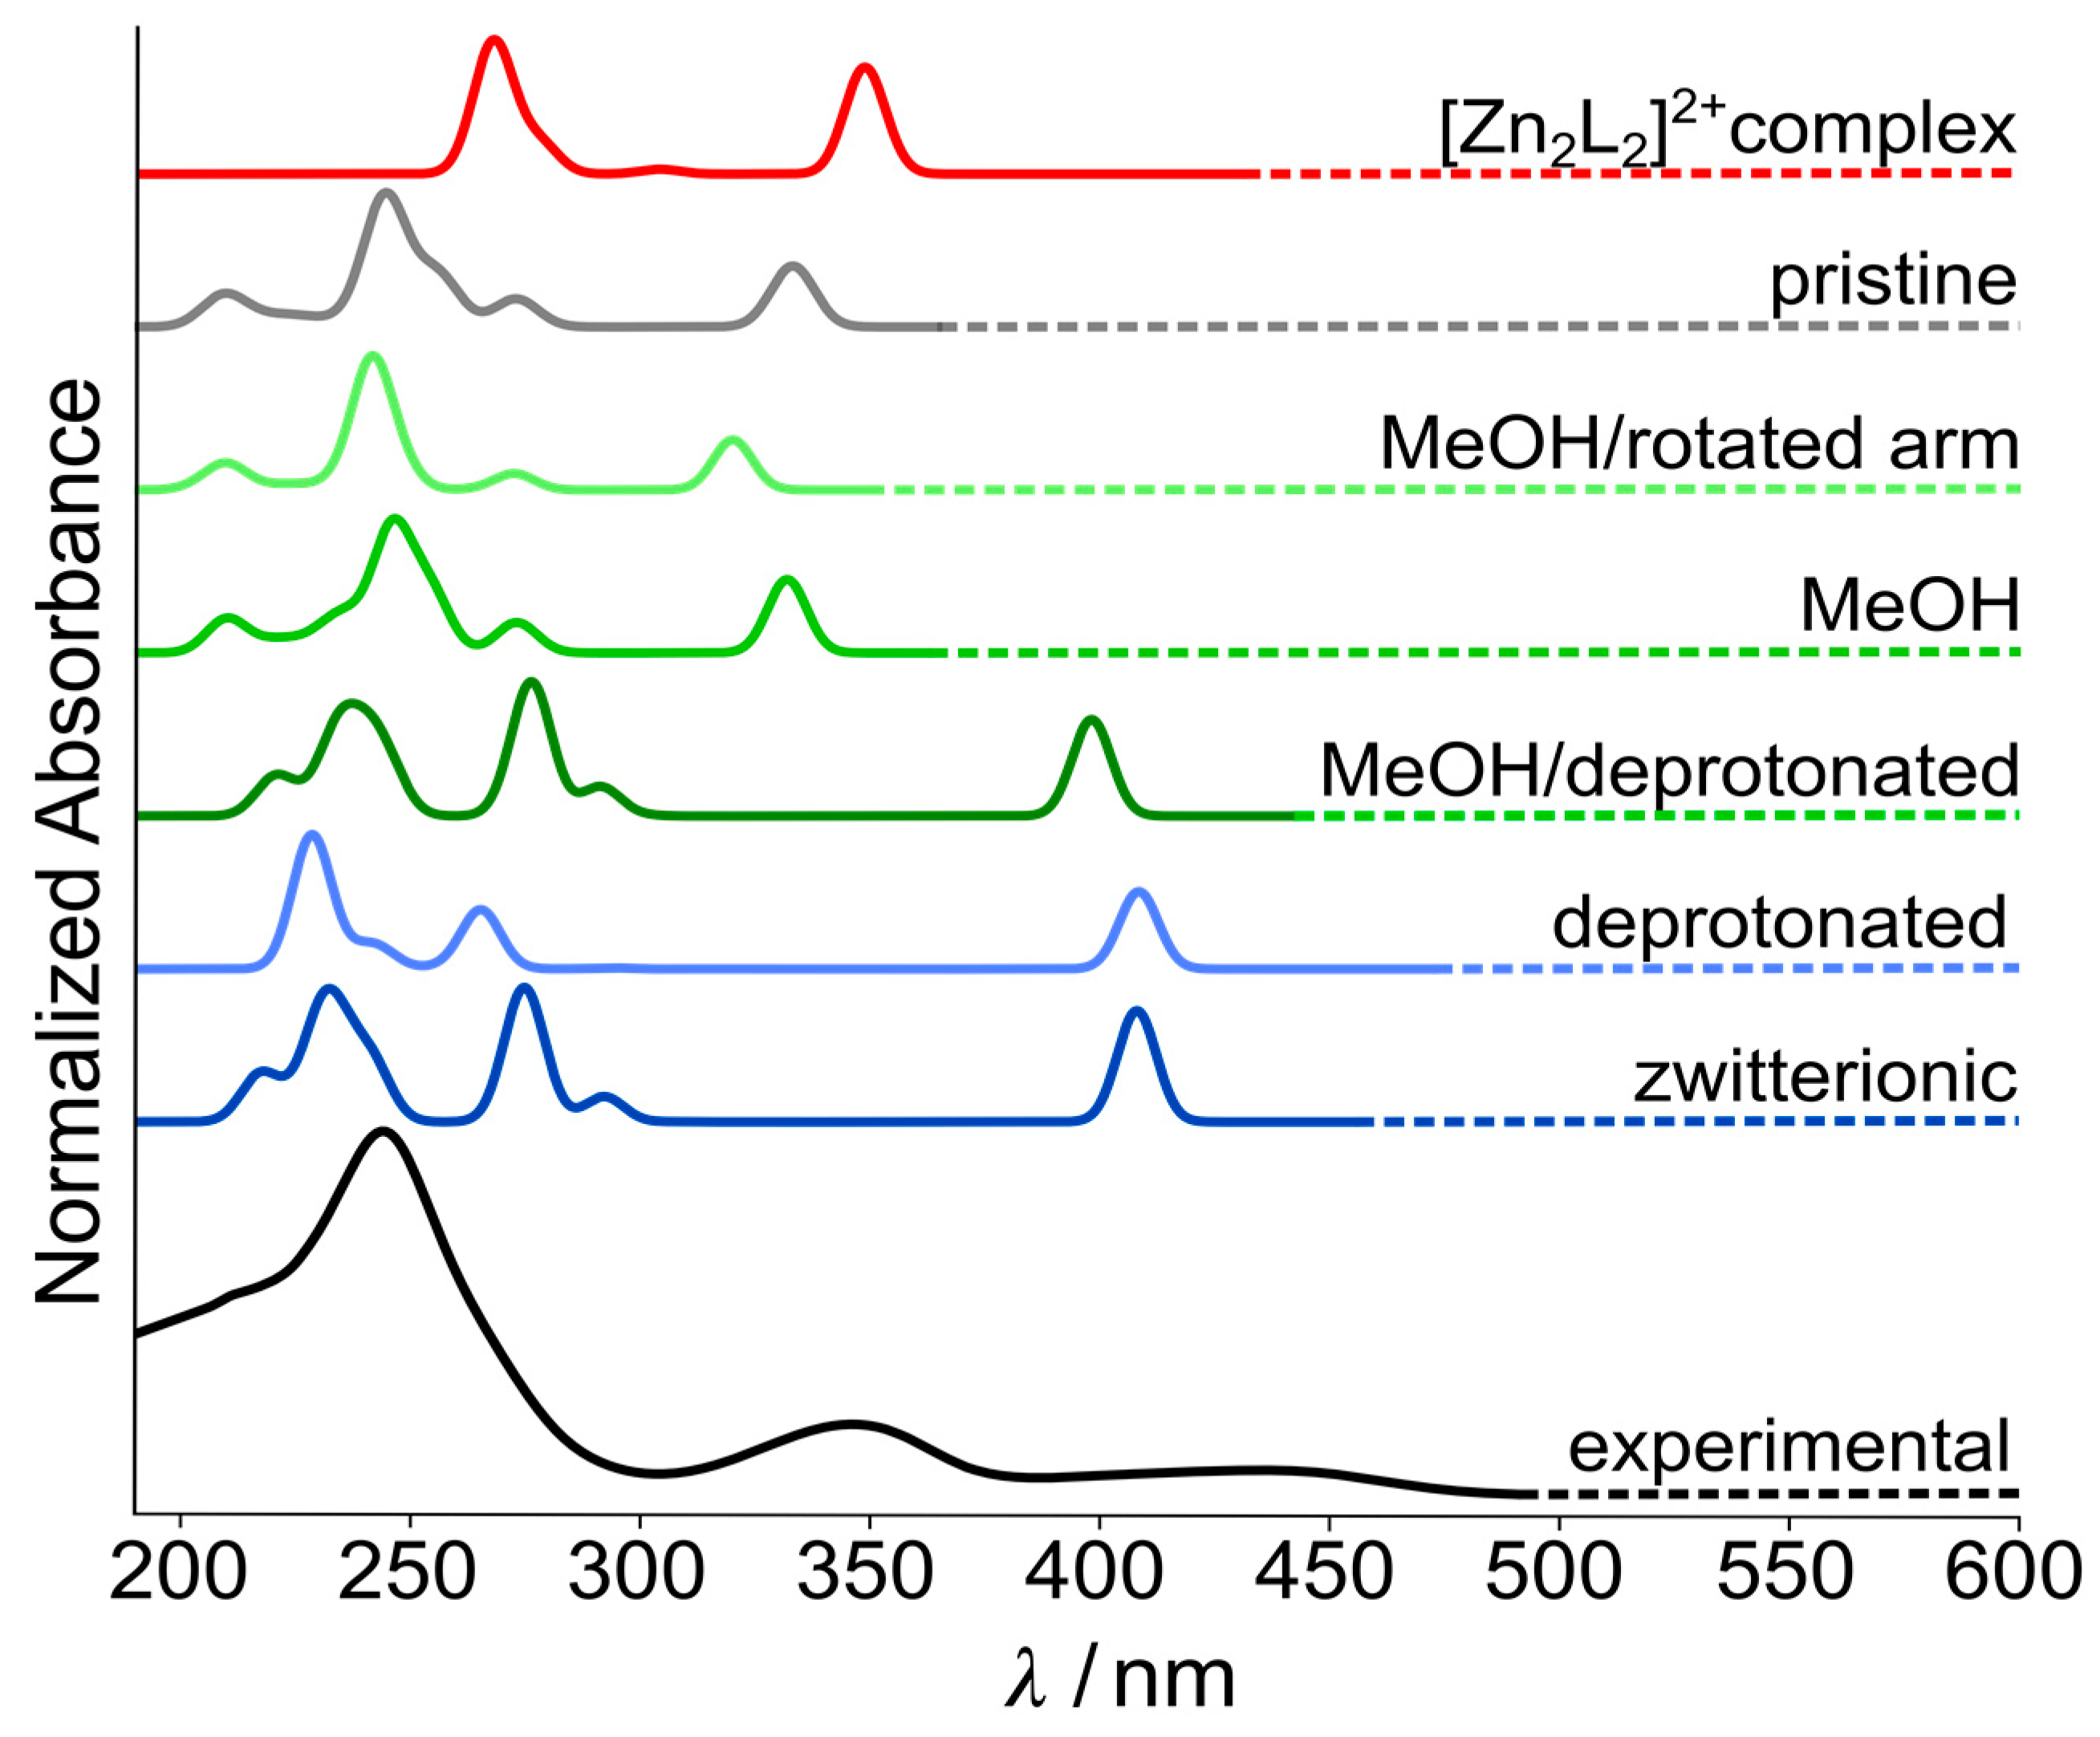
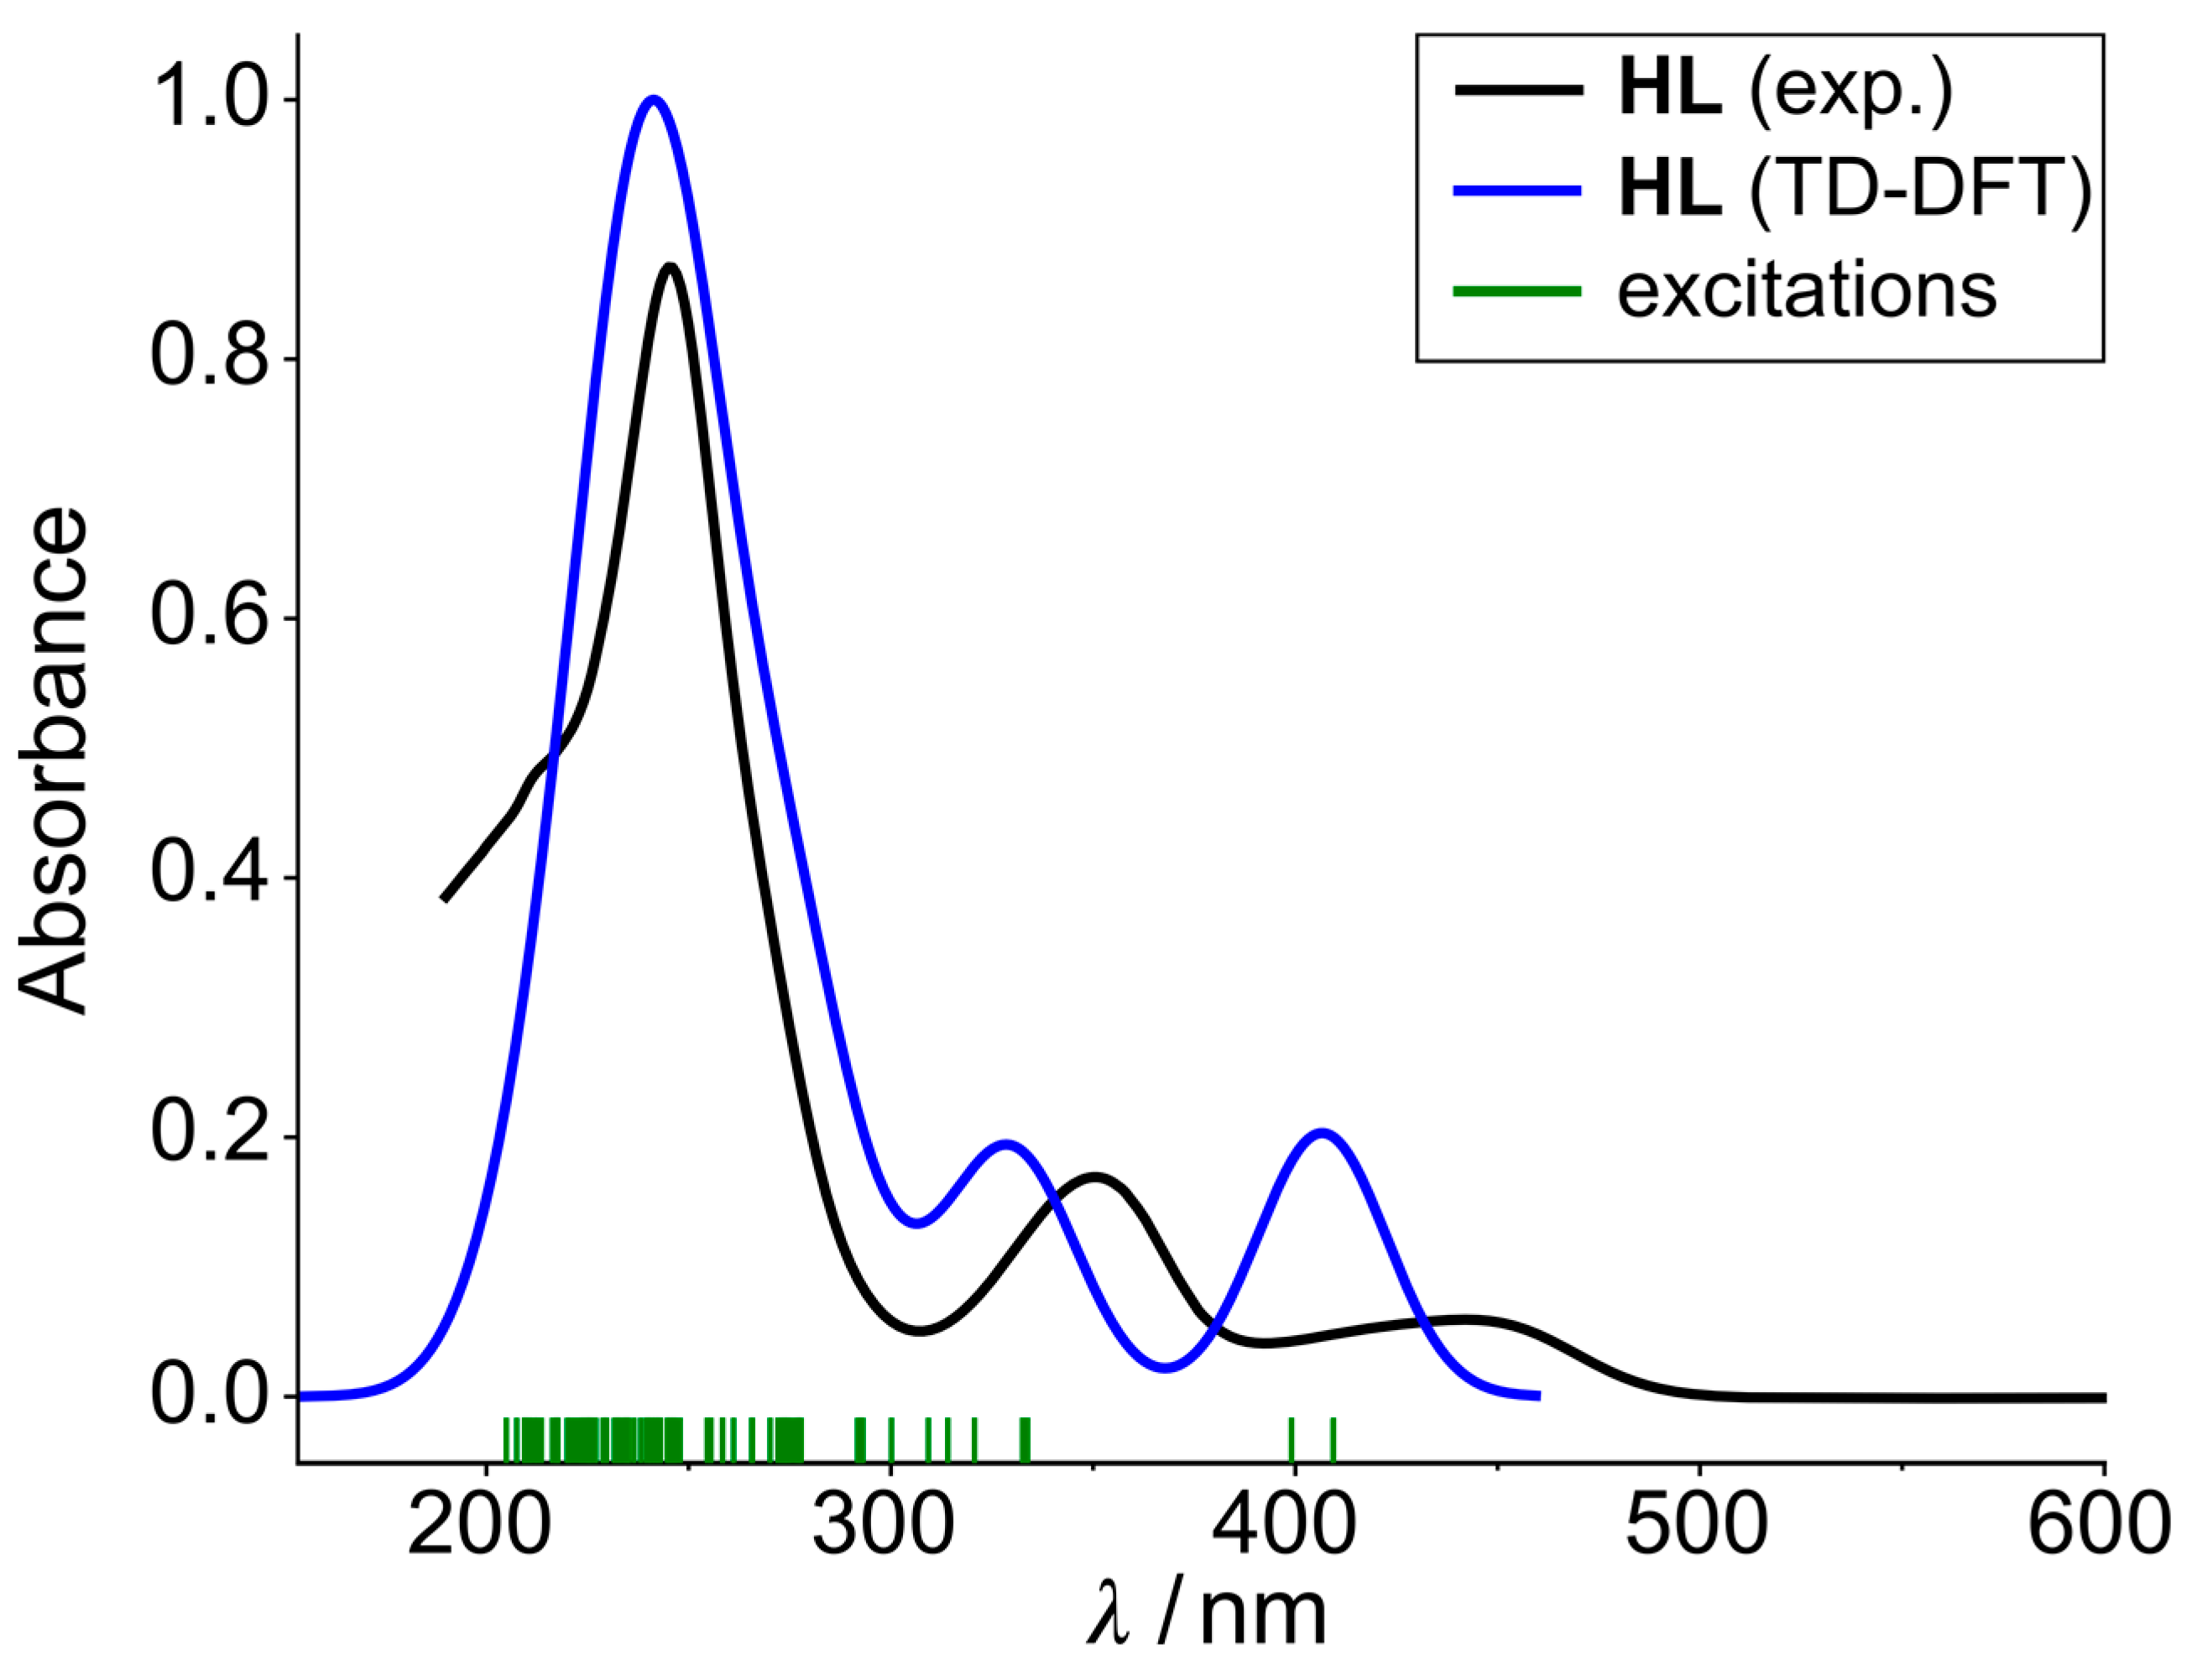
3.3. Electronic Absorption and Emission Spectroscopy

The synthesized compounds were further characterized using UV-vis absorption and photoluminescence spectroscopy. The electronic absorption spectra for the free ligand HL and its deprotonated phenolate form, L, were measured in a mixture of DCM/MeCN (3:2) at room temperature. The spectrum of the free ligand displays three main absorption maxima (Figure 4). The absorption maxima and corresponding extinction coefficients are listed in Table 3.
The broad band with an absorption maximum at 248 nm is attributed to the π-π* transitions localized on the phenol and phenyl rings of HL, according to time-dependent density functional theory (TDDFT) calculations (see details below). The lower-energy bands with absorption maxima at 348 nm and 451 nm, on the other hand, are assigned to electronic transitions within a more extended π system involving the phenolate ring and the two imine groups. The UV-vis spectrum of the deprotonated ligand differs significantly from that of the protonated ligand. It reveals two well-resolved absorption maxima at 234 and 349 nm. Instead of the band at 450 nm observed in HL, there is a tail on the 349 nm band that extends into the visible range but with no well-developed maximum. Thus, deprotonation has a strong effect on the spectroscopic properties of HL.
To study the complexation reactions of HL with Zn2+ ions in the solution, UV-vis spectrophotometric batch titrations were carried out. The method of Yoe and Jones was used here, in which the ligand concentration is kept constant over the entire range and the amount of Zn2+ is raised stepwise until a stable complex species is formed [61,62,63,64]. Tetra-n-butylammonium hexafluorophosphate (10 mM) was added to the used solvent mixture (3:2—DCM/MeOH) to ensure a constant ionic strength during the complexation reactions.
The addition of aliquots of Zn(OAc)2 (from 0.1 to 10 equiv.) leads to clear changes in the UV-vis spectrum of the ligand (Figure 5). Thus, the bands at 350 and 450 nm for HL vanish with increasing Zn2+ concentrations, and a new band with a maximum at 387 nm emerges (at a Zn/L ratio of 1.0 equiv.), providing clear support that Zn2+ binding to the bis(iminophenolate)ligand L occurs. Adding the further equivalents of Zn(OAc)2 leads to a weak but significant hyperchromic effect manifested by the slight increase in the intensity of the 387 nm band. The Yoe and Jones method was applied in order to determine the stoichiometric ratio of the complex. As observed from the inset of Figure 5, the plot of the absorbance value versus stoichiometric ratio [Zn2+]/[HL] increases very steeply up to 1:1, and then there is a further, but much less pronounced, increase in intensity, suggesting that additional Zn2+ ions will not directly interact with the donor atoms of HL. The spectroscopic titration of HL with Zn(ClO4)2.6H2O behaved in a very similar fashion (SI). Overall, these findings suggest that the ligand examined here has a strong propensity to form Zn2+ complexes with a 1:1 metal/ligand ratio. This ratio would be consistent with the 2:2 stoichiometries found in the solid state and implies that such 2:2 complexes also exist in the solution state. In the presence of additional co-ligands, this ratio may be increased, but it is accompanied by much less pronounced changes in the spectroscopic features of supporting ligand HL. These findings are also consistent with those made by fluorescence spectroscopy described below.
The complexation reactions were further examined using fluorescence spectroscopy. The emission spectra of compounds HL, L, and of a 1:3 solution of HL and Zn(OAc)2 are displayed in Figure 6 along with the corresponding excitation spectra. The emission spectra were measured in acetonitrile solution at the 10−5 M concentration. Table 3 lists the data. The free ligand fluorescence is blue-green, reflected in a single emission band with a maximum at 497 nm when excited at 447 nm. The excitation spectrum of HL monitored at 497 nm corresponds to the absorption spectrum and reveals an absorption band at 447 nm that is assigned to a transition into the 1(π-π*) state of the bis(iminomethyl)phenol system. The deprotonation of the ligand has a strong effect on the luminescence properties. This can be detected by the naked eye. Thus, in contrast to HL, L exhibits a very weak, intraligand 1(π-π)* fluorescence emission band at 563 nm. The luminescence intensity decreases by a factor of 15, and the Stokes shift increases from 2250 cm−1 for HL to 11,139 cm−1 in L. Remarkably, the complexation of the ligand by Zn2+ leads to a circa six-fold enhancement of the luminescence intensity, which is also accompanied by a hypsochromic shift in the emission band to 452 nm. This behavior has been observed for other Zn2+ complexes supported by o-hydroxy-aryl Schiff base ligands [65,66,67,68]. The enhancement of the emission intensity can be explained by the CHEF effect (chelation-enhanced fluorescence effect) due to the inhibition of photo-induced electron transfer processes [69,70].
Figure 7 displays a titration of HL with Zn(OAc)2 monitored by fluorescence spectroscopy at 0.01 mM concentration. As observed, the intensity of the emission band at around 450 nm increases steadily with increasing Zn2+ concentrations. An inflection point occurs at a metal-to-ligand ratio (M/L) of 1:1. At higher M/L ratios, the emission intensity remains nearly constant. These observations are in good agreement with the conclusions provided by UV vis spectroscopy and provide strong support for the presence of Zn2+ complexes with 1:1 M/L ratio. The slight blue shift of the maximum of the emission band from 450 to 445 nm may be due to the change in the coordination geometry of the initial coordination geometry, such as an attachment of additional acetate or hydroxide ligands, although other factors cannot be ruled out.
The luminescence properties of the ligand HL were investigated in the presence of other metal ions in view of reports from the literature that o-hydroxy-aryl compounds allow for the sensitive optical detection of Zn2+ ions among other metal cations [11]. Thus, methanolic solutions containing the equimolar quantities of the ligand and a series of abundant and biologically relevant p- and d-bock metals were prepared, and their emission properties were determined. Figure 8 shows that none of the investigated metal ions reveals a fluorescence enhancement. This is either attributed to the poor binding affinity of some metal ions to the Schiff-base ligands (in the case of Na+, K+, Mg2+ and Ca2+) or the quenching of the excited singlet states by electron transfer reactions involving the d-states of open-shell transition metal ions (in case of Mn2+, Fe2+, Co2+, Ni2+ and Cu2+).
Several other fluorescent OFF_ON sensors for Zn2+ ions based on salicylidene aldimine binding sites have been reported [11,20,65]. Zn2+ binding enhances the rather weak intraligand 1(π-π) fluorescence emission of the free ligands significantly due to the inhibition of photo-induced electron transfer processes [65]. Zn2+ ion binding also rigidifies the ligand architecture, thereby decreasing the probability of the vibrational deactivation of the excited singlet state [34,35].
The fluorescence intensity of HL as a function of the Zn2+ concentration was investigated in order to determine the LOD value (limit of detection value), which provides the lowest concentration that can be measured. Fluorescence intensity was found to be linear between 1 × 10⁻⁶ and 1 × 10⁻⁷ M Zn2+ and produced an LOD value of 0.24(1) ppm. This value is comparable to those of other Zn2+ fluorescence sensor systems featuring imino-phenolate units [11,34,35].
In order to support experimental findings, we have carried out TD-DFT calculations on ligand HL, differently (de-)protonated species and a [Zn2L2]2+ complex to simulate the UV-vis absorption spectra (for details, see the Experimental Section). By considering various forms of HL, dynamic and solvent effects could be accounted for, allowing the full assignment of absorption bands in the experimental spectra (see Figure 9).
The band with the largest intensity was assigned to various π-π* transitions, while the band at around 350 nm was assigned to a π-π* transition with a contribution from the n-orbitals of the OH group. The lowest excitations at 450 nm were assigned to a π-π* transition with contributions from the deprotonated phenol group, and it was observed that the deprotonation resulted in a large redshift into the visible light range. As it is shown in Figure 10 the experimental results are in good agreement with the calculated ones.

4. Conclusions

The syntheses of the new tridentate Schiff-base ligand 2,6-bis((N-benzyl)iminomethyl)-4-tert-butylphenol (HL) and the corresponding polynuclear zinc complexes [Zn6L2(µ3-OH)2(OAc)8] (1) and [Zn4L4(µ2-OH)2](ClO4)2 (2) are described. The exact composition of the two complexes was confirmed via X-ray crystallography, which revealed the influence of the coordinating acetate anion. The molecular structure of 1 contains Zn2+ ions, which are six-, five- and four-coordinated by the O and the two N atoms of the ligand and OH and acetate ligands. In the discrete complex cation [Zn4L4(µ2-OH)2]2+ of 2 all Zn2+ ions, there are five-coordinated with τ values ranging from 0.49 to 0.52. The absorption properties of the ligand have been investigated with UV-vis spectroscopy. The lower energy band at 348 nm and the visible transition at 451 nm are designated as electronic transitions within the extended π system of the iminophenolate. Via the deprotonation of the ligand, the band at 451 nm disappears, whereby the spectroscopic properties of the ligand change significantly. The UV-vis titrations with the acetate and the perchlorate salts of Zn2+ exhibit the tendency of HL to form complexes with a stoichiometric ratio of 1:1. The results of luminescence spectroscopy studies support this observation. The complexation of Zn2+ leads to a further enhancement of the fluorescence intensity by factor six (CHEF effect), which was not detected for Na+, K+, Mg2+, Ca2+, Mn2+, Fe2+, Co2+, Ni2+ or Cu2+.

Supplementary Materials

The following supporting information can be downloaded at: https://www.mdpi.com/article/10.3390/chemistry5020070/s1. Figure S1: FTIR spectrum of HL (KBr pellet); Figure S2: FTIR spectra of [Zn6L2(OH)2(OAc)8] (1, KBr pellet) and [Zn4L4(OH)2](ClO4)2] (2, KBr pellet); Figure S3. Overlay of the FTIR spectra of the ligand (HL) and the zinc complexes 1 and 2 (1700–1500 cm−1); Figure S4. Overlay of the FTIR spectra of the zinc complexes 1 and 2 (1750–450 cm−1); Figure S5: Packing diagram of HL showing intermolecular π-π stacking (offset face-to-face) interactions between adjacent ligand molecules; Figure S6: 13C-NMR spectrum of HL recorded in dimethylsulfoxide-d6 at 363 K; multiplicity of C-H coupling displayed; parts of the spectrum without signals cut out for better observation of the multiplicities; Figure S7: 1H-NMR spectrum of [Zn6L2(OH)2(OAc)8] recorded in CD3CN at ambient temperature; Figure S8: Spectrophotometric titration of HL with Zn(ClO4)2·6H2O in CH2Cl2/MeOH (3:2/v:v) at a 10−5 M concentration and constant ionic strength (10−2 M N(n-Bu)4PF6, T = 295 K). The blue curve corresponds to a final Zn2+/HL molar ratio of 1:1. The inset shows the evolution of selected absorbance values versus the [Zn2+]/[HL] molar ratio; Figure S9. Excitation (blue) and emission spectrum (green) of HL in acetonitrile (c(HL) = 1 × 10⁻⁵ M, 298 K). MeCN; 1 × 10⁻⁵ M; λEx = 447 nm; λEm = 497 nm; Figure S10: Excitation (violet) and emission spectrum (yellow) of L in acetonitrile in the presence of base (c(HL) = 1 × 10⁻⁵ M, c(NEt3) = 1 × 10⁻⁵ M, 298 K). MeCN; c(HL) = 1 × 10⁻⁵ M; c(NEt3) = 1 × 10⁻⁵ M; λEx = 346 nm; λEm = 563 nm; Figure S11. Excitation (azure) and emission spectrum (turquoise) of [Zn6L2(OH)2(OAc)8] in acetonitrile (c(complex) = 1 × 10⁻⁵ M, 298 K). λEx = 378 nm; λEm = 452 nm; Figure S12: Major contributions to the observed UV-Vis bands of HL with the single orbital transition contribution in parentheses. a) HOMO→LUMO: 334 nm (97%). b) HOMO-1→LUMO+1: 245 nm (67%); Figure S13: Major contributions to the observed UV-Vis bands of HL with the single orbital transition contribution in parentheses. a) HOMO→LUMO: 409 nm (98%). b) HOMO-2→LUMO+1: 229 nm (36%); Figure S14: Major contributions to the observed UV-Vis bands of [Zn2L2]2+ with the single orbital transition contribution in parentheses. a) HOMO→LUMO: 348 nm (57%); Figure S15: PBE-D3(BJ) optimized structure of HL used for the simulation of UV-Vis spectra (pristine) and basis for the other used structures; Figure S16: Fluorescence spectra HL as a function of Zn2+ ion concentration; Table S1. Shape symmetry factors for complex 1.

Author Contributions

Conceptualization, T.S. and V.K.; methodology, T.S.; validation, T.S., B.K. and A.K.; formal analysis, H.W. and A.K.; investigation, V.K. and T.S.; resources, B.K.; data curation, B.K.; writing—original draft preparation, T.S.; writing—review and editing, M.B. and B.K.; visualization, T.S., M.B. and B.K.; supervision, B.K.; project administration, B.K.; funding acquisition, B.K. All authors have read and agreed to the published version of the manuscript.

Funding

This research was funded by the German Science Foundation (Priority programme 2102, “Light Controlled Reactivity of Metal Complexes”, project KE 585/9-1).

Data Availability Statement

Deposition Numbers 2248758-2248760 contain the supplementary crystallographic data for this paper. These data are provided free of charge by the joint Cambridge Crystallographic Data Centre and Fachinformationszentrum Karlsruhe Access Structures service. TD-DFT data will be available soon and will be announced.

Acknowledgments

We are thankful to H. Krautscheid for providing facilities for X-ray crystallographic measurements.

Conflicts of Interest

The authors declare no conflict of interest.

References

  1. Follmer, C.; Real-Guerra, R.; Wasserman, G.E.; Olivera-Severo, D.; Carlini, C.R. Jackbean, soybean and Bacillus pasteurii ureases. Eur. J. Biochem. 2004, 271, 1357–1363. [Google Scholar] [CrossRef] [PubMed]
  2. Sumner, J.B. The Isolation and Crystallization of the Enzyme Urease. J. Biol. Chem. 1926, 69, 435–441. [Google Scholar] [CrossRef]
  3. Bertagnolli, H.; Kaim, W. The Dinuclear CuA Center in Cytochrome c Oxidase and N2O Reductase-A Metal–Metal Bond in Biology? Angew. Chem. Int. Ed. Engl. 1995, 34, 771–773. [Google Scholar] [CrossRef]
  4. Lv, Y.; Cao, M.; Li, J.; Wang, J. A Sensitive Ratiometric Fluorescent Sensor for Zinc(II) with High Selectivity. Sensors 2013, 13, 3131–3141. [Google Scholar] [CrossRef] [PubMed]
  5. Fernley, R.T. Non-cytoplasmic carbonic anhydrases. Trends Biochem. Sci. 1988, 13, 356–359. [Google Scholar] [CrossRef]
  6. Hewett-Emmett, D.; Tashian, R.E. Functional diversity, conservation, and convergence in the evolution of the alpha-, beta-, and gam-ma-carbonic anhydrase gene families. Mol. Phylogenetics Evol. 1996, 5, 50–77. [Google Scholar] [CrossRef] [PubMed]
  7. Thiel, G.; Lietz, M. Regulator neuronaler Gene: Zinkfingerprotein REST. Biol. Unserer Zeit 2004, 34, 96–101. [Google Scholar] [CrossRef]
  8. Tashian, R.E. The carbonic anhydrases: Widening perspectives on their evolution, expression and function. Bioessays 1989, 10, 186–192. [Google Scholar] [CrossRef]
  9. Liu, M.-J.; Bao, S.; Gálvez-Peralta, M.; Pyle, C.J.; Rudawsky, A.C.; Pavlovicz, R.E.; Killilea, D.W.; Li, C.D.; Nebert, W.; Wewers, M.D.; et al. ZIP8 Regulates Host Defense through Zinc-Mediated Inhibition of NF-κB. Cell Rep. 2013, 3, 386–400. [Google Scholar] [CrossRef]
  10. Ternes, W. Biochemie der Elemente—Anorganische Chemie Biologischer Prozesse, Springer Spektrum; Springer: Berlin/Heidelberg, Germany, 2013. [Google Scholar]
  11. Roy, P.; Dhara, K.; Manassero, M.; Ratha, J.; Banerjee, P. Selective Fluorescence Zinc Ion Sensing and Binding Behavior of 4-Methyl-2,6-bis(((phenylmethyl)imino)methyl)phenol: Biological Application. Inorg. Chem. 2007, 46, 6405–6412. [Google Scholar] [CrossRef]
  12. Yu, G.; Liu, Y.; Song, Y.; Wu, X.; Zhu, D. A new blue light-emitting material. Synth. Met. 2001, 117, 211–214. [Google Scholar] [CrossRef]
  13. Di Bella, S.; Fragala, I. Two-dimensional characteristics of the second-order nonlinear optical response in dipolar donor–acceptor coor-dination complexes. New J. Chem. 2002, 26, 285–290. [Google Scholar]
  14. Leung, A.C.W.; Chong, J.H.; Patrick, B.O.; MacLachlan, M.J. Poly(salphenyleneethynylene)s:  A New Class of Soluble, Conjugated, Metal-Containing Polymers. Macromolecules 2003, 36, 5051–5054. [Google Scholar] [CrossRef]
  15. Wang, P.; Hong, Z.; Xie, Z.; Tong, S.; Wong, O.; Lee, C.-S.; Wong, N.; Hung, L.; Lee, S. A bis-salicylaldiminato Schiff base and its zinc complex as new highly fluorescent red dopants for high performance organic electroluminescence devices. Chem. Commun. 2003, 14, 1664–1665. [Google Scholar] [CrossRef]
  16. Rigamonti, L.; Demartin, F.; Forni, A.; Righetto, S.; Pasini, A. Copper(II) Complexes of salen Analogues with Two Differently Sub-stituted (Push−Pull) Salicylaldehyde Moieties. A Study on the Modulation of Electronic Asymmetry and Nonlinear Optical Properties. Inorg. Chem. 2006, 45, 10976–10989. [Google Scholar] [CrossRef]
  17. Zhang, G.; Yang, G.; Wang, S.; Chen, Q.; Ma, J.S. A Highly Fluorescent Anthracene-Containing Hybrid Material Exhibiting Tunable Blue–Green Emission Based on the Formation of an Unusual “T-Shaped” Excimer. Chem. Eur. J. 2007, 13, 3630–3635. [Google Scholar] [CrossRef]
  18. Kotova, O.; Semenov, S.; Eliseeva, S.; Troyanov, S.; Lyssenko, K.; Kuzmina, N. New Helical Zinc Complexes with Schiff Base Derivatives of β-Diketonates or β-Keto Esters and Ethylenediamine. Eur. J. Inorg. Chem. 2009, 2009, 3467–3474. [Google Scholar] [CrossRef]
  19. Hai, Y.; Chen, J.-J.; Zhao, P.; Lv, H.; Yu, Y.; Xu, P.; Zhang, J.-L. Luminescent zinc salen complexes as single and two-photon fluo-rescence subcellular imaging probes. Chem. Commun. 2011, 47, 2435–2437. [Google Scholar] [CrossRef]
  20. Dumur, F.; Contal, E.; Wantz, G.; Gigmes, D. Photoluminescence of Zinc Complexes: Easily Tunable Optical Properties by Variation of the Bridge Between the Imido Groups of Schiff Base Ligands. Eur. J. Inorg. Chem. 2014, 2014, 4186–4198. [Google Scholar] [CrossRef]
  21. Su, Q.; Wu, Q.-L.; Li, G.-H.; Liu, X.-M.; Mu, Y. Bis-salicylaldiminato zinc complexes: Syntheses, characterization and luminescent properties. Polyhedron 2007, 26, 5053–5060. [Google Scholar] [CrossRef]
  22. Cheng, J.; Ma, X.; Zhang, Y.; Liu, J.; Zhou, X.; Xiang, H. Optical Chemosensors Based on Transmetalation of Salen-Based Schiff Base Complexes. Inorg. Chem. 2014, 53, 3210–3219. [Google Scholar] [CrossRef]
  23. Malthus, S.J.; Cameron, S.A.; Brooker, S. Improved Access to 1,8-Diformyl-carbazoles Leads to Metal-Free Carbazole-Based [2 + 2] Schiff Base Macrocycles with Strong Turn-On Fluorescence Sensing of Zinc(II) Ions. Inorg. Chem. 2018, 57, 2480–2488. [Google Scholar] [CrossRef] [PubMed]
  24. Zhou, X.; Yu, B.; Guo, Y.; Tang, X.; Zhang, H.; Liu, W. Both Visual and Fluorescent Sensor for Zn2+ Based on Quinoline Platform. Inorg. Chem. 2010, 49, 4002–4007. [Google Scholar] [CrossRef]
  25. Frederickson, C.J.; Kasarskis, E.J.; Ringo, D.; Frederickson, R.E. A quinoline fluorescence method for visualizing and assaying the histochemically reactive zinc (bouton zinc) in the brain. J. Neurosci. Methods 1987, 20, 91–103. [Google Scholar] [CrossRef] [PubMed]
  26. Nasir, M.S.; Fahrni, C.J.; Suhy, D.A.; Kolodsick, K.J.; Singer, C.P.; O’Halloran, T.V. The chemical cell biology of zinc: Structure and intracellular fluorescence of a zinc-quinolinesulfonamide complex. JBIC J. Biol. Inorg. Chem. 1999, 4, 775–783. [Google Scholar] [CrossRef] [PubMed]
  27. Coyle, P.; Zalewski, P.D.; Philcox, J.C.; Forbes, I.J.; Ward, A.D.; Lincoln, S.F.; Mahadevan, I.; Rofe, A.M. Measurement of zinc in hepatocytes by using a fluorescent probe, zinquin: Relationship to metallothionein and intracellular zinc. Biochem. J. 1994, 303, 781–786. [Google Scholar] [CrossRef]
  28. Zalewski, P.D.; Forbes, I.J.; Betts, W.H. Correlation of apoptosis with change in intracellular labile Zn(II) using zinquin [(2-methyl-8-p-toluenesulphonamido-6-quinolyloxy)acetic acid], a new specific fluorescent probe for Zn(II). Biochem. J. 1993, 296, 403–408. [Google Scholar] [CrossRef] [PubMed]
  29. Mahadevan, I.B.; Kimber, M.C.; Lincoln, S.F.; Tiekink, E.R.T.; Ward, A.D.; Betts, W.H.; Forbes, I.J.; Zalewski, P.D. The Synthesis of Zinquin Ester and Zinquin Acid, Zinc(II)-Specific Fluorescing Agents for Use in the Study of Biological Zinc(II). Aust. J. Chem. 1996, 49, 561–568. [Google Scholar] [CrossRef]
  30. Toroptsev, I.V.; Eshchenko, V.A. Histochemical detection of zinc using fluorescent 8-(arensulfonilamino)-quinolines. Tsitologiia 1970, 12, 1481–1484. [Google Scholar]
  31. Ullmann, S.; Börner, M.; Kahnt, A.; Abel, B.; Kersting, B. Green-Emissive Zn2+ Complex Supported by a Macrocyclic Schiff-Base/Calix[4]arene-Ligand: Crystallographic and Spectroscopic Characterization. Eur. J. Inorg. Chem. 2021, 36, 3691–3698. [Google Scholar] [CrossRef]
  32. Laube, C.; Taut, J.A.; Kretzschmar, J.; Zahn, S.; Knolle, W.; Ullman, S.; Kahnt, A.; Kersting, B.; Abel, B. Light controlled oxidation by supramolecular Zn(ii) Schiff-base complexes. Inorg. Chem. Front. 2020, 7, 4333–4346. [Google Scholar] [CrossRef]
  33. Klose, J.; Severin, T.; Hahn, P.; Jeremies, A.; Bergmann, J.; Fuhrmann, D.; Griebel, J.; Abel, B.; Kersting, B. Coordination chemistry and photoswitching of dinuclear macrocyclic cadmium-, nickel-, and zinc complexes containing azobenzene carboxylato co-ligands. Beilstein J. Org. Chem. 2019, 15, 840–851. [Google Scholar] [CrossRef]
  34. Ullmann, S.; Schnorr, R.; Laube, C.; Abel, B.; Kersting, B. Photoluminescence properties of tetrahedral zinc(ii) complexes supported by calix[4]arene-based salicylaldiminato ligands. Dalton Trans. 2018, 47, 5801–5811. [Google Scholar] [CrossRef]
  35. Ullmann, S.; Schnorr, R.; Handke, M.; Laube, C.; Abel, B.; Matysik, J.; Findesien, M.; Rüger, R.; Heine, T.; Kersting, B. Zn2+-Ion Sensing by Fluorescent Schiff Base Calix[4]arene Macrocycles. Chem. Eur. J. 2017, 23, 3824–3827. [Google Scholar] [CrossRef] [PubMed]
  36. Spectrum FL; PerkinElmer: Waltham, MA, USA, 2019.
  37. OriginPro 8G; OriginLab Corporation: Northampton, MA, USA, 2009.
  38. MestReNova 14.1.0; Mestrelab Research S.L.: Santiago de Compostela, Spain, 2019.
  39. X-AREA and X-RED 32; V1.35; STOE & Cie GmbH: Darmstadt, Germany, 2006.
  40. Sheldrick, G.M. Phase annealing in SHELX-90: Direct methods for larger structures. Acta Crystallogr. Sect. A Found. Crystallogr. 1990, 46, 467–473. [Google Scholar] [CrossRef]
  41. Sheldrick, G.M. Crystal structure refinement with SHELXL. Acta Crystallogr. Sect. C Struct. Chem. 2015, 71, 3–8. [Google Scholar] [CrossRef] [PubMed]
  42. Spek, A.L. PLATON—A Multipurpose Crystallographic Tool; Utrecht University: Utrecht, The Netherlands, 2000. [Google Scholar]
  43. Dolomanov, O.V.; Bourhis, L.J.; Gildea, R.J.; Howard, J.A.K.; Puschmann, H. OLEX2: A complete structure solution, refinement and analysis program. J. Appl. Crystallogr. 2009, 42, 339–341. [Google Scholar] [CrossRef]
  44. Farrugia, L.J. ORTEP-3 for Windows—A version of ORTEP-III with a Graphical User Interface (GUI) by J. Farrugia. J. Appl. Cryst. 1997, 30, 565. [Google Scholar] [CrossRef]
  45. Van Lenthe, E.; Baerends, E.J. Optimized Slater-type basis sets for the elements 1-118. J. Comput. Chem. 2003, 24, 1142–1156. [Google Scholar] [CrossRef]
  46. Perdew, J.P.; Burke, K.; Ernzerhof, M. Generalized Gradient Approximation Made Simple. Phys. Rev. Lett. 1996, 18, 3865–3868. [Google Scholar] [CrossRef]
  47. Grimme, S.; Ehrlich, S.; Goerigk, L. Effect of the damping function in dispersion corrected density functional theory. J. Comput. Chem. 2011, 32, 1456–1465. [Google Scholar] [CrossRef] [PubMed]
  48. van Gisbergen, S.; Snijders, J.; Baerends, E. Implementation of time-dependent density functional response equations. Comput. Phys. Commun. 1999, 118, 119–138. [Google Scholar] [CrossRef]
  49. Seth, M.; Ziegler, T. Range-Separated Exchange Functionals with Slater-Type Functions. J. Chem. Theory Comput. 2012, 8, 901–907. [Google Scholar] [CrossRef] [PubMed]
  50. Marques, M.A.; Oliveira, M.J.; Burnus, T. Libxc: A library of exchange and correlation functionals for density functional theory. Comput. Phys. Commun. 2012, 183, 2272–2281. [Google Scholar] [CrossRef]
  51. Lehtola, S.; Steigemann, C.; Oliveira, M.J.; Marques, M.A. Recent developments in libxc—A comprehensive library of functionals for density functional theory. Softwarex 2018, 7, 1–5. [Google Scholar] [CrossRef]
  52. Rüger, R.; Franchini, M.; Trnka, T.; Yakovlev, A.; van Lenthe, E.; Philipsen, P.; van Vuren, T.; Klumpers, B.; Soin, T. AMS 2021.104 SCM, Theoretical Chemistry; Vrije Universiteit: Amsterdam, The Netherlands, 2021. [Google Scholar]
  53. Baerends, E.J.; Ziegler, T.; Atkins, A.J.; Autschbach, J.; Baseggio, O.; Bashford, D.; Bérces, A.; Bickelhaupt, F.M.; Bo, C.; Boerrigter, P.M.; et al. ADF, 2021.104, SCM, Theoretical Chemistry; Vrije Universiteit: Amsterdam, The Netherlands, 2021. [Google Scholar]
  54. te Velde, G.; Bickelhaupt, F.M.; Baerends, E.J.; Fonseca Guerra, C.; van Gisbergen, S.J.A.; Snijders, J.G.; Ziegler, T. Chemistry with ADF. J. Comput. Chem. 2001, 22, 931–967. [Google Scholar] [CrossRef]
  55. Louwen, J.N.; Pye, C.C.; van Lenthe, E.; Austin, N.D.; McGarrity, E.S.; Xiong, R.; Sandler, S.I.; Burnett, R.I. AMS 2021.104 COS-MO-RS, SCM, Theoretical Chemistry; Vrije Universiteit: Amsterdam, The Netherlands, 2021. [Google Scholar]
  56. Pye, C.C.; Ziegler, T.; van Lenthe, E.; Louwen, J.N. An implementation of the conductor-like screening model of solvation within the Amsterdam density functional package—Part II. COSMO for real solvents. Can. J. Chem. 2009, 87, 790–797. [Google Scholar] [CrossRef]
  57. Pye, C.C.; Ziegler, T. An implementation of the conductor-like screening model of solvation within the Amsterdam density functional package. Theor. Chem. Acc. 1999, 101, 396–408. [Google Scholar] [CrossRef]
  58. Addison, A.W.; Rao, T.N.; Reedijk, J.; Van Rijn, J.; Verschoor, G.C. Synthesis, structure, and spectroscopic properties of copper(II) compounds containing nitrogen–sulphur donor ligands; the crystal and molecular structure of aq-ua[1,7-bis(N-methylbenzimidazol-2′-yl)-2,6-dithiaheptane]copper(II) perchlorate. J. Chem. Soc. Dalton Trans. 1984, 7, 1349–1356. [Google Scholar] [CrossRef]
  59. Llunell, M.; Casanova, D.; Cirera, J.; Alemany, P.; Alvarez, S. SHAPE; University of Barcelona: Barcelona, Spain, 2013. [Google Scholar]
  60. Hirozo, K.; Yoshihiko, S. The Crystal Structure of Zinc Oxyacetate, Zn4O(CH3COO)6. Bull. Chem. Soc. Jap. 1954, 27, 112–114. [Google Scholar]
  61. Yoe, J.H.; Jones, A.L. Colorimetric Determination of Iron with Disodium-1,2-dihydroxybenzene-3,5-disulfonate. Ind. Eng. Chem. Anal. Ed. 1944, 16, 111–115. [Google Scholar] [CrossRef]
  62. Yoe, J.H.; Harvey, A.E. Colorimetric Determination of Iron with 4-Hydroxybiphenyl-3-carboxylic Acid. J. Am. Chem. Soc. 1948, 70, 648–654. [Google Scholar] [CrossRef]
  63. Meyer, A.S.; Ayres, G.H. The Mole Ratio Method for Spectrophotometric Determination of Complexes in Solution. J. Am. Chem. Soc. 1957, 79, 49–53. [Google Scholar] [CrossRef]
  64. Meyer, A.S.; Ayres, G.H. The Interaction of Platinum(II) and Tin(II) Chlorides. J. Am. Chem. Soc. 1955, 77, 2671–2675. [Google Scholar] [CrossRef]
  65. Mitra, A.; Hinge, V.K.; Mittal, A.; Bhakta, S.; Guionneau, P.; Rao, C.P. A Zinc-Sensing Glucose-Based Naphthyl Imino Conjugate as a Detecting Agent for Inorganic and Organic Phosphates, Including DNA. Chem. Eur. J. 2011, 17, 8044–8047. [Google Scholar] [CrossRef]
  66. Pathak, R.K.; Dessingou, J.; Rao, C.P. Multiple Sensor Array of Mn2+, Fe2+, Co2+, Ni2+, Cu2+, and Zn2+ Complexes of a Triazole Linked Imino-Phenol Based Calix[4]arene Conjugate for the Selective Recognition of Asp, Glu, Cys, and His. Anal. Chem. 2012, 84, 8294–8300. [Google Scholar] [CrossRef]
  67. Mum-midivarapu, V.V.S.; Tabbasum, K.; Chinta, J.P.; Rao, C.P. 1,3-Di-amidoquinoline conjugate of calix[4]arene (L) as a ratiometric and colorimetric sensor for Zn2+: Spectroscopy, microscopy and computational studies. Dalton Trans. 2012, 41, 1671–1674. [Google Scholar] [CrossRef]
  68. Mum-midivarapu, V.V.S.; Bandaru, S.; Yarramala, D.S.; Samanta, K.D.; Mhatre, S.; Rao, C.P. Binding and Ratiometric Dual Ion Recognition of Zn2+ and Cu2+ by 1,3,5-Tris-amidoquinoline Conjugate of Calix[6]arene by Spectroscopy and Its Supramolecular Features by Microscopy. Anal. Chem. 2015, 87, 4988–4995. [Google Scholar] [CrossRef]
  69. Nugent, J.W.; Lee, H.; Lee, H.-S.; Reibenspies, J.H.; Hancock, R.D. Mechanism of chelation enhanced fluorescence in complexes of cadmium(ii), and a possible new type of anion sensor. Chem. Commun. 2013, 49, 9749–9751. [Google Scholar] [CrossRef]
  70. Joseph, R.; Chinta, J.P.; Rao, C.P. Lower Rim 1,3-Diderivative of Calix[4]arene-Appended Salicylidene Imine (H2L): Experimental and Computational Studies of the Selective Recognition of H2L toward Zn2+ and Sensing Phosphate and Amino Acid by [ZnL]. J. Org. Chem. 2010, 75, 3387–3395. [Google Scholar] [CrossRef]
Scheme 1. Synthesis of ligand HL and zinc complexes 1 and 2.
Chemistry 05 00070 sch001
Figure 1. Molecular structure of the ligand HL in the crystal. Thermal ellipsoids are drawn at the 50% probability level. Hydrogen atoms are omitted for clarity, except one involved in intramolecular hydrogen bonding. Selected bond lengths (Å): N1-C8 1.2765(11), N2-C15 1.2677(16) and O1···N1 2.5905(12).
Chemistry 05 00070 g001
Figure 2. Ball and stick representation of the molecular structure of neutral complex 1 in crystals of [Zn6L2(OH)2(OAc)8]·3MeCN·0.5H2O (1·3MeCN·0.5H2O). Hydrogen atoms are omitted for clarity.
Chemistry 05 00070 g002
Figure 3. Molecular structure of the [Zn4L4(µ-OH)2]2+ complex cation in the crystals of (2·3MeOH·0.5MeCN). All hydrogen atoms, phenyl rings and t-Bu groups have been omitted for clarity.
Chemistry 05 00070 g003
Figure 4. Measured UV-vis spectra of HL and its deprotonated form, L. Experimental conditions: 5 × 10⁻⁵ M, CH2Cl2/MeOH (v:v/3:2), 298 K. The fully deprotonated ligand was obtained by adding an excess of NEt3 to the solution of HL.
Chemistry 05 00070 g004
Figure 5. Spectrophotometric titration of HL with Zn(OAc)2·2H2O in CH2Cl2/MeOH (3:2/v:v) at a 10−5 M concentration and constant ionic strength (10−2 M N(n-Bu)4PF6, T = 295 K). The red curve corresponds to the final Zn2+/HL stoichiometric ratio of 3.0. The inset shows the evolution of selected absorbance values versus the [Zn2+]/[HL] stoichiometric ratio.
Chemistry 05 00070 g005
Figure 6. Excitation (dashed) and emission spectra (solid) of HL, L, and a 1:3 mixture of HL/Zn(OAc)2 in MeCN (10−5 M, 298 K).
Chemistry 05 00070 g006
Figure 7. Fluorescence titration of HL with Zn(OAc)2·2H2O in CH2Cl2/MeOH (3:2/v:v) at a 10−5 M concentration and constant ionic strength (10−2 M N(n-Bu)4PF6, T = 295 K, λexc = 378 nm). The blue and red curves correspond to Zn2+/HL stoichiometric ratios of 1.0 and 5.0, respectively. The inset shows the evolution of the fluorescence intensity of the emission band at 450 nm versus the [Zn2+]/[HL] stoichiometric ratio.
Chemistry 05 00070 g007
Figure 8. Normalized emission intensity at 443 nm of 10−5 M solutions containing equimolar quantities of HL and various metal ions (methanolic solution, concentration: ligand 1 × 10⁻⁵ M, metal salt: 3 × 10⁻⁵ M, T = 295 K); excitation wavelength 378 nm.
Chemistry 05 00070 g008
Figure 9. Simulated UV-vis spectra of different HL forms. Included are the zwitterionic form, explicitly coordinated methanol, deprotonated HL, the pristine ligand and the [Zn2L2]2+ complex. The spectra were obtained using AMS code [53].
Chemistry 05 00070 g009
Figure 10. Summation of the calculated excitations for all species in Figure 9. The excitations are convolved with a 30 nm wide Gaussian to fit the experimental spectrum well.
Chemistry 05 00070 g010
Table 1. Selected bond lengths (Å) and angles (°) for 1·3MeCN·0.5H2O.
Zn1-O1 2.114(4)N1-Zn1-O1 87.90(19)N3-Zn4-O11 88.40(18)
Zn1-N1 2.064(5)N1-Zn1-O3 97.27(17)N3-Zn4-O13 90.8(2)
Zn1-O2 2.016(4)N1-Zn1-O4 86.15(16)N3-Zn4-O14 88.41(19)
Zn1-O3 2.103(4)N1-Zn1-O5 98.8(2)N3-Zn4-O15 98.98(19)
Zn1-O4 2.264(4)O1-Zn1-O4 94.19(16)O11-Zn4-O14 93.16(16)
Zn1-O5 2.101(4)O2-Zn1-N1 163.88(19)O12-Zn4-N3 166.20(19)
Zn2-O1 2.063(4)O2-Zn1-O1 78.83(16)O12-Zn4-O11 78.95(16)
Zn2-N2 2.091(5)O2-Zn1-O3 92.02(16)O12-Zn4-O13 94.78(18)
Zn2-O2 2.065(4)O2-Zn1-O4 85.74(15)O12-Zn4-O14 86.82(17)
Zn2-O6 2.060(4)O2-Zn1-O5 93.55(17)O12-Zn4-O15 93.07(17)
Zn2-O7 1.996(4)O3-Zn1-O1 90.56(17)O13-Zn4-O11 90.37(18)
Zn3-O2 1.939(4) O3-Zn1-O4 174.26(17)O13-Zn4-O14 176.35(18)
Zn3-O8 1.976(4)O5-Zn1-O1 170.98(16)O15-Zn4-O11 170.48(16)
Zn3-O9 1.957(4)O5-Zn1-O3 94.56(17)O15-Zn4-O13 95.50(18)
Zn3-O10 1.969(4)O5-Zn1-O4 80.33O15-Zn4-O14 81.13(16)
Zn4-O11 2.113(4)O1-Zn2-N2 88.07(19)N4-Zn5-O11 87.19(19)
Zn4-N3 2.034(5)O1-Zn2-O2 78.89(16)O12-Zn5-N4 164.02(19)
Zn4-O12 2.012(4)O2-Zn2-N2 156.16(18)O12-Zn5-O11 79.39(16)
Zn4-O13 2.107(4)O6-Zn2-N2 89.1(2)O12-Zn5-O16 95.29(19)
Zn4-O14 2.234(4)O6-Zn2-O1 148.89(19)O16-Zn5-N4 88.1(2)
Zn4-O15 2.096(4)O6-Zn2-O2 91.90(18)O16-Zn5-O11 135.03(19)
Zn5-O12 2.045(4)O7-Zn2-N2 105.0(2)O17-Zn5-N4 96.70(19)
Zn5-N4 2.059(5)O7-Zn2-O1 109.06(18)O17-Zn5-O11 115.40(19)
Zn5-O11 2.063(4)O7-Zn2-O2 98.14(17)O17-Zn5-O12 96.87(19)
Zn5-O16 2.046(5)O7-Zn2-O6 101.6(2)O17-Zn5-O16 109.6(2)
Zn5-O17 2.000(4)O2-Zn3-O8 107.92(19)O12-Zn6-O18 106.5(2)
Zn6-O12 1.934(4)O2-Zn3-O9 108.63(17)O12-Zn6-O19 108.21(18)
Zn6-O18 1.952(5)O2-Zn3-O10 122.87(18)O12-Zn6-O20 121.79(19)
Zn6-O19 1.966(4)O9-Zn3-O8 108.25(19)O18-Zn6-O19 106.9(2)
Zn6-O20 1.940(4)O9-Zn3-O10 107.01(18)O20-Zn6-O18 107.7(2)
O10-Zn3-O8 101.30(19)O20-Zn6-O19 104.93(19)
Table 2. Selected bond lengths (Å) and angles (°) for 2·3MeOH·0.5MeCN.
Zn1-O1 2.018(3)N1-Zn1-O2 159.01(11) N5-Zn3-N7 118.88(11)
Zn1-O2 2.135(2)N3-Zn1-N1 107.88(12)N5-Zn3-O3 84.91(10)
Zn1-N1 2.117(3)N3-Zn1-O2 85.17(12)N7-Zn3-O3 157.33(11)
Zn1-N3 2.048(3)O1-Zn1-N1 86.28(11)O4-Zn3-N5 115.58(11)
Zn1-O5 1.956(2)O1-Zn1-N3 119.00(12)O4-Zn3-N7 86.56(11)
Zn2-O1 2.144(2)O5-Zn1-N1 99.91(11)O4-Zn3-O3 72.08(9)
Zn2-O2 2.012(3)O5-Zn1-N1 99.91(11)O5-Zn3-N5 108.29(12)
Zn2-N2 2.050(3)O5-Zn1-N3 119.00(12)O5-Zn3-N7 99.47(11)
Zn2-N4 2.118(3)O5-Zn1-O1 129.36(10)O5-Zn3-O3 88.85(10)
Zn2-O6 1.992(3)O5-Zn1-O2 91.57(10)O5-Zn3-O4 129.58(10)
Zn3-O3 2.154(2)N2-Zn2-N4 110.11(11)N6-Zn4-O4 160.17(11)
Zn3-O4 2.008(3)N2-Zn2-O1 85.85(10)N8-Zn4-N6 108.65(11)
Zn3-N5 2.053(3)N4-Zn2-O1 158.57(11)N8-Zn4-O4 84.43(11)
Zn3-N7 2.118(3)O2-Zn2-N2 115.58(12)O3-Zn4-N6 88.07(11)
Zn3-O5 1.962(2)O2-Zn2-N4 87.08(12)O3-Zn4-N8 116.03(11)
Zn4-O3 2.003(2)O2-Zn2-O1 72.81(9)O3-Zn4-O4 72.58(9)
Zn4-O4 2.135(2)O6-Zn2-N2 110.14(12)O6-Zn4-N6 98.18(11)
Zn4-N6 2.076(3)O6-Zn2-N4 98.46(11)O6-Zn4-N8 109.84(11)
Zn4-N8 2.055(3)O6-Zn2-O1 88.76(10)O6-Zn4-O3 128.75(10)
Zn4-O5 1.993(2)O6-Zn2-O2 128.62(11)O6-Zn4-O3 90.88(10)
Table 3. UV-vis spectroscopic data for HL and the deprotonated ligand; luminescence spectroscopic data for HL, L and 1.
λmax/nmελ/[M−1cm−1]Assignment
HL(a)451
348
248
5600
5480
28,800
π-π* (ArOH)
π-π*(ArOH)
π-π*(ArOH+Ph)
L(a,b)349
232
6620
45,940
π-π* (ArO)
L(a,c)349
234
6640
59,920
π-π* (ArO)
λex/nmλem/nmStokes shift/cm−1
(rel. intensity/a.u.)
HL(d)4474972250 (5380)
L(b,d)34656311,139 (350)
1(d)3784524331 (35,850)
(a) DCM/MeOH (3:2/v:v), 10−5 M sample concentration, (b) [NEt3] = 8 × 10⁻³ M, (c) [NEt3] = 16 × 10−3 M, (d) MeCN, 10−5 M sample concentration.
Disclaimer/Publisher’s Note: The statements, opinions and data contained in all publications are solely those of the individual author(s) and contributor(s) and not of MDPI and/or the editor(s). MDPI and/or the editor(s) disclaim responsibility for any injury to people or property resulting from any ideas, methods, instructions or products referred to in the content.

