Abstract
Theoretical DFT calculations using GGA+U and HSE06 frameworks enabled vibrational mode assignment and partial (atomic) phonon DOS determination in KAgF3 perovskite, a low-dimensional magnetic fluoroargentate(II). Twelve bands in the spectra of KAgF3 were assigned to either IR active or Raman active modes, reaching excellent correlation with experimental values (R2 > 0.997). Low-temperature Raman measurements indicate that the intriguing spin-Peierls-like phase transition at 230 K is an order–disorder transition and it does not strongly impact the vibrational structure of the material.
1. Introduction
Fluoroargentates(II) attract interest because of their noticeable similarities with isoelectronic copper(II) oxides; many interesting physical phenomena occur in the latter. One of them is low dimensional magnetism, which plays an important role in superconducting materials. The structural simplicity of these systems also provides important insights into correlation between details of the crystal structure and physical properties, and it provides physicists with a framework to test the available theories. Studying (quasi)-1D antiferromagnets allowed for observation of, for example, spin-Peierls transition [1], Haldane chains, or spin-ladder systems [2]. KAgF3, which adopts a distorted perovskite structure [3], is an example of such a low-dimensional magnetic system. Magnetic susceptibility measurements indicate substantial magnetic anisotropy in this compound, with strong antiferromagnetic ordering along the crystallographic b axis, and a weak ferromagnetic one in the ac plane (Pnma setting).
KAgF3 can be regarded as quasi-1D antiferromagnet in which superexchange constant along kinked Ag–F–Ag chains (Figure 1), J1D, is about 20 times larger than in the remaining two dimensions [4,5]. Importantly, the standard Generalized Gradient Approximation (GGA) approach fails to reproduce the antiferromagnetic ground state of KAgF3. Due to considerable correlation of silver valence electrons on d orbitals, it is necessary to introduce Mott-Hubbard correction within the GGA+U framework [4]. The GGA+U approach permits to reproduce experimental J values for both strong intra-chain and much weaker intra-sheet interactions [5,6]. The unique character of KAgF3 stems from the fact that the intra-chain antiferromagnetic interactions are immensely strong, of the order of 100 meV, thus comparable to those for copper(II) oxides, as well as from substantial magnetic anisotropy.
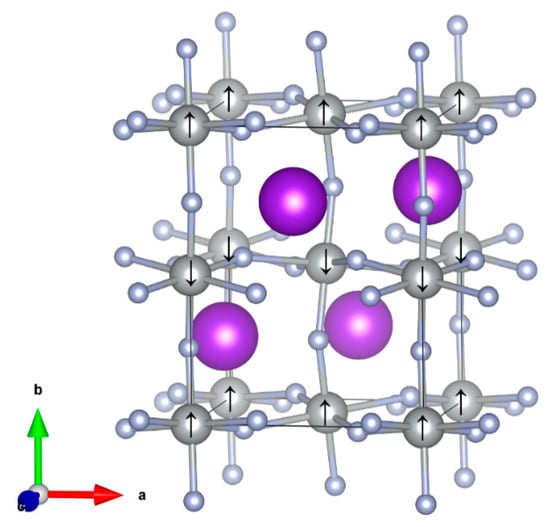
Figure 1.
Ground state spin ordering in KAgF3 Pnma structure as marked by black arrow (gray—Ag; light blue—F; violet—K).
Interestingly, KAgF3 exhibits an intriguing phase transition at 230 K which resembles a spin-Peierls transition; it has been preliminarily assigned to a structural order/disorder-type (Pnma/Pcma) transition based on X-ray diffraction studies [4]. Moreover, this compound shows a complex magnetic ordering at temperatures below 66 K [6], which is subject to ongoing investigation. Analysis of X-ray diffraction experiments suggests that the phase transition present at ca. 230 K might be of the order/disorder type. The low temperature ordered polymorph crystallizes in the Pnma space group while the high-temperature disordered one is in the Pcma one, exhibiting tilting of [AgF4]2– units around the a and c vectors [4]. Most characteristic structural features (tilting of octahedra, Jahn-Teller effect), as well as magnetic features (antiferromagnetic 1D character) are retained during this transition.
Stability of metal halide perovskites is often represented in terms of Goldschmidt tolerance factor t (originally developed for oxide systems). Compounds with t in a range of 0.71–0.90 are prone to adopt orthorhombic symmetry [7]. It was also found that certain types of perovskites, particularly useful for photonics, exhibit t in a range of 0.80–1.00 [7]. KAgF3 has a tolerance factor equal to 0.77 being indeed orthorhombic. However, dynamic stability of this compound and its possible phase transitions are of interest.
Lattice dynamics studies of related AAgF3 (A—cation) systems have been scarce despite the fact that they host interesting physical phenomena. There are no spectroscopic data published on KAgF3 to date. The goal of the current work is to gain insight into lattice dynamics (phonons) of KAgF3 with both experimental and theoretical tools, assign the bands appearing in the Raman scattering and infrared absorption spectra, as well as further elucidate the nature of the 230 K phase transition. Understanding the impact of disorder on the lattice dynamics is also of interest here.
2. Experimental
KAgF3 has been prepared using a published synthesis route yielding high purity product (an equimolar mixture of KF and AgF2 was heated in nickel reactor, under F2 atmosphere, for four days at 300 °C) [4]. Infra-red measurements were carried out on Bruker Vertex 80 V vacuum spectrometer using powdered samples placed on HDPE windows. Raman spectra were obtained on a Horiba Jobin Yvon LabRam-HR Raman micro-spectrometer with 632.8 nm He–Ne laser exciting beam. As with other AgII compounds, the power of laser beam had to be very low, in order to minimize thermal (or photo-) decomposition [8,9]. In this work we have used power of circa 0.3 mW. KAgF3 can also easily decompose in contact with the atmosphere, so the sample was enclosed inside a sealed quartz capillary. In the case of low-temperature Raman measurements, the capillary was placed in a home-made flow cryostat, described in more detail below, and measured using Horiba Jobin Yvon T64000 Raman spectrometer with 514.5 nm Ar-Kr laser exciting beam, with on-sample power lower than 0.5 mW.
The low-temperature setup was prepared in the following way: 5 N Ar gas bottle was connected to fluorinated ethylene propylene (FEP) coil placed in a 3 L dewar (Figure 2). The amount of LN2 in the dewar and the flow rate of cool Ar gas were chosen to ensure a near constant temperature in the vicinity of the sample (a maximum of 1–2 K drift was observed during measurements).
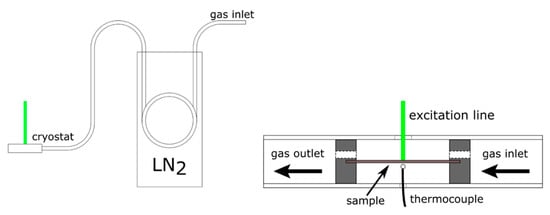
Figure 2.
The experimental setup for study of Raman spectrum of KAgF3 at low temperature.
The cryostat itself was made from FEP tube with aluminum disks. Holes drilled in the aluminum disks enabled gas flow through the measurement chamber, and retained sample in place. The main body of the cryostat, made from FEP tube, had two holes drilled on opposing sides of the tube—the first one, about 3 mm in diameter to let in the excitation line, the second one, about 1 mm in diameter, to let in a thermocouple. The temperature inside the cryostat was measured using a thermocouple positioned about 1 mm from the capillary with enclosed sample. To ensure that no condensation formed in the hole for the excitation line, a heat gun was used to blow the newly formed ice crystals away from the cryostat. The minimum stable temperature reached in this setup was equal to 123 K, way below the 230 K order/disorder-type phase transition but above the temperature of magnetic ordering (66 K), and we report here spectra measured at 123 K as well as at room temperature.
3. Computational Details
Lattice dynamics was modelled using GGA+U framework using Lichtenstein formalism [10] with values of U = 5.0 eV and J = 1.0 eV for silver atoms in order to account for strong electron correlation. The Perdew–Burke–Ernzerhof functional revised for solids (PBEsol) [11] and the projector-augumented-wave method [12,13] were used, as implemented in VASP 5.2.12 code [14,15,16]. The cut-off energy of the plane wave basis set was equal to 800 eV with a self-consistent-field convergence criterion of 1 × 10⁻⁷ eV. The k-point mesh spacing used in calculations was equal to 0.16 Å−1. Ordered, low temperature, Pnma structure of KAgF3 was chosen as a starting model for the calculations [4]. An antiferromagnetic model was assumed in agreement with Zhang et al. (AFM along the chains, FM in planes) [5].
Phonon dispersion curves and phonon density of states were calculated for a 2 × 2 × 2 supercell with the use of PHONON software package [17,18]. Hellmann–Feynman forces were evaluated using series of atomic displacements (0.0018–0.0025 Å) for which single point energies were calculated with the settings mentioned above and harmonic approximation. Furthermore, obtained Γ-point frequencies were compared with values obtained using HSE06 functional [19]. For that comparison the finite differences method was used, as implemented in VASP core. These calculations were carried for the KAgF3 unit cell, using less dense k-point mesh spacing of 0.25 Å−1 to reduce the calculation cost. This implementation yields frequencies in the centre of the first Brillouin zone (Γ point).
4. Results and Discussion
Infrared (Figure 3) and Raman spectra (Figure 4) were measured from the instrument lower limit up to 1000 cm−1. FIR measurement resulted in eight separate bands, while Raman measurement showed seven bands. Low temperature Raman measurement exhibits a slight temperature shift towards higher wavenumbers. A density functional framework was used to gain in-depth understanding of present spectral features.
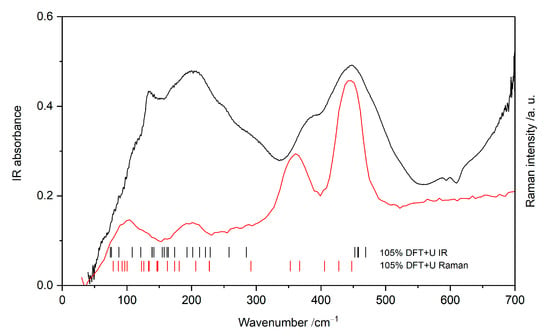
Figure 3.
FIR (black) and Raman (red) spectra of KAgF3 at room temperature together with marks indicating the computed wavenumbers.
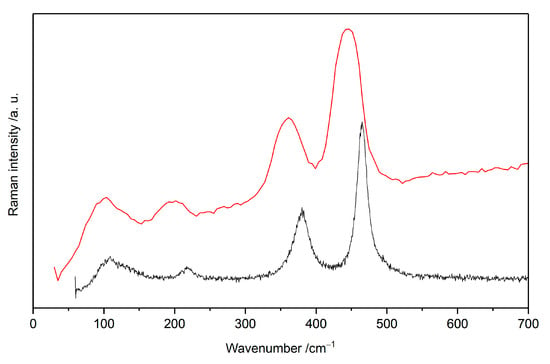
Figure 4.
Raman spectrum measured at room temperature (red) and 123 K (black).
To set the grounds for analysis of the experimental spectra, we begin our discussion with group theory analysis. According to Group theory analysis there are 60 normal vibrational modes for KAgF3 in Pnma symmetry (Γacoustic = B1u + B2u + B3u; Γoptic = 7Ag + 8Au + 5B1g + 9B1u + 7B2g + 7B2u + 5B3g + 9B3u).
Calculated phonon dispersion curves and phonon density of states are shown in Figure 5. No imaginary modes are seen; hence, the low-temperature structure is confirmed to be dynamically stable. Partial (atomic) phonon density of states (Figure 5, right) yields information about atoms involved in oscillations. Up to ca. 175 cm−1 all atoms contribute comparably to normal modes. The characteristic region of vibrations of potassium atoms is within the energy range 0–225 cm−1. Silver atoms contribute within slightly broader energy range 0–260 cm−1 as well as to the highest energy modes between 400 and 450 cm−1. Fluorine atoms contribute considerably to all phonon modes of the KAgF3. Their contribution dominates the phonon DOS within the energy range 150–250 cm−1, which is the characteristic energy region of the F-Ag-F bending vibrations, and the entire higher energy phonon DOS in the range 300–450 cm−1, which is the characteristic region of the Ag-F stretching vibrations.
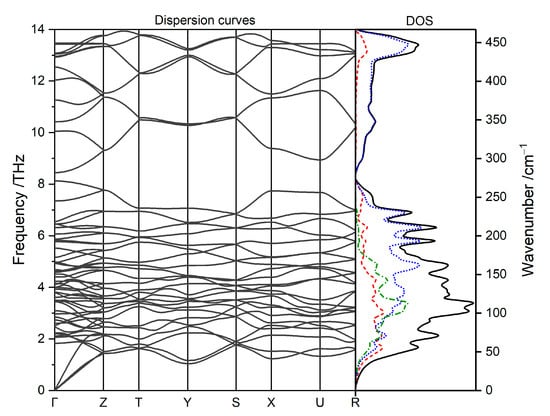
Figure 5.
The calculated phonon dispersion and phonon (atomic) density of states for KAgF3 (blue dotted line—F, red dashed line—Ag, green dash-dotted line—K).
The phonon bands belonging to F-Ag-F bending and low-energy lattice modes (below 250 cm−1) show relatively low dispersion. On the other hand, phonon bands stemming from diverse Ag-F stretching modes exhibit substantial dispersion indicating considerable coupling of the stretching vibrations along both the direction of the propagation of the AFM chains (corresponding to Y point in the 1st Brillouin zone) and within the [AgF2] planes (X and Z points in the 1st Brillouin zone).
The eigenvectors for selected normal modes assigned to measured IR and Raman spectra are shown in Figure 6, while the complete list of theoretically predicted Γ-point frequencies is contained in Electronic Supplementary Material.
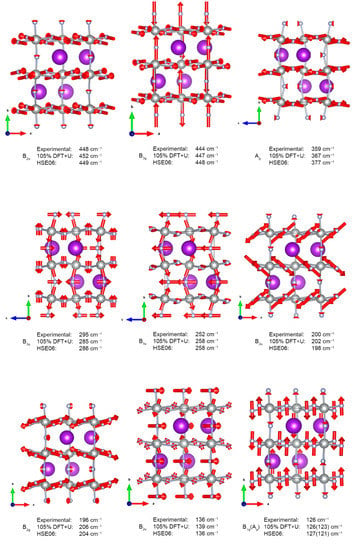
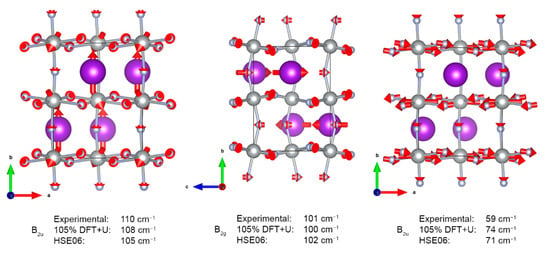
Figure 6.
Normal vectors for selected fundamentals. Red arrows show the direction and relative amplitude of atomic movement.
The measured room-temperature far infra-red absorption spectrum of KAgF3 (Figure 3) consists of eight bands, of which seven were successfully assigned using DFT+U framework while considering both selection rules and calculated absolute values of wavenumbers; we found out that the best match between theoretical and experimental wavenumbers is obtained if the former ones are scaled by the factor of 1.05 (Table 1 and Figure 3). The highest frequency band is placed at 448 cm−1 and was assigned to B2u stretching within [AgF2] planes in the ac plane. The 377 cm−1 shoulder cannot be assigned to any fundamental mode; it likely originates either from 126 cm−1 + 252 cm−1 combination mode (A1u) or from an unknown impurity. In a lower frequency range, observed bands are rather broad and not fully resolved. One feature centred at 200 cm−1 may be assigned to [AgF2] plane buckling vibrations (B2u). Two shoulders at 295 and 252 cm−1 are associated with similar plane buckling, as well as bending of the [AgF+] chain (B3u and B1u, respectively). The 136 cm−1 band of medium strength is also assigned to chain bending (B2u), but its two shoulders originate from potassium and fluoride lattice modes (both B2u, at 110−1 and 59 cm−1, respectively).

Table 1.
Vibrational band assignment for KAgF3.
In the measured room-temperature Raman spectrum seven bands are clearly visible. Two bands at 444 cm−1 and 359 cm−1 were assigned to Ag-F stretching within chain-forming [AgF6] octahedra and within [AgF2] planes (B2g and Ag, respectively). The weak band at 196 cm−1 is associated with [AgF2] intra sheet bending vibrations (B2g). The lowest lying 126 cm−1 and 101 cm−1 features correspond, respectively, to B1g and/or a nearby Ag, and B2g lattice modes involving potassium cations. There are two more bands in the spectral region above 800 cm−1 (not shown); the shoulder at 899 cm−1 is supposedly the first overtone of the IR-active B2u mode at 448 cm−1; the origin of the 949 cm−1 band currently remains unknown. The assignment presented above is substantially strengthened by the fact that HSE06 hybrid DFT calculations yield identical band assignment without necessity to scale wavenumbers by the 1.05 factor (Figure 7). Linear regression with excellent correlation factor of R2 = 0.997 is obtained for HSE06 dataset.
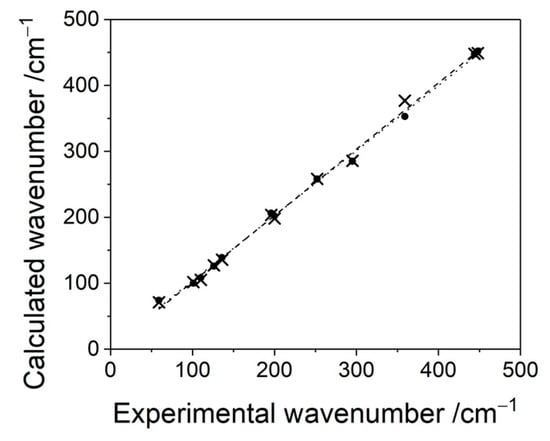
Figure 7.
Correlations between theoretical and experimental wavenumbers jointly for IR and Raman spectra (black dotted line—linear regression with R2 = 0.999 for corrected DFT+U dataset, black dashed line—linear regression with R2 = 0.997 for HSE06 dataset; both not bound to pass at (0,0)).
The measured low-temperature Raman spectra are compared with the room-temperature one in Figure 4. Both spectra are characteristic of the same four broad main features, while in the low-temperature spectrum these features are shifted to slightly higher energies. All bands that are present at low temperature, are observable also at RT, and the general shape of the spectrum remains unchanged. There is some phonon stiffening observed at low temperatures, with the 444 cm−1 band now appearing at 464 cm−1, the 359 cm−1 one at 380 cm−1, the 196 cm−1 one at 217 cm−1, the 126 cm−1 one at 127 cm−1, and the 101 cm−1 one at 109 cm−1.
In published work, the disordered room temperature Pcma structure is derived by dividing the Pnma unit cell in half and introducing disorder of fluoride anions. The fluorine anions are placed alternately along the [AgF+] chains with an occupancy of 0.5 [2]. As this type of phase transition does not substantially alter the network of covalent bonds, the thermal shift observed in Raman spectra can be satisfactorily explained by thermal compressibility of the KAgF3 lattice. With decreasing temperature, Ag–F bond lengths also decrease, causing energy of associated stretching and bending phonons to rise. The fact that the room temperature vibrational spectra of KAgF3 may be successfully assigned using the low-temperature Pnma structure serves as a confirmation of the X-ray diffraction-based hypothesis described above. This is additionally confirmed by comparing Raman spectrum obtained at room temperature and at 123 K (Figure 4, Table 2).

Table 2.
Wavenumbers of selected Raman fundamentals [cm−1] observed for KAgF3 at 123 K and at room temperature, and their ratio, R [1].
5. Conclusions
The vibrational spectra of KAgF3 perovskite, a unique 1D antiferromagnet, have successfully been assigned with the help from theoretical DFT calculations. The calculated frequencies are in excellent agreement with experimental values when applying a 1.05 scaling factor for DFT+U calculations, and without any scaling for hybrid DFT ones. Phonon dispersion curves show that the low-temperature Pnma structure is dynamically stable, as no phonon softening is present. Comparison of low temperature and room temperature Raman measurements proves that order–disorder phase transition in 230 K has no major effect on the crystal structure and vibrational characteristics of the compound. To achieve complete understanding of the vibrational structure of KAgF3 additional studies using, e.g., Inelastic Neutron Scattering are needed which could determine the energies of these phonons, which have so far eluded experiment, and enable comparison with theoretical values.
Supplementary Materials
The following are available online at https://www.mdpi.com/2624-8549/3/1/7/s1, Table S1: List of all theoretically predicted normal modes, Figure S1: Visualization of theoretically predicted normal modes in order of decreasing wavenumber.
Author Contributions
Conceptualization, W.G. and M.D.; methodology, Z.M. and M.D.; formal analysis, K.K.; investigation, K.K., J.G. and Z.M.; resources, W.G.; writing—original draft preparation, K.K.; writing—review and editing, M.D. and W.G.; visualization, K.K.; supervision, M.D. and W.G.; project administration, W.G.; funding acquisition, W.G. All authors have read and agreed to the published version of the manuscript.
Funding
This work was supported by Polish National Science Center (NCN) within Maestro project (2017/26/A/ST5/00570) funding. M. Derzsi acknowledges the ERDF, R&I Operational Program (ITMS2014+: 313011W085), Scientific Grant Agency of the Slovak Republic grant (VG 1/0223/19) and the Slovak Research and Development Agency grant (APVV-18-0168). Z. Mazej acknowledges the Slovenian Research Agency for financial support within research program P1-0045 Inorganic Chemistry and Technology.
Institutional Review Board Statement
Not applicable.
Informed Consent Statement
Not applicable.
Data Availability Statement
The data presented in this study are available in supplementary material.
Acknowledgments
The research was carried out using supercomputers of Interdisciplinary Centre for Mathematical and Computational Modelling (ICM), University of Warsaw, under grant number GA76-19 (ADVANCE++). Experimental research in Warsaw was carried out with the use of CePT infrastructure financed by the European Union—the European Regional Development Fund within the Operational Programme “Innovative economy” for 2007–2013 (POIG.02.02.00-14-024/08-00).
Conflicts of Interest
The authors declare no conflict of interest.
References
- Shaz, M.; Van Smaalen, S.; Palatinus, L.; Hoinkis, M.; Klemm, M.; Horn, S.; Claessen, R. Spin-Peierls transition in TiOCl. Phys. Rev. B 2005, 71, 100405. [Google Scholar] [CrossRef]
- Pieper, O.; Lake, B.; Daoud-Aladine, A.; Reehuis, M.; Prokeš, K.; Klemke, B.; Kiefer, K.; Yan, J.Q.; Niazi, A.; Johnston, D.C.; et al. Magnetic structure and interactions in the quasi-one-dimensional antiferromagnet CaV2O4. Phys. Rev. B 2009, 79, 180409. [Google Scholar] [CrossRef]
- Mazej, Z.; Goreshnik, E.; Jagliić, Z.; Gaweł, B.; Łasocha, W.; Grzybowska, D.; Jaroń, T.; Kurzydłowski, D.; Malinowski, P.; Koźminski, W.; et al. KAgF3, K2AgF4 and K3Ag2F7: Important steps towards a layered antiferromagnetic fluoroargentate(II). CrystEngComm 2009, 11, 1702–1710. [Google Scholar] [CrossRef]
- Kurzydłowski, D.; Mazej, Z.; Jagličić, Z.; Filinchuk, Y.; Grochala, W. Structural transition and unusually strong antiferromagnetic superexchange coupling in perovskite KAgF3. Chem. Commun. 2013, 49, 6262–6264. [Google Scholar] [CrossRef] [PubMed]
- Zhang, X.; Zhang, G.; Jia, T.; Guo, Y.; Zeng, Z.; Lin, H.Q. KAgF3: Quasi-one-dimensional magnetism in three-dimensional magnetic ion sublattice. Phys. Lett. A 2011, 375, 2456–2459. [Google Scholar] [CrossRef]
- Kurzydłowski, D.; Grochala, W. Large exchange anisotropy in quasi-one-dimensional spin-1/2 fluoride antiferromagnets with a d(z2)1 ground state. Phys. Rev. B 2017, 96, 155140. [Google Scholar] [CrossRef]
- Goldschmidt, V.M. Die Gesetze der Krystallochemie. Die Naturwissenschaften 1926, 14, 477–485. [Google Scholar] [CrossRef]
- Derzsi, M.; Malinowski, P.J.; Mazej, Z.; Grochala, W. Phonon spectra and phonon-dependent properties of AgSO4, an unusual sulfate of divalent silver. Vib. Spectrosc. 2011, 57, 334–337. [Google Scholar] [CrossRef]
- Gawraczyński, J.; Kurzydłowski, D.; Gadomski, W.; Mazej, Z.; Ruani, G.; Bergenti, I.; Jaroń, T.; Ozarowski, A.; Hill, S.; Leszczyński, P.J.; et al. The silver route to cuprate analogs. Proc. Natl. Acad. Sci. USA 2019, 116, 1495–1500. [Google Scholar] [CrossRef] [PubMed]
- Liechtenstein, A.I.; Anisimov, V.I.; Zaanen, J. Density-functional theory and strong interactions: Orbital ordering in Mott-Hubbard insulators. Phys. Rev. B. 1995, 52, R5467–R5470. [Google Scholar] [CrossRef] [PubMed]
- Csonka, G.I.; Perdew, J.P.; Ruzsinszky, A.; Philipsen, P.H.T.; Lebègue, S.; Paier, J.; Vydrov, O.A.; Ángyán, J.G. Assessing the performance of recent density functionals for bulk solids. Phys. Rev. B 2009, 79, 155107. [Google Scholar] [CrossRef]
- Blöchl, P.E. Projector augmented-wave method. Phys. Rev. B 1994, 50, 17953–17979. [Google Scholar] [CrossRef]
- Kresse, G.; Joubert, D. From ultrasoft pseudopotentials to the projector augmented-wave method. Phys. Rev. B 1999, 59, 1758–1775. [Google Scholar] [CrossRef]
- Kresse, G.; Hafner, J. Ab initio molecular dynamics for liquid metals. Phys. Rev. B 1993, 47, 558–561. [Google Scholar] [CrossRef]
- Kresse, G.; Furthmüller, J. Efficient iterative schemes for ab initio total-energy calculations using a plane-wave basis set. Phys. Rev. B 1996, 54, 11169–11186. [Google Scholar] [CrossRef]
- Kresse, G.; Furthmüller, J. Efficiency of ab-initio total energy calculations for metals and semiconductors using a plane-wave basis set. Comput. Mater. Sci. 1996, 6, 15–50. [Google Scholar] [CrossRef]
- Parlinski, K.; Li, Z.Q.; Kawazoe, Y. First-principles determination of the soft mode in cubic ZrO2. Phys. Rev. Lett. 1997, 78, 4063–4066. [Google Scholar] [CrossRef]
- Parlinski, K. PhononA Software ver.7.10; for Windows, 64-bit; Krzysztof Parlinski, Computing for Materials: Warsaw, Poland, 2017. [Google Scholar]
- Krukau, A.V.; Vydrov, O.A.; Izmaylov, A.F.; Scuseria, G.E. Influence of the exchange screening parameter on the performance of screened hybrid functionals. J. Chem. Phys. 2006, 125, 224106. [Google Scholar] [CrossRef]
Publisher’s Note: MDPI stays neutral with regard to jurisdictional claims in published maps and institutional affiliations. |
© 2021 by the authors. Licensee MDPI, Basel, Switzerland. This article is an open access article distributed under the terms and conditions of the Creative Commons Attribution (CC BY) license (http://creativecommons.org/licenses/by/4.0/).