Article

Synthesis and Characterization of Multifunctional Mesoporous Silica Nanoparticles Containing Gold and Gadolinium as a Theranostic System

by
André Felipe Oliveira
1,*,
Isabela Barreto da Costa Januário Meireles
1,
Maria Angela Barros Correia Menezes
1,
Klaus Krambrock
2 and
Edésia Martins Barros de Sousa
1
1
Serviço de Nanotecnologia (SENAN), Centro de Desenvolvimento da Tecnologia Nuclear—(CNEN/CDTN), Belo Horizonte 31270-901, Brazil
2
Departamento de Física, Universidade Federal de Minas Gerais, Belo Horizonte 31270-901, Brazil
*
Author to whom correspondence should be addressed.
J. Nanotheranostics 2025, 6(4), 26; https://doi.org/10.3390/jnt6040026
Submission received: 6 June 2025 / Revised: 27 August 2025 / Accepted: 22 September 2025 / Published: 26 September 2025

Abstract

Among the many nanomaterials studied for biomedical uses, silica and gold nanoparticles have gained significant attention because of their unique physical and chemical properties and their compatibility with living tissues. Mesoporous silica nanoparticles (MSNs) have great stability and a large surface area, while gold nanoparticles (AuNPs) display remarkable optical features. Both types of nanoparticles have been widely researched for their individual roles in drug delivery, imaging, biosensing, and therapy. When combined with gadolinium (Gd), a common contrast agent, these nanostructures provide improved imaging due to gadolinium’s strong paramagnetic properties. This study focuses on incorporating gold nanoparticles and gadolinium into a silica matrix to develop a theranostic system. Various analytical techniques were used to characterize the nanocomposites, including infrared spectroscopy (FTIR), ultraviolet-visible spectroscopy (UV-Vis), thermogravimetric analysis (TGA), nitrogen adsorption, scanning electron microscopy (SEM), dynamic light scattering (DLS), X-ray fluorescence (XRF), X-ray diffraction (XRD), vibrating sample magnetometry (VSM), and neutron activation analysis (NAA). Techniques like XRF mapping, XANES, nitrogen adsorption, SEM, and VSM were crucial in confirming the presence of gadolinium and gold within the silica network. VSM and EPR analyses confirmed the attenuation of the saturation magnetization for all nanocomposites. This validates their potential for biomedical applications in diagnostics. Moreover, activating gold nanoparticles in a nuclear reactor generated a promising radioisotope for cancer treatment. These results indicate the potential of using a theranostic nanoplatform that employs mesoporous silica as a carrier, gold nanoparticles for radioisotopes, and gadolinium for imaging purposes.

1. Introduction

In recent decades, there has been a growing interest in MSNs due to their promising potential as platforms for cancer therapy and imaging [1,2,3,4,5,6]. Several studies have highlighted the suitability of MSNs for various biological applications, attributed to their low toxicity and large surface area, which allow for customized chemical modifications and formulation adjustments [7,8,9,10,11]. Additionally, the narrow pore size distribution of MSNs has led to their use in a wide range of research applications as nanoplatforms for drug delivery systems [5,12,13,14,15,16,17]. These systems can encapsulate a variety of components within their matrix, including therapeutic drugs, fluorescent formulations, chelating agents, magnetic iron oxides, other oxides, metals, and gold nanoparticles [2,7,8,16,17,18,19,20,21,22]. This capability facilitates controlled and sustained release and retention of the encapsulated materials.
Gold nanoparticles (AuNPs) incorporated into a silica matrix have garnered significant attention in recent years [20,21,23,24,25,26,27]. These nanoparticles exhibit unique optoelectronic properties originating from their localized surface plasmon resonances [28,29,30,31,32,33,34,35,36,37]. These properties can be precisely adjusted through colloidal chemistry by manipulating the size and shape of the nanocrystals [28,29,31,37,38,39,40]. By leveraging the diverse optical characteristics of various gold nanostructures, substantial improvements can be achieved in the fields of biosensing and biomedical imaging [37,40,41]. A considerable amount of research has explored the synthesis of gold nanoparticles, which come in a variety of shapes, including nanospheres, stars, rods, and others [28,35,39,40]. However, there is a notable lack of research focusing on radioactive gold radionuclides/nanoparticles, specifically 198Au [39,42]. The integration of radioactive elements into nanoparticle platforms, such as mesoporous silica nanoparticles (MSNs), presents numerous technical and logistical challenges, making such studies rare and highly valuable. A recent study by Barbezan proposed an innovative approach for treating prostate cancer, utilizing a radioactive gold nanoparticle coated with bovine serum albumin (BSA) [39]. Consequently, nanoplatforms that contain gold nanoparticles within a silica matrix hold promising potential as a cancer therapy system [4,20,21,23,24,26,27,43,44,45].
Gadolinium has paramagnetic properties that make it useful as a contrast agent in magnetic resonance imaging (MRI) [46,47,48,49]. These properties enhance the multifunctionality of nanomaterials, allowing them to be used for imaging diagnosis [46,50,51]. Additionally, when exposed to irradiation in a nuclear reactor, gadolinium can transform into the radioisotope 159Gd, which emits beta and gamma radiation [50,52]. This particular radionuclide finds applications in diagnostic imaging techniques such as MRI and single photon emission computed tomography (SPECT) [50,53,54]. It can also be utilized in cancer treatment as a radioisotope [42,50,53,54]. However, gadolinium is extremely toxic when it exists as a free ion, especially when it is released from its chelate and accumulates in tissues [51,55]. This toxicity limits impacts the practicality of using free ions as magnetic or radio isotopic agents [51,55]. Therefore, it is essential to employ of a second phase to ensure the stability of this agent and to address the limitations posed by its toxicity [50,56]. Incorporating of gadolinium as an oxide or chelate is crucial in preventing its elevated toxicity [2,19,51,56,57,58].
A significant amount of research has focused on synthesizing nanocomposites that include silica/gold nanoparticles [17,20,21,23,24,25,27,43,59], silica/gadolinium [2,3,19,51,60], or gold/gadolinium [61,62,63,64], which are employed in photothermal therapy and imaging applications. However, reports on mesoporous silica nanoparticles MSNs combined with gold and gadolinium (MSNs/Au/Gd) are relatively rare. Notably, a study by Kadria-Vili and co-workers (2022) described a system where gadolinium oxide/mesoporous silica was coated with a gold shell, creating a core–shell structure that exhibits both MRI contrast and near-infrared photothermal properties [43]. This finding highlights the potential use of MSNs/Au/Gd nanocomposites as theranostic systems.
In this study, we synthesized tailored nanocomposites that incorporate mesoporous silica nanoparticles (MCM-41) with gold nanoparticles (AuNPs) and gadolinium oxide (Gd2O3). The resulting nanomaterial exhibits a large surface area and possesses magnetic properties, making it suitable for use a as theranostic systems in diagnostic imaging with MRI/SPECT machines, or through the use of the radioisotopes 198Au and/or 159Gd in radiotherapy. This approach facilitates the simultaneous treatment and diagnosis of various types of cancers. Vibrating sample magnetometry (VSM) and electron paramagnetic resonance (EPR) analyses confirmed the paramagnetic behavior of all the nanocomposites, reinforcing their potential for biomedical applications. Additionally, activating gold in a nuclear reactor produced a promising radioisotope that can be utilized in cancer treatment. The investigation into the practical biological applications of these composites is significant, and further research in this area may lead to the development of innovative methods for cancer diagnosis and therapy.

2. Methodology

2.1. Materials

Tetraethyl orthosilicate (TEOS, 98%), cetyltrimethylammonium bromide (CTAB, 99%), sodium hydroxide (NaOH, 98%), chloroauric acid trihydrate (HAuCl4.3H2O, 99.9%), silver nitrate (AgNO3, 99%), L-ascorbic acid (C6H8O6, 99%), and gadolinium (III) nitrate hexahydrate (Gd(NO3)3.6H2O, 99.9%) were purchased from Sigma-Aldrich (Louis, MO, USA). Sodium borohydride (NaBH4, 99%) was purchased from FLUKA (Buchs, Switzerland).

2.2. Synthesis of Mesoporous Silica Nanoparticles

Mesoporous silica nanoparticles, specifically MCM-41, were synthesized using the sol-gel method as described by Freitas et al. (2017), Meireles et al. (2021), and Oliveira and Sousa (2023) [1,2,21]. In this process, tetraethoxysilane (TEOS) was used as the silicon precursor, and cetyltrimethylammonium bromide (CTAB) served as a template to create the pore structure. Initially, 280 mg of sodium hydroxide (NaOH) and 1000 mg of CTAB were completely dissolved in 480 mL of deionized water, with continuous stirring at a temperature of 78 °C. Once the surfactant was fully dissolved, 5 mL of TEOS was added slowly to the mixture. The resulting material was then filtered, washed, and dried at 60 °C for 24 h. Finally, the calcination process was performed at 550 °C for 165 min in a tubular furnace (EDG FT HI 20, São Carlos, São Paulo, Brazil) without a gas supply.

2.3. Synthesis of Gold Nanoparticles

The synthesis of gold nanoparticles was carried out using a modified method based on existing literature [21,28]. Initially, two precursor solutions were prepared. The seed solution was created by combining CTAB (0.2 M) with HAuCl4.3H2O (0.0005 M) and then adding ice-cold NaBH4 (0.01 M). This mixture was stirred vigorously for 2 min at room temperature. Three different types of gold nanoparticles were synthesized by varying the preparation of the growth solution, with silver nitrate being the only difference. First, 15 mL of CTAB (0.2 M) was added and stirred at 27–30 °C. For gold nanospheres (designated Au530), no silver nitrate was added to the solution. For gold nanobeans (Au630), HAuCl4.3H2O (0.005 M) was added first, followed by the addition of AgNO3 (0.02 M). For gold nanorods (Au800), the synthesis involved adding AgNO3 (0.02 M) first, followed by and then HAuCl4.3H2O (0.005 M). In all three cases, C6H8O6 (0.4 M) was also added to the solution. The final stage of the synthesis involved adding 0.3 mL of the seed solution to the growth solution and stirring it continuously for 20 min. The final solution was purified through three cycles of centrifugation at 11,000 rpm for 30 min. The supernatant was carefully removed, and the precipitate was resuspended in deionized water.

2.4. Synthesis of Nanocomposites

The nanocomposites were prepared similarly to the method described by Oliveira and Sousa (2023) and Meireles et al. (2021) [2,21]. First, gold nanoparticles (Au530, Au630 or Au800) were dispersed in 380 mL of deionized water while stirring continuously at 78 °C. Next, 280 mg NaOH and 1000 mg of CTAB were added to the mixture. Then, 3.6 mL of TEOS was added dropwise to the solution, which was stirred before adding 309 mg of Gd(NO3)3 in a theoretical proportion of 4% mol or 9% mass relative to silicon. An additional 1.4 mL of TEOS was then added dropwise, and the mixture was allowed to stir for another 2 h. Subsequently, nanocomposites with gold nanospheres (named as SiAu530Gd) and nanobeans (named as SiAu630Gd) were calcined at 550 °C for 165 min in a tubular furnace without a gas supply. The surfactant was removed from the MCM-41 containing gold nanorods (named as SiAu800Gd) by solvent extraction using a 1 M HCl/EtOH solution at 70 °C for 1 h [65].

2.5. Characterization

FTIR measurements were performed with a Bruker model Vertex 70v instrument using a Platinum Diamond ATR (Bruker, Billerica, MA, USA) in a vacuum (~1 mbar). The spectra were collected with 128 accumulations, a resolution of 4 cm−1, and a region in the transmission mode from 4000 to 200 cm−1. The samples’ porosity parameters and nitrogen adsorption isotherms were obtained at 77 K using a Quantachrome Autosorb Nova 2000 adsorption analyzer (Quantachrome, Boynton Beach, FL, USA). Specific surface area was calculated through the Brunauer–Emmett–Teller (BET) method, while pore volume and pore sizes were calculated using the Barret–Joyner–Halenda (BJH) theory applied to N2 desorption data from the obtained isotherms; all the samples analyzed were outgassed for 4 h at 300 °C. The weight loss of the samples as a function of increasing temperature was determined in a Shimadzu thermogravimetric analyzer (Shimadzu, Kyoto, Japan) 50 WS and the measurements were carried out in a nitrogen atmosphere (100 mL/min−1) using a sample mass of approximately 3–10 mg from 25 to 800 °C, at a temperature rate of 10 °C.min−1. XRD patterns and SAXS were measured at RT using a Rigaku Ultima diffractometer (Shimadzu, Kyoto, Japan) with Cu Kα radiation in room temperature. The XRD measurements were performed starting from 10° to 90° with a velocity scan of 0.5°/min, and a step of 0.02. For SAXS, the measurements were performed starting from 0.1° to 6° with a velocity scan of 0.05°/min and step of 0.01°. Energy dispersive X-ray fluorescence (EDXRF) was measured at room temperature using the Rigaku model NEX CG (Shimadzu, Kyoto, Japan) for elemental analyses. The magnetic characteristics of the samples were determined at room temperature using about 30 mg of the sample in vibrational sample magnetometry (VSM; 7400 series, LakeShore Cryotronics, Westerville, OH, USA). Measurements of the hydrodynamic size were carried out by dynamic light scattering (DLS), as this procedure allows for the calculation of the mean size of the particles within dispersion and the polydispersity index (PDI), which is a dimensionless measure of the broadness of the particle size distribution. After adequate dilution in deionized water (1 mg/mL, refraction index of 1.33), the analytical procedure was conducted in a Zetasizer Nanoseries Zs (Malvern Panalytical, Malvern, UK) apparatus. The colloidal stability of the nanocomposites was evaluated by monitoring the zeta potential values of the samples for 7 days. The analytical procedure was carried out in a Zetasizer Nano Zs (Malvern Panalytical, Malvern, UK). The samples were prepared at a concentration of 0.05 mg/mL (50 μg.mL) dispersed in simulated body fluid (SBF, pH 7.34) with a conductivity of approximately 20 ± 2 mS/cm2. The stability of the chemical interactions between mesoporous silica and gadolinium was investigated using SBF suspensions. The essay consisted of preparing 1 mg/mL suspensions of the composites (pH 7.34), incubating them, and keeping them stirred (50 RPM) at 37 °C for 120 h. After each incubation period, the suspensions were filtered, and the resulting liquid was analyzed using inductively coupled plasma optical emission spectrometry (ICP-OES, Specto Arcos, SPECTRO Analytical Instruments, Kleve, Germany) to determine the gadolinium content. MEV images were taken using the FEG-SEM model SIGMA VP, Carl Zeiss Microscopy (Zeiss Microscopy, Oberkochen, Germany). Electron paramagnetic resonance (EPR) was conducted at room temperature using about 30 mg to analyze the paramagnetic behavior of all samples. The experiments were performed on a modified EPR Miniscope 400 (Magnettech, Freiberg, Saxony, Germany) spectrometer working at X-band microwave frequencies (~ 9.40 GHz) using standard 100 kHz magnetic field modulation. X-ray fluorescence (XRF) mapping and X-ray Absorption Near Edge Spectroscopy (XANES) measurements were carried out at the Tarumã endstation of the Carnaúba beamline of the Brazilian Synchrotron Light Laboratory (Sirius-LNLS, Campinas, São Paulo, Brazil). Applying the neutron activation analysis, k0-method [66], the production of 198Au and 159Gd radioisotopes occurred by the irradiation of all samples in the carousel of TRIGA Mark I IPR-R1 (General Atomics, San Diego, CA, USA), 100 kW nuclear research reactor located at CDTN (Belo Horizonte, Brazil). A mass of 100 mg of all samples was irradiated for 20 min to investigate the activation under a thermal neutron flux of 6.4 × 10¹¹ neutrons cm−2·s−1. To determine the gadolinium and gold activation, 197Au(n,γ)198Au and 158Gd(n, γ)159Gd, the gamma spectra of the irradiated samples were obtained using an HPGe detector with a nominal efficiency of 50% and the software Genie 2000, CANBERRA.

2.6. Cell Viability Assay

Cell viability assays were conducted using the fibroblast cell line MRC-5, and the 4T1 breast cancer cell line, which was derived from the mammary gland tissue of a BALB/c mouse strain obtained from ATCC (Manassas, VA, USA). The cells were cultured at 37 °C in 5% CO2 in high-glucose Dulbecco’s modified Eagle’s medium (DMEM; Life Technologies, Thermo Fisher Scientific, Carlsbad, CA, USA) containing 10% fetal bovine serum, 1 mM sodium pyruvate, 50 units/mL penicillin, and 50 μg/mL streptomycin (Life Technologies). The cells were cultured in the presence or absence of MCM-41 and nanocomposites. Cell viability was assessed using Resazurin (7-hydroxy-3H-phenoxazine-3-one 10-oxide; Sigma-Aldrich (Louis, MO, USA), a cell-permeable redox indicator. Cells were seeded in 96-well plates at a density of 2 × 10⁴ cells/well in 0.2 mL of DMEM culture medium. After 24 h of culture, the samples were treated with 10, 50, 100, or 200 µg mL−1. Untreated cells were used as the control group. Moreover, after 48 h of incubation with the nanomaterials, the culture medium was removed and replaced with a solution containing DMEM and Resazurin (0.5 mg/mL), followed by an additional 12 h incubation. The optical density was then measured using a spectrophotometer at 570 nm (Multiskan GO microplate reader, Thermo Fisher Scientific, Carlsbad, CA, USA).

3. Results

FTIR spectroscopic analyses were conducted to elucidate the vibrational chemical bonds present in each sample, as shown in Figure 1. The infrared spectrum of MCM-41 and all nanocomposites reveals transmission bands typical of silica materials. Specifically, the prominent bands at 1060, 800, 440 cm−1, along with a shoulder at approximately 1250 cm−1, correspond to antisymmetric stretching, bending, and out-of-plane bonding of Si-O-Si. Additionally, the vibrational band observed at 970 cm−1, which is typical of silanol groups (Si-OH) commonly found in silica materials, further confirms the successful synthesis of the materials [1,2,17,21]. The transmission band associated with Gd-O was not detectable, likely due to the limited amount of gadolinium oxide present in the system; this vibrational band may overlap with the Si-O-Si bond at 440 cm−1 [2]. The bands observed in the spectrum of the mesoporous silica nanoparticles were also found in the nanocomposites, indicating that the formation of characteristic functional groups of MCM-41 was not affected by the insertion of gold nanoparticles and gadolinium oxide. In addition, it was observed that SiAu800Gd presented vibrational bands in 2930 and 2850 cm−1 characteristics of C-H of remaining CTAB that was not completely removed during the solvent extraction using 1% HCl solution. Furthermore, these results show that all the synthesized materials presented the mesoporous silica transmission band, as seen in the literature [17,19].
The thermogravimetric analyses (TGA) of all nanocomposites are shown in Figure 1b, while the weight-loss table is in the insert. In the temperature range of 25–150 °C, the mass loss rate for MCM-41 and its nanocomposites ranged from 0.9% to 2.8%. This initial range is attributed to physically adsorbed water molecules. In the second temperature range, from 150 °C to 500 °C, the weight loss for all samples, except SiAu800Gd, was approximately 1.6–3.0%. This loss likely corresponds to synthesis residuals that remained following calcination for MCM-41 and its calcined nanocomposites, possibly related to the presence of the template (CTAB) [17,67]. In the third range, from 500 to 800 °C, the weight loss was almost negligible (0.3–0.4%), indicating excellent thermal stability for the calcined nanocomposites and MCM-41 throughout this temperature range. For SiAu800Gd, however, the mass loss rate increased to around 7.6%, which may be associated with the degradation of the surfactant (CTAB). This suggests that the solvent extraction process was less efficient in removing CTAB by compared to calcination at 550 °C [21]. As was observed using the FTIR technique, the TGA results also indicate the presence of CTAB [17]. This could be due to residual surfactant that was not eliminated during solvent extraction with 1% HCl, possibly existing in more internal regions of the silica matrix [21,67]. In the 500–800 °C temperature region, a continuous degradation rate of approximately 1.8% was noted in the weight loss curve, likely related to residuals from the synthesis process.
The specific surface area of MCM-41 and the composites were measured by N2 adsorption–desorption (Figure 2), and the results are shown in Table 1. The MCM-41 samples show an isotherm of type IV, consistent with IUPAC [68,69]. It is typical of mesoporous materials with a large surface area. BET (Brunauer–Emmett–Teller) theory was employed to calculate the specific surface area, which for MCM41 was 1162.7 m2/g, and for nanocomposites, reduced to 992.8 m2/g (SiAu800Gd). The pore distribution and diameter were calculated using the BJH (Barrett–Joyner–Halenda) method applied to the desorption branch to estimate pore size distribution, which was 2.6 nm for MCM-41 [68]. Adding gold nanoparticles and gadolinium oxide to the synthesis of mesoporous silica decreased the specific surface area but increased the pore diameter and volume for all nanocomposites (4.1 nm for SiAu800Gd). These results suggest that the new constituents are present within the silica matrix, occupying smaller pores and enlarging their diameter and volume, as shown by the pore size distribution graph (inserted in Figure 2). In the case of SiAu800Gd, a larger pore diameter and volume were observed compared to the other nanocomposites. This observation may result from the widening of pores caused by the larger size of the gold nanorods in the silica matrix during the composite synthesis. The effectiveness of the nanomaterial in controlled drug delivery heavily depends on its pore structure. Because of this, this technique was used to assess the porosity and texture parameters of the synthesized nanocomposite systems. Additionally, a high pore volume and larger pore diameter are vital features, making the MSN/Au/Gd2O3 system highly promising for drug delivery. These properties also enable their use as a theranostic system proposed in this study, offering a multifaceted therapeutic approach.
Figure 3a shows the XRD patterns for all samples at room temperature. For all nanocomposites, the observed patterns are well identified and indexed as a cubic phase with space group Fd-3m (Au, ICSD 64-701). The characteristic peaks at 38.2°, 44.4°, 64.6°, 77.6°, and 81.8° Bragg angles (2θ) can be assigned to the crystallographic planes (111), (200), (220), (311), and (222) of gold in all composites, indicating the presence of nanoparticles in the systems. For SiAu800Gd, three minor peaks were observed, and it was indexed with the remaining CTAB (monoclinic P21/c, ICSD 30-1746; see Figure S1), as noticed in FTIR and TGA. Additionally, a diffuse halo within the 15° to 35° range was observed. This halo could be attributed to the short-range periodicity characteristic of the tetrahedral unit of the amorphous silica matrix (SiO4)4− [16].
SAXS (Small-Angle X-ray Scattering) is a technique that measures X-rays at very small angles (0.1–6°) and can complement nitrogen adsorption. SAXS of the MCM-41 and nanocomposite samples are presented in Figure 3b. The curves display three Bragg reflections corresponding to the planes (hkl) based on the Miller indices (100) at = 2.47°, (110) at = 4.29° and (200) at = 4.95°, characteristic of the hexagonal ordering of mesoporous silica like MCM-41 [1,67,69]. The internal structure of mesoporous blocks consists of a hexagonal arrangement of mesoporous cylinders. It is characterized by interplanar spacing values d(100) (calculated by Equation (1)) and hexagonal unit cell parameter a0 (calculated by Equation (2)). Through Figure 3b, it is possible to note that the diffraction signals characteristic of hexagonal systems, corresponding to the (100) plane, are conserved. The values of d(100), a0, and wt for the samples are found in Table 1. The value of “wt” is the thickness of the pore wall, and Pd is the diameter of the pores calculated from gas adsorption analysis (Equation (3)).
d = λ s i n 2 θ
a 0 = d ( 100 ) 3  
w t = a 0 P d
Furthermore, we can confirm that the planes referring to the Miller indices (110) and (200) were not observed in the diffractogram of the composite samples. The presence of gold nanoparticles and gadolinium oxide within the silica matrix may have filled specific pores, leading to a reduction in the intensity of the peaks. The first peak at = 2.47° was shifted, indicating a change in the structural order of the samples due to the incorporation of these materials into the silica matrix for all nanocomposites, which aligns with the nitrogen adsorption results [71]. Additionally, we observed that the wall thickness (wt) decreased from 1.5 to 0.3 nm, while the mesoporous parameter (a0) increased from 4.1 to 4.4 nm with the addition of gold nanoparticles and gadolinium oxide, as shown in Table 2. Subtracting (a0) and (wt) gives the pore diameter values obtained from nitrogen adsorption (2.6 and 4.1 nm). As illustrated in nitrogen adsorption studies (Figure 2 and Table 1), the morphology of gold nanorods, defined by their shape and size, appears to have a significant impact on the structural parameters of mesoporous silica, in contrast to the behavior observed for other types of gold nanoparticle morphologies.
X-ray fluorescence (XRF) analysis was performed to determine the mass percentages of the elements present in the samples’ oxides and metallic nanoparticles, specifically Si, O, Au, and Gd. The results are summarized in Table 3. For MCM-41, the measured data presented were consistent with the theoretical percentages. The presence of gadolinium and gold was detected in all the nanocomposites, confirming the successful incorporation of the elements into the silica matrix. In the sample SiAu530Gd, the amount of gold matched the theoretical percentage, suggesting the synthesis of gold nanospheres, which may be more facile to achieve than other morphologies such as nanobeans and nanorods [28]. Additionally, for the sample SiAu800Gd, a decrease in gadolinium and gold was noted, likely due to surfactant removal by 1% HCl.
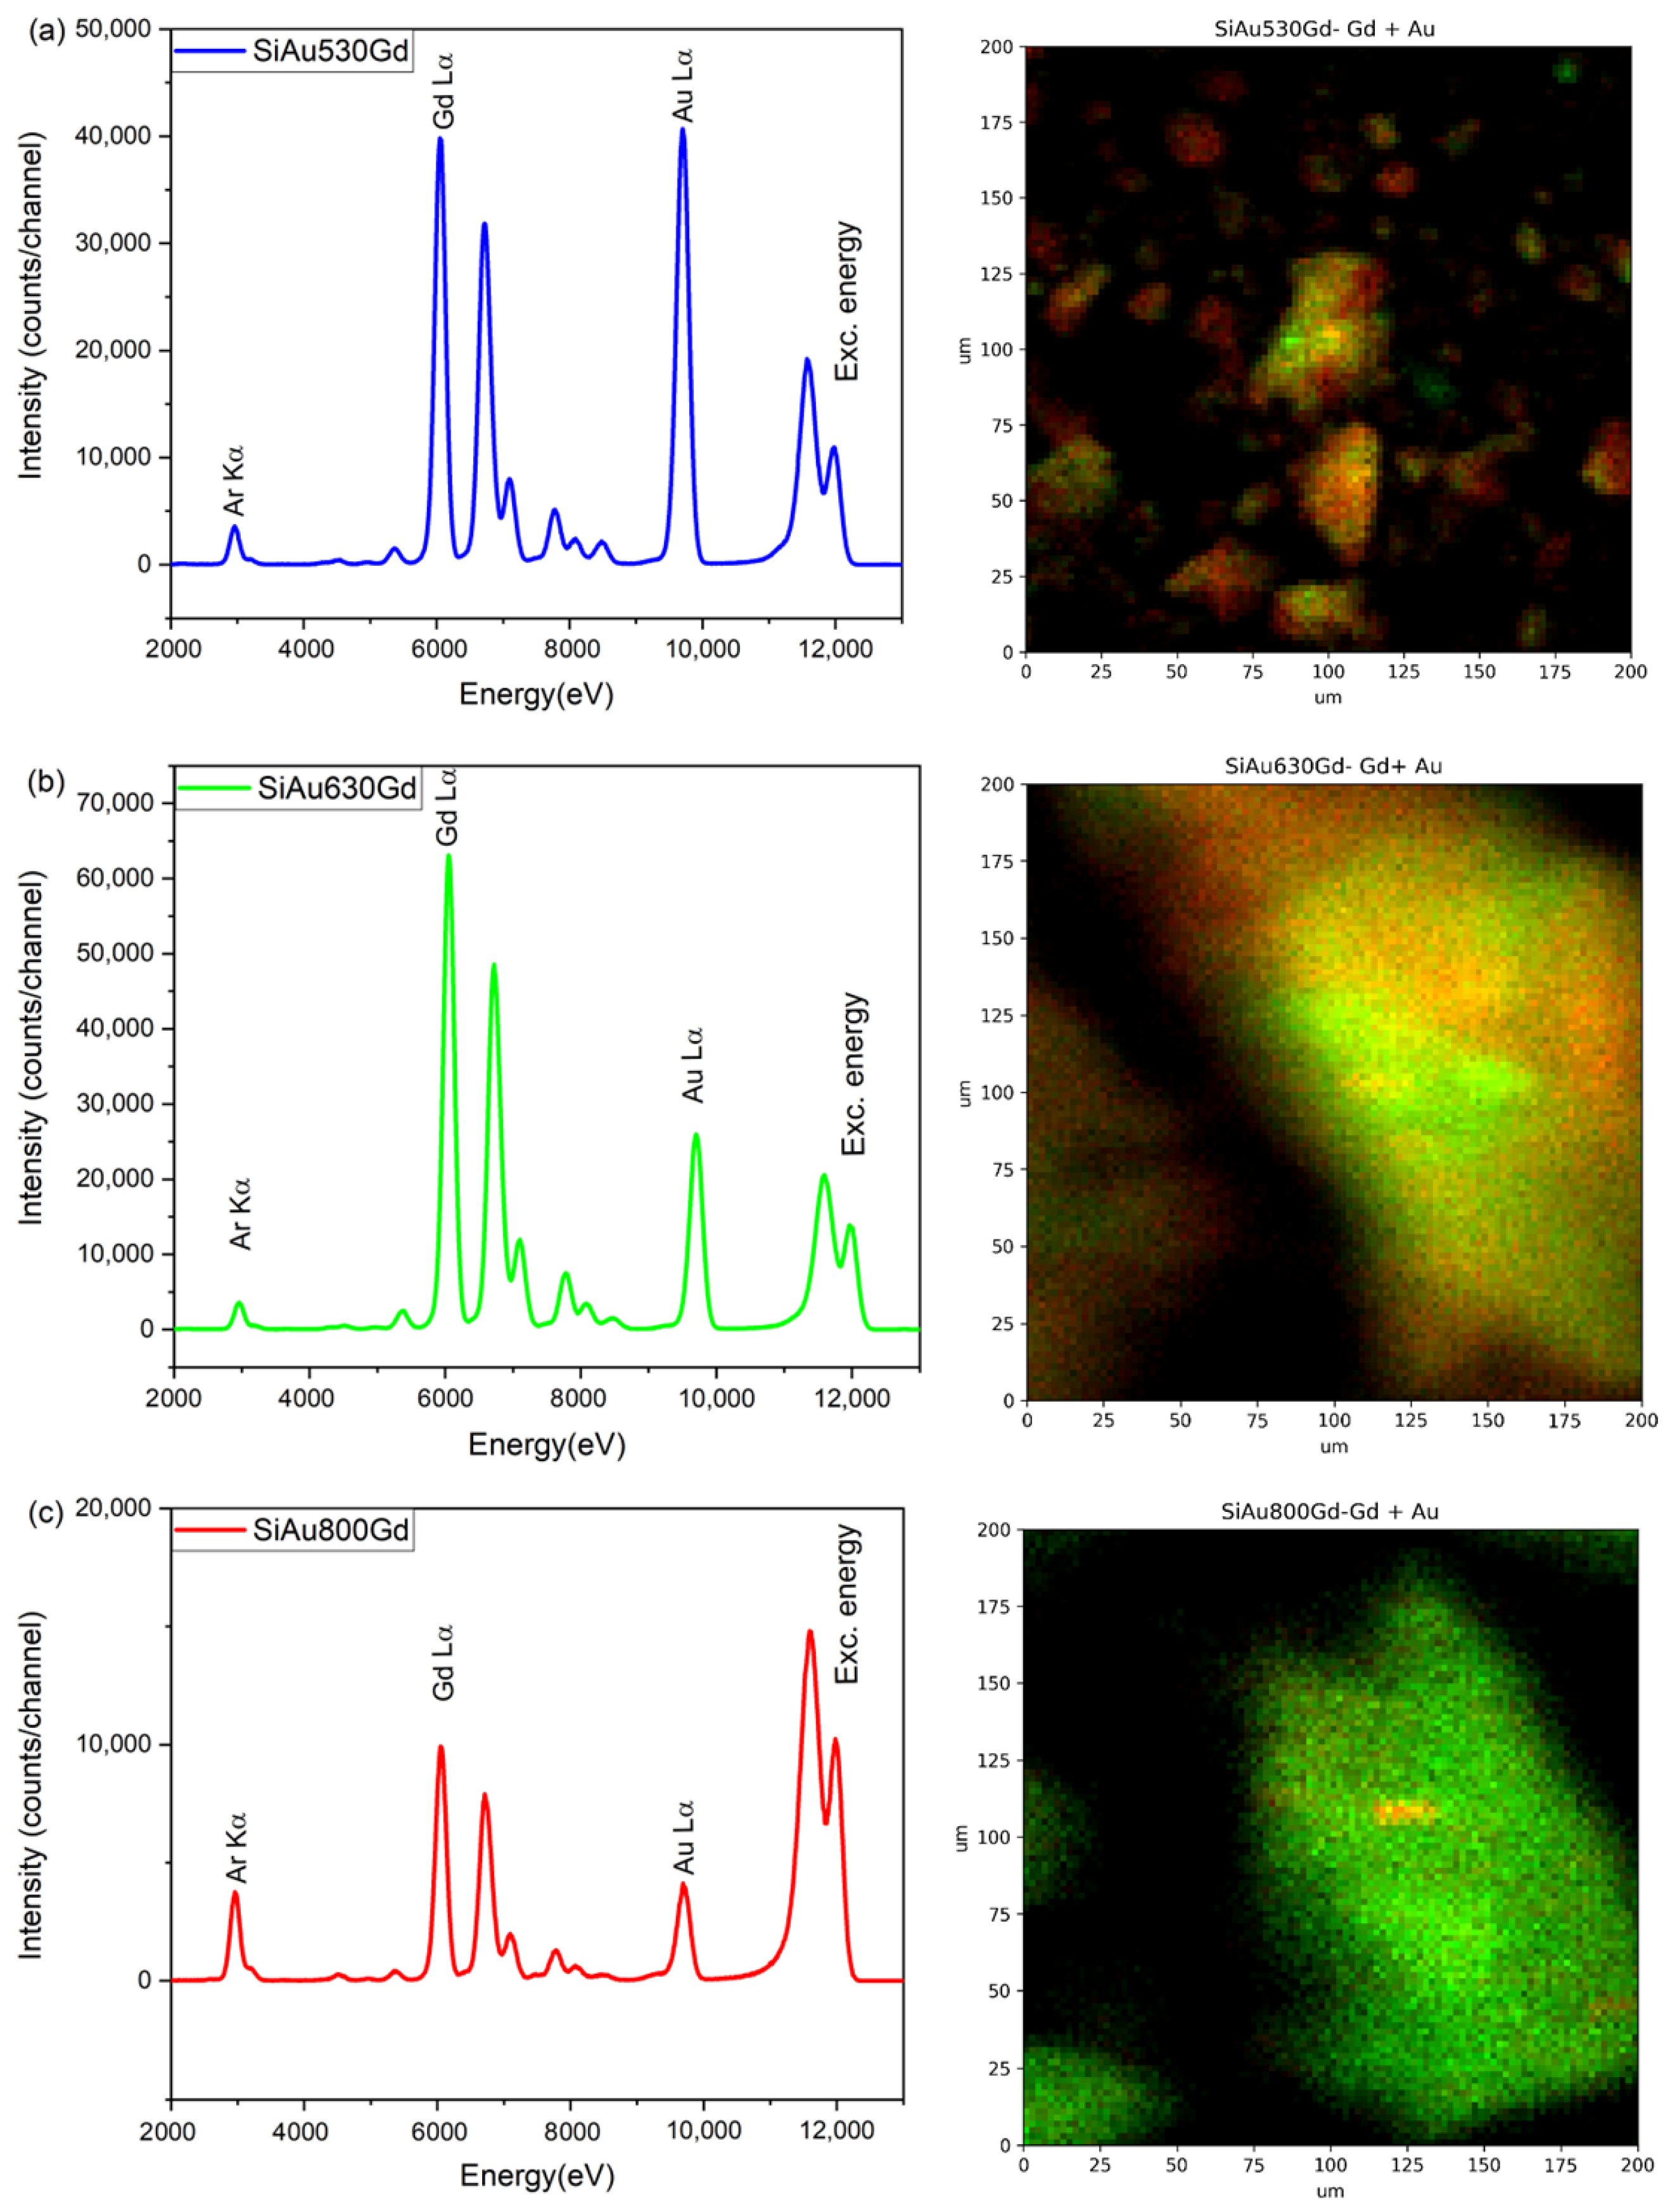
The distribution of gadolinium and gold within the composites was analyzed using X-ray fluorescence (XRF) mapping, achieving submicrometric spatial resolution under irradiation energy of 12,000 keV, as shown in Figure 4. The XRF spectra allowed for the integration of Gd (represented in green color) and Au (shown in red color) Lα lines in each pixel, creating maps that confirmed the concomitant presence of both elements. The low-magnification images in Figure 4 further validated the presence of gadolinium and gold. In the SiAu800Gd sample, a minor concentration of gold was detected, a finding that was supported by the XRF analyses.
XANES spectra can reveal the valence of atoms in a material as well as their coordination symmetry. Figure 5 presents the XANES spectra at Gd K-edge for each nanocomposite. Depending on the valence of the absorbing ion, a shift in the position of the absorbing edge can be detected because of the binding energy of bound electrons, which increases with higher valence. For all composites analyzed, no significant modifications were observed as a function of the Gd compared to the gadolinium oxide pattern [72]. This indicates that gadolinium oxide was successfully formed during the silica synthesis process.
The saturation magnetization (Ms) of the nanocomposites was measured by evaluating their magnetic hysteresis loops at room temperature, as shown in Figure 6a. The total mass of the systems was considered when calculating the Ms values. The hysteresis loops of MCM-41 and the nanocomposites are shown in Figure 6a. A decrease in Ms was noted for all sample MCM-41/NpAu/Gd compared to the gadolinium oxide. This reduction may be attributed to a decrease in the paramagnetic phase of the gadolinium oxide, which is consistent with findings in the literature [71]. Additionally, the hysteresis loop was adjusted based on the percentage of gadolinium present in the nanocomposites, as detailed in Table 3 and presented in Figure 6b. The Ms of the compounds exhibited a resemblance to gadolinium after adjustment based on the percent phase fractions. A marginal decline in Ms was evident for sample Si800Gd compared to the other nanocomposites. This observation may be attributed to a partial dissolution of gadolinium oxide during the surfactant extraction process that utilized a 1% HCl solution and, as a result, for a no-paramagnetic phase of residual CTAB.
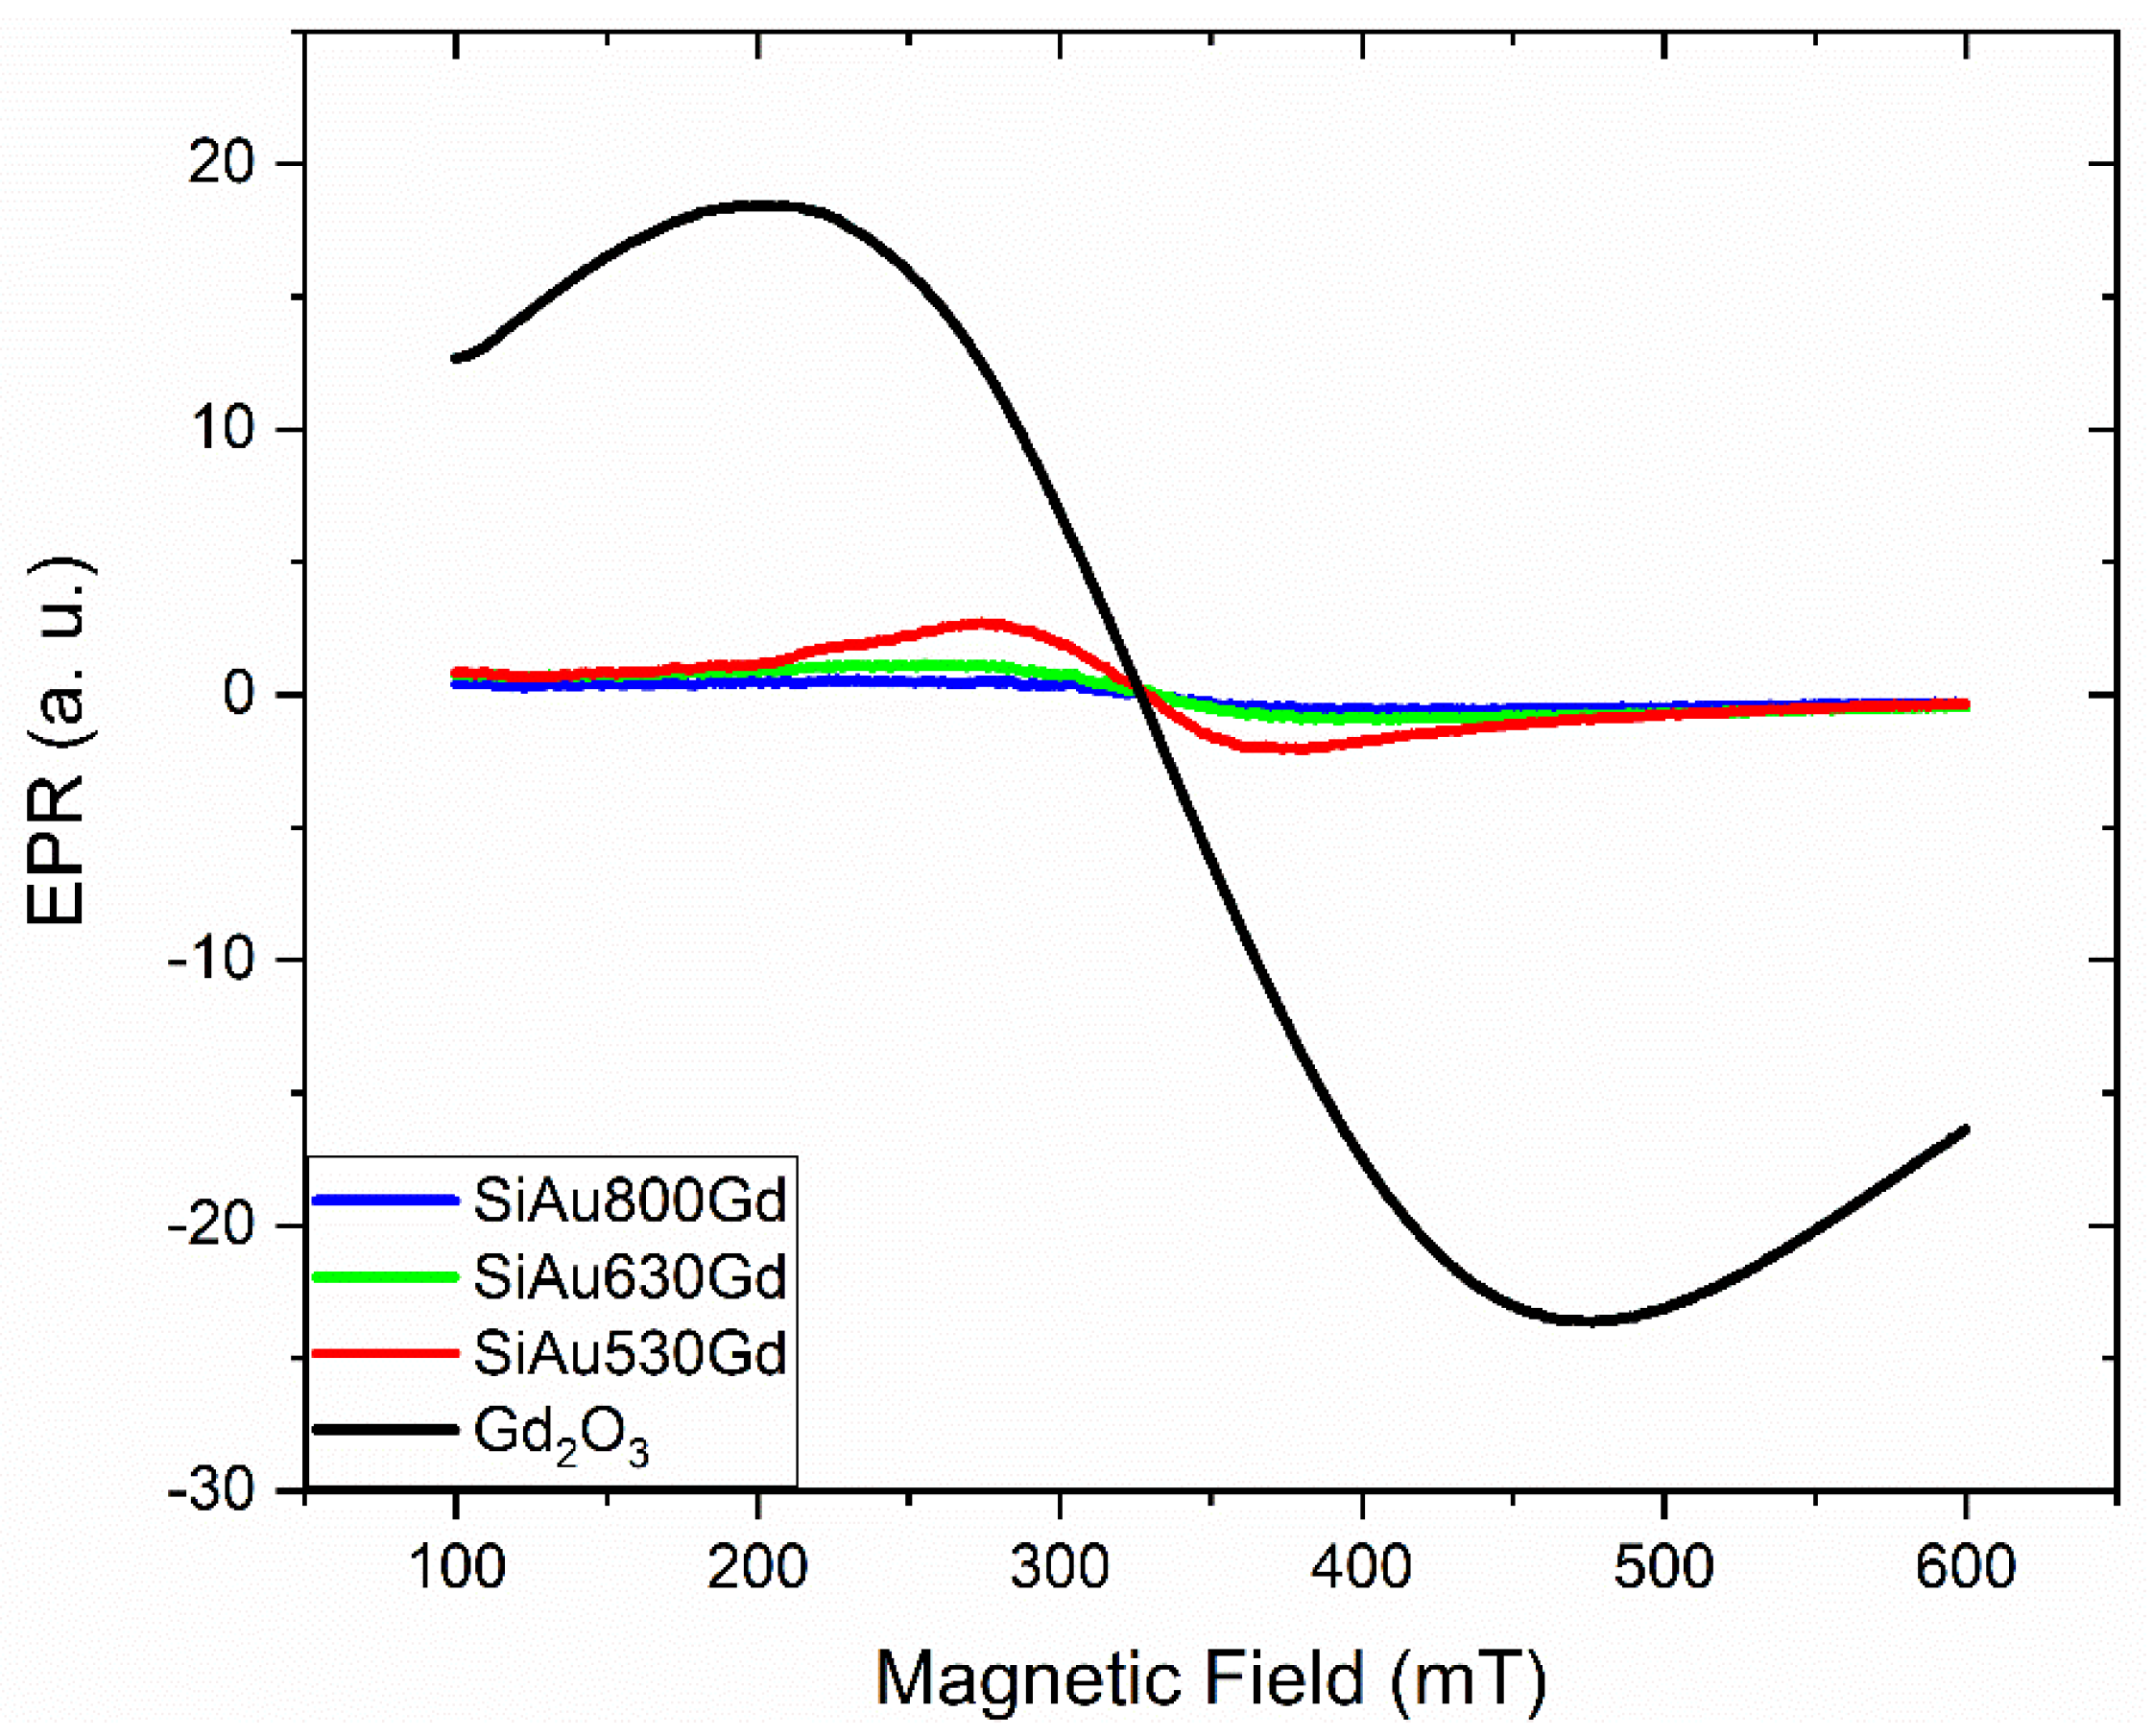
Electron paramagnetic resonance (EPR) spectroscopy was used to examine the magnetic characteristics of the nanoconjugates, as shown in Figure 7. The nanocomposite particles exhibited similar EPR signals when analyzed at room temperature (T = 300 K). In comparison, a measurement containing only gadolinium oxide produced a very broad, intense EPR signal centered at about g ~ 2.0. This indicates a high concentration of Gd3+ ions along with some magnetic coupling between the Gd atoms; however, the magnetic phase is primarily paramagnetic. On the other hand, the nanocomposites SiAu530Gd and SiAu630Gd also displayed broad EPR lines, albeit with lower intensity, consistent with their much lower Gd concentrations [73,74]. The double-integrated EPR signals of the SiAu530Gd and SiAu630Gd samples are proportional to the Gd concentration and align with the data obtained by the XRF analyses (Table 3). In contrast, the SiAu800Gd sample exhibited somewhat distinct magnetic behavior. The EPR signal for SiAu800Gd sample was nearly suppressed, similar what was observed by VSM. Although gold is generally diamagnetic in the bulk form, it can exhibit ferromagnetic behavior at the nanoparticle level, depending on the capping layer of the Au nanoparticle [75,76]. Paramagnetic rare earth elements have garnered significant attention due to their distinctive magnetic attributes, which hold promise for applications in cancer nanomedicine and other biomedical fields, such as magnetic resonance imaging (MRI) for diagnostic purposes. Furthermore, the magnetic properties of these nanocomposites may be investigated further in future studies on cancer nanotheranostics systems.
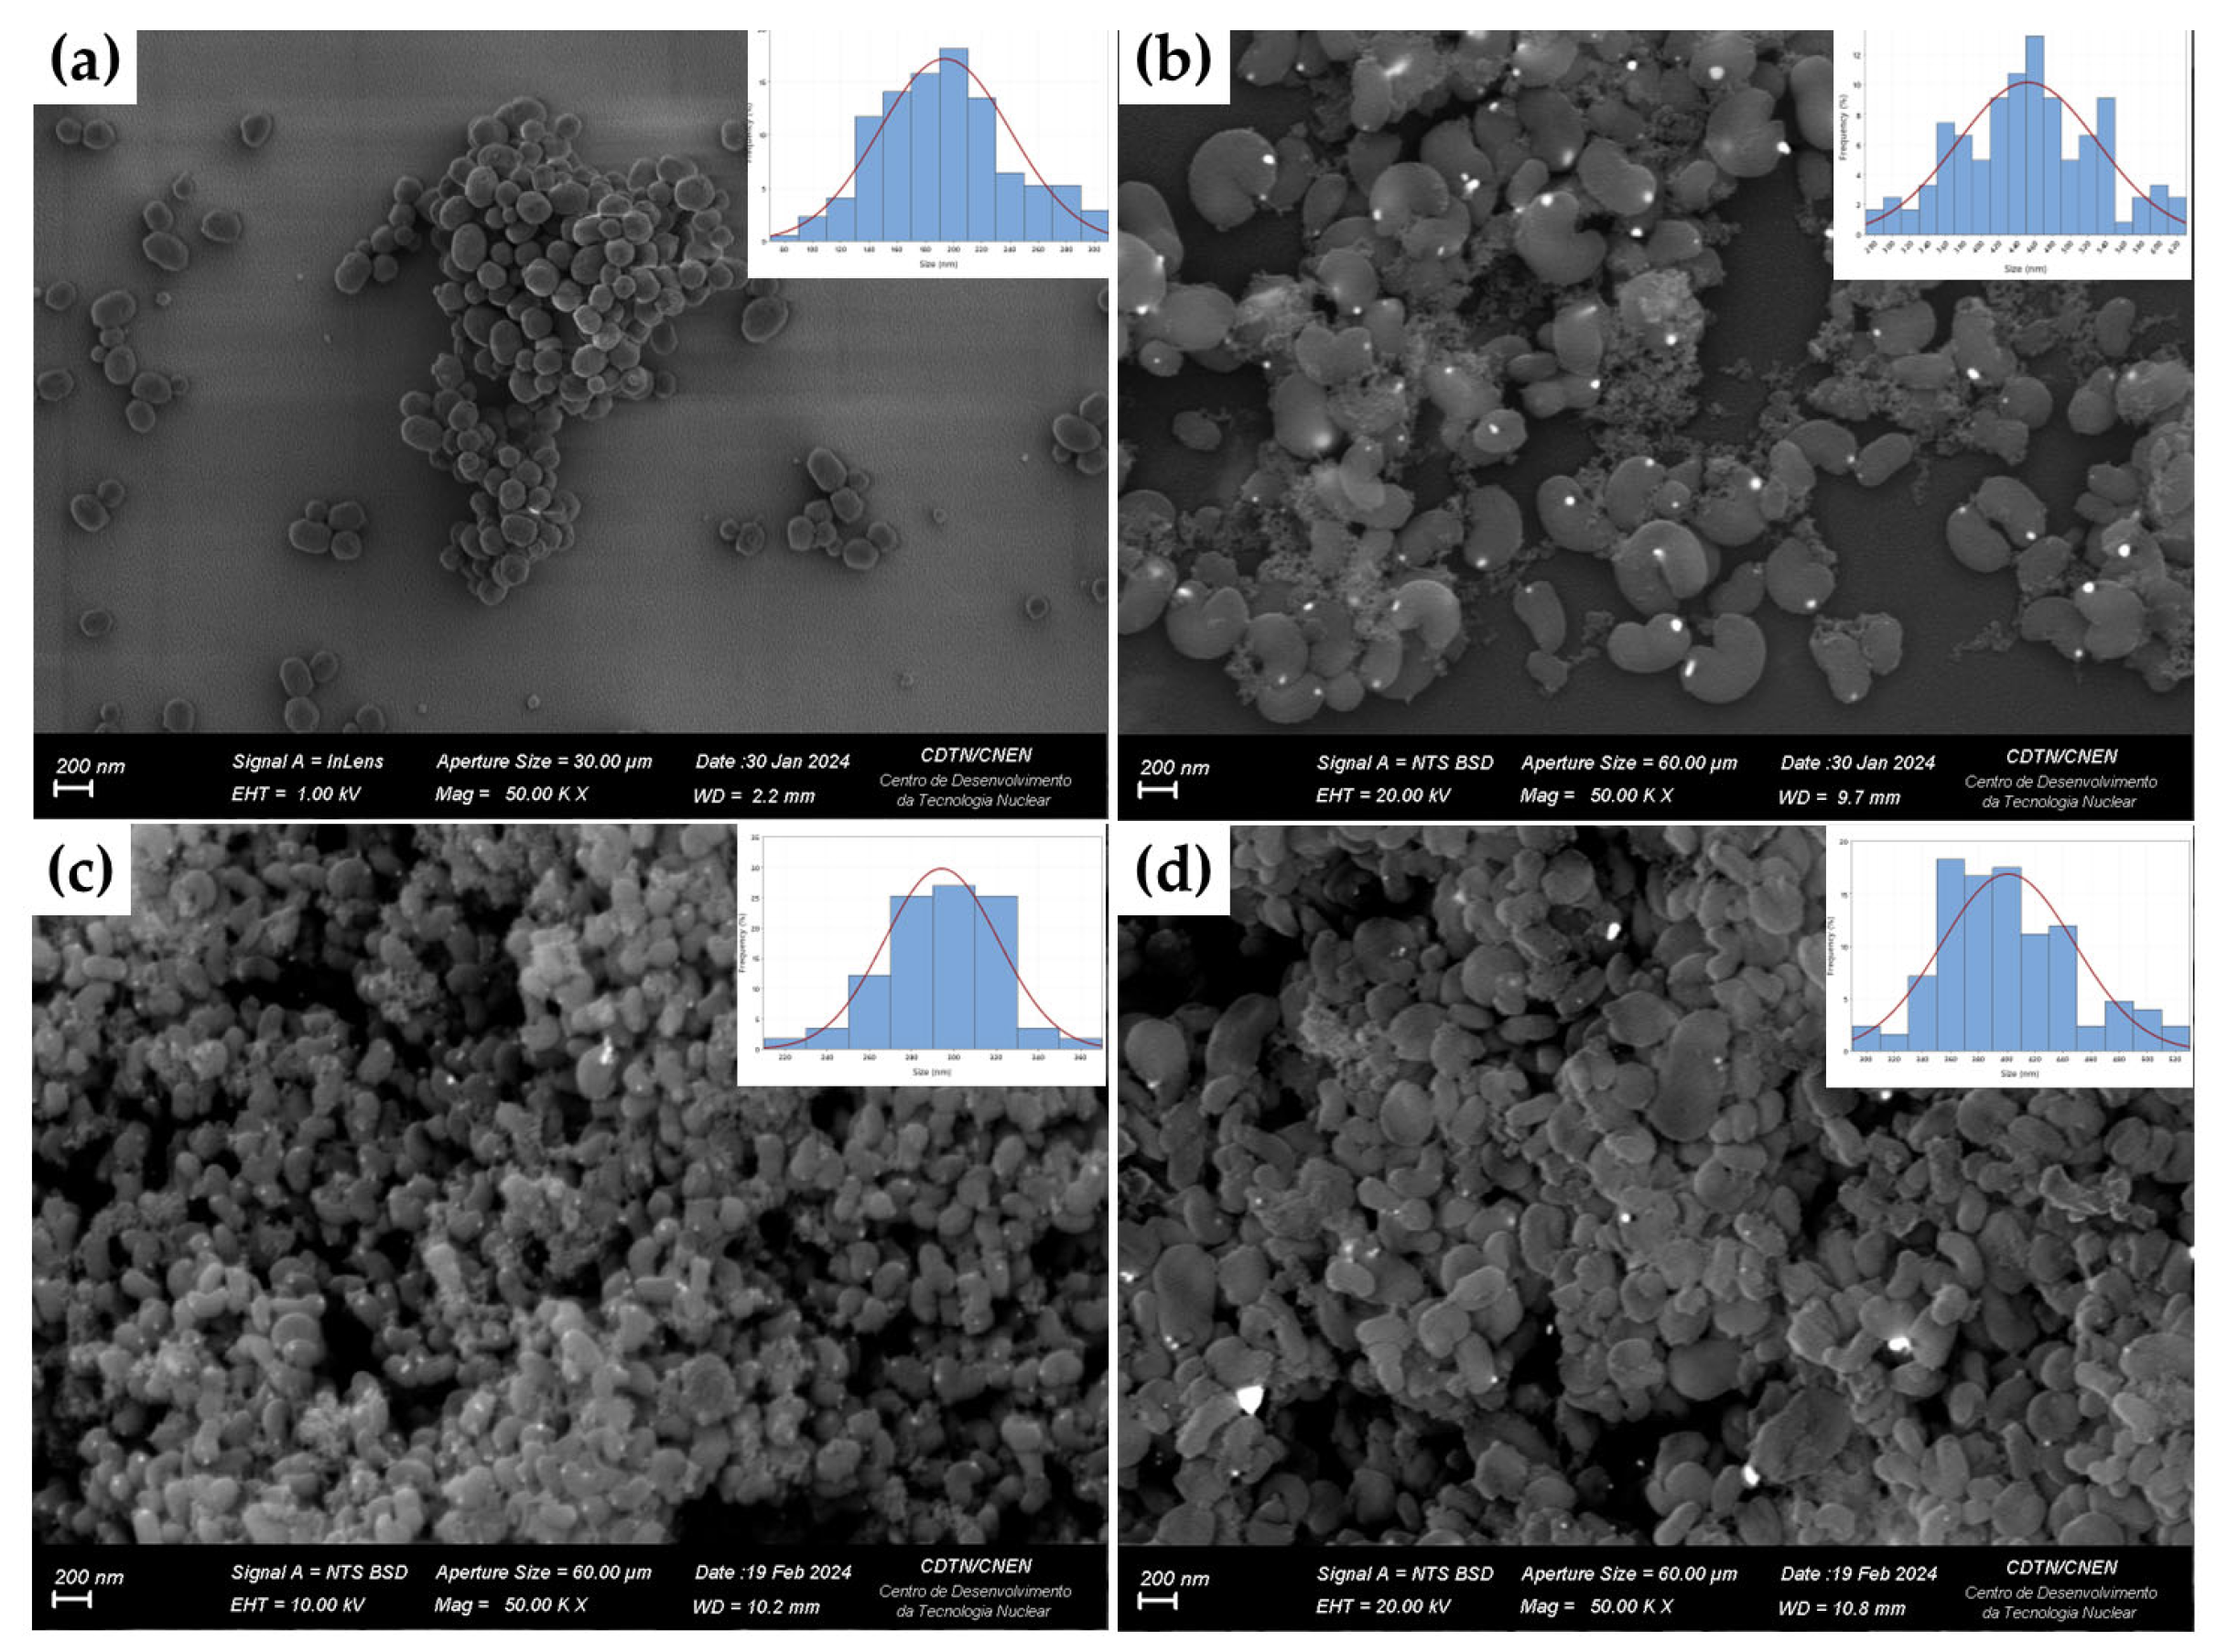
Figure 8 presents SEM images and size distribution for (a) Au530, (b) Au630, (c) Au800, and (d) UV-Vis spectra of the nanoparticles. Comparing the SEM images, it is possible to observe that each type of gold nanoparticle (sphere, rod, or bean) is consistent with the UV-Vis graph and the literature. The nanosphere presented only one adsorption band, while the nanorod and nanobean presented two absorption bands consistent with the two dimensions of the particles [28]. Figure 9 shows the SEM images of MCM-41 (a) and BSDE images of SiAu530Gd (b), SiAu630Gd (c), and SiAu800Gd (d) followed by size distribution charts. The SEM images of MCM-41 (Figure 9a) show a particle size distribution between 80 and 300 nm, with an average size of 193.7 ± 46.5 nm. In contrast, the nanocomposites presented an ellipsoidal morphology and a larger average size, ranging from 290 to 450 nm. Similar findings have been reported in other studies that incorporated gadolinium into the system [2]. The particle size and homogeneity of the nanocomposites are different compared to the MCM-41 due to Gd incorporation, possibly due to the gadolinium electropositivity that could affect the formations of pores and the surfactant micelles. In addition, it could generate a disordered hexagonal arrangement. It also could impact the formation of cage-like interparticles from primary particle aggregation, which may impact the morphology of the particles [10]. The SEM micrographs were analyzed using backscattered electrons (BSDEs) to identify variations in atomic number on the surface and just below it, as observed through contrast variations in the images. The BSDE images in Figure 9 reveal varying contrasts for all nanocomposites, suggesting the presence of both gold and gadolinium within the silica matrix. For SiAu800, a marginal point of contrast is observed, which may indicate a lower concentration of gold compared to the other composites, as evidenced by XRF analysis. Additionally, the nanomaterials present a size distribution in the nanometric range, enabling them to leverage the enhanced permeability and retention (EPR) effect. This feature makes them promising candidates for biomedical applications.
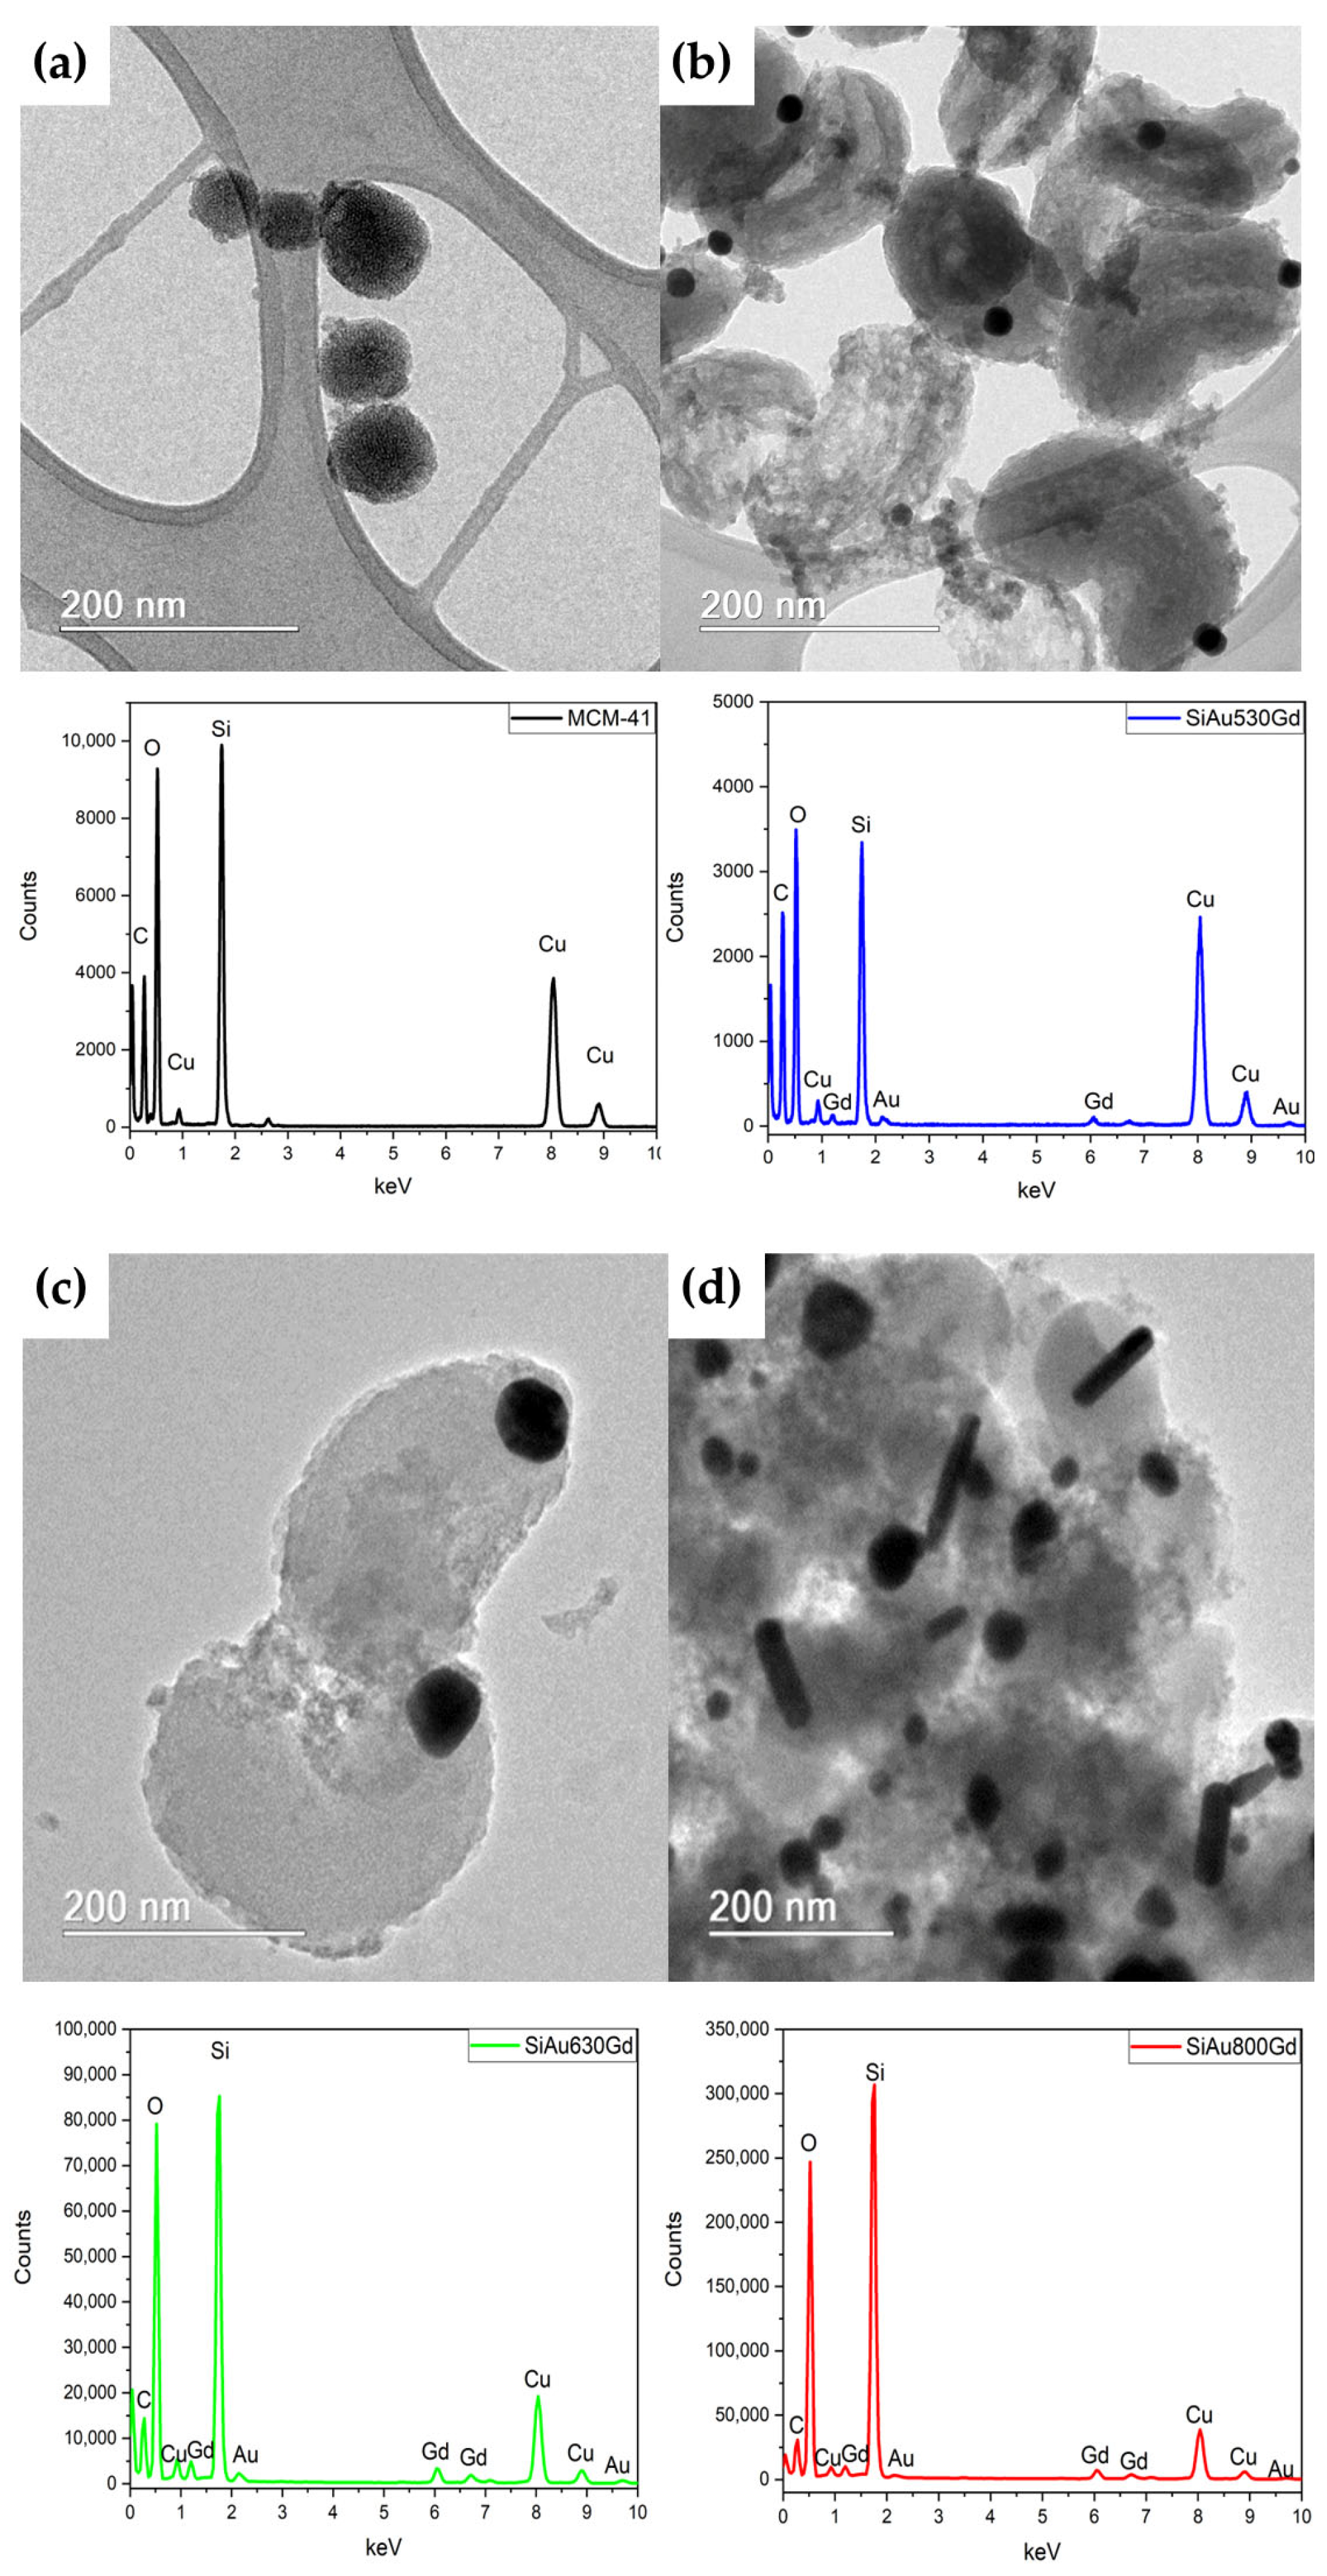
Figure 10 displays the TEM images for all the samples, along with their corresponding EDS spectra. Table 4 presents the percentage values of the elements calculated by EDS. For MCM-41, the particles exhibited a morphology similar to that observed in the SEM images. As noted in SEM/BSDE images, the nanocomposites had a different morphology from MCM-41, which may occur due to the presence of gadolinium during the synthesis of the composites [2]. Additionally, other structures resembling gold nanoparticles were observed, indicating the successful incorporation of gold into the silica network. The EDS graphs confirm this finding further, and Table 4 lists the percentage values of the elements, which are similar to those found in the XRF analysis. While the amounts in Table 3 and Table 4 slightly differ by 6 to 7% and 5 to 8% for gadolinium, the amount of gold remains consistent, suggesting a slight heterogeneity in gadolinium incorporation during nanocomposites synthesis. Furthermore, these results reinforce the successful integration of gold and gadolinium into the silica network.
Table 5 presents the hydrodynamic size and zeta potential used to analyze the behavior of the nanocomposites in aqueous solution at about pH 6–7 and room temperature. For MCM-41, a hydrodynamic size of 208 nm and zeta potential of −30 mV were observed, indicating good stability in the water solution. The hydrodynamic size is equivalent to the mean size calculated from the histogram in the SEM images. All composite materials exhibited a decrease in zeta potential, which resulted from a reduction in the number of hydroxyls (-OH) present in the pores of the mesoporous silica due to the incorporation of gold and gadolinium during the synthesis of MSN. Among the nanocomposites, the SiAu530Gd sample showed a larger hydrodynamic size (431 nm). The SiAu630Gd sample also exhibited a hydrodynamic particle size greater than that of MCM-41. This result may be related to the incorporation of gadolinium oxide, as shown in SEM images. The SiAu800Gd nanocomposite exhibited a hydrodynamic size of approximately 421 nm, consistent with the size distribution observed in the SEM images, similar to the other nanocomposites. In addition, a stability study was carried out in SBF, showing a variation in zeta potential from −10.6 mV to −3.6 mV over 168 h (7 days) for the SiAu800Gd sample (Table S1). In contrast, the MCM-41 sample remained stable at −13 mV (Table S1), demonstrating a reasonable stability of these nanomaterials. Furthermore, the stability of the chemical interactions between mesoporous silica and gadolinium was investigated using SBF suspensions over 120 h. A maximum liberation of 0.17% gadolinium incorporated in MCM-41, or 0.007 mmol/L, was observed (see Table S2). This observation demonstrated that a minimum gadolinium content in nanocomposites was released, achieving optimal chemical stability in the biological medium.
All samples were investigated by neutron activation analysis, and gamma spectra are demonstrated in Figure 11. Since 198Au is a beta emitter, the beta counter does not discriminate against beta radiation from distinct radionuclides. Then, the samples containing Gd and Au were irradiated to analyze 159Gd/198Au. The energy 363.5 keV of 159Gd (half-life 18.56 h) does not appear because 198Au is more active and has a half-life of 2.6935 d, longer than 159Gd. 198Au masks the peak due to background activity (measurement was 24 h after irradiation). The results indicate that specific activity of 2.59 MBq g−1 of 198Au (411 keV) was induced in the SiAu530Gd sample due to a higher content of gold, as shown in Table 3. The experimental results demonstrate the activation of gold in all nanocomposites, thereby facilitating the attainment of a stable theranostic system without the necessity of posterior radioisotopic marking. Consequently, this results in weakened interaction between nanocomposites and radioisotopes. Therefore, this process effectively impedes the migration of radioisotopes from the silica matrix. However, the characteristic energies of 159Gd in Figure 11 were not observed, which may be due to the high activation of 198Au. In contrast, the energies of 153Gd after 10 days of irradiation were observed because of its longer half-life (Figure 11b). Since 153Gd was detected, the radioisotope 159Gd may be generated after neutron irradiation.
In this work, the Resazurin assay was used to evaluate the toxicity of the nanocomposites on MRC-5 cells, which involves a blue dye reduced to a soluble pink fluorescent product. This process is simpler, one-step, and more sensitive, especially with a fluorescence plate reader. The results are shown in Figure 12. The nanomaterials were tested at concentrations of 10, 50, 100, or 200 μg mL−1. The results demonstrated that there were no significant differences in cell viability between the groups treated with MCM-41, SiAu530Gd, SiAu630Gd, and SiAu800Gd nanomaterials and the control group. Notably, the 200 μg mL−1 concentration did not significantly reduce cell viability (p < 0.01). These findings suggest that the tested nanomaterials do not induce significant toxicity in MRC-5 cells, aligning with previous studies using the same cell line and the primary fibroblast HDFa cell line [17,21]. Therefore, it can be concluded that MSN/NpAu/Gd nanostructures do not induce toxicity in the non-tumorigenic cellular environment of MRC-5 cells.
A cell viability study was conducted using the nanocomposites on 4T1 cells (Figure 13). The study showed no decrease in cell viability at any concentration (p < 0.001 and p < 0.01). This finding aligns with previously reported low toxicity levels (see Figure 13). These results highlight the importance of activating the nanocomposites in a nuclear reactor or incorporating antitumor agents into the system, as this could enhance their potential as novel theranostic platform in the fight against cancer.

4. Conclusions

This study successfully synthesized nanocomposites consisting of mesoporous silica nanoparticles, gold nanoparticles, and gadolinium oxides. FTIR analysis showed that all transmission band characteristics of MSNs were present, indicating that no other functional groups were formed. Additionally, N2 adsorption analysis revealed a high surface area for all nanocomposites, suggesting that multiple medicines can be incorporated into the silica matrix. VSM and EPR analyses confirmed the magnetic properties of the nanocomposites despite their reduced magnetization compared to the gadolinium oxide standard. These results validate their potential for biomedical applications in diagnostics. Moreover, activating gold nanoparticles in a nuclear reactor generated a promising radioisotope for cancer treatment. Biological assays were conducted to assess the level of cellular toxicity exhibited by MSN and their composites, indicating their potential for use in biomedical applications. The investigation of the practical biological applications of these composites is significant, and further research, including in vivo studies, could potentially facilitate the development of novel methods for cancer diagnosis and therapy.

Supplementary Materials

The following supporting information can be downloaded at https://www.mdpi.com/article/10.3390/jnt6040026/s1. Figure S1. XRD patterns of SiAu800Gd, CTAB and gold nanoparticles at room temperature; Table S1. Colloidal stability assay of the nanocomposite evaluated the zeta potential values of the samples for 168 h at 25 °C; Table S2. Chemical stability interactions between mesoporous silica and gadolinium in SBF suspensions over 120 h at 25 °C.

Author Contributions

A.F.O.: Writing—drafted the manuscript and designed the figures (equal); review and edit (equal); methodology (performed most experiments). I.B.d.C.J.M.: Methodology (supporting). M.A.B.C.M.: Methodology (performed neutron activation analysis); writing—review and editing (equal). K.K.: Methodology (performed electron paramagnetic resonance); writing—review and editing (equal). E.M.B.d.S.: Supervision; Project Administration; writing—review and editing (equal). All authors have read and agreed to the published version of the manuscript.

Funding

This research was funded by the Conselho Nacional de Desenvolvimento Científico e Tecnológico (CNPq)—grant number 304061/2022-0, and Fundação de Amparo à Pesquisa do Estado de Minas Gerais (FAPEMIG)—grant number APQ-01987-23.

Data Availability Statement

The raw data supporting the conclusions of this article will be made available by the authors on request.

Acknowledgments

This research was supported by the Brazilian agencies Conselho Nacional de Desenvolvimento Científico e Tecnológico (CNPq), Fundação de Amparo à Pesquisa do Estado de Minas Gerais (FAPEMIG), Centro Nacional de Pesquisa em Energia e Materiais (CNPEM), Centro de Desenvolvimento da Tecnologia Nuclear (CDTN), and Comissão Nacional de Energia Nuclear (CNEN).

Conflicts of Interest

The authors declare no conflicts of interest, financial or otherwise.

References

  1. Freitas, L.B.d.O.; Corgosinho, L.d.M.; Faria, J.A.Q.A.; dos Santos, V.M.; Resende, J.M.; Leal, A.S.; Gomes, D.A.; de Sousa, E.M.B. Multifunctional mesoporous silica nanoparticles for cancer-targeted, controlled drug delivery and imaging. Microporous Mesoporous Mater. 2017, 242, 271–283. [Google Scholar] [CrossRef]
  2. Oliveira, A.F.; de Sousa, E.M.B. Synthesis and characterization of MSN/Fe3O4/Gd2O3 nanocomposite as theranostic systems. J. Nanoparticle Res. 2023, 25, 115. [Google Scholar] [CrossRef]
  3. Pires, I.C.B.; Shuchi, S.I.; Tostes, B.d.V.A.; Santos, D.K.D.D.N.; Burnett, W.L.; Leonce, B.C.; Harvey, O.R.; Coffer, J.L.; Filho, I.A.d.S.; de Athayde-Filho, P.F.; et al. Theranostics Using MCM-41-Based Mesoporous Silica Nanoparticles: Integrating Magnetic Resonance Imaging and Novel Chemotherapy for Breast Cancer Treatment. Int. J. Mol. Sci. 2024, 25, 8097. [Google Scholar] [CrossRef]
  4. Trayford, C.; van Rijt, S. In situ modified mesoporous silica nanoparticles: Synthesis, properties and theranostic applications. Biomater. Sci. 2024, 12, 5450–5467. [Google Scholar] [CrossRef]
  5. Sarnaik, S.; Bhatane, D.; Pamshong, S.R.; Alexander, A. Cutting-edge advancements in anticancer drug delivery and scope for theranostics using biocompatible multifunctional mesoporous silica nanoparticles. J. Drug Deliv. Sci. Technol. 2024, 94, 105504. [Google Scholar] [CrossRef]
  6. Gupta, Y.D.; Mackeyev, Y.; Krishnan, S.; Bhandary, S. Mesoporous silica nanotechnology: Promising advances in augmenting cancer theranostics. Cancer Nanotechnol. 2024, 15, 1–44. [Google Scholar] [CrossRef]
  7. Souza, K.C.; Mohallem, N.D.S.; Sousa, E.M.B. Mesoporous silica-magnetite nanocomposite: Facile synthesis route for application in hyperthermia. J. Sol-Gel Sci. Technol. 2009, 53, 418–427. [Google Scholar] [CrossRef]
  8. de Andrade, G.F.; Soares, D.C.F.; Almeida, R.K.d.S.; Sousa, E.M.B. Mesoporous Silica SBA-16 Functionalized with Alkoxysilane Groups: Preparation, Characterization, and Release Profile Study. J. Nanomater. 2012, 2012, 816496. [Google Scholar] [CrossRef]
  9. Andrade, G.F.; Soares, D.C.F.; dos Santos, R.G.; Sousa, E.M.B. Mesoporous silica SBA-16 nanoparticles: Synthesis, physicochemical characterization, release profile, and in vitro cytocompatibility studies. Microporous Mesoporous Mater. 2013, 168, 102–110. [Google Scholar] [CrossRef]
  10. Garrido, M.D.; Puchol, N.; El Haskouri, J.; Sánchez-Royo, J.F.; Folgado, J.V.; Marrachelli, V.G.; Terol, I.P.; Ros-Lis, J.V.; Marcos, M.D.; Ruíz, R.; et al. High content and dispersion of Gd in bimodal porous silica: T2 contrast agents under ultra-high magnetic fields. Microporous Mesoporous Mater. 2022, 336, 111863. [Google Scholar] [CrossRef]
  11. Fiedler, R.; Beizinger, B.; Walther, P.; Lindén, M. Synthesis of highly monodisperse superparamagnetic iron oxide core@mesoporous silica shell particles with independently tunable size, and porosity. Microporous Mesoporous Mater. 2022, 340, 112027. [Google Scholar] [CrossRef]
  12. Manzano, M.; Aina, V.; Areán, C.O.; Balas, F.; Cauda, V.; Colilla, M.; Delgado, M.R.; Vallet-Regí, M. Studies on MCM-41 mesoporous silica for drug delivery: Effect of particle morphology and amine functionalization. Chem. Eng. J. 2008, 137, 30–37. [Google Scholar] [CrossRef]
  13. Wang, S. Ordered mesoporous materials for drug delivery. Microporous Mesoporous Mater. 2009, 117, 1–9. [Google Scholar] [CrossRef]
  14. de Sousa, A.; Maria, D.A.; de Sousa, R.G.; de Sousa, E.M.B. Synthesis and characterization of mesoporous silica/poly(N-isopropylacrylamide) functional hybrid useful for drug delivery. J. Mater. Sci. 2009, 45, 1478–1486. [Google Scholar] [CrossRef]
  15. Tang, F.; Li, L.; Chen, D. Mesoporous Silica Nanoparticles: Synthesis, Biocompatibility and Drug Delivery. Adv. Mater. 2012, 24, 1504–1534. [Google Scholar] [CrossRef]
  16. dos Apostolos, R.C.R.; Andrada, A.d.S.; Oliveira, A.F.; Neto, E.S.F.; de Sousa, E.M.B. pH-Sensitive Hybrid System Based on Eu3+/Gd3+ Co-Doped Hydroxyapatite and Mesoporous Silica Designed for Theranostic Applications. Polymers 2023, 15, 2681. [Google Scholar] [CrossRef] [PubMed]
  17. Meireles, I.B.d.C.J.; Oliveira, A.F.; Rodrigues, M.A.; de Sousa, E.M.B. A platform of gold nanoparticles coated with silica as controlled drug delivery for application in cancer treatment. J. Mater. Sci. 2024, 59, 22181–22205. [Google Scholar] [CrossRef]
  18. Ballem, M.A.; Söderlind, F.; Nordblad, P.; Käll, P.-O.; Odén, M. Growth of Gd2O3 nanoparticles inside mesoporous silica frameworks. Microporous Mesoporous Mater. 2012, 168, 221–224. [Google Scholar] [CrossRef]
  19. Li, Z.; Guo, J.; Zhang, M.; Li, G.; Hao, L. Gadolinium-Coated Mesoporous Silica Nanoparticle for Magnetic Resonance Imaging. Front. Chem. 2022, 10, 837032. [Google Scholar] [CrossRef]
  20. Croissant, J.G.; Guardado-Alvarez, T.M. Photocracking Silica: Tuning the Plasmonic Photothermal Degradation of Mesoporous Silica Encapsulating Gold Nanoparticles for Cargo Release. Inorganics 2019, 7, 72. [Google Scholar] [CrossRef]
  21. Meireles, I.B.d.C.J.; Cipreste, M.F.; Gastelois, P.L.; Macedo, W.A.d.A.; Gomes, D.A.; de Sousa, E.M.B. Synthesis and characterization of gold nanorods coated by mesoporous silica MCM-41 as a platform for bioapplication in photohyperthermia. Nanotechnology 2021, 32, 505720. [Google Scholar] [CrossRef]
  22. Li, Y.; Yan, Y.; Wang, J.; Li, L.; Tang, F. Preparation of silver nanoparticles decorated mesoporous silica nanorods with photothermal antibacterial property. Colloids Surf. A Physicochem. Eng. Asp. 2022, 648, 129242. [Google Scholar] [CrossRef]
  23. Hammond-Pereira, E.; Bryant, K.; Graham, T.R.; Yang, C.; Mergelsberg, S.; Wu, D.; Saunders, S.R. Mesoporous silica-encapsulated gold core–shell nanoparticles for active solvent-free benzyl alcohol oxidation. React. Chem. Eng. 2020, 5, 1939–1949. [Google Scholar] [CrossRef]
  24. Trayford, C.; Crosbie, D.; Rademakers, T.; van Blitterswijk, C.; Nuijts, R.; Ferrari, S.; Habibovic, P.; LaPointe, V.; Dickman, M.; van Rijt, S. Mesoporous Silica-Coated Gold Nanoparticles for Multimodal Imaging and Reactive Oxygen Species Sensing of Stem Cells. ACS Appl. Nano Mater. 2022, 5, 3237–3251. [Google Scholar] [CrossRef]
  25. Song, J.-T.; Zhang, X.-S.; Qin, M.-Y.; Zhao, Y.-D. One-pot two-step synthesis of core–shell mesoporous silica-coated gold nanoparticles. Dalton Trans. 2015, 44, 7752–7756. [Google Scholar] [CrossRef] [PubMed]
  26. Kobayashi, Y.; Nagatsuka, M.; Akino, K.; Yamauchi, N.; Nakashima, K.; Inose, T.; Nishidate, C.; Sato, K.; Gonda, K.; Kobayashi, Y. Development of methods for fabricating nanoparticles composed of magnetite, gold, and silica toward diagnostic imaging. Colloids Surf. A Physicochem. Eng. Asp. 2022, 643, 128773. [Google Scholar] [CrossRef]
  27. Yang, F.; Jin, C.; Subedi, S.; Lee, C.L.; Wang, Q.; Jiang, Y.; Li, J.; Di, Y.; Fu, D. Emerging inorganic nanomaterials for pancreatic cancer diagnosis and treatment. Cancer Treat. Rev. 2012, 38, 566–579. [Google Scholar] [CrossRef] [PubMed]
  28. Nikoobakht, B.; El-Sayed, M.A. Preparation and Growth Mechanism of Gold Nanorods (NRs) Using Seed-Mediated Growth Method. Chem. Mater. 2003, 15, 1957–1962. [Google Scholar] [CrossRef]
  29. He, Z.; Zhang, C.Y.; Lei, Y.; Song, G.; Yao, Y. Plasmonic nanomaterials: A versatile phototheranostic platform of cancers. Mater. Today 2022, 62, 168–189. [Google Scholar] [CrossRef]
  30. Bardhan, R.; Lal, S.; Joshi, A.; Halas, N.J. Theranostic Nanoshells: From Probe Design to Imaging and Treatment of Cancer. Acc. Chem. Res. 2011, 44, 936–946. [Google Scholar] [CrossRef]
  31. Scaletti, F.; Kim, C.S.; Messori, L.; Rotello, V.M. Rapid purification of gold nanorods for biomedical applications. MethodsX 2014, 1, 118–123. [Google Scholar] [CrossRef]
  32. Guo, T.; Lin, Y.; Li, Z.; Chen, S.; Huang, G.; Lin, H.; Wang, J.; Liu, G.; Yang, H.-H. Gadolinium oxysulfide-coated gold nanorods with improved stability and dual-modal magnetic resonance/photoacoustic imaging contrast enhancement for cancer theranostics. Nanoscale 2016, 9, 56–61. [Google Scholar] [CrossRef]
  33. Roduner, E. Size matters: Why nanomaterials are different. Chem. Soc. Rev. 2006, 35, 583–592. [Google Scholar] [CrossRef]
  34. Chen, G.-Y.; Jiang, G.-L.; Qian, H.; Wang, L.-J.; Yang, H.-J.; Fu, X.-L.; Wu, K.-L.; Zang, Z.; Zhao, S. Escalated hyperfractionated accelerated radiation therapy for locally advanced non-small cell lung cancer: A clinical phase II trial. Radiother. Oncol. 2004, 71, 157–162. [Google Scholar] [CrossRef] [PubMed]
  35. Zhang, R.; Kiessling, F.; Lammers, T.; Pallares, R.M. Clinical translation of gold nanoparticles. Drug Deliv. Transl. Res. 2022, 13, 378–385. [Google Scholar] [CrossRef] [PubMed]
  36. Heikkilä, T.; Santos, H.A.; Kumar, N.; Murzin, D.Y.; Salonen, J.; Laaksonen, T.; Peltonen, L.; Hirvonen, J.; Lehto, V.-P. Cytotoxicity study of ordered mesoporous silica MCM-41 and SBA-15 microparticles on Caco-2 cells. Eur. J. Pharm. Biopharm. 2010, 74, 483–494. [Google Scholar] [CrossRef] [PubMed]
  37. Kumar, P.P.P.; Mahajan, R. Gold Polymer Nanomaterials: A Promising Approach for Enhanced Biomolecular Imaging. Nanotheranostics 2024, 8, 64–89. [Google Scholar] [CrossRef]
  38. Rotz, M.W.; Culver, K.S.B.; Parigi, G.; MacRenaris, K.W.; Luchinat, C.; Odom, T.W.; Meade, T.J. High Relaxivity Gd(III)–DNA Gold Nanostars: Investigation of Shape Effects on Proton Relaxation. ACS Nano 2015, 9, 3385–3396. [Google Scholar] [CrossRef]
  39. Barbezan, A.B.; Rosero, W.A.A.; Perez, D.V.; Rigo, M.E.Z.; da Silva, G.D.; Rodrigues, A.A.; de Almeida, L.F.; da Silva, F.F.A.; Rivera, A.G.; da Silva, N.G.; et al. Radioactive gold nanoparticles coated with BSA: A promising approach for prostate cancer treatment. Nanotheranostics 2024, 8, 112–126. [Google Scholar] [CrossRef]
  40. Hu, X.; Zhang, Y.; Ding, T.; Liu, J.; Zhao, H. Multifunctional Gold Nanoparticles: A Novel Nanomaterial for Various Medical Applications and Biological Activities. Front. Bioeng. Biotechnol. 2020, 8, 990. [Google Scholar] [CrossRef]
  41. Chinchulkar, S.A.; Patra, P.; Dehariya, D.; Appidi, T.; Rengan, A.K. Gold nanoparticle–based biosensing applications and fundamentals of sensor technology: Principles and novel designs. In Fundamentals of Sensor Technology; Elsevier: Amsterdam, The Netherlands, 2023; pp. 669–723. [Google Scholar]
  42. Neves, M.; Kling, A.; Oliveira, A. Radionuclides used for therapy and suggestion for new candidates. J. Radioanal. Nucl. Chem. 2005, 266, 377–384. [Google Scholar] [CrossRef]
  43. Kadria-Vili, Y.; Neumann, O.; Zhao, Y.; Nordlander, P.; Martinez, G.V.; Bankson, J.A.; Halas, N.J. Gd 2 O 3 -mesoporous silica/gold nanoshells: A potential dual T1/T2 contrast agent for MRI-guided localized near-IR photothermal therapy. Proc. Natl. Acad. Sci. USA 2022, 119, e2123527119. [Google Scholar] [CrossRef]
  44. Li, Z.; Barnes, J.C.; Bosoy, A.; Stoddart, J.F.; Zink, J.I. Mesoporous silica nanoparticles in biomedical applications. Chem. Soc. Rev. 2012, 41, 2590–2605. [Google Scholar] [CrossRef]
  45. Xu, B.; Li, S.; Shi, R.; Liu, H. Multifunctional mesoporous silica nanoparticles for biomedical applications. Signal Transduct. Target. Ther. 2023, 8, 1–28. [Google Scholar] [CrossRef]
  46. Weinmann, H.J.; Brasch, R.C.; Press, W.R.; Wesbey, G.E. Characteristics of gadolinium-DTPA complex: A potential NMR contrast agent. Am. J. Roentgenol. 1984, 142, 619–624. [Google Scholar] [CrossRef] [PubMed]
  47. Geraldes, C.F.G.C.; Laurent, S. Classification and basic properties of contrast agents for magnetic resonance imaging. Contrast Media Mol. Imaging 2009, 4, 1–23. [Google Scholar] [CrossRef] [PubMed]
  48. Lohrke, J.; Frenzel, T.; Endrikat, J.; Alves, F.C.; Grist, T.M.; Law, M.; Lee, J.M.; Leiner, T.; Li, K.-C.; Nikolaou, K.; et al. 25 Years of Contrast-Enhanced MRI: Developments, Current Challenges and Future Perspectives. Adv. Ther. 2016, 33, 1–28. [Google Scholar] [CrossRef] [PubMed]
  49. Yan, G.-P.; Bottle, S.E.; Zhuo, R.-X.; Wei, L.; Liu, M.-L.; Li, L.-Y. Evaluation of Dendritic Gadolinium Complexes as MRI Contrast Agents. J. Bioact. Compat. Polym. 2004, 19, 453–465. [Google Scholar] [CrossRef]
  50. Cipreste, M.F.; Peres, A.M.; Cotta, A.A.; Aragón, F.H.; Antunes, A.d.M.; Leal, A.S.; Macedo, W.A.; de Sousa, E.M. Synthesis and characterization of 159 Gd-doped hydroxyapatite nanorods for bioapplications as theranostic systems. Mater. Chem. Phys. 2016, 181, 301–311. [Google Scholar] [CrossRef]
  51. Lin, Y.-S.; Hung, Y.; Su, J.-K.; Lee, R.; Chang, C.; Lin, M.-L.; Mou, C.-Y. Gadolinium(III)-Incorporated Nanosized Mesoporous Silica as Potential Magnetic Resonance Imaging Contrast Agents. J. Phys. Chem. B 2004, 108, 15608–15611. [Google Scholar] [CrossRef]
  52. Moralles, M.; Pascholati, P.; Vanin, V.; Helene, O. Decay of 159Gd. Appl. Radiat. Isot. 1995, 46, 133–138. [Google Scholar] [CrossRef]
  53. Musa, A.S.; Hadi, M.F.R.A.; Ashour, N.I.; Hashikin, N.A.A. Theranostic Investigation of Gadolinium-159 for Hepatocellular Carcinoma: Monte Carlo Simulation Study. Appl. Sci. 2022, 12, 12396. [Google Scholar] [CrossRef]
  54. Musa, A.S.; Hadi, M.F.R.A.; Hashikin, N.A.A.; Ashour, N.I.; Ying, C.K. Dosimetric assessment of Gadolinium-159 for hepatic radioembolization: Tomographic images and Monte Carlo simulation. Appl. Radiat. Isot. 2023, 199, 110916. [Google Scholar] [CrossRef] [PubMed]
  55. Bartolini, M.; Pekar, J.; Chettle, D.; McNeill, F.; Scott, A.; Sykes, J.; Prato, F.; Moran, G. An investigation of the toxicity of gadolinium based MRI contrast agents using neutron activation analysis. Magn. Reson. Imaging 2003, 21, 541–544. [Google Scholar] [CrossRef] [PubMed]
  56. Hemmer, E.; Yamano, T.; Kishimoto, H.; Venkatachalam, N.; Hyodo, H.; Soga, K. Cytotoxic aspects of gadolinium oxide nanostructures for up-conversion and NIR bioimaging. Acta Biomater. 2013, 9, 4734–4743. [Google Scholar] [CrossRef]
  57. Shao, Y.; Liu, L.; Song, S.; Cao, R.; Liu, H.; Cui, C.; Li, X.; Bie, M.; Li, L. A novel one-step synthesis of Gd3+-incorporated mesoporous SiO2 nanoparticles for use as an efficient MRI contrast agent. Contrast Media Mol. Imaging 2010, 6, 110–118. [Google Scholar] [CrossRef]
  58. Fedorenko, S.; Stepanov, A.; Zairov, R.; Kaman, O.; Nizameev, I.; Kholin, K.; Ismaev, I.; Voloshina, A.; Sapunova, A.; Kadirov, M.; et al. One-pot embedding of iron oxides and Gd(III) complexes into silica nanoparticles—Morphology and aggregation effects on MRI dual contrasting ability. Colloids Surf. A Physicochem. Eng. Asp. 2018, 559, 60–67. [Google Scholar] [CrossRef]
  59. Zhou, M.; Yang, H.; Xian, T.; Ma, J.; Zhang, H.; Feng, W.; Wei, Z.; Jiang, J. Morphology-controlled synthesis of orthorhombic LuFeO 3 particles via a hydrothermal route. J. Alloys Compd. 2014, 617, 855–862. [Google Scholar] [CrossRef]
  60. Liu, Y.; Zhang, N. Gadolinium loaded nanoparticles in theranostic magnetic resonance imaging. Biomaterials 2012, 33, 5363–5375. [Google Scholar] [CrossRef]
  61. Alric, C.; Taleb, J.; Le Duc, G.; Mandon, C.; Billotey, C.; Le Meur-Herland, A.; Brochard, T.; Vocanson, F.; Janier, M.; Perriat, P.; et al. Gadolinium Chelate Coated Gold Nanoparticles As Contrast Agents for Both X-ray Computed Tomography and Magnetic Resonance Imaging. J. Am. Chem. Soc. 2008, 130, 5908–5915. [Google Scholar] [CrossRef]
  62. Perry, H.L.; Botnar, R.M.; Wilton-Ely, J.D.E.T. Gold nanomaterials functionalised with gadolinium chelates and their application in multimodal imaging and therapy. Chem. Commun. 2020, 56, 4037–4046. [Google Scholar] [CrossRef] [PubMed]
  63. Durand, M.; Lelievre, E.; Chateau, A.; Berquand, A.; Laurent, G.; Carl, P.; Roux, S.; Chazee, L.; Bazzi, R.; Eghiaian, F.; et al. The detrimental invasiveness of glioma cells controlled by gadolinium chelate-coated gold nanoparticles. Nanoscale 2021, 13, 9236–9251. [Google Scholar] [CrossRef] [PubMed]
  64. Durand, M.; Chateau, A.; Jubréaux, J.; Devy, J.; Paquot, H.; Laurent, G.; Bazzi, R.; Roux, S.; Richet, N.; Reinhard-Ruch, A.; et al. Radiosensitization with Gadolinium Chelate-Coated Gold Nanoparticles Prevents Aggressiveness and Invasiveness in Glioblastoma. Int. J. Nanomed. 2023, 18, 243–261. [Google Scholar] [CrossRef] [PubMed]
  65. Jabariyan, S.; Zanjanchi, M.A. A simple and fast sonication procedure to remove surfactant templates from mesoporous MCM-41. Ultrason. Sonochemistry 2012, 19, 1087–1093. [Google Scholar] [CrossRef]
  66. Menezes, M.A.d.B.C.; Sabino, C.d.V.S.; Jaćimović, R. k0-Neutron Activation Analysis at CDTN, Brazil: 27 years of history, development and main achievements. J. Radioanal. Nucl. Chem. 2023, 332, 3457–3468. [Google Scholar] [CrossRef]
  67. Akpotu, S.O.; Moodley, B. Synthesis and characterization of citric acid grafted MCM-41 and its adsorption of cationic dyes. J. Environ. Chem. Eng. 2016, 4, 4503–4513. [Google Scholar] [CrossRef]
  68. Sing, K.S.W. Reporting physisorption data for gas/solid systems with special reference to the determination of surface area and porosity (Recommendations 1984). Pure Appl. Chem. 1985, 57, 603–619. [Google Scholar] [CrossRef]
  69. Beck, J.S.; Vartuli, J.C.; Roth, W.J.; Leonowicz, M.E.; Kresge, C.T.; Schmitt, K.D.; Chu, C.T.W.; Olson, D.H.; Sheppard, E.W.; McCullen, S.B.; et al. A new family of mesoporous molecular sieves prepared with liquid crystal templates. J. Am. Chem. Soc. 1992, 114, 10834–10843. [Google Scholar] [CrossRef]
  70. Souza, M.J.; Araujo, A.S.; Pedrosa, A.M.; Marinkovic, B.A.; Jardim, P.M.; Morgado, E. Textural features of highly ordered Al-MCM-41 molecular sieve studied by X-ray diffraction, nitrogen adsorption and transmission electron microscopy. Mater. Lett. 2006, 60, 2682–2685. [Google Scholar] [CrossRef]
  71. Ni, K.; Zhao, Z.; Zhang, Z.; Zhou, Z.; Yang, L.; Wang, L.; Ai, H.; Gao, J. Geometrically confined ultrasmall gadolinium oxide nanoparticles boost the T1 contrast ability. Nanoscale 2016, 8, 3768–3774. [Google Scholar] [CrossRef]
  72. Hormes, J. X-ray absorption near edge structure (XANES) measurements of ceria-based solid electrolytes. Solid State Ionics 2000, 136-137, 945–954. [Google Scholar] [CrossRef]
  73. Szyczewski, A.; Krzyminiewski, R.; Lis, S.; Pietrzak, J.; Elbanowski, M. EPR study of selected gadolinium complexes: β-diketonates and polycarboxylates. Radiat. Phys. Chem. 1995, 45, 935–938. [Google Scholar] [CrossRef]
  74. Kliava, J.; Edelman, I.S.; Potseluyko, A.M.; Petrakovskaja, E.A.; Berger, R.; Bruckental, I.; Yeshurun, Y.; Malakhovskii, A.V.; Zarubina, T.V. Magnetic and optical properties and electron paramagnetic resonance of gadolinium-containing oxide glasses. J. Phys. Condens. Matter 2003, 15, 6671–6681. [Google Scholar] [CrossRef]
  75. Trudel, S. Unexpected magnetism in gold nanostructures: Making gold even more attractive. Gold Bull. 2011, 44, 3–13. [Google Scholar] [CrossRef]
  76. Hori, H.; Teranishi, T.; Nakae, Y.; Seino, Y.; Miyake, M.; Yamada, S. Anomalous magnetic polarization effect of Pd and Au nano-particles. Phys. Lett. A 1999, 263, 406–410. [Google Scholar] [CrossRef]
Figure 1. FTIR spectra of MCM-41, SiAu530Gd, SiAu630Gd, and SiAu800Gd in 4000–200 cm−1 region (a). TGA curves of MCM-41, SiAu530Gd, SiAu630Gd, and SiAu800Gd samples, with the weight-loss table is in the insert (b).
Jnt 06 00026 g001
Figure 2. Nitrogen adsorption isotherms pattern of MCM-41, SiAu530Gd, SiAu630Gd, and SiAu800Gd, and their pore size distribution in the insert.
Jnt 06 00026 g002
Figure 3. XRD patterns for SiAu530Gd, SiAu630Gd, and SiAu800Gd at room temperature (a). Small-angle X-ray diffraction of the MCM-41, SiAu530Gd, SiAu630Gd, and SiAu800Gd samples, and a schematic representation of the mesoporous array of the MCM-41 after the calcination (b). Where wt = silica wall thickness, d(100) = interplanar distance in the (100) plane and a0 = mesoporous cell parameter [70].
Jnt 06 00026 g003
Figure 4. XRF micrographs of the SiAu530Gd (a), SiAu630Gd (b), and SiAu800Gd (c) at an irradiation energy of 12,000 keV. Gadolinium is represented in green color and gold in red color.
Jnt 06 00026 g004
Figure 5. XANES spectra of (a) SiAu530Gd, (b) SiAu630Gd, and (c) SiAu800Gd.
Jnt 06 00026 g005
Figure 6. (a) VSM hysteresis loops for MCM-41, SiAu530Gd, SiAu630Gd, and SiAu800Gd samples showing that gadolinium ions can alter the magnetic behavior of pure silica to paramagnetic, and (b) adjusted by the percentage of gadolinium oxide mass on nanocomposites.
Jnt 06 00026 g006
Figure 7. Experimental Electron Paramagnetic Resonance spectra at 300 K of the samples MCM-41, SiAu530Gd, SiAu630Gd, and SiAu800Gd, illustrating the magnetic properties of the nanoconjugates due to gadolinium ions.
Jnt 06 00026 g007
Figure 8. SEM images with size distribution charts of gold nanoparticles Au530 (a), Au630 (b), Au800 (c), and their respective UV-Vis spectra (d).
Jnt 06 00026 g008
Figure 9. SEM images of MCM-41 (a) and BSDE images of SiAu530Gd (b), SiAu630Gd (c), and SiAu800Gd (d) followed by size distribution charts.
Jnt 06 00026 g009
Figure 10. TEM images and size distribution of MCM-41 (a), SiAu530Gd (b), SiAu630Gd (c), and SiAu800Gd (d) and its elemental graphs obtained by EDS.
Jnt 06 00026 g010
Figure 11. Wide-range gamma spectrum obtained after neutron activation for all activated samples (a) and an inset of the photopeak of 153Gd (b).
Jnt 06 00026 g011
Figure 12. Cell viability assay of MRC-5 cells treated with MCM-41, SiAu530Gd, SiAu630Gd, and SiAu800Gd. Cells were treated with nanomaterials at concentrations of 10, 50, 100, or 200 μg mL−1. Resazurin assay was used to evaluate the cell viability. The representative graphs show the normalized data as a percentage of the control group (CT) from nanomaterial-treated cells. Cells treated with Triton-X 100 were used as a positive control for cell viability. ns = non-significant. * p < 0.05, ** p < 0.01, *** p < 0.001, **** p < 0.0001.
Jnt 06 00026 g012
Figure 13. Cell viability assay of 4T1 cells treated with MCM-41, SiAu530Gd, SiAu630Gd, and SiAu800Gd. Cells were treated with nanomaterials at concentrations of 10, 50, 100, or 200 μg mL−1. The resazurin assay was used to evaluate the cell viability. The representative graphs show the normalized data as a percentage of the control group (CT) from nanomaterial-treated cells. Cells treated with Triton-X 100 were used as a positive control for cell viability. ns = non-significant. * p < 0.05, ** p < 0.01, *** p < 0.001, **** p < 0.0001.
Jnt 06 00026 g013
Table 1. Nitrogen adsorption–desorption parameters of MCM-41 and nanocomposites.
Specific Area
(m 2·g−1)
Pore Diameter
(nm)
Pore Volume
(cm3·nm−1·g−1)
MCM-411162.72.60.8
Si530Gd1006.63.50.9
Si630Gd1039.93.50.9
Si800Gd992.84.11.0
The equipment presents an error of 2% for all measurements.
Table 2. Structural parameters of MCM-41 and nanocomposites obtained by SAXS measurements.
2Ɵd(100) (nm)a0 (nm)wt
MCM-412.47°3.64.11.5
SiAu530Gd2.39°3.74.30.8
SiAu630Gd2.39°3.74.30.8
SiAu800Gd2.33°3.84.40.3
Table 3. The mass percentage of the elements obtained through experimental XRF measurements at room temperature and the expected concentrations were calculated based on the contents used in the synthesis for all the nanocomposites.
Si
(% Mass)
O
(% Mass)
Au
(% Mass)
Gd
(% Mass)
MCM-4146.0 ± 1.253.9 ± 1.2--
SiAu530Gd33.0 ± 0.157.5 ± 0.12.9 ± 0.36.6 ± 0.4
SiAu630Gd32.8 ± 0.158.5 ± 0.11.7 ± 0.57.0 ± 0.1
SAu800Gd29.2 ± 0.263.2± 0.11.6 ± 0.26.1 ± 0.3
Theoretical percentile46.9/
40.5
53.1/
47.5
2.99.2
Table 4. The mass percentage of the elements obtained by EDS measurements and the expected concentrations were calculated based on the contents used in the synthesis for all the nanocomposites.
Si
(% Mass)
O
(% Mass)
Au
(% Mass)
Gd
(% Mass)
MCM-4143.4 ± 0.255.7 ± 0.2--
SiAu530Gd37.8 ± 0.253.9 ± 0.23.1 ± 0.15.2 ± 0.1
SiAu630Gd39.8 ± 0.249.2 ± 0.22.2 ± 0.18.3 ± 0.1
SAu800Gd45.1 ± 0.148.4 ± 0.10.8 ± 0.15.3 ± 0.1
Theoretical percentile46.9/
40.5
53.1/
47.5
2.99.2
Table 5. Hydrodynamic size, polydispersity, and Zeta (ζ) potential of the nanomaterials obtained by DLS.
Size (nm)PDIZeta (ζ) Potential (mV)
MCM-41208.1 ± 3.80.2−30.8 ± 1.4
SiAu530Gd431.2 ± 1.40.2−9.5 ± 0.3
SiAu630Gd285.9 ± 9.20.3−10.7 ± 0.3
SiAu800Gd421.5 ± 15.40.4−9.0 ± 0.2
Disclaimer/Publisher’s Note: The statements, opinions and data contained in all publications are solely those of the individual author(s) and contributor(s) and not of MDPI and/or the editor(s). MDPI and/or the editor(s) disclaim responsibility for any injury to people or property resulting from any ideas, methods, instructions or products referred to in the content.