1. Introduction
The Internet of Things (IoT) has become the cornerstone of modern communication, connecting billions of devices across the globe and enabling pervasive smart environments [
1]. As IoT networks expand, significant attention has been focused on wireless technologies that can support long-range, low-power communication for massive deployments [
2,
3]. In particular, Low-Power Wide-Area Networks (LPWANs) have emerged to meet this need, offering connectivity to devices over kilometers while consuming minimal energy [
4]. Among the LPWAN protocols, LoRaWAN (Long-Range Wide-Area Network) stands out for operating in unlicensed spectra with the ability to cover extensive areas (on the order of several kilometers) and sustain multi-year node battery life [
5,
6]. LoRaWAN’s favorable trade-off of range vs. data rate has made it a leading choice alongside Sigfox and NB-IoT for large-scale IoT deployments [
3]. Its long-range coverage, low energy consumption, and flexibility have positioned it as a viable option for university environments, where successful applications in environmental sensing, asset tracking, and security have already been documented [
7,
8].
Ensuring that such technological advances benefit all users, including those with disabilities, is an urgent priority in higher education. Inclusive education mandates that students with disabilities have equitable access to campus resources and real-time support, yet traditional approaches rely heavily on assistive tools that operate in isolation. Research has shown that assistive technologies can markedly improve the academic engagement, performance, and independence of students with disabilities [
9,
10]. For example, accessible software and devices (screen readers, braille displays, etc.) help level the educational playing field, and their use correlates with greater self-efficacy and participation [
9,
10]. However, most current assistive solutions are personal and localized; the broader campus environment often lacks the embedded infrastructure to monitor and assist these students in real time. Studies continue to report gaps in institutional support and technology adoption for disability inclusion at universities [
11,
12]. Students with disabilities can remain at a disadvantage—in one survey, they reported having more passive roles in laboratory classes compared to their peers, due in part to insufficient accommodations [
11,
12]. Moreover, safety and mobility challenges on large campuses (e.g., reaching class on time or getting help in emergencies) are exacerbated for those with impairments when no real-time monitoring or alerting system is in place. It is within this context that IoT-based assistive systems present an opportunity to bridge the accessibility gap in higher education. Early concepts in other domains have hinted at the potential: for instance, general IoT frameworks have been proposed to support the autonomy of people with various disabilities through remote monitoring, environmental control, and smart wearable devices [
13]. Likewise, specific systems have been developed that allow people with severe motor disabilities to control household appliances and electronic devices through adapted IoT-based interfaces [
14]. Such examples motivate the design of a campus-wide assistive monitoring network that can enhance the safety and inclusion of students with special needs in real time.
Several recent studies have explored IoT deployments on university campuses, laying important groundwork for this study. Kaur et al. implemented a campus-wide LoRa network to evaluate indoor IoT connectivity and found that with optimal radio parameters (spreading factor, coding rate), reliable coverage can be achieved even in non-line-of-sight buildings [
8]. Their extensive measurements at a university campus demonstrated 100% packet delivery under certain configurations and highlighted LoRa’s suitability for real-time monitoring in dense educational environments. In a related effort, Liao et al. developed a campus safety system in which each student is equipped with a Bluetooth Low Energy beacon that relays their location via LoRaWAN to a central server [
7]. This hybrid IoT network achieved response times of approximately one second for locating individuals in concealed or restricted areas, significantly bolstering on-campus security and incident response [
7]. Inspired by these advances, researchers have begun exploring long-range communication technologies, such as LoRa, for academic administration tasks. Noprianto et al. proposed an attendance monitoring solution for large campuses using LoRa modules and smart cards, which showed that long-range wireless links can overcome the physical limitations of LAN-based systems for tracking attendance in dispersed buildings [
15]. Although these studies did not use LoRaWAN or mobile nodes, they illustrate the feasibility of using LPWAN technologies in campus applications. To the best of our knowledge, no solutions that implement an operational LoRaWAN network for real-time monitoring of students with disabilities in university environments have been reported. Therefore, we present this work as a new LoRaWAN application, distinguished by its focus on mobile users, the requirement for reliable real-time data delivery, and the critical role of assisting students with disabilities in their daily activities on campus.
Outside the campus IoT, parallel research in assistive technologies further underlines the possibilities of an integrated approach. In [
16], a systematic review of portable fall detectors based on low-power transmission systems is proposed, with an emphasis on technologies such as LoRaWAN, Sigfox, and NB-IoT. Unlike traditional approaches that rely on short-range networks (Bluetooth, Wi-Fi) or smartphones as intermediaries, this study highlights the potential of LPWANs to enable direct, long-range, low-power communication, ideal for contexts where the aim is to preserve the autonomy of users with reduced mobility or disabilities. Beyond health monitoring, IoT has been integrated with assistive devices in daily life—P. Kumari et al. designed a LoRa/Bluetooth-enabled smart alarm clock to help hearing-impaired users wake up via vibration alerts, extending the IoT benefits to improve the quality-of-life of people with disabilities [
17,
18]. In the realm of assistive robotics, IoT connectivity enables remote operation and control to aid human operators: recent work by Nicolas et al. introduced an IoT-driven robotic arm stabilization system to suppress hand tremors, aimed at assisting users in performing delicate tasks with greater steadiness [
19]. Other studies have presented teleoperated robotic systems for hazardous environments (e.g., an explosive ordnance disposal robot) that rely on custom user interfaces and reliable wireless links to keep operators (and bystanders) safe at a distance [
20,
21]. These diverse advances in IoT, from smart wearables to connected service robots, highlight a broad toolset of technologies that can be used to support people with special needs. They also make clear that the integration of IoT into assistive applications can dramatically extend the reach of support services–whether by monitoring health conditions around the clock or by extending one’s abilities through connected devices.
Motivated by the shortcomings identified in previous campus implementations and based on research on assistive IoT, this study evaluates the performance of a LoRaWAN network for monitoring tasks designed to assist people with disabilities on a university campus. Each student with a disability receives a portable device with LoRa technology that automatically transmits data to LoRaWAN gateways strategically installed throughout the campus. The system includes IoT devices based on Microchip development kits and a LoRaWAN gateway connected to The Things Network (TTN) as a LoRaWAN server. Although full integration of the application layer and user interface is not yet fully implemented, communication performance is evaluated using metrics such as signal strength (RSSI), signal-to-noise ratio (SNR), and packet reception rate (PRR) in different campus scenarios. This study demonstrates a novel inclusive LoRaWAN IoT application for real-time attendance tracking but also provides empirical guidelines for implementing LPWAN attendance solutions in university environments. By bridging the current technology gap in inclusive education, our LoRaWAN-based monitoring system seeks to improve the safety, independence, and participation of students with disabilities, bringing us closer to a truly smart and accessible campus for all.
2. Literature Review
2.1. Other Technologies
The choice of LoRaWAN was based on its performance compared to other alternatives. An LPWAN was chosen due to the need to operate with batteries and require a long range, common characteristics in technologies such as Sigfox, NB-IoT, and LoRaWAN.
Table 1 presents a comparison of the technical characteristics of different LPWANs and Wi-Fi wireless technologies on the UNSA university campus. Wi-Fi is included as a point of comparison not because it belongs to the LPWAN category of technologies but because it is a wireless technology available on the university campus at the time of the study. For a more comprehensive comparative analysis of LPWAN technologies, an additional overview can be found in [
22].
LoRaWAN allows private deployments and full bidirectional communications, providing greater flexibility and control than SigFox, whose operation depends exclusively on a provider and is optimized for uplink communications with limited downlink capacity. In relation to NB-IoT, although it benefits from the existing cellular infrastructure and offers good urban coverage, its use implies subscription to operators and depends on the availability of the mobile network. On the other hand, Wi-Fi use was ruled out due to high energy consumption, short range, and possible network congestion on campus. In terms of energy efficiency, autonomy, interference tolerance, and low implementation cost, LoRaWAN outperformed the evaluated technologies, this makes it suitable for urban university campus scenarios, where sensors are required for mobility, low maintenance, and economical deployment.
2.2. LoRa and LoRaWAN
According to Milarokostas et al. [
23], LoRa technology refers to the physical layer (PHY) of the protocol stack based on the Chirp Spread Spectrum (CSS) modulation developed by Semtech. This layer defines the transmission parameters, such as the spread factor (SF), coding rate (CR), and time of air (ToA), which determine the link’s basic behavior. In this layer, channel quality is commonly evaluated using metrics such as the received signal strength indicator (RSSI) and signal-to-noise ratio (SNR), which characterize propagation conditions and interference levels.
While LoRa focuses on the physical transmission of data, LoRaWAN defines the medium access control (MAC) layer, including SF management, security key management, message fragmentation, and device operation classes (A, B, and C), all of which directly influence both channel quality and performance indicators.
According to Alipio and Bures [
24], LoRa and LoRaWAN play crucial roles in connecting and managing several devices. IoT devices such as sensors, actuators, and other smart devices use LoRa technology to transmit data to LoRaWAN gateways. These gateways act as access points for receiving signals from the devices and forwarding data to the central network server. The long-range capability of LoRa allows IoT devices to communicate over large distances, eliminating the need for frequent deployment of communication infrastructures, especially in rural or remote areas.
2.3. LoRa Frame Format
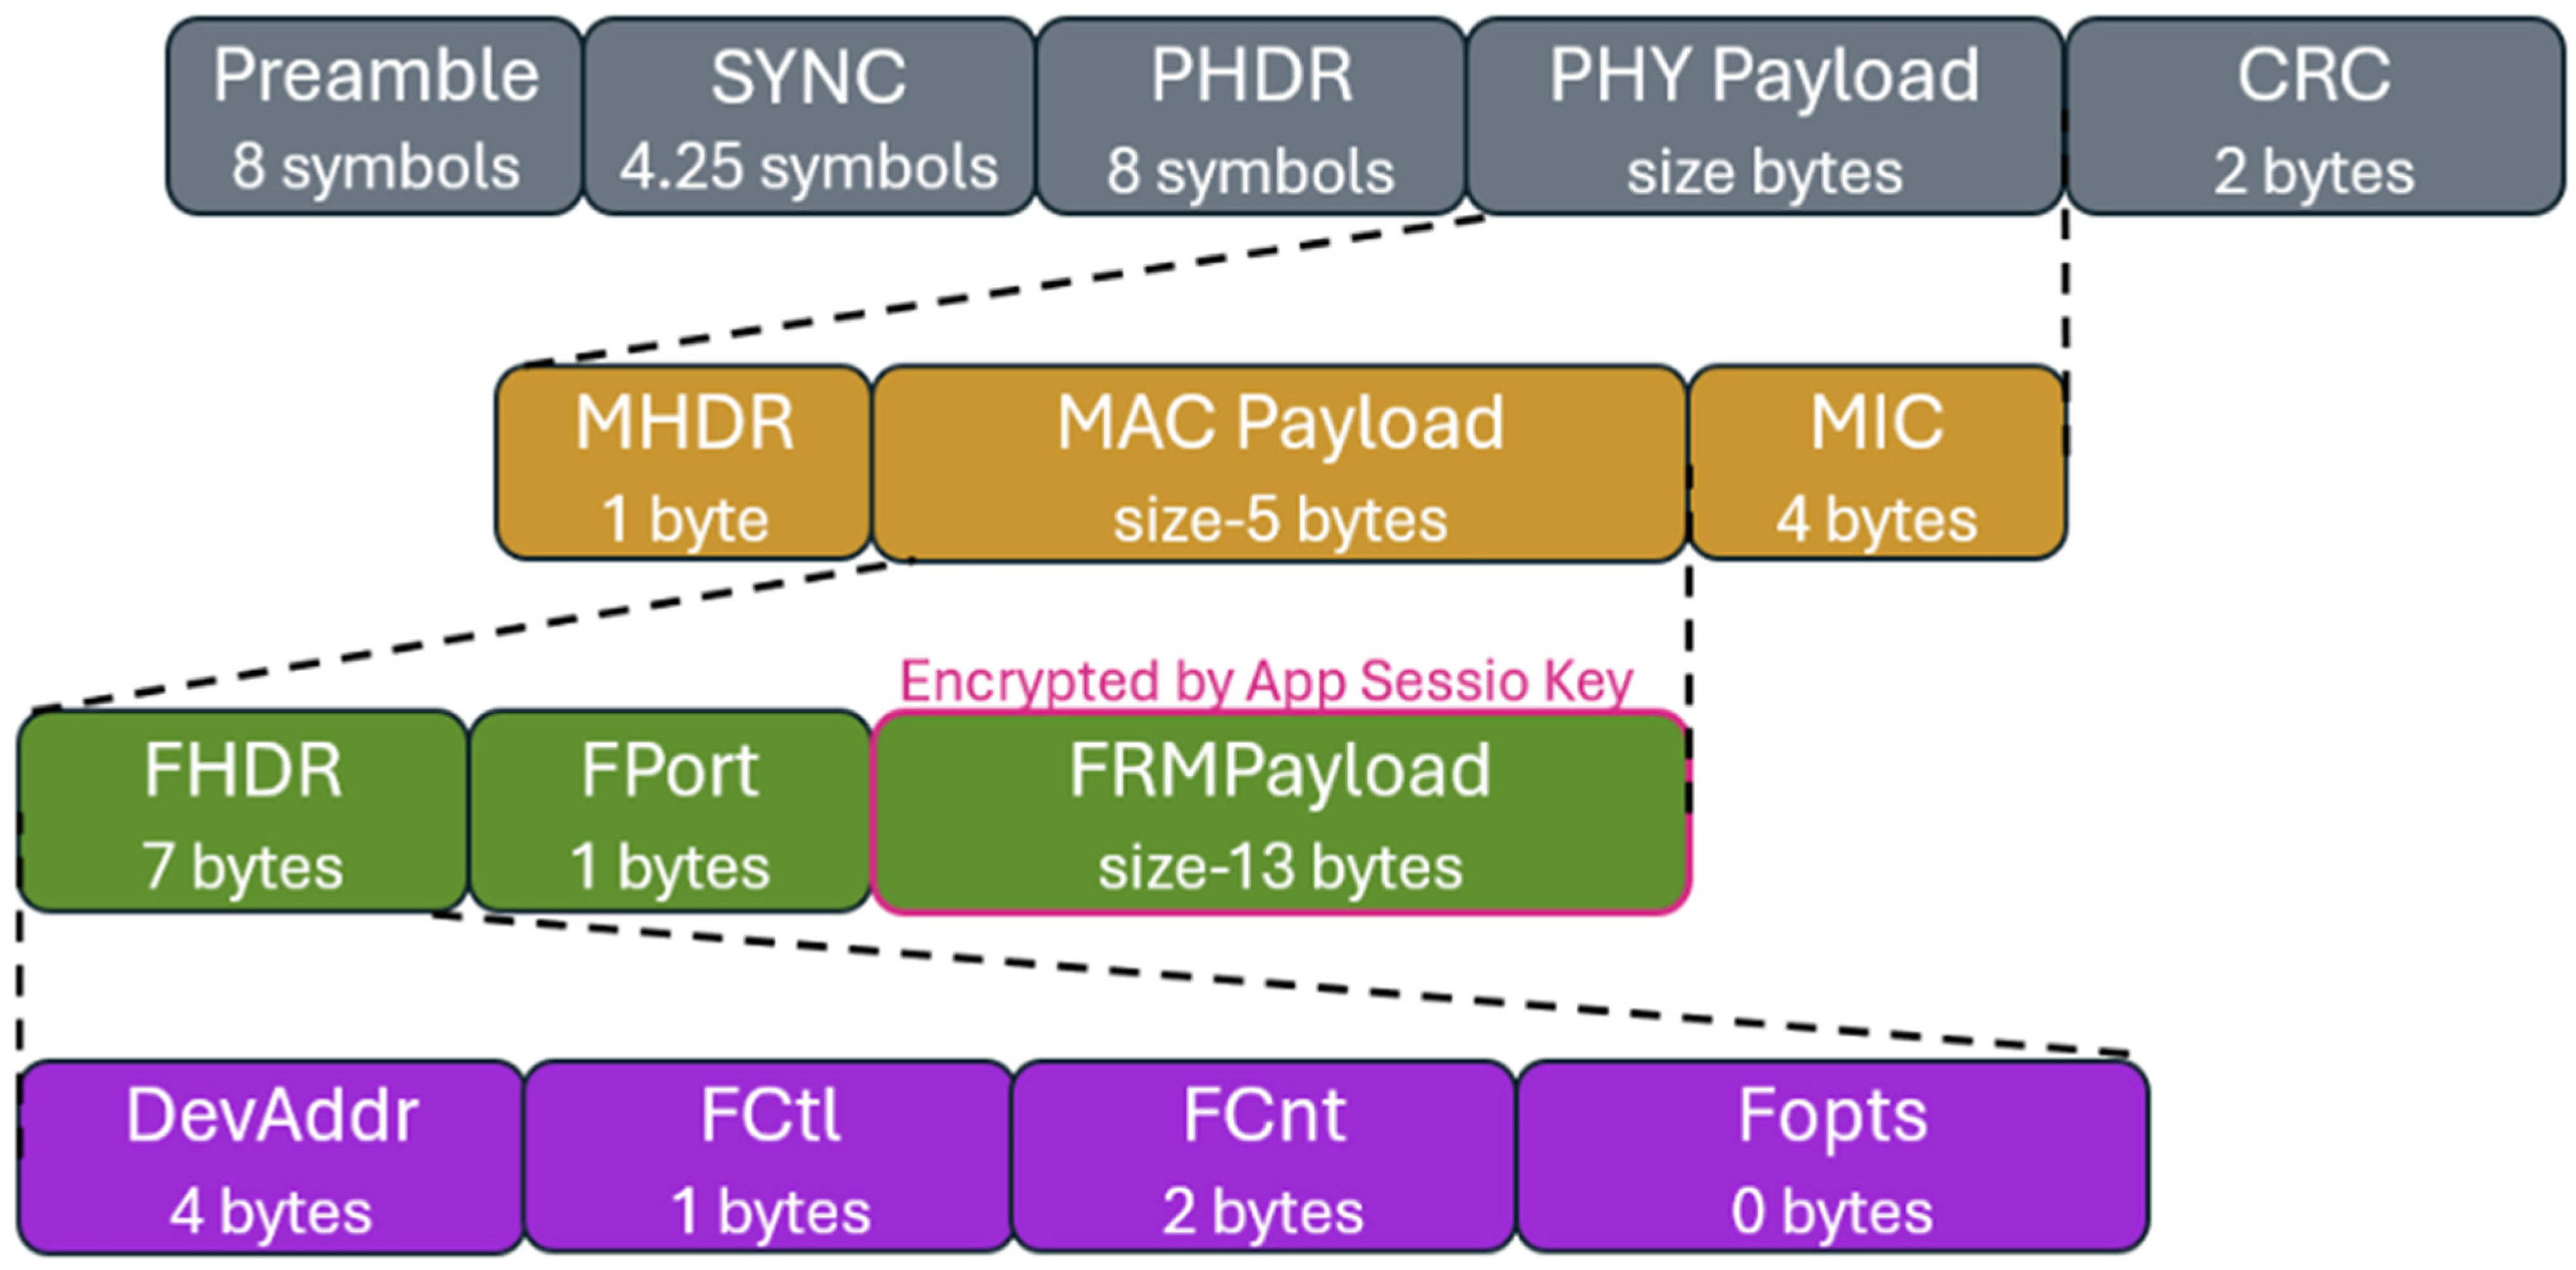
According to the LoRa Alliance specification [
25], a LoRa physical layer data frame contains a preamble with 8 symbols, which is a sequence used to synchronize the receiver with the transmitter, a SYNC with 4.25 symbols and a PHDR with 8 symbols that contain configuration information to ensure header integrity, a PHY Payload that contains the main data (payload), and a Payload CRC with 2 bytes that verifies the integrity of the data transmitted in the payload.
Figure 1 shows the complete data frame for typical LoRa transmission.
Figure 1 shows that the PHY payload section corresponds to the data sent by the network when it is used in a LoRaWAN context. This section contains a subframe with a MAC header subsection that specifies the message type and LoRaWAN version, a MAC payload subsection that contains user information, and a MIC (Message Integrity Code) subsection that ensures the authenticity and integrity of the data using a network key.
The Payload Subsection MAC Payload in
Figure 1 contains a Frame Header subsection, which is analyzed below, a Frame Port that determines whether the data in the payload are user data or MAC commands, and a Frame Payload with the data to be sent, which is encrypted with the application session key (AppSKey).
Finally, the Frame Header (FHDR) section is presented with the following fields: a Device Address that identifies the device on the network, a Frame Control that contains information such as uplink/downlink bits, a Frame Counter to prevent frame repetition, and a Frame Options field that contains additional MAC commands.
Table 2 shows the bytes required for each frame.
2.4. Packet Interval in LoRaWAN
This represents the minimum time elapsed between the transmission of one packet and the next packet. In LoRaWAN networks, there are limitations with respect to the minimum interval between packet sending. These limitations are related to:
2.4.1. Duty Cycle
Percentage of time that a device can transmit. In certain regions, this percentage is regulated to prevent devices saturating the network. The European Union (EU868) limits this value to 1%, whereas in regions such as South America (US915) these regulations are more flexible, allowing them to work at a higher Duty cycle. In this study, we work with the LoRaWAN US915 band in Peru, where there is no explicit duty cycle restriction. Therefore, the transmission intervals were defined to maintain reasonable channel usage while respecting the airtime based on the packet size and spreading factor.
2.4.2. Server Usage Policies
These limits were established by the network operator to ensure that all users share resources fairly. The Things Network (TTN) was used as the LoRaWAN network server. TTN enforces a fair use policy that restricts airtime (ToA) to a maximum of 30 s per device per day, which limits the amount of data that each node can transmit in 24 h.
2.4.3. Time on Air (ToA)
The LoRa physical layer parameters, such as the dispersion factor, bandwidth, coding rate, and message size, determine the time a data packet occupies the LoRa transmission channel. A longer ToA reduces the number of transmissions allowed under duty cycle restrictions and increases the probability of packet collisions, especially in dense deployments, as demonstrated by Abdelfadeel et al. in their study about LoRaWAN scalability and scheduling [
26].
3. Materials
3.1. LoRaWAN Hardware Used
The LoRaWAN network was implemented using the Microchip DV164140-2 kit, which contains a gateway and two RN2903 nodes. The device operates in the 915 MHz band with a power of 2–20 dBm. The gateway and nodes have 3 dBi antennas and an integrated display, which was not used in this phase of the project.
An omnidirectional antenna included in the Microchip DV164140-2 kit was used. It is a rubber-coated monopole antenna in the 915 MHz ISM band connected via a single-mode analog (SMA) connector. This antenna has linear polarization, an estimated gain of 2–3 dBi, and a compact structure, making it suitable for laboratory testing and field prototypes.
This Microchip LoRaWAN kit is ideal for the prototyping stage for initial validation and provides easy access to programming, debugging, and testing LoRaWAN communication in a single environment, allowing for the acceleration of development without compatibility problems between components. On the other hand, although this kit is not entirely suitable for the final product, our goal with this board is to prototype, validate the network, and ensure that the communication parameters are well defined.
3.2. Base Station
The gateway is based on the Microchip LoRa Gateway development platform (Microchip Technology Inc., Chandler, AZ, USA), which consists of a radio board equipped with two Semtech SX1257 RF transceivers (Semtech Corporation, Camarillo, CA, USA) and a centralized baseband processor (SX1301), capable of simultaneously receiving multiple LoRa uplink packets across different channels and spreading factors. Communication with the server is conducted using the TCP/IP protocol. The system operates in the 915 MHz ISM band and is compatible with LoRa modules of the RN series. For this experiment, the gateway was connected to a 3 dBi gain antenna and installed on the roof of a four-story building (approximately 20 m high) at the School of Telecommunications Engineering on campus. The configuration enabled 8 uplink channels, and the gateway was connected to The Things Network (TTN) as a LoRaWAN server.
3.3. LoRaWAN End Devices
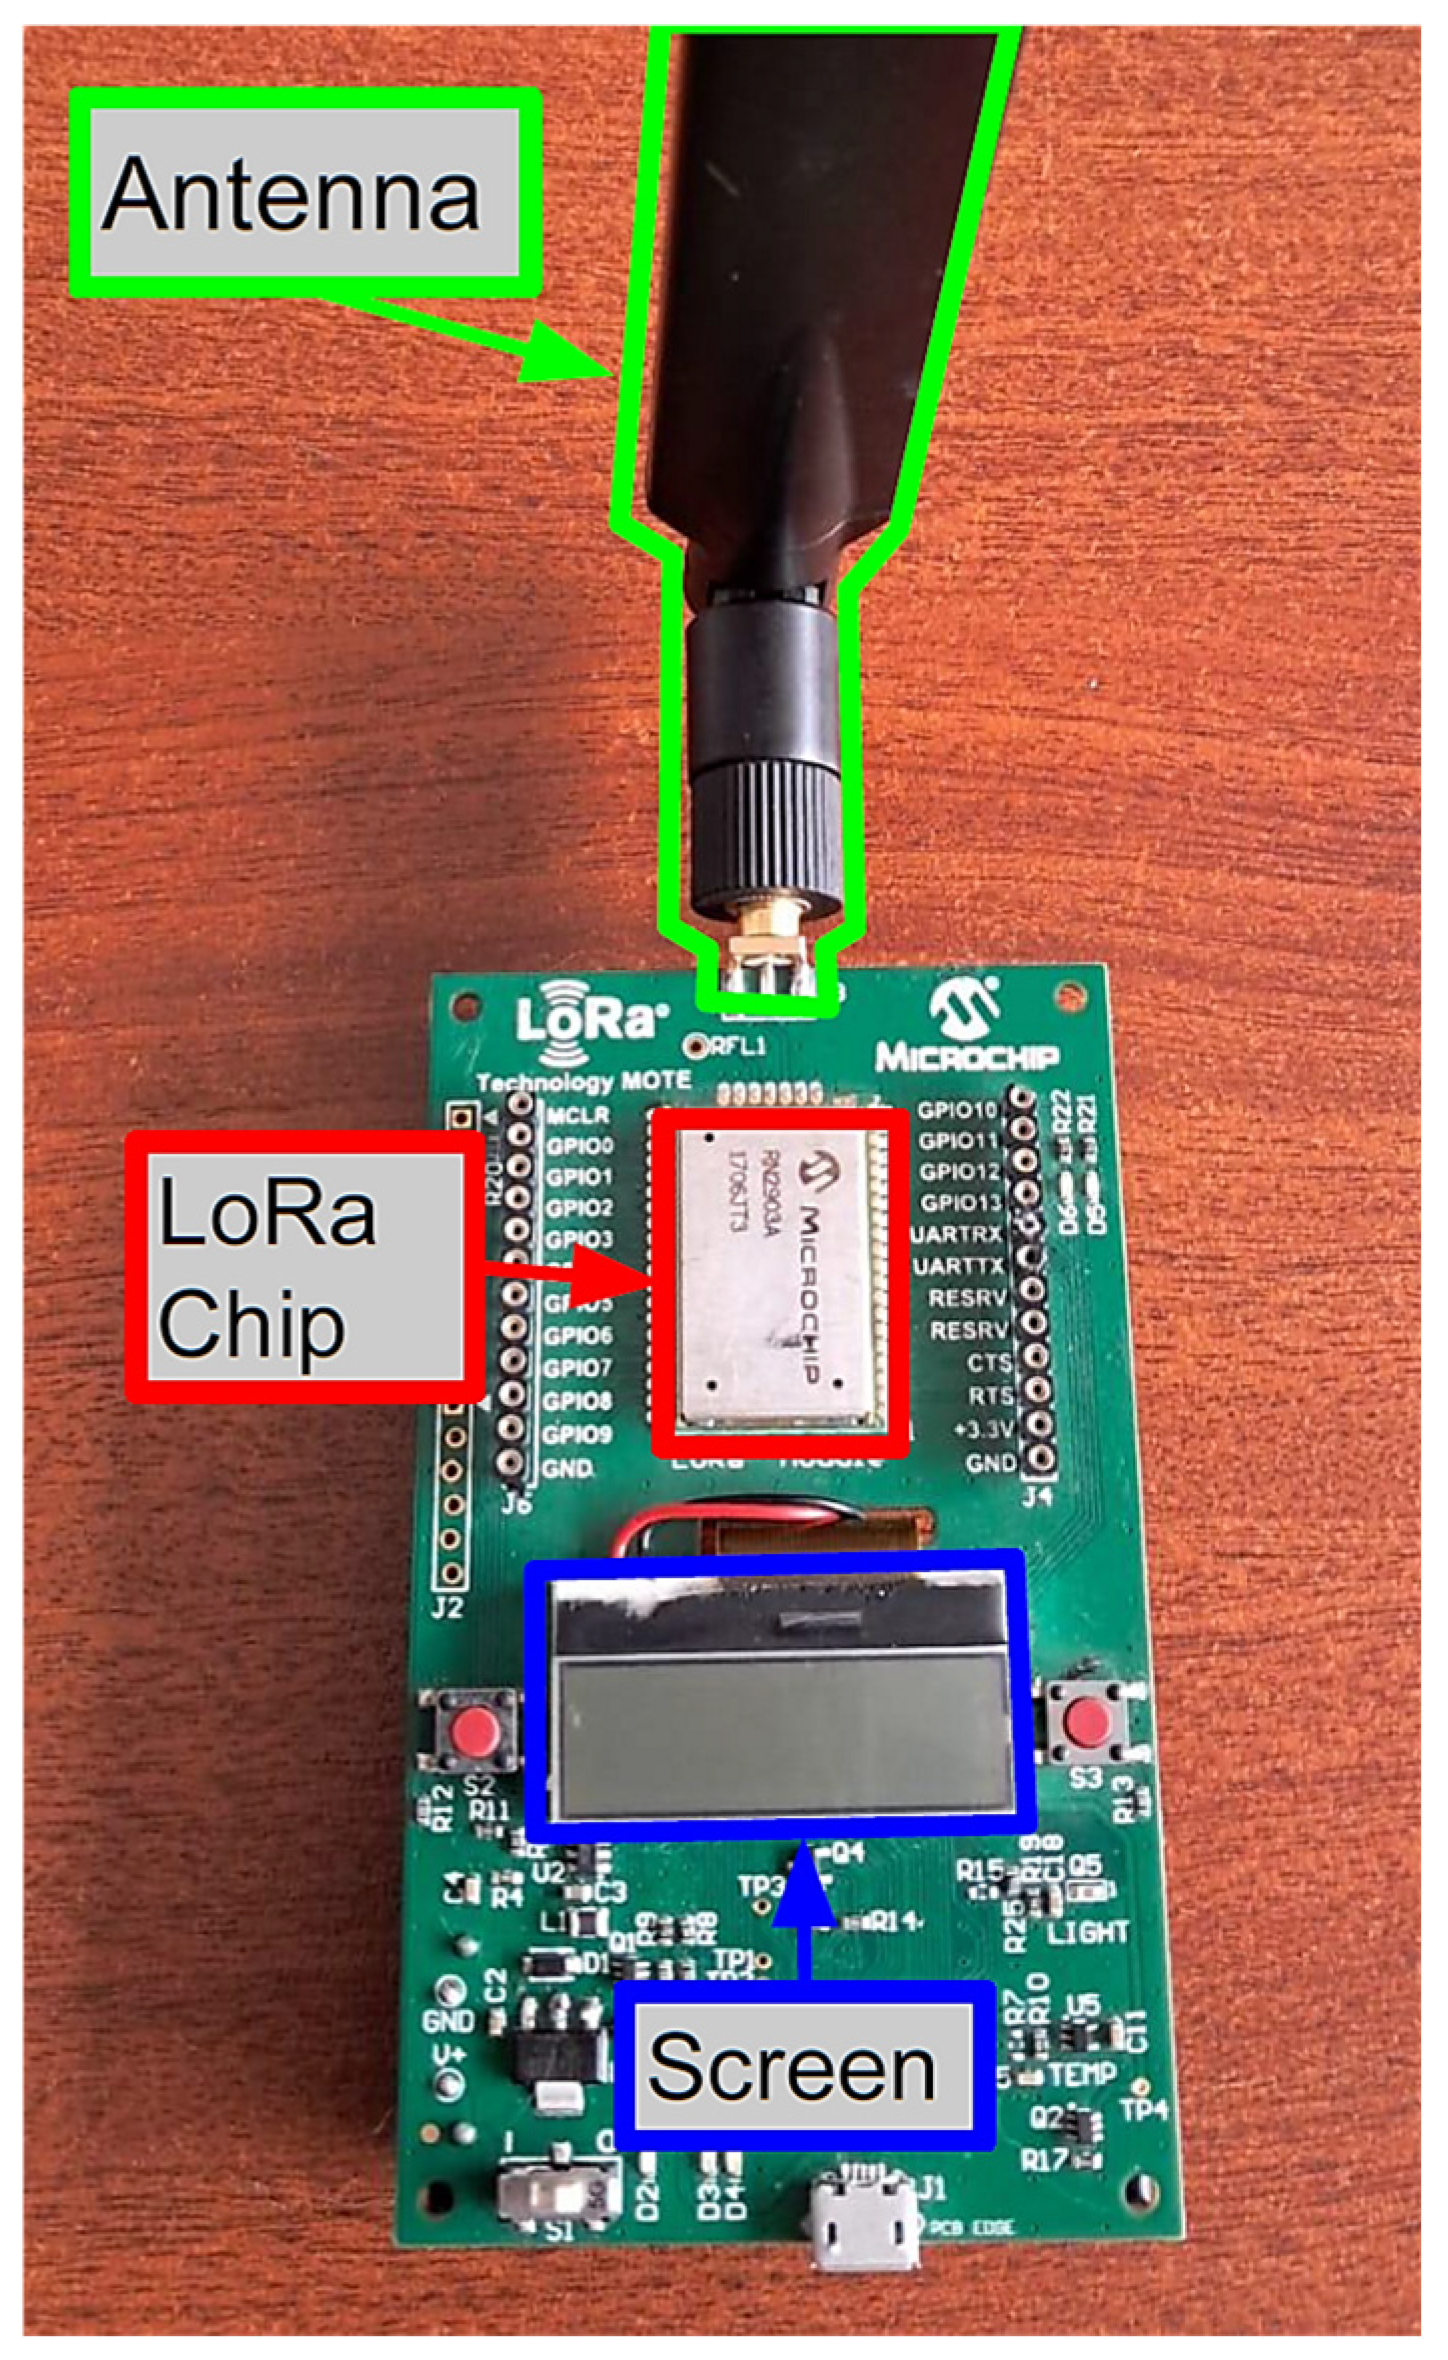
The end devices used in this study are equipped with Microchip RN2903 LoRa modules, which operate in the 915 MHz ISM band and are connected to antennas with a gain of 3 dBi (
Figure 2). Three nodes of this type were implemented in the experimental setup.
The end devices used in this study are those studied in [
9], which presents the development of a low-cost (USD 50 per device) educational kit consisting of a cane, a glove and a cap, each of them were designed and developed by our research team to assist people with visual impairment both outdoors. The devices, which can be used independently or together, offer detection, navigation, fall control, and real-time tracking functions without the need for additional infrastructure. Their design prioritizes functionality, usability, and ergonomics and promotes the reproduction and customization of accessible assistive technologies. In contrast, this study focuses on evaluating the device performance when a LoRaWAN infrastructure is integrated.
3.3.1. Smart Cap
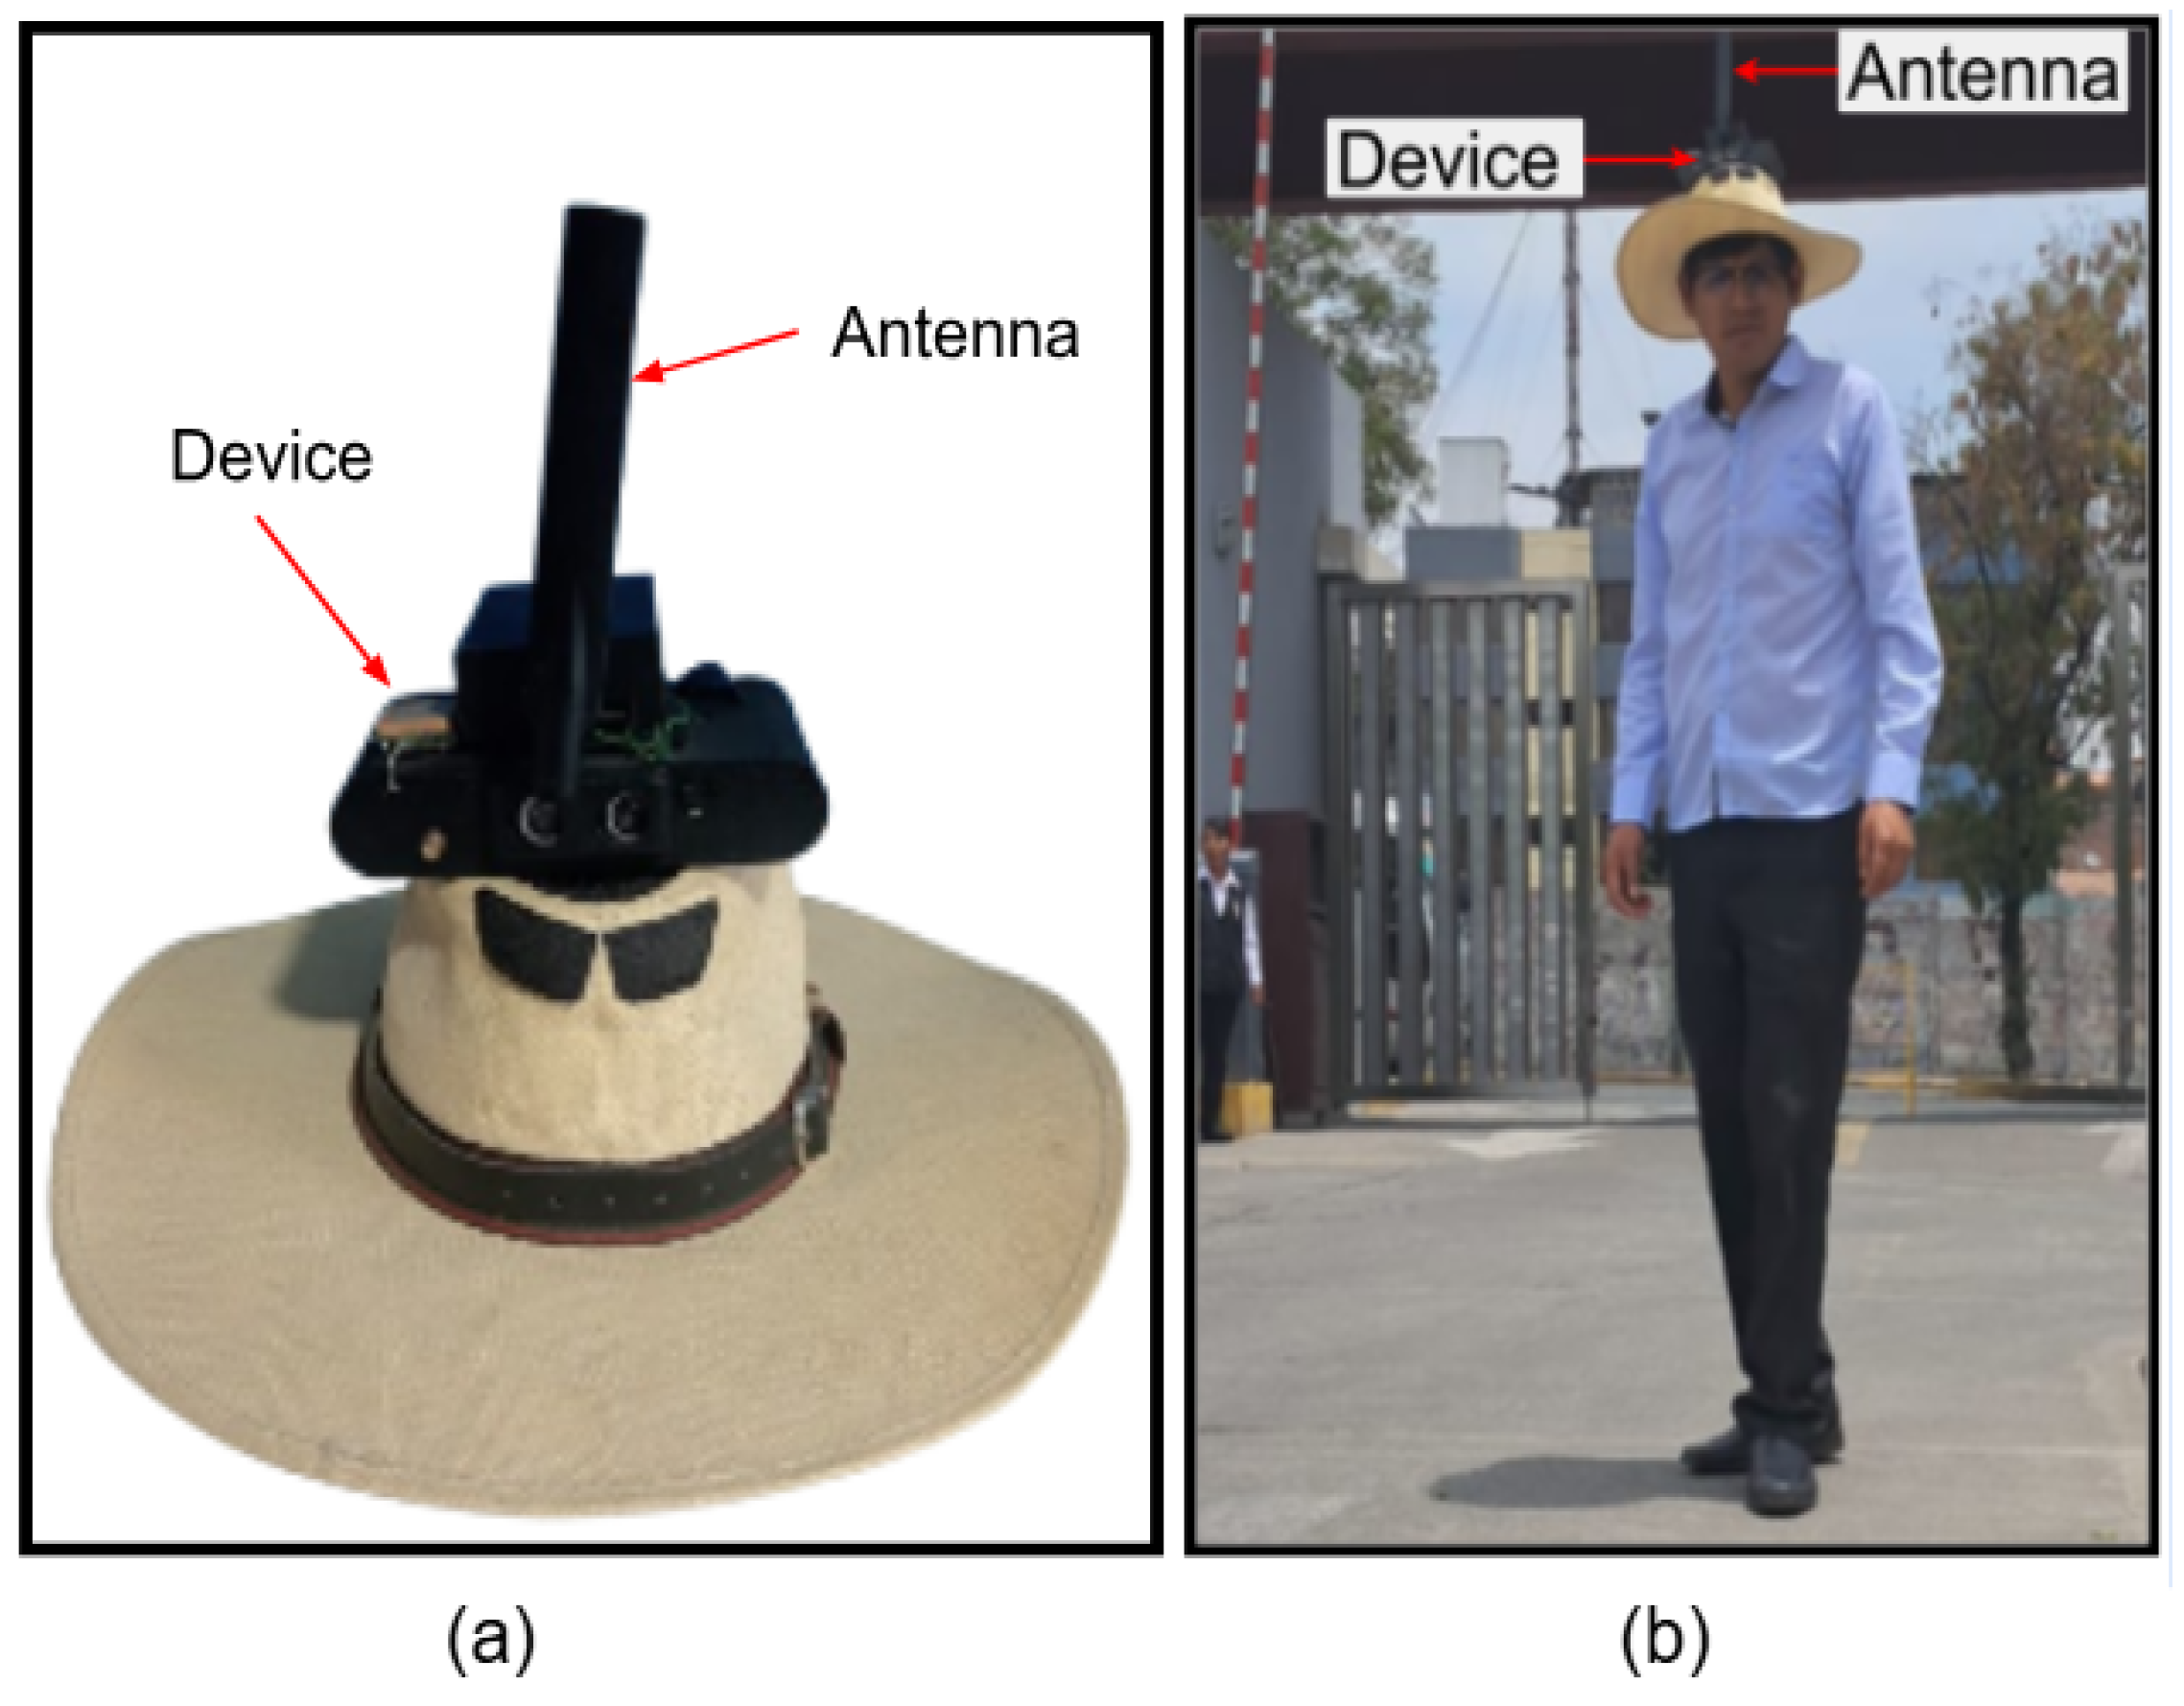
This device is integrated into a hat, as shown in
Figure 3. The system includes a GPS receiver for position measurements, an ultrasonic sensor for obstacle distance measurements, a gyroscope sensor for fall detection, and a UV sensor for radiation measurements. In [
9], simulated falls, UV radiation, and GPS receiver accuracy tests in static and moving states were presented.
3.3.2. Smart Cane
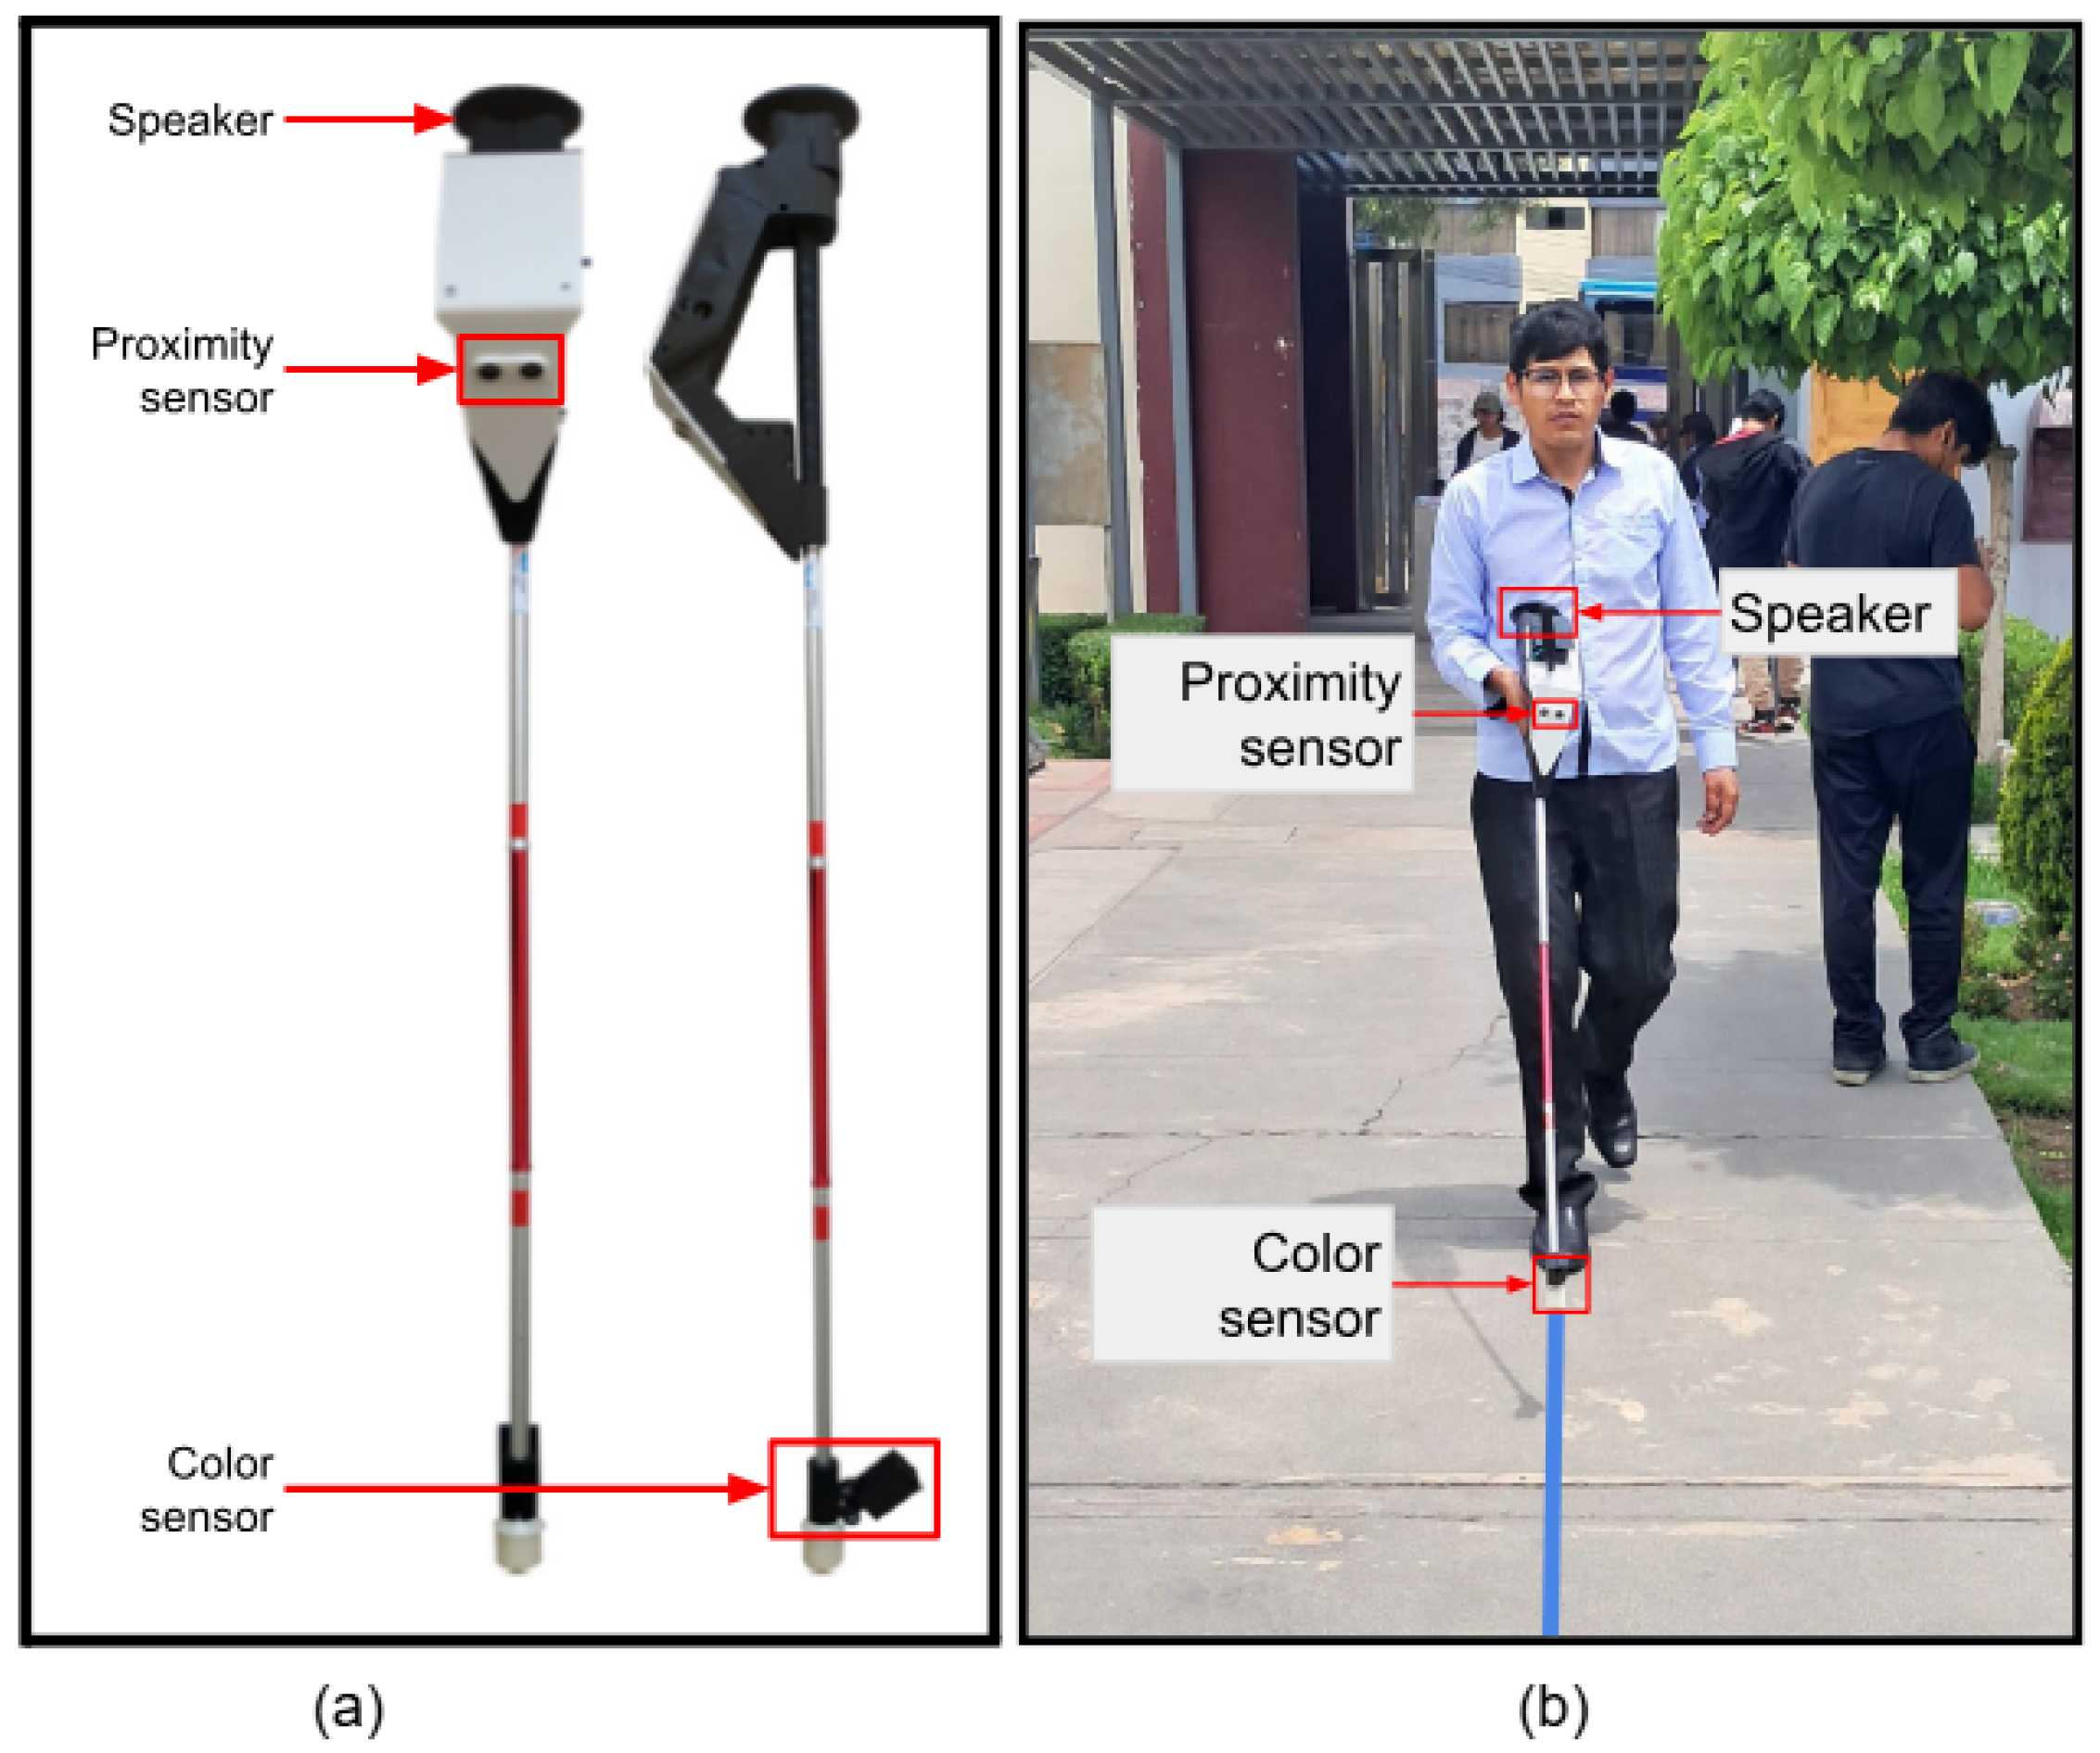
This device was designed as a cane for visually impaired individuals (
Figure 4). The system includes an ultrasonic sensor for obstacle distance measurements and a color recognition sensor that detects lines of different colors (red, green, blue, and black), providing auditory indications of the different routes the user can take. In [
9], tests on the color detection accuracy at distances of 1–9 cm and obstacle detection at distances of 50–450 cm were described.
3.3.3. Smart Glove
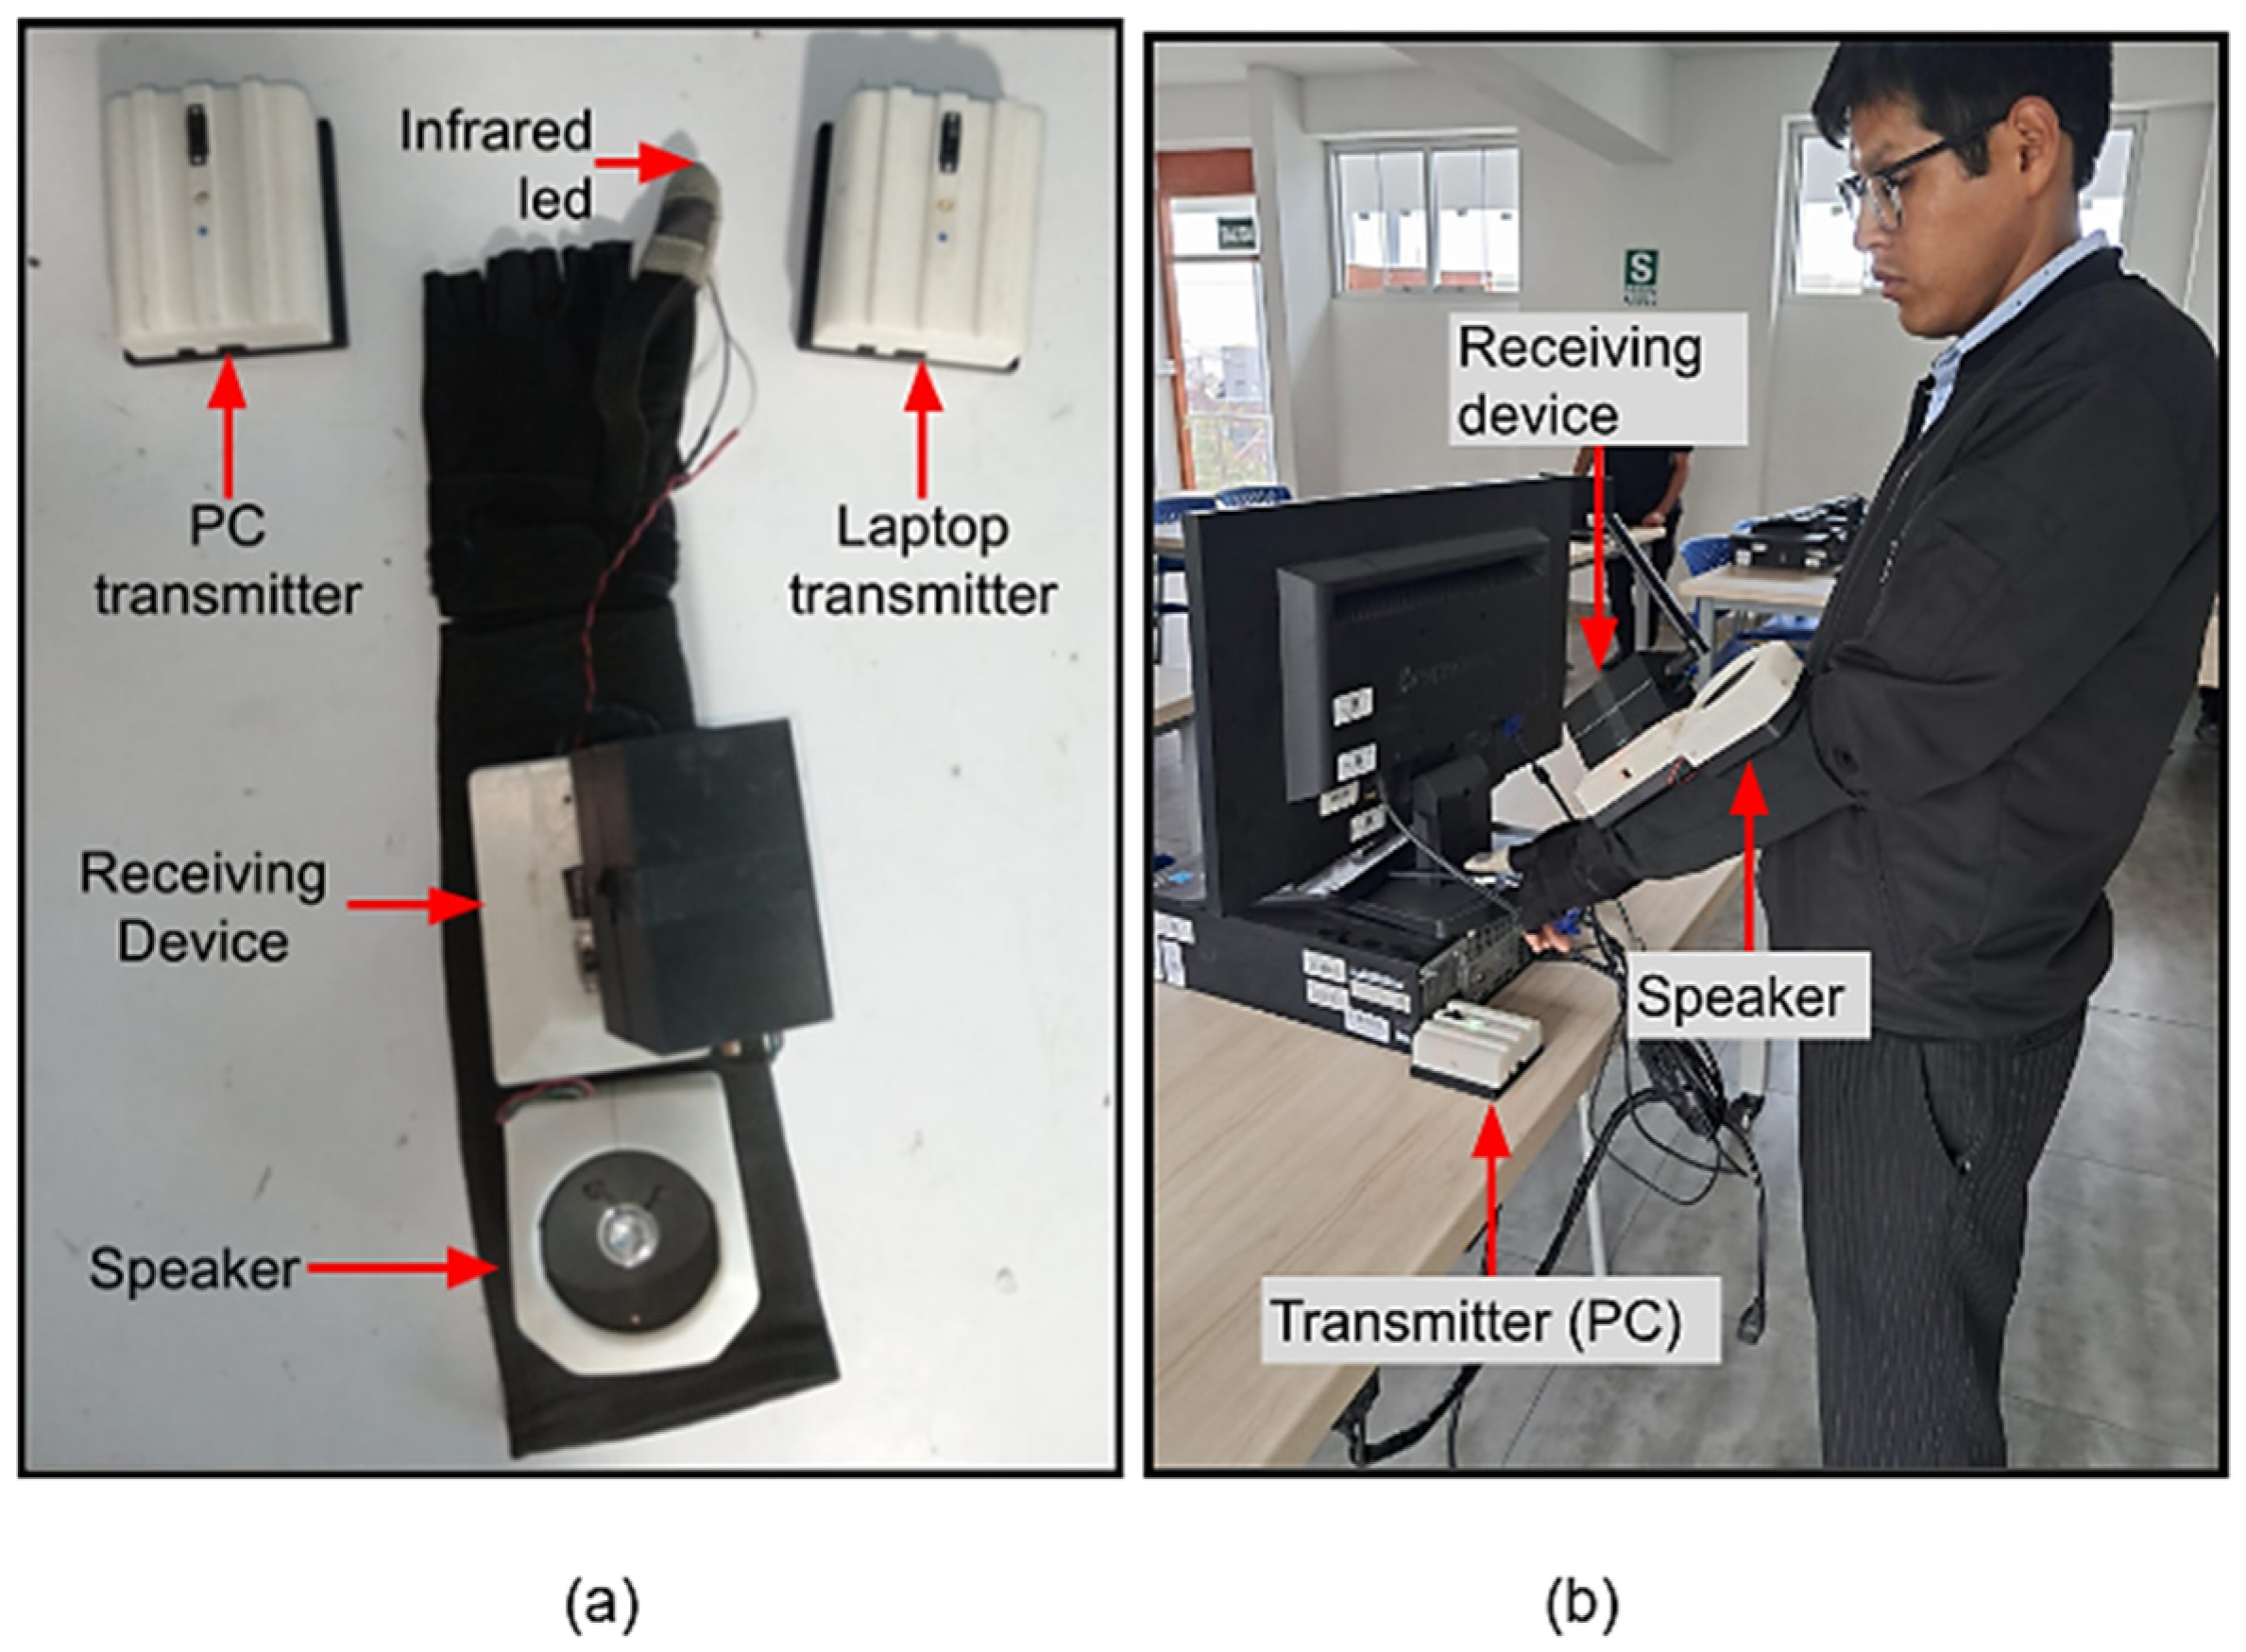
This device is worn on the user’s hand, as shown in
Figure 5b. The system includes an infrared sensor for recognizing specific nearby objects (computer and laptop). The system consists of a light transmitter and a receiver that captures the emission, as shown in
Figure 5a. In [
9], tests on the range and accuracy of the infrared transmitter and receiver modules configured to operate within a 10 cm range were conducted. The operation involves bringing the receiver close to both transmitters (laptop and PC).
3.4. Other Devices
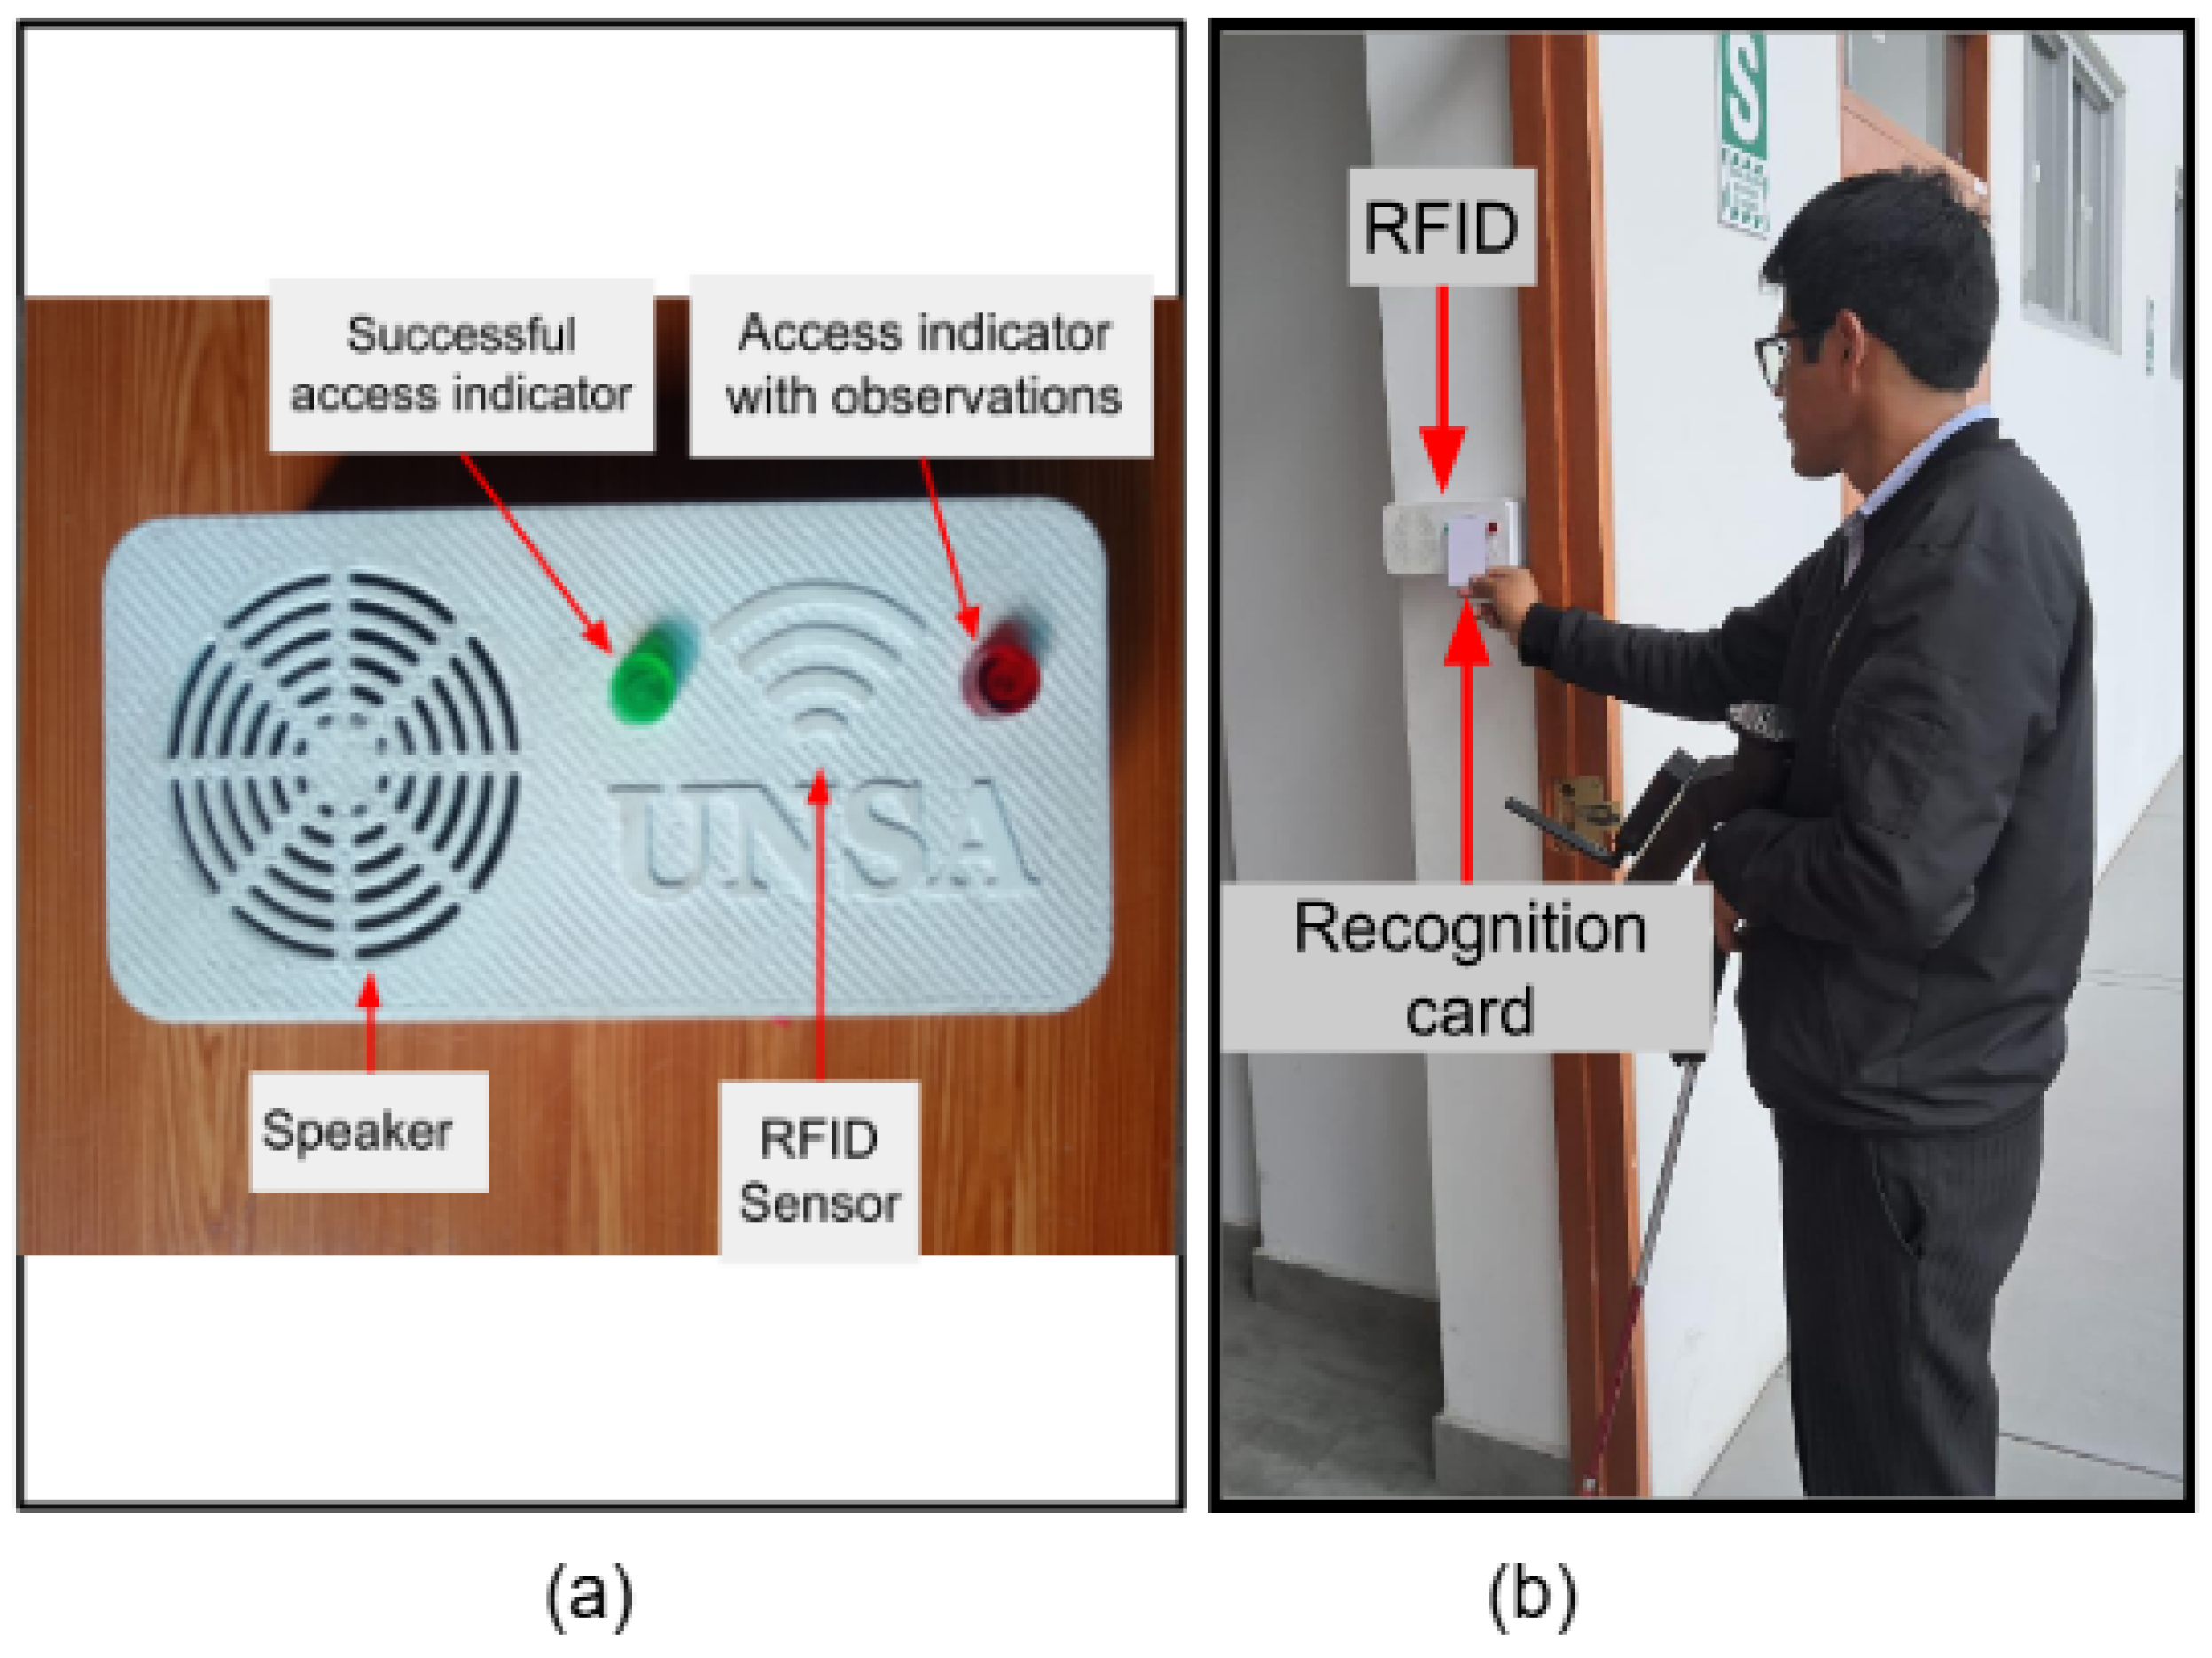
Additionally, a user recognition device using an RFID card was placed at the entrance door to grant access to the assigned classroom (
Figure 6). The device transmits data to the control dashboard via a Wi-Fi network. The reading range of the device was 15 cm. Although this distance could be greater, this feature was chosen so as not to increase the prototype’s cost. This device was excluded from the LoRaWAN network study.
3.5. Dashboard
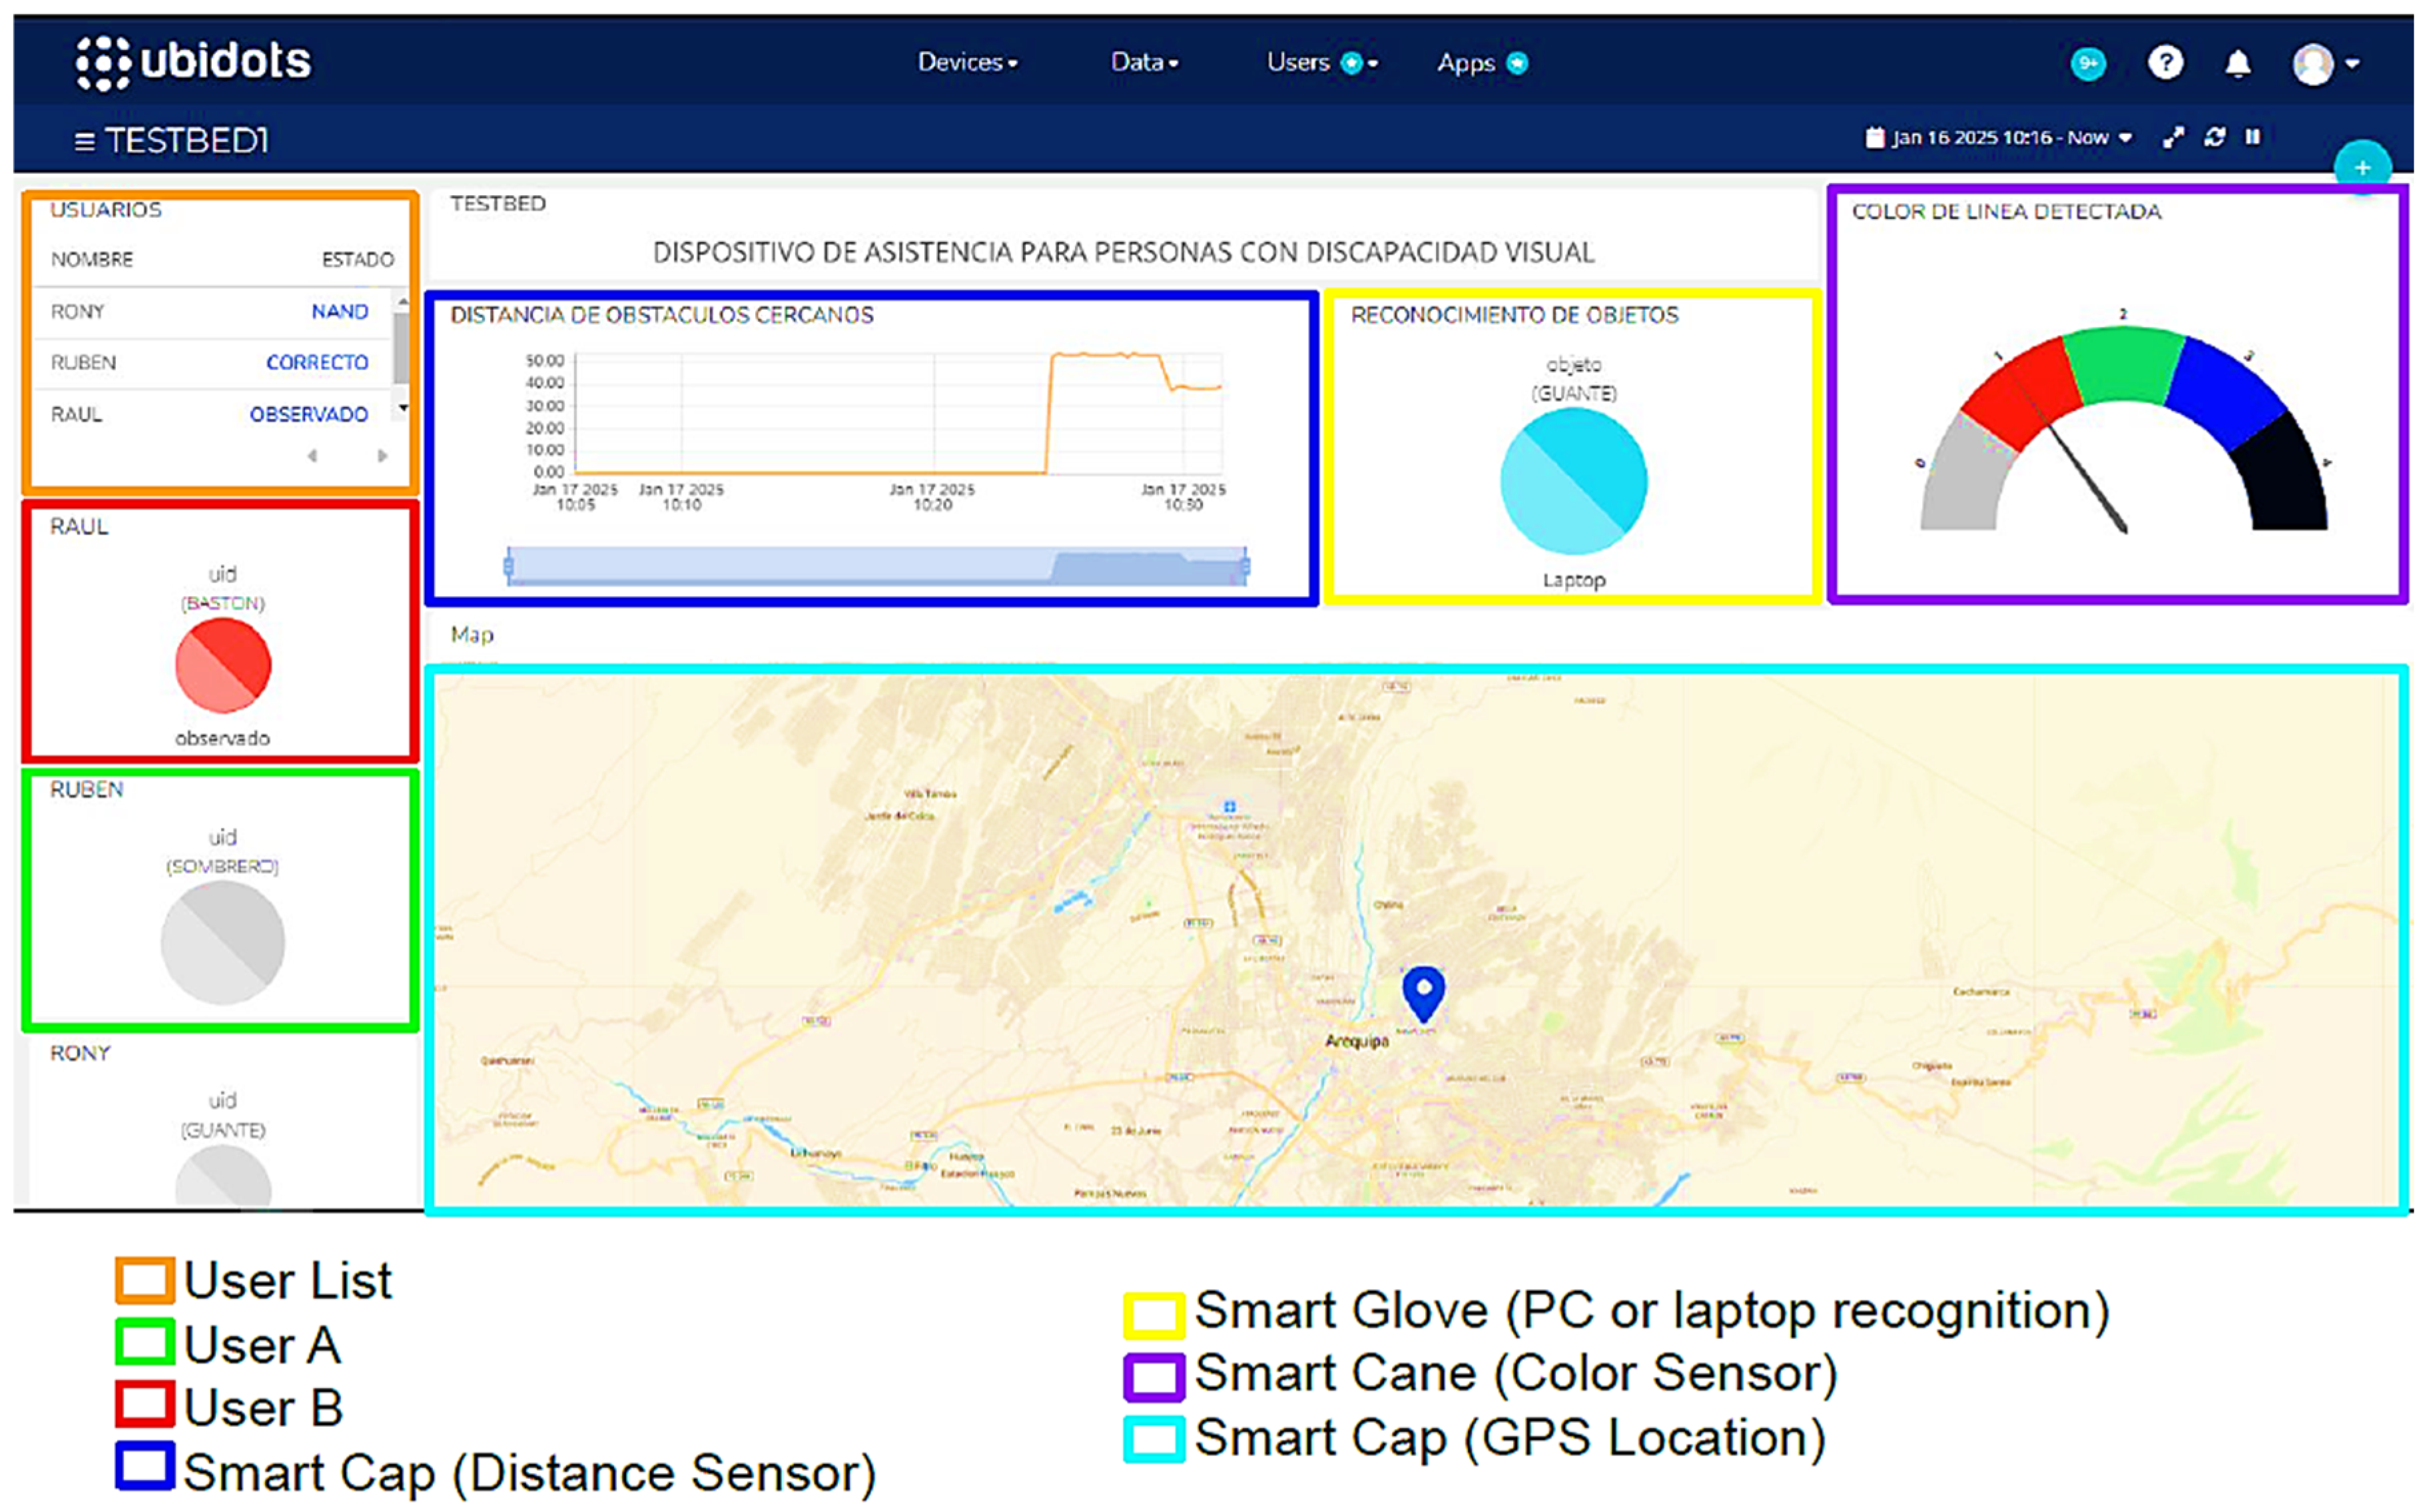
For monitoring and visualization purposes, the Ubidots dashboard, which is oriented toward the Internet of Things (IoT), was used. This dashboard allows the graphical visualization and real-time control of data collected by devices connected to the system, as indicated by the Ubidots Team [
27].
Figure 7 shows the proposed dashboard with a list of users registered in the system and sensor readings from the three end devices (smart glove, smart cane, and smart cap).
4. Methods
The difference between an application scenario and a test scenario must be understood in this section. The application scenario refers to the system’s intended use: providing real-time assistance and monitoring to students with visual impairment on the university campus. In contrast, the test scenario refers to the experimental conditions under which the LoRaWAN network performance was evaluated.
4.1. Application Scenario
The system monitors and assists students with visual impairments on the campus of the National University of San Agustín. Users must request an assistive device to transfer to their assigned classroom upon entering the campus. Trained security personnel are responsible for delivering the devices, providing guidance on their use, and collecting them afterward. The system comprises sensor-equipped devices connected to a network with Internet access. A supervisor monitors and views the data sent from each device from a central location through a web panel. Each user receives a unique identification card to access their assigned classroom.
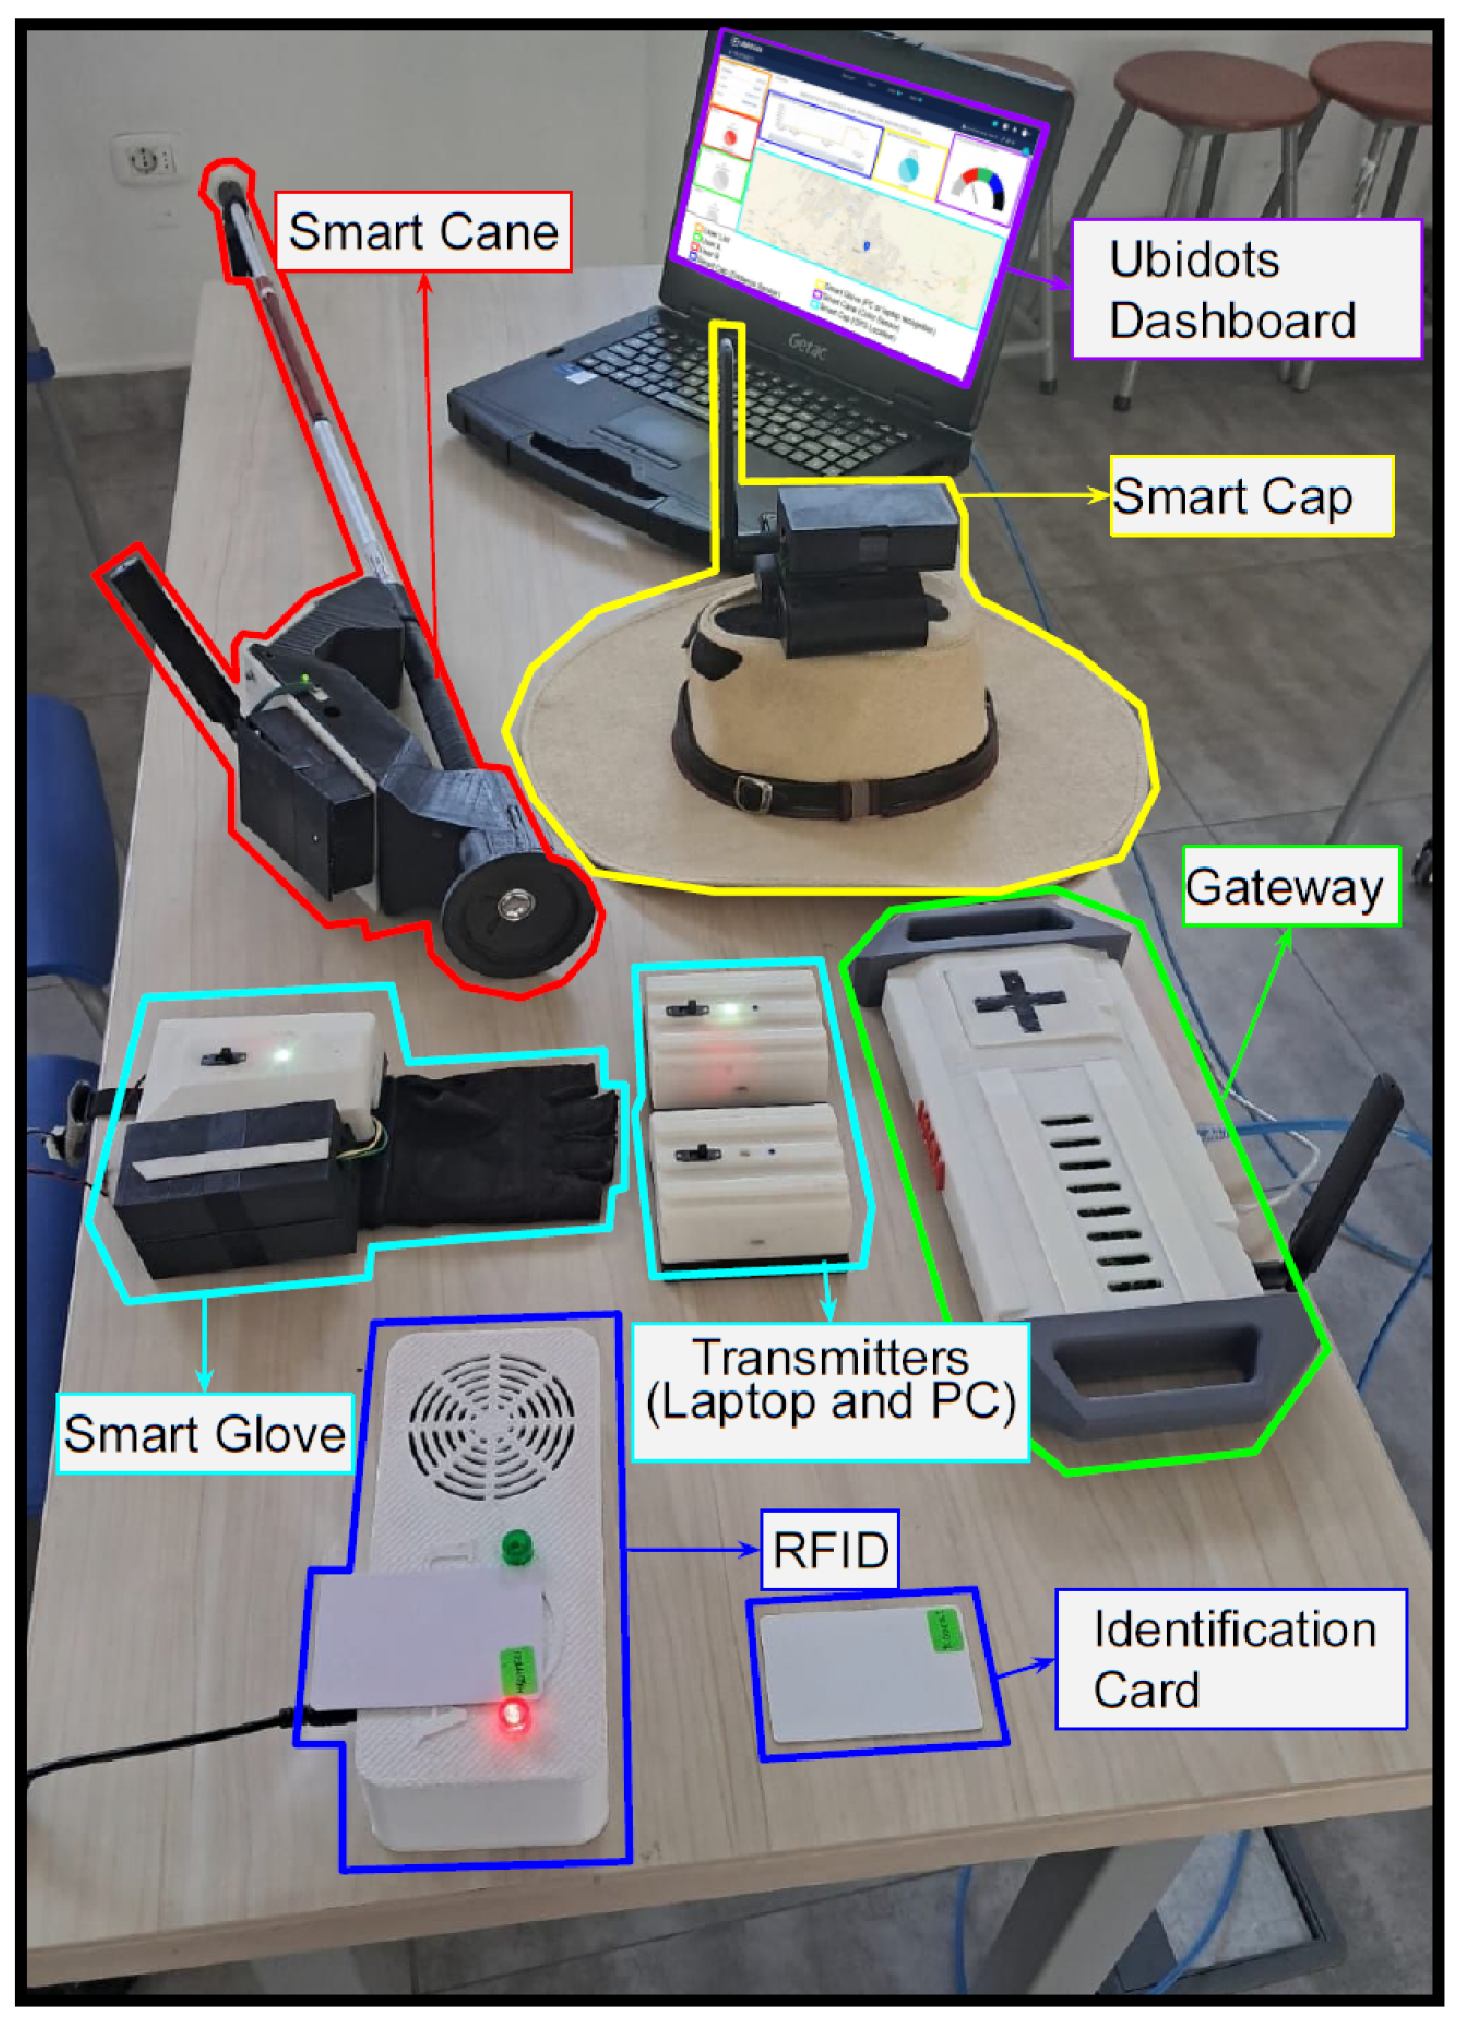
Figure 8 shows the devices used in this study.
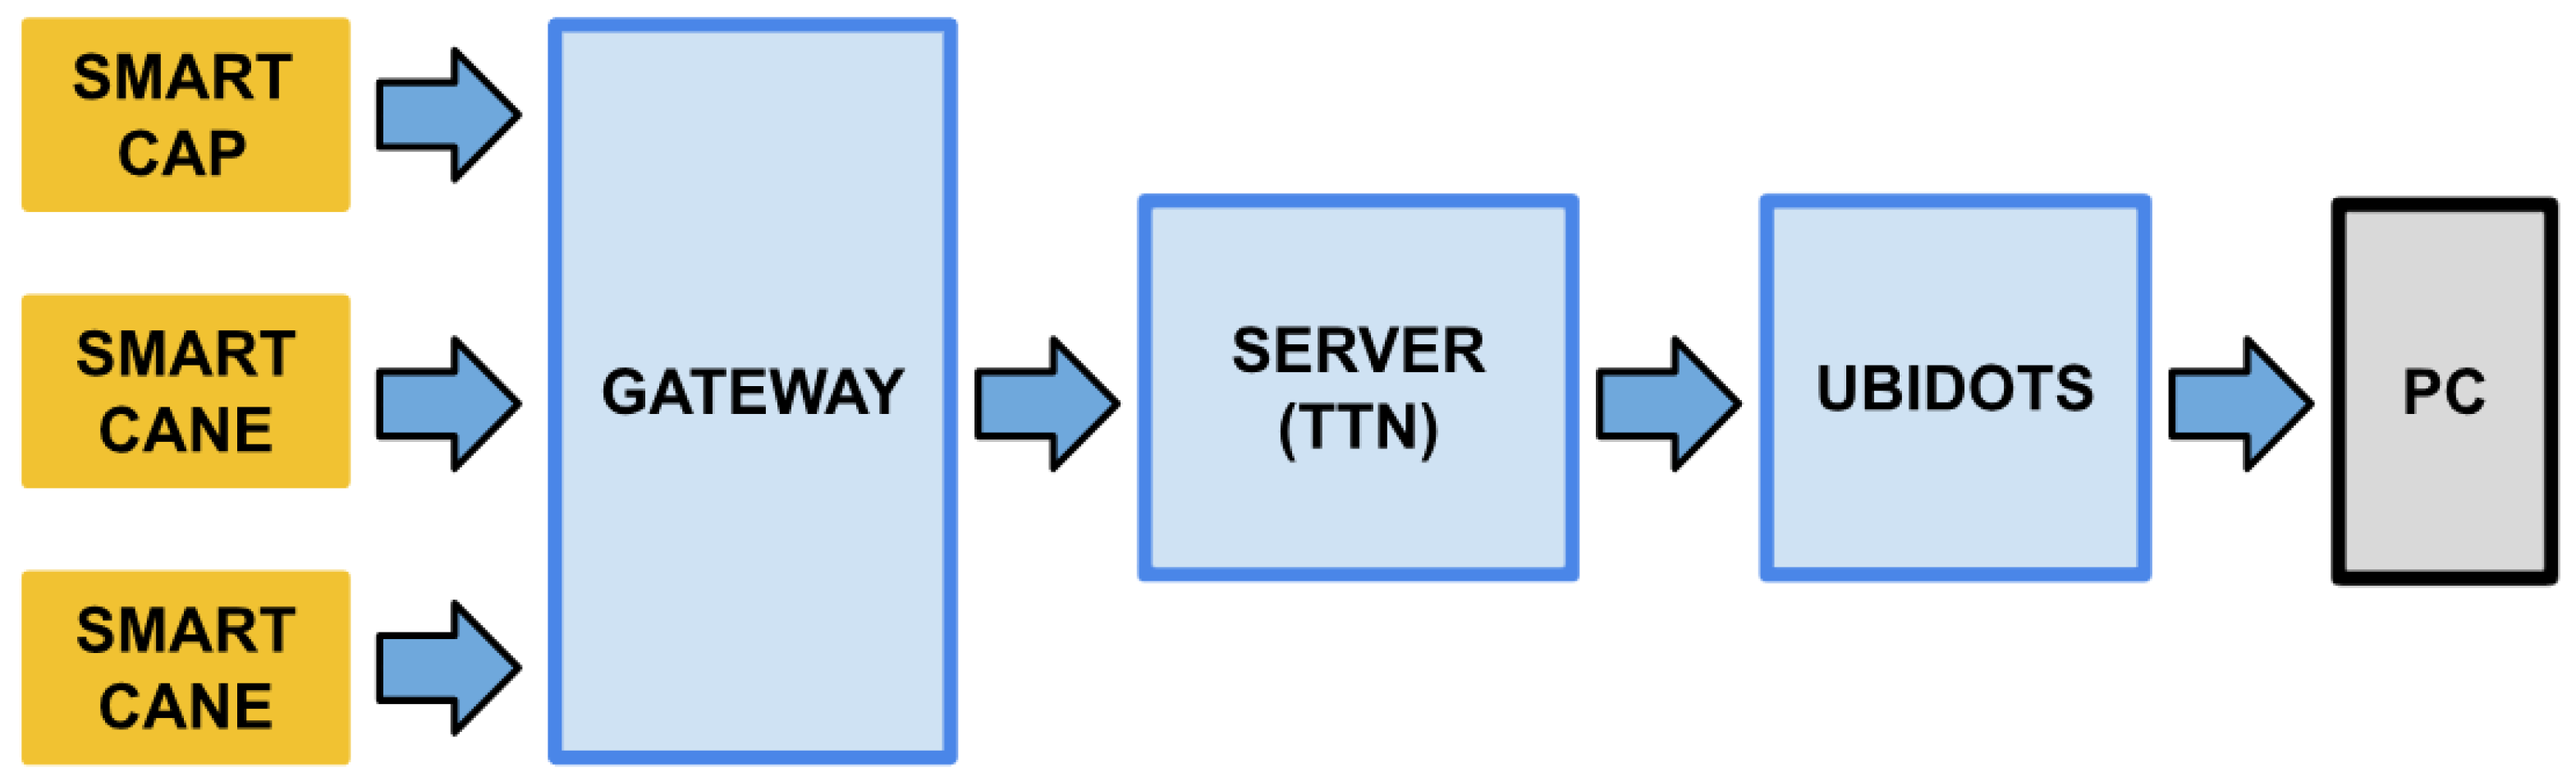
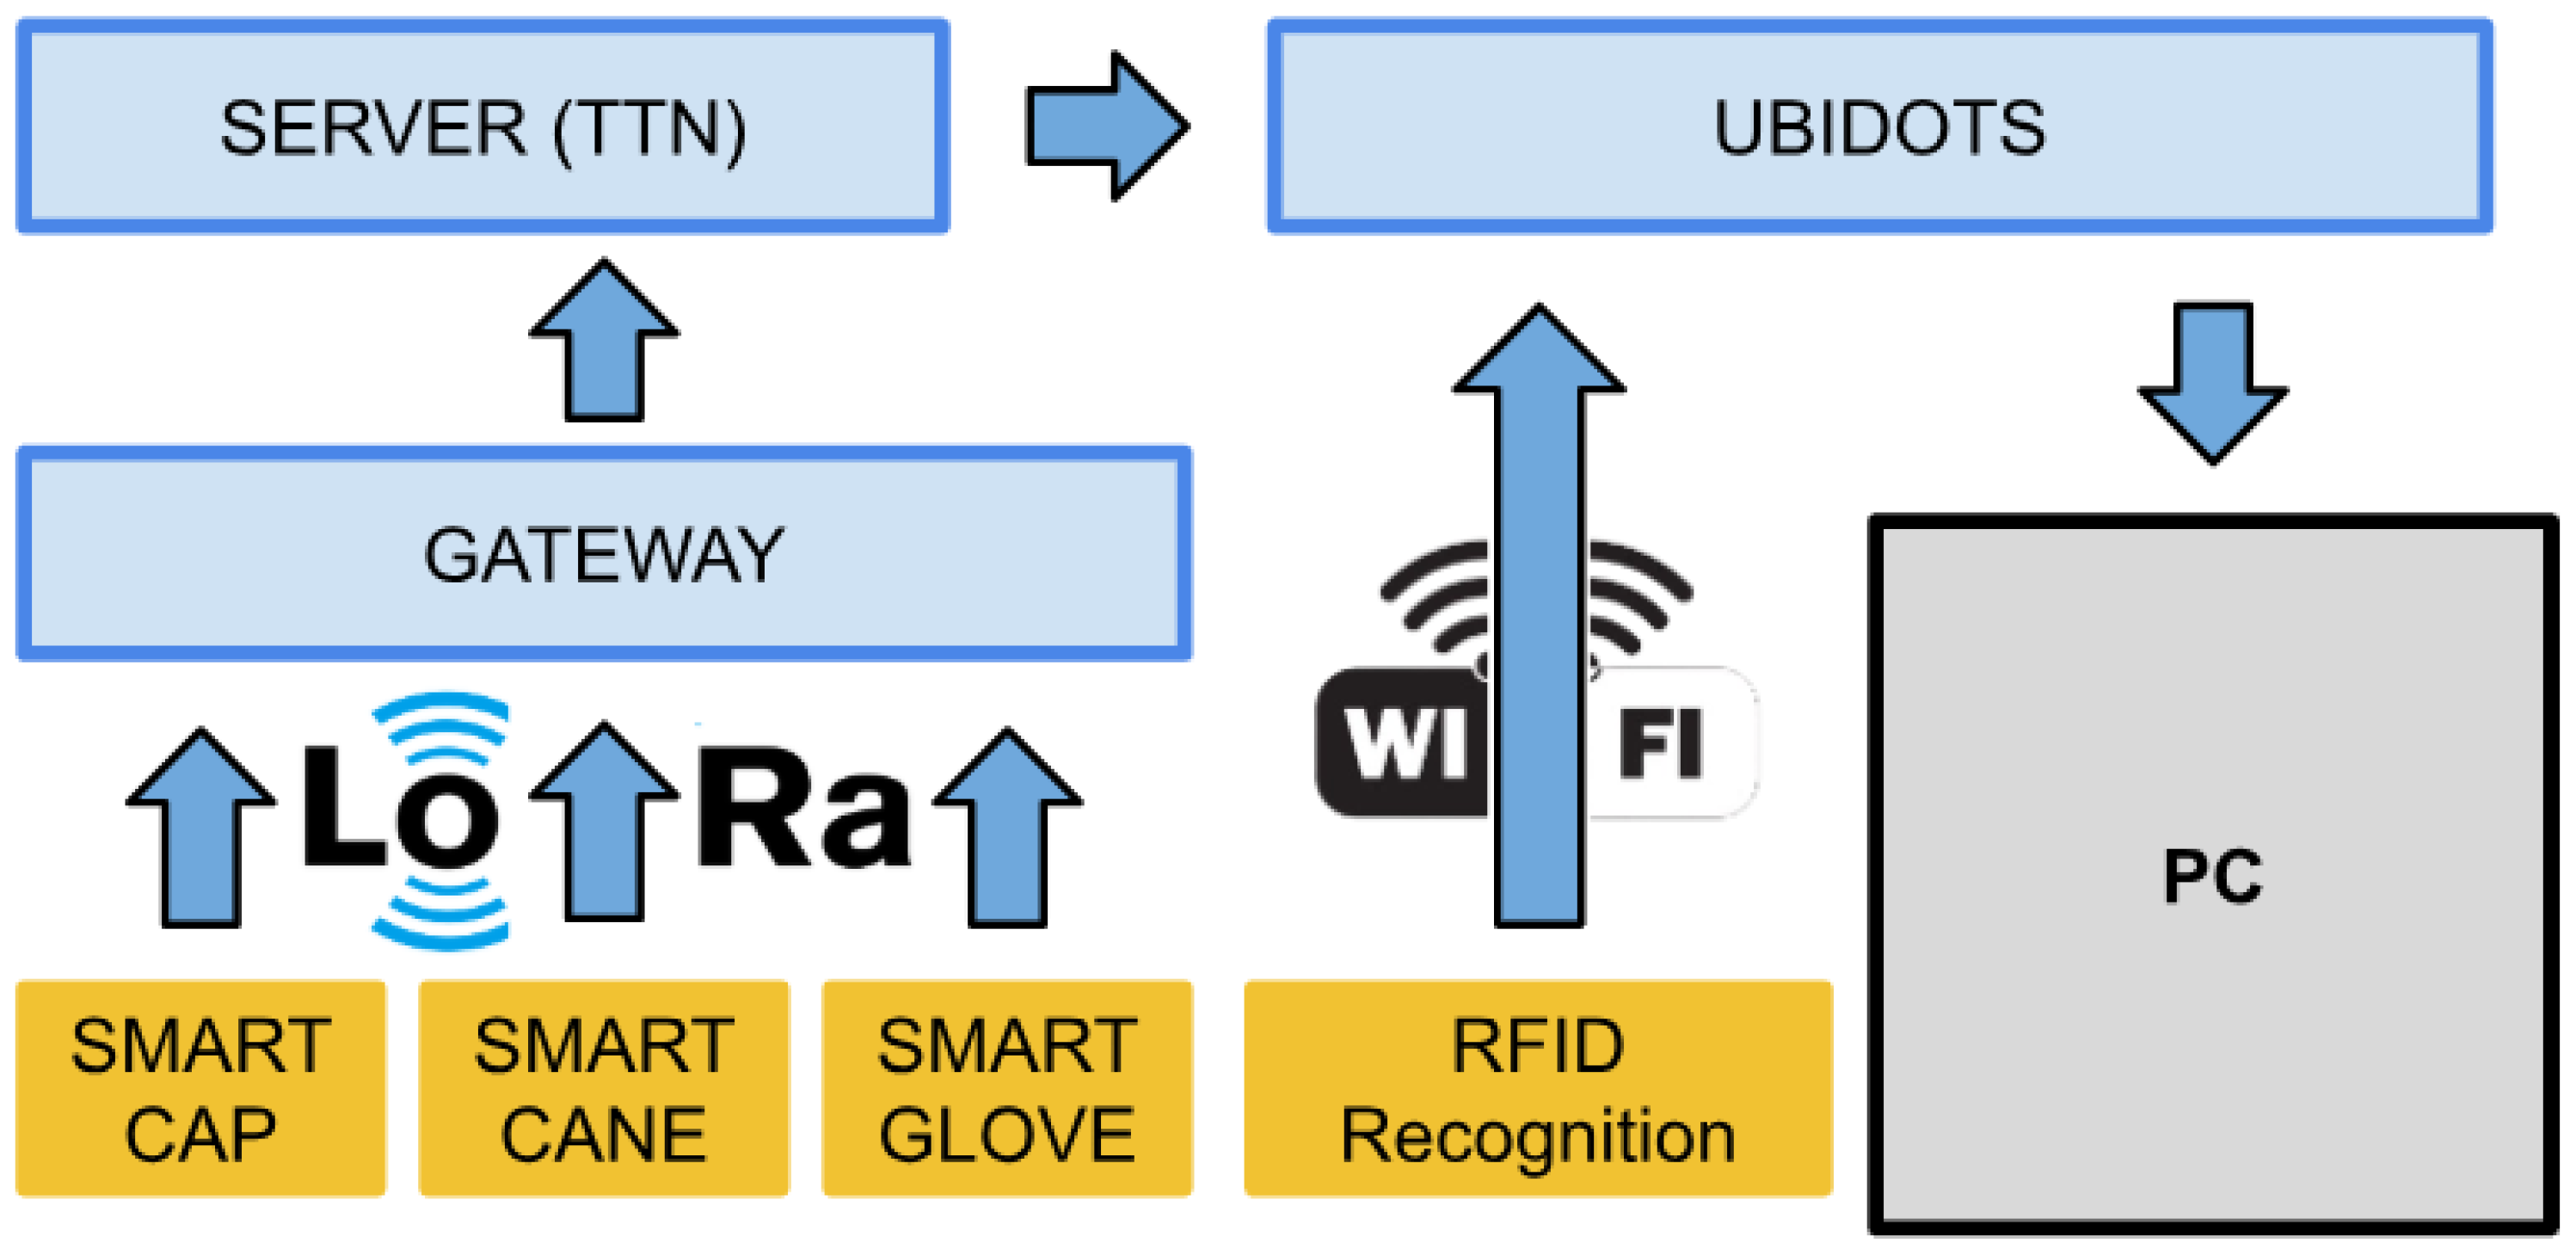
The system operation is explained by the block diagram in
Figure 9. The devices transmit data obtained from the sensors and send it to the cloud via a router. The Ubidots control panel facilitates data visualization in the cloud, which can be used to access data via computers and smartphones.
4.2. Test Scenario
The tests were carried out on the LoRaWAN network using an experimental prototype consisting of three terminal nodes, a base station, and a LoRaWAN server in selected areas of the campus to analyze signal behavior at different distances, with predefined routes and realistic but controlled conditions. The test scenario also includes open areas with trees, metal poles, and people’s frequent movement, covering scenarios with and without a direct line of sight (NLoS) to the base station. This environment presents sources of interference typical of an urban area, such as mobile communications, metal structures, and street furniture, which can affect signal propagation.
Figure 10 shows the proposed LoRaWAN architecture for testing.
During testing, the actual routes were defined within the campus, and the terminal nodes were progressively moved away from the station (0, 150, 300, and 400 m). Distances were determined manually by measuring the linear distances from the gateway. The nodes transmit their data to the TTN during these routes, allowing the recording of metrics such as RSSI, SNR, packet number, and timestamp. Furthermore, to comply with TTN’s fair use policy, each end device has a maximum limit of 30 s of airtime per day, so the experiments were spread over four consecutive days: the corresponding transmissions were made at 0 m on the first day, 150 m on the second day, 300 m on the third day, and 400 m on the fourth day.
The experimental phase presented in this article was conducted in the outdoor areas of the university campus due to logistical limitations and access to buildings. The systematic indoor validation was excluded from this study.
4.3. Transmission Parameters
The transmission parameters were defined according to the type of data to be transmitted, LoRaWAN network restrictions in the US915 band, and policies for fair access to the TTN server channel. The terminal node packet size was determined according to the information transmitted by each node as follows:
Node 1 (Smart Cap) transmits positioning data through the LoRaWAN network, with a packet size of 22 bytes (latitude and longitude), sent at 60 s transmission intervals.
Table 3 shows the transmission characteristics of the Smart Cap to the LoRaWAN network.
Node 2 (Smart Cane) transmits data on the distance between obstacles and color detection data from a guide line on the floor with a total packet size of 8 bytes sent at 20 s transmission intervals.
Table 4 presents the transmission characteristics of the Smart Cane device.
Node 3 (Smart Glove) sends object identification data through interactions with the environment, with a total packet size of 4 bytes sent in 10 s transmission periods. The transmission characteristics of the Smart Glove device are shown in
Table 5.
Adaptive data rate (ADR) was enabled for all devices so that the network automatically adjusts the transmission parameters according to link quality. The ADR mechanism dynamically modifies the SF and transmission power to optimize communication efficiency and reduce transmission time while maintaining a fixed bandwidth of 125 kHz. This adaptive configuration improves scalability and energy efficiency, ensuring stable communication over various distances and conditions. As stated by Chinchilla-Romero in [
28].
4.4. Transmit Power
In the proposed system, transmit power refers to the power level at which the LoRa end devices (Smart Cap, Smart Glove and Smart Cane) emit their signals to the gateway. A transmission power of 14 dBm was configured in this implementation. Although the development kit allows a configurable range between 2 and 20 dBm, the actual transmission power supported by the RN2903 radio module is between 3 and 18 dBm, according to the data sheet. This value was chosen because it allows achieving an adequate coverage range (up to 400 m in field tests), favors energy efficiency by limiting the power consumption of the end devices, and helps mitigate possible interference in the 915 MHz ISM band. This configuration proved sufficient to ensure reliable communication under NLoS conditions, thus avoiding the use of higher power levels that could reduce system autonomy.
4.5. Interference Between Nodes
An important factor to consider in LoRaWAN networks is the potential interference between multiple nodes transmitting simultaneously, especially when they share the same frequency channel and SF. To mitigate this interference, two main mechanisms are used in this implementation. First, each node operates on different frequency channels, which reduces the likelihood of physical layer collisions. Second, ADR is enabled, allowing the network server to dynamically assign different SFs and transmission power levels to each node based on link quality. LoRa modulation guarantees orthogonality between different SFs, allowing transmissions with different SFs on the same channel to coexist with minimal interference. These combined mechanisms (multichannel operation and ADR-based adaptive SF assignment) significantly reduce the probability of collisions and improve the overall network scalability and energy efficiency.
4.6. Time on Air Analysis
It is important to note that this application does not require a high data transmission rate because the devices transmit small packets (between 3 and 22 bytes) at low frequency (every 10 to 60 s). Therefore, performance analysis is included as a metric to validate the operational efficiency of the system under real conditions,
ToA is obtained by adding the payload time and preamble time according to Equation (1).
From Equation (1), the payload time
is the time it takes to transmit the packet payload (actual data + headers) which is calculated with Equation (2).
On the other hand the Preamble Time (
) is the time required to transmit the synchronization symbols of the packet. Then, it is calculated using Equation (3), where the n preamble takes the value of 8.
The term symbol duration (
) in Equations (2) and (3) represents the time it takes to transmit a single symbol and is calculated in Equation (4).
Finally, the term
is calculated using Equation (5).
where
PL: number of payloads (bytes) = 37 bytes (Smart cap), 23 bytes (Smart Cane) y 19 bytes (Smart Glove)
SF: Spreading Factor = 7–9
BW: Bandwidth = 125 Khz
CRC = 1
IH = 0, when enabled = (0) meaning in the explicit mode, disabled = (1) meaning in the implicit mode
DE = 0, when enabled = (1), disabled = (0)
CR = 1, because baud rate = ⅘
4.7. Measurement Procedure
The measurement tests were conducted in relation to the environment, as described in the “Test scenario” section. For data collection, 100 transmissions per node were performed for each measurement point. RSSI (Received Signal Strength Indicator), SNR (Signal-to-Noise Ratio) and percentage of packets received correctly values were collected. The data were collected through The Things Network (TTN) console and exported for further analysis. Each transmitted packet contained a sequential counter to facilitate analysis.
4.8. Scalability Analysis
The scalability of a LoRaWAN network is directly related to the gateway’s ability to receive multiple packets simultaneously. This application uses an SX1301-based gateway, which has 8 LoRa demodulators, allowing up to 8 packets to be decoded concurrently [
29]. This limit of 8 simultaneous reception channels defines the physical ceiling of the network: if more than 8 nodes transmit at the same time on the same channel and spreading factor (SF), the additional packets cannot be decoded and will be lost. Therefore, network planning must consider the temporal distribution of transmissions to avoid saturating the demodulators. In the application scenario discussed in this article, the nodes have different transmission intervals: 10 s, 20 s, and 60 s. Therefore, to avoid collisions on the same channel and achieve the highest packet reception rate (PRR), one node per channel would have to be used. If we take that value as a limitation, we can connect a maximum of 2 kits (Smart Cap, Smart Cane, and Smart Glove), i.e., 6 end nodes in the worst case scenario.
On the other hand, following the analytical model proposed in [
30], we can approximate the capacity of LoRaWAN as the superposition of independent ALOHA-based networks, where the probability of collisions in the MAC layer increases with the number of nodes. Therefore, the probability that a packet will be received without collision is given by
, where (
G) is the channel load. Furthermore, by maintaining a
, we obtain a channel load
G = 0.053. Consequently, the maximum number of nodes of the same type that can coexist on the same channel can be estimated from the channel load according to Equation (6).
where the maximum number of nodes
N is limited by the channel load (
G), the time on air (
), and the transmission interval configured on each node (
).
5. Results
In this study, we conducted link-level tests on a LoRaWAN network to evaluate the performance and communication coverage between the end devices (LoRa nodes) and the base station (LoRa Gateway) installed on the university campus. The analysis considers four fundamental parameters: the received signal strength indicator (RSSI), Signal-to-Noise Ratio (SNR), Time of Air (ToA), and Packet Reception Rate (PRR). The RSSI provides information on the strength of the received signal, whereas the SNR evaluates the signal quality in relation to noise. ToA represents the duration of a packet while it occupies the transmission channel, and PRR, a direct measure of link reliability, quantifies the proportion of successfully received packets. Finally, the network range defines the maximum distance between the nodes and the base station at which stable communication is maintained. These metrics are used to determine the viability of the proposed system.
5.1. Network Range
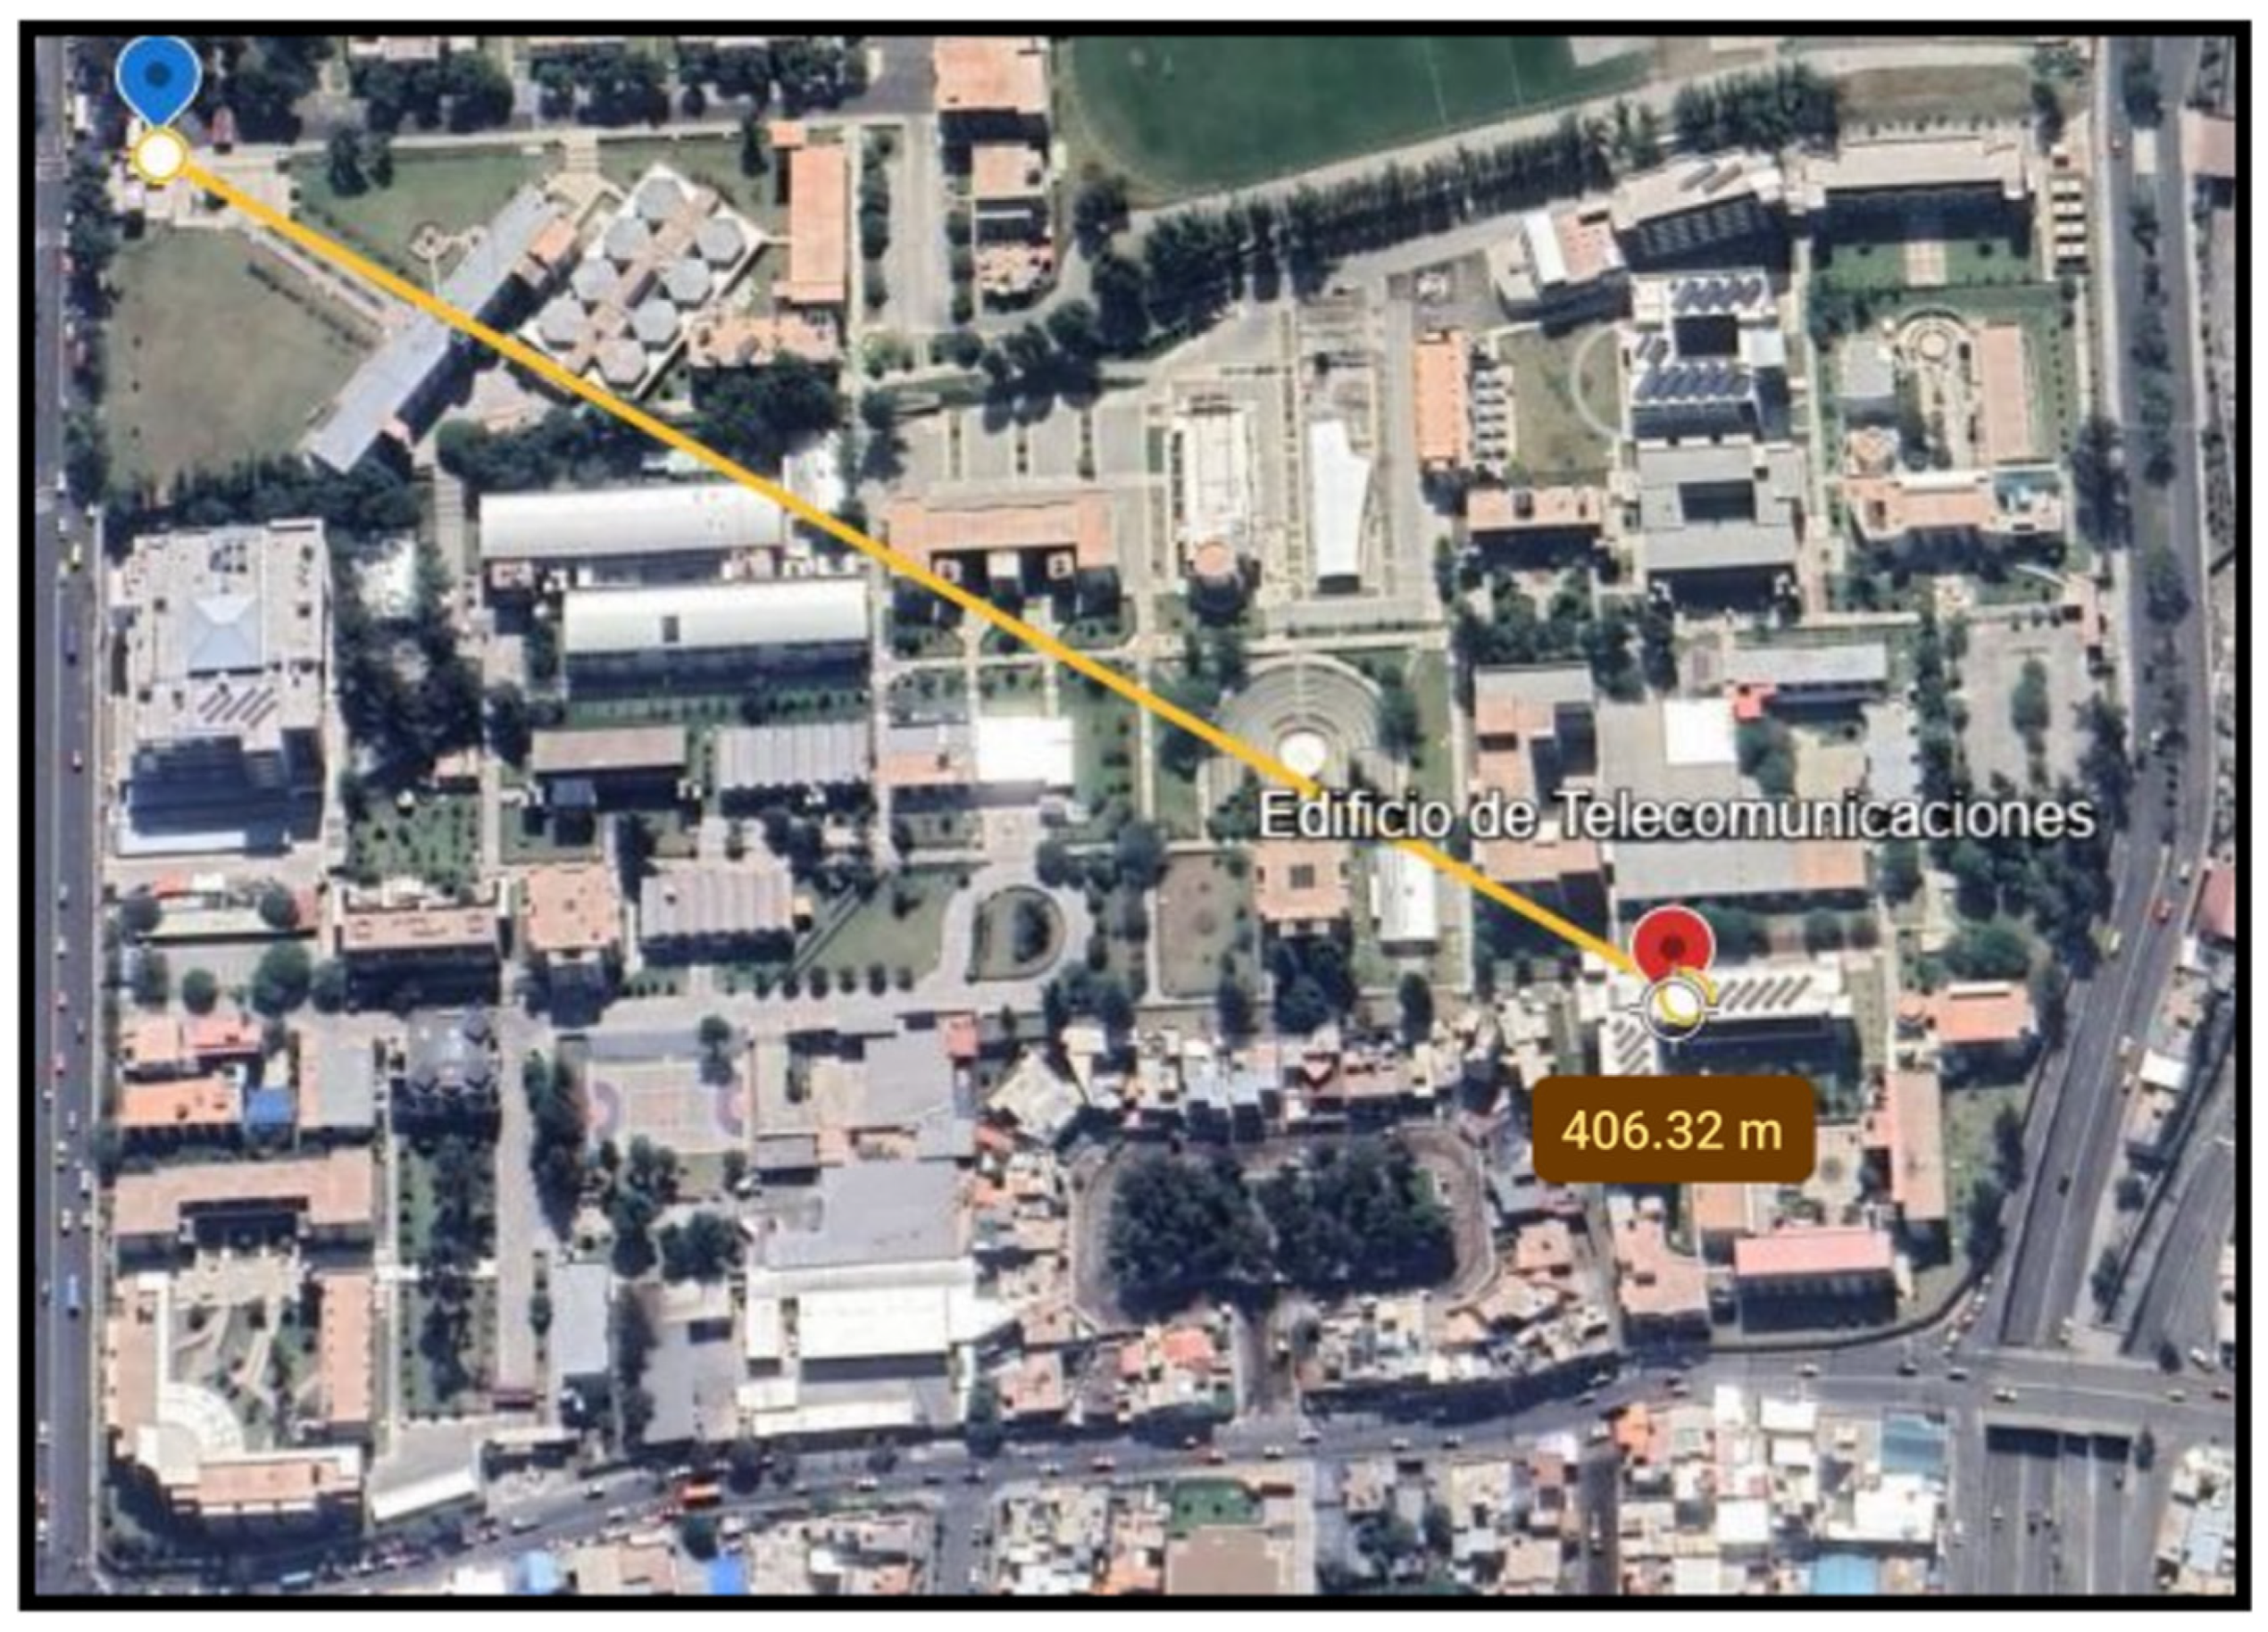
The network range is the maximum distance at which a LoRa device or node can transmit data and be correctly received by the gateway in the test scenario conducted within the university campus. Under these conditions, the average maximum range was 400 m, as shown in
Figure 11. The maximum distance was measured from the main campus gate to the building of the professional telecommunications school, where the entrance gate was located. However, this value does not represent the maximum possible range of LoRa technology or the LoRa modules used.
5.2. Coverage and Performance
To objectively evaluate the performance and communication coverage of the proposed network, TTN data were collected from the gateway.
Table 6,
Table 7 and
Table 8 summarize the test results, including the SNR, RSSI, and ToA values for different distance ranges and dispersion factors, respectively. Tables were organized according to ADR-designated SFs. The data shown is an average of multiple transmissions made by each node without exceeding the 30 s allowed by TTN’s fair use policy. The SF values reach a maximum of 10 because the TTN limits the maximum use to SF10 for the uplink (transmission from the node to the network) in the LoRaWAN Regional Parameters configuration for US915.
The standard deviation (σ) of each parameter was calculated to quantify the signal variability and determine link stability under different propagation conditions.
5.3. Time on Air Results
Table 9 presents an estimate of the daily transmission limits under TTN’s fair use policy for each node. The maximum number of daily transmissions each node can perform before reaching that limit was calculated based on the obtained ToA values and the 30 s in accordance with TTN’s Fair Access Policy. On the other hand, the maximum operating time before reaching the daily limit is calculated from the maximum number of transmissions and the configured send intervals: 60 s for the Smart Cap, 20 s for the Smart Cane, and 10 s for the Smart Glove.
The ToA value for each device varied with SF. The greater the transmission distance, the higher the recommended SF and, therefore, the greater the ToA. Similarly, nodes operating with higher SFs (SF8–SF9-SF10) have lower daily transmission capacity, confirming the inverse relationship between ToA and maximum message rate.
6. Discussion
6.1. Time-on-Air (ToA)
According to
Table 9, the daily transmission time allowed varies depending on the SF between 121 and 389 min for the Smart Cap, 27 and 176 min for the Smart Cane, and 30 and 97 min for the Smart Glove. The Smart Cap and Smart Glove nodes reached SF = 8 and SF = 9, respectively, in the tests. In the worst case scenario (SF = 9), both reach transmission times of approximately 121 and 30 min, respectively, while the Smart Cane has 27 min of continuous operation under SF = 10. In contrast, the best scenario (SF = 7), particularly for the Smart Glove, would allow communication to be maintained for 2 h.
Given that 100 packets were sent for each measurement point in the experiment and based on
Table 6,
Table 7 and
Table 8, the number of packets effectively transmitted at a distance of 400 m was evaluated, considering the worst case scenario due to the high dispersion factor values. In the Smart Cap, 89 and 11 packets were transmitted with SF = 8 and 9, respectively, with a total ToA duration of 15.3 s. In the Smart Cane, SF = 8, SF = 9, and SF = 10, 10, 22, 12, and 55 packets were sent, respectively, reaching a total ToA of 23.18 s. In the Smart Glove, SF = 7, SF = 8, and SF = 9, 22, 36, and 62 packets were sent, respectively, with a total ToA duration of 15.3 s. These results validate the test planning, justifying the decision to take measurements for four consecutive days at each point to avoid exceeding the fair access policy’s maximum transmission time.
Overall, the results in
Table 9 show that the daily transmission time is quite limited, which poses a challenge for the sustained use of assistive IoT in urban environments. Therefore, an alternative is proposed to operate the devices in burst mode so that they remain active only when the user is using them and remain idle for the rest of the time. This strategy not only optimizes energy consumption but also extends the system’s autonomy without compromising its functionality.
6.2. Scalability
Using Equation (6), the experimentally measured ToA (
Table 9) and the configured transmission intervals; the maximum number of nodes
that can coexist on the same channel while maintaining a
is estimated in
Table 10.
According to
Table 10, the best scenario is observed for the Smart Cap with SF = 7, where the low ToA and lower transmission frequency allow up to 41 nodes per channel (328 nodes in 8 channels). In contrast, the worst scenario corresponds to the Smart Glove with SF = 9 and Smart Cane with SF = 7, where the increase in ToA combined with a short transmission interval significantly increases the channel load, reducing capacity to only 3 nodes per channel. Thus, at shorter transmission intervals, the network becomes saturated more quickly. Therefore, based on the pure ALOHA analytical model and the experimentally measured ToA values, resizing the transmission intervals according to node density should be considered for future tests in order to avoid excessive channel occupancy.
6.3. Signal-to-Noise Ratio (SNR)
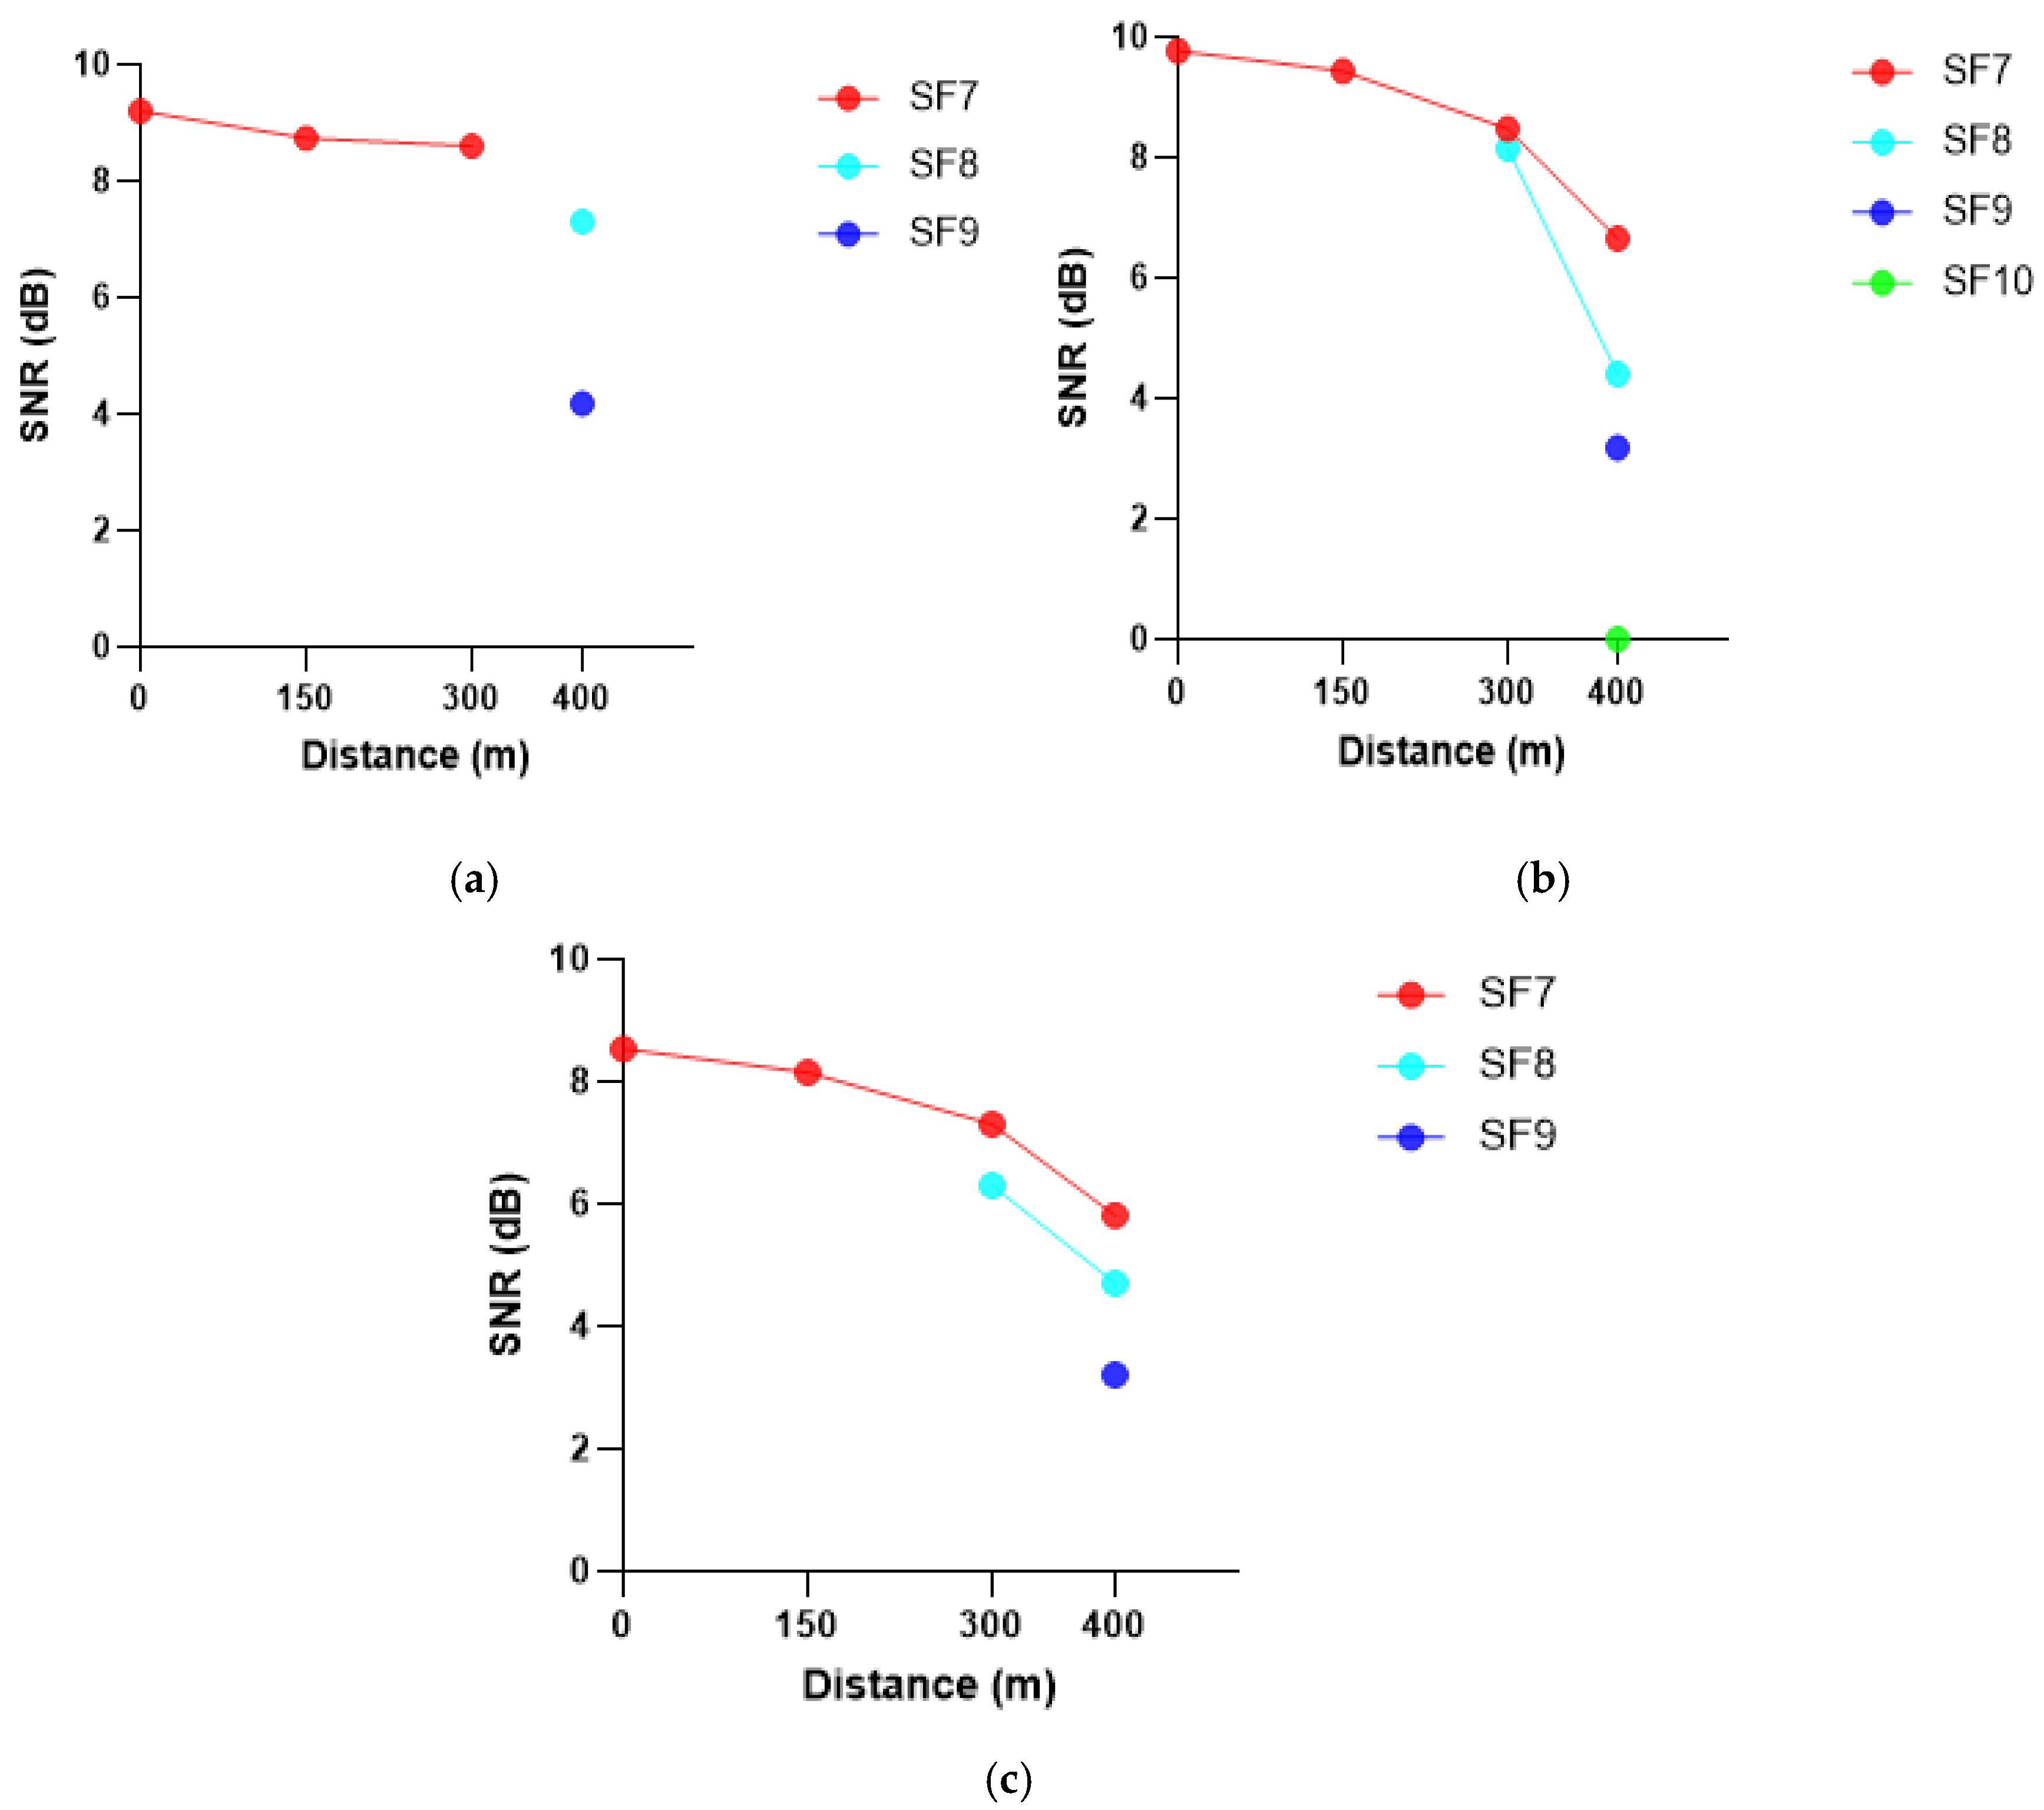
As shown in
Figure 12a–c, the SNR level decreases as the distance between the end devices and the base station increases, indicating that at greater distances, noise has a greater influence on the signal. At distances of 0, 150, 300, and 400 m and dispersion factors SF = 7, SF = 8, and SF = 9, a stable connection is maintained between the end devices and the gateway, achieving SNR values above 0 dB.
Similarly, in
Figure 12a–c, the color coding associated with each SF shows that SNR values tend to decrease with distance as the SF increases. This behavior is evident from the lowest SF values: in our case, SF7 presents the most favorable SNR, which is consistent with the short symbol duration (Tsym) and the link’s lower susceptibility to temporal variations in receiver synchronization. As the SF increases to 8 and 9, the airtime and Tsym increase, making the link progressively more sensitive to timing mismatches and channel fluctuations. This increased sensitivity translates into a gradual degradation of the SNR in these intermediate configurations. On the other hand, the behavior observed for SF = 10 shows a pronounced drop in SNR, particularly visible at 400 m in
Figure 12b. This reduction is not explained solely by the increase in SF or the greater distance. Experimental studies have shown that LoRa link quality critically depends on receiver synchronization and that synchronization failures intensify with high SFs and low-SNR conditions, affecting preamble detection and reducing the PRR [
31,
32]. Moreover, the longer airtime associated with high SFs increases the probability of temporal errors during reception, especially in environments with interference or channel fluctuations. Together, these factors explain the sharp decrease in SNR recorded when SF = 10 is used.
On the other hand, in
Table 6,
Table 7 and
Table 8, the standard-deviation (σ) columns of the SNR for distances of 0, 150, and 300 m with an SF = 7 show values below 1.5 dB, suggesting stable and predictable values. However, at 400 m, the high σ values suggest that the signal is not consistent, having a considerable change between measurements. Nevertheless, the obtained SNR values were compared with the theoretical sensitivity thresholds set for each SF in the LoRa standard. For a bandwidth of 125 kHz, receivers require minimum SNRs of 7.5 dB (SF7), 10 dB (SF8), 12.5 dB (SF9), and 15 dB (SF10) [
33]. Comparing these values with the measurements presented in
Figure 12a–c confirms that, even at 400 m, the recorded SNRs—between 3 and 8 dB for SF7–SF9 and around 0 dB for SF10—remain well above the theoretical sensitivity limits. This implies that although the link exhibits greater variability, the signal quality remains sufficient for packet reception.
Overall, the results show that the three end devices maintained adequate and acceptable SNR levels for reliable communication up to 300 and 400 m, respectively, confirming the stability of the LoRa link in controlled urban environments and its ability to maintain communication under moderately adverse channel conditions.
6.4. Received Signal Strength Indicator (RSSI)
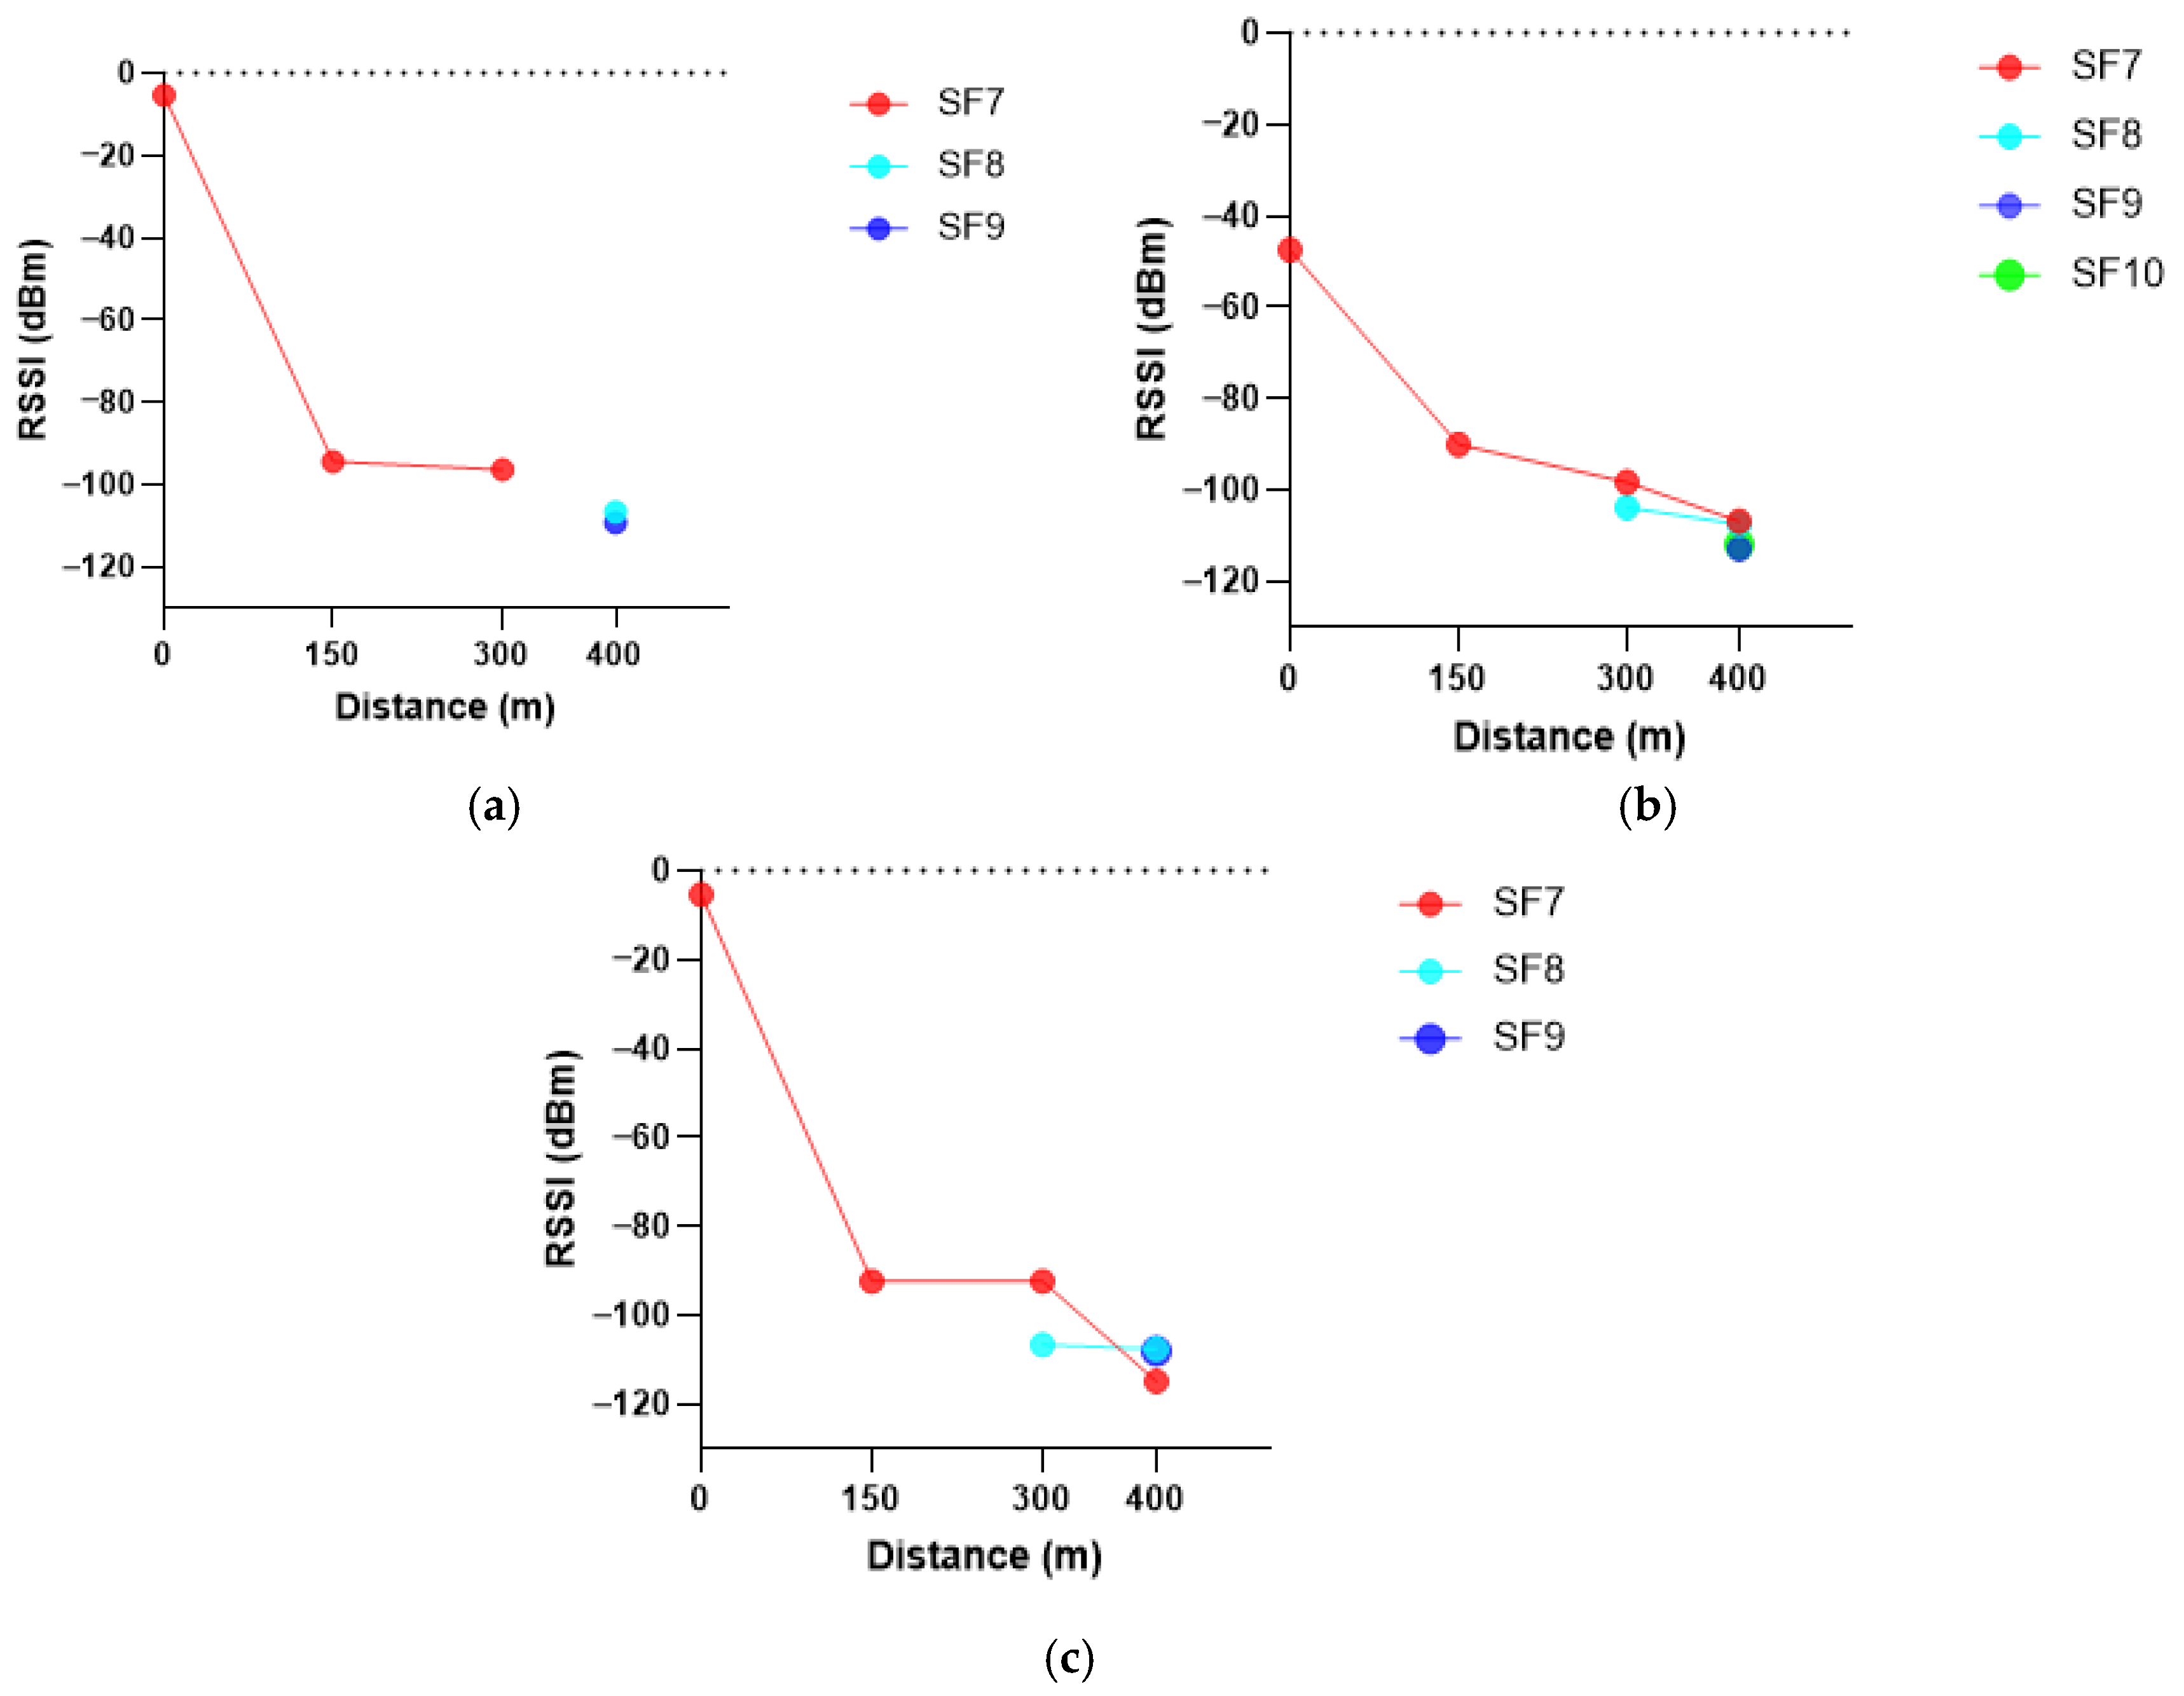
In the experiments conducted, the nodes continuously send uplink packets and gradually move away from the LoRa gateway location. As expected, the RSSI values decreased as the end devices moved away from the base station. As shown in
Figure 13a–c, the RSSI decreases abruptly at a distance of 150 m. It is important to note that this abrupt drop is due to the fact that, in this area, the signal starts to approach the noise level. This is confirmed by directly comparing the RSSI and SNR values. Finally, from 150 m onwards, the increase in RSSI values varies slowly.
For a dispersion factor of 7 and distances between 0, 150, and 300 m, RSSI values between approximately −5 and −98 dBm are observed, which are generally considered acceptable for reliable communication.
The minimum values, close to −110 dBm at a distance of 400 m for SF = 8, SF = 9, and SF = 10, reflect more difficult propagation conditions and weaker received signals, likely influenced by partial obstructions or environmental variations. Despite these low power levels, the LoRaWAN network maintained an acceptable PRR during the measurements.
Similarly, in
Table 6,
Table 7 and
Table 8, standard deviation σ values below 2 dB indicate stable and predictable signal strength, whereas those above 4 dB suggest channel fluctuations possibly linked to diffraction or multipath. Up to 300 m, the combination of RSSI and SNR values, along with the high PRR reported in
Table 6,
Table 7 and
Table 8, remained within the appropriate ranges for reliable communication, suggesting a sufficient link for the intended application within the campus environment. Beyond this distance, the signal power decreases, defining the system’s effective operational limit under the evaluated experimental conditions.
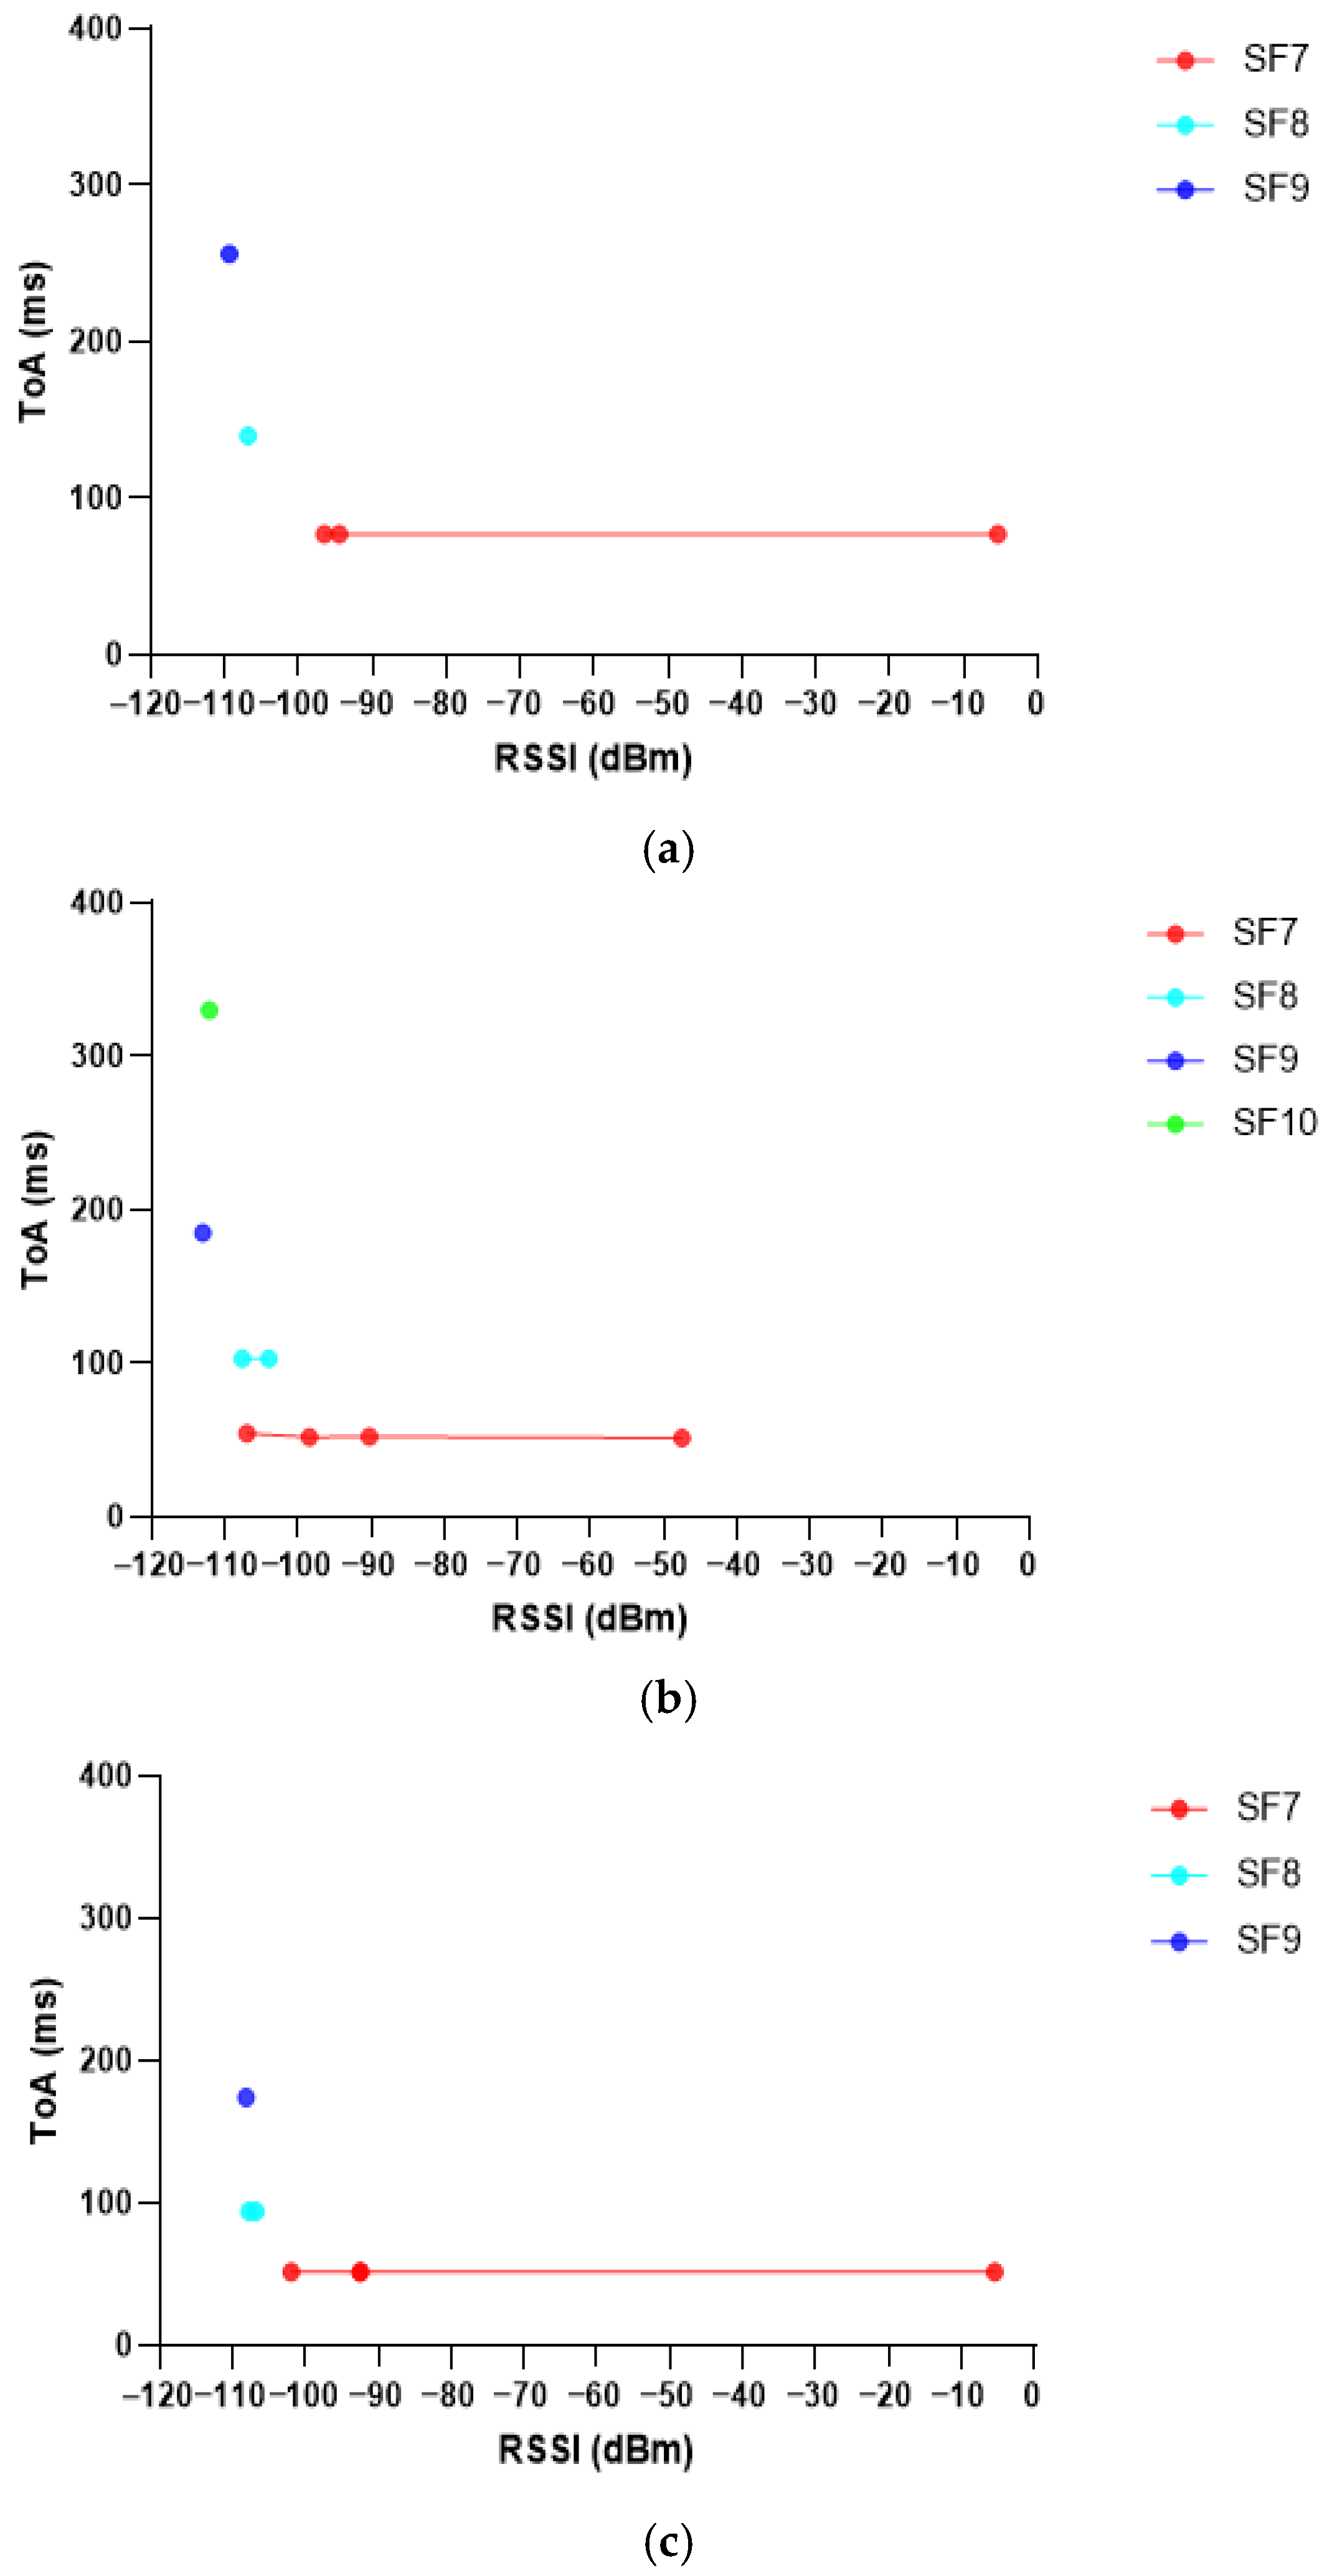
Figure 14 shows the relationship between RSSI, ToA, and the SF assigned by the system. In
Figure 14b, it can be seen that RSSI values close to −112 dBm and −113 dBm are associated with longer transmission times when SF 9 and SF 10 are used. In contrast, with SF 7 and SF 8, the airtimes are shorter and the RSSI values remain above 110 dBm, reflecting more stable links and a more efficient use of the channel. This behavior aligns with the operational principle of ADR: when the link has good quality, the system selects low SFs, which reduces ToA and improves spectral efficiency; when link quality degrades, the SF increases to maintain communication despite a longer transmission time.
The results also relate to what was discussed in
Section 6.2: the simultaneous decrease in RSSI and SNR under adverse conditions is not only explained by the loss of received power but also by synchronization failures at the receiver, including more pronounced temporal mismatches at high SF, which increase the difficulty of preamble detection and increase the risk of errors during reception. This interaction between received power, temporal stability, and demodulation capability justifies the greater dispersion and higher transmission times observed for SF 9 and SF 10.
6.5. Comparison Between the End Nodes
The end nodes show important differences in SNR, RSSI, and PRR due to their configurations and payload. The Smart Cap, with a lower sending frequency (every 60 s) and payload of 22 bytes, showed SNR values above 8.6 dB up to 300 m, decreasing to 4.18 dB at 400 m with a probability of errors. Its RSSI remained at unreliable levels due to external interference, from −94.53 dBm to −115 dBm. In addition, the PRR was 100% up to 200 m, 98% at 300 m and 90% at 400 m, confirming its stability in field conditions.
The smart cane, with a higher frequency (every 20 s) and intermediate payload (10 bytes), showed a more marked decrease as the distance increased. It started with an SNR of 10.1 dB at 100 m and dropped to −9.22 dB at 400 m, while its RSSI went from −83.08 dBm to −114.51 dBm. In addition, its PRR dropped from 100% (up to 100 m) to 97% (100–200 m) and then remained at 85% for the 200–400 m ranges. These results indicate that this node is more prone to packet loss.
The Smart Glove maintained good performance despite transmitting every 10 s due to its low payload (3 bytes). The SNR was stable up to 300 m (maximum of 9.5 dB) and decreased to 7 dB at 400 m, i.e., with the probability of errors. The RSSI ranged from −88 dBm to −110 dBm which indicates an unreliable signal due to interference from other technologies in the same band. In terms of PRR, it achieved 100% up to 200 m, 95% at 300 m, and 91% at 400 m, and it was the node with the best relative performance compared to its load and transmission frequency.
Although the transmission frequency does not directly affect parameters such as RSSI or SNR—which depend mainly on distance, obstacles, and transmission power—it can influence the Packet Reception Rate (PRR), since a lower transmission frequency reduces the probability of collisions between packets. Therefore, a longer transmission interval can contribute to greater data delivery reliability without directly modifying the signal quality. This information is relevant for the campus monitoring system, where the number of active devices could increase over time. Correctly adjusting the transmission interval helps maintain network scalability and reliability, ensuring that data from users with disabilities are delivered reliably.
7. Conclusions
This article evaluates the performance of a LoRaWAN network in terms of RSSI, SNR, PRR, and ToA to assist visually impaired people on a university campus. Three terminal nodes connected to a base station were used, employing a LoRaWAN server from The Things Network and the Ubidots platform for data monitoring and visualization. Measurements were taken at four points—in particular, at distances of 0 m, 150 m, 300 m, and 400 m from the base station—and the ADR mechanism was activated. The results confirm the ability of LoRaWAN to maintain reliable communication in assistive IoT systems, even under variable propagation conditions. In particular, the bonds remained stable up to 300 m and had scattered and unstable values at 400 m.
The tests showed that the channel conditions became more variable at the three nodes as the distance increased. SNR values remain stable up to 300 m, indicating a stable communication channel with low variability. However, at 400 m, greater dispersion is observed. This degradation is also reflected in the signal strength (RSSI), which decreases progressively until reaching minimum values of around −110 dBm, and in the packet reception rate (PRR), which remains above 96% up to 300 m but drops significantly at longer distances.
The combined behavior of RSSI, SNR, SF, ToA, and PRR demonstrates LoRaWAN’s ability to adapt to adverse propagation conditions: when the signal weakens, the system increases the SF to preserve link integrity, compensating for packet losses at the expense of longer transmission times. This dynamic balance between reliability, spectral efficiency, and energy consumption is essential for the sustained operation of assistive IoT. Finally, the overall performance was sufficient to ensure operational viability within the university environment. However, in the event of an increase in the number of end nodes, it is necessary to resize the transmission intervals according to node density in order to avoid excessive channel occupancy and preserve network performance.
On the other hand, in the context of application on the university campus, it is proposed to use a burst mode operation, only activating the devices during their effective use to optimize energy consumption and comply with the time restrictions imposed by TTN’s fair access policy. This recommendation arises from the experimental results, where the analysis of ToA behavior shows an increase associated with the SF assigned by the ADR mechanism, which prolongs the transmission time and, consequently, limits the number of daily transmissions allowed by the network.
For future work, we propose increasing the number of nodes in the LoRaWAN network, using optimized antennas, reducing the size of the end nodes, and monitoring their performance under higher traffic conditions. Subsequent analyses will also consider the evaluation of new features or devices with potential impact on more than 26,000 university students. In addition, indoor monitoring will be a key line of work; in subsequent phases, tests will be carried out inside buildings to assess actual coverage and, if necessary, implement intermediate gateways or adjustments to the network topology.