Article

Influence of the Magnetic Field Topology in the Evolution of Small-Scale Two-Fluid Jets in the Solar Atmosphere

by
Elton Everardo Díaz-Figueroa
1,
Gonzalo Ares de Parga
1 and
José Juan González-Avilés
2,*
1
Escuela Superior de Física y Matemáticas, Instituto Politécnico Nacional, Mexico City C.P. 07738, Mexico
2
Investigadores por México-CONACYT, SCIESMEX, LANCE, Instituto de Geofísica, Universidad Nacional Autónoma de México, Morelia Michoacán C.P. 58190, Mexico
*
Author to whom correspondence should be addressed.
Physics 2023, 5(1), 261-275; https://doi.org/10.3390/physics5010020
Submission received: 6 December 2022 / Revised: 25 January 2023 / Accepted: 31 January 2023 / Published: 27 February 2023

Abstract

:
In this paper, a series of numerical simulations is performed to recreate small-scale two-fluid jets using the JOANNA code, considering the magnetohydrodynamics of two fluids (ions plus electrons and neutral particles). First, the jets are excited in a uniform magnetic field by using velocity pulse perturbations located at y 0 = 1.3, 1.5, and 1.8 Mm, considering the base of the photosphere at y = 0 . Then, the excitation of the jets is repeated in a magnetic field that mimics a flux tube. Mainly, the jets excited at the upper chromosphere ( y 1.8 Mm) reach lower heights than those excited at the lower chromosphere ( y 1.3 Mm); this is due to the higher initial vertical location because of the lesser amount of plasma dragging. In both scenarios, the dynamics of the neutral particles and ions show similar behavior, however, one can still identify some differences in the velocity drift, which in the simulations here is of the order of 10 3 km/s at the tips of the jets once they reached their maximum heights. In addition, the heat due to the friction between ions and neutrals ( Q i , n i n ) is estimated to be of the order of 0.002–0.06 W/m 3 . However, it hardly contributes to the heating of the surroundings of the solar corona. The jets in the two magnetic environments do not show substantial differences other than a slight variation in the maximum heights reached, particularly in the uniform magnetic field scenario. Finally, the maximum heights reached by the three different jets are found in the range of some morphological parameters corresponding to macrospicules, Type I spicules, and Type II spicules.

1. Introduction

Solar jet-type phenomena are ubiquitous in the solar atmosphere, which in turn is the main topic of numerous investigations that study the origin and evolution of solar jets (see, e.g., [1,2] and references therein). Although there are many open questions about the nature of the solar jets, enormous progress has been made in understanding their dynamics, particularly in 2D (2-dimensional), 2.5D, and 3D magnetohydrodynamics (MHD) numerical simulations. These models have swept a broad spectrum of complexity from ideal MHD to resistive MHD and two-fluid MHD (see, e.g., [3,4,5,6,7,8,9]).
Jet-type phenomena have been proposed as promising candidates to generate large amounts of heat at the upper atmospheric layers of the Sun [10]. The frequency of occurrence of the jets is high compared to other solar phenomena, which gives the impression that jets are ongoing events that could represent a continuous source of energy [11]. These collimated plasma jets are called “spicules” and are cataloged according to their different characteristics [12,13,14]. The spicules were first described by Secchi [15], but they owe their name thanks to Roberts [16]. Later, Beckers [10] developed a theoretical and observational analysis to show that the chromosphere is mostly populated by these elongated structures that may supply plasma to the corona. The first spicules observed, also called Type I spicules, can reach heights in the range of 7000–13,000 km [12], diameters of 500–2000 km [17], vertical speeds of 25 km/s, lifetimes of 1–10 min, temperatures of 5000–15,000 K, and densities of 3 × 10 13 g/cm 3 that remain quasi-constant with height [12,18]. Meantime, the Type II spicules, which could be generated due to magnetic reconnection, reach heights from 1000 to 7000 km above the chromosphere, in a range of vertical speeds between 40 km/s and 300 km/s, with the bulk between 50 and 150 km/s, lifetimes from 10 to 150 s, with characteristic diameters less than 200 km, temperatures of approximately 10 4 K [5,13,19,20,21,22]. Moreover, the macrospicules can reach heights of 7–70 Mm and speeds of 10–150 km/s, and they can have lifetimes of 3–45 min, according to observations and numerical simulations [14,23,24]. Finally, there is also another complex chromospheric ejection, known as surges, which are seen as darkenings in the blue/red wings of the line with line-of-sight (LOS) apparent velocities of a few to several tens of km/s on areas with projected lengths of 10–50 Mm [25]. Surges can also consist of small-scale thread-like structures that appear to be related to shocks and Kelvin–Helmholtz instabilities [26,27,28].
The origin of the small-scale plasma jets found in the lower solar atmosphere is still a matter of debate. Therefore, there is still room for new models, such as the two-fluid approximation, which includes the dynamics of neutrals apart from the ions, and therefore is more realistic for studying the generation, evolution, and morphology of small-scale jets from the chromosphere to the solar corona. The fluid two-approximationis essential in the modeling of partially ionized plasmas in astrophysical scenarios in general (see, e.g., [29]). For example, the authors in Ref. [30] uses numerical simulations using the two-fluid equations in 2D Cartesian geometry to study the formation and evolution of solar spicules. It is found that the simulated spicule consists of a dense, cold core dominated by neutrals. More recently, the authors in Ref. [31] studies the formation and evolution of jets employing localized non-linear Gaussian pulses of ion and neutral pressures initially launched from the magnetic null point of a potential arcade in a partially ionized solar atmosphere. The study finds that the shock propagates upwards into the solar corona and lifts the cold and dense chromospheric plasma in the form of a collimated jet with an inverted-Y shape. These kinds of inverted-Y jets and their heating may explain the properties of some jets observed in the solar atmosphere. Recent studies related to investigations emphasize the two-fluid effects playing an essential role in the non-linear regime, particularly in the context of wave damping and plasma heating of the solar chromosphere, see, e.g., [32,33,34].
In this paper, with the use of the JOANNA code [35], we solve the two-fluid MHD equations numerically to simulate different chromospheric small-scale two-fluid jets excited at three different vertical locations ( y 0 = 1.3 , 1.5 , 1.8 Mm) to analyze the effect two different magnetic configurations have on the evolution and morphology of the jets. The paper is organized as follows. First, Section 2 describes the two-fluid equations, the numerical methods, the perturbations, and the magnetic field configurations. Then, Section 3 presents the most significant results of the numerical simulations for the two different magnetic field configurations. Next, Section 4 discusses the most relevant differences between the two simulation cases. Finally, Section 5 draws the results obtained here and gives the conclusions.

2. Model and Methods

2.1. The System of Two-Fluid Equations

Here, we consider a stratified solar atmosphere composed of two fluids, i.e., ions plus electrons and neutral particles (neutrals). The system of the two-fluid equations is expressed as follows [30,36,37]:
ρ i t + · ( ρ i V i ) = 0 ,
ρ n t + · ( ρ n V n ) = 0 ,
ρ i V i t + · ( ρ i V i V i + p i e I ) 1 μ ( × B ) × B + ρ i g = S i n ,
ρ n V n t + · ( ρ n V n V n + p n I ) + ρ n g = S n i ,
p i t + V i · p i + γ p i · V i = ( γ 1 ) Q i i n ,
p n t + V n · p n + γ p n · V n = ( γ 1 ) Q n i n ,
B t = × ( V i × B ) ,
· B = 0 ,
where ρ i , n , p i , n , μ , B , V i , n , S i n , Q i , n i n represent the ion (i) and neutral (n) densities, gas pressures, the magnetic permeability of the medium, magnetic field, the ion and neutral velocities, the collisional momentum, and the heat generation due to collisions between species, respectively. Note that the electrical resistivity is not included in the simulations. Besides, t stands for the time and γ = 5 / 3 is the adiabatic index.
The collisional momentum, S i n , between particles (ions and neutrals), specifically in Equation (3), is defined as S i n = ν i n ρ i ( V i V n ) , where the collision frequency between species is ν i n = α i n / ρ n . with α i n = 4 3 σ i n m p + m n 8 k B π T i m i + T n m n ρ i ρ n , where, σ i n is the collisional cross-section between ions and neutrals and takes a value of 0.75 × 10 18 m 2 [37]. T i , n denotes the ion and neutral particle temperatures, respectively; m i = m H μ i , m n = m H μ n , with m H being the hydrogen mass, which is the main ingredient of the gas, and therefore m n m i = m H = m p (with m p being the proton mass), and k B is the Boltzmann constant. The mean masses are μ i 0.58 and μ n 1.21 .
Finally, the heat generation due to collisions between species is defined, respectively, as
Q i i n = α i n 1 2 | V i V n | 2 + 3 2 k B m i ( T n T i ) ,
Q n i n = α i n 1 2 | V i V n | 2 + 3 2 k B m i ( T i T n ) ,
where I is a unity matrix. A gravitational acceleration acting only on the y-axis is taken ( g [ 0 , g ] ) to be g = 274 m/s 2 . The gas pressures are defined here by using the ideal gas laws:
p i = k B m i ρ i T i ,
p n = k B m n ρ n T n .

2.2. Model of the Solar Atmosphere

At the initial time of simulations, it was assumed that the solar atmosphere is in hydrostatic equilibrium, i.e., the ion and neutral particle velocities were set equal to zero: V i = V n = 0 . Then, considering the ideal gas laws for ions (11) and neutrals (12), and taking into account the y-components of the hydrostatic equation, p i , n + ρ i , n g = 0 , one arrives at the following expressions for the equilibrium gas pressures:
p n ( y ) = p 0 n exp y 0 y d y Λ n ( y ) ,
p i ( y ) = p 0 i exp y 0 y d y Λ i ( y ) .
Here,
Λ i ( y ) = k B T i ( y ) m H μ i g and Λ n ( y ) = k B T n ( y ) m H μ n g
are the pressure scale heights, and p 0 i , n denote the gas pressures at the reference level y 0 = 10 Mm. Specifically, in this study, the semi-empirical model of Table 26 from Ref. [38] is adopted for the temperature field. We consider that temperatures of ions and neutrals are initially equal (at t = 0 ), i.e., they are in thermal equilibrium, and T i = T n = T are set here. Figure 1 displays equilibrium profiles, including the mass densities for ions and neutrals and the ionization fraction, ρ i / ρ n .

2.3. Magnetic Field Configurations

In this study, the simulations for two magnetic fields was performed: (i) constant vertical field and (ii) flux tube. For the constant magnetic field,
B [ 0 , B 0 ] ,
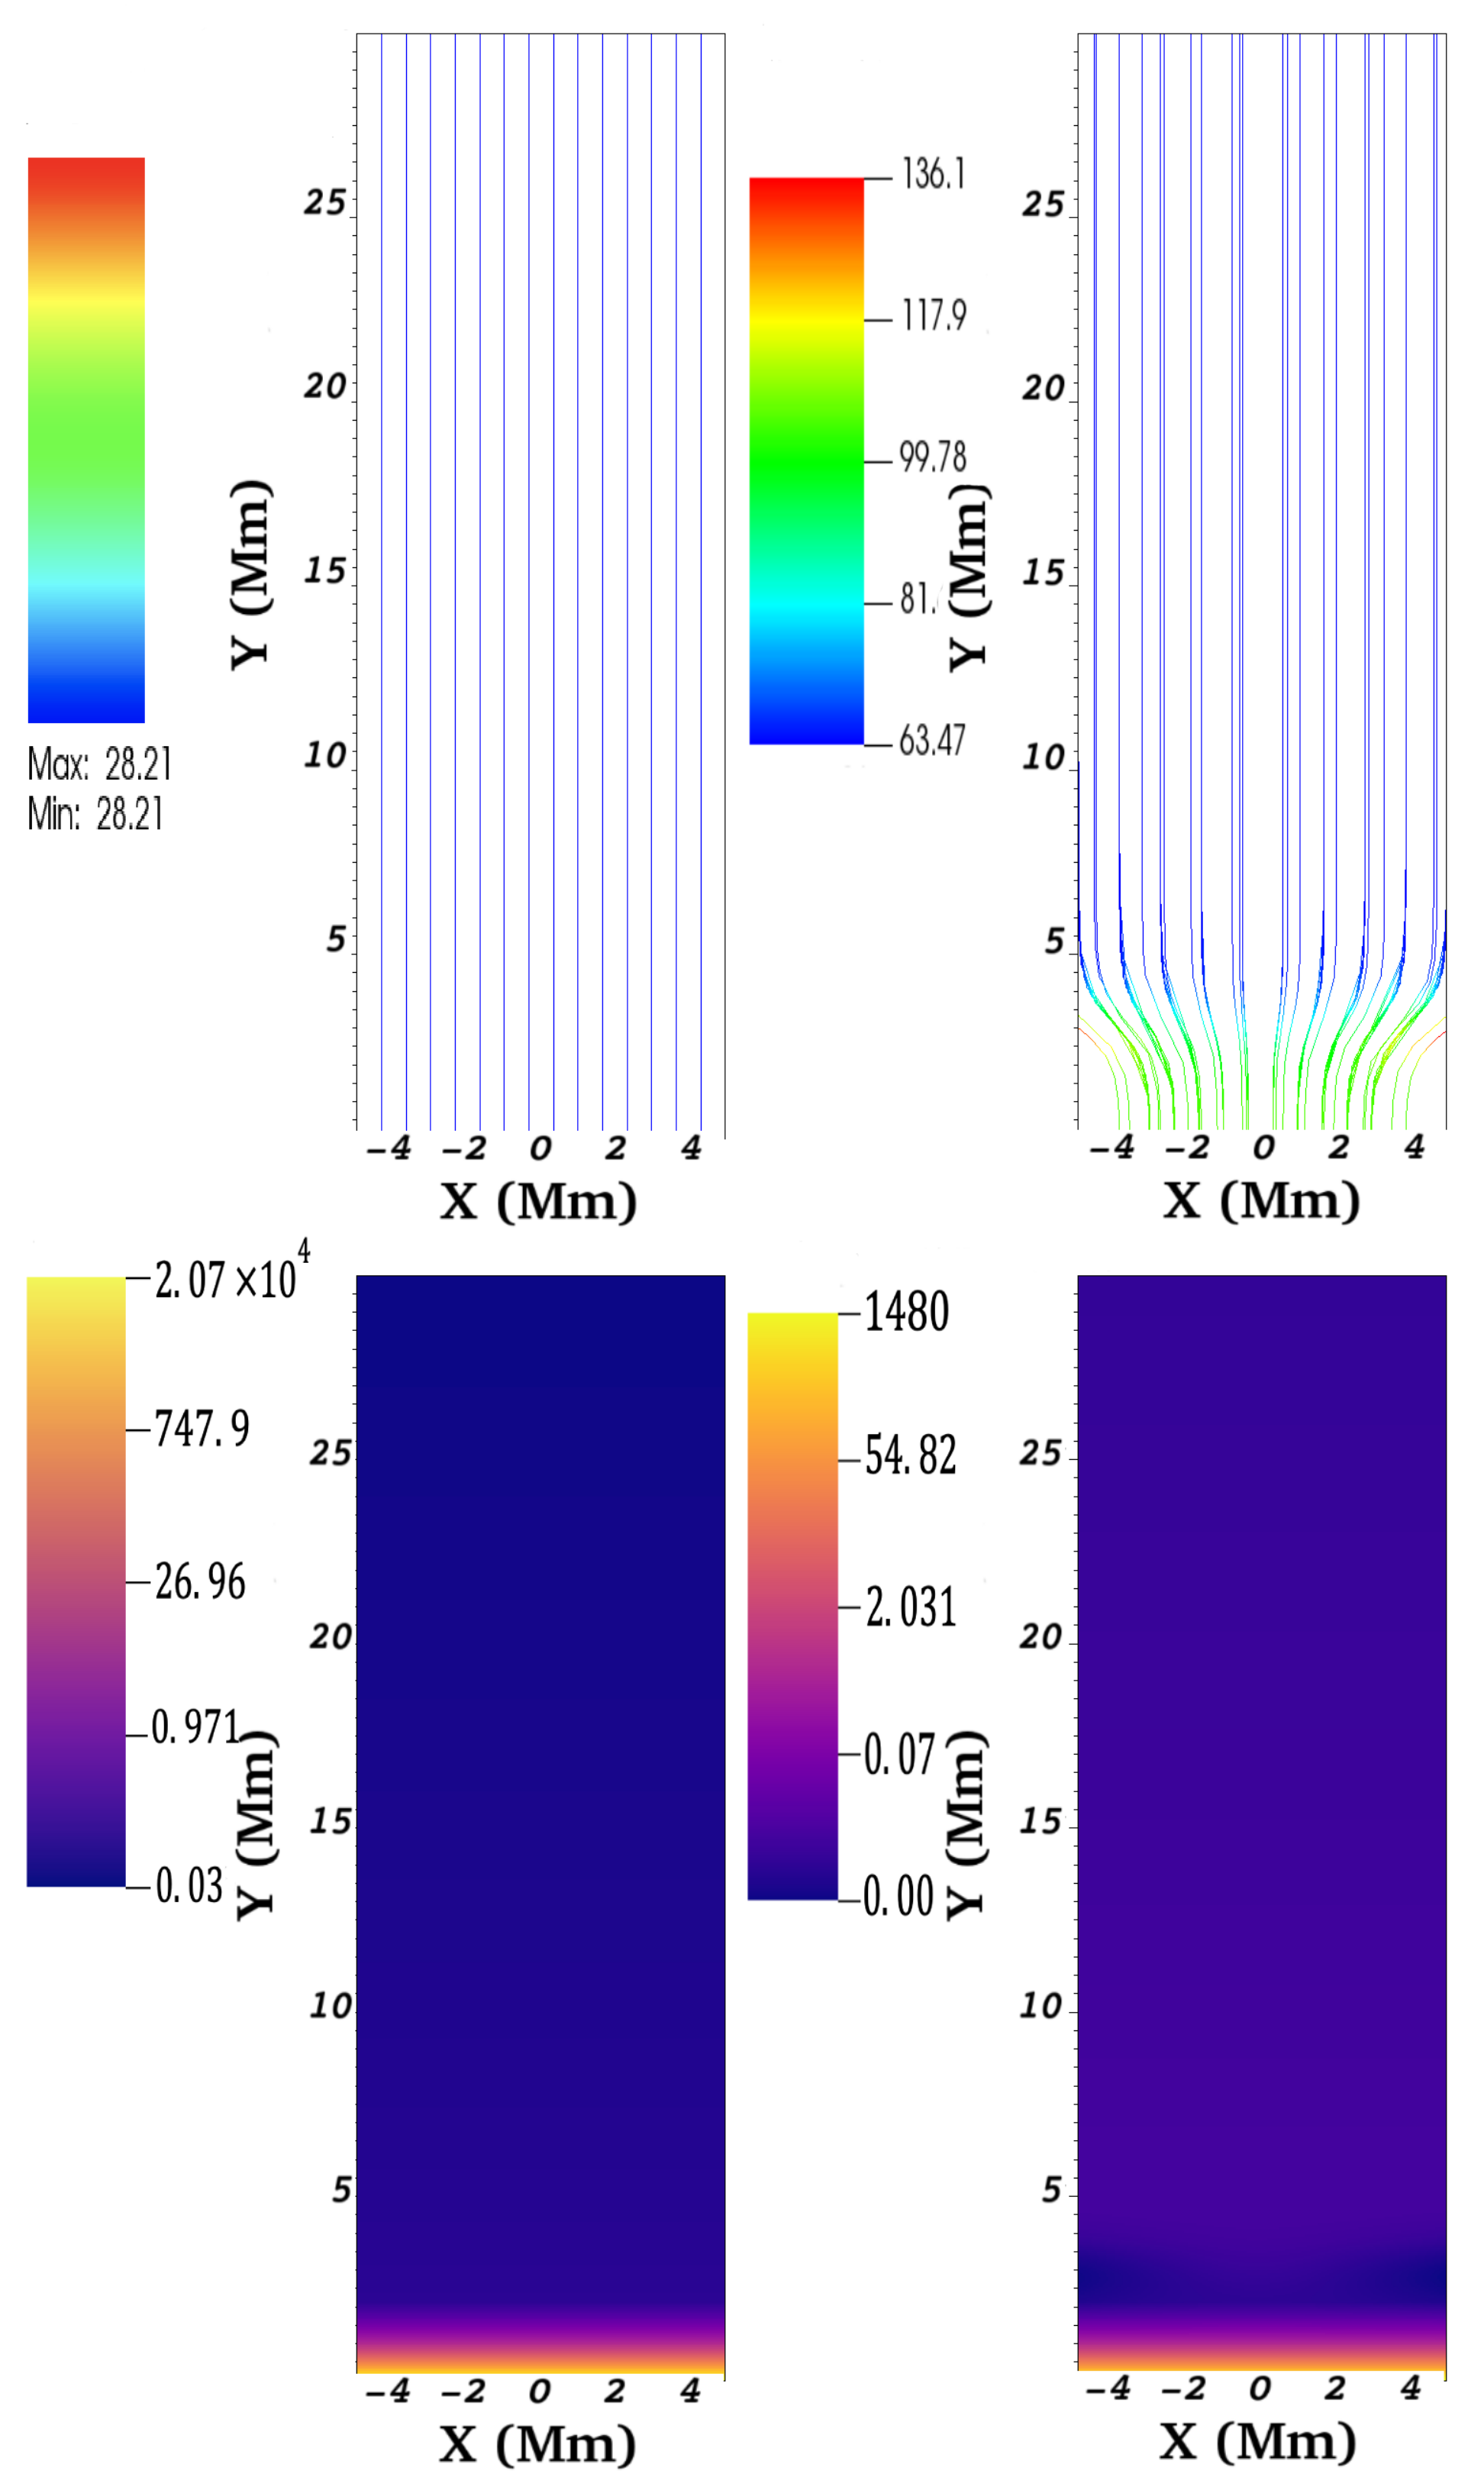
is used where B 0 = 30 G, displayed in of Figure 2, upper left. For the flux tube, the following normalized expressions in Cartesian coordinates,
B x = 0.075 x ¯ B 0 sech 2 ( y ¯ 3 ) ,
B y = B 0 ( 0.3 0.075 tanh ( y ¯ 3 ) ) .
are used which recreate a flux tube in a particular simplified geometric way. Here, x ¯ = x / L , y ¯ = y / L , and L = 10 6 m. B 0 = 100 G represents the magnitude of the field in the lower part of the flux tube, i.e., in the photosphere. This magnetic field satisfies the divergence-free condition, · B = 0 , and it is analogous to an inverted magnetic bottle that can accelerate to the charged particles at the footpoints of the flux tubes where the jets are emerging. Despite that × B 0 and ( × B ) × B / μ 0 0 , there should be no significant effects on the evolution of the jet, since if one calculates the curl of B for a two-dimensional Cartesian system, one gets × B = ( B x / y )   z ^ , thus
× B = 1.5 × 10 13 x ¯ B 0 tanh ( y ¯ 3 ) sec h 2 ( y ¯ 3 ) z ^ .
For 1 μ 0 ( × B ) × B = 1 μ 0 B y B x y B y B y x x ^ + 1 μ 0 B x B x y + B x B y x y ^ , then
1 μ 0 ( × B ) × B = ( 3.5 × 10 8 B 0 2 x ¯ sech 2 ( y ¯ 3 ) tanh ( y ¯ 3 ) + 8.95 × 9 B 0 2 x ¯ sech 2 ( y ¯ 3 ) tanh 2 ( y ¯ 3 ) ) x ^ + ( 8.95 × 15 B 0 2 x ¯ 2 sech 4 ( y ¯ 3 ) tanh ( y ¯ 3 ) ) y ^ .
For B 0 = 100 , G = 0.01 T, and μ 0 = 1.256 × 10 6 N/A 2 , in the case of Equation (19), the maximum value is around 10 15 T/m, while for Equation (20), the maximum value of the Lorentz force in the x direction is of the order of 10 12 N/m 3 , while in the y direction, it is of the order of 10 17 N/m 3 . Thus, the current density and the Lorentz force are negligible compared to the gravity force, balanced by the pressure of the plasma. Let us explicitly demonstrate this by calculating ρ i g . Supposing the value of the ion density, ρ i 6 × 10 10 kg / m 3 ) and the gravitational acceleration, g = 274 m/s 2   y ^ , at 1.3 Mm, where the velocity pulse that generates one of the jets under study is used, one gets ρ i g = 1.6 × 10 7 N/m 3   y ^ , i.e., is about ten orders of magnitude greater than the Lorentz force acting in the y direction. Therefore, due to a much larger order of magnitude of the force of gravity ( ρ i g ( × B ) × B / μ ), one can consider that the magnetic flux tube model is close enough to equilibrium, i.e., actually force-free, at t = 0 . Then, the nature of the spicule is subject primarily to the velocity pulse but not to the currents and forces provided by the flux tube.
The magnetic field is intense at ( x , y ) = ( 0 , 0 ) Mm, where the field lines open upwards, reaching a quasi-constant value for y 3 Mm. The magnetic field lines of the flux tube are shown in Figure 2, upper right. In addition, the plasma- β ,
β ( x , y ) = p i ( y ) + p n ( y ) B 2 / 2 .
helps estimating the ratio between ion and neutral pressures to magnetic pressure. Here, the pressures p i , n ( y ) are defined by Equations (13) and (14), and B 2 = ( B x 2 + B y 2 ) .
Figure 2, lower, displays the spatial profiles of plasma- β for both magnetic field configurations, where one observes β > 1 in the lower atmosphere (the photosphere and the chromosphere) for both cases. Otherwise, β < 1 in the solar corona ( y > 2.1 Mm). Such behavior of plasma β is consistent with a vertical dominant magnetic field, as shown in Ref. [30].

2.4. Perturbations

In the simulations here, the hydrostatic equilibrium atmosphere is perturbed, initially (at t = 0 ), by localized Gaussian pulses in ion and neutral vertical velocities, given as
v y n , i ( x , y , t = 0 ) = A v exp ( x x 0 ) 2 + ( y y 0 ) 2 w 2 .
Here, A v denote the amplitudes of the pulses, ( x 0 , y 0 ) are their positions, and w denote their widths. The pulses are located at x 0 = 0 and y 0 = 1.3 , 1.5 , and 1.8 Mm for the three cases, and w = 0.3 Mm and A v = 100 km/s are hold fixed; this velocity value falls in the range of velocities of Type II spicules [19].

2.5. Numerical Methods

To solve the two-fluid Equations (1)–(8) numerically, the JOANNA code [35] was employed. In all simulations, the Courant–Friedrichs–Levy (CFL) number was set equal to 0.9 and choose the third-order strong stability preserving Runge–Kutta (SSP-RK3) time integrator [39]. Additionally, the Harten–Lax–van Leer discontinuities (HLLD) approximate Riemann solver [40] was adopted in combination with a linear reconstruction and the minmod limiter. To control numerically the growth of the solenoidal constraint condition given by Equation (8), the extended generalized Lagrange multiplier method [41] is used. This method is robust in low plasma- β (∼10 3 10 2 ) regions, as implied in the solar corona; see, for example, Figure 2, lower.
The simulations was carried out in the domain x [ 5 , 5 ] Mm, y [ 0 , 30 ] Mm, in a uniform grid, which is covered by 200 × 600 cells. Here, y = 0 represents the bottom of the photosphere. Next, the outflow boundary conditions was imposed at the side edges specified by x = 5 Mm and x = 5 Mm. Finally, all the plasma quantities were set to their equilibrium values at the bottom and top boundaries delimited by y = 0 and y = 30 Mm.

3. Results of the Numerical Simulations

A series of simulations was performed for the case when the collisions between ions and neutrals are considered [30,42]. In particular, the following two scenarios were defined: (i) uniform magnetic field and (ii) flux tube-type configuration. For each of the two scenarios, three different simulations were perfomed corresponding to three different vertical locations ( y 0 = 1.3 , 1.5 , and 1.8 Mm) of the velocity pulses at the initial time, t = 0 , within the range 0.6 y 2.5 Mm that covers the chromosphere. These velocity perturbations give a rise to the jets that are of interest for this analysis (hereafter called Jet1, Jet2, and Jet3 each corresponding to values of y 0 listed above). The following Subsections describe the results of the numerical simulations under the two magnetic scenarios (i) and (ii) above.

3.1. Uniform Magnetic Field

Here, a uniform magnetic field implementation is considetred to observe the behavior of jets in an environment where the magnetic field lines are straight and constant. Actually, the magnetic conditions of the chromosphere are complex. However, in some simulations, such as in studies [24,43], there are a few bounded regions where some jets evolve within field lines that vary smoothly. Therefore, the point of the current simulations paper was to explore these conditions in a more general context to have as a control test in a magnetically uniform environment. The latter is useful to make the comparison with a more complex magnetic field that mimics a flux tube, as this is described in Section 3.2 below.
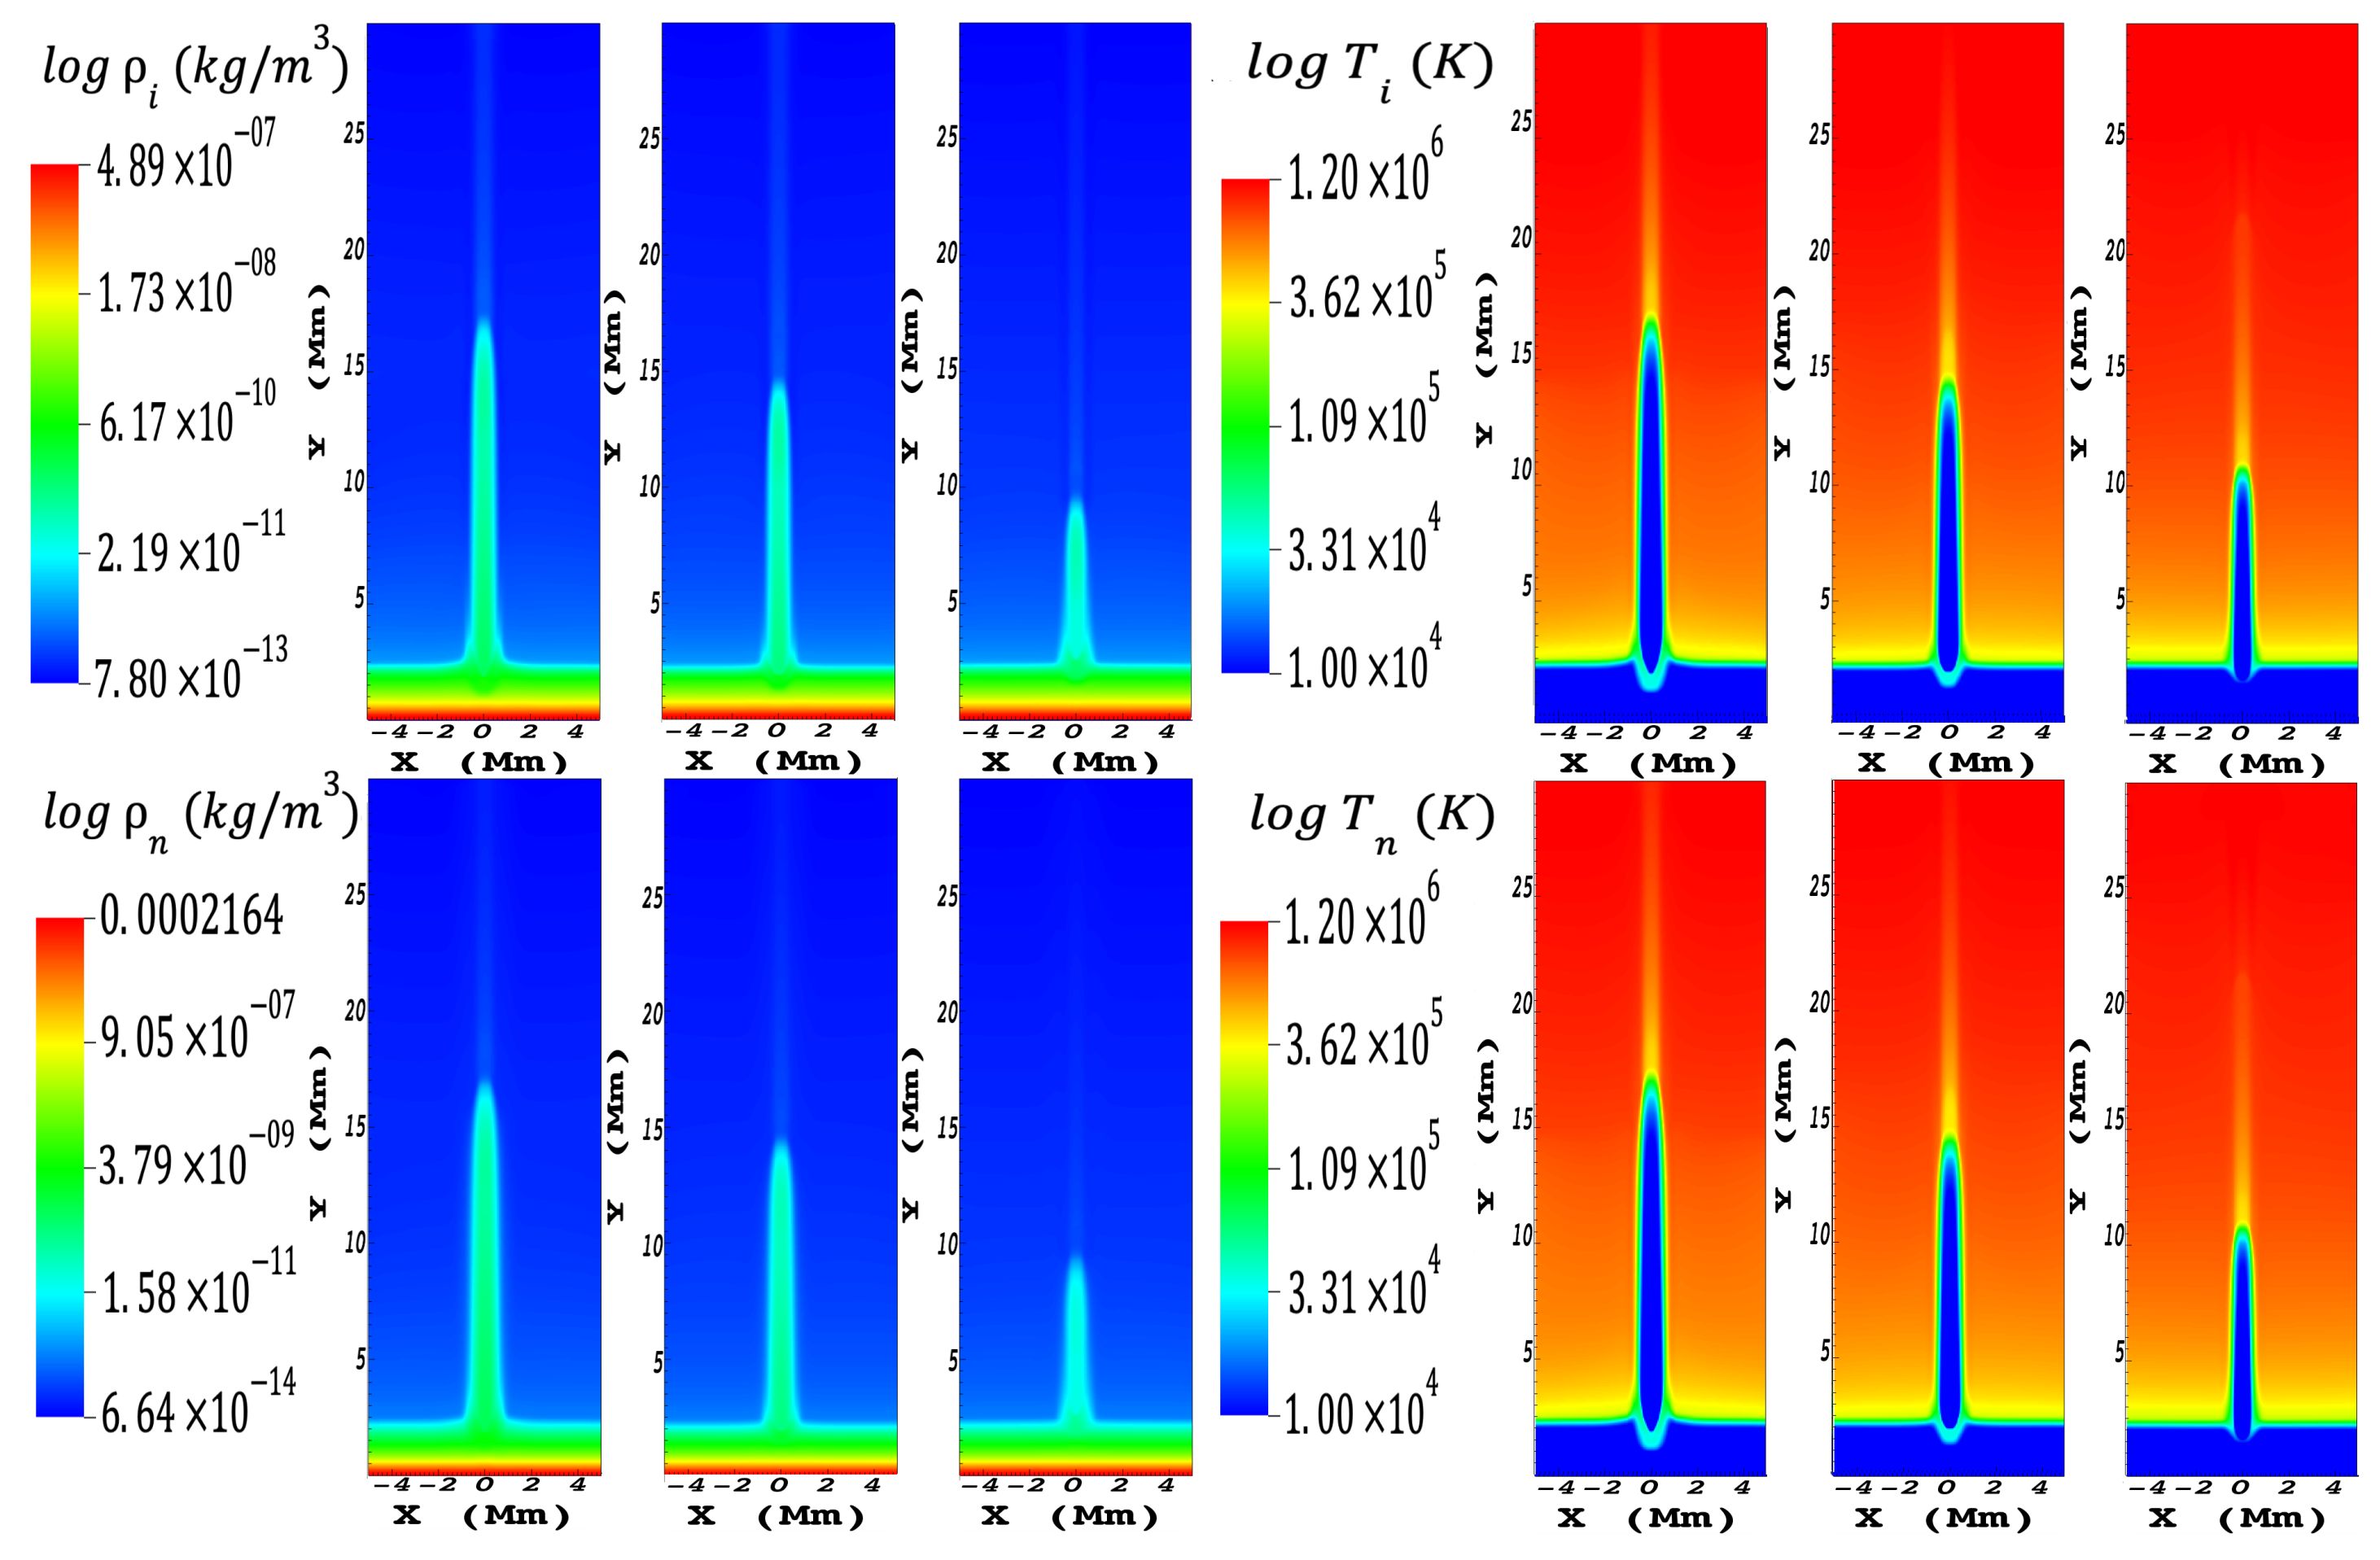
Three simulations were performed for the vertical magnetic field by launching the simulations with a velocity pulse for ions and neutrals with an amplitude A v = 100 km/s at different vertical positions, namely at y 0 = 1.3 , 1.5 , and 1.8 Mm. A uniform magnetic field B [ 0 , B 0 ] was set to B 0 = 30 G, and the pulses were launched in a region where the condition β < 1 is satisfied; see Figure 2, lower left. The simulations were ran up to a physical time of t f = 600 s. Figure 3, left, shows the logarithm of the mass density for ions, ρ i (Figure 2, upper left), and neutrals, ρ n (Figure 2, lower left), of Jet1, Jet2, and Jet3, as indicated. Each snapshot shows the maximum heights of the jets, ( h max ) for both types of fluids. The times, at which Jet1, Jet2, and Jet3 reached their maximum heights, are t = 300 s, t = 270 s, and t = 210 s, respectively. For this simulation, S n i 0 allows the collision between the fluids and the exchange of momentum between the ions and neutrals. Both types of fluids that make up the jets reach equal heights, evidencing the coupling of particles and collimating equally to the neutral part even after the times when the maximum heights are reached. As discussed in Ref. [37], when the charged particles act over neutrals, the species show a joint dynamicity. The temperatures in the cores of the jets remain constant throughout the evolution, see Figure 3. However, on the tips, one observes the temperatures up to (3.6–6.5) × 10 5 K; being coupled, ions and neutrals exhibit collective behavior.

3.2. Flux Tube-Type Configuration

As found in some studies [43,44], the magnetic configuration over spicule-type jets evolves as it diverges from bottom to top. For example, Refs. [30,45] use a general 2D expression for an open magnetic field, while Ref. [46] employes a general 3D expression of a flux tube. In the current analysis and for this simulation stage, a simplified analytic expression is used that recreates a 2D flux tube, as described below.
The jets propagate in an embedded environment in a magnetic field configuration described by Equations (17) and (18). Here, B 0 = 100 G. This magnitude decreases with a height reaching a constant value of 0.6 B 0 after exceeding y = 3 Mm. Under this flux tube, a component of the Lorentz force pulls in the y -direction for the ions emerging from areas where the magnetic field is intense. Since the field becomes weaker at higher values of y, the component of the acceleration in the y-direction, given by [47],
a y = d v d t = 1 2 v 2 B ( y ) Δ B y Δ y ,
is positive (here, Δ B y / Δ y is a negative term). Therefore, particles leaving the lower parts of the footpoints at 100 km/s, where the magnetic field is three times stronger than in the zones y > 3 Mm, would undergo higher accelerations and therefore reach higher speeds (≈197 km/s), and thus, jets would reach greater heights. It is worth mentioning that the conditions, under which the particles are found in this plasma do not ideally reflect the ideal behavior of a single particle as described by the theory, particularly alluding to the previous comment. This feature can be seen in Section 4.1 below. In Figure 4, Jet1 can exceed 16.5 Mm, Jet2 can reach 13.5 Mm, and Jet3 reaches a maximum height of 9.75 Mm. The jets reached their maximum heights at t = 300 s, t = 250 s, and t = 190 s, respectively, following the coupling between species throughout evolution. Also, in Figure 4, right, one can see that the temperatures of the cores do not change in the ascent phase. However, only at the tip and peripheries of the jets is there is a visible increase in temperature of around 1– 3.6 × 10 5 K. One can note an increase of temperature over the tips; in the two-fluid scenario, this increase can be produced by the velocity pulse that develops into a shock (see, e.g., [31]).

4. Discussion

4.1. Maximum Height of the Jets

We conducted a series of simulations to recreate the evolution of small-scale solar jets generated at different heights above the photosphere and under two different magnetic field conditions. uniform magnetic field and a flux tube-type field were used. Initially, the atmosphere was hydrostatically stratified, and it was perturbed with velocity pulses [48] to generate the jets. Figure 3 and Figure 4 show the simulations carried out only with S i , n 0 , however, and to identify the influence of the neutrals on the ions coupling, the simulations with S i , n = 0 in Equations (3) and (4) were performed.
The maximum heights reached by the ion and neutral particle jets with interacting fluids were y ( i , n ) max = 17.5 , 14.7 , and 10.9 Mm in the uniform field for Jet1, Jet2, and Jet3, respectively. The latter heights match those reached by macrospicules, Type I spicules, and Type II spicules for the respective jets. In the case of the flux tube y ( i , n ) max = 16.75 , 13.5 , and 9.75 Mm (see Figure 5), which differed by Δ y ( i , n ) max = 0.75 , 1.2 , and 1.15 Mm. The jets that evolved within the uniform field reached larger heights. One can also see that Jet1, despite having been generated in a zone ( y 0 = 1.3 Mm) closer to the photosphere, reaches the highest maximum height compared to that of Jet1,2. The same is true for the flux tube configuration. The heights of these jets fall within the established heights for what are known as Type-I spicules (Jet2), Type-II spicules (Jet3), and macrospicules (Jet1). The latter happens because Jet1 has had more mass on it than it has been able to drag, as commented in Ref. [30], where a velocity pulse of A v = 40 km/s is used in the case of adiabatic MHD equations. Meantime, when the collisions between ions and neutrals turn off, the particles are no longer coupled, and the jets of different fluids present independent dynamics. The charged and neutral particle jets in the two magnetic field conditions have differences between their respective maximum heights up to Δ y ( i , n ) max = 1.25 Mm for Jets1,2,3 in the uniform magnetic field and up to Δ y ( i , n ) max = 2 Mm for Jets1,2,3 in the flux tube (see Figure 5). The latter is to outline the contribution of the neutrals on the ions through momentum transfer.

4.2. Temperature of the Jets

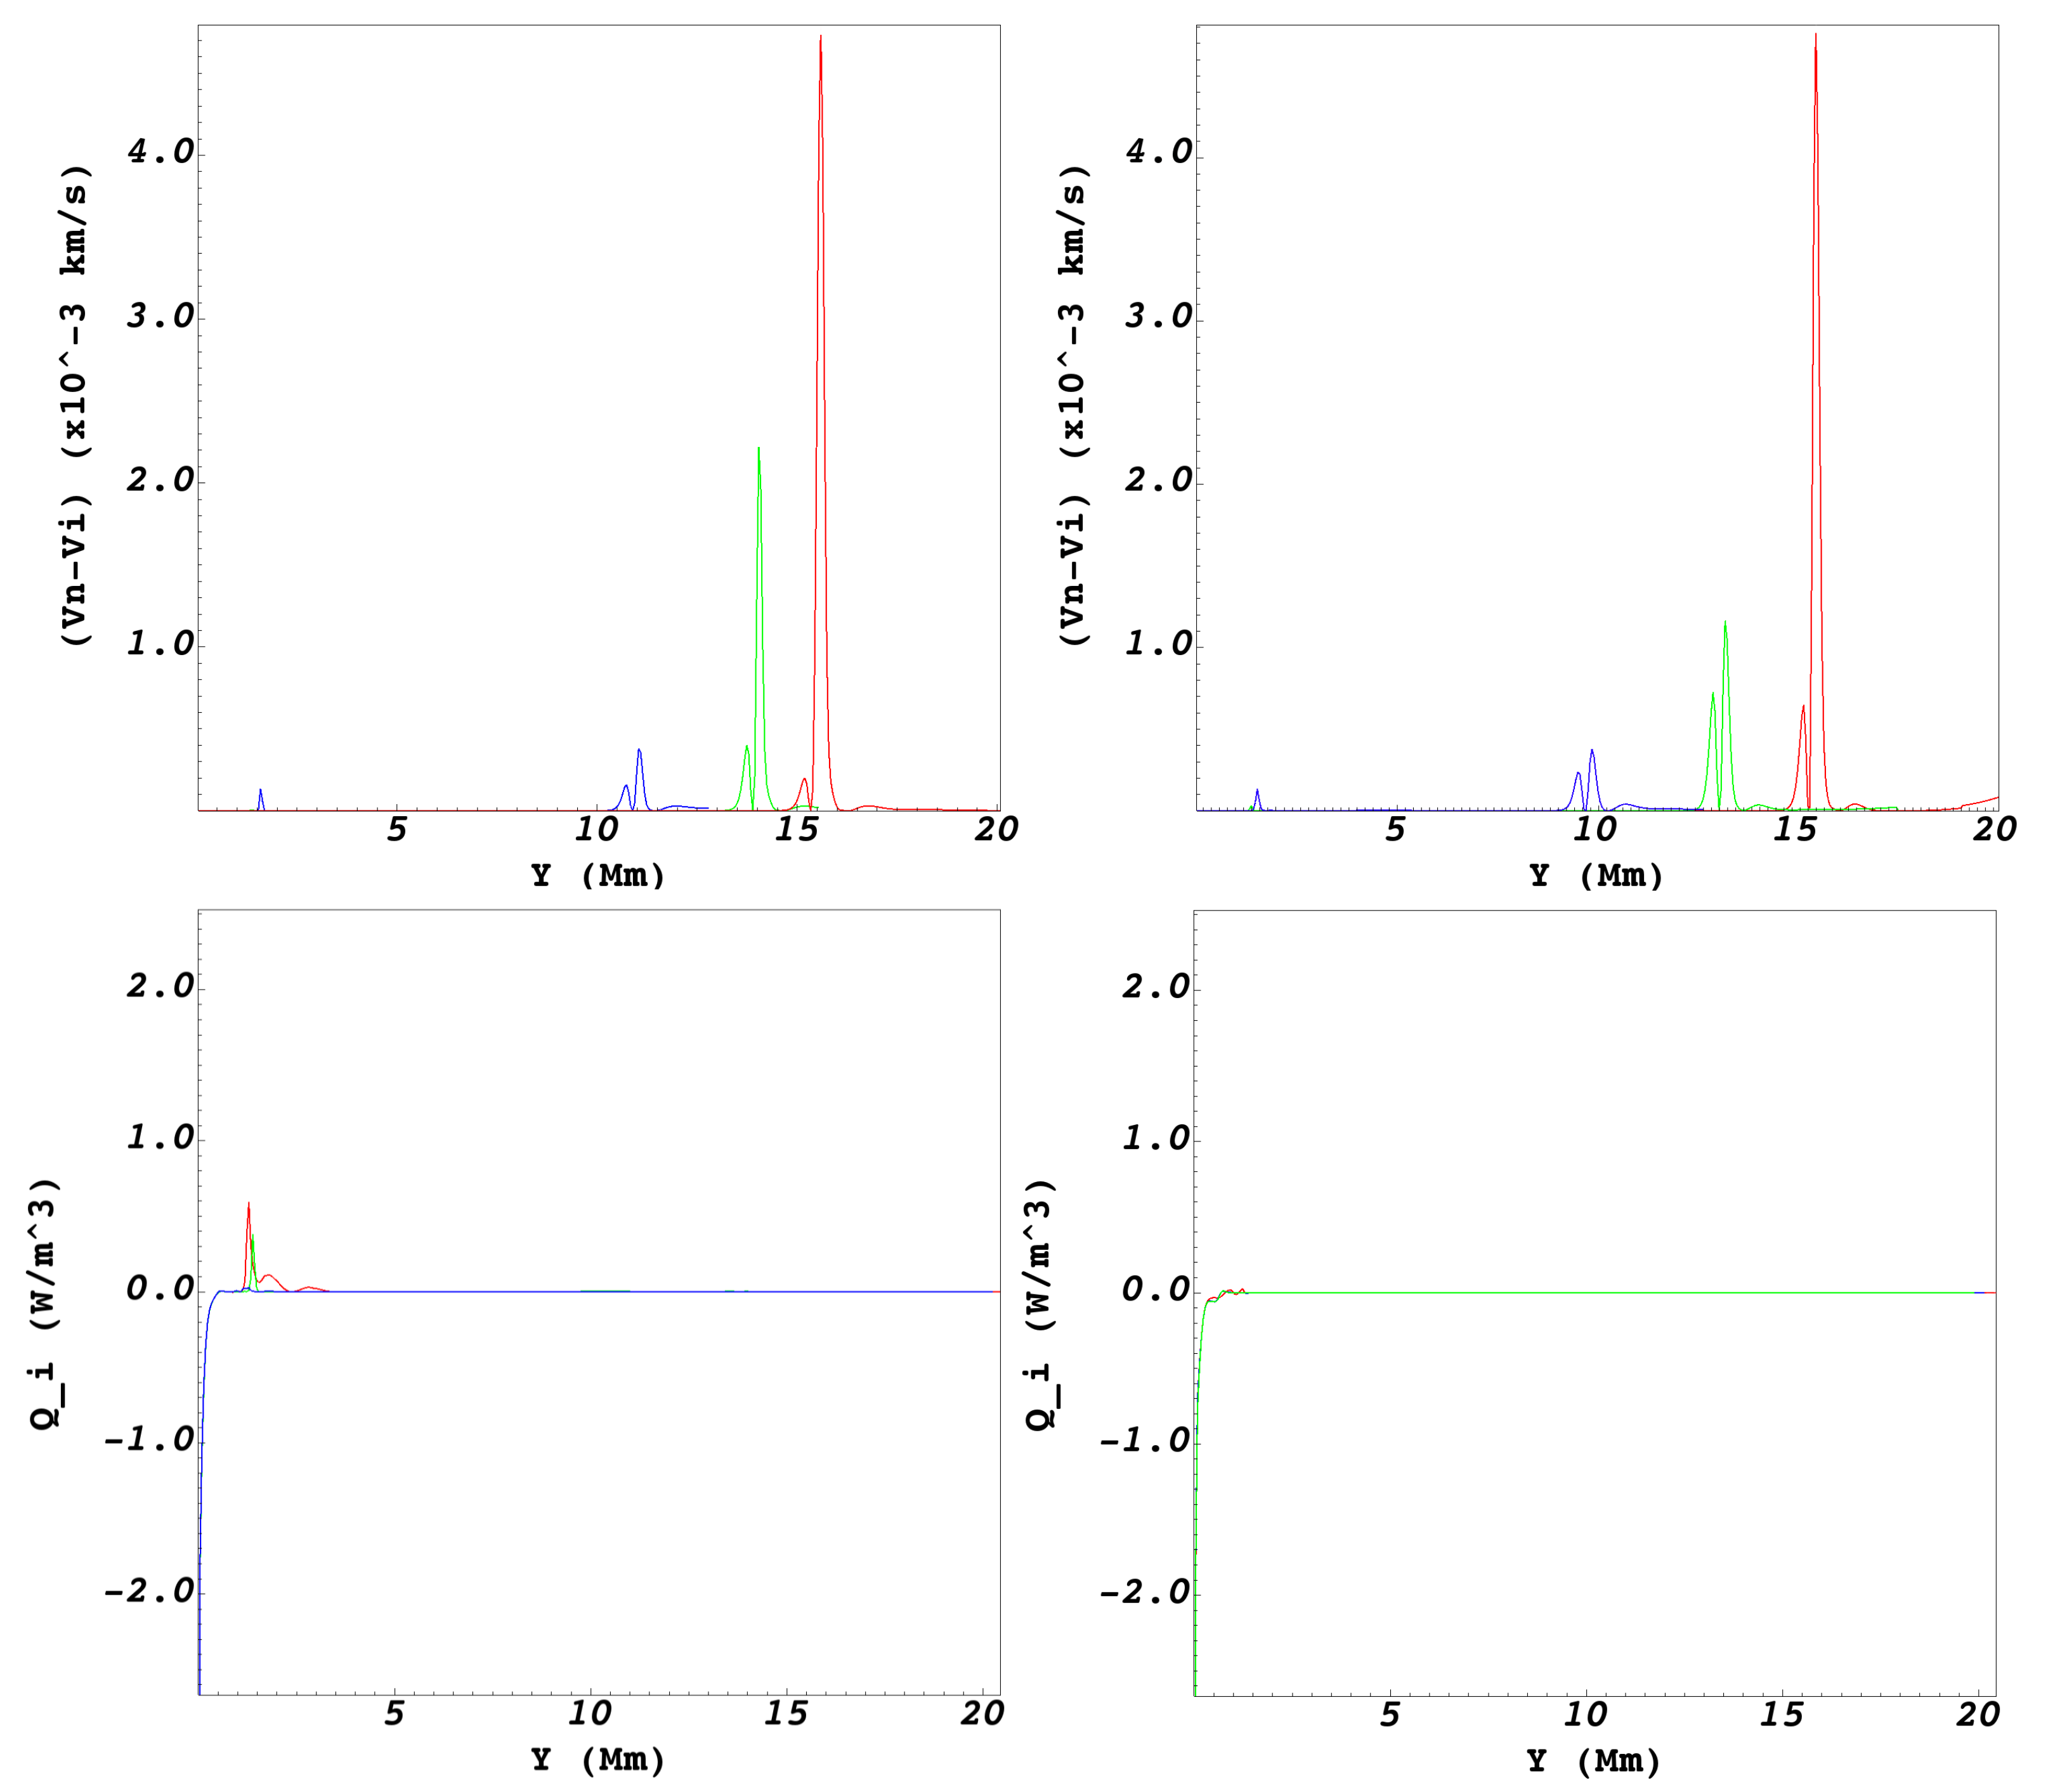
At t = 0 (Figure 1), the temperatures of ions and neutrals are, for 0 y 2 Mm, T i T n 10 4 K. The evolution of the jets was within the range of physical time of 0 t f 600 s. In this period, the Jets1,2,3 reached the corresponding y max values, but the orders of the magnitude in temperatures remained quite similar. For example, in Figure 3 and Figure 4, one can see that the temperature of the cores (along x = 0 ) throughout their evolution did not vary significantly, the latter being in agreement with the observations in [10,49,50]. However, on the tips of the jets, the temperatures ( T 6 × 10 5 K) are reached above that of the bodies of the jets ( T 10 4 K). This result is due to the previous sweep of the shock wave produced by the pulse. At the footpoints of the jets in Figure 3 and Figure 4, one can see the changes in temperature above 160s. In Figure 6, bottom, one can see that the Q i ’s are slightly above 0 (0.002–0.6 W/m 3 ), specifically in these zones ( 1.0 y 3.5 for the case considered Section 3.1, and 1.0 y 1.5 for the case of Section 3.2). These minimum heat generation values in the lower part of the jets are associated with the proportionality that exists with ( V n V i ) 2 , which in turn are related to the points where the original disturbance was generated. Hence, this heat is not being produced by any event inherent to the natural evolution of the jets. In the lateral peripheries of the jets, one can find an increase in temperature which keeps increasing from the emergence of the corona, at y = 2.25 Mm for t > 0 , up to the corresponding y max values. The conversion of kinetic energy could produce this increase in temperature into heat [51,52,53], but this is not related to the interaction between the charged and neutral particles directly, but rather to the moving particles entering a relatively static environment (in ideal terms for the simulation purposes) and with temperatures exceeding 10 6 K.
In this paper, a two-fluid model of straightforward interaction is employed when radiation losses and ambipolar effects of the plasma are not counted for. However, the model is able to mimic the temperature behavior in the regions mentioned above of the jets. Nevertheless, more realistic simulations exist, see, e.g., Refs. [44,54] analyzing the generation of spicule-jets using Cowling’s conductivity employing the generalized Ohm’s law, ambipolar diffusion, and multiple species of different ionization levels.

4.3. Collisions between Ions and Neutrals

Throughout the simulation ( t [ 0 , 600 ] s), for both cases considered in Section 3.1 and Section 3.2, the temperature of a relatively substantial fraction of ions and neutrals inside the jets remains constant as soon as the jets reach the y max values.
The characteristic collision time,
τ = 1 ν n i + ν i n ,
between fluids [37] with T i T n 10 4 K, ρ i = 6.3 × 10 11 kg/m 3 , and ρ n = 1.08 × 10 4 kg/m 3 , with ν n i the collision frequency between ions and neutrals,
ν n i = α i n ρ n ,
i.e., ν n i 384 Hz here, and since ν n i = ν i n , results to τ = 1.3 ms. As noticed just above, the characteristic time of the system involving the jet itself is around 6 × 10 2 s, and this ensures that the collisions between the particles and the exchange of momentum can keep the ions and neutrals coupled almost full lifetime of the jet. The peripheries and tip of the jet, being in direct kinetic interaction with the coronal medium, reach higher temperatures of up to T i T n 3.62 × 10 5 K, with ρ i = 4 × 10 12 kg/m 3 and ρ n = 5.4 × 10 5 kg/m 3 . The collision frequency and characteristic collision time for these temperatures and densities are ν n i 147 Hz and τ = 3.4 ms, respectively. Even though the temperature is an order of magnitude higher in the outer layers of the jet, mass densities are an order of magnitude lower in the center of the same jet, so the characteristic collision time turns out to be higher in the core. However, in the two simulations, this collision time turns out to be of an order of 10 3 s.
As one can find from Figure 6, the coupling of the particles is less effective at the tips of the jets than it is inside the jets, where the dragging of particles from the corona in relative rest ( V i 0 ) generates small instabilities. The order of magnitude of the velocity drifts, V n V i , is in the range 0 to 4.7 × 10 3 km/s for the uniform magnetic field, and 0 to 4.72 × 10 3 km/s for the flux tube magnetic field. Also, one can recognize a peak of 0.14 × 10 3 km/s in the velocity drift at y = 1.6 Mm, near the footpoints of Jet3, in the uniform magnetic field, at t = 210 s, as well as another peak of 0.12 × 10 3 km/s at y = 1.5 Mm for Jet3, in the flux tube magnetic field at t = 190 s. For both magnetic field types, the highest velocity drift is found at the tip of Jet1. The peaks at y = 15.5 , 14.1 , and 11.1 Mm for Jet1, Jet2, and Jet3, in the uniform magnetic field, are of ( 0.35 , 2.2 , and 4.7 ) × 10 3 km/s, respectively, and the peaks at y = 15.4 , 13.6 , and 9.75 Mm for Jet1, Jet2 and Jet3 in the flux tube magnetic field, are ( 0.38 , 1.2 , and 4.72 ) × 10 3 km/s, been not sufficient to affect the temperature.

5. Conclusions

In this paper, the dynamics of small-scale jets in two different magnetic field configurations has been studied using the JOANNA code in order to solve the two-fluid MHD equations numerically, i.e., the equations for the continuity of mass, momentum, and energy for ions and neutral particles were considered separately. Then, the jets were excited by launching velocity pulses at three different vertical locations, namely at y = 1.3 , 1.5 , and 1.8 Mm, within the chromosphere range of 0.6 y 2.5 Mm, starting from an atmosphere model in hydrostatic equilibrium. A simplified model that does not consider radiation losses, ambipolar diffusion, or recombination between particles has been employed. Instead, the ions and neutrals were considered interacting merely anchored to friction due to collisions. For completeness, the hypothetical scenario has been studied where the collisions between the ions and neutrals are not present. The general result for this scenario indicates that momentum transfer in the jets is responsible for a relatively small increase in their maximum heights.
To summarize the results of this study, the following findings to be pointed out:
  • The Jets1,2,3 generated within the uniform magnetic field (Section 3.1) with A v = 100 km/s showed a relationship in their maximum heights as follows, y max ( Jet 3 ) < y max ( Jet 2 ) ( Jet 1 ) , and the same was seen for the case with the flux tube (Section 3.2). This behavior had already been reported in Ref. [30], a velocity pulse with A v = 40 km/s was used. One observes such a behaviour because the jets that arise from zones closer to the photosphere have a more significant amount of plasma that can be dragged by the pulse that perturbs the hydrostatic equilibrium. In this collective behaviour of the plasma and under the solar conditions that were taken into account here, it was not possible to observe any hint of what was predicted by the theory in Section 3.2. It is important to emphasize that the jets generated in the uniform magnetic field, reached a higher height, with a Δ y ( i , n ) max = 0.75 , 1.2 , and 1.15 Mm, concerning their counterparts in the flux tube. This result reveals a kind of braking due to the constriction of the magnetic lines in 0 y 5 Mm. Jet1 reached heights that have been reported for macrospicules [14], while Jet2 and Jet3 reached heights typical of Type I and Type II spicules [13], respectively. The three jets do not show similarities with surges since they are greater, less frequent, and more explosive than spicules. However, this requires a broader study to be able to determine if the y 0 , at which these jets are generated can be a crucial factor in categorizing the spicules reported in Refs. [13,55,56], or if the nature of these jets creation, such as magnetic reconnection or another phenomenon, is the one that best categorizes the jets within the family of spicules already described with current observations.
  • The characteristic times of collision between particles were τ = [ 1.3 , 3.4 ] ms, for the core and peripheries of the jet, respectively, which guaranteed from t > 0 the coupling between ions and neutrals during the entire lifetime of the jets ( t f = 600 s), such that a joint dynamic between the fluids is observed.
  • From Figure 3 and Figure 4, one can see that the jets created in the constant magnetic field are somewhat thinner than those found in the flux tube field configuration. The densities inside the jets remained within a value of ρ i 4 × 10 12 kg/m 3 and ρ n 5.4 × 10 5 kg/m 3 during the evolution time.
  • The velocity drifts between particles were measured at the tips of the jets when they reached their maximum heights, being negligible (0–4.72 × 10 3 km/s for any heat contribution that the friction between fluids could add to the coronal region. The filamentary regions above the jets with temperatures T i , n > 6.5 × 10 5 K were generated by the shock wave that propagated towards the corona with velocities V > 100 km/s. The temperature of the peripheries of the jets exceeded 3.62 × 10 5 K, arising entirely from friction due to the collisional interaction between the coronal plasma and the jet particles.
Finally, the analysis presented in this paper complements, for example, the studies in Refs. [30,37]. In particular, this paper clearly states why the ions and neutrals behave as if they are coupled. In further studies, we plan to analyze the evolution of multiple jets considering the three-fluid resistive equations, which makes it possible to create a more realistic scenario that describes the generation of jets in the solar chromosphere.

Author Contributions

The authors have contributed to the elaboration of the article in the following way: conceptualization, J.J.G.-A.; methodology, G.A.d.P., J.J.G.-A.; software, J.J.G.-A., E.E.D.-F.; validation, J.J.G.-A., G.A.d.P.; formal analysis, investigation and visualization of the results, E.E.D.-F.; writing-original draft preparation, E.E.D.-F.; writing-review and editing, E.E.D.-F., G.A.d.P., J.J.G.-A.; funding acquisition, E.E.D.-F., G.A.d.P., J.J.G.-A. All authors have read and agreed to the published version of the manuscript.

Funding

The authors would like to thank the joint support from the Consejo Nacional de Ciencia y Tecnología (CONACYT), Comisión de Operación y Fomento de Actividades Académicas (COFAA) del Instituto Polytécnico Nacional (IPN), Estímulo al Desempeño de los Investigadores (EDI) del IPN, and Beca de Estímulo Institucional de Formación de Investigadores (BEIFI) del IPN. J.J.G.-A. is grateful for Investigadores por México-CONACYT (CONACYT Fellow), CONACYT 319216 (2022), CONACYT LN 315829 (2021), and CONACYT-AEM 2017-01-292684 grants, financed by “Consejo Nacional de Ciencia y Tecnología” (CONACYT), which partially supported this work, along with the program “Investigadores for México,” project 1045 sponsor space Weather Service Mexico (SCIESMEX).

Data Availability Statement

Not applicable.

Acknowledgments

We thank the anonymous referees for constructive comments and suggestions that significantly improved the clarity of the paper. We would also like to thank the facilities provided by Instituto de Geofísica, Unidad Michoacán, Universidad Nacional Autónoma de México (IGUM-UNAM), Campus Morelia, via J.J.G.-A., for the computer resources where the simulations were developed. The authors also want to thank the developers of the JOANNA code, which was crucial to this work. We finally thank Kris Murawski for sharing the JOANNA code, Darek Wójcik who developed this code, Piotr Woloszkiewicz and Luis Kadowak for their helpful contributions.

Conflicts of Interest

The authors declare no conflict of interest.

References

  1. Raouafi, N.E.; Patsourakos, S.; Pariat, E.; Young, P.R.; Sterling, A.C.; Savcheva, A.; Shimojo, M.; Moreno-Insertis, F.; DeVore, C.R.; Archontis, V.; et al. Solar coronal jets: Observations, theory, and modeling. Space Sci. Rev. 2016, 201, 1–53. [Google Scholar] [CrossRef] [PubMed] [Green Version]
  2. Shen, Y. Observation and modelling of solar jets. Proc. R. Soc. Lond. A Math. Phys. Engin. Sci. 2021, 477, 20200217. [Google Scholar] [CrossRef]
  3. Isobe, H.; Miyagoshi, T.; Shibata, K.; Yokoyama, T. Three-dimensional simulation of solar emerging flux using the Earth Simulator I. Magnetic Rayleigh-Taylor instability at the top of the emerging flux as the origin of filamentary structure. Publ. Astron. Soc. Jpn. 2006, 58, 423–438. [Google Scholar] [CrossRef] [Green Version]
  4. Pariat, E.; Antiochos, S.K.; DeVore, C.R. A model for solar polar jets. Astrophys. J. 2009, 691, 61–74. [Google Scholar] [CrossRef]
  5. Archontis, V.; Tsinganos, K.; Gontikakis, C. Recurrent solar jets in active regions. Astron. Astrophys. 2010, 512, L2. [Google Scholar] [CrossRef] [Green Version]
  6. Jiang, R.L.; Fang, C.; Chen, P.-F. Numerical simulation of solar microflares in a canopy-type magnetic configuration. Astrophys. J. 2012, 751, 152. [Google Scholar] [CrossRef] [Green Version]
  7. Leake, J.E.; Linton, M.G. Effect of ion–neutral collisions in simulations of emerging active regions. Astrophys. J. 2013, 764, 54. [Google Scholar] [CrossRef]
  8. Soler, R.; Carbonell, M.; Ballester, J.L. Magnetoacoustic waves in a partially ionized two-fluid plasma. Astrophys. J. Suppl. Ser. 2013, 209, 16. [Google Scholar] [CrossRef] [Green Version]
  9. Wójcik, D.; Murawski, K.; Musielak, Z.E. Acoustic waves in two-fluid solar atmosphere model: Cut-off periods, chromospheric cavity, and wave tunnelling. Mon. Not. R. Astron. Soc. 2018, 481, 262–267. [Google Scholar] [CrossRef]
  10. Beckers, J.M. Solar spicules. Sol. Phys. 1968, 3, 367–433. [Google Scholar] [CrossRef]
  11. De Pontieu, B.; McIntosh, S.W.; Hansteen, V.H.; Schrijver, C.J. Observing the roots of solar coronal heating—In the chromosphere. Astrophys. J. 2009, 701, L1–L6. [Google Scholar] [CrossRef]
  12. Lippincott, S.L. Chromospheric Spicules. Smithson. Contrib. Astrophys. 1957, 2, 15–23. [Google Scholar] [CrossRef]
  13. De Pontieu, B.; McIntosh, S.; Hansteen, V.H.; Carlsson, M.; Schrijver, C.J.; Tarbell, T.D.; Title, A.M.; Shine, R.A.; Suematsu, Y.; Tsuneta, S.; et al. A Tale of two spicules: The impact of spicules on the magnetic chromosphere. Pub. Astron. Soc. Jpn. 2007, 59, S655–S662. [Google Scholar] [CrossRef]
  14. Loboda, I.P.; Bogachev, S.A. What is a macrospicule? Astrophys. J. 2019, 871, 230. [Google Scholar] [CrossRef] [Green Version]
  15. Secchi, A. Le Soleil; Imprimerie de Gauthier-Villars: Paris, France, 1875; Available online: https://books.google.co.zm/books?id=V-gRAAAAYAAJ (accessed on 27 January 2023).
  16. Roberts, W.O. A preliminary report on chromospheric spicules of extremely short lifetime. Astrophys. J. 1945, 101, 136–140. [Google Scholar] [CrossRef] [Green Version]
  17. Lynch, D.K.; Beckers, J.; Dunn, R. A morphological study of solar spicules. Sol. Phys. 1973, 30, 63–70. [Google Scholar] [CrossRef]
  18. Bray, R.J.; Loughhead, R.E. The Solar Chromosphere; Chapman and Hall: London, UK, 1974. [Google Scholar]
  19. Pereira, T.M.D.; De Pontieu, B.; Carlsson, M. Quantifying spicules. Astrophys. J. 2012, 759, 18. [Google Scholar] [CrossRef]
  20. Isobe, H.; Proctor, M.R.E.; Weiss, N.O. Convection-driven emergence of small-scale magnetic fields and their role in coronal heating and solar wind acceleration. Astrophys. J. 2008, 679, L57–L60. [Google Scholar] [CrossRef]
  21. González-Avilés, J.J.; Guzmán, F.S.; Fedun, V. JET formation in solar atmosphere due to magnetic reconnection. Astrophys. J. 2017, 836, 24. [Google Scholar] [CrossRef] [Green Version]
  22. González-Avilés, J.J.; Guzmán, F.S.; Fedun, V.; Verth, G.; Shelyag, S.; Regnier, S. I. Jet formation and evolution due to 3D magnetic reconnection. Astrophys. J. 2018, 856, 176. [Google Scholar] [CrossRef]
  23. Murawski, K.; Srivastava, A.K.; Zaqarashvili, T.V. Numerical simulations of solar macrospicules. Astron. Astrophys. 2011, 535, A58. [Google Scholar] [CrossRef] [Green Version]
  24. González-Avilés, J.J.; Murawski, K.; Srivastava, A.K.; Zaqarashvili, T.V.; González-Esparza, J.A. Numerical simulations of macrospicule jets under energy imbalance conditions in the solar atmosphere. Mon. Not. R. Astron. Soc. 2021, 505, 50–64. [Google Scholar] [CrossRef]
  25. Nóbrega-Siverio, D.; Martíez-Sykora, J.; Moreno-Insertis, F.; van der Voort, L.R. Surges and Si IV bursts in the solar atmosphere: Understanding IRIS and SST observations through RMHD experiments. Astrophys. J. 2017, 850, 153. [Google Scholar] [CrossRef] [Green Version]
  26. Nelson, C.J.; Doyle, J.G. Excitation of an outflow from the lower solar atmosphere and a co-temporal EUV transient brightening. Astron. Astrophys. 2013, 560, A31. [Google Scholar] [CrossRef] [Green Version]
  27. Yang, H.; Chae, J.; Lim, E.-K.; Lee, K.-S.; Park, H.; Song, D.-U.; Cho, K. Magnetic-reconnection generated shock waves as a driver of solar surges. Astrophys. J. Lett. 2014, 790, L4. [Google Scholar] [CrossRef] [Green Version]
  28. Zhelyazkov, I.; Zaqarashvili, T.V.; Chandra, R.; Srivastava, A.K.; Mishonov, T. Kelvin–Helmholtz instability in solar cool surges. Adv. Space Res. 2015, 56, 2727–2737. [Google Scholar] [CrossRef] [Green Version]
  29. Ballester, J.L.; Alexeev, I.; Collados, M.; Downes, T.; Pfaff, R.F.; Gilbert, H.; Khodachenko, M.; Khomenko, E.; Shaikhislamov, I.F.; Soler, R.; et al. Partially ionized plasmas in astrophysics. Space Sci. Rev. 2018, 214, 58. [Google Scholar] [CrossRef] [Green Version]
  30. Kuźma, B.; Murawski, K.; Kayshap, P.; Wójccik, D.; Srivastava, A.K.; Dwivedi, B.N. Two-fluid numerical simulations of solar spicules. Astrophys. J. 2017, 849, 78. [Google Scholar] [CrossRef] [Green Version]
  31. González-Avillés, J.J.; Murawski, K.; Zaqarashvili, T.V. Numerical simulations of a two-fluid jet at a magnetic null point in a solar arcade. Mon. Not. R. Astron. Soc. 2022, 515, 5094–5105. [Google Scholar] [CrossRef]
  32. Kuźma, B.; Wójcik, D.; Murawski, K. Heating of a quiet region of the solar chromosphere by ion and neutral acoustic waves. Astrophys. J. 2019, 878, 81. [Google Scholar] [CrossRef]
  33. Wójcik, D.; Kuźma, B.; Murawski, K.; Musielak, Z.E. Wave heating of the solar atmosphere without shocks. Astron. Astrophys. 2020, 635, A28. [Google Scholar] [CrossRef] [Green Version]
  34. Murawski, K.; Musielak, Z.E.; Wójcik, D. 3D numerical simulations of solar quiet chromosphere wave heating. Astrophys. J. Lett. 2020, 896, L1. [Google Scholar] [CrossRef]
  35. Wójcik, D.; Kuźma, B.; Murawski, K.; Srivastava, A.K. Two-fluid numerical simulations of the origin of the fast solar wind. Astrophys. J. 2019, 884, 127. [Google Scholar] [CrossRef] [Green Version]
  36. Smith, P.D.; Sakai, J.I. Chromospheric magnetic reconnection: Two-fluid simulations of coalescing current loops. Astron. Astrophys. 2008, 486, 569–575. [Google Scholar] [CrossRef]
  37. Oliver, R.; Soler, R.; Terradas, J.; Zaqarashvili, T.V. Dynamics of coronal rain and descending plasma blobs in solar prominences. II. Partially ionized case. Astrophys. J. 2016, 818, 128. [Google Scholar] [CrossRef] [Green Version]
  38. Avrett, E.H.; Loeser, R. Models of the solar chromosphere and transition region from SUMER and HRTS observations: Formation of the extreme-ultraviolet spectrum of hydrogen, carbon, and oxygen. Astrophys. J. Suppl. Ser. 2008, 175, 229–276. [Google Scholar] [CrossRef] [Green Version]
  39. Durran, D.R. Numerical Methods for Fluid Dynamics; Springer Science+Business Media, LLC: New York, NY, USA, 2010. [Google Scholar] [CrossRef]
  40. Miyoshi, T.; Kusano, K. A multi-state HLL approximate Riemann solver for ideal magnetohydrodynamics. J. Comput. Phys. 2005, 208, 315–344. [Google Scholar] [CrossRef]
  41. Dedner, A.; Kemm, F.; Kröner, D.; Munz, C.D.; Schnitzer, T.; Wesenberg, M. Hyperbolic divergence cleaning for the MHD equations. J. Comput. Phys. 2002, 175, 645–673. [Google Scholar] [CrossRef] [Green Version]
  42. Braileanu, B.P.; Keppens, R. Two-fluid implementation in MPI-AMRVAC with applications to the solar chromosphere. Astron. Astrophys. 2022, 664, A55. [Google Scholar] [CrossRef]
  43. Martínez-Sykora, J.; Pontieu, B.D.; Moortel, I.D.; Hansteen, V.H.; Carlsson, M. Impact of Type II spicules in the corona: Simulations and synthetic observables. Astrophys. J. 2018, 860, 116. [Google Scholar] [CrossRef] [Green Version]
  44. Martínez-Sykora, J.; De Pontieu, B.; Hansteen, V.H.; Rouppe van der Voort, L.; Carlsson, M.; Pereira, T.M.D. On the generation of solar spicules and Alfvénic waves. Science 2017, 356, 1269–1272. [Google Scholar] [CrossRef] [PubMed] [Green Version]
  45. Konkol, P.; Murawski, K.; Zaqarashvili, T.V. Numerical simulations of magnetoacoustic oscillations in a gravitationally stratified solar corona. Astron. Astrophys. 2012, 537, A96. [Google Scholar] [CrossRef] [Green Version]
  46. Magyar, N.; Utz, D.; Erdélyi, R.; Nakariakov, V.M. Could switchbacks originate in the lower solar atmosphere? I. Formation mechanisms of switchbacks. Astrophys. J. 2021, 911, 75. [Google Scholar] [CrossRef]
  47. Jackson, J.D. Classical Electrodynamics; John Wiley & Sons, Inc.: New York, NY, USA, 1975; Available online: https://archive.org/details/ClassicalElectrodynamics2nd (accessed on 27 January 2023).
  48. Murawski, K.; Zaqarashvili, T.V. Numerical simulations of spicule formation in the solar atmosphere. Astron. Astrophys. 2010, 519, A8. [Google Scholar] [CrossRef] [Green Version]
  49. Beckers, J.M. Solar spicules. Annu. Rev. Astron. Astrophys. 1972, 10, 73–100. [Google Scholar] [CrossRef]
  50. Sterling, A.C. Solar spicules: A review of recent models and targets for future observations. Sol. Phys. 2000, 196, 79–111. [Google Scholar] [CrossRef]
  51. Díaz-Figueroa, E.E.; González-Avilés, J.J.; Ares de Parga, G. Propagation of Type II spicules into the solar corona I. A thermomechanical toy model (Plasma rise phase). J. Phys. Conf. Ser. 2022, 2307, 12063. [Google Scholar] [CrossRef]
  52. Díaz-Figueroa, E.E.; González-Avilés, J.J.; Ares de Parga, G. Propagation of Type II spicules into the solar corona II. A thermomechanical toy model (Plasma escape and descent phase). J. Phys. Conf. Ser. 2022, 2307, 12064. [Google Scholar] [CrossRef]
  53. Díaz-Figueroa, E.E.; González-Avilés, J.J.; Ares de Parga, G. Propagation of Type II spicules into the solar corona III. MHD simulation. J. Phys. Conf. Ser. 2022, 2307, 12065. [Google Scholar] [CrossRef]
  54. Martínez-Sykora, J.; Szydlarski, M.; Hansteen, V.H.; De Pontieu, B. On the velocity drift between ions in the solar atmosphere. Astrophys. J. 2020, 900, 101. [Google Scholar] [CrossRef]
  55. De Pontieu, B.; Hansteen, V.H.; Rouppe van der Voort, L.; van Noort, M.; Carlsson, M. Observations and simulations of fibrils and mottles. arXiv 2007, arXiv:astro-ph/0702081. [Google Scholar] [CrossRef]
  56. De Pontieu, B.; Hansteen, V.H.; Rouppe van der Voort, L.; van Noort, M.; Carlsson, M. High-resolution observations and modeling of dynamic fibrils. Astrophys. J. 2007, 655, 624–641. [Google Scholar] [CrossRef] [Green Version]
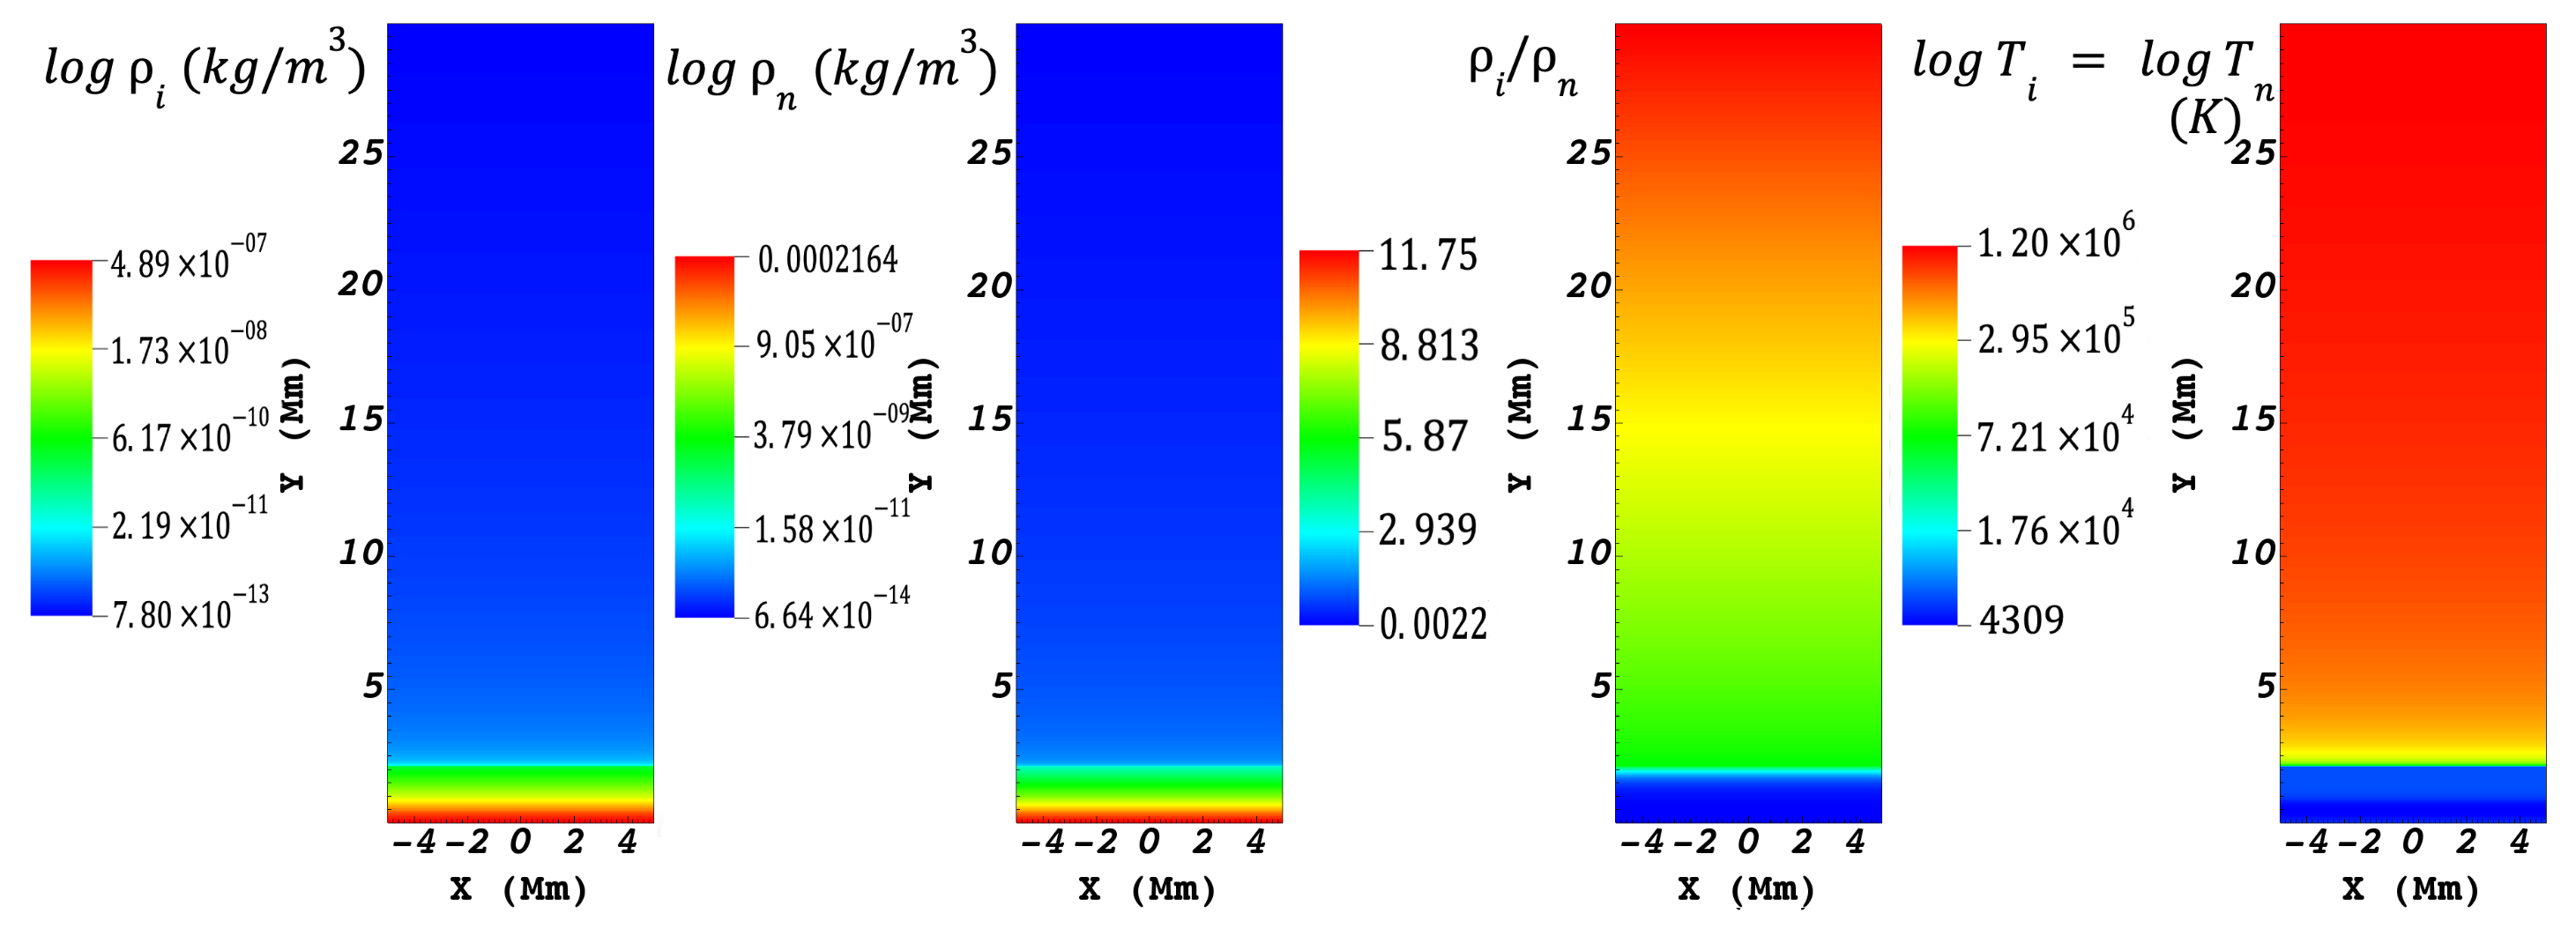
Figure 1. Left to right: The log ρ i , log ρ n , ion-to-neutral densities ratio, ρ i / ρ n , for the solar atmosphere model at the initial time, t = 0 , and log T i = log T n .
Physics 05 00020 g001
Figure 2. Upper: magnetic field lines for the vertical straight magnetic field configuration (left) and for the flux tube configuration (right) at the initial time, t = 0 . The color bar represents the magnitude of the magnetic field | B | . Lower: The plasma- β corresponding to the vertical straight magnetic field (left) and the flux tube (right) at the initial time, t = 0 .
Physics 05 00020 g002
Figure 3. Uniform magnetic field case. Left: maximum heights reached by the jets generated at y 0 = 1.3 (Jet1), 1.5 (Jet2), and 1.8 Mm (Jet3), at t = 300 s, t = 270 s, and t = 210 s, respectively (left to right). Temporal evolution of log ρ i , n ( x , y ) is shown for ion (upper) and neutral (lower) densities. Right: temperatures reached by the jets Jet1, Jet2, and Jet3 generated at t = 300 s, t = 270 s, and t = 210 s, respectively (left to right). Temporal evolution is shown for log T i , n ( x , y ) for ions (upper) and neutrals (lower).
Physics 05 00020 g003
Figure 4. Flux tube case. Left: maximum heights reached by the jets generated at at y 0 = 1.3 (Jet1), 1.5 (Jet2), and 1.8 Mm (Jet3), at t = 300 s, t = 250 s, and t = 190 s, respectively (left to right). Temporal evolution of log ρ i , n ( x , y ) is shown for ion (upper) and neutral (lower) densities. Right: temperatures reached by the jets Jet1, Jet2, and Jet3 generated at t = 300 s, t = 250 s, and t = 190 s, respectively (left to right). Temporal evolution is shown for log T i , n ( x , y ) for ions (upper) and neutrals (lower).
Physics 05 00020 g004
Figure 5. Maximum heights, y max , of Jet1, Jet2, and Jet3 versus the corresponding vertical position of the initial velocity pulse in y 0 for A v = 100 km/s for the cases of the uniform (left) and flux tube (right) magnetic filelds. Here, the open circle represents ion jets with S i n 0 ; the asterisks represents neutral jets with S i n 0 ; the red plus symbol represents ion jets with S i n = 0 ; and the green plus symbol represents neutral jets with S i n = 0 . See text for details.
Physics 05 00020 g005
Figure 6. Upper: the difference between the neutral and ion speeds evaluated along x = 0 , for Jet1 (red), Jet2 (green), and Jet3 (blue) at the corresponding y max values for the uniform (left) and flux tube (right) magnetic fields. Lower: the heat Q i i , n , generated by the interaction between fluids evaluated along x = 0 for Jet1 (red), Jet2 (green), and Jet3 (blue) at the corresponding t y max values for the uniform (left) and flux tube (right) magnetic fields.
Physics 05 00020 g006
Disclaimer/Publisher’s Note: The statements, opinions and data contained in all publications are solely those of the individual author(s) and contributor(s) and not of MDPI and/or the editor(s). MDPI and/or the editor(s) disclaim responsibility for any injury to people or property resulting from any ideas, methods, instructions or products referred to in the content.