Covid-19 Predictions Using a Gauss Model, Based on Data from April 2 †


Abstract
:1. Introduction
2. Results
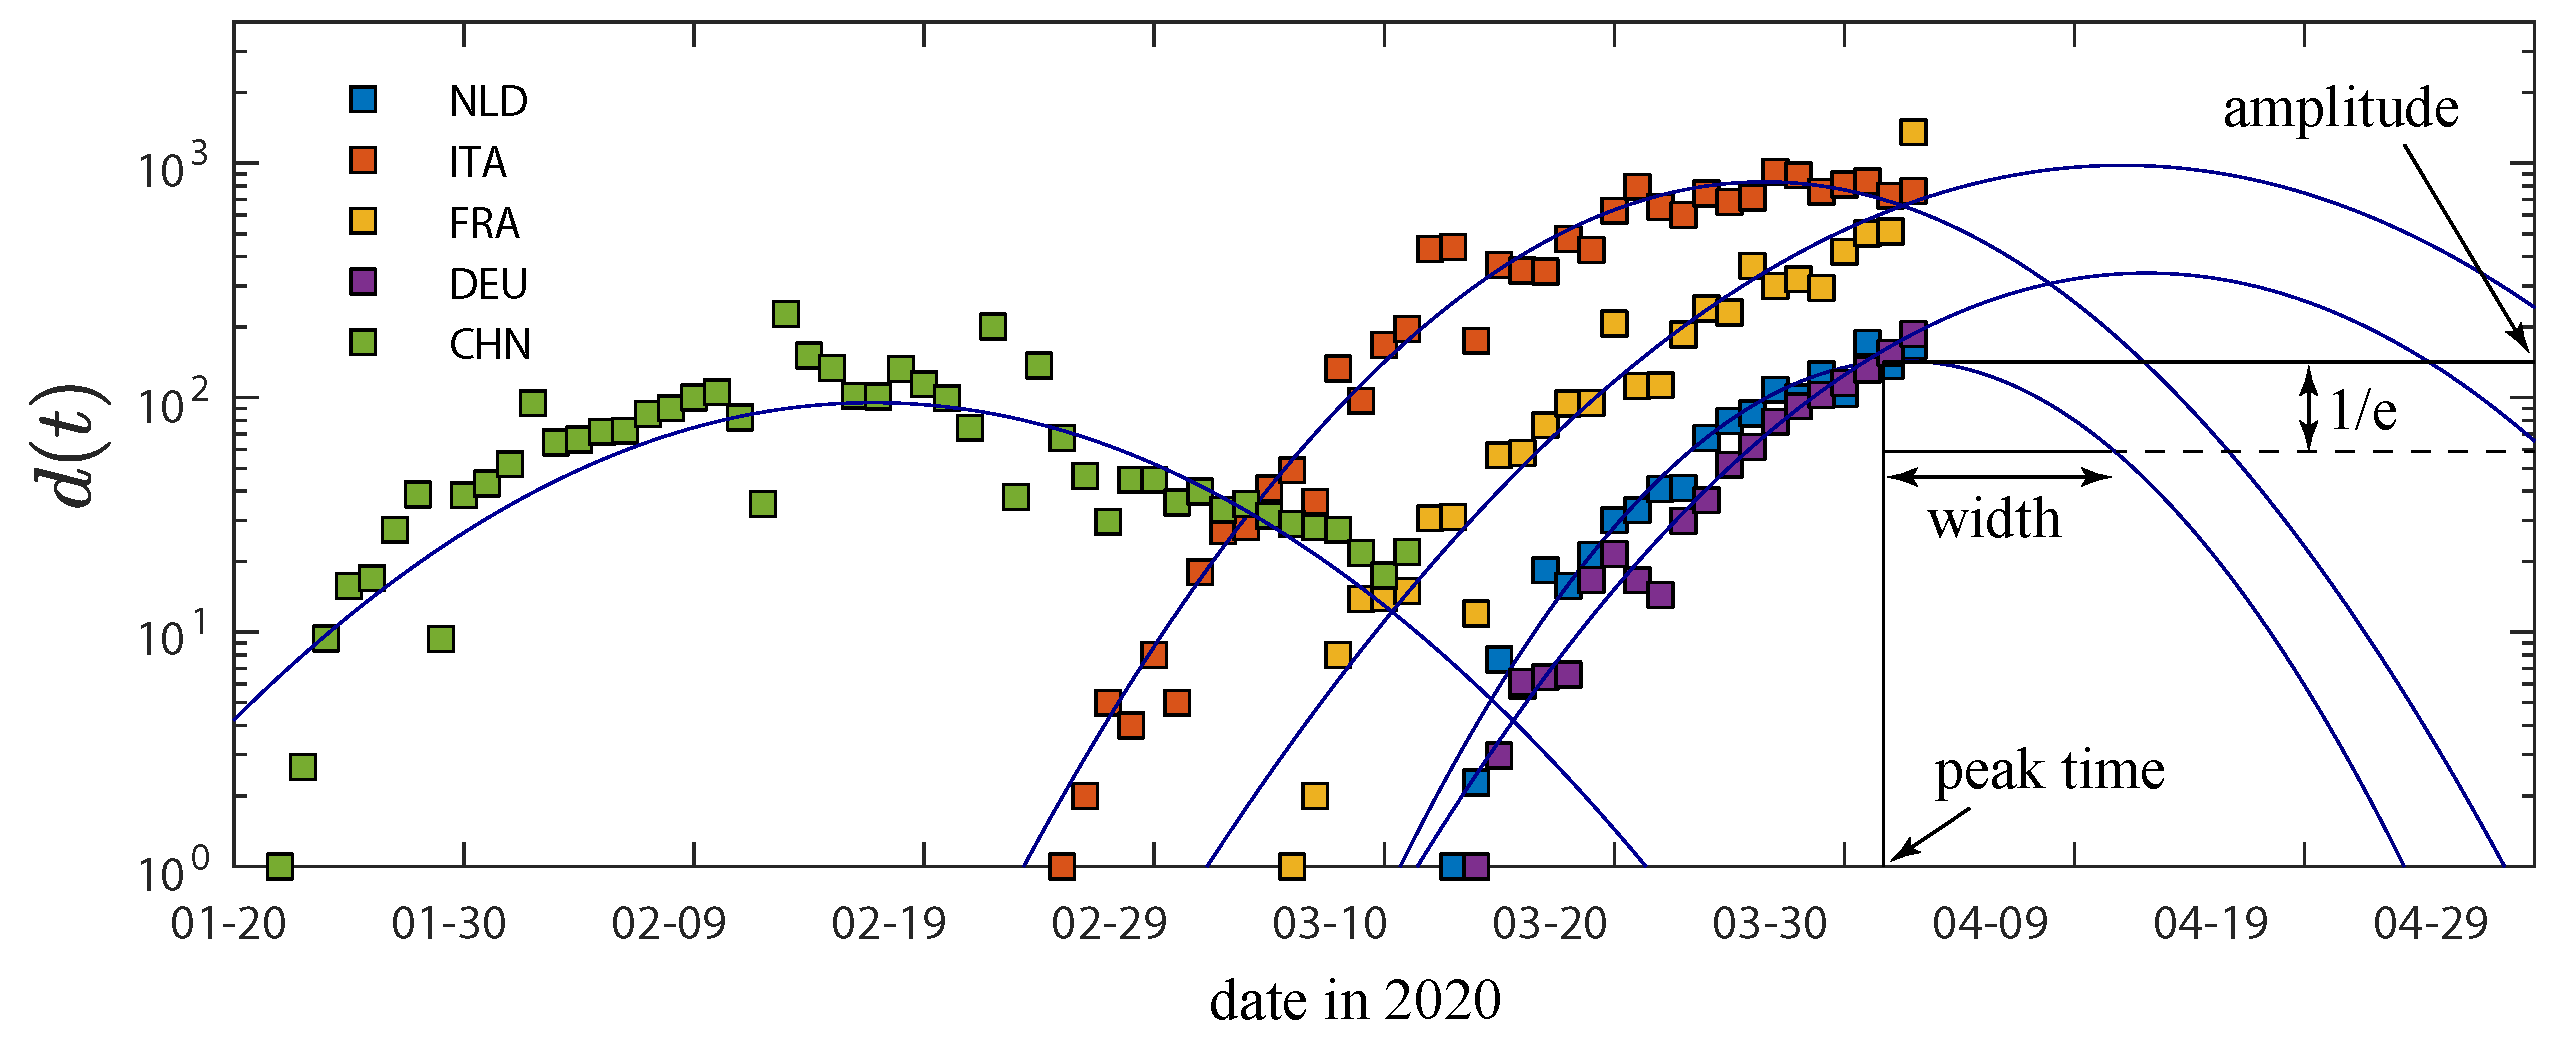
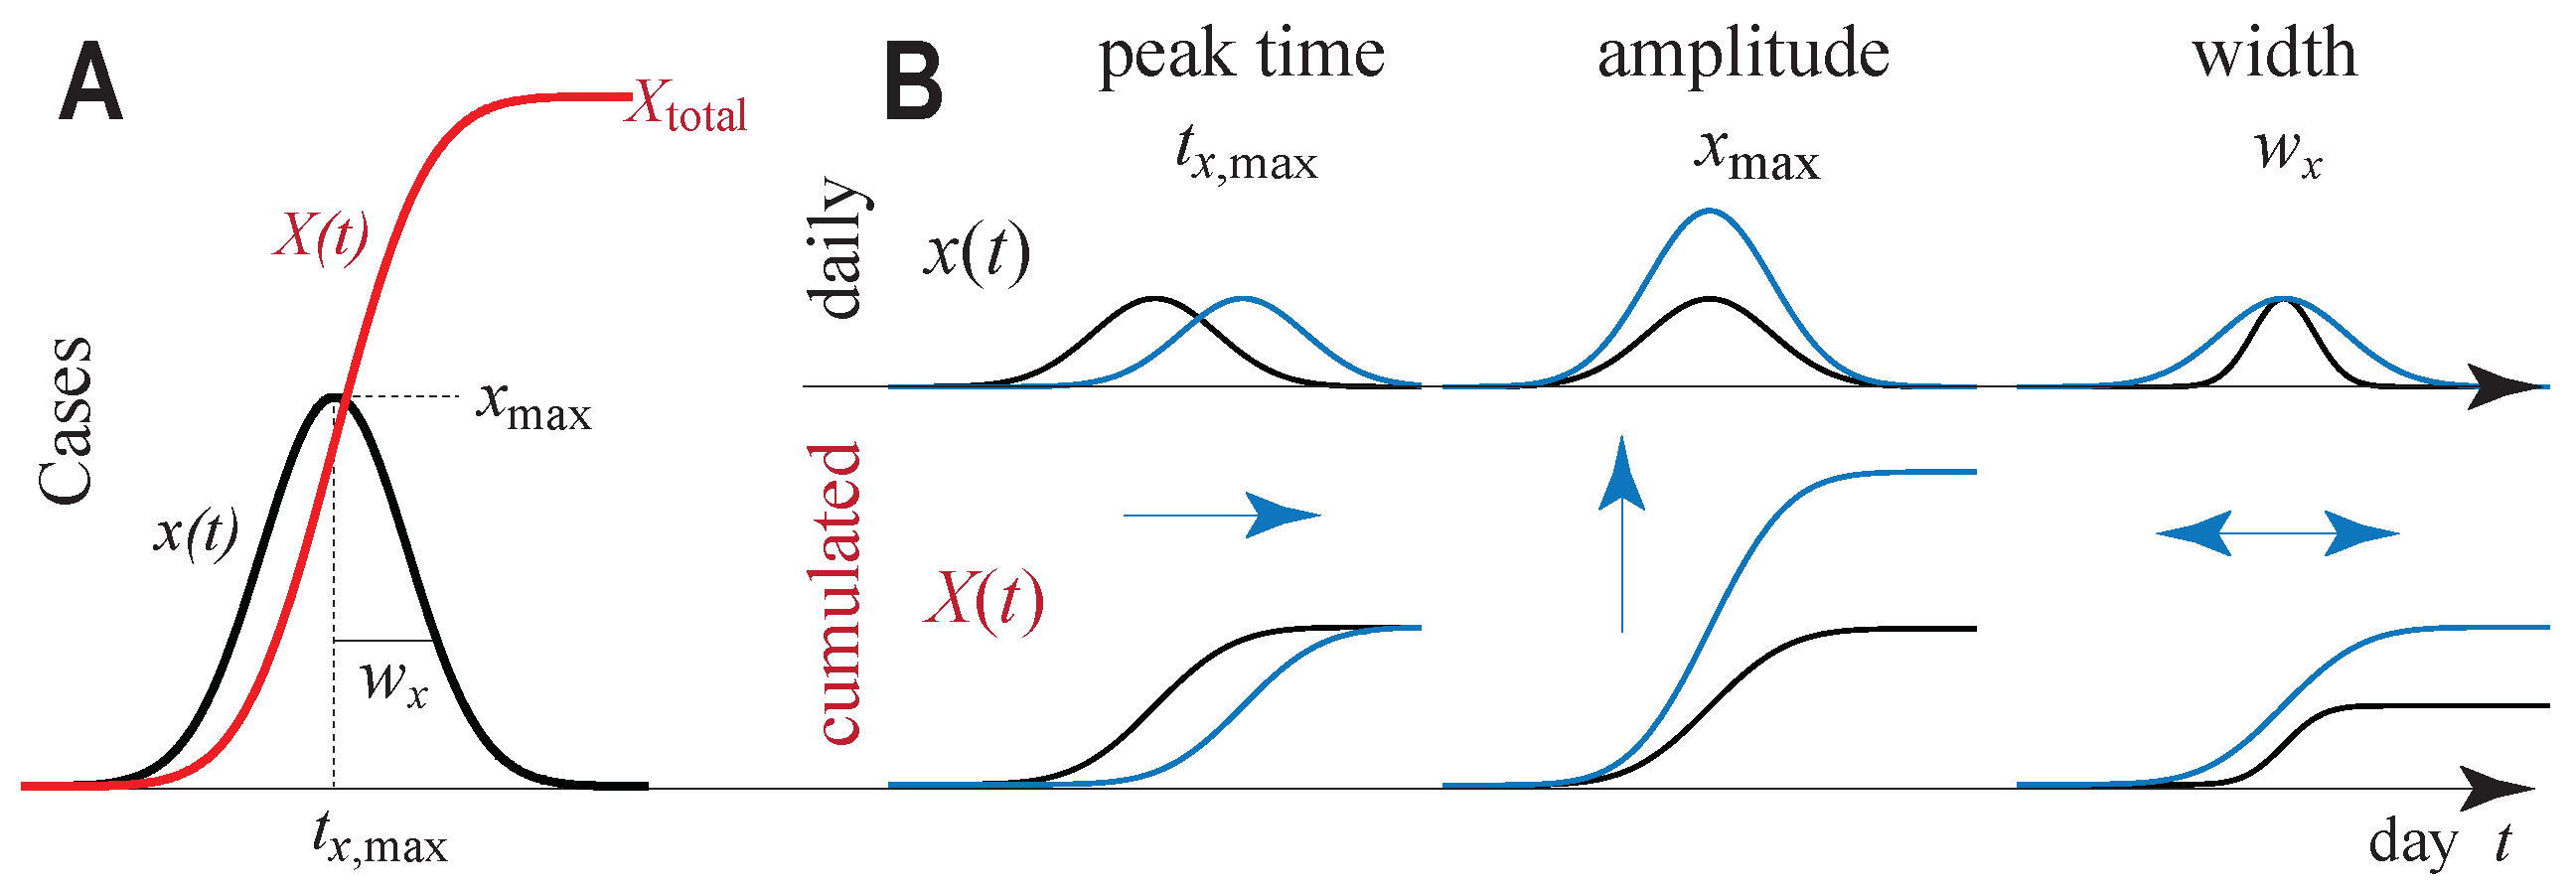
2.1. Gauss Model (GM)
2.2. Logarithmic Daily Fatalities Are Quadratic
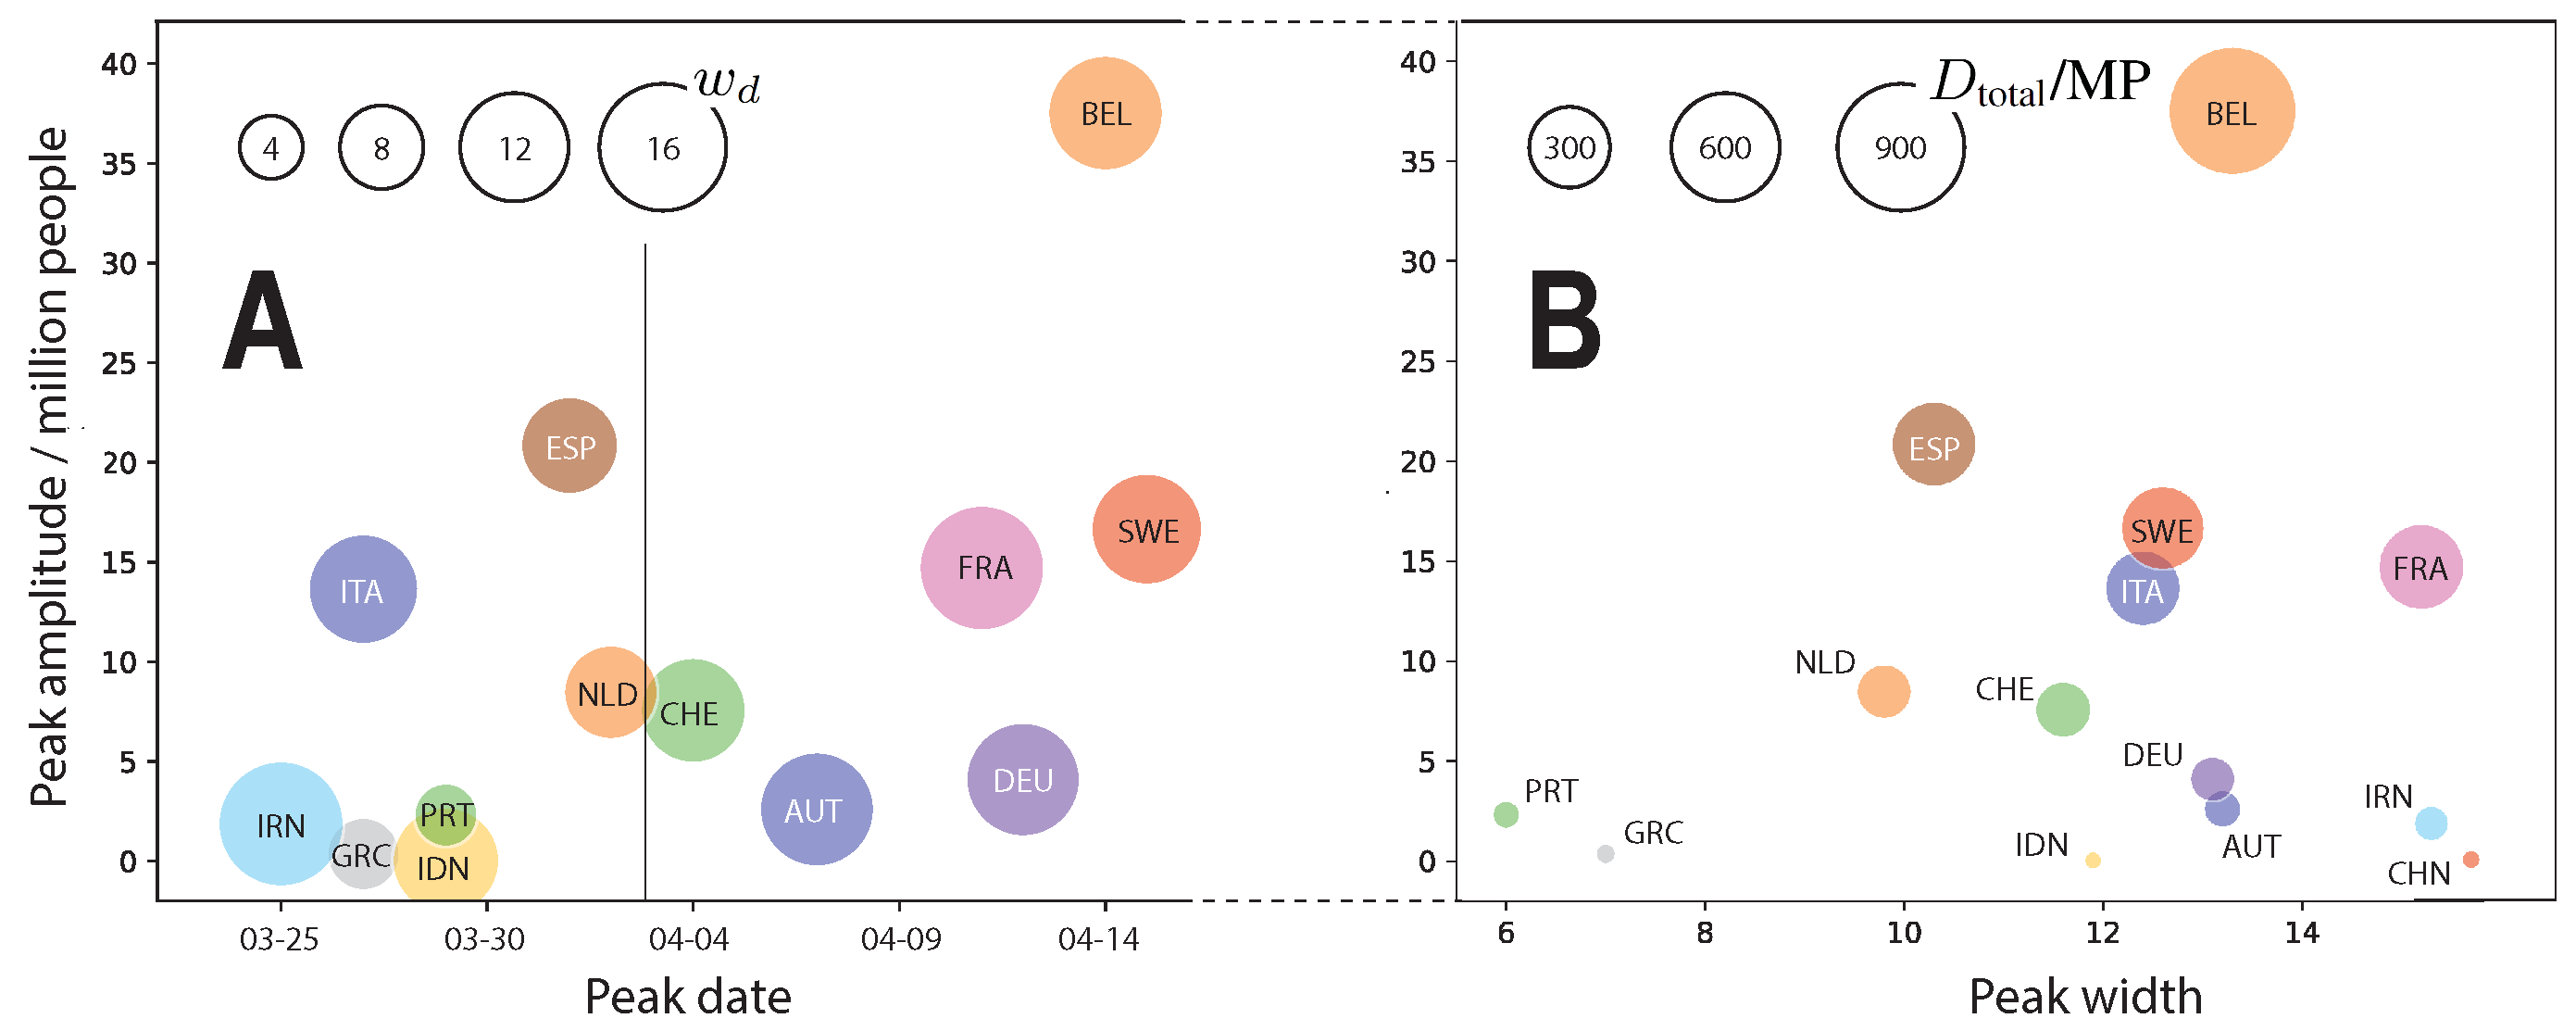
2.3. The Fitted Parameters
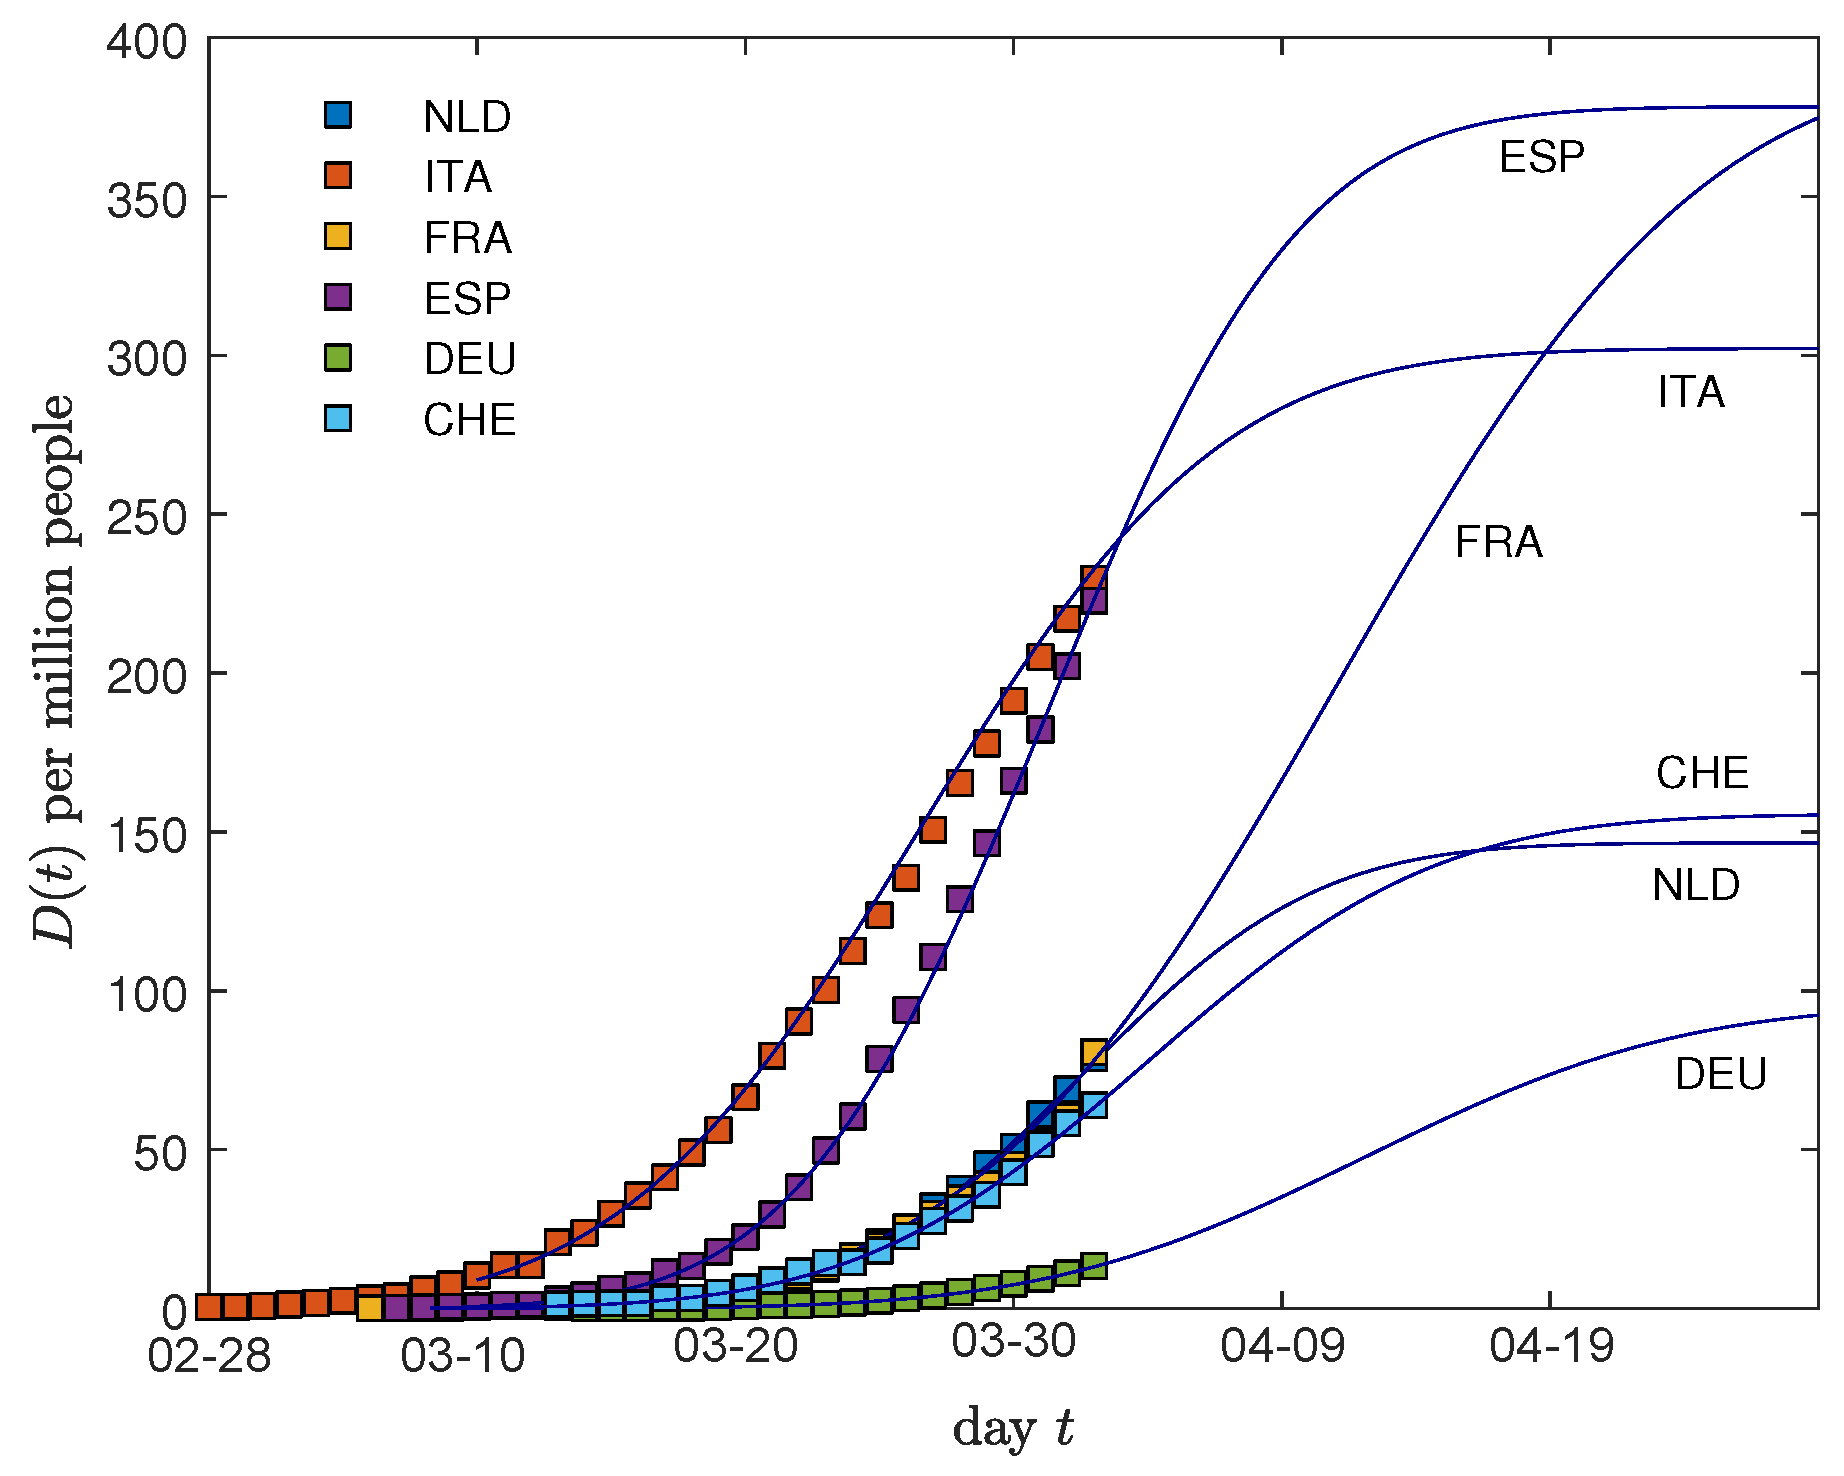
2.4. Additional Predictions
3. Discussion
4. Conclusions
5. Note Added in Proof
Supplementary Materials
Author Contributions
Funding
Acknowledgments
Conflicts of Interest
Appendix A. Model, Methods, and Implications of the GM
Appendix A.1. Gauss Model
Appendix A.2. Fitting and Errors
Appendix A.3. Deaths vs. Infections

| Code | Country | MP | ||||
|---|---|---|---|---|---|---|
| BRA | Brazil | 11.1 ± 0.2 | April 3 ± 8 | 800 ± 350 | 16,000 ± 7000 | 78 ± 35 |
| CHL | Chile | 11.7 ± 0.2 | April 2 ± 7 | 321 ± 33 | 6600 ± 800 | 370 ± 45 |
| GBR | Great Britain | 20.0 ± 0.7 | April 27 ± 14 | — | — | — |
| JPN | Japan | 38.0 ± 2.3 | April 27 ± 22 | 195 ± 90 | 13,000 ± 7000 | 104 ± 54 |
| SAU | Saudi Arabia | 15.4 ± 0.6 | April 2 ± 13 | 140 ± 23 | 3900 ± 700 | 120 ± 24 |
| SRB | Serbia | 10.3 ± 0.3 | April 1 ± 8 | 113 ± 50 | 2100 ± 1000 | 290 ± 130 |
| PAK | Pakistan | 10.3 ± 0.3 | March 28 ± 11 | 170 ± 80 | 3200 ± 1600 | 16 ± 8 |
| PER | Peru | 16.8 ± 1.3 | April 9 ± 28 | 148 ± 64 | 4400 ± 2300 | 140 ± 70 |
| POL | Poland | 15.0 ± 0.4 | April 7 ± 10 | 340 ± 50 | 9100 ± 1500 | 240 ± 40 |
| ROU | Romania | 18.9 ± 1.3 | April 19 ± 26 | 690 ± 90 | 23,200 ± 4600 | 1200 ± 250 |
| USA | United States | 14.8 ± 0.2 | April 14 ± 5 | — | — | — |
Appendix A.4. Data Used
Appendix A.5. Cumulative Fatalities
Appendix A.6. Occupation of Respiratory Equipment
Appendix A.7. Percentiles of Infection Numbers
Appendix A.8. Doubling Times
Appendix A.9. Reproduction Factor and Base Reproduction Number
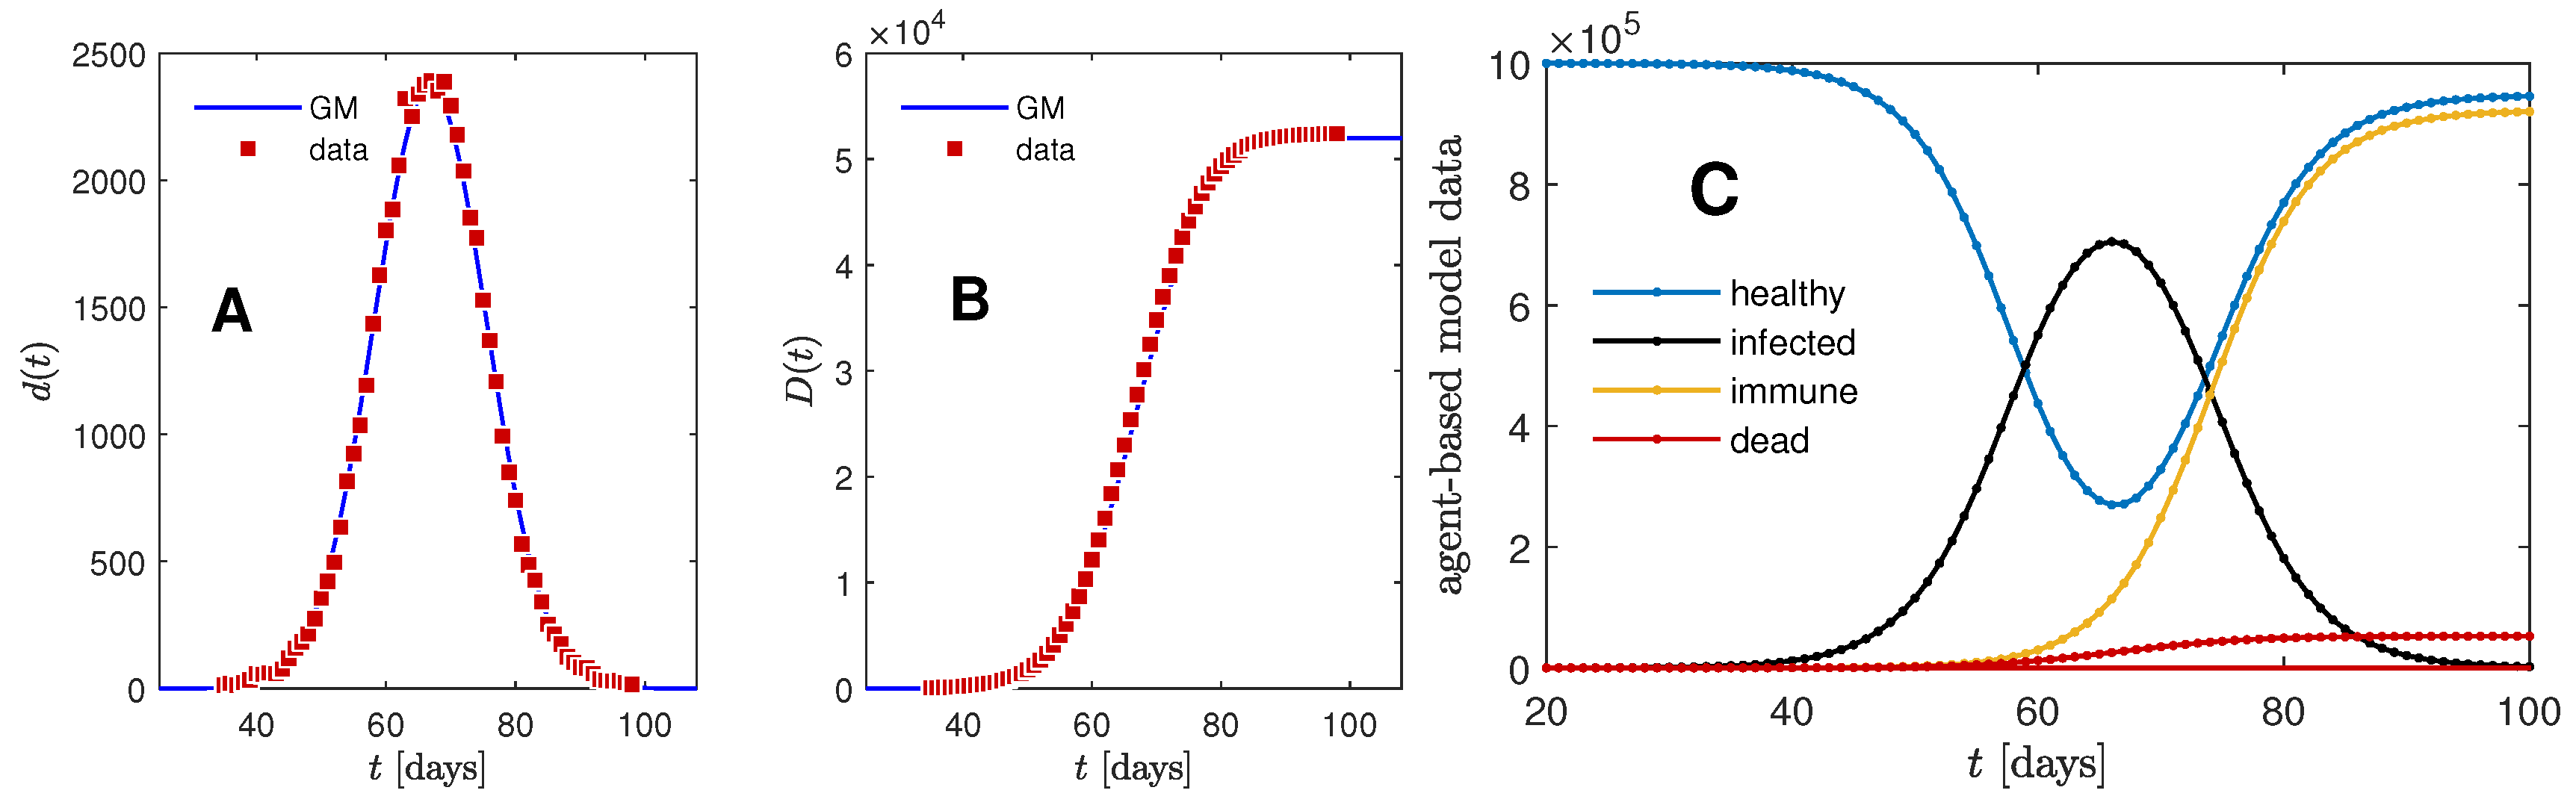
Appendix B. Stochastic Model Leading to Gaussian Time Evolution
| person j | ||||
| status | infected | immune | dead | day of infection |
- a:
- duration in days, during which a newly infected person (not yet immune, or dead) can potentially infect others,
- b:
- average daily number of contacts between an infected person and other people randomly chosen from the whole population (dead or alive),
- c:
- probability for an infectious person to transmit the virus during a single contact (irrespective the health status of the contact, it might be healthy or already infected),
- f:
- probability to die from an infection.
- (0)
- Initialize.Code: Set time , , and for all .
- (1)
- Begin with a single infected individual (no 1) on day 0 of the pandemic.Code: , .
- (2)
- Proceed with the next day and clear the daily counters i (infected) and d (deceased) for later use.Code: Increase t by one. Set , , and .
- (3)
- Begin looping over all individuals at time t.Code:
- (4)
- If an individual j is infected, it dies today with probability .Code: If , choose an equally distributed random number . If , set , , ,
- (5)
- A deceased individual does not contribute to further infections.Code: If , proceed with step (3).
- (6)
- If an individual j is alive and already infected since more than a days, it gets immune today.Code: If and , then , .
- (7)
- If individual j is infected, inspect its contacts. If contact k is not yet immune, it is getting infected with probability c today.Code: If , create a set containing b people randomly chosen from the (dead or alive) population. For each member k of the set of contacts randomly choose a number : If and , then set , , .
- (8)
- Continue looping over all individuals.Code: If , proceed with step (3). Otherwise just continue with step (9),
- (9)
- Collect the daily information for later use.Code: Calculate current number of infected , immune , dead , and healthy people by summing over the information contained in the quadruplets. Note that cannot be derived from , while .
- (10)
- If there are no more infected people, terminate the code.Code: If , proceed with step (2), otherwise exit.
References
- Kermack, W.O.; McKendrick, A.G. Contributions to the mathematical theory of epidemics—I. 1927. Bull. Mathem. Biol. 1991, 53, 33–55. [Google Scholar]
- Kermack, W.O.; McKendrick, A.G. Contributions to the mathematical theory of epidemics—II. The problem of endemicity. 1932. Bull. Mathem. Biol. 1991, 53, 57–87. [Google Scholar]
- Kermack, W.O.; McKendrick, A.G. Contributions to the mathematical theory of epidemics—III. Further studies of the problem of endemicity. 1933. Bull. Mathem. Biol. 1991, 53, 89–118. [Google Scholar]
- Enserink, M.; Kupferschmidt, K. With COVID-19, modeling takes on life and death importance. Science 2020, 367, 1414–1415. [Google Scholar] [CrossRef] [Green Version]
- Lixiang, L.; Yang, Z.; Dang, Z.; Meng, C.; Huang, J.; Meng, H.; Wang, D.; Chen, G.; Zhang, J.; Peng, H.; et al. Propagation analysis and prediction of the COVID-19. Infect. Dis. Model. 2020, 5, 282–292. [Google Scholar]
- Ciufolini, I.; Paolozzi, A. Mathematical prediction of the time evolution of the COVID-19 pandemic in Italy by a Gauss error function and Monte Carlo simulations. Eur. Phys. J. Plus 2020, 135, 355. [Google Scholar] [CrossRef] [PubMed]
- Pham, H. On estimating the number of deaths related to Covid-19. Mathematics 2020, 8, 655. [Google Scholar] [CrossRef]
- Cakir, Z.; Savas, H.B. A Mathematical Modelling Approach in the Spread of the Novel 2019 Coronavirus SARS-CoV-2 (COVID-19) Pandemic. Electr. J. Gen. Med. 2020, 17. [Google Scholar] [CrossRef] [Green Version]
- Alimadadi, A.; Aryal, S.; Manandhar, I.; Munroe, P.B.; Joe, B.; Cheng, X. Artificial intelligence and machine learning to fight COVID-19. Physiol. Genom. 2020, 52, 200–202. [Google Scholar] [CrossRef]
- Tarnok, A. Machine Learning, COVID-19 (2019-nCoV), and multi-OMICS. Cytometry A 2020, 97, 215–216. [Google Scholar] [CrossRef]
- Wynants, L.; Van Calster, B.; Bonten, M.M.J.; Collins, G.S.; Debray, T.P.A.; De Vos, M.; Haller, M.C.; Heinze, G.; Moons, K.G.M.; Riley, R.D.; et al. Prediction models for diagnosis and prognosis of covid-19 infection: Systematic review and critical appraisal. Brit. Medic. J. 2020, 369, m1328. [Google Scholar] [CrossRef] [Green Version]
- Singh, D.; Kumar, V.; Kaur, M. Classification of COVID-19 patients from chest CT images using multi-objective differential evolution-based convolutional neural networks. Europ. J. Clin. Microbiol. Infect. Dis. 2020. [Google Scholar] [CrossRef]
- Naude, W. Artificial intelligence vs COVID-19: Limitations, constraints and pitfalls. AI Soc. 2020. [Google Scholar] [CrossRef] [PubMed]
- Kim, S.; Seo, Y.B.; Jung, E. Prediction of COVID-19 transmission dynamics using a mathematical model considering behavior changes in Korea. Epidem. Health 2020, 42. [Google Scholar] [CrossRef]
- Zhu, Y.F.; Chen, Y.Q. On a Statistical Transmission Model in Analysis of the Early Phase of COVID-19 Outbreak. Statist. Biosci. 2020. [Google Scholar] [CrossRef]
- Bai, Z.H.; Gong, Y.; Tian, X.D.; Cao, Y.; Liu, W.J.; Li, J. The Rapid Assessment and Early Warning Models for COVID-19. Virol. Sin. 2020. [Google Scholar] [CrossRef] [PubMed] [Green Version]
- Wolfram, C. An agent-based model of Covid-19. Complex Syst. 2020, 29, 87–105. [Google Scholar] [CrossRef]
- National Center for Immunization and Respiratory Diseases (NCIRD). Covid-19 Forecasts. 2020. Available online: https://www.cdc.gov/coronavirus/2019-ncov/covid-data/forecasting-us.html (accessed on 2 April 2020).
- Sperrin, M.; Grant, S.W.; Peek, N. Prediction models for diagnosis and prognosis in Covid-19. Brit. Medic. J. 2020, 369. [Google Scholar] [CrossRef] [Green Version]
- Kristiansen, I.S.; Burger, E.A.; De Blasio, B.F. COVID-19: Simulation models for epidemics. Tidsskr. Nor. Laegeforening 2020, 140, 546–548. [Google Scholar]
- Panovska-Griffiths, J. Can mathematical modelling solve the current Covid-19 crisis? BMC Public Health 2020, 20. [Google Scholar] [CrossRef]
- Shrivastava, S.R.; Shrivastava, P. Resorting to mathematical modelling approach to contain the coronavirus disease 2019 (COVID-19) outbreak. J. Acute Dis. 2020, 9, 49–50. [Google Scholar] [CrossRef]
- Murray, C.J.L. Forecasting COVID-19 impact on hospital bed-days, ICU-days, ventilator-days and deaths by US state in the next 4 months. medRxiv 2020. [Google Scholar] [CrossRef] [Green Version]
- Schlickeiser, R.; Schlickeiser, F. A Gaussian model for the time development of the Sars-Cov-2 corona pandemic disease. Predictions for Germany made on March 30, 2020. Physics 2020, 2, 164–170. [Google Scholar] [CrossRef]
- Github databse. JSON Time-Series of Coronavirus Cases (Confirmed, Deaths and Recovered) Per Country-Updated Daily, 2020. Available online: https://pomber.github.io/covid19/timeseries.json (accessed on 2 April 2020).
- Barmparis, G.D.; Tsironis, G.P. Estimating the infection horizon of COVID-19 in eight countries with a data-driven approach. Chaos Solitons Fractals 2020, 135, 109842. [Google Scholar] [CrossRef]
- Adam, D. Special report: The simulations driving the world’s response to COVID-19. Nature 2020, 580, 316–318. [Google Scholar] [CrossRef] [Green Version]
- Yang, X.; Yu, Y.; Xu, J.; Shu, H.; Xia, J.; Liu, H.; Wu, Y.; Zhang, L.; Yu, Z.; Fang, M.; et al. Clinical course and outcomes of critically ill patients with SARS-CoV-2 pneumonia in Wuhan, China: A single-centered, retrospective, observational study. Lancet 2020, 8, 475–481. [Google Scholar] [CrossRef] [Green Version]
- Organisation for Economic Co-operation and Development (OECD). OECS Data. 2020. Available online: https://data.oecd.org (accessed on 3 April 2020).
- Stevens, H. Why Outbreaks Like Coronavirus Spread Exponentially, and How to Flatten the Curve. Washington Post. 2020. Available online: https://www.washingtonpost.com/graphics/2020/world/corona-simulator/ (accessed on 1 April 2020).
- Abhari, R.S.; Marini, M.; Chokani, N. COVID-19 epidemic in Switzerland: Growth prediction and containment strategy using artificial intelligence and big data. medRxiv 2020. [Google Scholar] [CrossRef] [Green Version]
- Zwietering, M.H.; Jongenburger, I.; Rombouts, F.M.; Van’t Riet, K. Modeling of the Bacterial Growth Curve. Appl. Environ. Microbiol. 1990, 56, 1875–1881. [Google Scholar] [CrossRef] [Green Version]
- Zullinger, E.M.; Ricklefs, R.E.; Redford, K.H.; Mace, G.M. Fitting Sigmoidal Equations to Mammalian Growth Curves. J. Mammal. 1984, 65, 607–636. [Google Scholar] [CrossRef]
- Hau, B. Mathematical Functions to Describe Disease Progress Curves of Double Sigmoid Pattern. Phytopathology 1993, 83, 928. [Google Scholar] [CrossRef]
- Wang, X.S.; Wu, J.; Yang, Y. Richards Model Revisited: Validation by and Application to Infection Dynamics. J. Theor. Biol. 2012, 313, 12–19. [Google Scholar] [CrossRef]
- Fu, X.; Ying, Q.; Zeng, T.; Wang, Y. Simulating and forecasting the cumulative confirmed cases of SARS-CoV-2 in China by Boltzmann function-based regression analyses. J. Infection 2020. [Google Scholar] [CrossRef] [PubMed]
- Wu, K.; Darcet, D.; Wang, Q.; Sornette, D. Generalized Logistic Growth Modeling of the COVID-19 Outbreak in 29 Provinces in China and in the Rest of the World. arXiv 2020, arXiv:2003.05681. [Google Scholar]
- Vasconcelos, G.L.; Macêdo, A.M.S.; Ospina, R.; Almeida, F.A.G.; Duarte-Filho, G.C.; Souza, I.C.L. Modelling Fatality Curves of COVID-19 and the Effectiveness of Intervention Strategies. medRxiv 2020. [Google Scholar] [CrossRef]
- Clark, F.; Brook, B.W.; Delean, S.; Reşit Akçakaya, H.; Bradshaw, C.J.A. The Theta-Logistic Is Unreliable for Modelling Most Census Data: Theta-Logistic Model Is Not Robust. Meth. Ecol. Evol. 2010. [Google Scholar] [CrossRef]
- Verma, M.K.; Asad, A.; Chatterjee, S. COVID-19 Epidemic: Power Law Spread and Flattening of the Curve. Trans Indian Natl. Acad. Eng. 2020. [Google Scholar] [CrossRef]
- Schüttler, J.; Schlickeiser, R.; Schlickeiser, F.; Kröger, M. Covid-19 predictions using a Gauss model, based on data from April 2. medRxiv 2020. [Google Scholar] [CrossRef] [Green Version]
- Schüttler, J.; Schlickeiser, R.; Schlickeiser, F.; Kröger, M. Covid-19 predictions using a Gauss model, based on data from April 2. Preprints 2020. [Google Scholar] [CrossRef] [Green Version]
- An der Heiden, M.; Buchholz, U. Modellierung von Beispielszenarien an der SARS-CoV-2 Epidemie 2020 in Deutschland. RKI 2020. (In Germany) [Google Scholar] [CrossRef]
- Kröger, M.; Schlickeiser, R. Gaussian doubling times and reproduction factors of the COVID-19 pandemic disease. Preprints 2020. [Google Scholar] [CrossRef]
- Milligan, G.N.; Barrett, A.D.T. Vaccinology: An Essential Guide; Wiley Blackwell: Chichester, UK, 2015; p. 310. [Google Scholar]
- Fraser, C.; Donnelly, C.A.; Cauchemez, S. Pandemic potential of a strain of influenza A (H1N1): Early findings. Science 2009, 324, 1557–1561. [Google Scholar] [CrossRef] [Green Version]


| Code | Country | /MP | |||||
|---|---|---|---|---|---|---|---|
| AUT | Austria | 13.2 ± 1.5 | April 7 ± 21 | 21.6 ± 4.7 | 500 ± 170 | 60 ± 20 | April 25 ± 44 |
| BEL | Belgium | 13.3 ± 0.6 | April 14 ± 18 | 430 ± 26 | 10,200 ± 1100 | 890 ± 100 | May 3 ± 19 |
| CHE | Switzerland | 11.6 ± 0.5 | April 5 ± 17 | 63 ± 12 | 1300 ± 300 | 156 ± 37 | April 20 ± 1 |
| CHN | China | 15.7 ± 0.3 | February 17 ± 3 | 95 ± 3 | 2600 ± 100 | 1.9 ± 0.1 | March 11 ± 4 |
| DEU | Germany | 13.1 ± 0.4 | April 12 ± 10 | 340 ± 6 | 7900 ± 400 | 95 ± 5 | April 30 ± 11 |
| ESP | Spain | 10.3 ± 0.2 | April 1 ± 6 | 960 ± 70 | 17,500 ± 1600 | 380 ±35 | April 13 ± 7 |
| FRA | France | 15.2 ± 0.3 | April 11 ± 8 | 980 ± 320 | 26,000 ± 9000 | 390±140 | May 4 ± 9 |
| GRC | Greece | 7.0 ± 0.2 | March 27 ± 9 | 3.8 ± 1.3 | 47 ± 17 | 4.4 ± 1.6 | April 1 ± 7 |
| IDN | Indonesia | 11.9 ± 0.8 | March 19 ± 22 | 5.3 ± 4.7 | 111 ± 91 | 0.4 ± 0.4 | — |
| IRN | Iran | 15.3 ± 0.1 | March 25 ± 2 | 150 ± 14 | 4100 ± 400 | 51 ± 5 | April 17 ± 2 |
| ITA | Italy | 12.4 ± 0.1 | March 27 ± 1.8 | 832 ± 60 | 18,300 ± 1400 | 300 ± 23 | April 12 ± 2 |
| NLD | Netherlands | 9.8 ± 0.1 | April 2 ± 4 | 144 ± 23 | 2500 ± 400 | 147 ± 26 | April 13 ± 5 |
| PRT | Portugal | 6.0 ± 0.1 | March 29 ± 4 | 24 ± 4 | 260 ± 40 | 25 ± 4 | April 2 ± 4 |
| SWE | Sweden | 12.6 ± 1.2 | April 15 ± 35 | 162 ± 12 | 3600 ± 600 | 370 ± 60 | May 1 ± 35 |
© 2020 by the authors. Licensee MDPI, Basel, Switzerland. This article is an open access article distributed under the terms and conditions of the Creative Commons Attribution (CC BY) license (http://creativecommons.org/licenses/by/4.0/).
Share and Cite
Schüttler, J.; Schlickeiser, R.; Schlickeiser, F.; Kröger, M. Covid-19 Predictions Using a Gauss Model, Based on Data from April 2. Physics 2020, 2, 197-212. https://doi.org/10.3390/physics2020013
Schüttler J, Schlickeiser R, Schlickeiser F, Kröger M. Covid-19 Predictions Using a Gauss Model, Based on Data from April 2. Physics. 2020; 2(2):197-212. https://doi.org/10.3390/physics2020013
Chicago/Turabian StyleSchüttler, Janik, Reinhard Schlickeiser, Frank Schlickeiser, and Martin Kröger. 2020. "Covid-19 Predictions Using a Gauss Model, Based on Data from April 2" Physics 2, no. 2: 197-212. https://doi.org/10.3390/physics2020013
APA StyleSchüttler, J., Schlickeiser, R., Schlickeiser, F., & Kröger, M. (2020). Covid-19 Predictions Using a Gauss Model, Based on Data from April 2. Physics, 2(2), 197-212. https://doi.org/10.3390/physics2020013