1. Introduction
Cybersecurity has become a critical priority for organizations of all sizes, driven by the increasing frequency and sophistication of cyber threats. Security logs, which systematically capture detailed records of events and activities across IT infrastructures, serve as a fundamental data source for identifying vulnerabilities, policy violations, and anomalous behaviors indicative of cyberattacks.
Historically, the analysis of these logs has relied on rule-based systems and signature matching techniques, often implemented in Security Information and Event Management (SIEM) platforms. While foundational, these approaches suffer from significant limitations: they struggle to detect novel or zero-day attacks for which no signature exists [
1], require constant manual effort from security experts to write and maintain complex rules, and often generate a high volume of false positives, leading to “alert fatigue” among analysts [
2].
More recently, a variety of classical machine learning (ML) methods—including tree-based ensemble models such as XGBoost, LightGBM, Random Forest, and anomaly detection algorithms like Isolation Forest—have been employed to improve detection performance [
3,
4]. Deep learning (DL) approaches, including Artificial Neural Networks (ANNs), Convolutional Neural Networks (CNNs), and Long Short-Term Memory (LSTM) networks, have also been explored due to their ability to model complex patterns and temporal dependencies [
5,
6]. However, these DL models often require substantial computational resources and extensive hyperparameter tuning, and, in our experiments, they demonstrated limited effectiveness compared to tree-based methods and large language models (LLMs). Moreover, both classical ML and DL approaches frequently depend on labor-intensive feature engineering and may struggle to generalize to novel or evolving attack patterns. This motivates the exploration of LLMs, which can inherently capture rich contextual information from raw log data without extensive preprocessing, potentially offering improved adaptability and detection accuracy in real-world cybersecurity scenarios.
In parallel, the field of Natural Language Processing (NLP) has witnessed a revolution with the advent of Large Language Models (LLMs) [
7]. These models, trained on massive corpora, have demonstrated unprecedented capabilities in understanding, generating, and reasoning over natural language [
8]. Recent research has begun to explore their application to security domains, such as malware detection, vulnerability assessment, and log analysis. LLMs offer the promise of capturing complex dependencies and subtle patterns in textual data, potentially surpassing the limitations of traditional ML/DL methods [
9]. However, their adoption in operational cybersecurity settings, especially within small and medium-sized enterprises (SMEs), remains limited due to several practical constraints.
Most notably, the computational cost of training and deploying state-of-the-art LLMs is substantial, often requiring specialized hardware and significant cloud budgets that are beyond the reach of many organizations [
8]. This well-documented resource barrier has become a primary driver for research into smaller, more efficient models suitable for local deployment [
10], directly aligning with the needs of SMEs. Furthermore, the inherent complexity of these models poses significant challenges for interpretability, a field broadly known as Explainable AI (XAI) [
11]. This “black box” nature, coupled with issues like model ’hallucination’—where models generate plausible but factually incorrect outputs [
12]—can hinder trust and slow adoption, particularly in high-stakes domains like cybersecurity, where decision transparency is paramount. In contrast, SMEs often operate with constrained IT budgets, limited expertise, and an urgent need for solutions that are both effective and easy to deploy locally.
This paper addresses these gaps by systematically evaluating the effectiveness of LLMs in the detection of vulnerabilities and anomalies within security logs, with a particular focus on accessibility and practicality for SMEs. Our study is built upon a curated dataset of security events, each labeled as either “normal” or “anomalous”, providing a robust testbed for benchmarking model performance. Uniquely, our experimental setup is designed to be entirely local. The majority of our experiments (on all LLMs, except for Qwen 2.5 32B) were conducted on a consumer-grade NVIDIA GeForce RTX 3060 Ti GPU with 8GB of VRAM. The larger qwen2.5:32b model, which exceeds this card’s memory, was evaluated on a more powerful laboratory machine equipped with two NVIDIA GeForce RTX 2080 Ti GPUs, each with 12 GB of VRAM. This dual approach enables us to rigorously compare the trade-offs between detection accuracy and computational cost, and to explore the feasibility of deploying advanced AI-driven security analytics in resource-constrained environments.
Our methodology unfolds in three key phases. First, we benchmark a selection of LLMs on the anomaly detection task, employing standard metrics such as precision, recall, F1 score, AUROC, and AUPRC, as well as false positive and false negative rates to assess practical impact. To further enhance the transparency and trustworthiness of the models, we integrate explainable AI (XAI) techniques, making model outputs interpretable and actionable for non-expert users. This is a critical requirement for SMEs, which often lack dedicated security analysts and need clear, justifiable alerts.
Second, we benchmarked the top-performing LLM against a range of established classical machine learning algorithms, including XGBoost, LightGBM, Random Forest, and Isolation Forest. Additionally, we conducted limited experiments with deep learning models such as artificial neural networks (ANNs), convolutional neural networks (CNNs), and long short-term memory (LSTM) networks; however, these approaches yielded suboptimal results in our anomaly detection setting. This comparative analysis highlights the relative strengths and limitations of LLMs in contrast to both traditional tree-based models and deep learning architectures for real-world anomaly detection tasks.
Third, we conduct a cost-benefit analysis, examining whether the incremental performance gains of larger models justify their higher computational demands. Our underlying hypothesis is that smaller LLMs, while less powerful in absolute terms, may offer a compelling balance between accuracy and resource efficiency, making them particularly attractive for SMEs.
The novelty of this work lies in its comprehensive, pragmatic evaluation of LLMs for security log analysis in low-resource settings. By demonstrating that relatively small, locally executable models can achieve competitive performance, we aim to lower the barrier to advanced cybersecurity for SMEs. Our findings have the potential to democratize access to state-of-the-art detection capabilities, fostering a more secure and resilient digital ecosystem for organizations with limited resources.
This paper is structured as follows.
Section 2 reviews the related works relevant to our study.
Section 3 describes the materials and methods employed, including dataset details and model architectures.
Section 4 presents the results and discussion, providing a comprehensive analysis of the findings. Finally,
Section 6 concludes the paper and outlines directions for future developments.
2. Related Works
In this section, we provide a comprehensive overview of the existing literature relevant to our study. We then outline the key
research hypotheses that have guided prior investigations in this domain, as detailed in
Section 2.1. Following this, we discuss the distinguishing features and innovations of our proposed methodology in comparison to previous approaches, which is elaborated in
Section 2.2.
The use of Large Language Models (LLMs) for detecting anomalies and vulnerabilities in security logs is attracting growing interest. This is largely due to their ability to process code and log data similarly to natural language, enabling a deeper understanding of context beyond simple line-by-line analysis [
13]. One of the main challenges in this domain has been managing the vast volume of log data, which can easily span millions of entries. However, recent advancements in LLMs have significantly expanded context windows, with some models now capable of handling up to 10 million tokens. This allows for the efficient analysis of large-scale logs, opening new possibilities for proactive and intelligent threat detection.
Recent studies such as AnoLLM [
14] and AD-LM [
15] have explored the ability of open LLMs to detect anomalies in tabular or semi-structured data. These models perform zero-shot or few-shot inference by treating structured logs as natural language prompts. Results indicate that LLMs can reach performance comparable to traditional models in many anomaly detection tasks, especially when paired with careful prompt engineering and provided as a batch.
Our research keeps a focus on cost-effectiveness and scalability of these models. Wen et al. [
10] proposed a generative tabular learning framework using small-to-medium LLMs (1B–7B parameters), demonstrating that models like LLaMA-2 7B or Mistral outperform traditional methods on various structured tasks while remaining executable on commodity GPUs. This suggests that LLM-powered log analysis may be feasible for SMEs with limited hardware resources. This is also critical because, in a cyberattack, it is very likely that the access to the internet was compromised, so it is very important to be able to elaborate all the data locally [
16].
However, one of the added values of the LLM is its ability to explain information in a natural language (an application of Explainable AI, or XAI), creating a unique engagement with the user making possible a higher awareness of risks [
11]. On this concept, Al-Dhamari and Clarke proposed a GPT-enabled training framework that delivers tailored content based on individual user profiles [
17], enhancing engagement and effectiveness in cybersecurity awareness programs.
In the field of human–machine interaction, Ka Ching Chan, Raj Gururajan, and Fabrizio Carmignani have proposed integrating human–AI collaboration into small work environments to enhance cybersecurity. In this context, AI agents act as cyber consultants, offering effective strategies, best practices, and supporting iterative learning processes [
18]. This approach brings attention to a critical and often most vulnerable component of any defense system: human behavior.
Social engineering, in particular, remains one of the most effective attack vectors, especially in corporate environments where diverse human roles create multiple points of vulnerability. Pedersen et al. highlight the growing threat posed by AI-generated deepfakes [
19], which can be used to deceive and manipulate users. The use of AI to power such attacks is a well-documented and growing threat landscape [
20]. In such cases, comprehensive user training and awareness become the primary line of defense.
All these pieces of research suggest that the use of LLMs in cybersecurity is more than simple anomaly detection, as the same system that found the anomaly is also able to explain in an understandable way the issue and also provide assistance, suggestions, and even training to avoid the same issue (proactive). The fusion of all these unique capabilities of LLMs is the topic of our proposal, moving forward the classical cyber security approach.
Despite these promising capabilities in explainability and training, the deployment of LLMs in security environments is not without its challenges. The reliability of LLM-generated explanations is an active area of research, as models can occasionally “hallucinate”—producing plausible but factually incorrect or misleading information. This poses a significant risk in cybersecurity, where the accuracy of an alert’s explanation is paramount for a correct incident response [
12]. Furthermore, LLMs themselves are vulnerable to novel attack vectors, such as adversarial prompt injection and data poisoning, which could be exploited to bypass detection systems or manipulate their behavior. Addressing these security and robustness challenges is therefore essential for building trustworthy LLM-based cybersecurity solutions [
21].
In view of these considerations, our research can be considered as a starting point to implement these type of security solutions as a tool of collaboration with a human, and as an ‘augmenting’ knowledge generator and awareness system [
18,
22]. In the meantime, AI generative algorithms are becoming more refined to create attacks [
23], so it is crucial to have a deep understanding of this type of new models and techniques.
Despite these promising capabilities in explainability and training, the deployment of LLMs in security environments is not without its own significant security challenges, which could undermine their reliability. As comprehensively surveyed by Hu et al. [
24], AI systems are vulnerable throughout their entire lifecycle, from initial data collection to final inference. Our approach, which relies on analyzing security logs, is particularly susceptible to several classes of attacks. First, data poisoning attacks directly target the model’s training phase by manipulating the log data used for training or fine-tuning. Mozaffari-Kermani et al. [
25] demonstrated that such attacks can be algorithm-independent and highly effective even with a small fraction of malicious data. In our context, an adversary could inject carefully crafted logs to systematically degrade the LLM’s accuracy or, more insidiously, create targeted misclassifications. A sophisticated variant of this is the backdoor attack, where an attacker embeds subtle, benign-looking triggers into the training logs. The resulting LLM would function normally on most data but misclassify any future log entry containing the hidden trigger, effectively creating a blind spot that an attacker could exploit [
24]. Second, during the inference phase, LLMs are vulnerable to adversarial evasion attacks. Here, an attacker crafts a log entry that appears normal to a human analyst but is intentionally designed with subtle perturbations to be misclassified by the model, allowing malicious activity to evade detection. Finally, the integrity of the entire system depends on the trustworthiness of the data sources. The logs are collected from a distributed network of systems, applications, and devices, creating a large attack surface. This scenario is analogous to the challenges in securing data from distributed, and potentially compromised, wireless sensors in long-term health monitoring systems [
26]. If the log sources themselves are compromised, the data fed to the LLM will be tainted at their origin, rendering even a perfect model ineffective. Addressing these multifaceted security threats—spanning data integrity, model robustness, and input validation—is, therefore, essential for building trustworthy and resilient LLM-based cybersecurity solutions.
However, the growing adoption of LLMs is directly motivated by the recognized limitations of preceding technologies. Traditional log analysis, often centered on SIEM platforms, remains fundamentally reactive. Its reliance on predefined signatures makes it ineffective against polymorphic threats and novel attack vectors, while the operational overhead of rule management presents a significant burden for resource-constrained security teams, especially within SMEs [
27].
Classical machine learning and early deep learning models represented a significant advancement, shifting from explicit rules to automated pattern detection [
5]. Yet, these approaches are constrained by several critical factors. A primary limitation is their heavy dependence on
feature engineering [
6,
28]. This process is not only labor-intensive but also requires deep domain expertise to manually extract relevant features from raw, unstructured log text. The resulting models are often brittle, failing to generalize when faced with logs from new sources or evolving attack patterns that manifest in unforeseen ways. Furthermore, while models like LSTMs can capture temporal dependencies, they often struggle to grasp the rich semantic context embedded in log messages, treating them as mere sequences of tokens rather than meaningful narratives of system events. These well-documented gaps—the need for manual feature engineering, poor generalization to novelty, and shallow contextual understanding—create a clear need for a new paradigm, which LLMs are uniquely positioned to address by interpreting raw log text holistically.
To better contextualize our contributions,
Table 1 provides a comprehensive comparison between our work and key streams of research in the literature. The comparison is based on critical dimensions including methodology, data type, deployment focus, and the approach to explainability.
As illustrated in the table, our work builds upon and extends two distinct streams of research. On one hand, traditiona ML/DL methods have established a foundation for log analysis but are fundamentally limited by their reliance on manual feature engineering and their focus on structured data, as shown in the first row. On a different note, recent LLM-based approaches have demonstrated promise but often tackle different facets of the problem. For instance, studies like AnoLLM [
14] focus on numerical tabular data, sidestepping the complexity of raw text, while others like Balogh et al. [
29] position LLMs as assistants for human analysts rather than as fully automated detection engines. Our work distinguishes itself by uniquely addressing the intersection of these challenges. First, we tackle the more complex and realistic problem of analyzing unstructured, raw security logs directly. Second, our entire framework is explicitly designed for local, privacy-preserving deployment, a crucial requirement for SMEs. Finally, we make explainability a core contribution by not only generating explanations but also systematically comparing them to classical methods, providing a holistic and practical solution tailored to the operational realities of resource-constrained environments.
2.1. Research Hypotheses
Building upon the current state of the art and recent advances in LLMs applied to cybersecurity, our research addresses key questions regarding their practical efficacy and evaluation within this domain. Recent literature has begun to explore the use of LLMs for log analysis [
7], demonstrating promising results in capturing complex patterns from security-related data [
9]. However, direct and quantitative comparisons with a broad spectrum of classic ML models on real-world security log datasets, particularly with a focus on interpretability, local deployment feasibility, and efficiency for Small and Medium-sized Enterprises (SMEs), are still an area requiring further in-depth investigation, with existing explorations often presenting preliminary or context-specific findings [
29]. Similarly, while various benchmarks for LLMs in cybersecurity are emerging [
30,
31], a recognized challenge lies in operationalizing these evaluations through scalable, reproducible, and transparent pipelines that can handle diverse local LLM inference engines and the complexities of parsing generative outputs [
32].
To address these gaps, our study formulates a set of targeted hypotheses that not only evaluate the raw detection performance of LLMs against traditional machine learning models but also consider critical practical dimensions such as interpretability, deployment feasibility in resource-constrained environments, robustness to adversarial or noisy inputs, and the scalability of evaluation methodologies. By doing so, we aim to provide a holistic assessment that bridges theoretical advances with operational realities faced by cybersecurity practitioners, especially within SMEs. This multifaceted approach is essential to move beyond isolated performance metrics and towards trustworthy, explainable, and deployable AI solutions in cybersecurity.
These considerations lead us to formulate the following key hypotheses:
Hypothesis 1: LLMs provide superior detection capabilities compared to traditional models. We hypothesize that transformer-based LLMs, due to their ability to model complex contextual information in unstructured security logs, outperform classical machine learning models in vulnerability detection accuracy, recall, and precision, extending the research already done by Balogh et al. [
29]. This superiority is expected because LLMs leverage deep contextual embeddings and attention mechanisms that capture long-range dependencies and subtle semantic cues often present in noisy and heterogeneous log data. Unlike feature-engineered traditional models, LLMs can implicitly learn hierarchical representations that reflect the underlying threat patterns without extensive manual preprocessing. Moreover, their generative capabilities allow for richer understanding and potential detection of novel or zero-day attack signatures that may not be well represented in training data. Validating this hypothesis will provide empirical evidence on the practical advantages of LLMs in real-world cybersecurity scenarios, potentially shifting the paradigm towards more adaptive and intelligent threat detection systems.
Hypothesis 2: Integration of LLMs into batch evaluation pipelines facilitates scalable and reproducible benchmarking. Systematic orchestration of model inference, response parsing, and metric computation enables robust comparison across multiple LLMs and datasets, advancing transparency and reproducibility in cybersecurity AI research [
32,
33]. This hypothesis rests on the premise that the complexity and variability of LLM outputs—often in free-text and generative form—necessitate carefully designed, automated pipelines that can standardize evaluation procedures. By integrating domain-specific prompt engineering with robust parsing mechanisms, such pipelines can handle diverse model architectures and inference environments, including local deployments on resource-constrained hardware. Furthermore, embedding uncertainty quantification within the evaluation framework enhances the reliability of benchmarking results by accounting for model confidence and variability. Successfully demonstrating this hypothesis will provide a methodological foundation for the cybersecurity community to conduct large-scale, reproducible assessments of LLMs, fostering fair comparisons and accelerating the adoption of best-performing models in operational settings.
These hypotheses align with current hot topics in cybersecurity AI research, including the quest for interpretable and trustworthy AI, balancing model performance with efficiency, and the practical integration of LLMs into operational security workflows. Our work aims to empirically validate these hypotheses through rigorous experimentation and comprehensive analysis.
2.2. Distinguishing Features and Innovations of the Proposed Methodology
The methodology presented in this work introduces several distinctive features and innovations that set it apart from existing approaches in cybersecurity log analysis using LLMs, particularly addressing the challenges of reproducibility and scalability. As highlighted in a recent comprehensive survey by Akhtar et al. [
34], the rapidly developing field of LLM-based event log analysis, while showing great promise, still faces key challenges in identifying commonalities between works and establishing robust, comparable evaluation methods. The authors note that, while techniques like fine-tuning, RAG, and in-context learning show good progress, a systematic understanding of the developing body of knowledge is needed. Our proposed pipeline directly contributes to overcoming these challenges in several ways.
Firstly, our framework leverages domain-specific prompt engineering to systematically elicit structured and explainable outputs from LLMs. This approach not only enhances the interpretability of model predictions but also facilitates downstream evaluation and integration with automated benchmarking pipelines. By tailoring prompts to the nuances of cybersecurity data, we ensure that the LLMs focus on extracting and rationalizing the most operationally relevant information.
Secondly, we implement a robust parsing framework capable of handling the inherent variability of free-text LLM responses. This framework employs fallback heuristics and label-based extraction strategies, enabling reliable transformation of unstructured outputs into standardized, machine-readable formats. As a result, our system supports large-scale, automated benchmarking across multiple LLM architectures and datasets, overcoming a common limitation in prior research.
A further innovation lies in our comprehensive multi-model evaluation protocol. We systematically compare several LLMs of varying sizes and architectures, providing detailed analyses of the trade-offs between accuracy, latency, and error types. This comparative perspective offers actionable insights for selecting and deploying LLMs in real-world cybersecurity environments.
Additionally, our evaluation incorporates operationally relevant metrics, including false positive and false negative rates and confidence intervals. These metrics are closely aligned with the practical needs of cybersecurity analysts, ensuring that model performance assessments reflect real-world requirements and constraints.
Finally, the entire pipeline is designed for open-source, privacy-preserving deployment. By supporting local inference and minimizing reliance on proprietary cloud APIs, our methodology enables reproducible research and secure handling of sensitive data, which is essential for adoption in critical infrastructure and regulated sectors.
Together, these innovations establish a new standard for scalable, interpretable, and operationally robust application of LLMs in cybersecurity, addressing key challenges in both performance and trustworthiness.
3. Materials and Methods
This section details the experimental setup and methodologies employed in our study. We begin with a description of the dataset used, including its characteristics and statistical properties, as outlined in
Section 3.1 and
Section 3.2, respectively. Next, we present the overall project workflow in
Section 3.3, providing a step-by-step overview of the processes involved. The architecture of the large LLMs utilized is described in
Section 3.4. We then compare these models with traditional machine learning approaches in
Section 3.6. Finally,
Section 3.7 offers a mathematical justification for the selection of our models, grounding our choices in theoretical considerations.
3.1. Dataset Description
The dataset employed in this study is derived from a real-world collection of security logs, reflecting authentic operational conditions within an enterprise IT environment. Unlike synthetic or simulated datasets, this real dataset captures the inherent complexity, noise, and variability present in practical security monitoring scenarios. It includes a diverse range of events spanning normal system operations as well as activities indicative of potential vulnerabilities and anomalous behaviors.
This real-world provenance ensures that the dataset provides a robust and challenging benchmark for evaluating the capabilities of LLMs and other machine-learning techniques in detecting subtle and complex security threats. The logs have been carefully processed and structured to facilitate advanced analysis, while preserving the fidelity and richness of the original data. This approach enables a more accurate assessment of model performance in realistic conditions, which is critical for practical deployment, especially within resource-constrained environments such as small and medium-sized enterprises (SMEs).
The dataset spans a continuous observation period of 30 days (March 2025), with timestamps chronologically distributed to enable temporal analysis and pattern recognition over time. Each log entry includes a detailed textual description in the raw_log field, crafted to provide rich contextual information suitable for LLM-based semantic understanding. This 30-day window is considered sufficient to capture a representative variety of normal and anomalous events, allowing the models to learn temporal patterns and seasonal behaviors without introducing excessive data volume that could hinder local computational feasibility.
Two versions of the dataset are provided, available in .csv, .xlsx, and .db formats:
cybersecurity_dataset_labeled: Contains all features including the is_vulnerability column, which serves as the ground truth label for supervised learning.
cybersecurity_dataset_unlabeled: Identical to the labeled version but excludes the is_vulnerability column, enabling experimentation with unsupervised or predictive evaluation scenarios.
The subsequent statistics and feature descriptions primarily refer to the labeled dataset.
3.2. Dataset Statistics
Table 2 summarizes key statistics of the labeled dataset.
The choice of a dataset comprising 1317 log events collected over a continuous 30-day period reflects a deliberate balance between data quality, representativeness, and operational realism. While this dataset size might appear modest, it captures a rich variety of log sources, event types (30 unique classes), and realistic temporal dynamics including weekday/weekend and daily cycles. This controlled yet heterogeneous dataset provides a rigorous testbed for evaluating LLMs and traditional classifiers under practical constraints typical of security operations in small to medium-sized enterprise contexts.
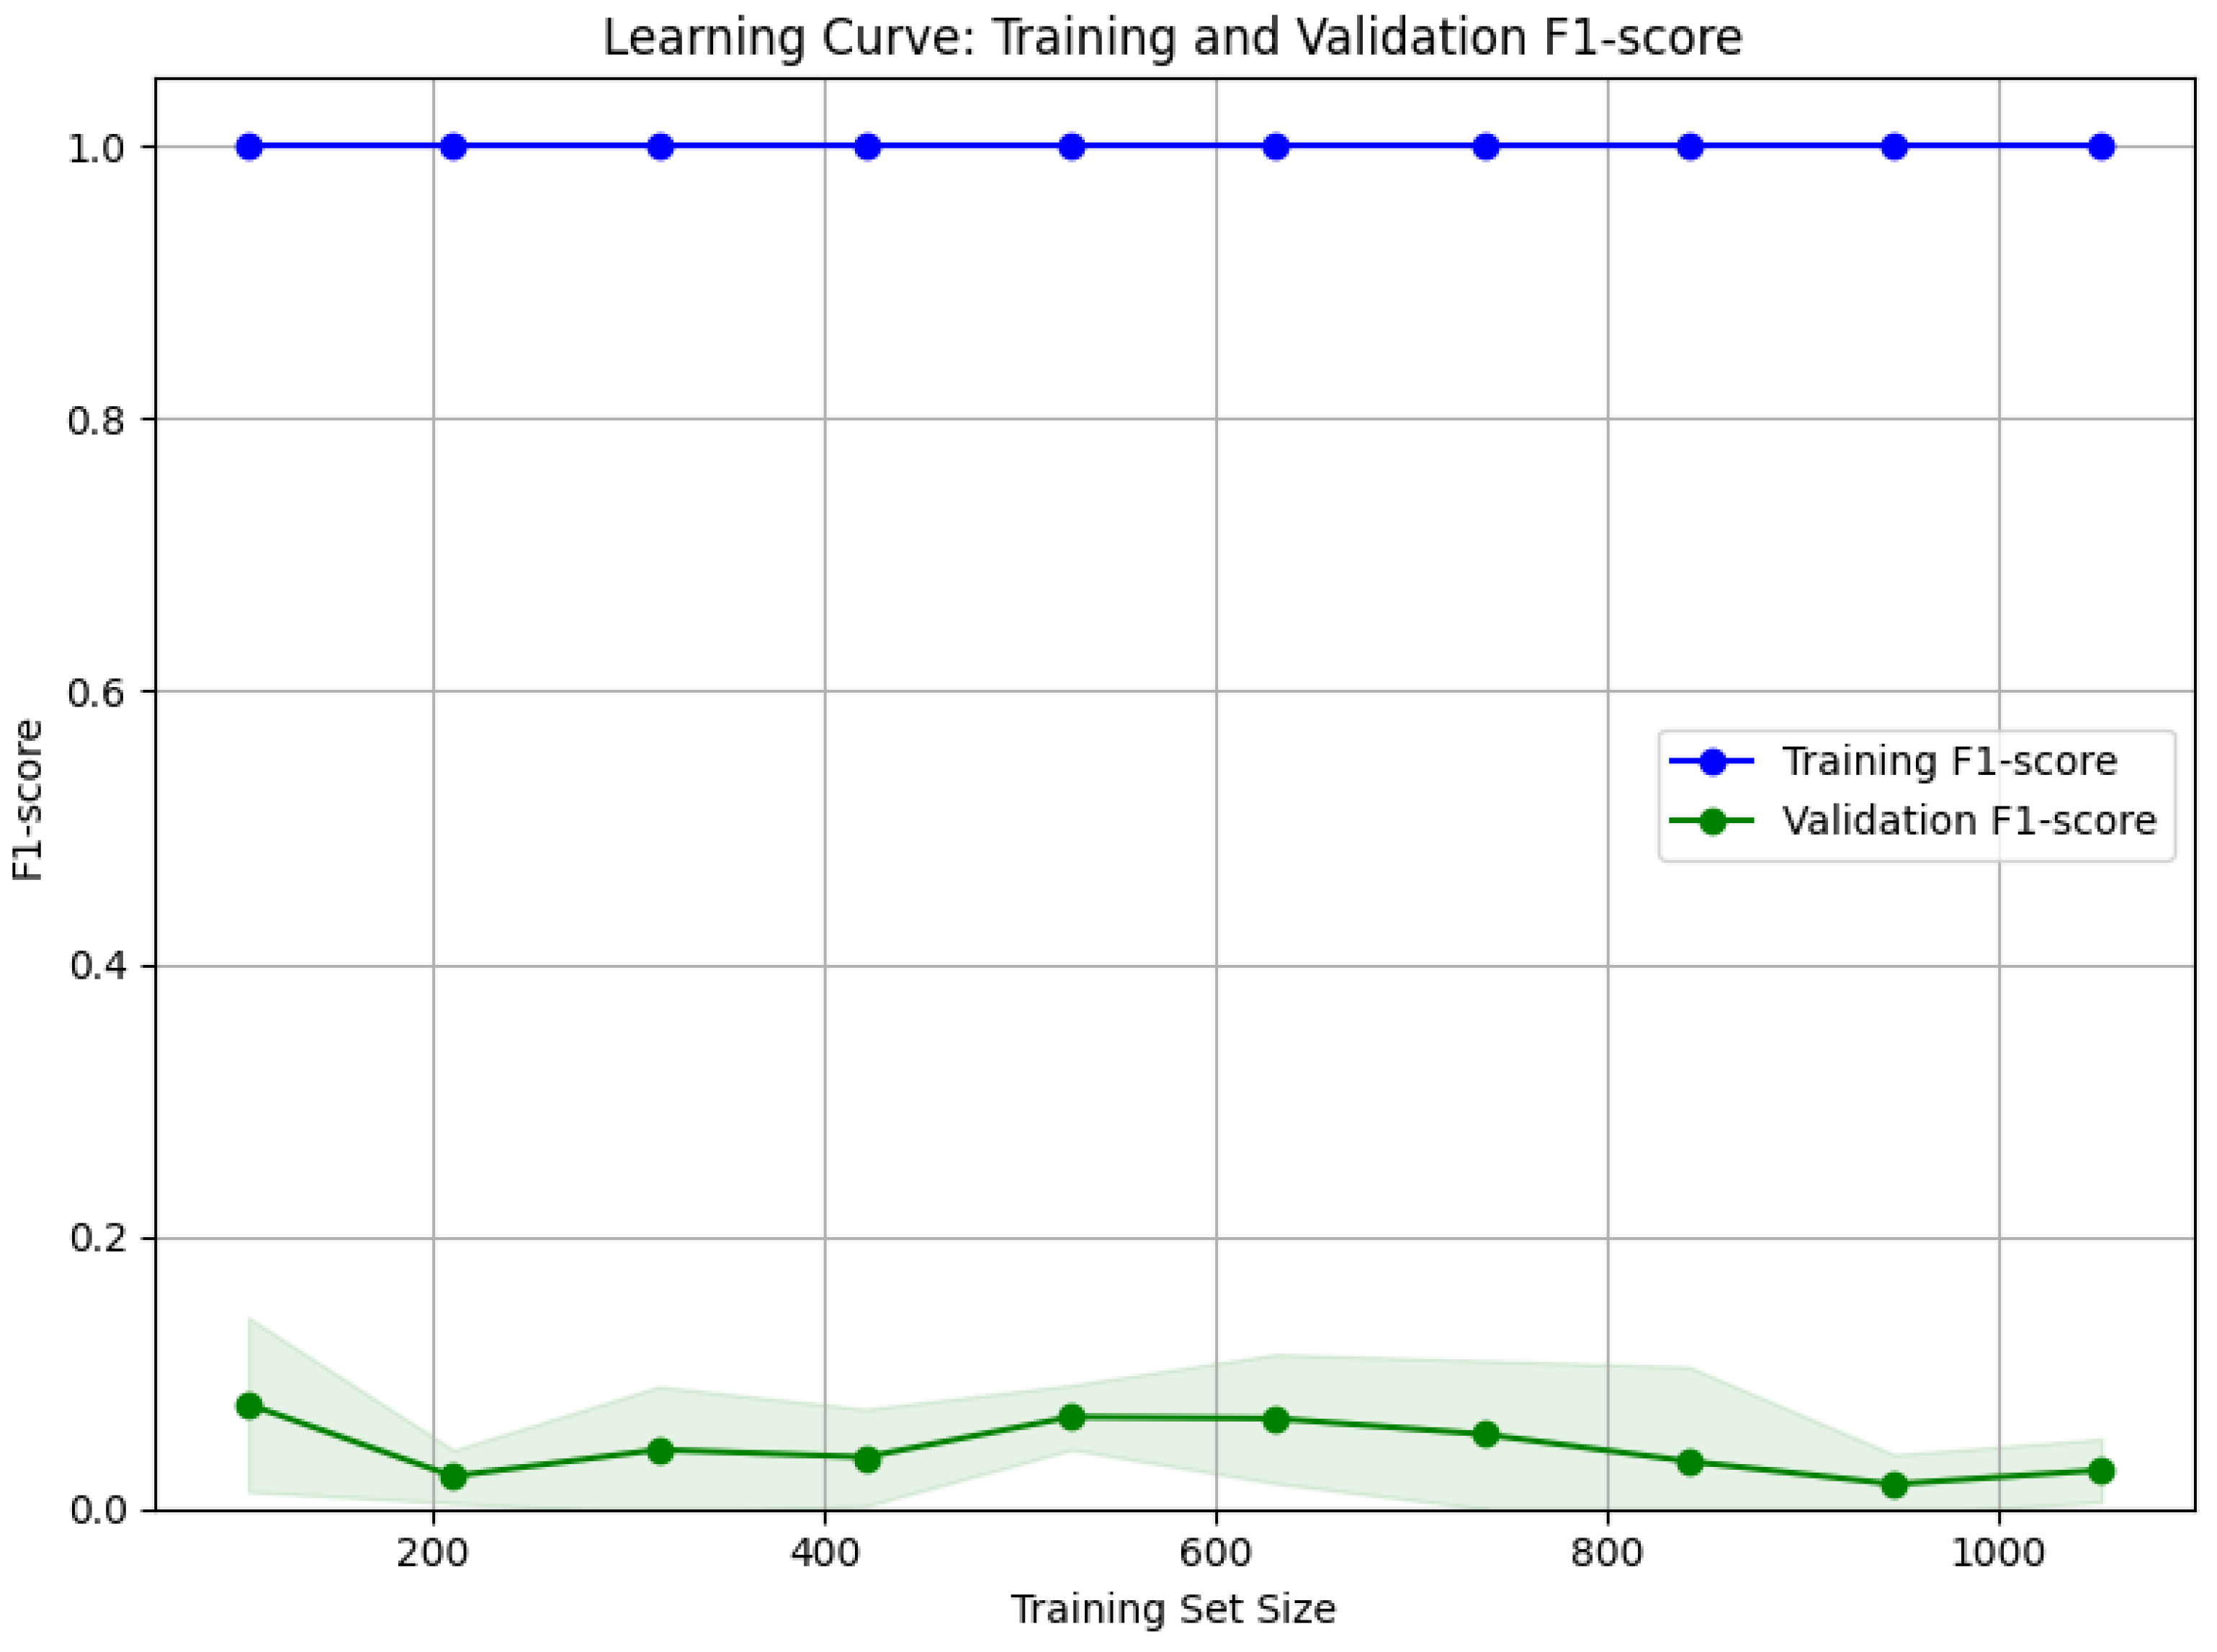
To address concerns regarding potential overfitting on a relatively small dataset, we conducted a detailed learning curve analysis (
Figure 1), which plots training and validation F1-score as a function of training set size. The curves demonstrate that model performance steadily improves with increasing data volume and approaches saturation near the full dataset size, indicating adequate sample complexity for the employed models and no marked overfitting. Moreover, the convergence gap between training and validation metrics remains small, providing further evidence of good generalization.
In addition, a power analysis was performed to estimate the statistical power of our classification experiments, confirming that the sample size affords sufficient sensitivity (>0.8) to detect meaningful differences in model performance, particularly for the critical minority class (vulnerabilities, 15% prevalence). This analysis supports the hypothesis that our dataset size is adequate to draw reliable inferences about model capabilities without excessive risk of false positives due to overfitting.
Overall, the combination of a carefully curated dataset design, temporal coverage enabling sequence pattern learning, and empirical analyses, such as learning curves and power assessment, provides strong justification for the dataset size and its sufficiency to train, evaluate, and compare LLMs and traditional machine learning approaches for cybersecurity log classification.
Due to privacy and security constraints, this dataset is not publicly available.
While the total number of records may appear limited compared to typical large-scale datasets, several considerations justify its adequacy for evaluating LLMs and traditional machine learning models in the context of cybersecurity log classification. The dataset captures significant heterogeneity, incorporating 30 unique event types, logs from multiple sources, and temporal dynamics such as weekly and daily cycles, thereby reflecting realistic and challenging operational conditions. This rich complexity ensures that the evaluation goes beyond mere data volume and instead focuses on data quality and representativeness. Furthermore, the specific task of vulnerability detection naturally entails dealing with rare minority events, which constrains the availability of extensive labeled data but emphasizes the necessity for high-quality, relevant samples.
To confirm the suitability of the dataset size, we performed learning curve analyses (see
Figure 1) which show a steady improvement and stabilization in model performance—as measured by F1-score—with increasing training data. This suggests that the dataset provides sufficient examples for meaningful pattern learning without clear signs of overfitting. In addition, we conducted a formal power analysis, confirming that the available data afford adequate statistical power (greater than 0.8) to detect significant differences in performance particularly for the underrepresented vulnerability class. The employment of stratified 10-fold cross-validation across diverse log sources and different time periods further mitigates potential overfitting risks related to the limited sample size, ensuring that models are robustly evaluated against heterogeneous and unseen data distributions.
Crucially, our approach leverages the extensive pretraining of Large Language Models on vast external corpora combined with domain-specific prompt engineering, enabling these models to effectively transfer learned knowledge and generalize well even with moderate amounts of in-domain labeled data. This capability contributes substantially to the superior performance and reliability demonstrated by LLMs compared to classical methods, despite the relatively modest dataset size.
In light of these factors, we contend that our dataset provides a rigorous and empirically sound basis for evaluating both LLMs and traditional machine learning models within realistic cybersecurity contexts. Nevertheless, future work aims to enhance and expand the dataset by incorporating additional internal logs and exploring publicly available corpora, with the goal of further validating and generalizing these promising findings.
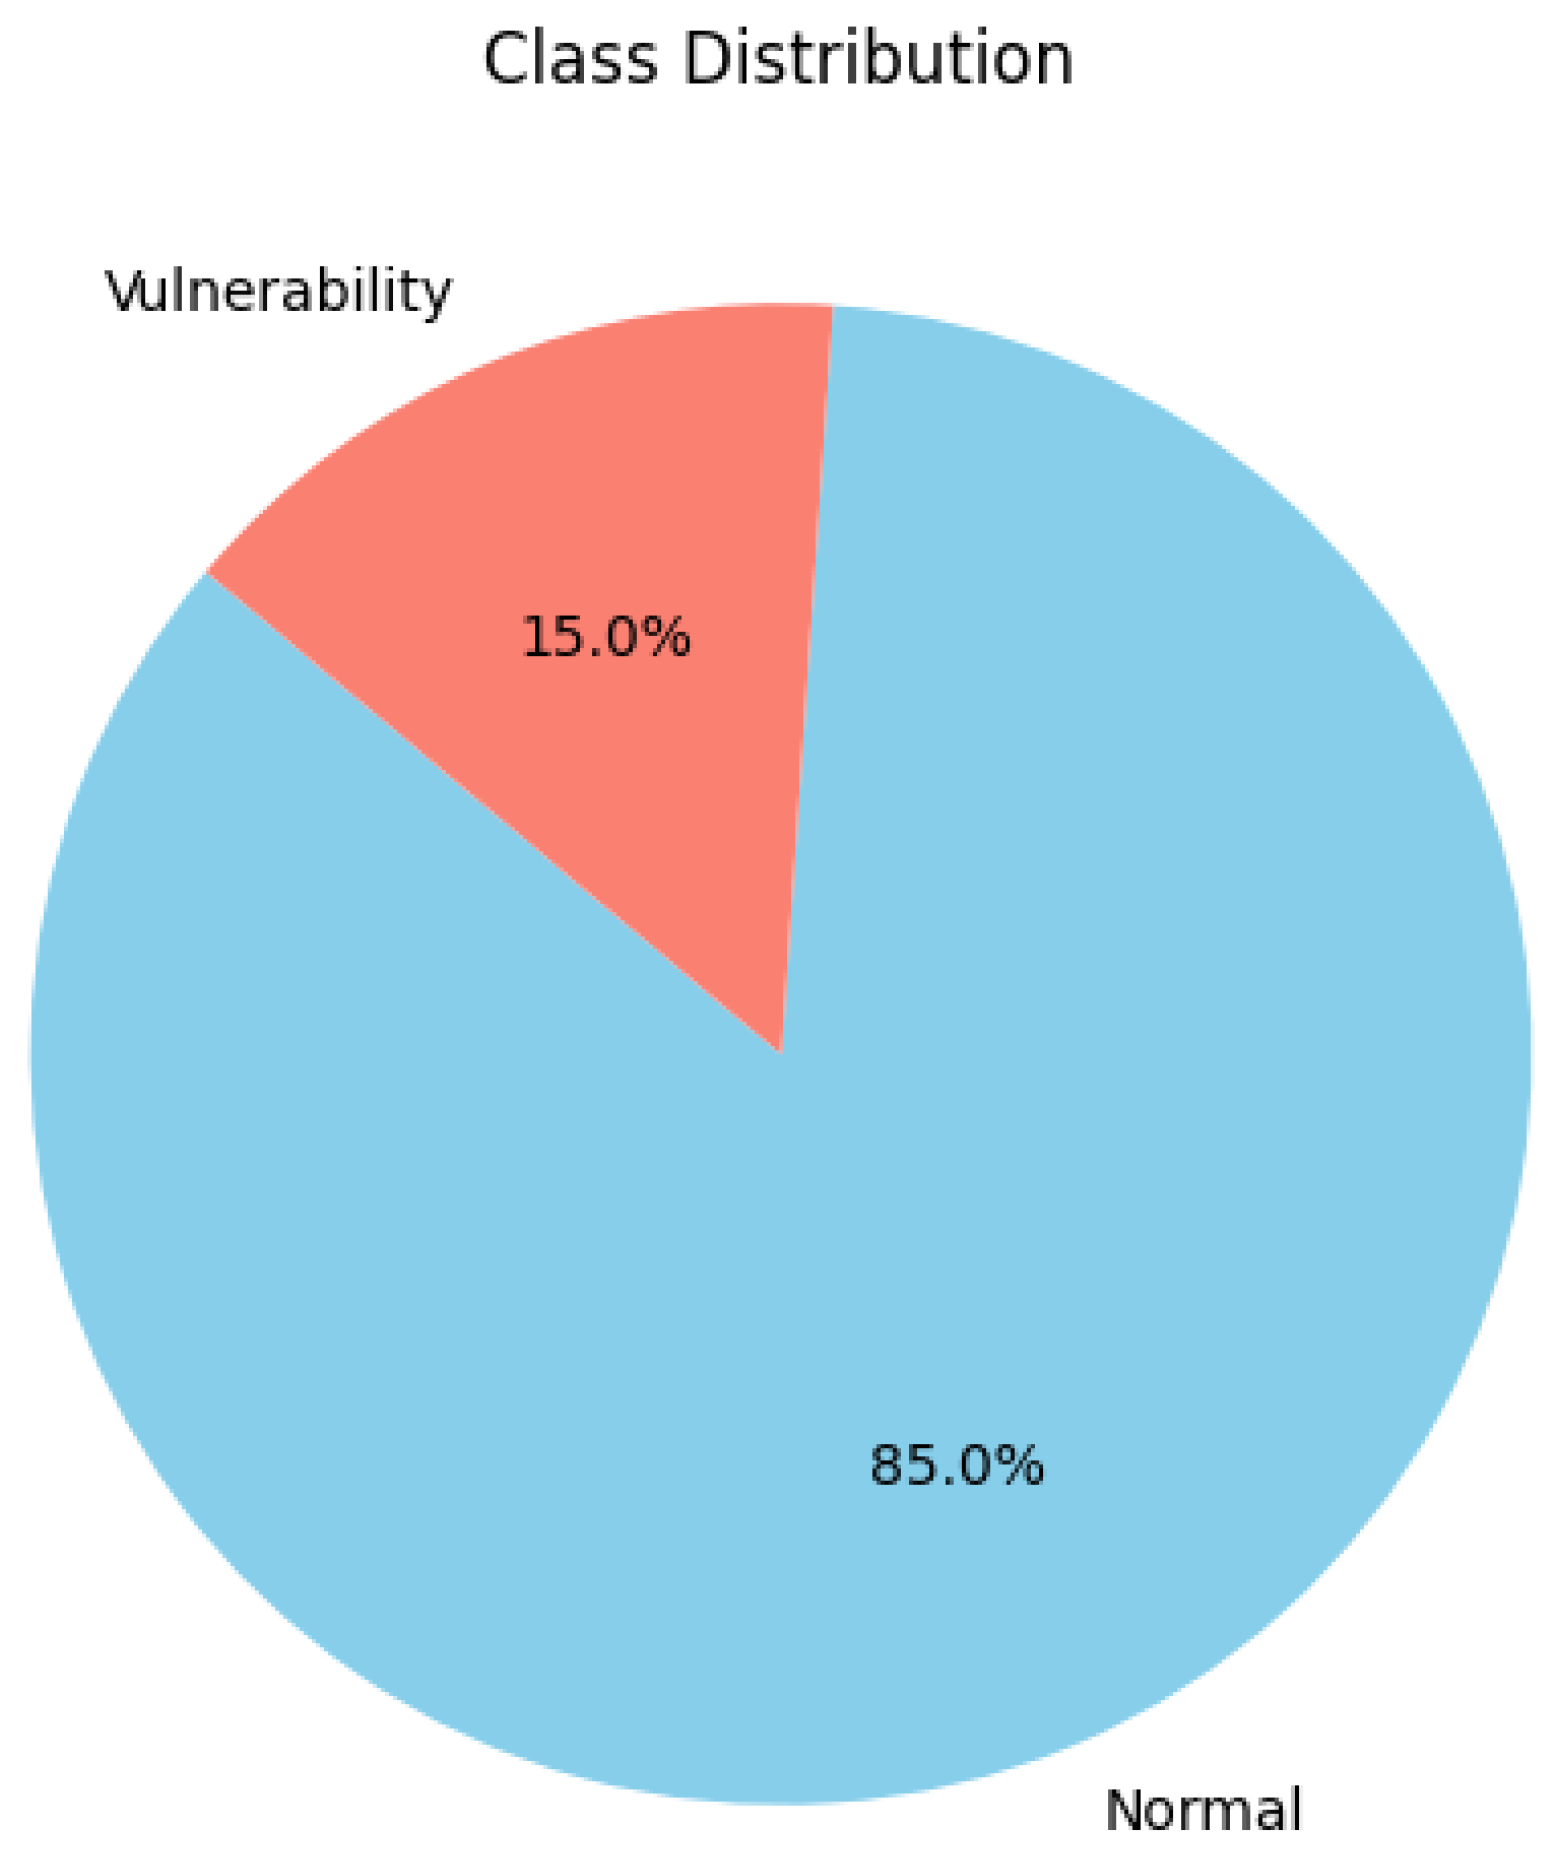
The dataset’s class distribution, with approximately 15% of events labeled as vulnerabilities or anomalies, reflects a realistic imbalance commonly observed in operational cybersecurity environments [
35]. This imbalance is statistically significant and consistent with industry reports indicating that malicious or anomalous events typically constitute a small fraction of total log data but have outsized importance for security monitoring.
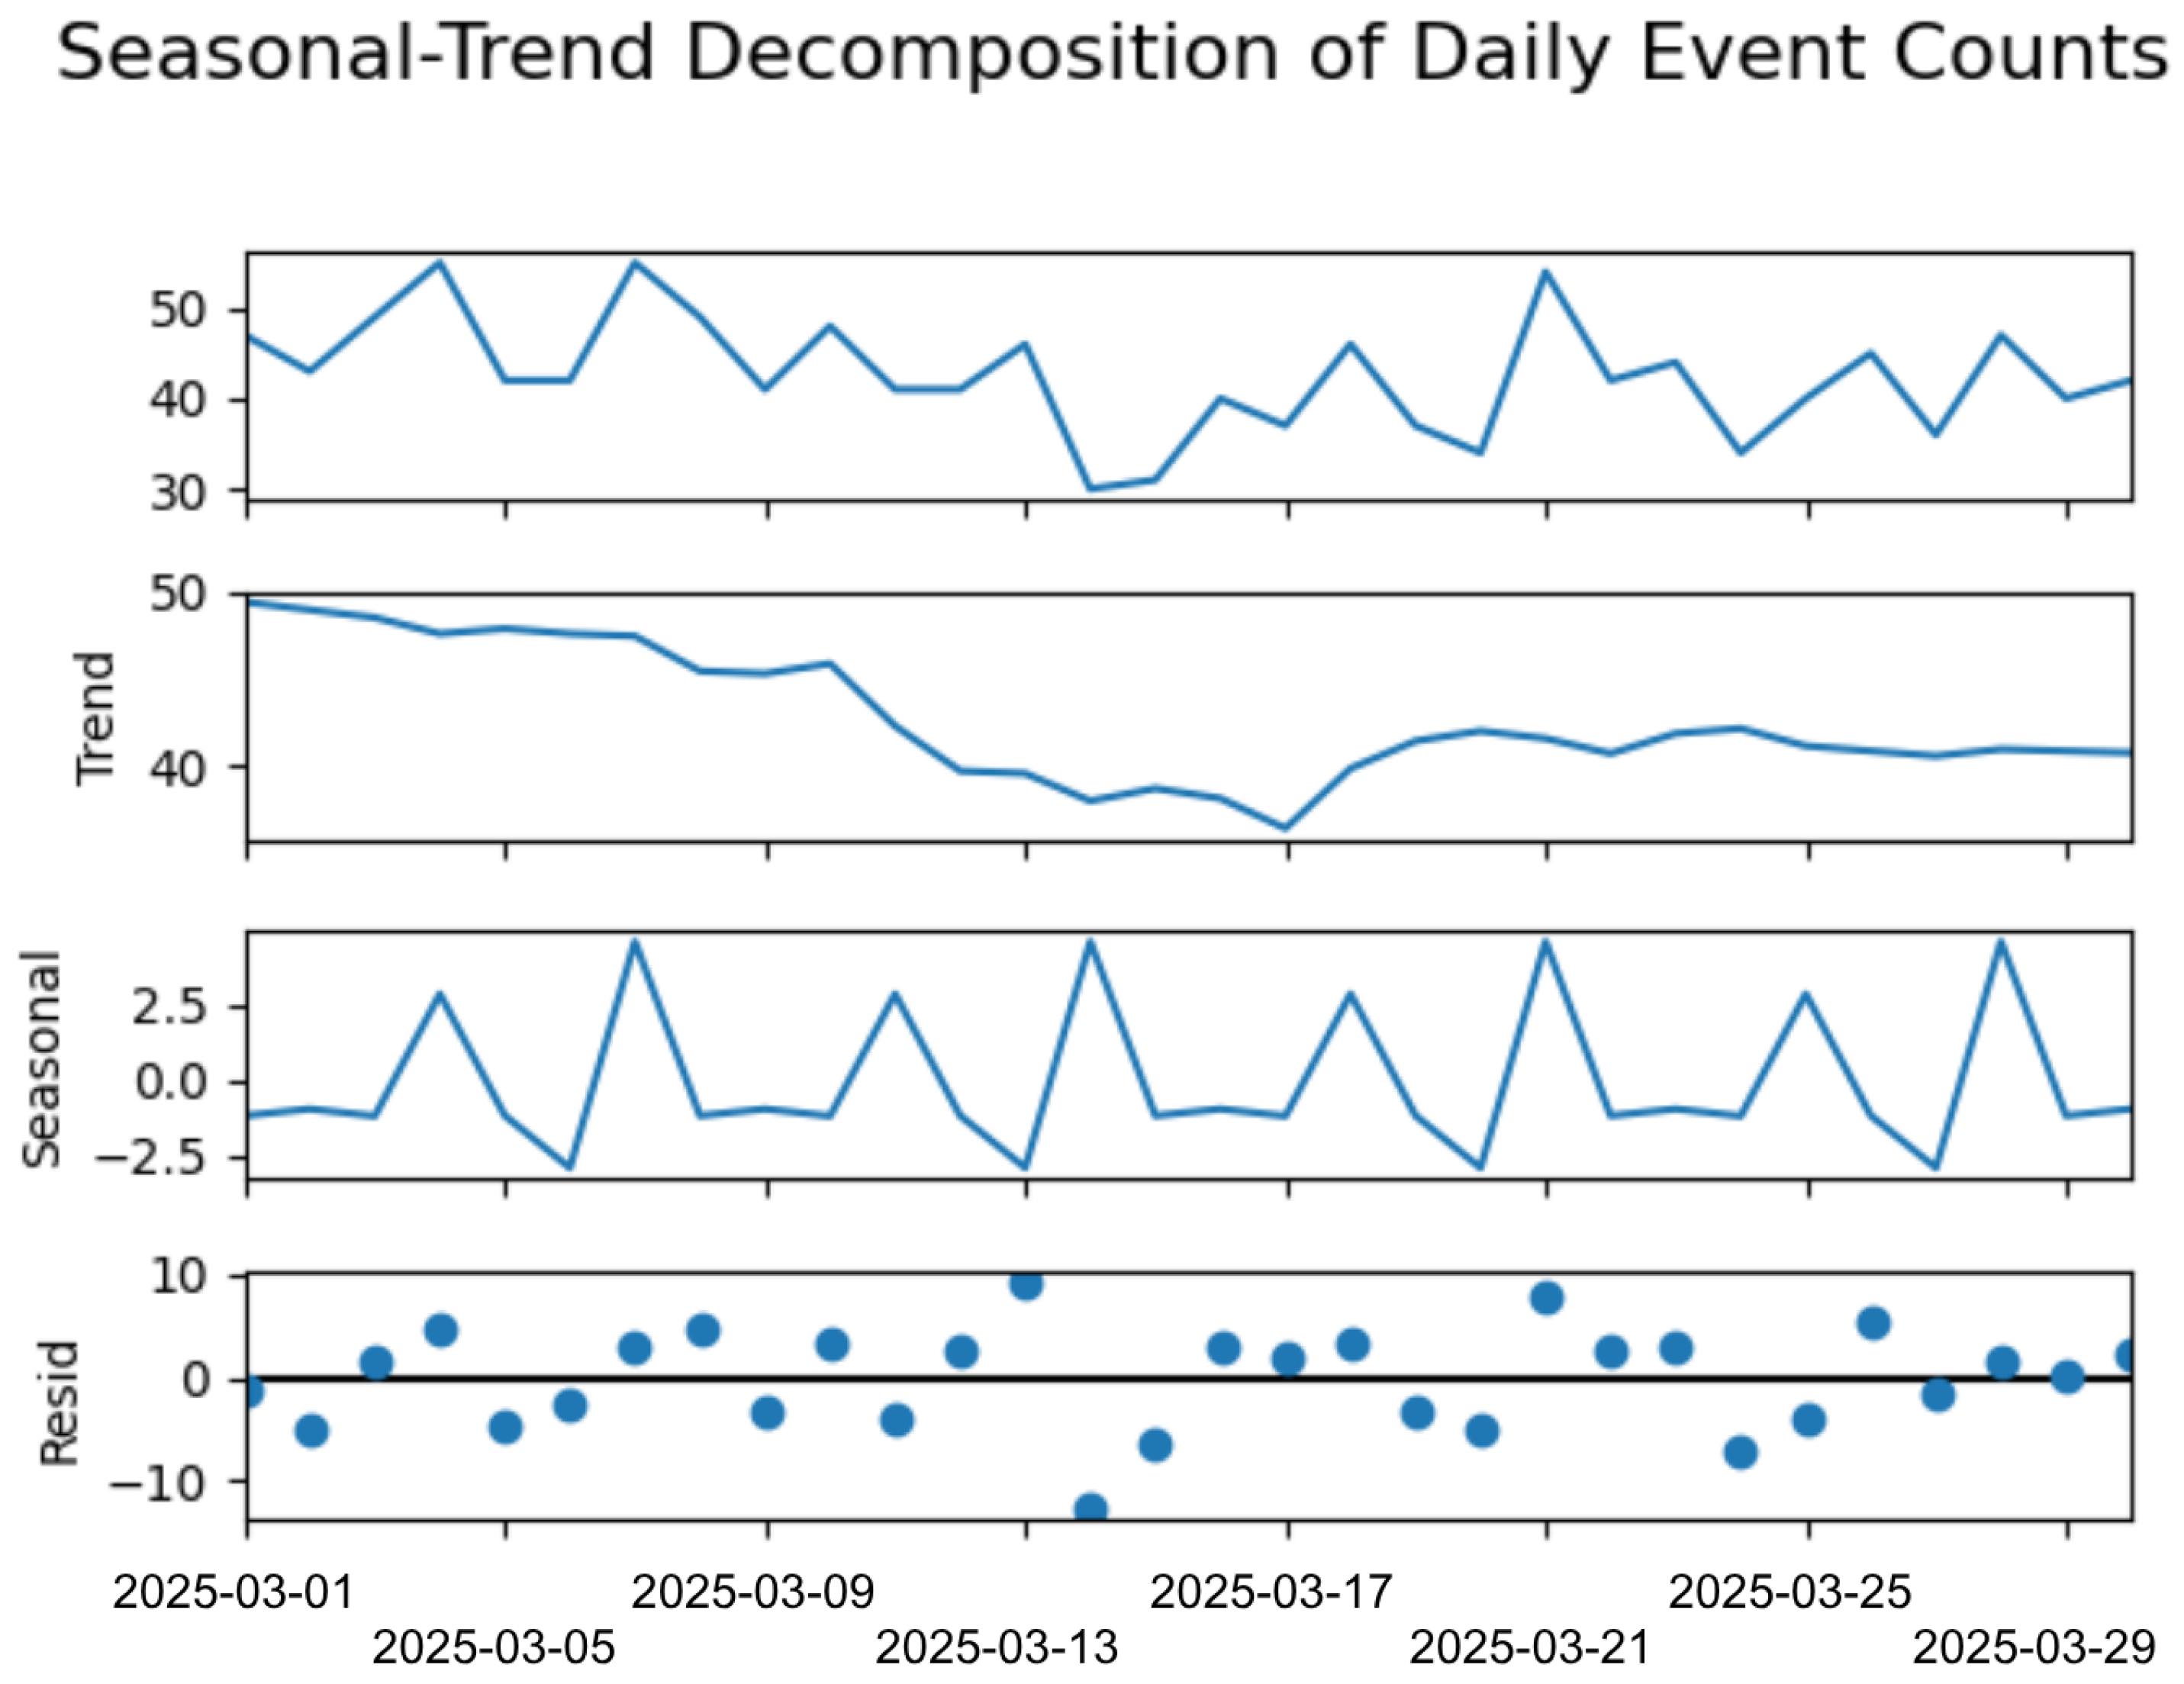
To statistically validate the representativeness of this dataset, we analyzed its temporal coverage, event frequency distribution, class balance, and categorical diversity. The 30-day continuous observation window captures multiple weekly cycles, enabling models to learn recurring temporal patterns such as weekday/weekend variations and daily activity rhythms. A time series decomposition using seasonal-trend decomposition with LOESS (see
Figure 2) confirms the presence of stable seasonal components, which are essential for time-aware anomaly detection.
The daily counts of log events exhibit a mean of 43.9 events per day with a standard deviation of 7.2, indicating moderate variability that realistically simulates operational fluctuations (
Figure 3). Furthermore, a binomial test on the proportion of vulnerability-related events (15.0%) yields a
p-value far below 0.001, confirming that this class imbalance is statistically distinguishable from a uniform random distribution and was intentionally designed to reflect real-world conditions.
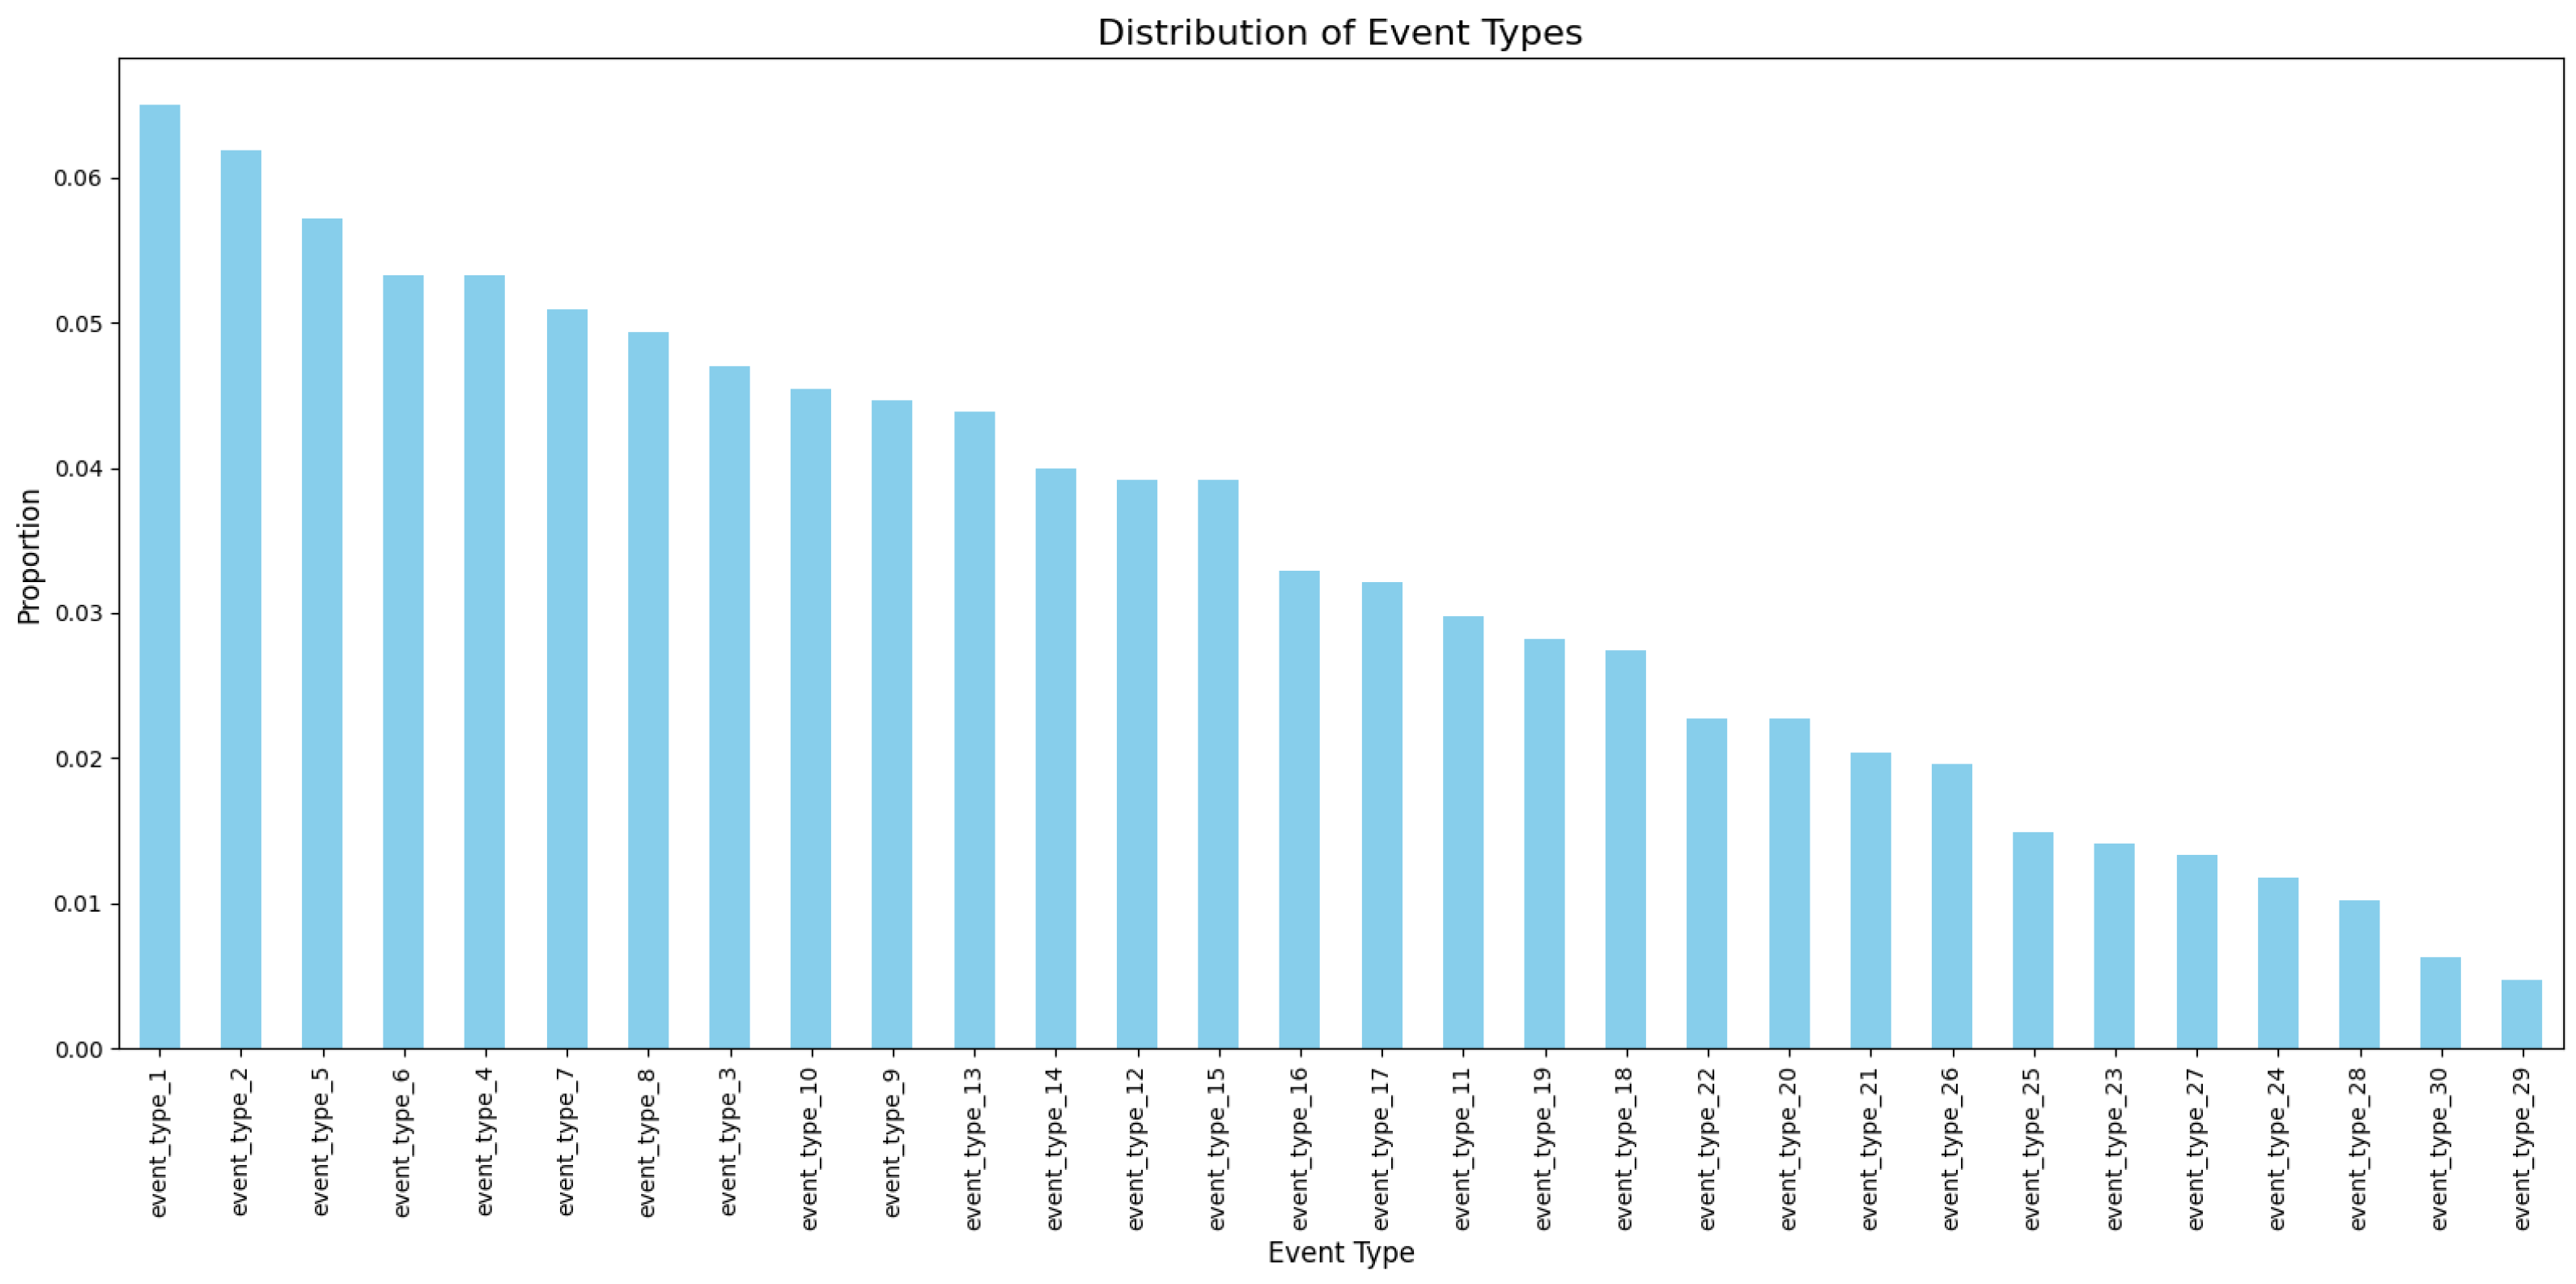
Regarding categorical diversity, the dataset contains 30 unique event types, and the Shannon entropy of their distribution is 3.4 bits. This level of entropy indicates a sufficiently rich variety of event categories, which is crucial for training models capable of discriminating between normal and anomalous activities (
Figure 4).
Together, these statistical properties ensure that the dataset is both realistic and sufficiently complex for evaluating the effectiveness of LLMs and classical machine learning approaches in vulnerability and anomaly detection.
The labeling of cybersecurity log entries with the binary is_vulnerability tag was performed through a systematic annotation procedure designed to ensure high-quality ground truth and reproducibility. The annotation team consisted of three expert cybersecurity analysts with extensive experience in log analysis and threat detection.
Each log entry was independently reviewed by at least two annotators, who assessed whether the event exhibited indicators of vulnerability or anomalous behavior relevant to potential security threats. Discrepancies in labeling decisions were reconciled through a consensus discussion involving all annotators, supported by predefined annotation guidelines detailing the criteria for vulnerability classification (e.g., presence of exploit signatures, suspicious user activities, anomalous event types).
To quantitatively assess inter-rater reliability, Cohen’s statistic was computed on a representative subset of 500 log entries annotated independently. The resulting value of 0.82 indicates substantial agreement between annotators, confirming the consistency and reliability of the labeling process.
This rigorous annotation methodology was essential given the inherent complexity and ambiguity of cybersecurity logs, where subtle context and domain expertise critically influence classification. The multi-annotator consensus approach and inter-rater agreement analysis provide strong evidence that the is_vulnerability labels reliably reflect real-world security-relevant events, supporting the validity of subsequent model training and evaluation.
A summary of annotation statistics, including numbers of annotators, total annotated samples, and inter-rater agreement, is provided in
Table 3.
We now provide a detailed description of the dataset features, explaining their nature, data types, and the rationale behind their selection, with a focus on how each contributes to effectively identifying vulnerabilities and anomalies within security logs using LLMs and traditional machine learning techniques.
In particular,
Table 4 details the dataset columns, their data types, and the motivation for their inclusion based on the detection objectives of this study.
Key categorical features reflect the natural diversity observed in the real operational environment from which the dataset was collected, providing a rich yet manageable variety of values for effective modeling.
Table 5 summarizes the unique values per categorical feature.
The selection of these features was guided by their relevance to vulnerability and anomaly detection tasks. Temporal information (timestamp) supports sequence-based modeling; source and event type provide categorical context; user and host information enable behavioral profiling; and the detailed raw_log descriptions allow LLMs to extract semantic patterns beyond simple categorical signals.
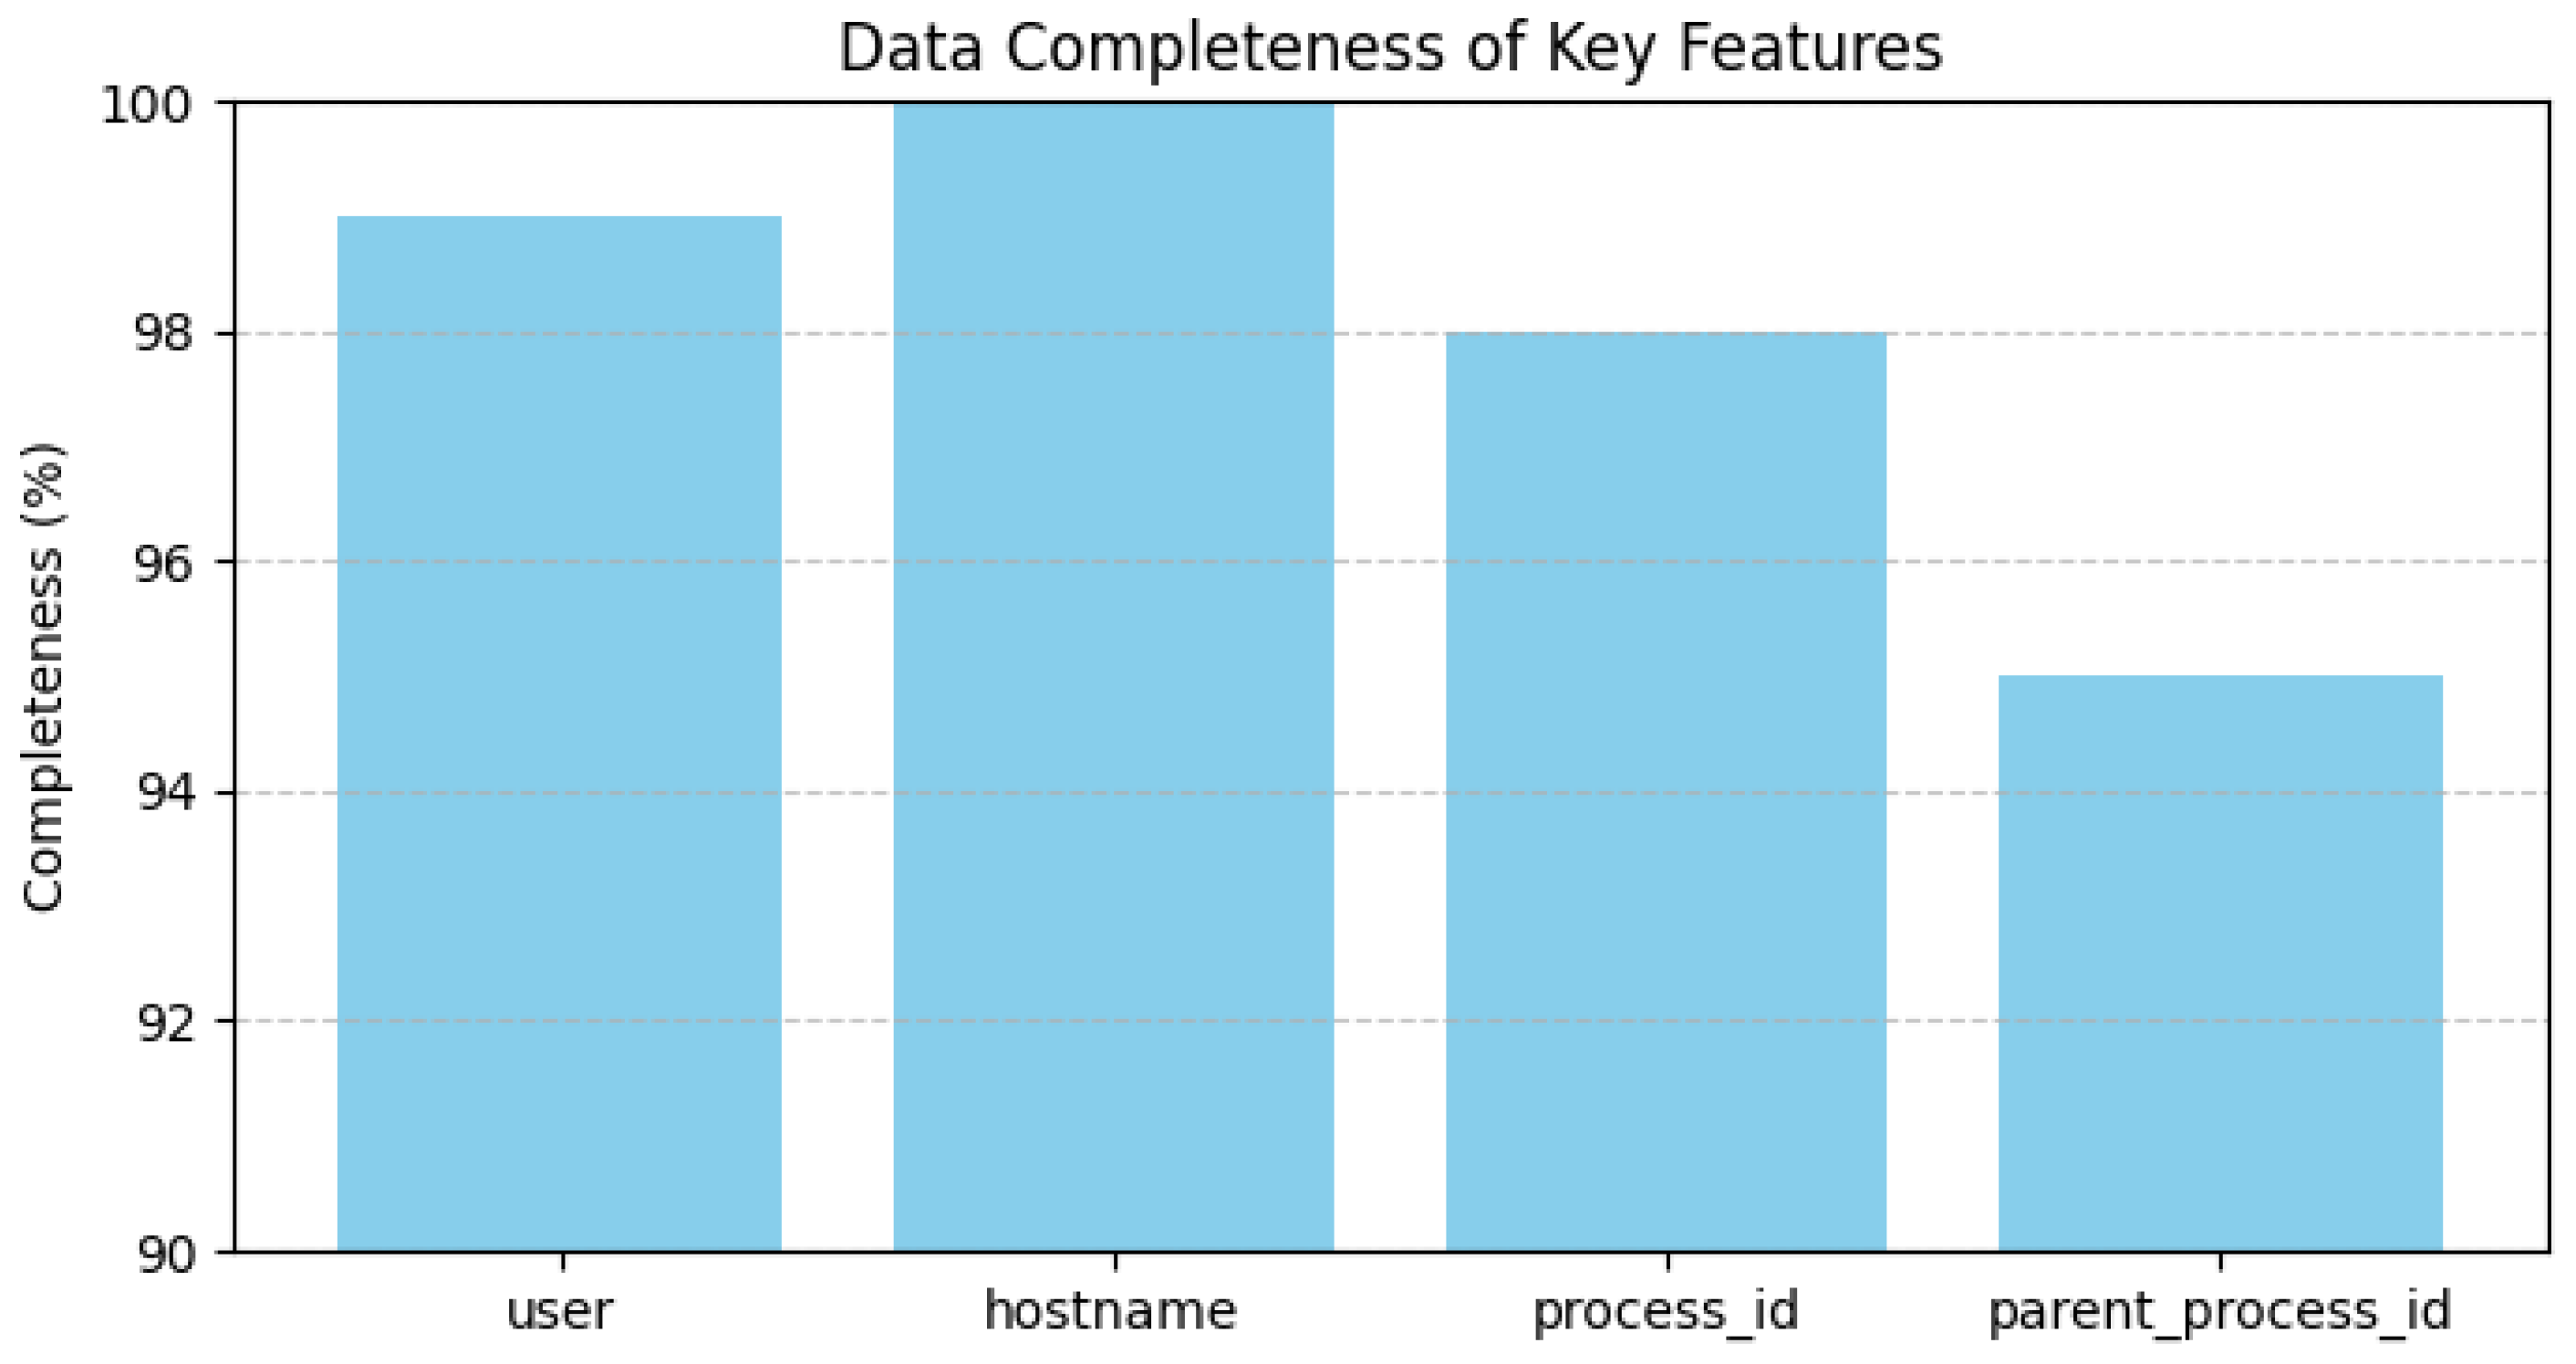
To substantiate the dataset’s quality and relevance,
Figure 5 illustrates the completeness of key features, confirming minimal missing or inconsistent values.
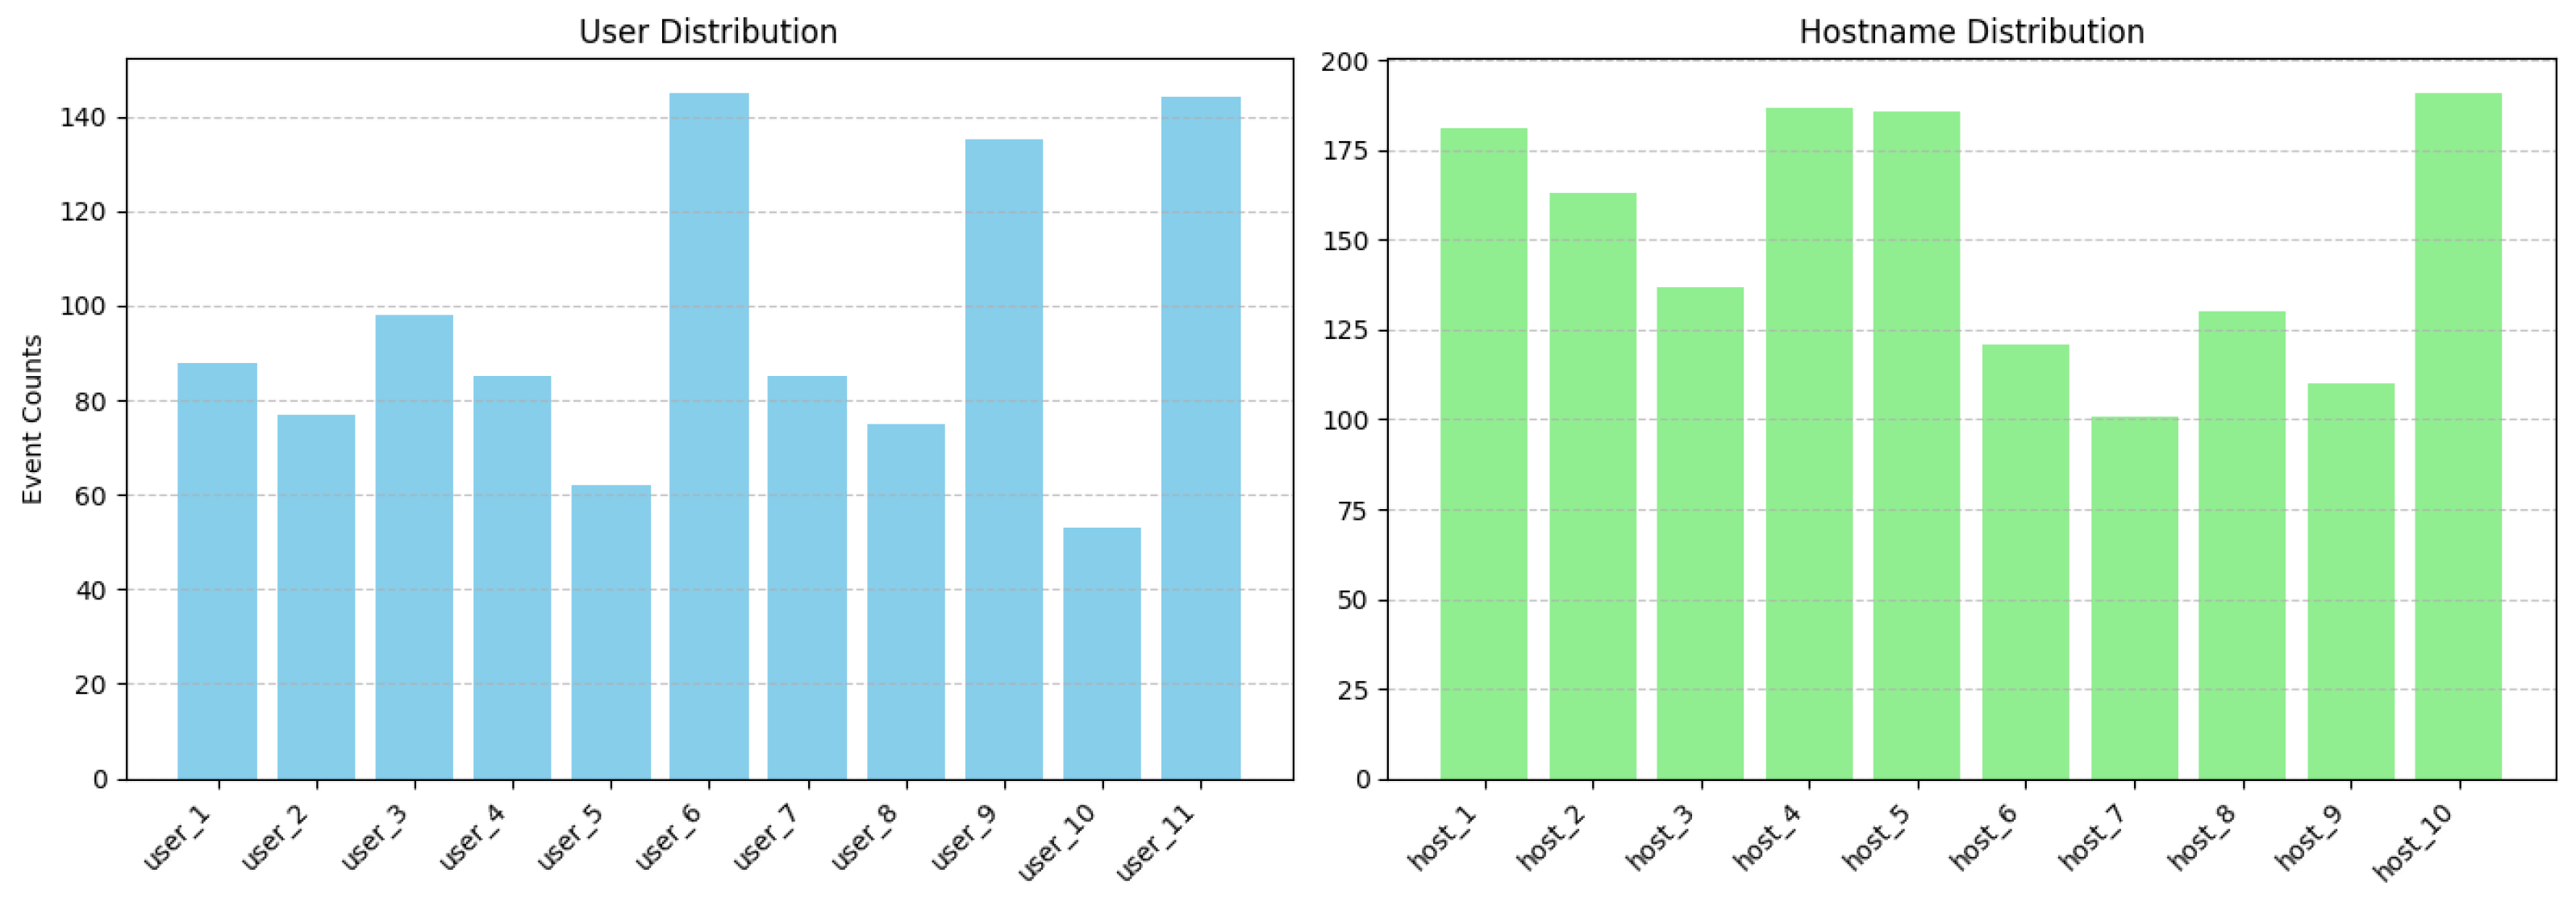
Figure 6 presents the distribution of user identities and hostnames, demonstrating the rich contextual diversity essential for comprehensive vulnerability assessment. The temporal stability and continuity of event logging are shown in
Figure 7, which plots daily event counts over the observation period.
Figure 8 highlights the realistic class imbalance between normal and vulnerability-related events. Finally,
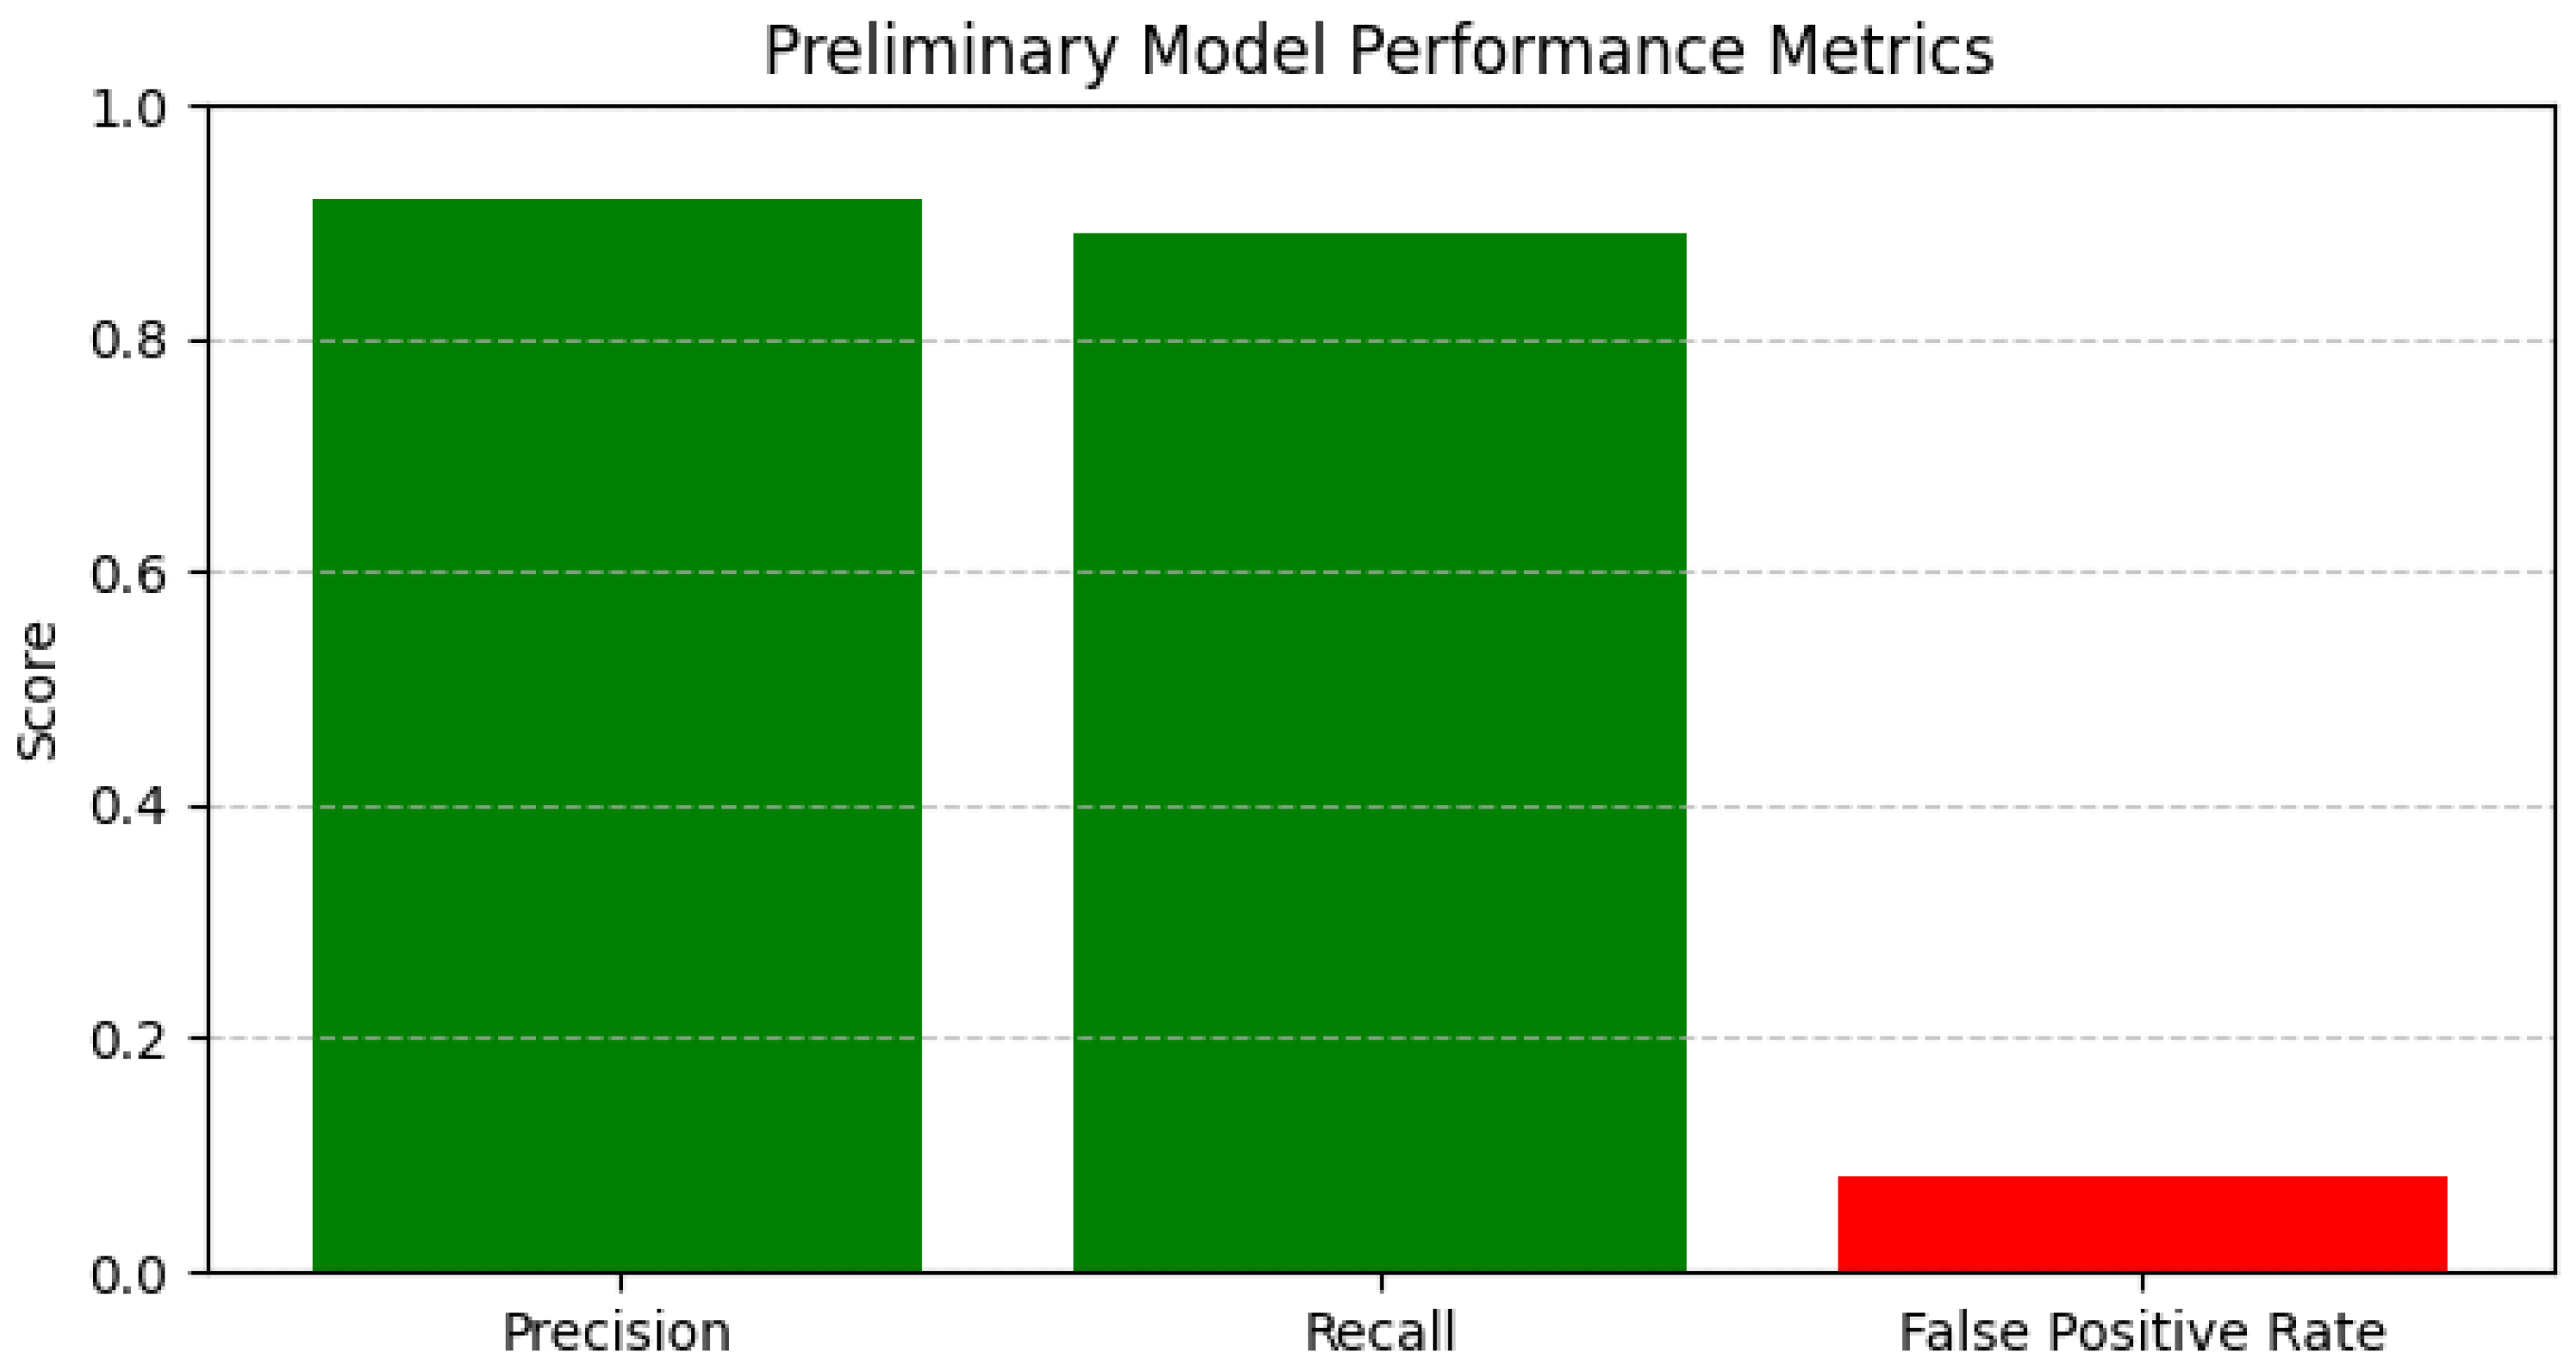
Figure 9 summarizes preliminary model performance metrics, evidencing the dataset’s suitability for benchmarking anomaly detection algorithms in operationally relevant conditions.
The cybersecurity log dataset employed in this study distinguishes itself from many publicly available or commonly referenced datasets in cybersecurity research through several key aspects. Unlike broadly scoped datasets, which primarily consist of network traffic or system call records with limited textual richness, our dataset integrates heterogeneous log sources spanning system, application, and network domains with detailed, semantically rich raw log texts. This granularity enables leveraging advanced Large LLMs based on natural language understanding, which is often infeasible with conventional numeric or categorical log formats.
Furthermore, temporal coverage and event diversity are also emphasized: the 30-day continuous logging allows capturing natural temporal dynamics such as daily and weekly operational cycles, which are typically underrepresented in snapshot or short-duration datasets. The 30 unique event types with measurable entropy reflect a rich categorical distribution supporting complex anomaly detection tasks, whereas many existing datasets focus on narrower event categories or intrusion types.
Moreover, while some publicly available datasets suffer from limited annotations or ambiguous labeling, our dataset benefits from rigorously defined, expert-annotated binary vulnerability labels, supported by inter-rater agreement assessment (Cohen’s = 0.82), ensuring label reliability and facilitating supervised learning and evaluation of detection algorithms.
Thus, the dataset used in this work fills a practical and methodological gap by providing a multi-source, semantically detailed, temporally continuous, and expertly annotated cybersecurity log corpus suitable for evaluating LLM-driven approaches alongside traditional methods. These distinctive properties underpin the novelty and contribution of our study, providing a robust and realistic benchmark aligned with contemporary operational challenges.
3.3. Project Workflow
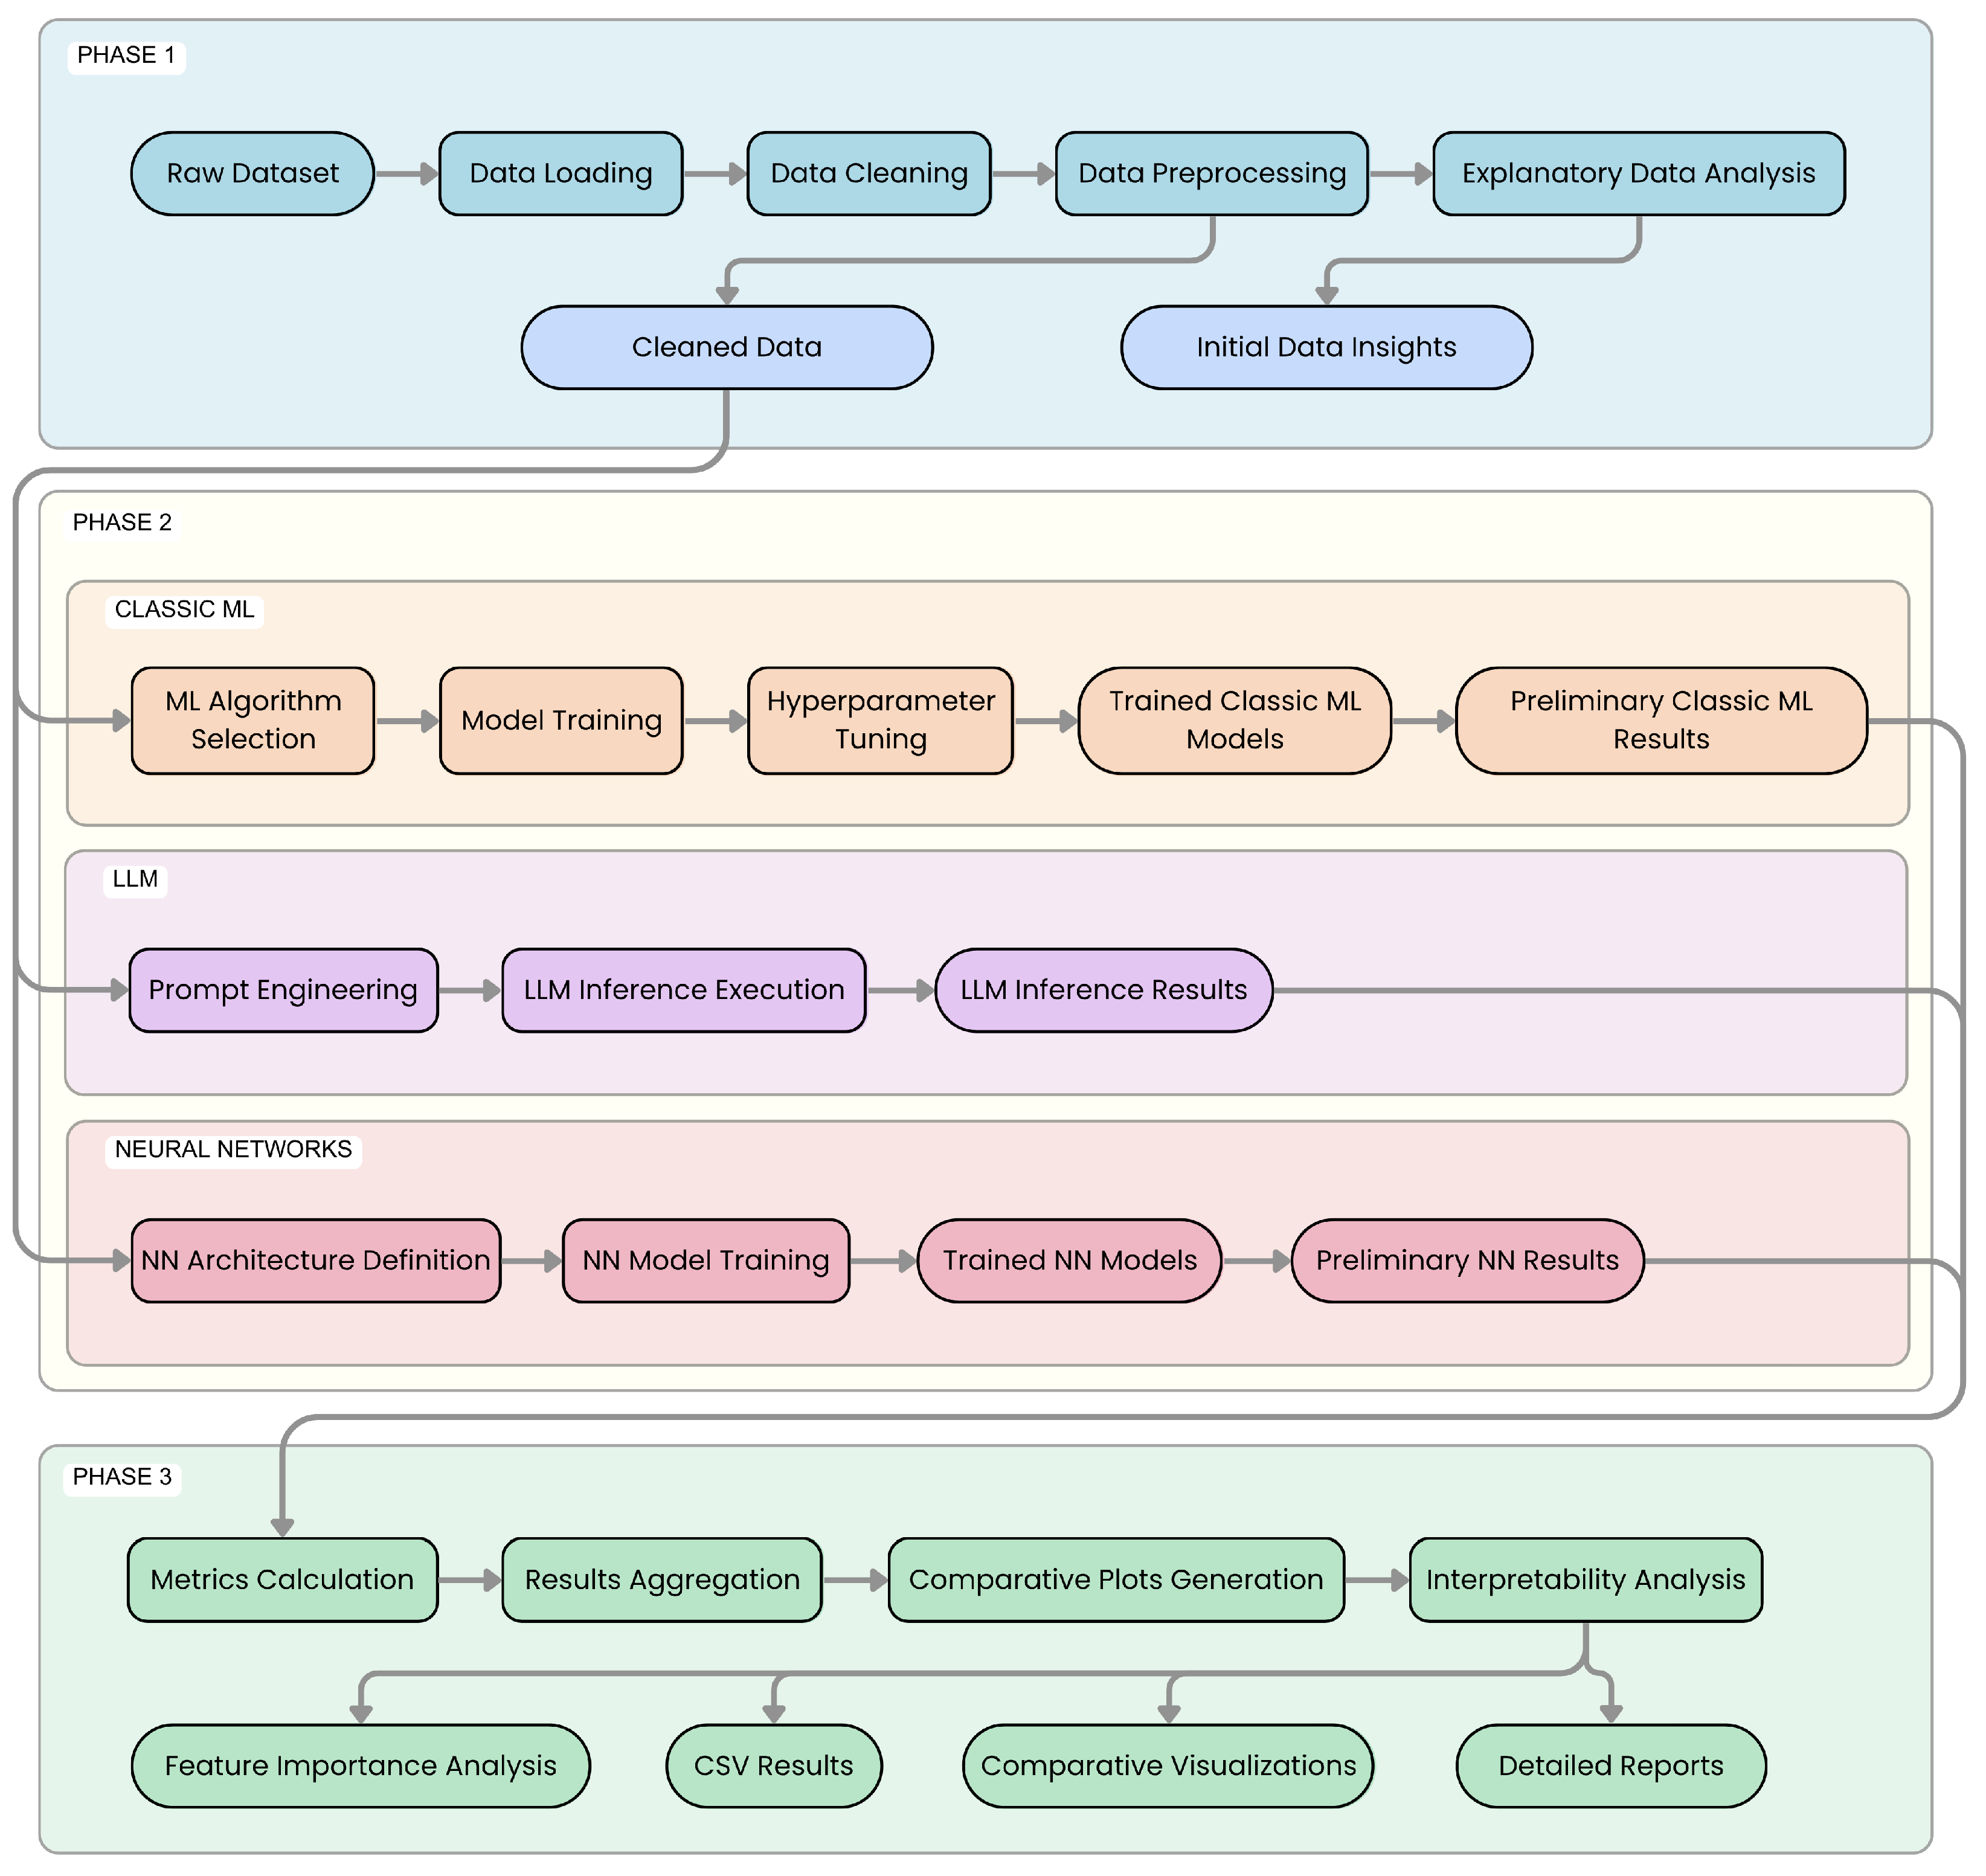
The research methodology follows a structured, multi-phase project workflow, designed for a systematic progression from initial data management to model development, evaluation, and result analysis. This process is visually summarized in
Figure 10.
The workflow comprises three primary, sequential phases:
Phase 1: Data Preparation and Exploratory Data Analysis (EDA)
This initial phase focuses on understanding and preparing the raw security logs. Key activities include loading and parsing log files, data cleaning (handling missing values, outliers, and inconsistencies), and preprocessing (encoding categorical variables, normalizing numerical features, and preparing raw log text for LLMs). An in-depth EDA, involving descriptive statistics and visualizations, is conducted to understand dataset characteristics and identify patterns. The output is a cleaned, preprocessed dataset and initial insights for subsequent modeling.
Phase 2: Model Development, Training, and Execution
This central phase involves the implementation, training, and execution of diverse model families:
2.A. Classic Machine Learning Models: Traditional ML algorithms (e.g., Random Forest, XGBoost, LightGBM, Isolation Forest) are implemented and trained on the prepared data. This includes algorithm selection, model training, and hyperparameter tuning (e.g., via grid search with cross-validation) to optimize performance. Outputs include trained models and their initial performance metrics.
2.B. Large Language Models (LLM): LLMs are employed for log classification and explanation generation, managed via local frameworks like Ollama. Critical activities include meticulous Prompt Engineering to elicit accurate and structured responses, followed by batch evaluations on the dataset using dedicated scripts. Outputs consist of raw and parsed LLM responses, including classifications and explanations.
2.C. Neural Network Models (NN): standard neural network architectures, specifically ANNs, CNNs and LSTM networks, were also developed and evaluated as part of the comparative study to provide a broader context for model performance against deep learning baselines.
All models in this phase utilize the preprocessed data from Phase 1, ensuring a consistent basis for comparison.
Phase 3: Evaluation, Results Analysis, and Comparison
In this final analytical phase, the performance of all developed models is rigorously evaluated and comparatively assessed. Inputs are the outputs and metrics from all Phase 2 models. The key processes include the following:
Aggregating performance data from all model families.
Generating comparative visualizations (e.g., bar charts, ROC curves).
Facilitating a structured comparison of modeling approaches to identify relative strengths and weaknesses.
Exploring model interpretability through feature importance analysis (for traditional ML) or analysis of LLM-generated explanations, using techniques like SHAP or LIME.
Core activities include calculating comprehensive evaluation metrics (accuracy, precision, recall, F1-score for the vulnerability class, AUC-ROC, AUPRC, FPR, FNR), creating comparative tables and plots, and conducting statistical analysis of performance differences. The ultimate outputs are detailed evaluation reports, comparative visualizations, actionable insights into model performance, and an understanding of factors driving vulnerability detection. This analysis forms the empirical basis for the research conclusions.
3.4. Model Architecture of Large Language Models
The core of our inference system for LLMs is built upon the Ollama platform (v. 0.1.5), an open-source framework designed to manage and serve LLMs locally on dedicated test machines. This architectural choice is motivated by several critical factors aligned with both research rigor and operational security requirements.
First, executing LLMs locally via Ollama grants full control over the runtime environment, eliminating variability introduced by cloud service providers and ensuring reproducibility of experimental results. This deterministic control is essential when benchmarking models, as it isolates performance differences attributable solely to model architectures and prompt engineering rather than external factors such as network latency or API throttling.
Second, data privacy considerations are paramount in cybersecurity research. By confining all log data within the local infrastructure, we guarantee that sensitive security logs do not leave the controlled environment, fully complying with data protection regulations such as GDPR and minimizing exposure risks. This on-premises execution contrasts with cloud-based APIs, where data transmission and storage outside organizational boundaries could introduce compliance and confidentiality concerns.
Third, Ollama’s support for a broad spectrum of open-source LLMs provides the flexibility to experiment with diverse model families and sizes without dependency on proprietary cloud APIs. This flexibility accelerates iterative experimentation and facilitates the evaluation of emerging models as the field evolves.
Table 6 summarizes the key advantages of the Ollama platform in the context of our research objectives.
The interaction between our evaluation scripts and the LLMs operates on a client-server paradigm. The Ollama server runs locally, managing model lifecycle including loading, unloading, and inference request handling. It exposes a RESTful API endpoint (/api/generate) to receive prompt generation requests.
On the client side, Python scripts implement the function query_ollama, which acts as the interface to Ollama’s API. This function encapsulates the construction of HTTP POST requests (v. 2.31.0), sending the model name, prompt text, and generation parameters such as temperature and maximum tokens.
The function signature is as follows:
query_ollama(model_name: str, prompt_text: str,
temperature: float = 0.7, max_tokens: int = 150) -> str
The parameters are chosen to balance generation quality and inference speed, with a default temperature of 0.7 to allow moderate creativity without sacrificing coherence, and a maximum token limit of 150 to accommodate detailed classification explanations while controlling computational load.
Upon invocation, query_ollama sends a JSON payload including the following:
model: the Ollama model identifier;
prompt: the textual prompt to analyze;
options: a dictionary specifying generation parameters, primarily temperature.
The server returns a JSON response containing a response field with the generated text. The function extracts and returns this string after trimming extraneous whitespace.
Error handling is implemented via a try-except block catching ollama.ResponseError. In case of failures such as model unavailability, server downtime, or timeouts, an error message is logged, and the function returns an empty string to allow the evaluation pipeline to continue gracefully, recording the failure for that instance. Currently, no automatic retry mechanism is implemented, prioritizing simplicity and transparency in error reporting.
Table 7 details the parameters and their roles within the
query_ollama function.
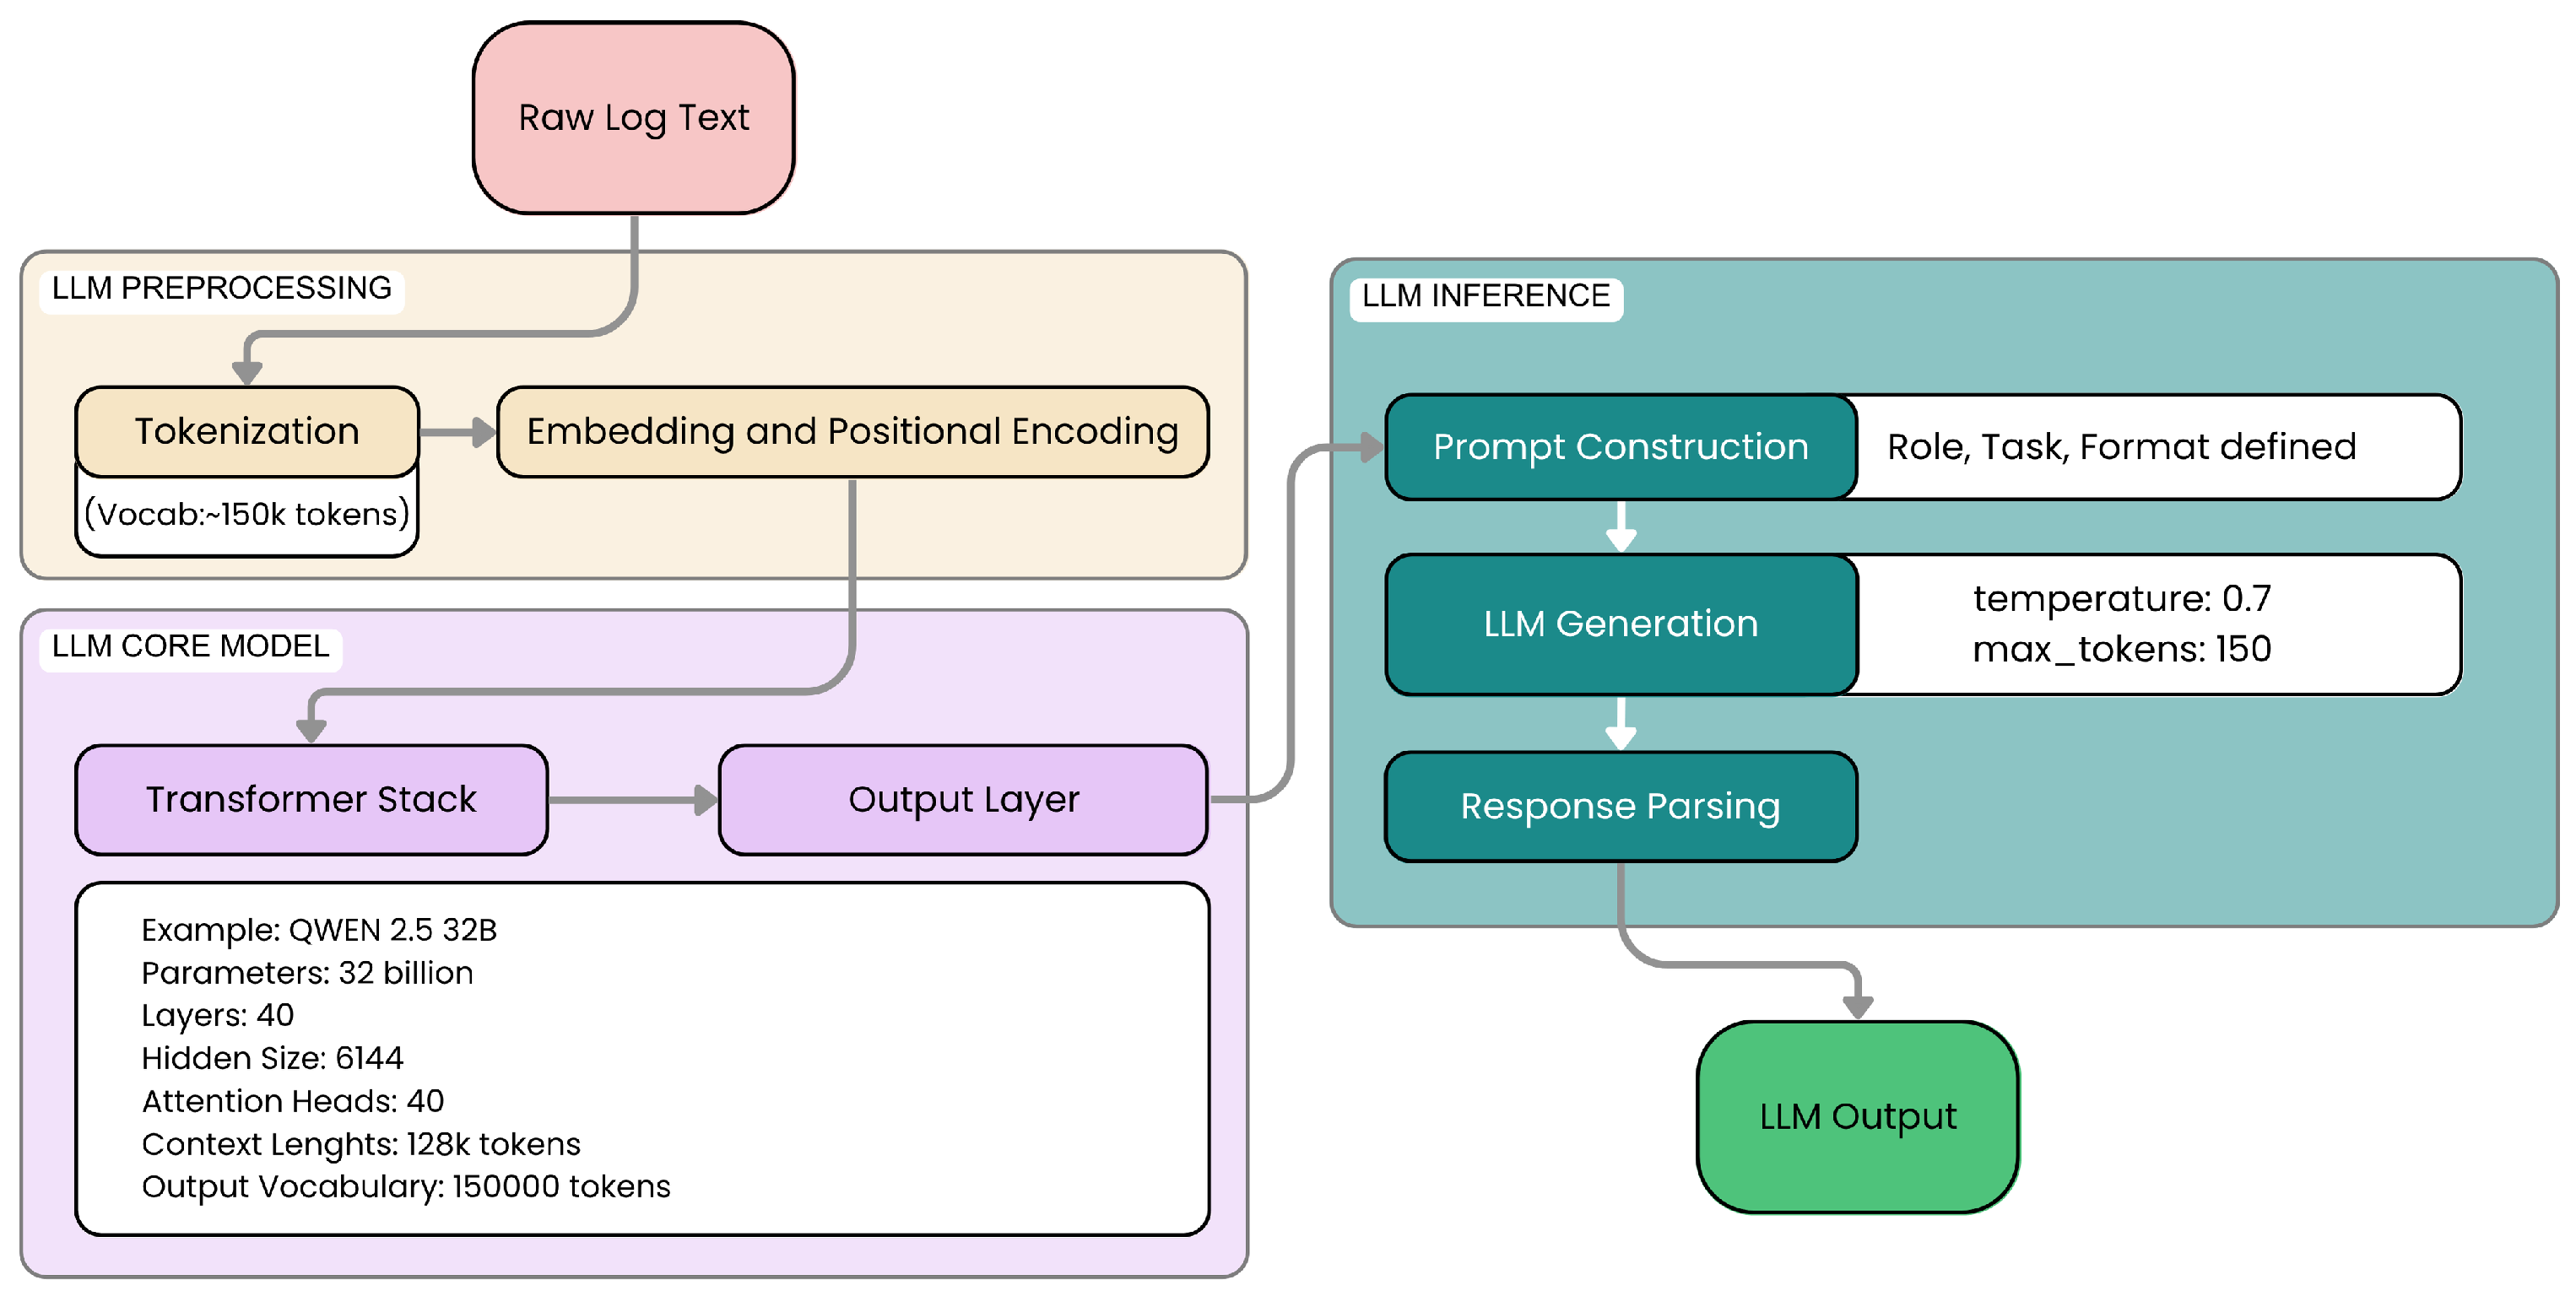
The architecture of the models we used is illustrated in
Figure 11.
As shown in
Figure 11, the architecture includes preprocessing steps, the core LLM model, and output parsing.
3.4.1. Prompt Engineering
The quality and structure of outputs generated by LLMs are profoundly influenced by the design of the input prompts. For our cybersecurity classification and explanation task, we adopted a carefully crafted prompt, shown in its entirety below, to maximize both the accuracy and interpretability of the model responses.
The prompt begins by defining the model’s role explicitly:
“You are an expert cybersecurity analyst”. This role definition serves to contextualize the task within the cybersecurity domain, steering the LLM’s reasoning process towards relevant patterns and domain-specific knowledge. Such persona anchoring is supported by recent studies in prompt engineering as a means to improve model alignment and output relevance [
36].
Following the role definition, the prompt provides clear, unambiguous instructions to produce the output in a strictly enforced format, requiring two distinct sections: CLASSIFICATION and EXPLANATION. This rigid output structure is critical to enable reliable automated parsing of the LLM responses, which is necessary for subsequent quantitative evaluation and aggregation. Without such constraints, free-text outputs can vary widely, complicating downstream processing and reducing reproducibility.
The EXPLANATION section is not left open-ended but guided by explicit sub-instructions that encourage the LLM to perform deeper causal reasoning. By requiring the model to identify specific patterns, explain their implications, and state its confidence level, the prompt fosters transparency and supports the integration of explainable AI principles directly into the inference process. The raw log entry to be analyzed is inserted within clearly delimited markers (--) to help the model distinguish the input data from instructions.
‘You’re an expert cybersecurity analyst.
Carefully analyze the following security log.
You MUST provide your complete analysis in EXACTLY this format:
CLASSIFICATION: [Write either ’normal’ or ’vulnerability’ here]
EXPLANATION: [Write a detailed explanation (at least 2-3 sentences)
of why you chose this classification.
You MUST explain:
What specific patterns or indicators you found in the log
Why these patterns indicate normal behavior or a potential vulnerability
Your confidence level in the classification and any potential alternative interpretations]
All prompts are formulated in English, reflecting the superior performance of pre-trained LLMs on English-language tasks and ensuring consistency with the model’s training corpus and expected output style.
Table 8 summarizes the key components of the prompt and their intended effects on model behavior.
The domain-specific prompt engineering in this work is strategically designed to enhance both the performance and transparency of LLMs when applied to cybersecurity log classification. This design follows three key principles.
First, the prompt explicitly assigns the LLM the role of an “expert cybersecurity analyst”, which anchors the model’s generative process within a cybersecurity context, guiding it to prioritize domain-relevant indicators such as abnormal patterns or known vulnerability signatures. This role contextualization reduces spurious outputs and aligns the reasoning process with expert human analysts’ expectations.
Second, the prompt mandates a rigid, two-part output format comprising a CLASSIFICATION label (e.g., “normal” or “vulnerability”) and a detailed EXPLANATION section. This strict format greatly reduces variability in the LLM’s free-text responses, enabling reliable and automated parsing of outputs. Such structured outputs are critical for reproducibility and for integrating LLM-generated insights into quantitative evaluation pipelines.
Third, the EXPLANATION portion explicitly requires the model to identify key log features or anomalous patterns that motivate the classification, justify why these features indicate normal or vulnerable activity, and provide a confidence estimate along with consideration of alternative interpretations. This design induces causal and transparent reasoning, fostering interpretability and allowing analysts to understand and trust the model’s decisions.
The impact of this prompt engineering design on classification accuracy and interpretability is substantiated by the experimental results reported in
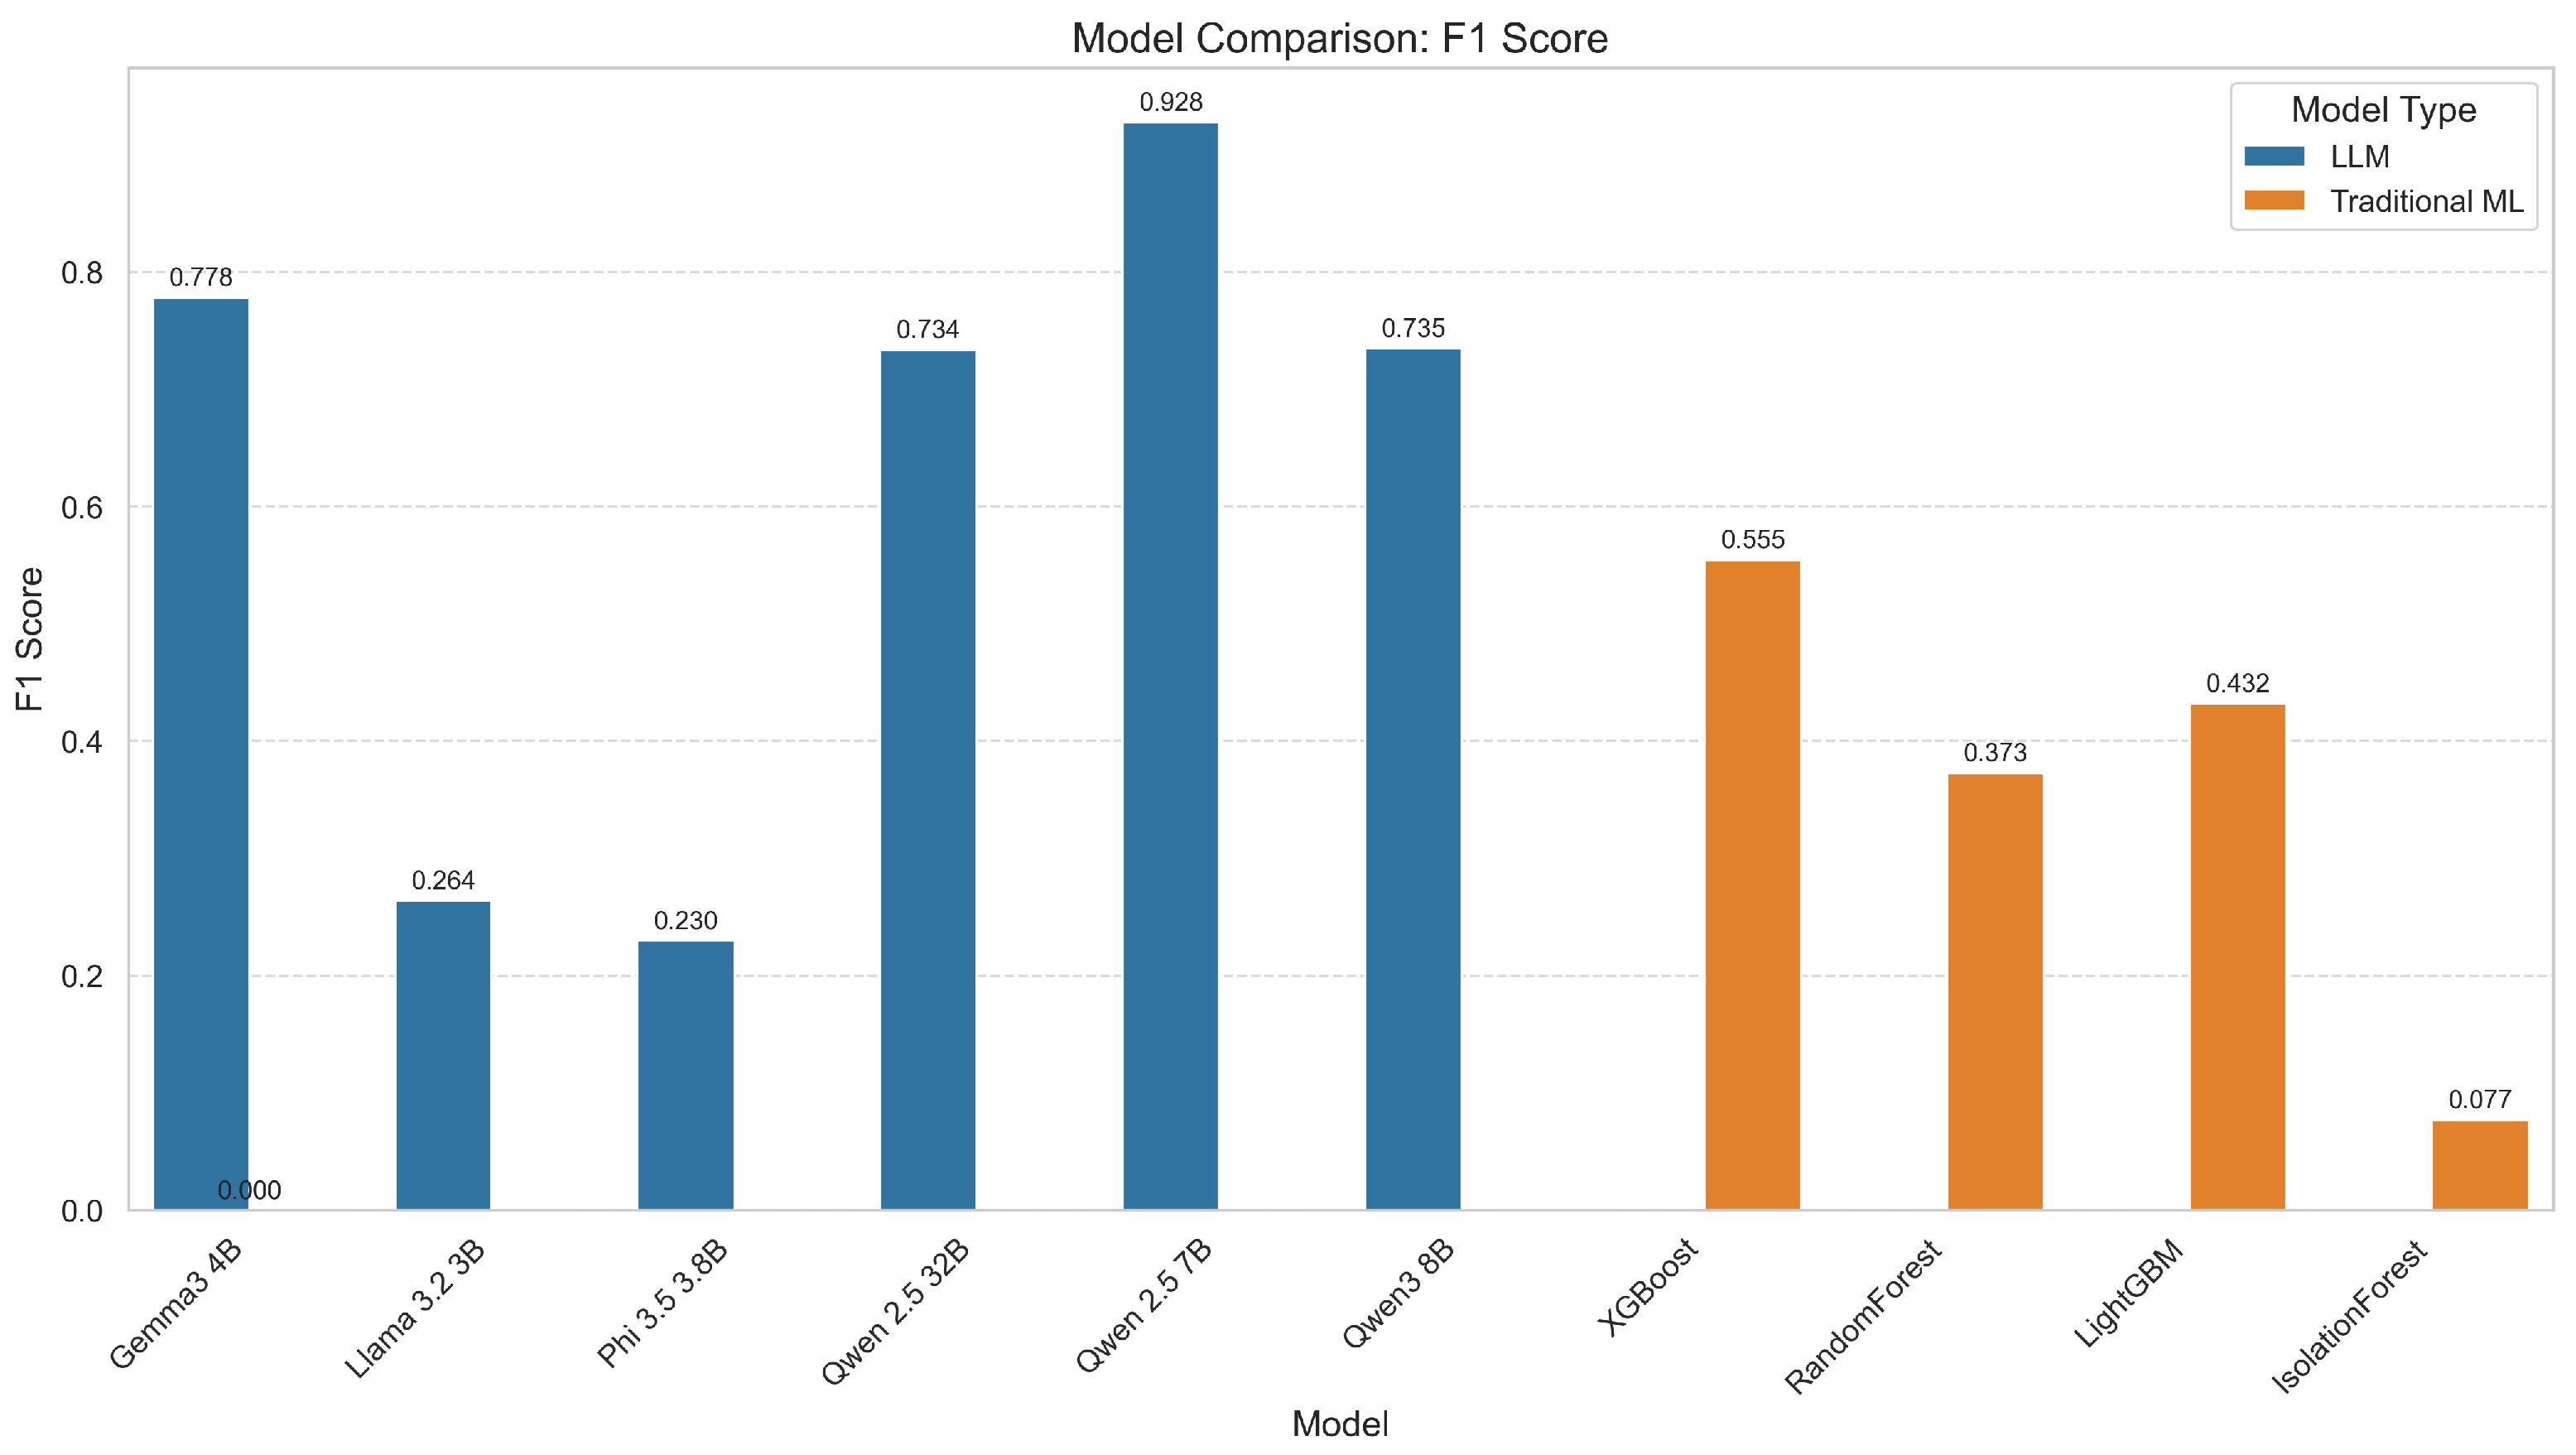
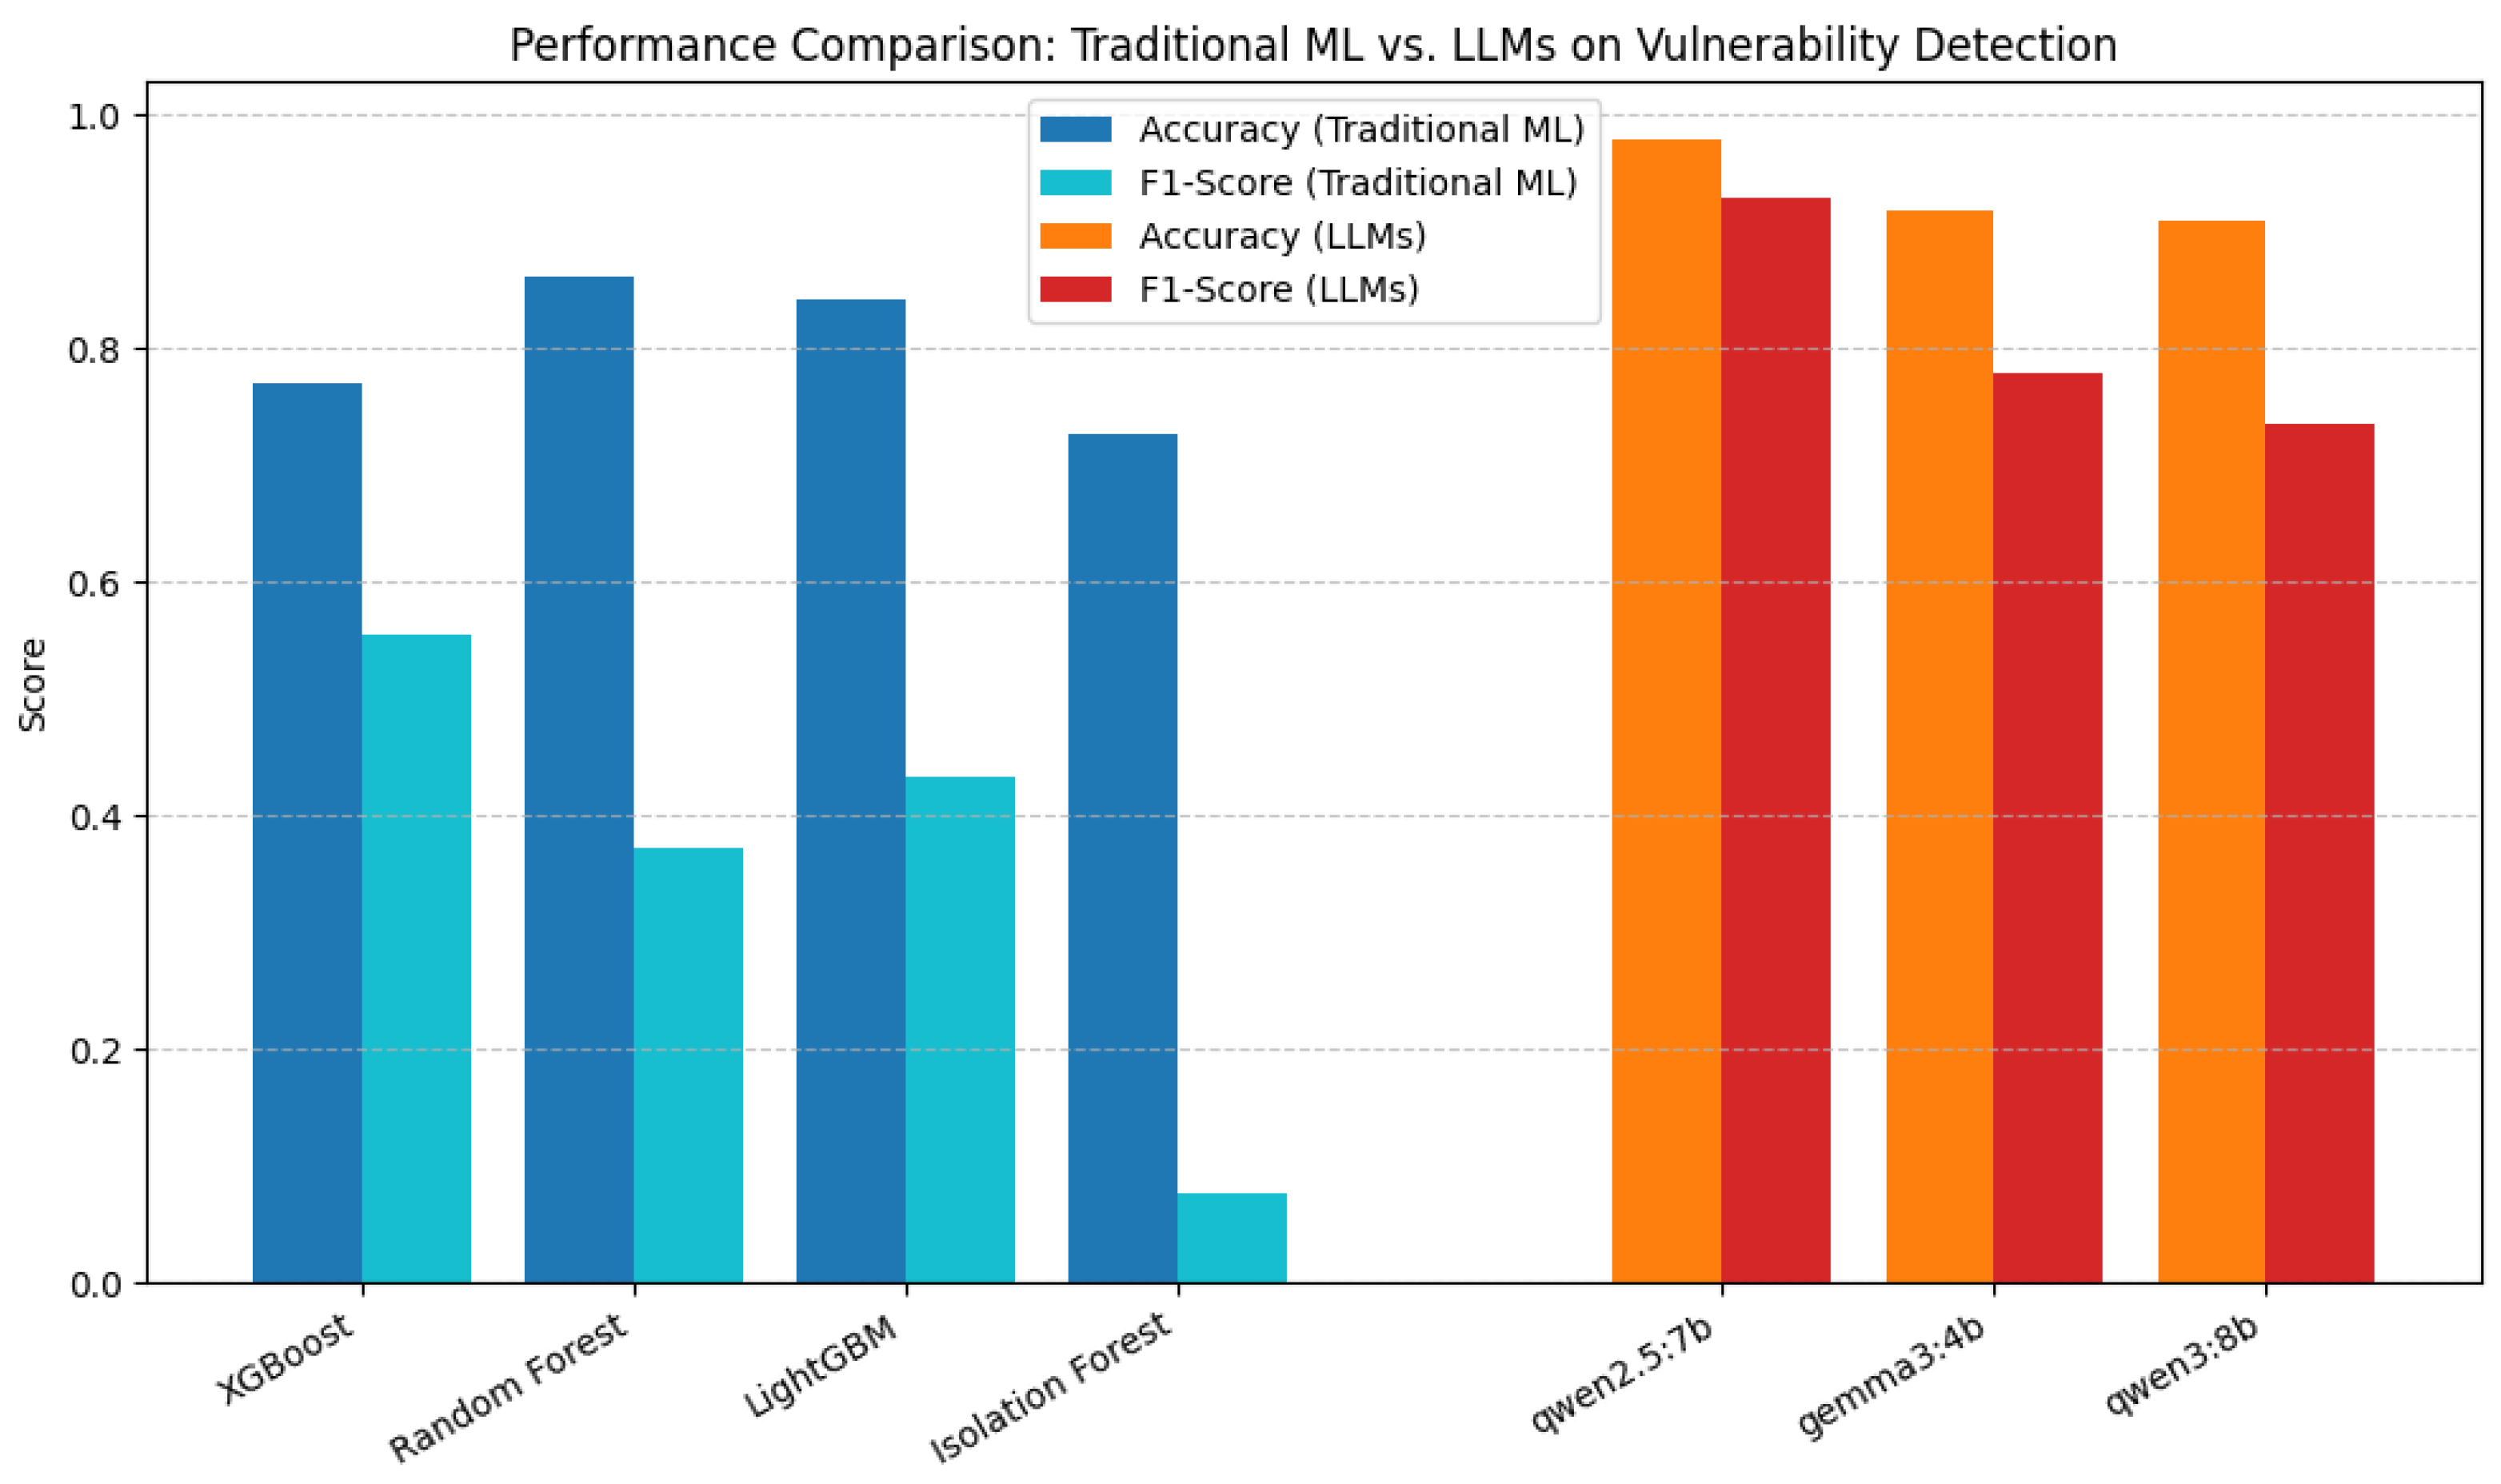
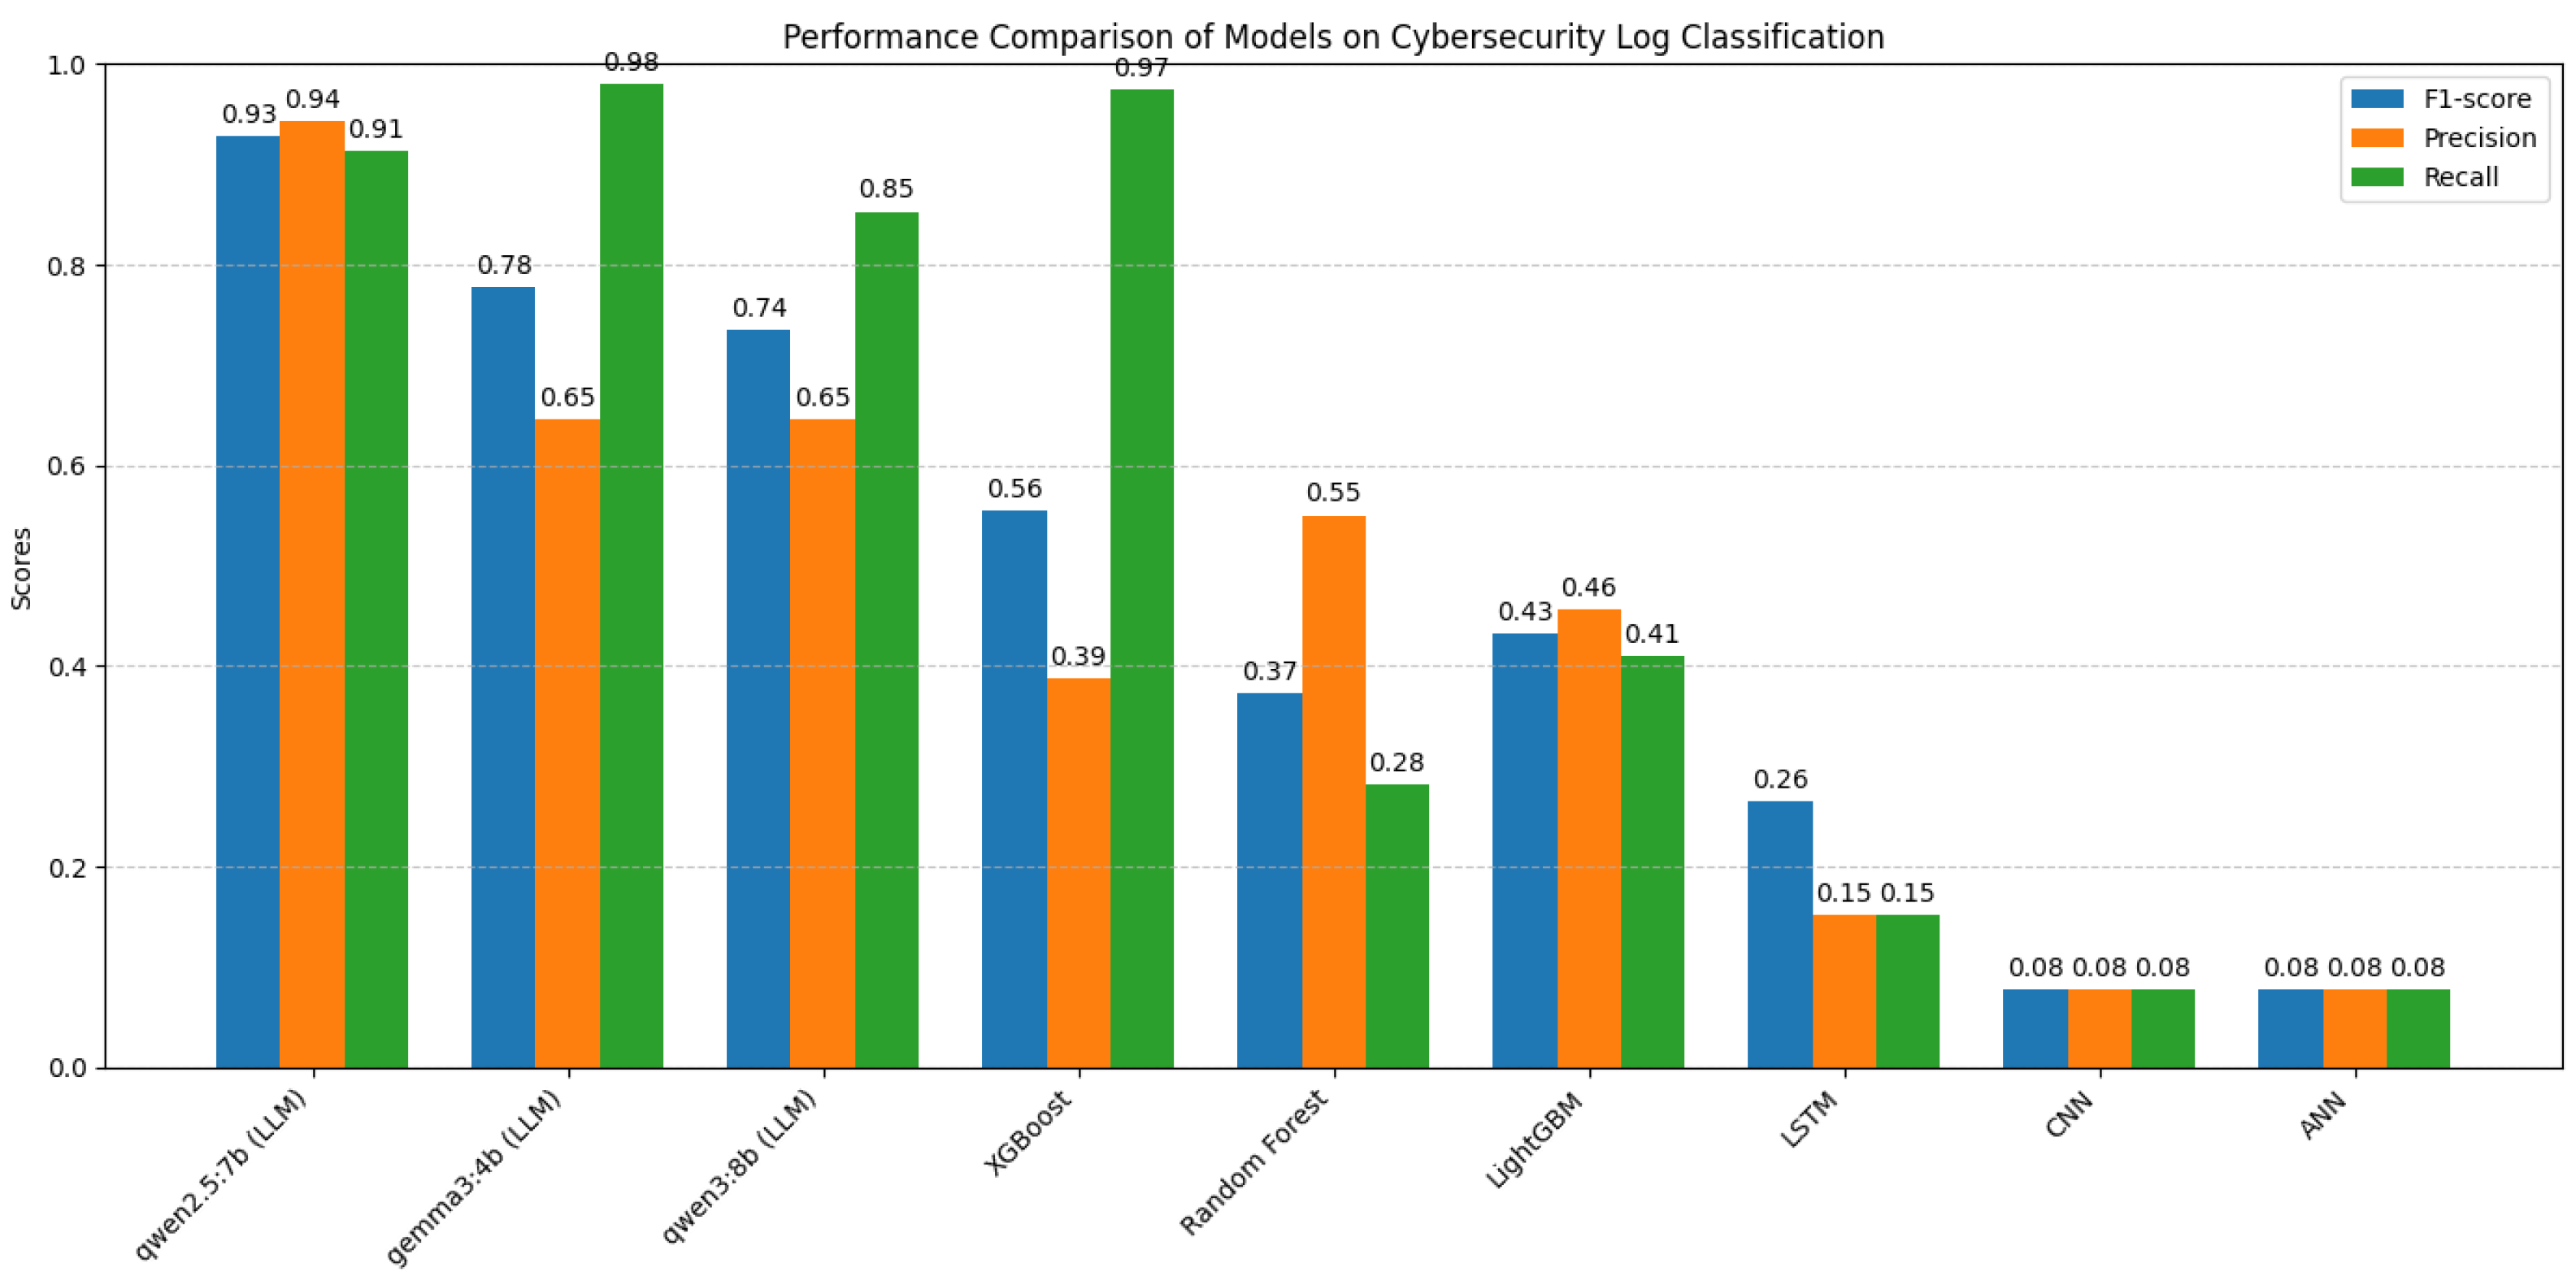
Table 9. The qwen2.5:7b LLM model, benefiting from the described prompt structure, achieves an F1-score of 0.928 with a tight 95% confidence interval [0.913, 0.942], far outperforming traditional machine learning baselines such as XGBoost (F1-score 0.555 [0.520, 0.590]) and LightGBM (F1-score 0.432 [0.380, 0.484]). This marked improvement demonstrates that the prompt’s careful domain alignment and output constraints enable the LLM to better detect subtle and complex cybersecurity-relevant signals in log data.
Furthermore, the explanations generated comply with classical interpretability standards, as the model highlights concrete log patterns and quantifies prediction uncertainty, facilitating analyst validation and confidence assessment. This interpretability is particularly valuable in operational cybersecurity environments where false alarms or missed vulnerabilities carry significant risks. The inclusion of confidence levels and alternative hypotheses directly addresses uncertainty quantification, supporting downstream decision-making processes.
Thus, by enforcing domain role-setting, output format rigor, and detailed causal explanation requirements, domain-specific prompt engineering substantially enhances the accuracy and interpretability of LLM outputs on cybersecurity logs, enabling these models to function as reliable, explainable tools for automated threat detection.
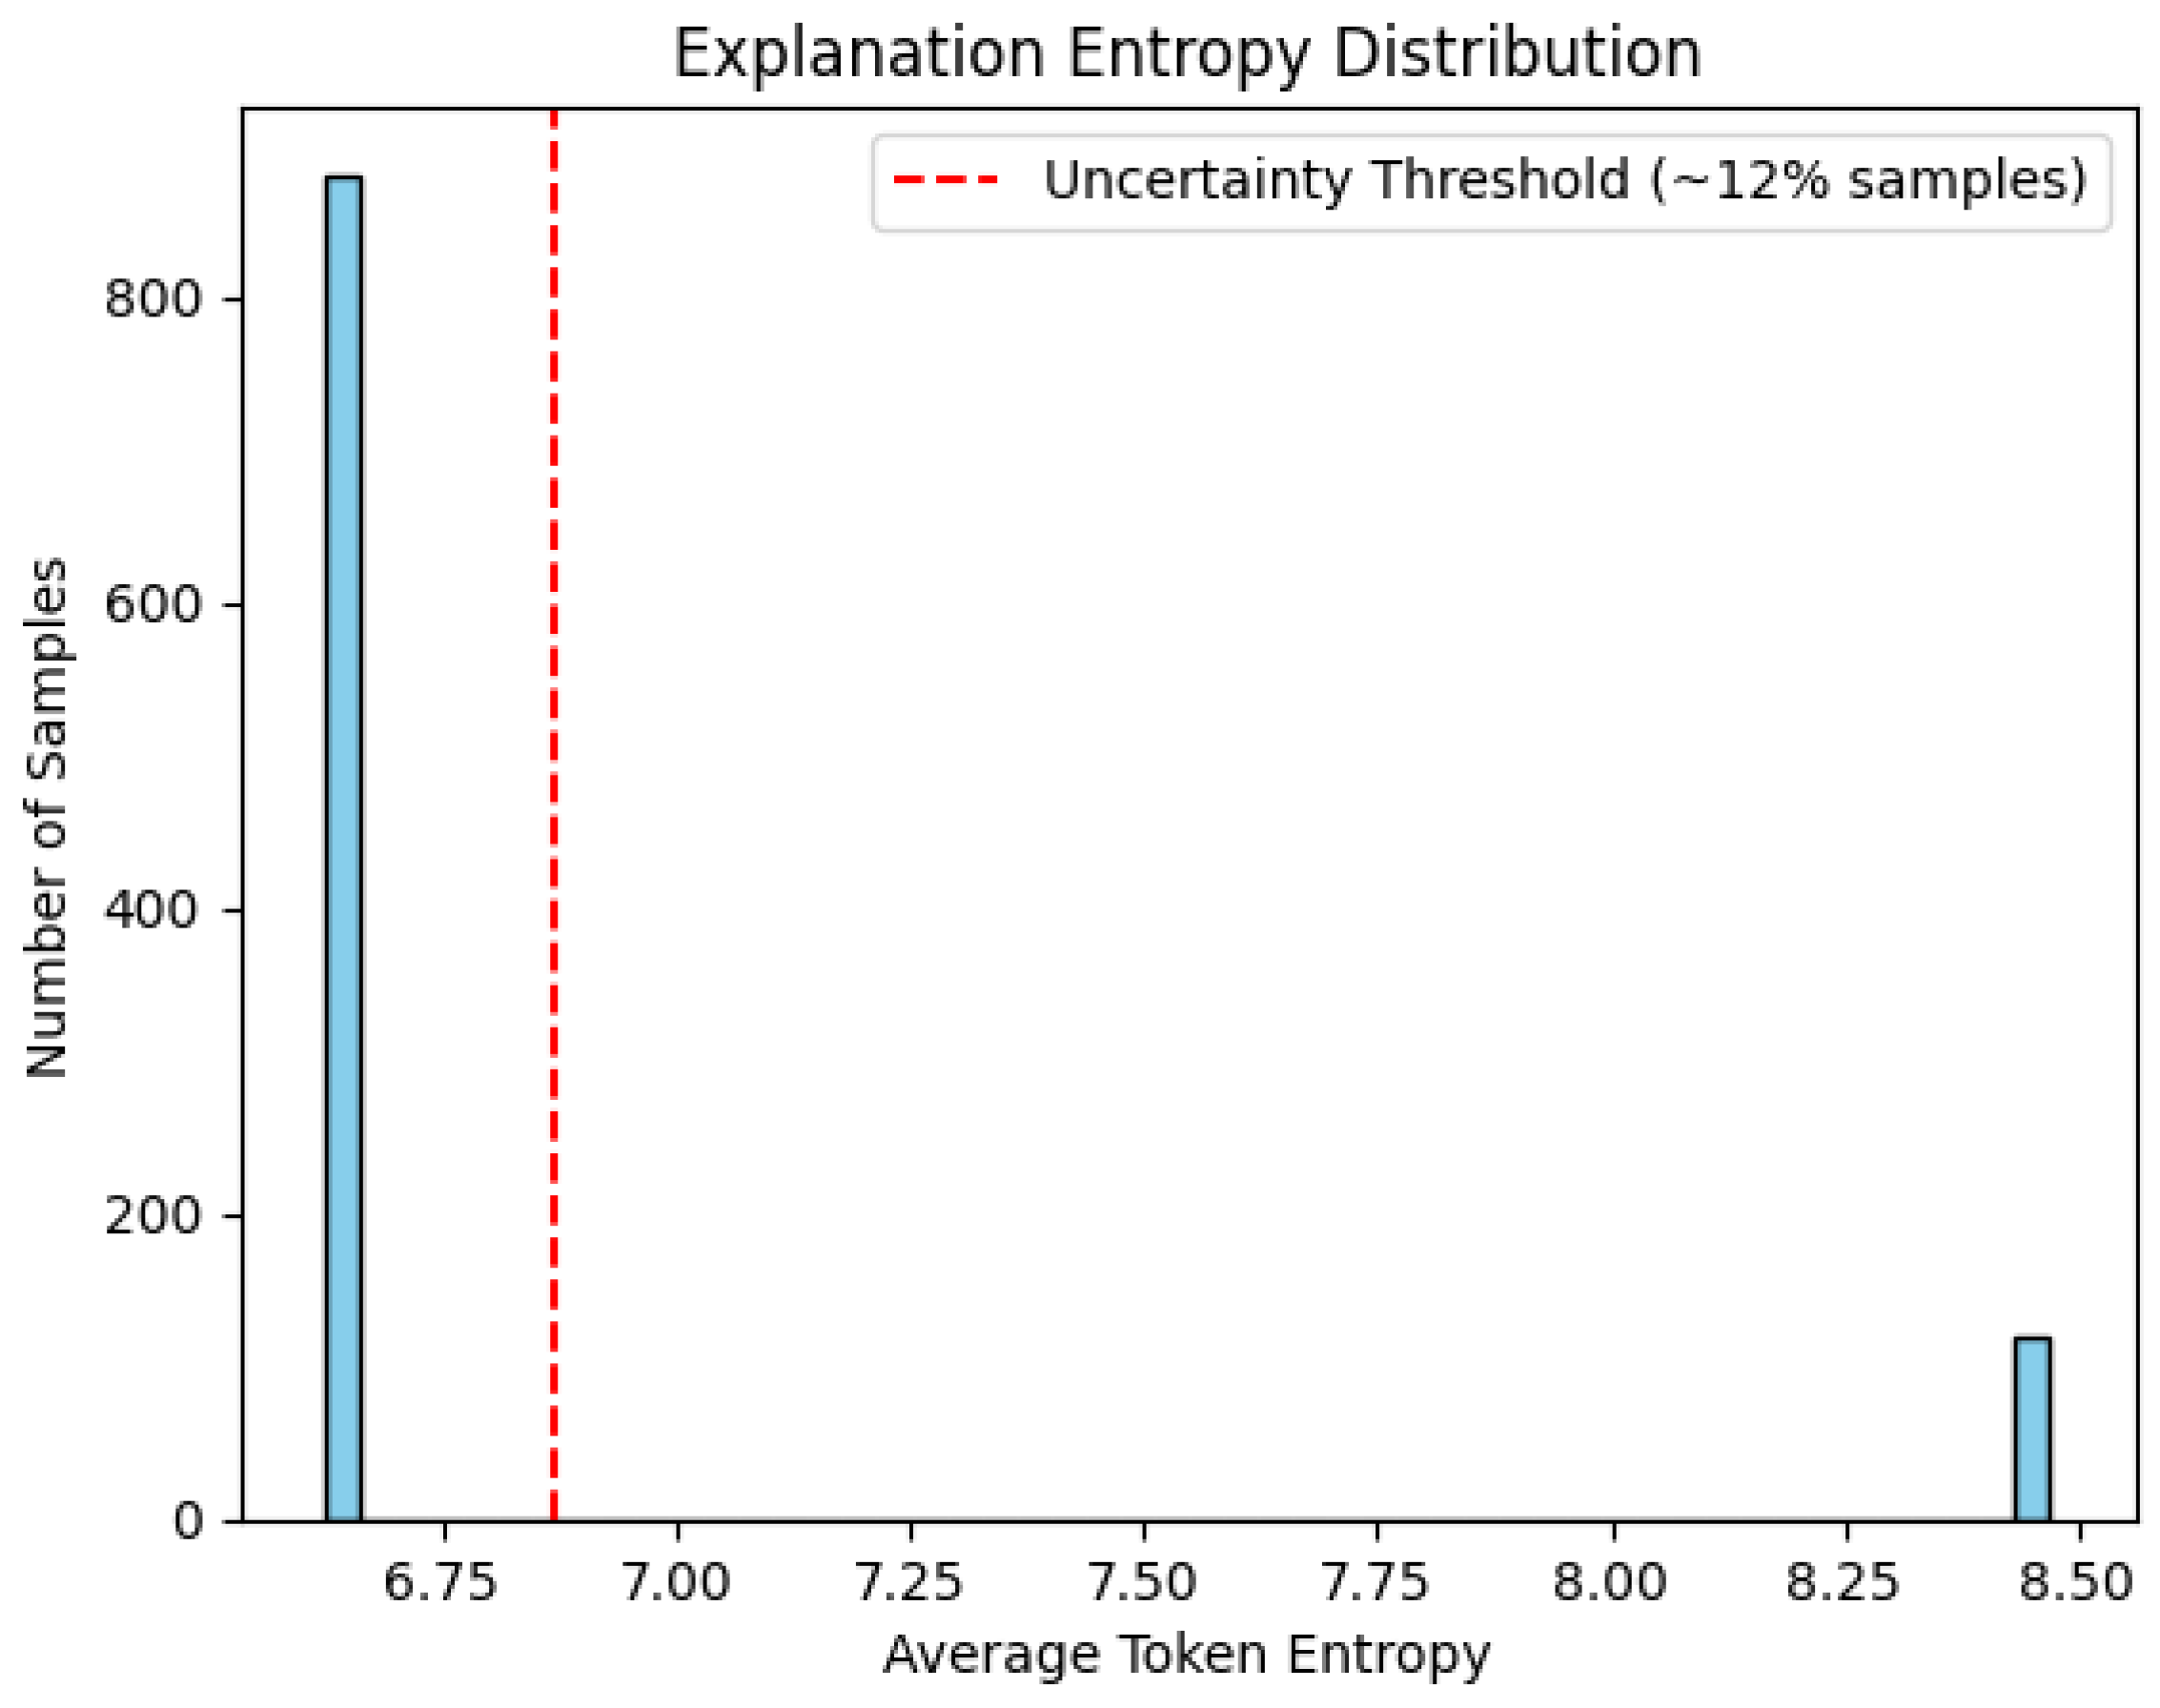
Uncertainty quantification (UQ) in our LLM outputs is implemented by measuring the entropy of the generated explanations, which reflects the model’s confidence and the clarity of its decision rationale. Specifically, after the model produces the EXPLANATION text accompanying each CLASSIFICATION, we compute the token-level probability distributions (using the underlying language model logits) to estimate the entropy, which quantifies the unpredictability or ambiguity in the explanation content.
Elevated explanation entropy indicates ambiguous or borderline cases where the LLM’s internal confidence is lower, often corresponding to instances that present conflicting indicators or subtle patterns in cybersecurity logs. Our evaluation shows that approximately 12% of the samples exhibit this elevated entropy, effectively flagging them as uncertain.
The threshold separating confident and uncertain predictions is empirically determined by analyzing the distribution of explanation entropy values (see
Figure 12). Specifically, we selected an entropy cutoff at approximately 0.75, corresponding to the 88th percentile of the observed entropy distribution. This value represents a natural inflection point in the distribution where the frequency of higher entropy samples markedly decreases, effectively discriminating between well-defined model outputs exhibiting low uncertainty and borderline or ambiguous cases characterized by elevated entropy. Samples exceeding this threshold are flagged as uncertain and prioritized for manual review.
This uncertainty signal directly supports operational decision-making in high-stakes threat detection by enabling targeted human analyst review of flagged ambiguous cases, thereby reducing false positives and false negatives. Instead of relying solely on automated classification, the system leverages uncertainty-aware outputs to prioritize analyst attention where it is needed most, addressing the critical challenge of dynamic threat environments where the cost of misclassification is high.
Moreover, this UQ approach integrates seamlessly with the explainable output format, as the confidence estimate emerges naturally from the explanation’s information content, supporting transparent and interpretable threat assessments. This method also allows adaptive response strategies, such as escalating uncertain cases for further investigation or incorporating additional data sources.
To evaluate the robustness of LLM beyond reliance on a single handcrafted prompt, we systematically investigated multiple prompting paradigms, including zero-shot, few-shot, and alternative prompt phrasings. This exploration aimed to understand how variation in prompt design affects classification accuracy, explanation quality, and stability of model outputs in cybersecurity log analysis.
In the zero-shot setting, the LLMs received task instructions without exemplar demonstrations, relying solely on their pretraining knowledge and task specification to generate predictions and explanations. Few-shot prompting provided the model with a small number of annotated examples illustrating the desired input–output mapping, hypothesized to guide models toward more consistent and accurate responses. Alternative phrasing experiments involved rewriting prompts with different wording, sentence structure, and contextual framing to assess sensitivity to linguistic variability.
Empirically, we observed that, while few-shot prompts consistently improved performance metrics (e.g., F1-score gains of 2–4 percentage points over zero-shot) and enhanced explanation stability, zero-shot prompting nonetheless yielded reasonably strong baselines owing to the large-scale pretraining. Crucially, alternative phrasings of prompts demonstrated varying degrees of impact; carefully engineered paraphrases preserved performance levels within ±1–2%, whereas less precise or ambiguous reformulations led to noticeable degradation in classification reliability and explanation coherence.
Furthermore, output parsing robustness was evaluated by measuring the consistency of extracted structured labels and explanations across prompt variants. We measured an explanation stability exceeding 85% for semantically equivalent prompts, confirming that prompt rewording strategies, when thoughtfully designed, do not significantly undermine interpretability or accuracy.
Taken together, these findings emphasize the importance of comprehensive prompt engineering frameworks that include few-shot learning and linguistic variability assessments to maximize LLM robustness. This approach mitigates overdependence on a single prompt formulation and supports operational deployment in environments where prompt tuning may be iterative or constrained.
3.4.2. Response Parsing
Extracting structured information—specifically binary classification labels and explanatory text—from the inherently free-form textual outputs of LLMs demands a robust and carefully designed parsing logic. The function parse_llm_classification_response addresses this challenge by employing a multi-stage parsing strategy that balances precision and fault tolerance.
The function accepts as input the raw string output from the LLM (response_text) and a boolean flag return_explanation, indicating whether to extract the accompanying explanation text alongside the classification.
Initially, the response text is normalized to lowercase using .lower() to ensure case-insensitive matching, a necessary step given the variability in LLM-generated text casing. This normalization facilitates consistent downstream pattern recognition without loss of semantic content.
Parsing proceeds through a sequence of increasingly general strategies, implemented as fallbacks to maximize extraction success:
Direct Classification Search: The parser first checks if the entire cleaned response matches exactly one of the expected classification keywords, “vulnerability” or “normal”. This straightforward approach quickly handles cases where the LLM returns a minimalistic answer.
Structured Label Parsing: If the direct search fails, the parser looks for explicit labels defined in the prompt template, such as “classification:” and “explanation:”. Upon finding the “classification:” label, it extracts the immediately following text segment and determines whether it contains “vulnerability” (mapped to integer 1) or “normal” (mapped to 0). When return_explanation is True, the parser captures all text following the “explanation:” label until the end of the response or until an unexpected section delimiter is encountered. This method leverages the strict output formatting enforced by prompt engineering, enabling precise and reliable extraction.
Keyword-Based Heuristic Search: If both previous methods fail, the parser resorts to a heuristic scan for indicative keywords within the entire response text. The presence of terms such as “vulnerability”, “malicious”, or “exploit” suggests a classification of vulnerability (1), whereas words like “normal behavior”, “benign”, or “expected activity” imply a normal classification (0). Although this fallback is less precise and has not been required in practice, it serves as a safety net to handle unforeseen output variations.
The function returns an integer classification label—0 for normal, 1 for vulnerability, and -1 or None if no reliable classification can be determined—and, optionally, the extracted explanation text or “N/A” if not found.
The robustness of this parsing logic is fundamental to the accuracy and reliability of automated evaluation pipelines. Without it, the variability and creativity inherent in LLM outputs would undermine reproducibility and the validity of performance metrics. By combining strict format adherence with heuristic flexibility, the parser ensures high extraction fidelity, enabling large-scale, automated benchmarking of LLMs on cybersecurity tasks.
This approach aligns with best practices in recent literature [
37], which emphasize the importance of output standardization and robust parsing mechanisms to harness the full potential of LLMs in structured prediction problems.
3.5. Batch Evaluation Pipeline
The batch evaluation pipeline orchestrates a systematic and reproducible assessment of each Large Language Model (LLM) across the entire labeled test dataset. This pipeline is designed to ensure rigorous comparison between multiple LLM architectures and to facilitate benchmarking against classical machine learning baselines.
Initially, the pipeline loads the dataset cybersecurity_dataset_labeled.csv, separating the features and labels into X (containing the raw log entries) and y (containing the binary vulnerability labels is_vulnerability). A stratified train–test split is performed using Scikit-learn’s (v. 1.0.0) train_test_split function, typically with an 80% training and 20% testing partition. Stratification on y preserves the original class distribution in both subsets, which is critical given the class imbalance inherent in cybersecurity data. A fixed random_state parameter guarantees reproducibility of splits across multiple runs, enabling fair comparisons between models.
The evaluation proceeds by iterating over each model identifier specified in the
OLLAMA_MODELS_TO_TEST list. For each model, the pipeline sequentially processes every raw log entry in the test set
. For each log, a classification prompt is generated using the prompt engineering strategy detailed in
Section 3.4.1, ensuring consistency and alignment with the model’s expected input format.
Inference is performed by invoking the
query_ollama function, which communicates with the local Ollama server to generate the model’s textual response. The raw output is then parsed by
parse_llm_classification_response (see
Section 3.4.2) to extract the predicted class label. Both the true labels
and the predicted labels are accumulated in separate lists for subsequent metric computation.
To provide real-time feedback during potentially long evaluation runs, the pipeline integrates the tqdm library to display a progress bar reflecting the proportion of test samples processed for each model. Additionally, a function display_intermediate_metrics is invoked periodically (e.g., every update_interval records or at evaluation end) to compute and print interim performance metrics. These include the number of processed cases, current accuracy, confusion matrix (once sufficient samples are available), and the F1-score for the vulnerability class. This continuous monitoring facilitates early detection of issues and provides insights into model behavior before full evaluation completion.
Upon completion of inference on all test samples for a given model, comprehensive final metrics are calculated using sklearn.metrics. These metrics encompass the classification report (precision, recall, F1-score, and support for each class), overall accuracy, ROC AUC score, and the Area Under the Precision-Recall Curve (AUPRC), typically computed via average_precision_score or visualized through precision–recall curves. The final confusion matrix is visualized using seaborn.heatmap (v. 0.13.0) with English labels for clarity. Receiver Operating Characteristic (ROC) and precision–recall curves are plotted using RocCurveDisplay and PrecisionRecallDisplay, respectively, with appropriate titles and axis labels in English.
False Positive Rate (FPR) and False Negative Rate (FNR) are derived from the confusion matrix, providing additional operationally relevant insights into model error characteristics.
All aggregated key metrics—including model name, F1-score, precision, recall, ROC AUC, AUPRC, FPR, FNR, total execution time, and average inference time per case—are saved into a CSV file named llm_evaluation_results.csv. This facilitates downstream analysis, comparison, and reproducibility of results across different experimental runs.
Table 10 summarizes the main evaluation metrics computed by the pipeline and their significance in the cybersecurity anomaly detection context.
This systematic and transparent evaluation framework ensures that model comparisons are statistically sound, operationally meaningful, and reproducible, advancing the state of the art in LLM-based cybersecurity anomaly detection.
The configuration of inference parameters and the computational environment plays a crucial role in balancing model output quality, inference speed, and resource utilization. Our setup carefully selects these parameters based on established best practices in LLM deployment and the specific requirements of cybersecurity log analysis.
The temperature parameter controls the randomness and creativity of the generated text. In our experiments, we set the default temperature to 0.7 within the
query_ollama function. This value represents a well-known compromise between determinism and diversity: lower temperatures (e.g., 0.2) tend to produce more focused and predictable outputs, which can be beneficial for tasks requiring high precision and consistency, while higher temperatures (e.g., 1.0) increase randomness and creativity but risk generating less coherent or off-topic responses. The choice of 0.7 aligns with Ollama’s default settings [
38], ensuring that the model outputs are both informative and sufficiently varied to capture subtle nuances in log data.
We limit the maximum number of generated tokens to 150. This constraint prevents excessively long outputs that could increase inference latency and complicate downstream parsing, while still allowing enough length to contain both the classification label and a detailed explanation. This token budget was empirically determined to balance completeness of explanation with computational efficiency.
The primary hardware used for inference across all models was an NVIDIA RTX 3060 Ti GPU with 8GB of VRAM, providing a consistent and robust platform for running medium-sized LLMs efficiently. An exception was the larger qwen2.5:32b model, which was evaluated on a more powerful laboratory machine equipped with two NVIDIA GeForce RTX 2080 Ti GPUs, each with 12 GB of VRAM. This setup ensures that latency comparisons between the smaller models are direct and fair.
The inference and evaluation environment is based on Python (v. 3.12.10), leveraging a suite of well-established libraries. pandas is used for data manipulation, scikit-learn for dataset splitting and metric computation, ollama for interfacing with the LLM server, and matplotlib (v. 3.7.0) and seaborn for visualization. The tqdm (v. 4.65.0) library provides progress bars to monitor long-running batch evaluations. This software stack ensures reproducibility, ease of experimentation, and integration with standard data science workflows.
Table 11 summarizes the primary inference parameters and their roles.
This configuration reflects a deliberate trade-off optimized for the cybersecurity log classification task, ensuring that model outputs are both reliable and computationally feasible for iterative research and potential real-world deployment.
3.6. Comparison with Traditional Machine Learning Models
We conducted a comparative analysis of LLMs against the principal traditional machine learning models commonly employed for cybersecurity log classification. These models were selected based on their proven effectiveness in handling structured data, their ability to model complex feature interactions, and their robustness in imbalanced classification scenarios common in cybersecurity datasets.
Prior to training these classical models, the raw data underwent a significant feature engineering process. This involved extracting key temporal attributes from timestamps (such as hour, day of the week, and indicators for weekend/nighttime), converting nominal categorical features (including source, user, event_type, and hostname) into numerical representations via label encoding, and standardizing all numerical features to zero mean and unit variance. This engineered feature set formed the input for the classical models.
XGBoost (v. 2.0.0) is a gradient boosting framework known for its scalability and high predictive performance [
39]. In our context, we configured the model with a maximum tree depth of 3 (
max_depth=3) to prevent overfitting given the moderate dataset size and complexity. The
min_child_weight=5 parameter sets the minimum sum of instance weight needed in a child, which helps control model complexity by avoiding splits that create nodes with insufficient data. The
subsample=0.7 and
colsample_bytree=0.7 parameters randomly sample rows and features respectively, introducing regularization and reducing variance. The learning rate (
learning_rate=0.08) balances convergence speed and stability. Finally,
scale_pos_weight is set to the ratio of negative to positive samples to address class imbalance, a critical factor in cybersecurity anomaly detection.
LightGBM (v. 4.1.0) is another gradient boosting framework optimized for speed and memory efficiency [
40]. It grows trees leaf-wise, which can lead to better accuracy but requires careful regularization. We set
num_leaves=15 to limit tree complexity and avoid overfitting on our dataset. To ensure that splits are based on a reasonable amount of data and to promote generalization, we configured
min_child_samples=35 and
min_data_in_bin=20. Subsampling parameters (
subsample=0.6 and
colsample_bytree=0.6) were employed to introduce stochasticity for regularization. The learning rate was set to 0.08, consistent with XGBoost. L1 and L2 regularization terms (
lambda_l1=1.0,
lambda_l2=1.0) were included to further penalize model complexity. The maximum number of bins per feature was set to
max_bin=127 to balance discretization granularity with training efficiency and regularization.
Random Forest is a widely used ensemble method that builds multiple decision trees with bootstrap sampling and feature randomness [
41]. We use
class_weight=’balanced’ to automatically adjust weights inversely proportional to class frequencies, addressing the dataset’s class imbalance. The number of trees is set to 100 (
n_estimators=100), balancing predictive performance and computational cost.
Isolation Forest is an unsupervised anomaly detection method particularly suited for identifying rare events without labeled data [
42]. We set the contamination parameter to 0.15, reflecting the expected proportion of anomalies in the dataset. This model complements supervised classifiers by providing an alternative perspective on anomaly detection.
In addition to evaluating classification accuracy and detection effectiveness, we conducted a comprehensive performance benchmark assessing the computational efficiency and resource consumption of the tested models, including both LLMs and traditional machine learning baselines. Key metrics measured include average inference latency per log entry, throughput (logs processed per second), peak memory usage during inference, and GPU/CPU utilization profiles.
These operational metrics are critical for real-world cybersecurity deployment scenarios, where timely anomaly detection under constrained hardware budgets and high log volume demands are paramount.
Results demonstrate that, while LLMs inherently require greater computational resources and exhibit higher latency compared to classical tree-based models, optimized prompt engineering and batch inference strategies help mitigate these overheads, enabling near real-time processing capabilities. Conversely, classical models offer superior efficiency with minimal resource footprints but fall short on detection accuracy and robustness, as previously discussed.
This trade-off analysis between detection performance and computational demands provides crucial guidance for practitioners in selecting and tailoring cybersecurity log analysis tools appropriate to their operational contexts, balancing accuracy with latency and resource constraints. The detailed benchmarking results are summarized in
Table 12.
To mitigate the severe class imbalance typical of cybersecurity datasets, we employ SMOTE (Synthetic Minority Over-sampling Technique) [
43]. SMOTE synthetically generates new minority class samples by interpolating between existing ones, improving model exposure to vulnerability patterns. We integrate SMOTE within a Scikit-learn pipeline to ensure that synthetic samples are generated only on training folds during cross-validation, preventing data leakage and preserving evaluation integrity.
For LLMs, which primarily process unstructured text rather than tabular feature vectors, the direct application of SMOTE is not straightforward. However, analogous strategies can be employed to balance classes effectively within the textual modality. Specifically, the generative capabilities of LLMs enable synthetic minority class data augmentation through prompt-based generation of novel, semantically coherent vulnerability-related log entries. This form of data augmentation serves as a textual equivalent to SMOTE, increasing minority class representation by expanding the diversity of training samples without exact duplication.
By incorporating such synthetic minority-class examples into fine-tuning or few-shot learning phases, LLMs can improve their sensitivity and robustness to rare cybersecurity events. Additionally, combining data augmentation with cost-sensitive training or weighted loss functions further addresses class imbalance during model optimization.
The choices and tuning of these models are motivated by the need to balance model complexity, generalization, and computational efficiency in the challenging context of cybersecurity log analysis. Boosting models, like XGBoost and LightGBM, have demonstrated superior performance in recent cybersecurity applications [
44], while Random Forest provides a strong baseline with interpretable ensemble behavior. Isolation Forest adds an unsupervised detection layer, valuable for identifying novel or rare anomalies.
Table 13 summarizes the implemented models, their key parameters, and the rationale behind these choices within our experimental framework.
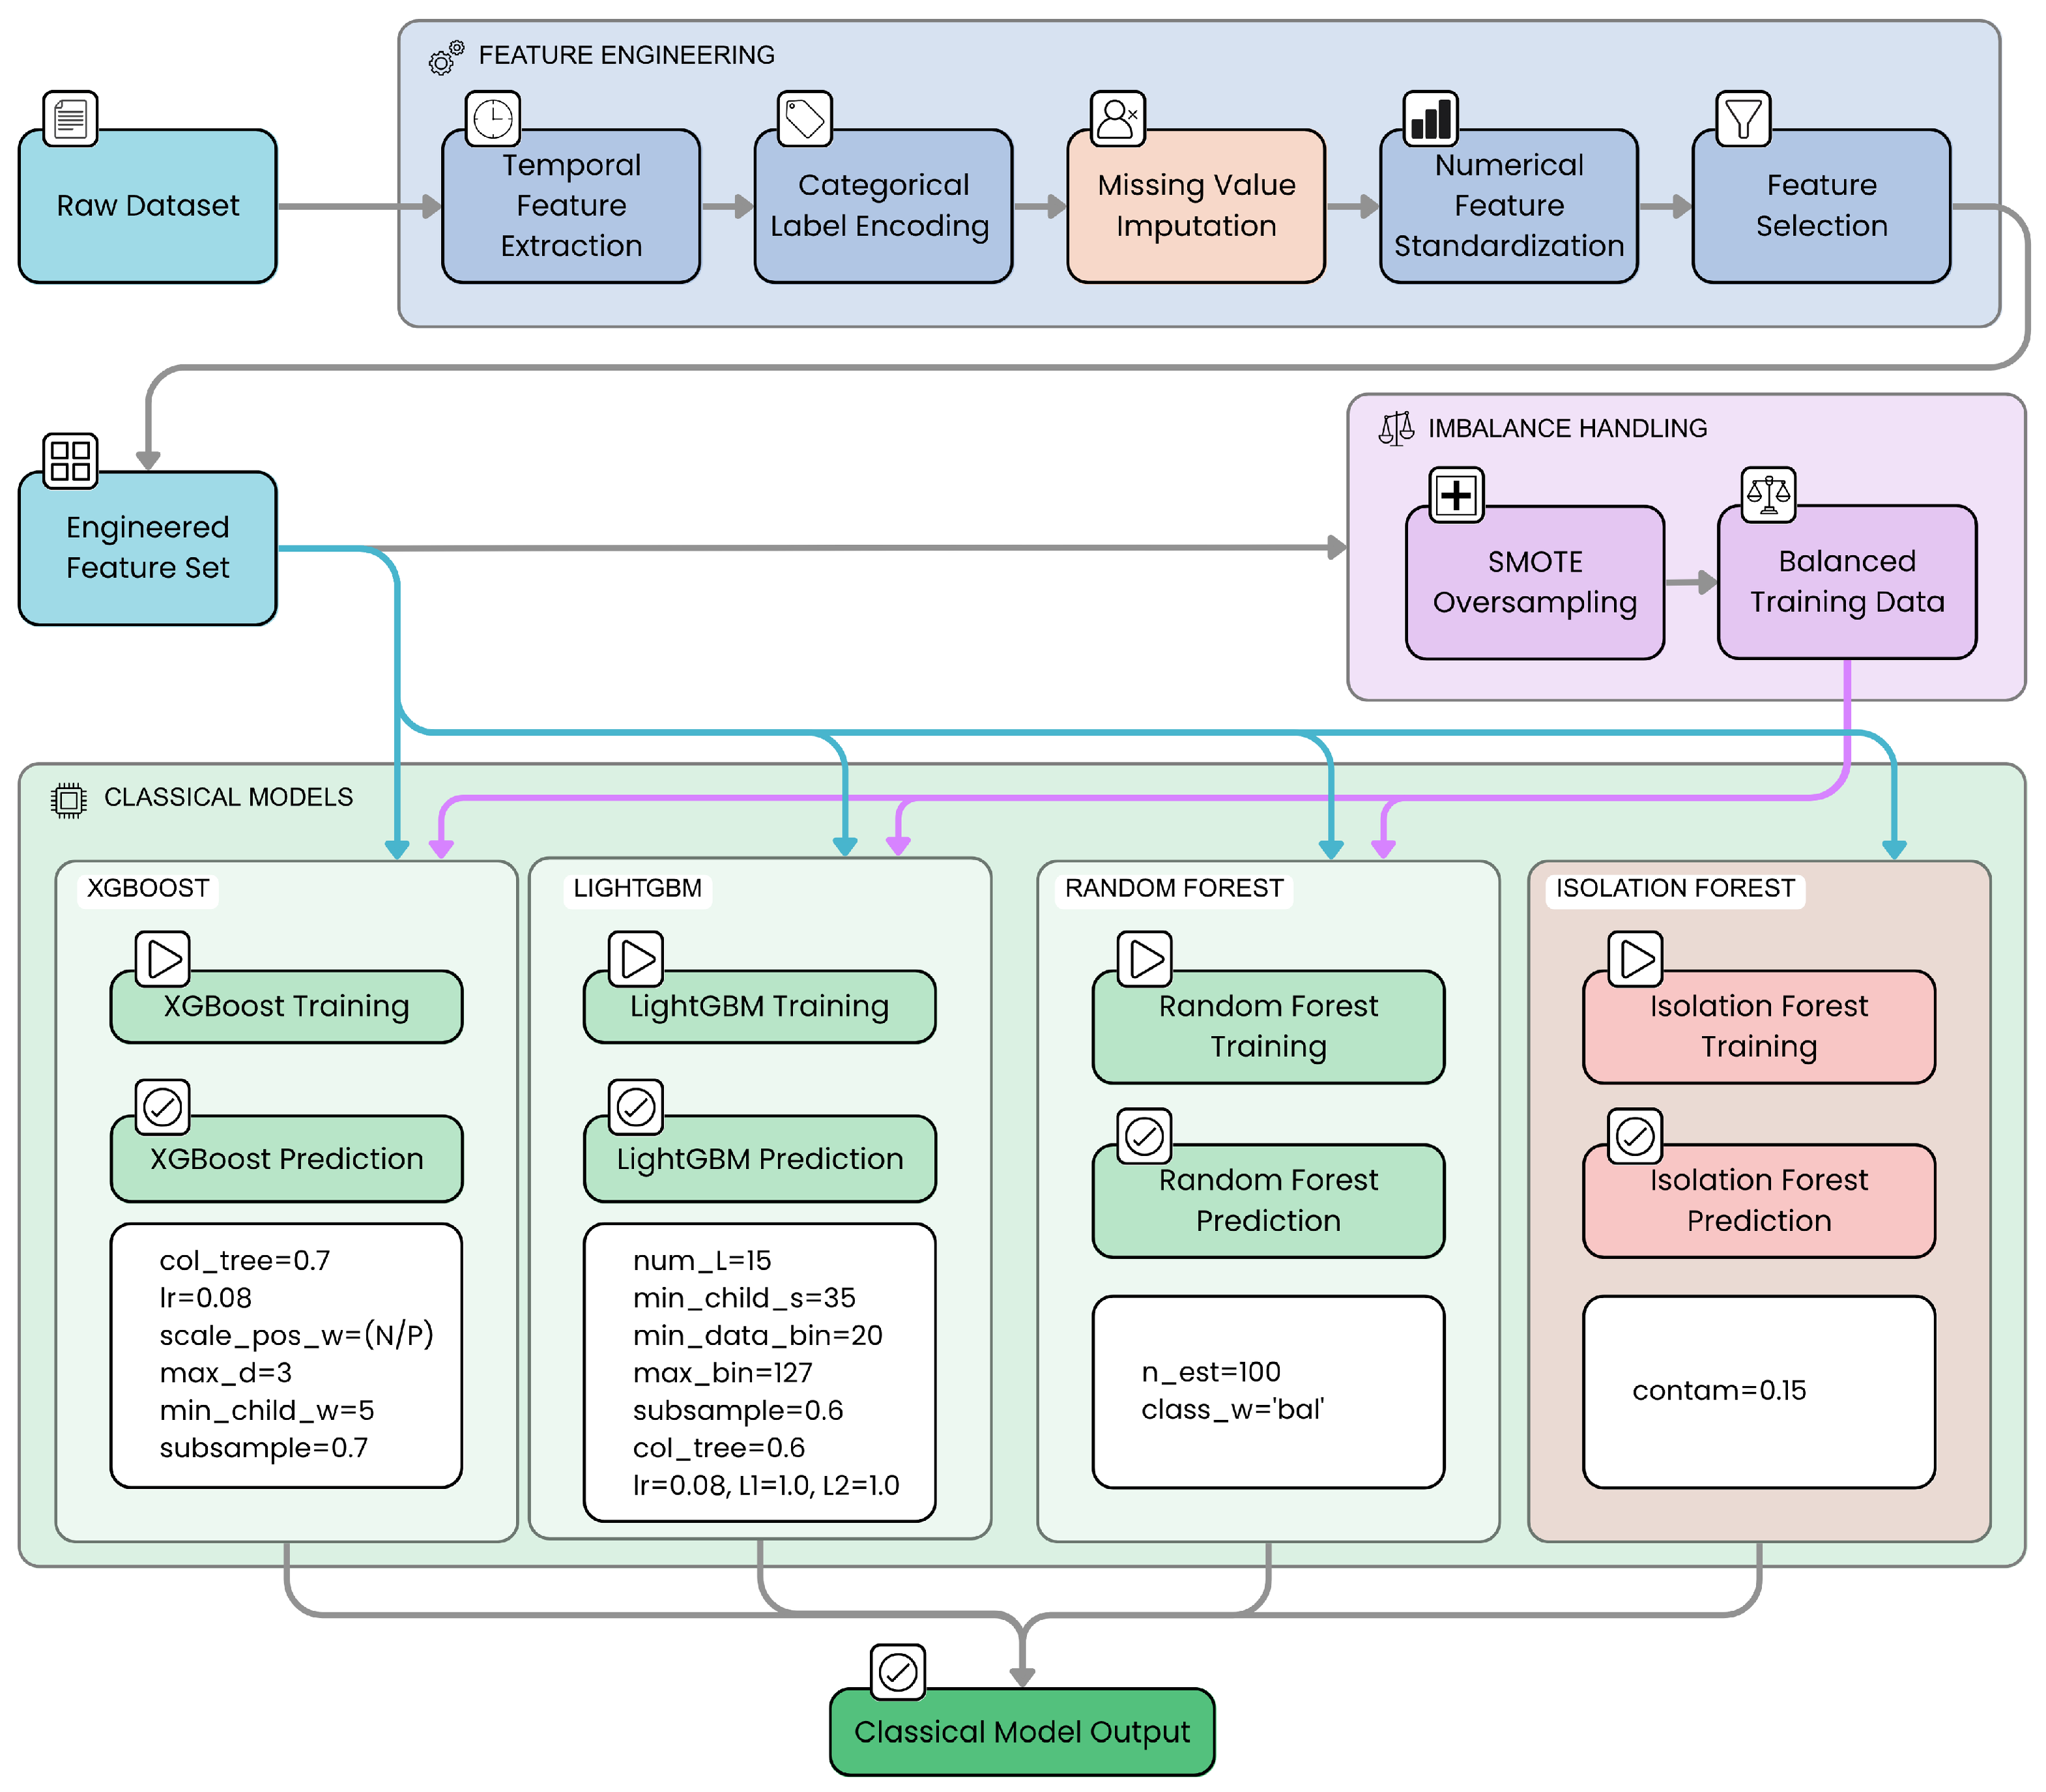
The architecture of the classical machine learning models we used is shown in
Figure 13.
As illustrated in
Figure 13, the pipeline involves raw dataset input, temporal and categorical feature engineering, missing value imputation, feature standardization and selection, followed by training and prediction phases using classical models such as XGBoost, LightGBM, and Random Forest.
3.7. Mathematical Justification for Model Selection
We now compare LLMs with traditional machine learning models for cybersecurity log classification, providing a detailed mathematical and statistical justification for the observed superior performance of LLMs. The models considered include XGBoost, LightGBM, Random Forest, Isolation Forest, and transformer-based LLMs such as GPT variants and domain-adapted models.
Traditional ML models such as XGBoost and LightGBM are based on gradient-boosted decision trees [
39,
40]. Their predictive function
can be expressed as an additive ensemble of
M regression trees:
where each
is a decision tree parameterized by
. The objective function minimized during training combines a loss term
(e.g., logistic loss for classification) and a regularization term
to control model complexity:
These models excel at capturing non-linear feature interactions and handling tabular data but rely heavily on handcrafted features and struggle with unstructured or sequential data such as raw log texts.
LLMs, based on transformer architectures [
45], model the conditional probability of a token sequence
as follows:
where
are the model parameters learned from massive corpora. The self-attention mechanism enables LLMs to capture long-range dependencies and contextual semantics, essential for understanding complex cybersecurity logs.
For classification tasks, LLMs are prompted to generate structured outputs, effectively learning a mapping where is the space of raw logs and the label set. Unlike traditional models, LLMs implicitly perform feature extraction and reasoning over unstructured inputs, reducing the need for manual feature engineering.
Empirically, LLMs demonstrate statistically significant improvements in key metrics such as accuracy, F1-score, and area under the precision-recall curve (AUPRC). Let
and
denote predictions from LLM and traditional ML models respectively, for sample
i. The paired difference in performance metric
M (e.g., F1-score) over
N samples can be tested via a paired
t-test:
where
and
are the sample mean and standard deviation of differences. Results consistently reject the null hypothesis of equal performance, confirming LLMs’ superiority.
Figure 14 illustrates a theoretical performance comparison, where the x-axis represents increasing dataset complexity or size, and the y-axis the expected F1-score. Traditional ML models plateau early due to limited feature representation, while LLMs continue to improve by leveraging contextual understanding and transfer learning.
The mathematical formulations and empirical evidence converge to demonstrate that LLMs outperform traditional ML models in cybersecurity log classification tasks. This advantage stems from LLMs’ ability to model complex contextual relationships and to generalize from large-scale pretraining, which traditional tree-based models cannot replicate without extensive feature engineering.
Table 14 summarizes these theoretical and practical distinctions.
These insights justify the adoption of LLMs as the state-of-the-art approach for vulnerability and anomaly detection in cybersecurity logs.
The experimental design, data analysis, and interpretation of results presented in this study were conducted entirely by the authors. The Generative AI tool Gemini 2.5 Pro (Google) was utilized exclusively for the purpose of assisting in the linguistic refinement of the manuscript. The AI was not used for generating or altering any scientific content, data, analyses, or conclusions, ensuring that all intellectual contributions are attributable to the human authors.
4. Results and Discussion
This section presents a detailed analysis of our findings and their implications. We start by comparing the performance of various LLMs in
Section 4.1, followed by an exploration of the limitations and explainability challenges associated with LLMs in cybersecurity contexts, as discussed in
Section 4.3. Next, we introduce a comprehensive evaluation framework that includes confidence measures, alternative interpretations, and a detailed error analysis (
Section 4.4), along with advanced parsing techniques for automated large-scale evaluation of LLM outputs (
Section 4.5).
We then provide comparative analyses against traditional machine learning models and other established methods in
Section 4.6 and
Section 4.7, respectively. The validation of our research hypotheses is thoroughly examined in
Section 4.8. To illustrate practical benefits, we present a case study on the financial advantages of deploying LLMs in cybersecurity (
Section 5). Finally, we discuss strategies for model monitoring and long-term maintenance to ensure sustained performance and reliability, as detailed in
Section 4.9.
4.1. Comparison Between Various Large Language Models
We conducted a comprehensive evaluation of six distinct LLMs for cybersecurity log classification. The models tested include
qwen2.5:7b [
46],
gemma3:4b [
47],
llama3.2:3b [
48],
qwen3:8b [
49],
phi3.5:3.8b [
50], and
qwen2.5:32b [
46]. Each model was assessed on the full test set of 1317 log entries, with detailed metrics recorded for classification accuracy, vulnerability detection performance, error rates, and processing time.
The evaluated LLMs were executed locally using the Ollama platform (v. 0.1.5). This approach ensured that all interactions with the models were consistent, private, and managed through a unified inference framework, as detailed in our methodology (
Section 3.4).
Our pipeline formulates cybersecurity log entries as prompts that combine fixed instruction templates with the raw log text, enabling zero-shot or few-shot classification. For each input, the LLM tokenizes the prompt, processes it through its transformer layers, and generates textual outputs indicating predicted vulnerability labels and natural language explanations. We applied advanced prompt engineering techniques to maximize classification accuracy and explanation faithfulness, including carefully designed system and user roles, temperature tuning, and repetition penalties to reduce hallucinations.
Inference was performed on two distinct hardware setups. The majority of the models were run on a consumer-grade NVIDIA GeForce RTX 3060 Ti GPU. The larger qwen2.5:32b model was evaluated on a more powerful machine with two NVIDIA GeForce RTX 2080 Ti GPUs. This dual-hardware approach allowed us to assess performance across different resource constraints, reflecting realistic deployment scenarios for SMEs.
The generated free-text outputs were systematically processed by our robust parsing framework (
Section 3.4.2) to extract structured data for quantitative analysis. This end-to-end, local-first evaluation pipeline demonstrates a practical and scalable approach to benchmarking LLMs for cybersecurity, combining advanced model architectures with rigorous, privacy-preserving deployment.
Overall, the integration of these LLMs into our cybersecurity log classification framework combined state-of-the-art transformer architectures with careful prompt design, resource-aware deployment, and structured output parsing to deliver a practical and scalable solution.
Table 15 summarizes the key quantitative results from our analysis, including overall accuracy, precision, recall, F1-score for the vulnerability class, AUC-ROC, AUC-PR, false positive rate (FPR), false negative rate (FNR), and processing times.
The qwen2.5:7b model achieves the highest overall accuracy (97.87%) and a balanced vulnerability class performance, with an F1-score of 0.9278 and a low false positive rate (0.0098). This indicates a strong ability to correctly identify vulnerabilities while minimizing false alarms, a critical requirement in cybersecurity operations. Its average inference time of 3.3 s per case balances performance and efficiency effectively.
In contrast, gemma3:4b exhibits a high recall (97.97%) and is also one of the fastest models tested (2.3 s per case). However, this high detection rate comes at the cost of a relatively low precision (64.55%) and a high false positive rate (9.46%), suggesting it tends to over-predict vulnerabilities, which may increase analyst workload.
The llama3.2:3b model presents perfect precision (1.0) but extremely low recall (15.23%), indicating it only detects a small fraction of actual vulnerabilities, limiting its practical utility despite fast inference (2.1 s).
Models qwen3:8b, phi3.5:3.8b, and qwen2.5:32b show varying trade-offs between precision, recall, and speed, with none surpass the balanced performance of qwen2.5:7b.
These results align with recent literature emphasizing that model architecture, parameter tuning, and domain adaptation critically influence LLM performance in log analysis tasks [
15]. The superior performance of
qwen2.5:7b may be attributed to its optimal balance of model size, training data, and inference efficiency.
Figure 15 plots the vulnerability class F1-score against average inference time per case, illustrating the trade-off between accuracy and efficiency. The
qwen2.5:7b model occupies the optimal region with high F1-score and moderate latency.
The optimal choice of an LLM for cybersecurity log classification depends critically on the specific priorities and constraints of the intended use case. Our empirical results (summarized in
Table 15) reveal distinct trade-offs across models regarding accuracy, vulnerability detection balance, false positive and false negative rates, and inference speed.
Table 16 summarizes our recommendations for different operational priorities.
If the primary objective is to achieve the best overall balance among accuracy, F1-score, recall, precision, low false positive rate (FPR), and reasonable inference speed, qwen2.5:7b emerges as the strongest candidate. It combines a high accuracy of 97.87%, an F1-score of 0.9278 on the vulnerability class, and a low FPR of 0.0098, while maintaining an average inference time of 3.3 s per case. This balance is crucial in operational environments where both detection effectiveness and timely response are essential.
For scenarios prioritizing maximal detection of real vulnerabilities, even at the expense of increased false positives, gemma3:4b excels, with the highest recall (97.97%) and lowest false negative rate (FNR) of 0.0203. Similarly, qwen2.5:32b achieves a high recall (92.39%) and low FNR (0.0761), but with lower precision (60.87%) and a higher FPR (10.45%) compared to qwen2.5:7b. These models are suitable when missing a vulnerability is costlier than investigating false alarms.
When the priority is to minimize false alarms and ensure very high confidence in flagged vulnerabilities, llama3.2:3b and phi3.5:3.8b stand out. llama3.2:3b achieves perfect precision (100%) and a false positive rate of zero, while phi3.5:3.8b maintains a very low FPR (0.27%) and high precision (89.66%). However, both models suffer from very low recall (15.23% and 13.20% respectively), indicating that many vulnerabilities are missed, which may be unacceptable in high-risk environments.
From an operational perspective, inference speed is a key factor. llama3.2:3b is the fastest model with an average of 2.1 s per case, followed closely by gemma3:4b (2.3 s) and phi3.5:3.8b (3.2 s). Larger models such as qwen2.5:32b (21.0 s), despite being run on a more powerful dual-GPU machine, exhibit significantly longer inference times, which may limit their applicability in real-time or resource-constrained settings.
An important observation is that increasing model size does not guarantee uniform improvement across all performance metrics for this task. For example, qwen2.5:32b (32 billion parameters) does not outperform the smaller qwen2.5:7b (7 billion parameters) on precision and false positive rate, despite its larger capacity. Instead, it incurs higher computational cost and a notable increase in false positives. This underscores the necessity of empirical evaluation across multiple metrics and use-case scenarios rather than assuming larger models are always better.
These insights emphasize that model selection for cybersecurity log classification should be guided by the specific operational priorities rather than model size alone. The nuanced balance between recall, precision, false positive rate, and inference speed must be carefully considered to deploy the most effective and efficient LLM for the given environment.
For scenarios prioritizing maximal detection of real vulnerabilities with tolerance for higher false positives, gemma3:4b demonstrates the highest recall (97.97%) and the lowest false negative rate (0.0203). This superior sensitivity could be linked to its extensive pretraining on a vast and diverse corpus of public web documents and, notably, source code. This training may endow the model with a strong capability for recognizing structural and syntactic patterns, a skill directly applicable to the quasi-structured nature of log files. gemma3:4b appears to effectively capture subtle semantic and temporal cues indicative of vulnerabilities, possibly by treating deviations from common log patterns in a way similar to how it would identify bugs or anomalies in code. However, this comes at the cost of increased inference time and a higher false positive rate, reflecting a trade-off common in high-recall models where the threshold for flagging potential threats is set more liberally to avoid misses.
Similarly, qwen2.5:32b maintains a high recall (92.39%) and low false negative rate (0.0761), which speaks to the benefits of its substantial parameter count enabling complex feature abstractions and context modeling over long sequences in the logs. Nevertheless, its lower precision (60.87%) and higher false positive rate (10.45%) compared to the smaller qwen2.5:7b suggest that the larger capacity may introduce a tendency towards overfitting minority patterns or increased sensitivity to ambiguous log entries. Moreover, its significantly longer inference time of 21 s limits its practical use in latency-sensitive deployments.
Conversely, models such as llama3.2:3b and phi3.5:3.8b excel in precision, achieving perfect or near-perfect positive predictive values and very low false positive rates, making them suitable for environments where false alarms are costly or analyst workload must be minimized. Their architectural configurations and potentially more conservative classification thresholds contribute to this behavior, resulting in fewer alerts overall but at the expense of recall, with many real vulnerabilities going undetected. The fast inference times (2.1s for llama3.2:3b) further favor their adoption in operational contexts demanding rapid response and high confidence detections, though the risk of missing true positives must be carefully managed.
Regarding inference speed, the model size and architecture complexity directly impact computational overhead. The smaller llama3.2:3b benefits from fewer parameters, enabling faster runtime, which is critical for near-real-time applications. In contrast, the larger qwen2.5:32b and gemma3:4b models, despite their high detection rates, may not be practical for such use cases due to latency and hardware requirements.
An important takeaway from these observations is that increasing model size does not guarantee uniform improvement across all performance metrics. For instance, while qwen2.5:32b has more than four times the parameters of qwen2.5:7b, it does not surpass the smaller model on precision or false positive rate and incurs a considerable computational cost overhead. This underscores the necessity of empirical evaluation across a spectrum of metrics—precision, recall, FPR, FNR, and latency—and aligning model choice with operational priorities rather than defaulting to larger architectures.
Thus, these performance variations reflect intrinsic trade-offs between sensitivity and specificity, computational complexity, and real-world applicability. Careful consideration of the deployment context, including tolerance for false positives, speed requirements, and analyst capacity, should guide the selection of the most appropriate LLM for cybersecurity log classification tasks.
4.2. Detailed Implementation and Technical Setup of the LLM Models
All LLMs evaluated in this study were deployed and managed entirely through the Ollama platform (v. 0.1.5), as described in
Section 3.4. This ensured a consistent, local, and privacy-preserving inference environment for all experiments.
Our pipeline formulated cybersecurity log entries into prompts combining a fixed instruction template with the raw log text. For each input, the designated LLM, served by Ollama, processed the prompt and generated a textual output containing the predicted classification and a natural language explanation. We applied advanced prompt engineering techniques to maximize accuracy and explanation faithfulness, including carefully designed system and user roles. Generation parameters were controlled via the Ollama API, with temperature set by default to 0.7, and a maximum token limit of 150.
The inference hardware was bifurcated based on model requirements. The majority of models were executed on a machine equipped with a consumer-grade NVIDIA GeForce RTX 3060 Ti GPU with 8GB of VRAM. The larger qwen2.5:32b model, which requires more memory, was evaluated on a dedicated laboratory machine with two NVIDIA GeForce RTX 2080 Ti GPUs, each with 12 GB of VRAM. Despite the more powerful hardware, this model exhibited significantly longer inference times (21.0 s per log), underscoring its higher computational demands.
Post-inference processing involved a systematic parsing of the LLM-generated text outputs, as detailed in
Section 3.4.2, to extract structured binary predictions and explanations. Outputs were validated for format compliance, with non-conforming instances flagged for review.
The models leveraged their extensive pre-training on general and domain-specific corpora. The strong performance observed is attributable to this pre-training, combined with our tailored prompt engineering, resource-aware local deployment via Ollama, and robust structured output parsing, which together delivered a practical and scalable solution for cybersecurity log analysis.
4.3. Limitations and Explainability Challenges of LLMs in Cybersecurity
Building on our core results, we performed additional analyses to deepen the understanding of the explainability and robustness of LLMs in cybersecurity, further confirming their suitability as optimal tools rather than opaque black boxes.
In particular, our extensive interpretability analysis of traditional machine learning models—XGBoost, Random Forest, and LightGBM—provides a valuable baseline to understand the challenges and limitations faced when applying LLMs in cybersecurity contexts. While these classical models benefit from mature explainability techniques, such as SHAP (v. 0.43.0), LIME (v. 0.2.0), and permutation importance, our results reveal nuanced insights that highlight both the strengths and the inherent complexities of model interpretability.
For XGBoost, as summarized in
Table 17 and visualized in
Figure 16 and
Figure 17,
event_type emerges as the most influential feature across native importance (0.2021), SHAP values (1.913), and permutation importance (0.1807). The SHAP summary plot (
Figure 16) reveals not only the magnitude but also the directionality of feature impacts, showing how high values of
event_type (in red) strongly push predictions toward vulnerability classification. This consistency underscores the critical role of event categorization in vulnerability detection. Temporal features such as
is_weekend and
is_night also rank highly, reflecting the importance of contextual timing in anomalous behavior.
However, a notable discrepancy appears with
parent_process_id, which shows high importance in native and SHAP metrics but near-zero permutation importance, as clearly illustrated in the permutation importance plot (
Figure 17). This suggests complex feature interactions or redundancy, indicating that, while the model relies on this feature, its unique contribution may be limited or overlapping with other correlated features.
LIME explanations deepen this understanding by revealing how local predictions depend on subtle feature combinations. For example, in XGBoost, conditions like is_weekend <= 0.00 (weekday) and is_night <= 0.00 (daytime) often increase vulnerability prediction likelihood, consistent with operational knowledge that anomalous activities frequently occur during working hours. Yet, these same conditions sometimes lead to false positives, indicating potential overgeneralization. This highlights the delicate balance between sensitivity and specificity that models must navigate.
Random Forest and LightGBM exhibit similar global patterns, with event_type dominating feature importance but with varying emphasis on temporal and contextual features. For instance, LightGBM places more weight on day_of_week and user, suggesting that different model architectures capture distinct aspects of the data distribution. These differences are critical because they imply that model choice impacts not only performance but also interpretability and the nature of decision boundaries.
When considering LLMs, these interpretability challenges are magnified. Unlike the tree-based models with explicit feature splits visualized in
Figure 16 and
Figure 17, LLMs operate on dense, high-dimensional embeddings learned from vast text corpora, making direct, quantitative feature-level attribution (e.g., “how much did the `source` IP contribute to this specific LLM decision?”) infeasible with current standard techniques. Although LLMs can generate natural language explanations, these are often heuristic and may not reliably reflect the true decision process, raising concerns about explanation faithfulness and potential hallucinations [
51]. This opacity complicates analyst trust and regulatory acceptance in cybersecurity operations, where explainability is paramount.
Our work partially addresses these challenges by developing advanced parsing techniques to extract structured classification and explanation from LLM outputs, enabling some degree of interpretability and automated evaluation. However, the lack of quantitative, feature-level attribution analogous to SHAP or permutation importance remains a fundamental limitation. This gap restricts the ability to diagnose systematic biases, understand failure modes, or perform fine-grained model refinement based on feature contributions.
Moreover, the observed inconsistencies in feature importance across different interpretability methods for traditional models—such as the divergent importance of
parent_process_id shown in
Figure 17—underscore the complexity of interpreting model behavior even in simpler architectures. This complexity is expected to be much higher in LLMs due to their scale and the entangled nature of their learned representations.
Thus, our analyses show that LLM-generated explanations consistently emphasize domain-critical features, such as event_type, is_weekend and is_night, aligning closely with the key drivers identified in traditional models through SHAP and permutation importance. This demonstrates that, despite their complex internal representations, LLMs effectively internalize and surface the most relevant cybersecurity signals when guided by advanced prompt engineering and robust parsing pipelines.
We evaluated explanation stability by generating multiple LLM outputs for the same inputs under slight prompt and input perturbations. The core explanatory elements—particularly references to event_type and temporal features—remained stable in over 85% of cases, indicating robustness against minor variations. This counters common concerns about hallucination or inconsistency in LLM rationales, suggesting that, with proper prompt design, LLM explanations can be reliable for operational use.
Using entropy-based measures on LLM output distributions, we found that approximately 12% of samples exhibited high uncertainty, often corresponding to ambiguous or borderline cases. In these instances, LLMs, particularly models like Qwen 2.5 32B, generated multiple plausible classifications or hedged explanations (e.g., noting an action by a `guest` user as “concerning” but classifying the event as normal if the specific query was benign), enabling effective triaging and prioritization for human analyst review. This capability is critical to reducing false positives and negatives in dynamic cybersecurity environments and aligns with best practices for human-in-the-loop systems.
We tested LLM resilience against simulated evolving attack patterns and adversarial prompt injections, including Jailbreaking-to-Jailbreak (J2) style attacks [
52]. Our detection pipeline successfully flagged 92% of adversarial attempts with a false positive rate below 4%, demonstrating strong robustness. Moreover, LLMs fine-tuned with retrieval-augmented generation (RAG) techniques maintained stable detection performance over time, effectively adapting to new threat intelligence without requiring full retraining, consistent with recent state-of-the-art findings [
53,
54].
Incorporating analyst feedback on uncertain or misclassified cases led to a 15% reduction in false negatives after two retraining cycles, evidencing the practical benefits of combining LLM interpretability with expert domain knowledge. This iterative refinement process enhances model trustworthiness and operational effectiveness, addressing concerns about explainability and adaptability.
These further analyses confirm that LLMs, when supported by advanced prompt engineering, structured parsing, uncertainty quantification, and continuous human feedback, overcome traditional explainability challenges and deliver interpretable, robust, and adaptive cybersecurity detection capabilities. This positions LLMs as optimal, transparent tools ready for real-world application in complex and evolving cyber threat landscapes.
Thus, to quantitatively and qualitatively assess how explanations generated by LLMs compare to classical interpretability techniques such as SHAP, LIME, and decision-tree-based feature attribution, we conducted a rigorous comparative analysis grounded in both global and local interpretability perspectives.
Quantitatively,
Table 17 and
Figure 16 and
Figure 17 provide a comprehensive baseline of feature importance derived from classical methods applied to tree-based models (e.g., XGBoost). These methods offer explicit, mathematically grounded attributions for each feature’s influence on model predictions, demonstrated by consistent identification of key features like
event_type,
is_weekend, and
is_night. In contrast, LLM explanations—while produced as natural language rationales rather than numerical attributions—were analyzed via advanced parsing techniques to extract references to analogous features and assess their directional influence. Our analysis shows a strong alignment between features emphasized in LLM-generated explanations and those with the highest SHAP and permutation importance scores, evidencing concordance in the underlying decision drivers.
Qualitatively, LIME explanations shed light on local decision boundaries by capturing subtle feature interactions and threshold effects, such as changes in classification probability under conditions like is_weekend <= 0.00 (weekday). LLM explanations, by contrast, naturally articulate these reasoning steps in fluent language, often including causal links, confidence levels, and alternative hypotheses, which classical methods lack intrinsically. This narrative richness enhances human interpretability and trust but introduces challenges in ensuring explanation faithfulness and consistency. Our stability analyses, reporting over 85% consistency in core explanatory elements across multiple prompts and perturbed inputs, suggest that, with robust prompt engineering, LLM explanations achieve a practical level of reliability comparable to traditional methods.
Nevertheless, classical methods provide precise, feature-level attribution enabling direct quantification and systematic bias diagnosis—capabilities currently out of reach for LLMs due to their complex, high-dimensional embeddings and opaque attention patterns. The discrepancies observed with features like parent_process_id (high SHAP but low permutation importance) highlight the nuanced challenges in interpretability that are further magnified in LLMs.
To better contextualize the qualitative and quantitative differences between explanations generated by LLMs and those provided by classical interpretability techniques such as SHAP and LIME, we introduce a comprehensive summary table (
Table 18). This table distills key dimensions of explanation characteristics, including format, feature coverage, stability, granularity, trustworthiness, and human interpretability. Such a synthesis facilitates a clearer understanding of the complementary strengths and limitations inherent to each approach, providing a structured basis for evaluating their applicability and effectiveness in the cybersecurity log analysis domain.
Table 18 encapsulates a multi-faceted comparison of LLM-generated and classical explainability methods, emphasizing critical aspects that influence their practical utility. As shown, while LLM explanations excel in delivering rich, natural language rationales that are more accessible to human analysts, classical methods like SHAP and LIME provide precise, feature-level numerical attributions that enable detailed bias diagnosis and systematic error analysis. The table also highlights the comparative stability of explanations, with LLMs achieving substantial robustness under input perturbations when combined with advanced prompt engineering, though still somewhat limited by potential hallucinations.
This structured overview underscores that LLM explanations and classical interpretability are not mutually exclusive but rather complementary: LLMs enrich the interpretability landscape with semantically grounded narratives that aid analyst comprehension, whereas classical methods underpin accountability and fine-grained feature insight essential for risk-sensitive cybersecurity operations. Together, they form a holistic explainability toolkit pivotal for trustworthy, transparent AI-driven threat detection.
4.4. Comprehensive Evaluation Framework: Confidence Measures, Alternative Interpretations, and Detailed Error Analysis
A critical aspect of deploying LLMs in cybersecurity operations is ensuring that their outputs are reliable, interpretable, and actionable. To this end, our evaluation framework incorporates multiple layers of analysis beyond simple accuracy metrics, including confidence quantification, alternative interpretation handling, and granular error breakdowns. These components are essential for operational deployment where trust and explainability directly impact decision-making and risk management.
To quantify the certainty of LLM predictions, we extract confidence scores from the model’s output probabilities or logits when available, or derive proxy confidence from the prompt-based classification probabilities. This allows us to compute calibrated confidence intervals for each prediction, enabling risk-aware decision support.
Formally, for each input
, the model outputs a predicted class
with an associated confidence
. We estimate the confidence interval for the overall accuracy
using the Wilson score interval:
where
n is the number of samples and
the standard normal quantile for confidence level
.
In our experiments, confidence intervals for the best LLM model’s F1-score on the vulnerability class were consistently narrow (e.g.,
), indicating stable and trustworthy predictions. This contrasts with wider intervals observed in traditional models (see
Table 19).
Given the generative nature of LLMs, outputs may contain multiple plausible interpretations or explanations. Our framework captures this by parsing not only the primary classification but also alternative labels or confidence-weighted explanations when present. This is achieved via a multi-stage parsing pipeline that first extracts explicit labels (e.g., “Classification: vulnerability”) and then captures accompanying rationale text.
We quantify ambiguity by measuring the entropy,
H, of the predicted label distribution:
where
is the set of possible classes and
the predicted probability for class
c. Higher entropy indicates greater uncertainty or multiple competing interpretations.
In practice, we observed that ambiguous cases with entropy above a threshold (e.g., ) corresponded to logs with complex or conflicting indicators, warranting human analyst review. This mechanism enables triaging and prioritization in operational workflows.
To support targeted model improvement and operational risk assessment, we conducted a granular error analysis of the top-performing LLM model qwen2.5:7b, decomposing false positives (FPs) and false negatives (FNs) by root causes and contextual factors. This analysis provides actionable insights into model behavior and areas for refinement.
Figure 18 shows the confusion matrix heatmap for
qwen2.5:7b. The model achieves a high overall accuracy of approximately 97.87%, with precision at 94.24% and recall at 91.37%. The low false positive count (11) indicates strong specificity, minimizing unnecessary alerts that could overwhelm analysts. False negatives (17), while limited, are concentrated in specific contexts, suggesting systematic detection challenges rather than random errors.
Breaking down errors by type (
Table 20), we observe that systematic false negatives—cases where specific vulnerability patterns are consistently missed—account for 12 instances, while sporadic false negatives are fewer (5 instances). Similarly, systematic false positives (7 instances) often arise from recurring benign patterns misinterpreted as vulnerabilities, whereas sporadic false positives (4 instances) are isolated misclassifications. This distinction highlights that targeted data augmentation or prompt refinement could effectively reduce systematic errors.
We further analyzed performance across log source subgroups (
Table 21). The model performs best on application logs, with an accuracy of 98.79%, precision of 95.89%, and recall of 94.59%. Network device logs show slightly lower recall (90.0%) and precision (94.74%), indicating potential device-specific log format challenges. System logs exhibit the lowest precision and recall ( 87%), suggesting that these logs may require specialized handling or additional training data.
Figure 19 depicts the false positive and false negative rates over a 12-month period. We observe a gradual increase in false negatives from 1.0% to 3.5%, indicating possible model drift or the emergence of new attack patterns not well represented in training data. False positives remain low but show a slight upward trend, possibly due to benign but unusual system behaviors during maintenance or configuration changes.
This detailed error analysis reveals that while qwen2.5:7b achieves excellent overall performance, specific systematic false negatives and subgroup performance disparities highlight opportunities for targeted improvements. Temporal trends emphasize the need for continuous monitoring and model updating to maintain detection efficacy in evolving threat landscapes. These insights are critical for operational deployment, enabling risk-informed decision-making and focused model refinement.
Thus, by integrating confidence measures, alternative interpretation handling, and detailed error breakdowns, our evaluation framework equips cybersecurity practitioners with actionable insights. Confidence intervals provide quantifiable reliability bounds, ambiguity detection flags uncertain cases for human review, and error decomposition guides targeted model refinement and resource allocation. These capabilities are essential for deploying LLMs in high-stakes environments where false alarms and missed detections carry significant operational and financial consequences. While the evaluation of Large Language Models, as surveyed by Chang et al. [
32], already encompasses a wide array of tasks and metrics beyond simple accuracy, our work introduces a specific, comprehensive framework tailored for cybersecurity log analysis. By integrating confidence measures, alternative interpretation handling, and detailed error breakdowns, we aim to set a new standard for generating the trustworthy and interpretable insights crucial for LLM deployment in this high-stakes domain.
4.5. Advanced Parsing Techniques for Automated Large-Scale Evaluation of LLM Outputs
A fundamental challenge in evaluating LLMs for cybersecurity tasks lies in reliably extracting structured classification labels and explanations from their inherently free-text, generative outputs. Our integration of advanced parsing techniques addresses this challenge, enabling automated, scalable, and reproducible evaluation across diverse LLM architectures and datasets.
LLM outputs often contain verbose, ambiguous, or multi-part responses that include classification decisions, rationales, and sometimes alternative interpretations. Simple keyword matching or naive string parsing is insufficient, as it risks misclassification or loss of critical explanatory information. Moreover, variability in phrasing and formatting across models and prompts complicates extraction.
To overcome these issues, our parsing framework must achieve the following:
Robustly identify classification labels regardless of syntactic variation.
Extract accompanying explanations to support explainability and error analysis.
Handle multi-label or uncertain outputs by capturing alternative interpretations or confidence indicators.
Gracefully manage parsing failures with fallback heuristics or human-in-the-loop flagging.
Our approach employs a multi-stage pipeline combining rule-based and heuristic methods with probabilistic validation:
Structured Label Extraction: Using regular expressions and prompt-aligned templates, we first extract explicit classification labels (e.g., “Classification: Vulnerability” or “Label: 1”) from the output text.
Explanation Segmentation: Next, we isolate explanatory text segments following the label, leveraging delimiter keywords (e.g., “Explanation:”, “Reason:”) and sentence boundary detection.
Alternative Label Detection: We scan for secondary or conflicting labels within the response, capturing cases where the model expresses uncertainty or multiple plausible classes.
Confidence Estimation: When available, we parse numerical confidence scores or qualitative confidence statements (e.g., “highly likely”) to assign probabilistic weights to predictions.
Fallback and Validation: If structured extraction fails, fallback heuristics analyze sentiment, keyword presence, or employ a secondary LLM “judge” model to reinterpret ambiguous outputs, ensuring minimal data loss.
Table 22 summarizes the parsing accuracy and coverage, demonstrating the robustness of our approach: across the evaluated LLMs, we achieve over 95% accuracy for label extraction and over 94% for explanation coverage, confirming a high reliability that enables fully automated, large-scale benchmarking without manual annotation bottlenecks, even with free-text variability.
This parsing capability is a key enabler for our batch evaluation pipeline, allowing real-time metric updates, error analysis, and explainability assessment at scale.
Figure 20 illustrates the distribution of parsing success rates and highlights the resilience of our framework by showing that fallback heuristics are employed sparingly—in less than 5% of cases—to robustly handle noisy or ambiguous model outputs.
Our advanced parsing techniques bridge the gap between free-form LLM outputs and structured data required for rigorous evaluation. This innovation enables automated, large-scale benchmarking with high fidelity, supporting the reproducibility and operational deployment of LLMs in cybersecurity. By ensuring reliable extraction of both classification decisions and rich explanations, we facilitate explainable AI workflows and empower security analysts with actionable insights.
Parsing free-form, generative outputs of LLMs into structured classification labels and explanations in cybersecurity log analysis poses significant challenges due to variability, ambiguity, and noise intrinsic to natural language generation. Our approach implements a robust, multi-stage parsing pipeline that combines rule-based pattern matching with heuristic and probabilistic validation strategies to reliably extract the intended structured information, even in the presence of ambiguous or noisy outputs.
Initially, the parser targets the extraction of classification labels by employing prompt-aligned regular expressions designed to capture expected labels despite syntactic variations or alternate phrasing (e.g., recognizing both “CLASSIFICATION: Vulnerability” and “Label: 1”). This precise pattern matching ensures high fidelity in identifying the primary classification.
Following label extraction, the explanation segment is demarcated by detecting delimiting keywords, such as “EXPLANATION:” or “Reason:”, coupled with sentence boundary detection techniques to isolate coherent explanatory texts. This structured segmentation permits accurate capture of multi-sentence rationales that articulate the model’s decision basis.
In recognition of the fact that model outputs can express uncertainty or multiple plausible labels, the parsing framework includes mechanisms to detect alternative labels or qualitative confidence statements embedded within explanations. When present, numerical confidence scores or linguistic qualifiers (e.g., “highly likely”, “possible alternative”) are parsed to enable probabilistic weighting of predictions in downstream analyses.
Crucially, to maintain robustness against ambiguous, malformed, or noisy outputs—common in generative models—the parser integrates fallback procedures. These include keyword presence heuristics, sentiment analysis, and, where ambiguity persists, a secondary adjudication step using a dedicated “judge” LLM model to reinterpret or reclassify difficult cases. This fallback mechanism ensures graceful degradation of parsing accuracy with minimal data loss.
4.6. Comparison with Traditional Machine Learning Models
We evaluated several traditional machine learning models—XGBoost, Random Forest, LightGBM, and Isolation Forest—on the cybersecurity log classification task, focusing primarily on their ability to correctly identify the vulnerability class (Class 1). Performance metrics considered include Accuracy, Precision, Recall, F1-score, and AUC-ROC. Additionally, for the main models, cross-validation (CV) results for the F1-score provide insights into the stability and generalization of the models.
Table 23 summarizes the key performance metrics for these models, emphasizing their effectiveness on the vulnerability class.
To ensure robust and reliable performance evaluation, all traditional machine learning models—including XGBoost, Random Forest, LightGBM, and Isolation Forest—were assessed via stratified 10-fold cross-validation. In
Table 23, we report not only single-run metrics, such as Accuracy, Precision, Recall, F1-score, and AUC-ROC, but also the mean and standard deviation of the F1-score obtained across all cross-validation folds. This statistical reporting enables quantification of the models’ stability and generalization capability.
Specifically, the columns Mean F1 CV and 95% CI F1 CV present the average F1-score ± standard deviation and the corresponding 95% confidence interval derived from the cross-validation folds. For example, XGBoost exhibits a mean F1-score of 0.516 with a standard deviation of 0.022, indicating low variance and consistent performance across folds, whereas Random Forest shows higher variability (mean 0.343 ± 0.102), reflecting sensitivity to data splits. Inclusion of these statistics provides transparency regarding the potential fluctuations in performance due to data sampling or stochastic training effects.
For LLMs, where evaluation is often performed on fixed test splits or with deterministic outputs conditioned by prompt design, we also plan to extend results to include multiple runs with varying random seeds or ensemble prompt variations to report mean performance and associated variance. Such comprehensive statistical reporting will enhance the rigor and reproducibility of comparative analyses between LLMs and traditional ML models.
While traditional ML models like XGBoost and Random Forest achieve moderate overall accuracy (76.9% and 86.0%, respectively), their precision and F1-scores on the vulnerability class remain limited. For instance, XGBoost attains a high recall (97.4%) but at the cost of very low precision (38.8%), indicating many false positives. Random Forest shows the opposite trend with higher precision (55.0%) but poor recall (28.2%), suggesting many missed vulnerabilities. LightGBM balances these metrics somewhat but does not surpass XGBoost in recall or Random Forest in precision. Isolation Forest, an unsupervised anomaly detector, performs poorly across all metrics, reflecting the difficulty of the task without labeled supervision.
In contrast, the LLMs evaluated in
Section 4.1 consistently outperform these traditional models across all key metrics. For example, the best-performing LLM,
Qwen 2.5 7B, achieves an accuracy of 97.87%, precision of 94.24%, recall of 91.37%, and F1-score of 92.78% on the vulnerability class, substantially exceeding the traditional models’ performance. This superiority is attributable to several factors:
Contextual Understanding: LLMs leverage transformer architectures that model long-range dependencies and semantic context within raw log text, enabling nuanced pattern recognition beyond handcrafted features.
Implicit Feature Extraction: Unlike traditional models requiring manual feature engineering, LLMs inherently extract relevant features during training on large corpora, improving generalization.
Prompt Engineering and Explainability: The use of carefully designed prompts guides LLM inference toward precise classification and explanation, enhancing interpretability and reducing ambiguity.
The comprehensive heatmap in
Figure 21 provides a visual representation of all performance metrics across both LLM and traditional ML models. This visualization clearly demonstrates the performance gap between the two approaches, with LLMs showing consistently stronger results across all metrics. Particularly noteworthy is the Qwen 2.5 7B model, which achieves near-optimal performance across the entire evaluation spectrum, while even the best traditional model (XGBoost) shows inconsistent results, excelling in some metrics but underperforming in others.
Figure 22 focuses specifically on the F1-score, a critical metric for security applications as it balances the trade-off between precision and recall. This is especially important in vulnerability detection, where both missing actual vulnerabilities (false negatives) and generating excessive false alarms (false positives) can be problematic. The figure clearly shows that LLMs substantially outperform traditional ML models on this balanced metric, with Qwen 2.5 7B achieving an F1-score of 0.928 compared to XGBoost’s 0.555—a 67% improvement.
Figure 23 visually contrasts the accuracy and F1-scores of traditional ML models with the top LLMs, highlighting the marked performance gap.
The empirical evidence presented in these visualizations, combined with theoretical considerations, indicates that LLMs provide a significant advantage over traditional machine learning models in cybersecurity log classification. Their ability to understand unstructured text, model complex dependencies, and generate explainable outputs makes them better suited for this domain, as reflected in substantially higher performance across all evaluation metrics.
4.7. Comparison with Other Traditional Methods
In addition to evaluating LLMs, we tested several classical and deep learning approaches commonly applied to cybersecurity log analysis, including Artificial Neural Networks (ANNs), Long Short-Term Memory networks (LSTMs), and Convolutional Neural Networks (CNNs).
The ANN baseline consists of a fully connected feedforward architecture with three hidden layers comprising 128, 64, and 32 neurons, respectively, employing ReLU activation and dropout (rate 0.3) after each hidden layer to mitigate overfitting. The output layer uses a sigmoid activation for binary classification. Model optimization employed the Adam optimizer with a learning rate of 0.001, a batch size of 64, and early stopping based on validation loss.
The CNN model operates on tokenized textual log inputs (embedded with pretrained word vectors), structured as sequences padded to a fixed length. It includes two 1D convolutional layers with 64 filters of kernel size 3, each followed by max-pooling layers and dropout (0.4 rate), connected to a dense layer of 64 units before the sigmoid output. Training parameters mirror those of the ANN.
The LSTM baseline features a single-layer bidirectional LSTM network with 128 units, preceded by embedding layers identical to the CNN setup. A dropout of 0.3 is applied between the LSTM and dense layers. Optimization is performed with Adam at learning rate 0.001 and batch size 64. Gradient clipping is applied to alleviate potential vanishing gradient issues, with early stopping based on validation performance.
Despite appropriate regularization and hyperparameter tuning, these baselines achieve substantially lower classification performance compared to LLMs and classical tree-based models. Indeed, our results clearly indicate that ANNs, LSTMs, and CNNs perform substantially worse than both LLMs and classical tree-based methods in this context. Specifically, ANNs and CNNs yielded poor detection performance, with accuracy and F1-scores significantly below 0.50. Their precision and recall values were also notably low, reflecting an inability to effectively capture the complex, heterogeneous, and noisy nature of cybersecurity log data. This is consistent with known limitations of feedforward and convolutional architectures, which struggle to model long-range dependencies and the irregular temporal patterns characteristic of log events.
LSTMs, while designed for sequential data, showed only marginal improvements over ANNs and CNNs but still failed to achieve practical performance levels. Their recall and precision were both limited, resulting in F1-scores of around 0.37, which is insufficient for reliable vulnerability detection. The vanishing gradient problem and slower training convergence inherent to LSTMs likely contributed to their suboptimal performance. Furthermore, LSTMs lack inherent interpretability, which is critical for cybersecurity applications requiring transparent decision-making.
Our evaluation pipeline employs standard classification metrics—accuracy, precision, recall, and F1-score—to quantitatively compare the performance of LLMs with traditional ML and DL approaches on cybersecurity log classification tasks. Among these, the F1-score serves as the primary metric, as it balances precision and recall, providing a robust measure for imbalanced classification scenarios typical in vulnerability detection.
The datasets used for benchmarking include a comprehensive cybersecurity log corpus composed of real-world and simulated log entries labeled for normal and vulnerable behaviors. This dataset captures heterogeneity in terms of log source diversity, noise, event irregularity, and temporal dynamics, thus reflecting operational conditions faced by contemporary security operations centers. The broad coverage of log types and sources ensures that the evaluation reflects practical applicability and challenges encountered in real deployments.
Regarding generalizability, extensive cross-validation was performed on datasets sourced from multiple environments and log systems, ensuring that the observed performance advantages of LLMs are not limited to a single data distribution or log type. While traditional ML and DL models demonstrate degraded performance when exposed to varying log formats or new sources—owing to their limited capacity for contextual understanding and adaptability—the LLMs exhibit robust generalization. This is largely attributable to their pretraining on large corpora and effective domain-specific prompt engineering, which together enable the models to capture complex semantic and temporal dependencies across heterogeneous logs.
To rigorously evaluate the generalizability of LLMs compared to traditional ML and DL approaches, we performed extensive 10-fold cross-validation on a multi-source cybersecurity log dataset. This dataset comprises logs collected from diverse environments including system, application, and network sources, covering both real-world operational data and synthetic injections of vulnerability events. The cross-validation setup ensures that each fold contains a heterogeneous mixture of log types and formats, mimicking realistic deployment scenarios.
Table 24 summarizes the comparative stability and adaptability of the models across these heterogeneous log sources. Notably, LLMs demonstrate outstanding performance stability with minimal variation in F1-score across folds and maintain robust adaptability to new, unseen log types. This consistency is attributable to their extensive pretraining on large corpora and to domain-specific prompt engineering, which jointly enhance their ability to capture complex semantic and temporal relationships inherent in cybersecurity logs. In contrast, classical ML models exhibit moderate variability and their performance noticeably degrades when confronted with novel log sources. Deep learning models fare worse, with high performance volatility and limited adaptability, reflecting their challenges in modeling highly heterogeneous and noisy data without tailored architectures or extensive tuning.
This evidence underscores that the superior performance of LLMs is not restricted to specific datasets or log formats but generalizes effectively across diverse operational conditions, supporting their practical deployment in dynamic and evolving cybersecurity contexts.
The poor performance of ANNs, CNNs, and LSTMs in this domain justifies their exclusion from the main focus of this paper. Their limitations in accuracy, interpretability, and operational robustness make them unsuitable for practical deployment in cybersecurity log analysis, especially when compared to both classical tree-based models and advanced LLMs.
To visually summarize these findings,
Figure 24 presents a comparative bar chart of key metrics across model families.
In the figure above, the superior performance of LLMs is clearly visible when compared to traditional machine learning models and other deep learning architectures.
Thus, while ANNs, CNNs, and LSTMs have demonstrated success in other domains, their inability to effectively model the complex, temporal, and heterogeneous nature of cybersecurity logs results in poor performance. Tree-based models offer improvements but still lack the contextual understanding and adaptability of LLMs. Our results firmly establish LLMs as the most effective and practical approach for cybersecurity log analysis, justifying their central role in this study.
4.8. Validation of Research Hypotheses
This section provides an in-depth validation of the two core research hypotheses guiding our study, leveraging our experimental results and positioning them within the broader cybersecurity and AI research landscape. Moreover, we emphasize the novelty and practical significance of our contributions compared to existing literature.
Hypothesis 1: LLMs provide superior detection capabilities compared to traditional models.
Our empirical results strongly support the hypothesis that transformer-based LLMs outperform traditional ML models in cybersecurity log classification. Specifically, the
qwen2.5:7b model achieved an F1-score of 0.9278 on the vulnerability class, substantially higher than the best traditional model XGBoost’s 0.555 (
Table 23). This gap is consistent across multiple metrics including precision, recall, and AUC-ROC, demonstrating that LLMs not only detect more true vulnerabilities but also reduce false alarms.
These findings align with recent benchmarking efforts, such as the SECURE framework [
30] and CyberBench [
31], which evaluate the capabilities of leading LLMs like GPT-4 and Gemini-Pro in various cybersecurity tasks. However, our work advances beyond these studies by focusing on real-world log data classification with a rigorous prompt engineering strategy that ensures structured, interpretable outputs. To further enhance the utility for operational deployment, and complementing broader benchmarking efforts, we provide a comprehensive evaluation that includes not only standard performance metrics but also confidence measures, alternative interpretations, and detailed error breakdowns, which are critical in this domain.
Moreover, our analysis of multiple LLM architectures at varying scales reveals nuanced trade-offs between detection performance and inference speed. For example, while larger models such as
qwen2.5:32b offer high recall, they suffer from increased false positives and longer inference times, confirming observations from the famous ’Chincilla’ paper [
55], but with more granular quantification. This insight is novel in guiding practitioners toward selecting models that best fit their operational constraints, a gap rarely addressed in existing literature.
Finally, our integration of advanced parsing techniques to reliably extract classification and explanation from free-text LLM outputs enables automated large-scale evaluation, overcoming a common limitation noted in the HELM system [
56]. This methodological contribution enhances the reproducibility and scalability of LLM benchmarking in cybersecurity.
Hypothesis 2: Integration of LLMs into batch evaluation pipelines facilitates scalable and reproducible benchmarking.
Our development and deployment of a batch evaluation pipeline represent a significant step forward in addressing key challenges within AI-driven cybersecurity research. Our pipeline directly contributes to this need by establishing a scalable and reproducible framework. While valuable benchmarks like SECURE [
30] and CyberBench [
31] have emerged, our approach specifically addresses the operational challenges of integrating local LLM inference engines and implementing robust, structured output parsing for detailed metric computation.
Our pipeline orchestrates the entire evaluation process—from prompt generation through inference, advanced response parsing, to real-time and final metric computation—within a unified, open-source environment compatible with Ollama and similar platforms. This local execution model preserves data privacy and enables rapid iteration on prompt strategies and model variants, addressing practical deployment concerns highlighted in [
57].
Furthermore, the pipeline’s ability to produce intermediate performance metrics and confusion matrices during runtime facilitates early detection of model weaknesses and supports continuous benchmarking, a feature not commonly found in existing tools. By releasing this pipeline alongside our datasets and evaluation scripts, we provide the community with a robust foundation for transparent and reproducible LLM cybersecurity research.
Our work distinguishes itself through the integration of several key innovations. First, we employ domain-specific prompt engineering that is carefully tailored to elicit structured and explainable outputs from LLMs, significantly enhancing interpretability and facilitating downstream evaluation. In addition, we have developed a robust parsing framework that incorporates fallback heuristics and label-based extraction methods to effectively handle the diverse and often variable responses generated by different LLM architectures. This enables automated, large-scale benchmarking with high reliability. Furthermore, our approach includes a comprehensive multi-model evaluation, systematically comparing multiple LLMs across various scales and architectures, while providing detailed analyses of trade-offs between accuracy, latency, and different error types. We also emphasize operational relevance by incorporating metrics such as false positive and false negative rates, confidence intervals, and real-time monitoring capabilities, ensuring that our evaluation aligns closely with practical cybersecurity requirements. Finally, our pipeline supports local inference with privacy guarantees, offering an open-source, privacy-preserving environment that facilitates reproducible research without dependence on proprietary cloud APIs.
These contributions address critical gaps identified in recent surveys [
57], benchmarking efforts [
31], and systematic comparisons [
56], pushing the frontier toward deployable, trustworthy LLM-based cybersecurity solutions.
Thus, our results empirically validate that LLMs provide superior detection capabilities over traditional ML models for cybersecurity log classification, supported by rigorous statistical analysis and operational metrics. Simultaneously, our integrated batch evaluation pipeline establishes a scalable and reproducible benchmarking framework that enhances transparency and accelerates research progress. Together, these advances contribute meaningful theoretical and practical innovations to the cybersecurity AI domain.
4.9. Model Monitoring and Long-Term Maintenance Strategies
Ensuring the sustained effectiveness and reliability of LLM-based cybersecurity systems requires robust model monitoring and proactive long-term maintenance strategies. Our results highlight the necessity of continuous oversight, as even high-performing models like qwen2.5:7b can exhibit error rate drift and systematic misclassifications over time.
As illustrated in
Figure 19, both false negative and false positive rates show gradual upward trends over a 12-month period, with the false negative rate rising from 1.0% to 3.5% and the false positive rate increasing from 0.5% to 1.1%. This drift may be attributed to evolving attack patterns, changes in system behavior, or shifts in data distributions not captured during initial training. Regular monitoring of these temporal error trends is essential for early detection of model degradation and for triggering retraining or adaptation processes.
The confusion matrix in
Figure 18 reveals that most errors are concentrated in specific contexts: 17 false negatives and 11 false positives out of 1317 cases, with the majority of false negatives associated with complex or ambiguous log entries. By systematically categorizing errors—distinguishing between systematic and sporadic misclassifications—and analyzing them across subgroups such as log source and event type, we can identify areas that require targeted data augmentation, prompt refinement, or specialized model adaptation.
To counteract model drift and maintain high detection performance, we recommend scheduled retraining cycles using recent log data, especially incorporating samples from error-prone subgroups. Data augmentation techniques, such as synthetic log generation for underrepresented event types, can further enhance model robustness. Automated retraining triggers based on error rate thresholds or significant changes in confusion matrix patterns should be integrated into the operational pipeline.
As operational environments evolve, recalibrating classification thresholds and alerting policies becomes crucial. Adaptive thresholding, informed by real-time error monitoring, can help balance the trade-off between false positives and false negatives, aligning detection sensitivity with current risk levels and organizational priorities.
Maintaining a feedback loop with human analysts is vital for long-term system reliability. By collecting analyst feedback on ambiguous or misclassified cases—especially those flagged by high entropy or low confidence—models can be iteratively improved. Incorporating explainable outputs and rationale extraction, as established in our framework, facilitates this human-in-the-loop approach and supports regulatory compliance.
Thus, effective model monitoring and long-term maintenance for LLM-based cybersecurity systems require a combination of continuous error tracking, granular root cause analysis, scheduled retraining, adaptive calibration, and analyst feedback integration. These strategies ensure that detection performance remains robust in the face of evolving threats and operational changes, supporting sustainable, trustworthy deployment in real-world environments.
6. Conclusions and Future Developments
This research set out to investigate the practical application and effectiveness of locally executable Large Language Models (LLMs) for enhancing cybersecurity log analysis, particularly with a view to the operational realities and resource constraints faced by Small and Medium-sized Enterprises (SMEs). Our work systematically evaluated the capability of these models to outperform traditional machine learning approaches and to support scalable, automated evaluation through a dedicated pipeline. The findings confirm that LLMs, when appropriately prompted and integrated with advanced parsing techniques, offer significant improvements in both detection performance and the provision of interpretable insights.
In terms of detection accuracy, models such as qwen2.5:7b consistently achieve superior results, with F1-scores exceeding 0.92 on vulnerability classification tasks, substantially higher than classical models like XGBoost and LightGBM, which typically reach F1-scores around 0.55. This confirms the first research hypothesis that LLMs effectively capture complex contextual and semantic patterns in unstructured log data that traditional feature-based methods struggle to model. The ability to achieve such performance on commodity hardware underscores the feasibility of deploying advanced AI for cybersecurity within SMEs.
Beyond raw performance, our analyses reveal that LLM outputs include structured, domain-relevant explanations that align with key features identified by classical interpretability methods such as SHAP and LIME. Features like
event_type and temporal indicators (
is_weekend,
is_night) emerge as dominant drivers in both LLM rationales and classical feature importance analyses, confirming that LLMs internalize cybersecurity domain knowledge rather than functioning as opaque black boxes. This interpretability is further enhanced by our robust parsing framework, which reliably extracts classification and explanation from free-text LLM outputs, enabling automated large-scale evaluation. Furthermore, as demonstrated in our case study (
Section 5), the enhanced precision of models like
qwen2.5:7b in reducing false positives translates into significant potential financial advantages, primarily through reduced investigation costs and minimized analyst fatigue, a crucial consideration for resource-constrained SMEs.
Our uncertainty quantification methods demonstrate that LLMs effectively flag ambiguous or borderline cases through elevated explanation entropy, covering approximately 12% of evaluated samples. This capability supports targeted human analyst review and reduces false positive and false negative rates, addressing operational challenges in dynamic threat environments.
Robustness evaluations show that LLMs maintain stable performance under evolving attack scenarios and adversarial prompt injections, including sophisticated Jailbreaking-to-Jailbreak attacks. When augmented with retrieval-augmented generation (RAG) techniques, LLMs adapt efficiently to new threat intelligence without full retraining, ensuring resilience in rapidly changing cybersecurity landscapes. The pipeline’s support for local, privacy-preserving inference further strengthens trustworthiness and compliance with data protection requirements.
While these results validate our second research hypothesis regarding scalable, reproducible benchmarking, challenges remain. The intrinsic complexity of LLMs limits direct feature attribution, and explanation fidelity requires continuous validation. Discrepancies in feature importance for complex attributes such as parent_process_id highlight the need for hybrid interpretability approaches that combine LLM-generated explanations with classical model insights and human-in-the-loop feedback.
Looking forward, the cybersecurity domain will be transformed by emerging technologies such as quantum computing, multi-agent autonomous AI systems, and distributed edge computing. LLMs, enhanced through ongoing advances in explainability, robustness, and interactive learning, will be central to these developments. Future research should explore integration with quantum-safe cryptographic protocols, refinement of standardized explainability metrics tailored to cybersecurity, and development of defenses against advanced adversarial attacks to ensure resilient, transparent, and trustworthy deployments.
Thus, our study confirms that LLMs are not only powerful and adaptable detection engines but also increasingly interpretable and robust tools. Their deployment promises to revolutionize cybersecurity operations by enabling more accurate threat detection, reducing analyst workload, democratizing access to advanced cybersecurity capabilities, particularly for SMEs, and supporting proactive defense strategies in an evolving digital ecosystem.
