Abstract
In today’s era of technology, where information is readily available anytime and from anywhere, safeguarding our privacy and sensitive data is more important than ever. The thermal sensors embedded within a CPU are primarily utilized for monitoring and regulating the processor’s temperature during operation. However, they can serve as valuable components in increasing the security of a system as well, by enabling the detection of anomalies through temperature monitoring. This study presents three distinct methods demonstrating that anomalies in CPU heat dissipation can be effectively detected using the thermal sensors of a CPU, even under conditions of significant environmental use. First, it evaluates the Hot-n-Cold anomaly detection technique across various noisy environments, demonstrating that the presence of additional lines of code inserted into a Linux command can be identified through thermal analysis. Second, it detects the CryptoTrooper ransomware attack by fingerprinting the associated cryptographic processes in terms of temperature. Finally, it detects unauthorized system login attempts by capturing and analyzing their distinctive thermal signatures. This study demonstrates that various detection mechanisms can be implemented using thermal sensors to enhance system security. It also motivates the need for further research in this relatively underexplored area with the goal of developing more effective methods of protecting data.
1. Introduction
In an increasingly interconnected digital landscape, where information is ubiquitously accessible, ensuring the security and privacy of sensitive data has become a critical concern. Data security safeguards people, maintains organization stability, and ensures the reliability and integrity of the systems that we depend on daily. That is, data security serves to protect personal, financial, and confidential information from unauthorized access, prevents financial losses resulting from theft, upholds the trust and reputation of organizations, and ensures the continuity of business operations.
Traditional security mechanisms focus more on software-level defenses, such as intrusion detection and firewalls. Although these approaches are overall effective, they are unable to detect stealthy attacks and neglect potential insights provided by the physical properties of the computing environment itself, an area that remains significantly underexplored.
A promising yet underutilized path lies in the use of on-chip thermal sensors, which are a standard component of modern CPUs. Although originally designed to monitor and manage processor temperature to prevent overheating, these sensors capture thermal variations induced by system-level activity, which is an opportunity to explore temperature-based anomaly detection as an additional layer of defense.
Workloads in the CPU can be fingerprinted by using thermal sensors and registering the thermal signatures of specific programs. If an attacker runs malicious code, it will usually result in different patterns, such as heavy computations or activity bursts. By continuously monitoring the temperature, deviations from expected profiles can be flagged as potential attacks. Anomaly detection can also be performed using ML (machine learning), by training a module to learn normal behavior and recognize variations that do not correspond to legitimate activity.
This work addresses the limitations of conventional security mechanisms and introduces a novel approach that leverages Intel’s Digital Thermal Sensors (DTSs) to detect anomalies at the physical layer. We demonstrate that thermal signatures can be effectively exploited for security purposes, even in the presence of environmental noise.
The proposed methods offer several important insights into the application of CPU temperature monitoring to system security. First, we demonstrate that thermal data, traditionally used solely for hardware protection and performance optimization, can serve as a reliable side channel for anomaly detection. Using thermal signatures, it is possible to identify subtle changes in CPU activity that correspond to malicious behavior, even under challenging environmental conditions.
A significant contribution of this study is the evaluation of the Hot-n-Cold [1] anomaly detection technique in noisy real-world server environments with varying system loads. It works by comparing thermal traces of a clean Linux command and the same command with extra code injected. Although execution timing patterns remain similar, the augmented version consistently runs hotter, signaling the presence of the injected code. It is a lightweight anomaly detection method, but it was demonstrated only in controlled, quiet environments. Our findings validate the ability of the technique to detect anomalies even in noisy environments. Its robustness under diverse operational conditions underlines the practical viability of thermal-based anomaly detection in deployed systems. Although still in its early stages, the technique offers a foundation that can be extended and adapted for deployment in practical and industrial contexts. It must be extended to support continuous monitoring of arbitrary processes and incorporate adaptive learning mechanisms. Integrating thermal data with other low-level system metrics can further enhance detection accuracy and robustness, paving the way for deployment in industrial, embedded, and security-sensitive contexts.
Furthermore, the research improves understanding of thermal side channels by establishing a methodology to capture and analyze thermal footprints associated with specific system events, such as cryptographic process execution and unauthorized system logins. We detect and create the thermal footprint of cryptographic processes in the CryptoTrooper [2] ransomware attack and thermal footprints for system logins and detect unauthorized login attempts as well.
These contributions collectively highlight the potential of CPU thermal sensors as a low-overhead hardware-assisted layer of defense that augments conventional cybersecurity approaches.
Through these insights, this study not only confirms the feasibility of thermal anomaly detection but also motivates further exploration into exploiting thermal sensor data for more sophisticated security mechanisms.
The core contributions of this work are as follows:
- We evaluate the Hot-n-Cold [1] anomaly detection technique, showing its robustness in identifying code injections via thermal traces;
- We detect cryptographic ransomware activity, such as CryptoTrooper [2], by fingerprinting its thermal profile;
- We identify authorized and unauthorized system login attempts based on their unique thermal footprints.
Organization
2. Related Work
Recent research has extensively explored the thermal characteristics of multicore systems to develop covert channels and side-channel attacks. The study in [3] introduces an ON-OFF scheme that takes advantage of heat propagation monitored through Intel thermal sensors, achieving a covered channel throughput of 12.5 bps. This was improved in [4] by encoding transmissions to stabilize temperature fluctuations, resulting in a throughput of more than 5 bps with a lower error than 1%. Further enhancements in [5] reduced error rates by 30% and increased throughput by 50%, addressed thermal interference, and allowed multiple transmitters.
ThermalAttackNet [6] applies convolutional neural networks to thermal side channel attacks on mobile MPSoCs, achieving a precision of 100% in password prediction using graphical thermal trace representations. ThermalBleed [7] demonstrates software-based thermal attacks that reveal TLB translations and bypass KASLR by thermal analysis of kernel prefetches. TooHotToHandle [8] correlates power and thermal traces to extract browser history, distinguishing between normal and Tor browsing despite power side-channel defenses.
ThermalScope [9] uses event interrupts tied to CPU processes to create covert channels with low error rates, fingerprint DNN architectures, and break KASLR in less than 9 h. These studies collectively highlight the viability of thermal side-channel attacks and the integration of machine learning to improve attack capabilities.
Various methods have been proposed to defend against thermal side-channel and covert-channel attacks. Dynamic shielding techniques [10] reduce vulnerability by detecting abnormal CPU activity and injecting noise. DVFS-based approaches [11,12] detect most attacks by lowering the frequencies of suspicious cores, significantly increasing bit error rates (BERs) with minimal performance loss. Task migration [13] moves the attacker and victim processes to distant cores, increasing packet error rates while improving efficiency. Noise injection methods [14,15] disrupt thermal patterns to increase BER and block transmissions.
Machine learning techniques, such as neural networks [16], achieve up to 99% accuracy in distinguishing attack signals from noise with low overhead. Dotecca [17] uses time-domain sensor data for precise detection of 99% while reducing overhead. Hot-n-Cold [1] and its extension Beat the Heat [18] detect anomalies in CPU temperature patterns and real-world noise scenarios, achieving up to 96% correlation and 88% detection accuracy. Collectively, these countermeasures offer effective protection against thermal attacks with balanced trade-offs.
To the best of our knowledge, no existing work has addressed this specific problem using thermal sensors to detect patterns in specific CPU processes and to compare Linux commands’ thermal behavior.
Some possible countermeasures an attacker might adopt to evade detection include dynamic frequency scaling (DFS), which is the main idea in [11,12,13]. Rather than using these methods to detect malicious activity, an attacker could exploit dynamic frequency scaling to distort thermal patterns and make injected commands less distinguishable. However, manipulating core frequencies in this way can introduce abnormal behavior at the hardware level, which can itself be detectable as an anomaly. Another countermeasure would be evading detection by slowing down code execution using delays, inserting NOP instructions, or spreading malicious actions over time, as in [19]. These tactics exploit the nature of dynamic analysis tools as behavior-based detectors, which may miss threats that execute slowly or appear benign.
3. Materials and Methods
3.1. Environment and Methodology
3.1.1. Experimental Setup
The experiments were carried out on three systems located in a temperature-controlled room at 20 degrees Celsius. The three desktops will be further called D-150, D-152, and D-153. They contain different architectures of Intel CPUs: D-150 has an i7-10700F processor [20], Comet Lake-S architecture on 14nm, and 8 physical cores; D-152 has an i7-13700 processor [21], Raptor Lake-S architecture on 10nm, and 16 physical cores (8 performance cores and 8 efficient cores); D-153 has an i9-11900K processor [22], Rocket Lake-S architecture on 14nm, and 8 physical cores. All of them operate with Ubuntu 24.04.1 LTS.
Usually, in the experiments, we avoided using notebooks because of their packed hardware and many ways of optimization to stay cool and save power. Notebooks exhibit variable frequency and power consumption depending on workload and operating conditions, leading to corresponding fluctuations in the amount of heat dissipated. Furthermore, power consumption strategies differ between power states, such as when running on a battery, charging, plugged in, or fully charged, with each state implementing different power optimization mechanisms to balance performance and energy efficiency. The above leads to unreliable test reproducibility.
In addition, we avoided AMD processors as their temperature cannot be read from each core; only a general temperature of the CPU can be established. Having only a single temperature sensor on the die limits the ability to detect localized thermal variations, meaning only significant or extreme temperature differences across the die are observable.
Our technique is well-suited for server and desktop processors, which typically operate at fixed or stable frequencies and under continuous workloads, providing a more consistent thermal and power profile for analysis.
3.1.2. Thermal Sensors
The coretemp kernel module [23] is a Linux driver that allows access to Digital Thermal Sensors (DTSs) embedded in all modern Intel processors(Intel Corporation, Santa Clara, CA, USA). These sensors are integrated into each CPU core and the processor package itself, allowing for precise monitoring of thermal conditions at both the core and package levels. [24]
When loaded, the coretemp driver reads the temperature data from the DTS units and exposes it through the hwmon interface [25] under the /sys/class/hwmon/hwmon[*]/ directory. Each sensor reading is available as a file, with values provided in millidegrees Celsius. The driver provides a temperature resolution of 1 °C.
The thermal data are updated every 2 ms, ensuring near-real-time responsiveness for temperature monitoring tools.
3.1.3. Baseline Temperature
For each system, the baseline temperature of each core was measured; see Figure 1. This baseline was determined by continuously recording the temperature of all CPU cores over a 24-h period. Measurements were taken in 5-min intervals, with readings sampled every 20 ms, followed by a 15-min pause between intervals. This step is critical to identifying the idle temperature profile of each core under controlled conditions.
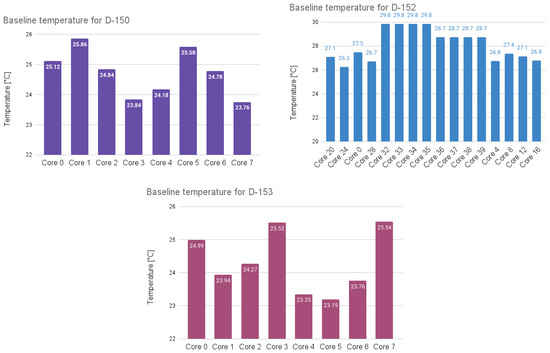
Figure 1.
Baseline temperatures of the systems.
In parallel, we conducted a comprehensive monitoring of all active daemons and background processes during a separate 24-h idle period. This analysis was performed to ensure system stability and to confirm that no background activity would interfere with or bias the thermal measurements collected during the main experimental phase.
3.1.4. The Scripts
The experiments were run using mainly two Shell scripts, one script to collect the temperatures of all cores (called forward readTemperature) and the other to execute the experiment (called forward runCommand). The two scripts were taskset to far-away physical cores to avoid heat dissipation.
3.1.5. Core Selection
For each system, we used the stress application Stress-ng [26] to determine the physical layout of the cores. For each core, the stress application was taskset on every core at a time, with a CPU usage of 90%, while the temperature was recorded. In the created chart, it can be seen which core influences the temperature of which core during the stress experiment. That is, when stress was applied on Core 0 (dark blue), it can be seen in the first part of Figure 2 that the temperature increased to approximately 43 °Celsius. In the same area, the core that has a greater temperature than normal is Core 3 (yellow); Core 7 is not taken into consideration since it is the one on which the readTemperature script was run. This leads to the conclusion that Core 0 (dark blue) is physically located near Core 3 (yellow), and heat dissipates between them. Using this logic, we extracted data from charts like this and created mathematical permutation problems to determine the real physical arrangement of the cores on the die. The possibilities in Figure 3 resulted from knowing that for D-153, the 8 cores are placed 4 cores in two rows [27]. Taking into consideration the lowest temperatures in the baseline charts, together with the layout solutions, we decided to run the readTemperature script on Core 0 and runCommand on Core 5. Similar experiments were performed for the other two systems.
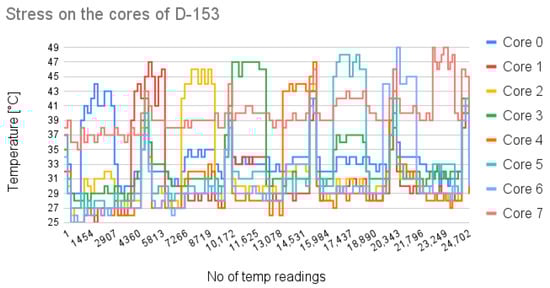
Figure 2.
Stress on each core of D-153.
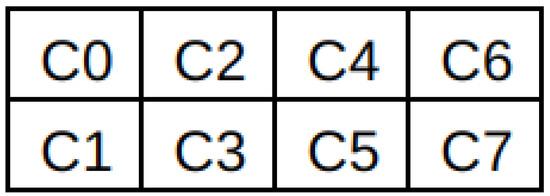
Figure 3.
Core layout for D-153.
3.1.6. The Noise
To simulate various real-world operational conditions, the experimental environment was subjected to various forms of server-like noise intended to emulate typical background activity and load found in multi-user systems.
The Apache [28] server was used to host a simple web page, png, jpg, and bmp images of 1 KB, 480 KB, and 1 MB in size.
The noise was created through the execution of automated client-side scripts developed in both Shell and Python. The Python-based scripts utilize the requests library to initiate repeated requests, either to retrieve static image files or to load web pages from the designated server. Specifically, the script responsible for web page access initiates HTTP requests at intervals of 2 ms, while the image retrieval script issues requests at a frequency of one request per second. Each script was run by one client at a time.
To increase the system load and introduce greater thermal and computational noise, a combination of these scripts was used concurrently. That is, five client instances simultaneously accessed the web page and downloaded images. When we refer to the five clients’ noise, this means simultaneously requesting the web page and downloading a 1 KB image, two 480 KB images, and two 1 MB images.
For more intensive experimental conditions, the above setup was scaled up to include thirty concurrent client processes, thereby simulating a significantly more demanding environment. That is, the five-client noise was started six times simultaneously.
3.2. Evaluation of Hot-n-Cold
3.2.1. Hot-n-Cold
Hot-n-Cold [1] is an anomaly detection technique that evaluates the correlation between an original Linux command and its augmented counterpart. The experimental evaluation was conducted using the ls and chmod Linux commands. The augmentation was performed by adding the ioctl system call, widely used in different attacks documented in the Common Vulnerabilities and Exposures (CVEs) dataset [29]. These commands were selected primarily because of their frequent usage in Linux environments, including desktop and server distributions. Their frequent invocation by users and system processes makes them ideal candidates for studying behavior-based anomaly detection. Additionally, these commands utilize file descriptors in their native implementations, allowing us to make minimal code modifications during augmentation, avoiding changes in the original functionality of the command.
For the unaltered commands, native Linux commands were utilized. In contrast, the augmented versions were constructed using the original source code retrieved from the official GitHub repository [30]. The ioctl invocation was strategically integrated into the original codebase close to the use of the existing file descriptor. This approach is the same as in [18] and aims to minimize the frequency of ioctl calls to reduce the footprint of the code and the execution overhead.
The resulting augmentation incurred minimal code expansion: the ls command exhibited an increase of approximately 0.10% in terms of lines of code (LOC), while the chmod command showed an increase of 2% LOC. This minimal augmentation ensured the integrity of command behavior while enabling the study of subtle thermal side-channel variations introduced by the injected system call.
The experimental scripts were developed with a focus on minimizing additional system calls or commands in order to preserve the integrity of the thermal and behavioral measurements associated with the target binaries. To prevent the introduction of additional system calls associated with loop constructs (e.g., for or while), each command was manually duplicated 600 times within the script. This approach ensures that the only system calls executed are those inherent to the command under investigation and the sleep function. Each script was executed 50 times, resulting in 50 temperature traces.
Pearson’s correlation was calculated to assess the similarity between the temperature profiles of the original and augmented commands. The results indicated correlation values as high as 0.80, with augmented commands consistently exhibiting elevated temperature levels. These findings support the conclusion that thermal signatures can serve as effective indicators for detecting anomalies introduced through command augmentation.
The differences in the implementation and testing phases of the Hot-n-Cold technique can be seen in Table 1.

Table 1.
Comparison between previous implementations.
3.2.2. Evaluation
For the evaluation, we considered that the level of noise introduced in the initial study was insufficient to rigorously assess the robustness and reliability of the proposed technique under more realistic operating conditions. To address this limitation, we introduced additional server-like noise, simulating typical web server workloads. Specifically, noise was generated through server activities such as responding to client requests, such as repeatedly requesting a web page, requests to download images of varying sizes, and executing combinations of these tasks using 5 or 30 concurrent clients.
This type of activity leads to a dynamic and non-uniform computational load on the CPU, thereby altering its thermal behavior through fluctuating core utilization, increased cache activity, and more frequent context switches. By incorporating such noise, our goal was to evaluate whether the proposed anomaly detection method remains distinguishable and detectable while the background thermal fluctuations.
3.3. Fingerprinting CryptoTrooper
CryptoTrooper [2] is an open-source ransomware attack for Linux, developed for educational and research purposes, particularly for reverse engineering and cryptographic analysis. It uses a white-box implementation of the AES-128-CBC algorithm to encrypt user and system files, including data stored in common locations such as /root, /home, and other directories associated with Apache, MySQL, etc. Each file is encrypted with a randomly generated AES key and initialization vector, which are themselves encrypted using the white-box cipher, producing the auxiliary files necessary for decryption.
In this paper, we downloaded the CryptoTrooper Git project [2] and executed the encryption process on the following locations /usr/share, /var/lib, /var/www, /root, /home/media, on all three systems. As encryption algorithms, we used AES-128, AES-256, and ChaCha20, from the OpenSSL library [31]. For each system, we have collected 25 traces of encryption for each algorithm. The experiments were carried out on one core of each processor, first, without noise, and then with noise from 30 clients (described in the subsection The Noise).
Furthermore, the level of background noise was tripled for the AES-128 encryption algorithm to evaluate whether the increase in interference would affect the thermal footprint associated with the cryptographic operation.
3.4. Fingerprinting Authentication Processes
The SSH [32] (Secure Shell) login process is a cryptographically secure protocol designed for remote authentication and command execution over untrusted networks. Upon initiation, the client establishes a connection with the SSH server, which then presents its host key for verification to ensure server authenticity and mitigate attacks. Following successful host verification, a secure key exchange is conducted using algorithms such as Diffie–Hellman or ECDH to derive a shared session key, which is subsequently used to encrypt all communication. The user is then authenticated. Once authenticated, a secure session is established, allowing interactive shell access, command execution, and additional services such as file transfer and port forwarding. [33]
The logins were created using Shell scripts. For each system, 30 users were created, named user1, user2, …, user30, and 30 different 10-character passwords were generated using random.org [34]. The experiments were carried out using various login methods. First, a login was performed for each of the 30 users, with 5 s between them. This process involved launching a new terminal instance for each attempt and logging onto the server through ssh using the sshpass utility, as seen in the next line.
- gnome-terminal -- bash -c ‘‘sshpass -p ’$password’ ssh -o
- StrictHostKeyChecking=no ${username}@${server_ip}; exec bash’’
Second, 30 login attempts were executed for the same user account, with a 5-s pause between attempts. Unlike in the previous case, these logins were performed without initiating a new terminal instance for each connection.
- sshpass -p ‘‘$PASSWORD’’ ssh -o StrictHostKeyChecking=no ‘‘$USER@$HOST’’
Finally, user switching was performed across the 30 user accounts using the su command to transition between them.
- spawn su - $username -c ‘‘whoami’’
In addition to standard authentication, the correctness of user passwords was alternated to simulate failed login attempts. Furthermore, server-like background activity was introduced to assess whether such noise would influence the thermal footprint generated during the login process.
The following scenarios were taken into account:
- With noise: one and two clients downloading the 1 KB image;
- With noise: from 5 clients (request the web page, download a 1 KB image, two 480 KB images, and two 1 MB images);
- With noise: from 30 clients (-client noise);
- Alternate passwords no noise: one correct and one wrong;
- Alternate passwords no noise: two correct and two wrong.
4. Results
In this study, our objective was to evaluate the Hot-n-Cold [1] technique in a noisy environment, to observe the thermal footprints of the encryption processes and the authentication processes of the system.
4.1. Hot-n-Cold Evaluation
First, the original method was reproduced on our three systems. The results can be seen in Figure 4, Figure 5 and Figure 6, where blue is the original command and pink the augmented one. It can be seen that the original command has a lower temperature than the augmented one, meaning that the addition in the code consumes more power, dissipating more heat. The Pearson correlation index, over 0.9, shows that the original and the augmented commands have very similar patterns.
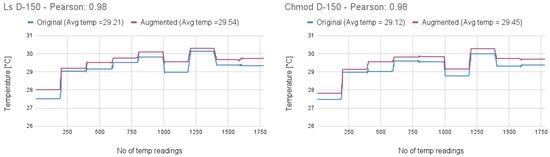
Figure 4.
ls and chmod on D-150.
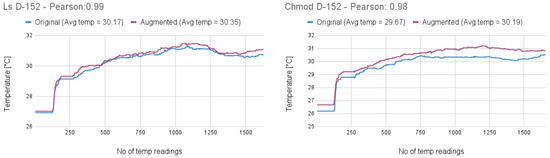
Figure 5.
ls and chmod on D-152.
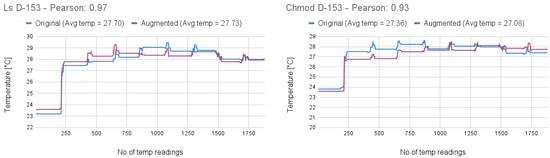
Figure 6.
ls and chmod on D-153.
Next, server-like noise was introduced. Figure 7 shows the results for when 1 KB of data was requested from the server every second. From the graphs, it can be seen that the correlation index is more than 0.9, and the augmented command dissipates more heat. This means that the theory of detecting additional code in a command stands still.
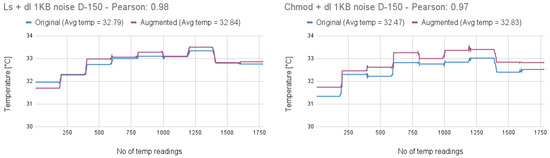
Figure 7.
ls and chmod with download 1 KB of data noise on D-150.
The size of the requested data was then increased to 480 KB. As seen in Figure 8, the correlation index is over 0.9, and the augmented command dissipates more heat.
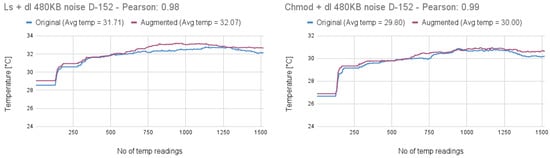
Figure 8.
ls and chmod with download 480 KB of data noise on D-152.
The noise was again increased to downloads of 1 MB data each second. The results are in Figure 9, where again the augmented command dissipates more heat and the Pearson correlation is more than 0.9.
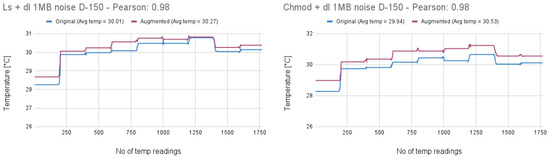
Figure 9.
ls and chmod with download 1 MB of data noise on D-150.
For the five-client type of noise, results can be seen in Figure 10, where again the rules above are respected, and the original command can be distinguished from the augmented one.
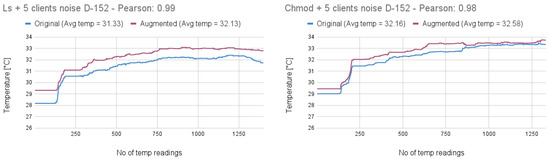
Figure 10.
ls and chmod with download 5-client noise on D-152.
Although the results for D-153 are noisier than those for the others, as seen in Figure 11, the Pearson correlation index remains above 0.9.
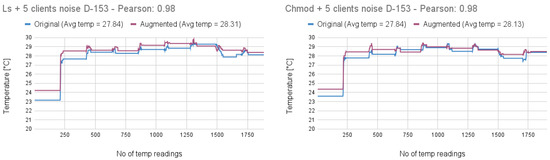
Figure 11.
ls and chmod with download 5-client noise on D-153.
4.2. Fingerprinting CryptoTrooper
To investigate the thermal behavior of cryptographic operations, we executed three commonly used encryption algorithms and monitored their thermal activity throughout execution.
The thermal data collected allowed us to construct thermal footprints for encryption algorithms. These footprints reflect the variation in temperature over time during the encryption process and highlight the unique thermal characteristics of cryptographic algorithms.
For each system, we run the cryptographic algorithm without noise, with five-client noise and thirty-client noise, as described in the section The Noise. Figure 12 shows the thermal footprint of AES128 on the three systems, where blue is the execution without noise, purple is the execution with 5-client noise, and pink is the execution with 30-client noise.
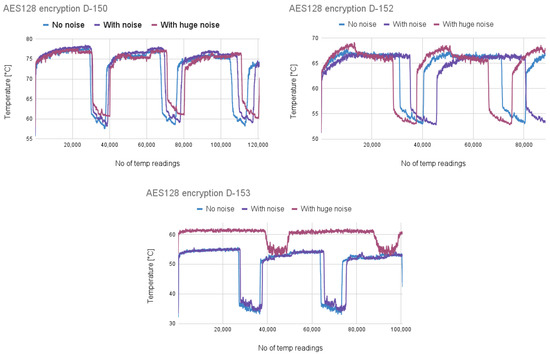
Figure 12.
AES128 on the three systems.
The results for the other two algorithms, namely AES256 and ChaCha20, can be seen in Appendix A.
4.3. Fingerprinting Authentication Processes
To investigate the thermal behavior of the authentication processes, we executed three types of authentication and monitored their thermal activity throughout execution.
The thermal data collected allowed us to construct thermal footprints of login processes, but not necessarily for the switch-user ones. In Figure 13, the three processes can be seen. For the two login processes (in pink, the logins of 30 users, and in blue, the logins of one user), each login attempt is perfectly seen on the chart as a spike in the temperature. The switch user process can also be seen (in purple); however, they are not as clear as the login ones. Similar results can be seen for D-152. However, we cannot tell the same for system D-153; reasons will be discussed in Section 5.
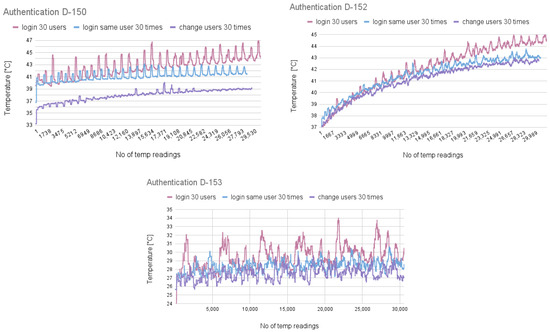
Figure 13.
Authentication on the three systems.
For the login of 30 users with a terminal, we have repeated the experiments using three types of noise. The results can be seen in Figure 14, where each login is seen as a spike in the temperature, from which one can tell that the authentication process can be footprinted even in noisy environments.
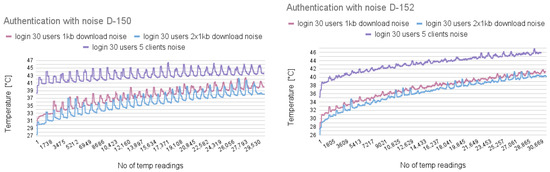
Figure 14.
Authentication with noise on D-150.
For the second type of commands (log-in the same user without terminal), we created an experiment that alternates passwords. First, a correct password comes after an incorrect password, with pink in Figure 15, and second, two correct passwords come after two incorrect passwords with blue. It can be seen in the figures that there is a spike in temperature in case of an authentication with a correct password and a flat line in case the password was wrong.
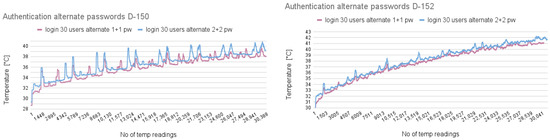
Figure 15.
Authentication alternate passwords on D-150.
For the first type of commands (logins of 30 users with a terminal), the alternate password experiment can be seen in Appendix A.
5. Discussion
5.1. Limitations of the Proposed Approach
A CPU temperature sensor with a low resolution of 1 °C limits the precision of thermal monitoring, making it difficult to distinguish the temperature of individual commands; from here comes the methodology of running multiple commands. However, this is not the case for login commands, which can be individually identified. Therefore, we had to create multiple traces of the experiments and use the average of those measurements to increase the accuracy of the temperature readings. However, we did not need tens of thousands of traces as in other studies such as [7]. Moreover, the technique is in the early stages of development, and it needs to be automated in order to be applied in real-life scenarios.
5.2. Differences in Cooling Systems
The D-150 and D-152 desktop models use air-based (fan) cooling systems, in contrast to D-153, which uses a liquid-based cooling method. The main differences between the two cooling models can be seen in Table 2.
Table 2.
Differences between the two cooling systems.
From the table above, the combination of the fan cooling system with i7 processors leads to more precise thermal signatures in the traces, while the i9 processors are more powerful and need a more reliable cooling system. Therefore, the cooling based on liquid brings more noise in the thermal traces, and the heat is diffused, making sharp curves in temperature disappear. However, we believe that if the number of traces used in the experiments is increased, the thermal footprints can be extracted from the i9 as well.
5.3. Hot-n-Cold Evaluation
Looking at the above results, we can conclude that the Hot-n-Cold technique works in noisy environments and on several types of processors as well.
Furthermore, we have used two options for the ls command, namely -l and -R, to check if the hypothesis of the technique remains true in more cases. As can be seen in Figure 16, the augmented commands dissipate more heat, and their patterns remain similar, as the Pearson correlation index shows.
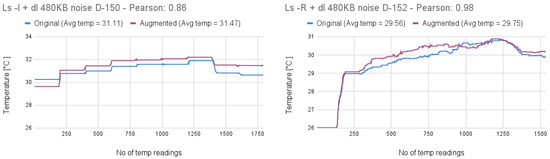
Figure 16.
ls with options.
To further expand the experiments, we have run the Hot-n-Cold technique also on a Notebook with an Intel Core i7-13700H and on a desktop with AMD Ryzen 7 5700G. Usually, in the experiments, we avoided using notebooks because of their noisy and unstable results. Nevertheless, we did some short experiments, as seen in Figure 17, where the Pearson correlation index is above 0.66 and the augmented command dissipates more heat. We also observed large differences in temperature in cases where the laptop was on battery, charging, or fully charged, leading to inconclusive results.
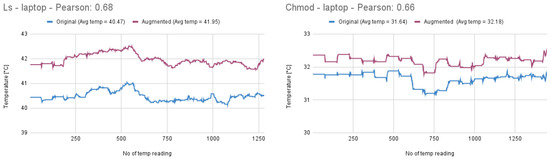
Figure 17.
Results for ls and chmod on the Laptop.
If we discuss AMD, these processors cannot be read the temperature from each core; only a general temperature of the CPU can be read. This is how we conducted the experiments. As seen in Figure 18, the results are very noisy, and fine-grained thermal traces cannot be extracted, leading again to inconclusive results.
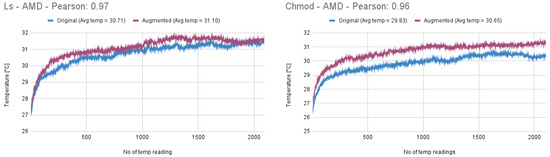
Figure 18.
Results for ls and chmod on the AMD desktop.
Moreover, we saw that on D-153, there are some visible spikes in the temperature, as seen in Figure 11. To identify their origin, we performed a small experiment in which we read the power and frequency, together with the temperature, while the ls command scripts were running. The results can be seen in Figure 19, where pink is the frequency, blue is the temperature, and purple is the power. It can be seen that, during the execution, all of them remain stable, with no noticeable increase or decrease. This leads to the conclusion that the spikes are created by using multiple traces for the final result.
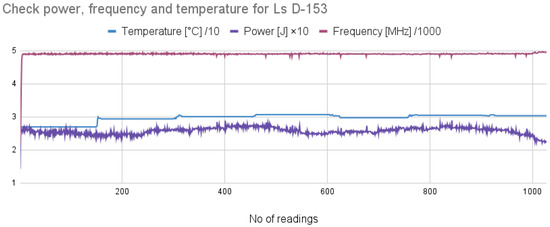
Figure 19.
Power, frequency, and temperature on D-153.
In addition, to measure the technique in more quantitative detection metrics, we have calculated the detection rate (True Positive Rate—TPR) using Formula (1), and the miss rate (False Negative Rate—FNR) using Formula (2), where we took True Positives (TPs) as the number of runs where injection was detected and False Negatives (FNs) as the number of runs where injection was missed. The results can be found in Figure 20, with a detection rate of 83%.
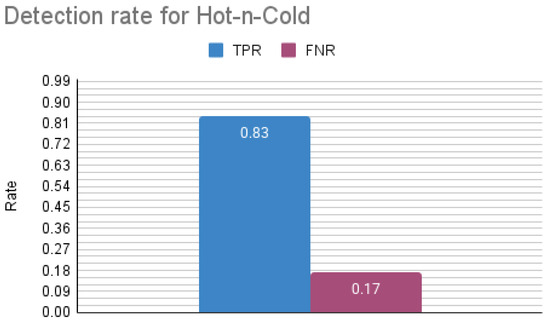
Figure 20.
Detection rate for Hot-n-Cold.
5.4. Fingerprinting CryptoTrooper
Our analysis revealed similarities in the thermal profiles over time. These results demonstrate that encryption processes leave thermal traces and cryptographic algorithms produce similar thermal signatures even in noisy environments. This information helps us detect when a cryptographic process is running; therefore, it is possible to detect CryptoTrooper attacks using thermal traces.
5.5. Fingerprinting Authentication Processes
To discuss the dissimilarities between the different authentication commands, some comparison tables are presented next. Table 3 presents a summary of the difference between the two ssh commands, first with terminal and second without terminal, for the authentication process.
Table 3.
Differences between the two ssh authentication commands.
In Table 4 presents a summary of the difference between the ssh and su commands for the authentication process.
Table 4.
Differences between the ssh and su authentication commands.
From the tables presented above, it can be seen that the switch user authentication process consumes very few resources; therefore, in thermal traces, the login attempts cannot be seen as in shh cases where resource usage is higher.
In addition to the differences in cooling presented above, another reason why authentication could not have been footprinted on the D-153 is a distinction in configuration. To set the login processes to run on a specific core, the PAM (Pluggable Authentication Module) and Slice CPU Affinity settings were used. On the i7 systems, PAM was used to pin the login session to a specific core before any execution starts. However, on the i9, we were unable to use PAM; therefore, we created a login slice, which sets the CPU affinity only after a part of the login session was initialized. This means that a part of the login session was run somewhere else, minimizing the temperature dissipation on the monitored core.
5.6. Future Work
The results on D-153 are not as conclusive as the other two. Thus, our future work will focus on increasing the traces for the desktop running on the i9 processor, in order to reproduce the authentication fingerprinting. In addition, we aim to increase the number of commands on which the experiments are performed and also to introduce AI in the following experiments.
6. Conclusions
In this work, we were able to demonstrate that anomalies in CPU heat dissipation can be effectively identified through the use of Intel Digital Thermal Sensors, even under high-load or noisy conditions. Three detection methods were explored to support this claim. The first involved the Hot-n-Cold technique, which successfully detected if additional lines of code were injected into Linux commands by analyzing thermal patterns. The second approach identified the presence of CryptoTrooper ransomware by capturing the thermal footprint of cryptographic processes. The third method detected system login attempts through their distinct thermal signatures.
These findings confirm that thermal monitoring can serve as a viable and complementary layer for system security. The ability to obtain processor temperature data for intrusion and anomaly detection opens new opportunities for research. More research is needed, and such methods are incorporated into real-time monitoring systems to enhance data protection.
Author Contributions
Conceptualization, T.V. and R.B.; methodology, T.V. and R.B.; software, T.V.; validation, T.V. and R.B.; formal analysis, T.V. and R.B.; investigation, T.V.; resources, R.B.; data curation, T.V.; writing—original draft preparation, T.V.; writing—review and editing, R.B.; visualization, T.V.; supervision, R.B.; project administration, T.V. All authors have read and agreed to the published version of the manuscript.
Funding
This research received no external funding.
Institutional Review Board Statement
Not applicable.
Informed Consent Statement
Not applicable.
Data Availability Statement
Scripts are available at https://github.com/teodoravasilas/WhenThingsHeatUp.
Conflicts of Interest
The authors declare no conflicts of interest.
Appendix A
Appendix A.1. Fingerprinting CryptoTrooper
In Figure A1 is the thermal footprint of AES256 and ChaCha20 for the D-150 system. Similar in Figure A2 and Figure A3 are the thermal footprints of systems D-152 and D-153, respectively.

Figure A1.
AES256 and ChaCha20 on D-150.


Figure A2.
AES256 and ChaCha20 on D-152.


Figure A3.
AES256 and ChaCha20 on D-153.

Appendix A.2. Fingerprinting Authentication Processes
For the first type of command, a correct password comes after an incorrect password, colored pink in Figure A4, and second, two correct passwords come after two incorrect passwords with blue.

Figure A4.
Authentication alternate passwords on D-150 and D-152.

References
- Vasilas, T.; Jakobsche, T.; Ciorba, F.M. Hot-n-Cold: Mapping the Syscall Attack Surface Using Thermal Side Channels, 2023. In Proceedings of the 2023 22nd International Symposium on Parallel and Distributed Computing (ISPDC), Bucharest, Romania, 10–12 July 2023. [Google Scholar]
- CryptoTrooper: The First Linux White-Box Ransomware for Learning Purpose. Available online: https://github.com/jdsecurity/CryptoTrooper/tree/master (accessed on 1 May 2025).
- Masti, R.J.; Rai, D.; Ranganathan, A.; Müller, C.; Thiele, L.; Capkun, S. Thermal covert channels on multi-core platforms. In Proceedings of the USENIX Security Symposium, Washington, DC, USA, 12–14 August 2015. [Google Scholar]
- Bartolini, D.B.; Miedl, P.; Thiele, L. On the capacity of thermal covert channels in multicores. In Proceedings of the Eleventh European Conference on Computer Systems, London, UK, 18–21 April 2016. [Google Scholar]
- Long, Z.; Wang, X.; Jiang, Y.; Cui, G.; Zhang, L.; Mak, T. Improving the efficiency of thermal covert channels in multi-/many-core systems. In Proceedings of the 2018 Design, Automation & Test in Europe Conference & Exhibition (DATE), Dresden, Germany, 19–23 March 2018. [Google Scholar]
- Dey, S.; Singh, A.K.; McDonald-Maier, K. ThermalAttackNet: Are CNNs making it easy to perform temperature side-channel attack in mobile edge devices? Future Internet 2021, 13, 146. [Google Scholar] [CrossRef]
- Kim, T.; Shin, Y. ThermalBleed: A practical thermal side-channel attack. IEEE Access 2022, 10, 25718–25731. [Google Scholar] [CrossRef]
- Mishra, N.; Dutta, T.L.; Shukla, S.; Chakraborty, A.; Mukhopadhyay, D. Too hot to handle: Novel thermal side-channel in power attack-protected Intel processors. In Proceedings of the 2024 IEEE International Symposium on Hardware Oriented Security and Trust (HOST), Tysons Corner, VA, USA, 6–9 May 2024. [Google Scholar]
- Allec, N.; Hassan, Z.; Shang, L.; Dick, R.P.; Yang, R. ThermalScope: Multi-scale thermal analysis for nanometer-scale integrated circuits. In Proceedings of the 2008 IEEE/ACM International Conference on Computer-Aided Design, San Jose, CA, USA, 10–13 November 2008. [Google Scholar]
- Gu, P.; Stow, D.; Barnes, R.; Kursun, E.; Xie, Y. Thermal-aware 3D design for side-channel information leakage. In Proceedings of the 2016 IEEE 34th International Conference on Computer Design (ICCD), Scottsdale, AZ, USA, 2–5 October 2016. [Google Scholar]
- Huang, H.; Wang, X.; Jiang, Y.; Singh, A.K.; Yang, M.; Huang, L. On countermeasures against the thermal covert channel attacks targeting many-core systems. In Proceedings of the 2020 57th ACM/IEEE Design Automation Conference (DAC), San Francisco, CA, USA, 20–24 July 2020. [Google Scholar]
- Huang, H.; Wang, X.; Jiang, Y.; Singh, A.K.; Yang, M.; Huang, L. Detection of and countermeasure against thermal covert channel in many-core systems. IEEE Trans. Comput. Aided Des. Integr. Circuits Syst. 2021, 41, 252–265. [Google Scholar] [CrossRef]
- Wu, Q.; Wang, X.; Chen, J. Defending against thermal covert channel attacks by task migration in many-core system. In Proceedings of the 2021 IEEE 3rd International Conference on Circuits and Systems (ICCS), Chengdu, China, 29–31 October 2021. [Google Scholar]
- Rahimi, P.; Singh, A.K.; Wang, X. Selective noise based power-efficient and effective countermeasure against thermal covert channel attacks in multi-core systems. J. Low Power Electron. Appl. 2022, 12, 25. [Google Scholar] [CrossRef]
- Wang, X.; Wang, S.; Jiang, Y.; Singh, A.K.; Yang, M.; Huang, L. Combating stealthy thermal covert channel attack with its thermal signal transmitted in direct sequence spread spectrum. IEEE Trans. Comput. Aided Des. Integr. Circuits Syst. 2022, 41, 4064–4075. [Google Scholar] [CrossRef]
- Wang, X.; Huang, H.; Chen, R.; Jiang, Y.; Singh, A.K.; Yang, M.; Huang, L. Detection of thermal covert channel attacks based on classification of components of the thermal signal features. IEEE Trans. Comput. 2022, 72, 971–983. [Google Scholar] [CrossRef]
- González-Gómez, J.; Sikal, M.B.; Khdr, H.; Bauer, L.; Henkel, J. Smart detection of obfuscated thermal covert channel attacks in many-core processors. In Proceedings of the 2023 60th ACM/IEEE Design Automation Conference (DAC), San Francisco, CA, USA, 9–13 July 2023. [Google Scholar]
- Vasilas, T.; Bacila, C.; Brad, R. Beat the Heat: Syscall Attack Detection via Thermal Side Channel. Future Internet 2024, 16, 301. [Google Scholar] [CrossRef]
- Ling, X.; Wu, L.; Zhang, J.; Qu, Z.; Deng, W.; Chen, X.; Qian, Y.; Wu, C.; Ji, S.; Luo, T.; et al. Adversarial attacks against Windows PE malware detection: A survey of the state-of-the-art. Comput. Secur. 2023, 128, 103134. [Google Scholar] [CrossRef]
- Intel® Core™ i7-10700F Processor. Available online: https://www.intel.com/content/www/us/en/products/sku/199318/intel-core-i710700f-processor-16m-cache-up-to-4-80-ghz/specifications.html (accessed on 7 June 2025).
- Intel® Core™ i7-13700 Processor. Available online: https://www.intel.com/content/www/us/en/products/sku/230490/intel-core-i713700-processor-30m-cache-up-to-5-20-ghz/specifications.html (accessed on 7 June 2025).
- Intel® Core™ i9-11900K Processor. Available online: https://www.intel.com/content/www/us/en/products/sku/212325/intel-core-i911900k-processor-16m-cache-up-to-5-30-ghz/specifications.html (accessed on 7 June 2025).
- Kernel driver coretemp. Available online: https://docs.kernel.org/hwmon/coretemp.html (accessed on 30 May 2025).
- Intel® 64 and IA-32 Architectures Software Developer’s Manual Combined Volumes: 1, 2A, 2B, 2C, 2D, 3A, 3B, 3C, 3D, and 4. 2023. Available online: https://www.intel.com/content/www/us/en/content-details/782158/intel-64-and-ia-32-architectures-software-developer-s-manual-combined-volumes-1-2a-2b-2c-2d-3a-3b-3c-3d-and-4.html?wapkw=intel%2064%20and%20ia-32%20architectures%20software%20developer%27s%20manual&docid=782158 (accessed on 13 June 2025).
- The Linux Kernel Archives. 2024. Available online: https://www.kernel.org/doc/Documentation/hwmon/sysfs-interface (accessed on 13 June 2025).
- stress-ng. Available online: https://github.com/ColinIanKing/stress-ng (accessed on 30 May 2025).
- Intel Core i9-11900K and Core i5-11600K Review: Rocket Lake Blasts Off. Available online: https://www.tomshardware.com/reviews/intel-core-i9-11900k-and-i5-11600k-review (accessed on 7 June 2025).
- Apache HTTP Server Project. Available online: https://httpd.apache.org/ (accessed on 1 June 2025).
- Common Vulnerabilities and Exposures. Available online: https://www.cve.org/ (accessed on 30 May 2025).
- GNU Core Utilities. Available online: https://github.com/coreutils/coreutils (accessed on 25 November 2024).
- OpenSSL: The Open Source Toolkit for SSL/TLS. Available online: https://www.openssl.org/ (accessed on 1 June 2025).
- ssh—Linux Manual Page. Available online: https://man7.org/linux/man-pages/man1/ssh.1.html (accessed on 30 May 2025).
- OpenSSH Server. Available online: https://documentation.ubuntu.com/server/how-to/security/openssh-server/index.html (accessed on 1 June 2025).
- Random.org. Available online: https://www.random.org/ (accessed on 1 June 2025).


Disclaimer/Publisher’s Note: The statements, opinions and data contained in all publications are solely those of the individual author(s) and contributor(s) and not of MDPI and/or the editor(s). MDPI and/or the editor(s) disclaim responsibility for any injury to people or property resulting from any ideas, methods, instructions or products referred to in the content. |
© 2025 by the authors. Licensee MDPI, Basel, Switzerland. This article is an open access article distributed under the terms and conditions of the Creative Commons Attribution (CC BY) license (https://creativecommons.org/licenses/by/4.0/).