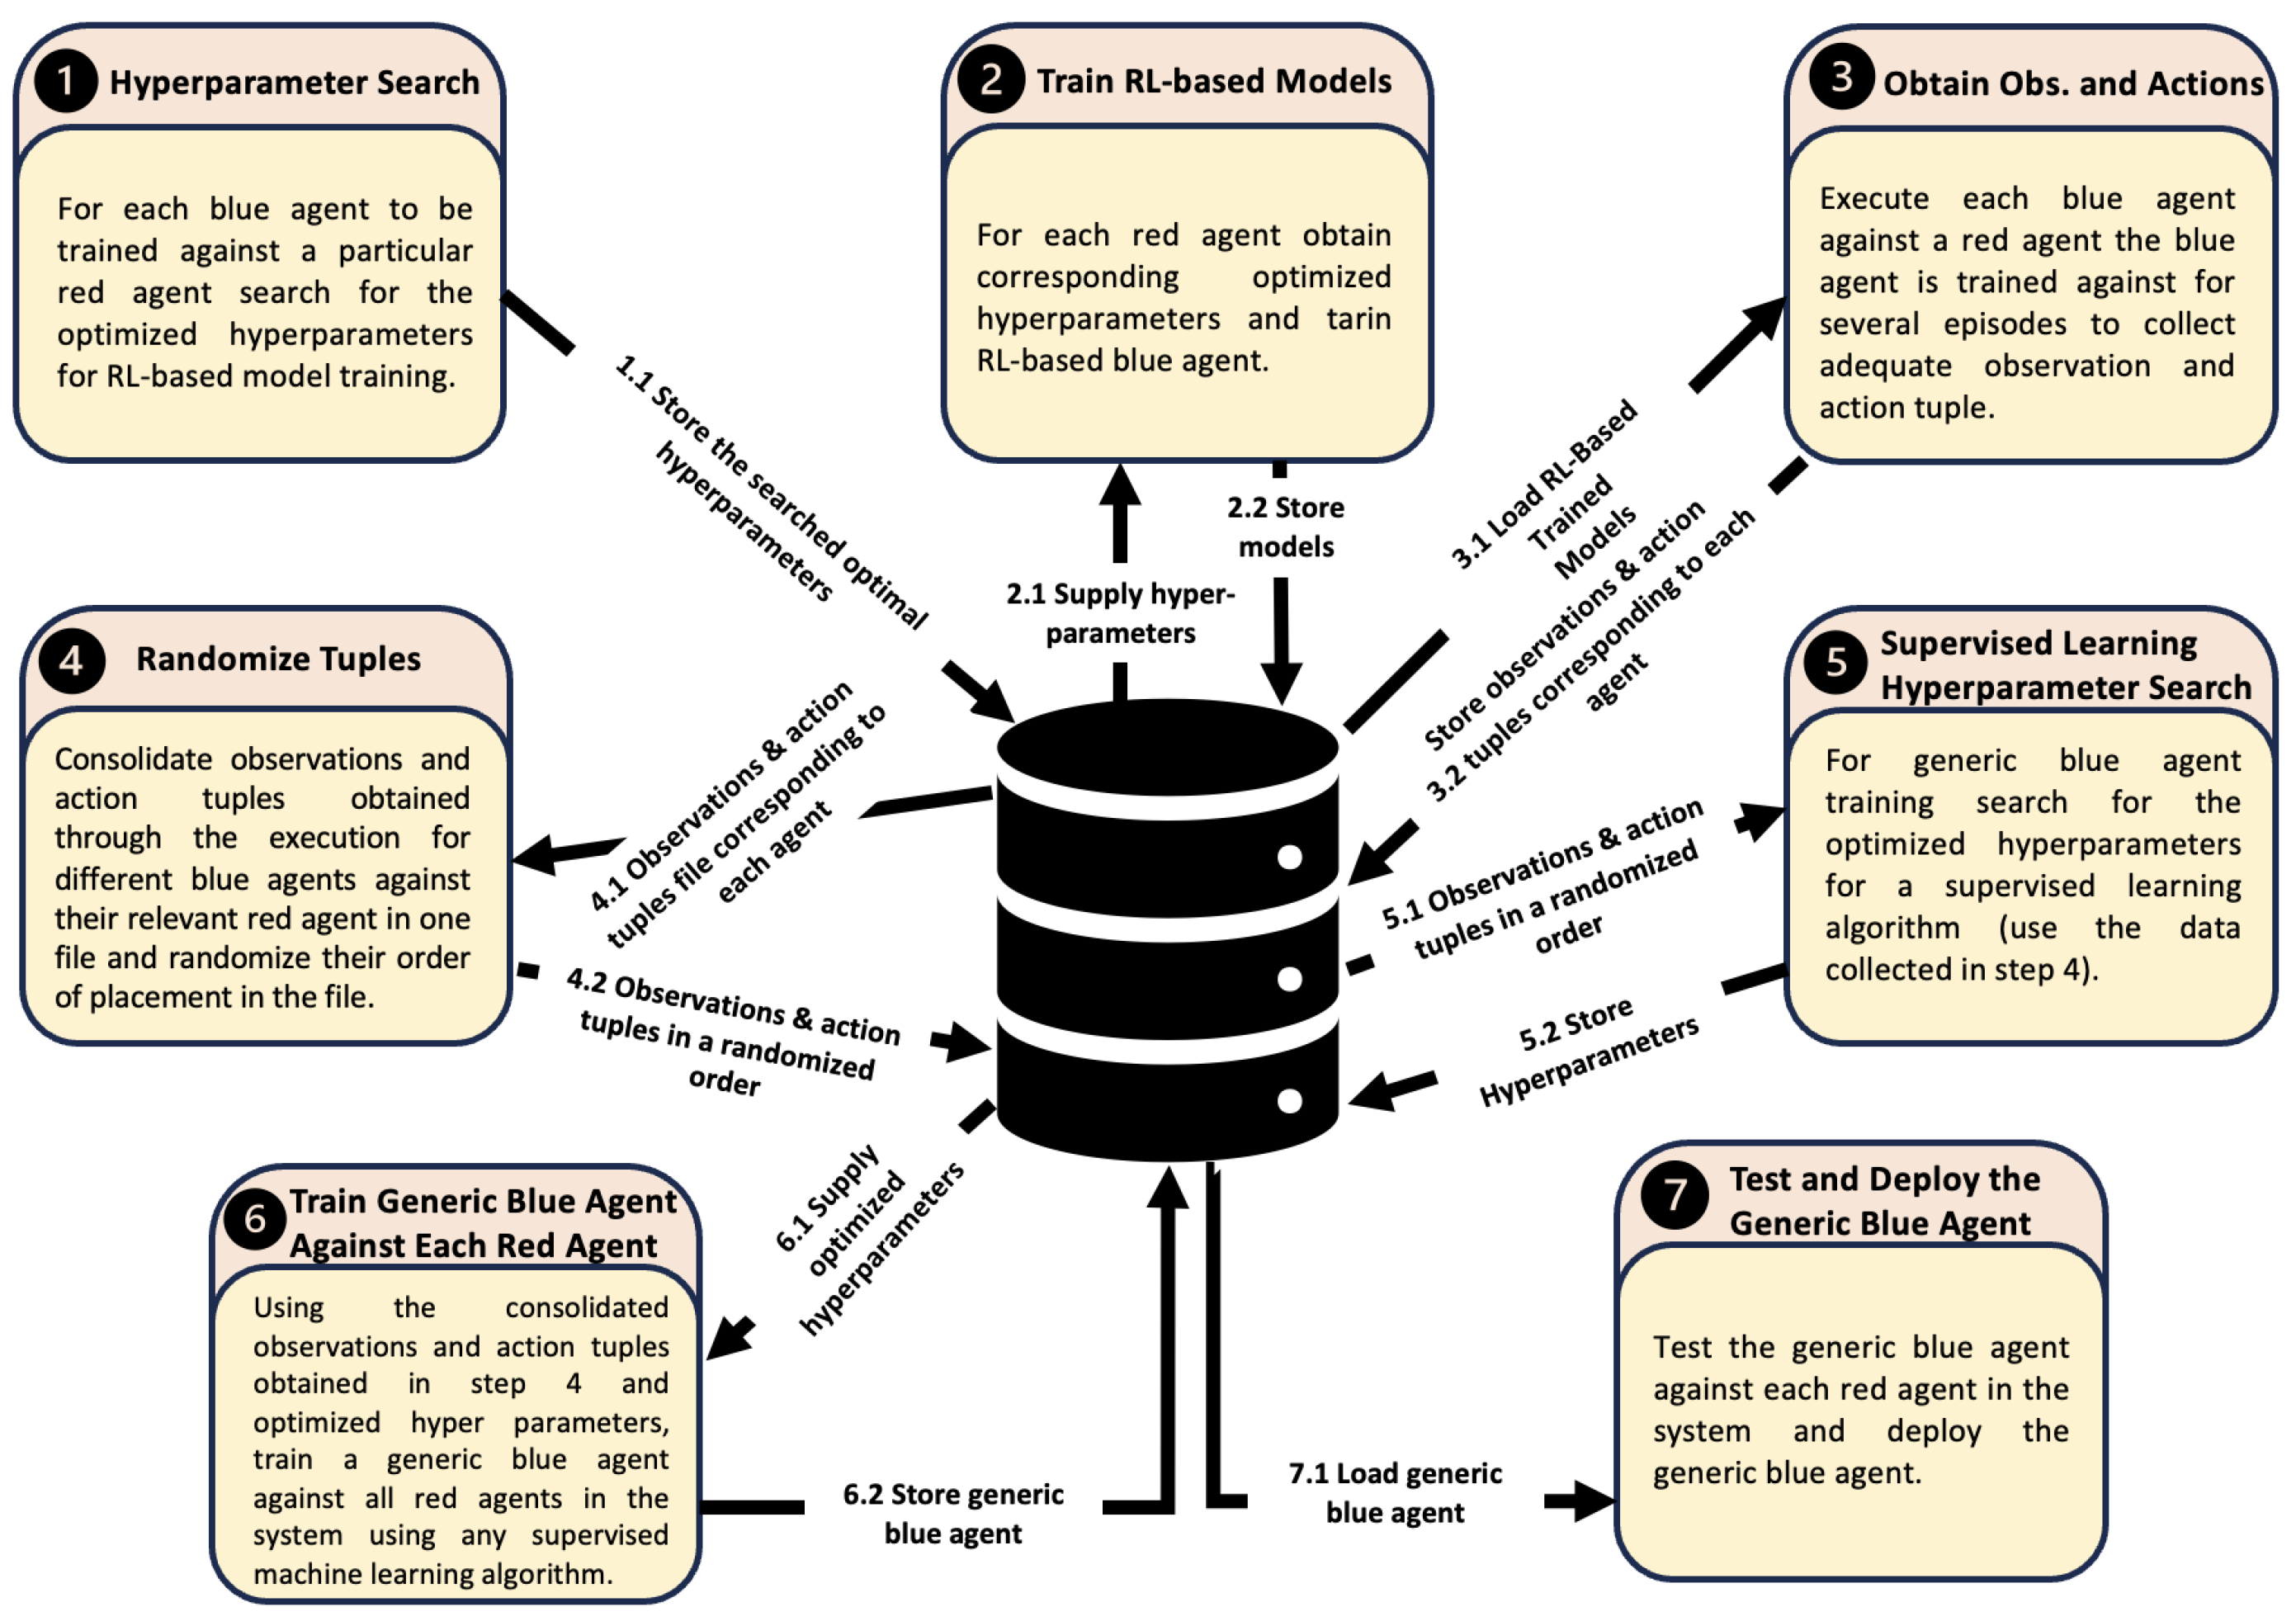
The proposed framework integrates RL with supervised learning. To gather data for supervised learning, each trained blue agent is run against the red agent it was trained to oppose, collecting observation–action tuples for further learning. Before we trained each agent, we carefully tuned relevant hyperparameters,
Table 5 lists the parameters and the range of values explored,
Table 6 shows the optimal hyperparamter values when training against each opponent. For each agent, 10,000 tuples were collected. We employ multi-layer perceptron and support vector machine algorithms for supervised learning, though the framework is adaptable to any supervised learning algorithm. HP optimization for both multi-layer perceptron and support vector machine algorithms was conducted using Bayesian search. For
, the HPs considered were
C,
, and
, with optimal values found to be
,
, and
, respectively. For
, the HPs considered were the number of hidden layers, activation function, solver, learning rate, and alpha, with optimal values determined to be 10,
,
,
, and
, respectively. For VAE-V, the
activation function is used in each layer, except for the output layer, which uses the
activation function. The loss function is a combination of categorical cross-entropy and Kullback–Leibler divergence. The latent vector comprises of 18 elements.
We deployed our approach in CybORG, which features two distinct red agents/attackers. Each blue agent used for performance evaluation is trained for 100,000 steps. For the various performance evaluation scenarios considered here, proximal policy optimization (PPO) is utilized as the RL algorithm, as previous studies have shown its superior performance and generalization ability compared to other RL algorithms like DQN [
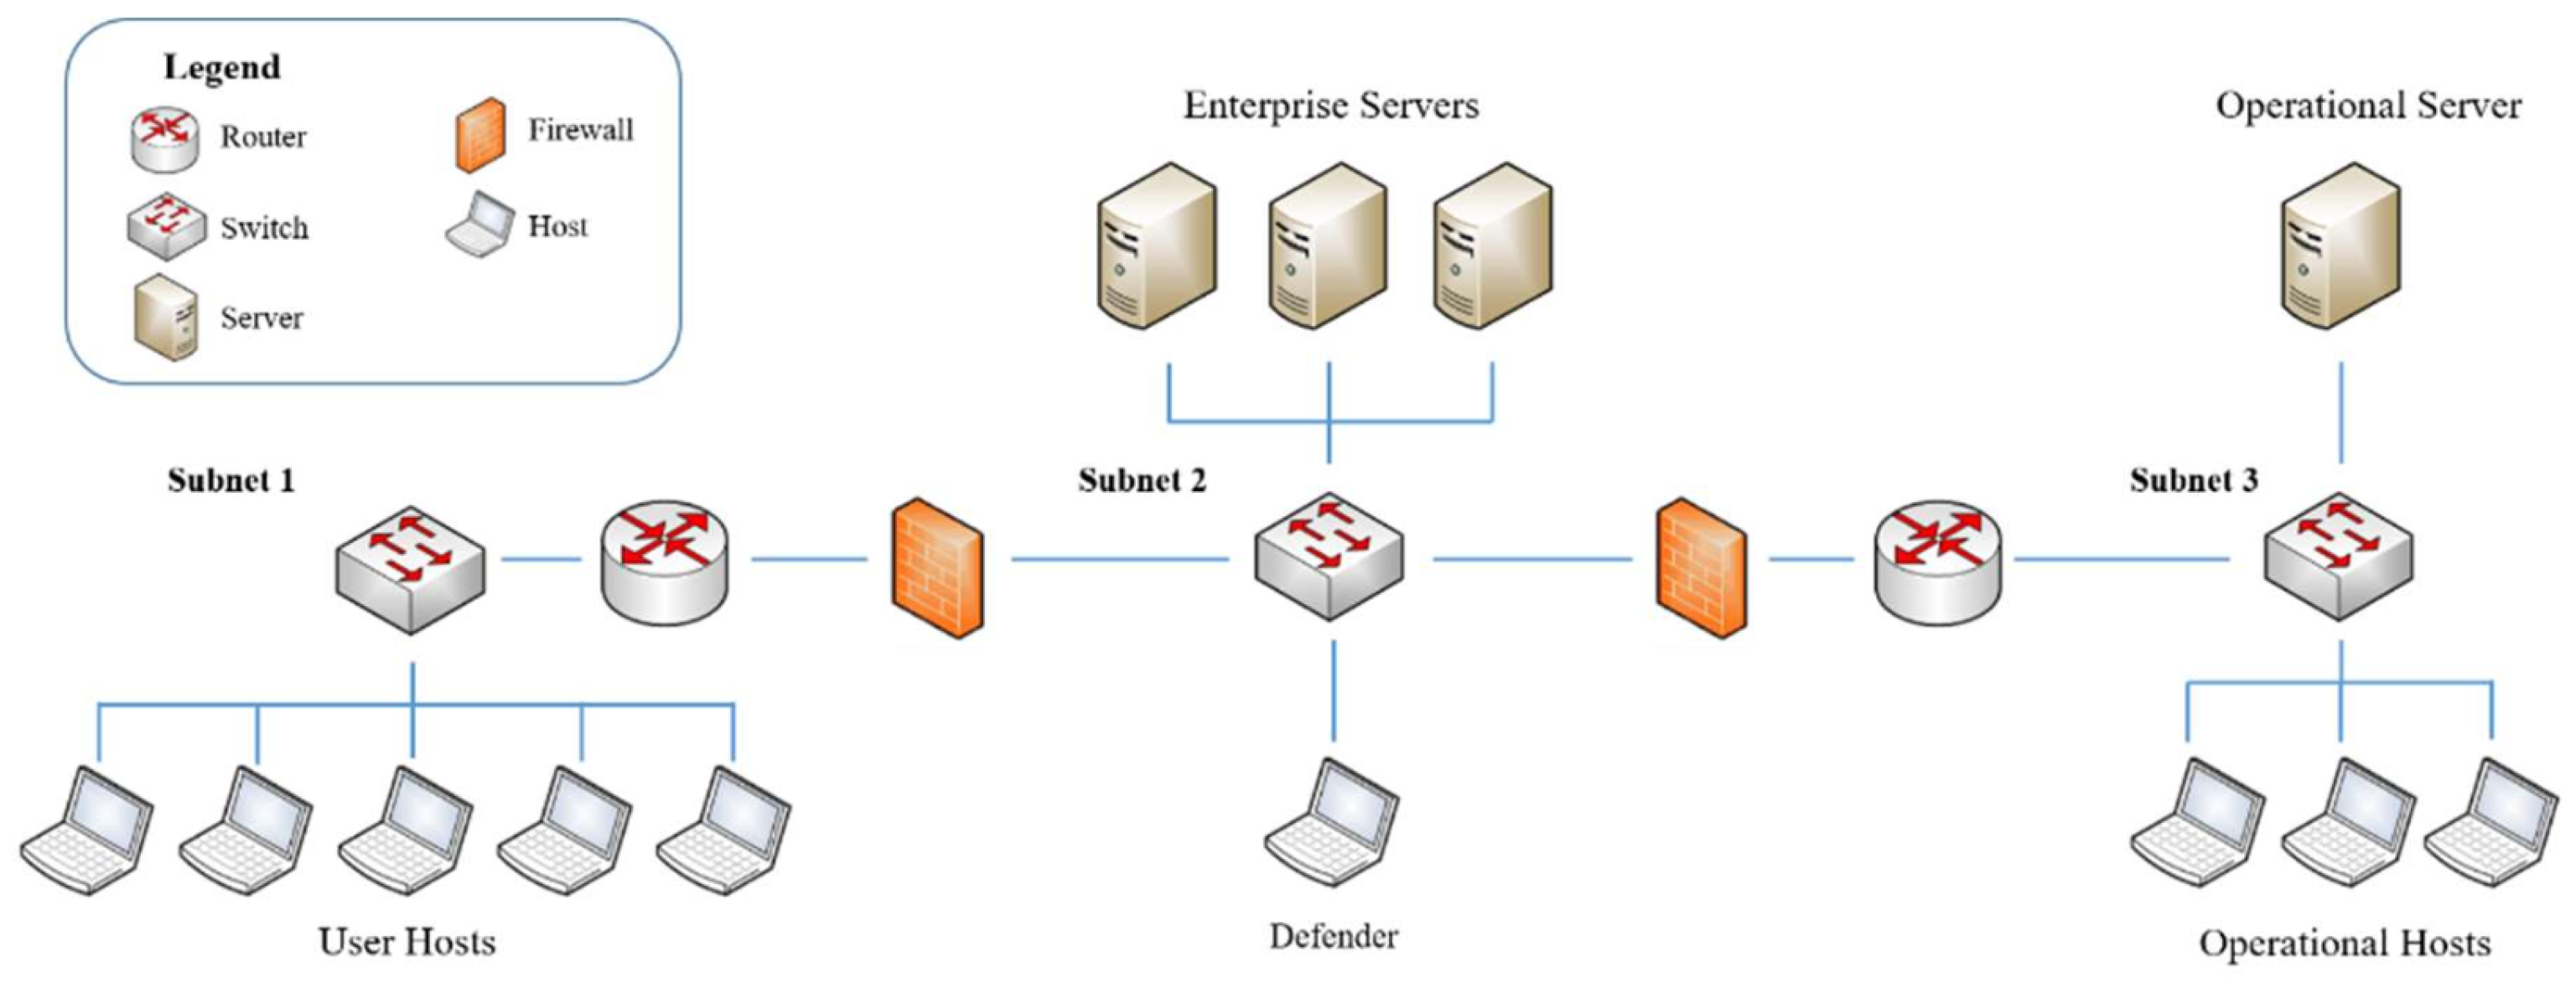
5]. The agents are trained using the networking scenario illustrated in
Figure 3. In each scenario, every trained blue agent is evaluated over 100 episodes against the red agents.
Our performance evaluation experiments utilize two different episode lengths: 100 steps and 50 steps. By varying the episode length, we aim to assess the trained agents’ performance over both shorter and longer periods. This approach helps to highlight how the trained blue agents perform initially and how they adjust their behavior as the scenario progresses. It should also be noted that blue agents do not receive rewards but are penalized at each step. They incur heavier penalties for successful actions of red agents. Therefore, an effective blue agent is one that successfully prevents the red agent’s actions, resulting in a total reward closer to zero.
4.1. Results Based on Training Topology
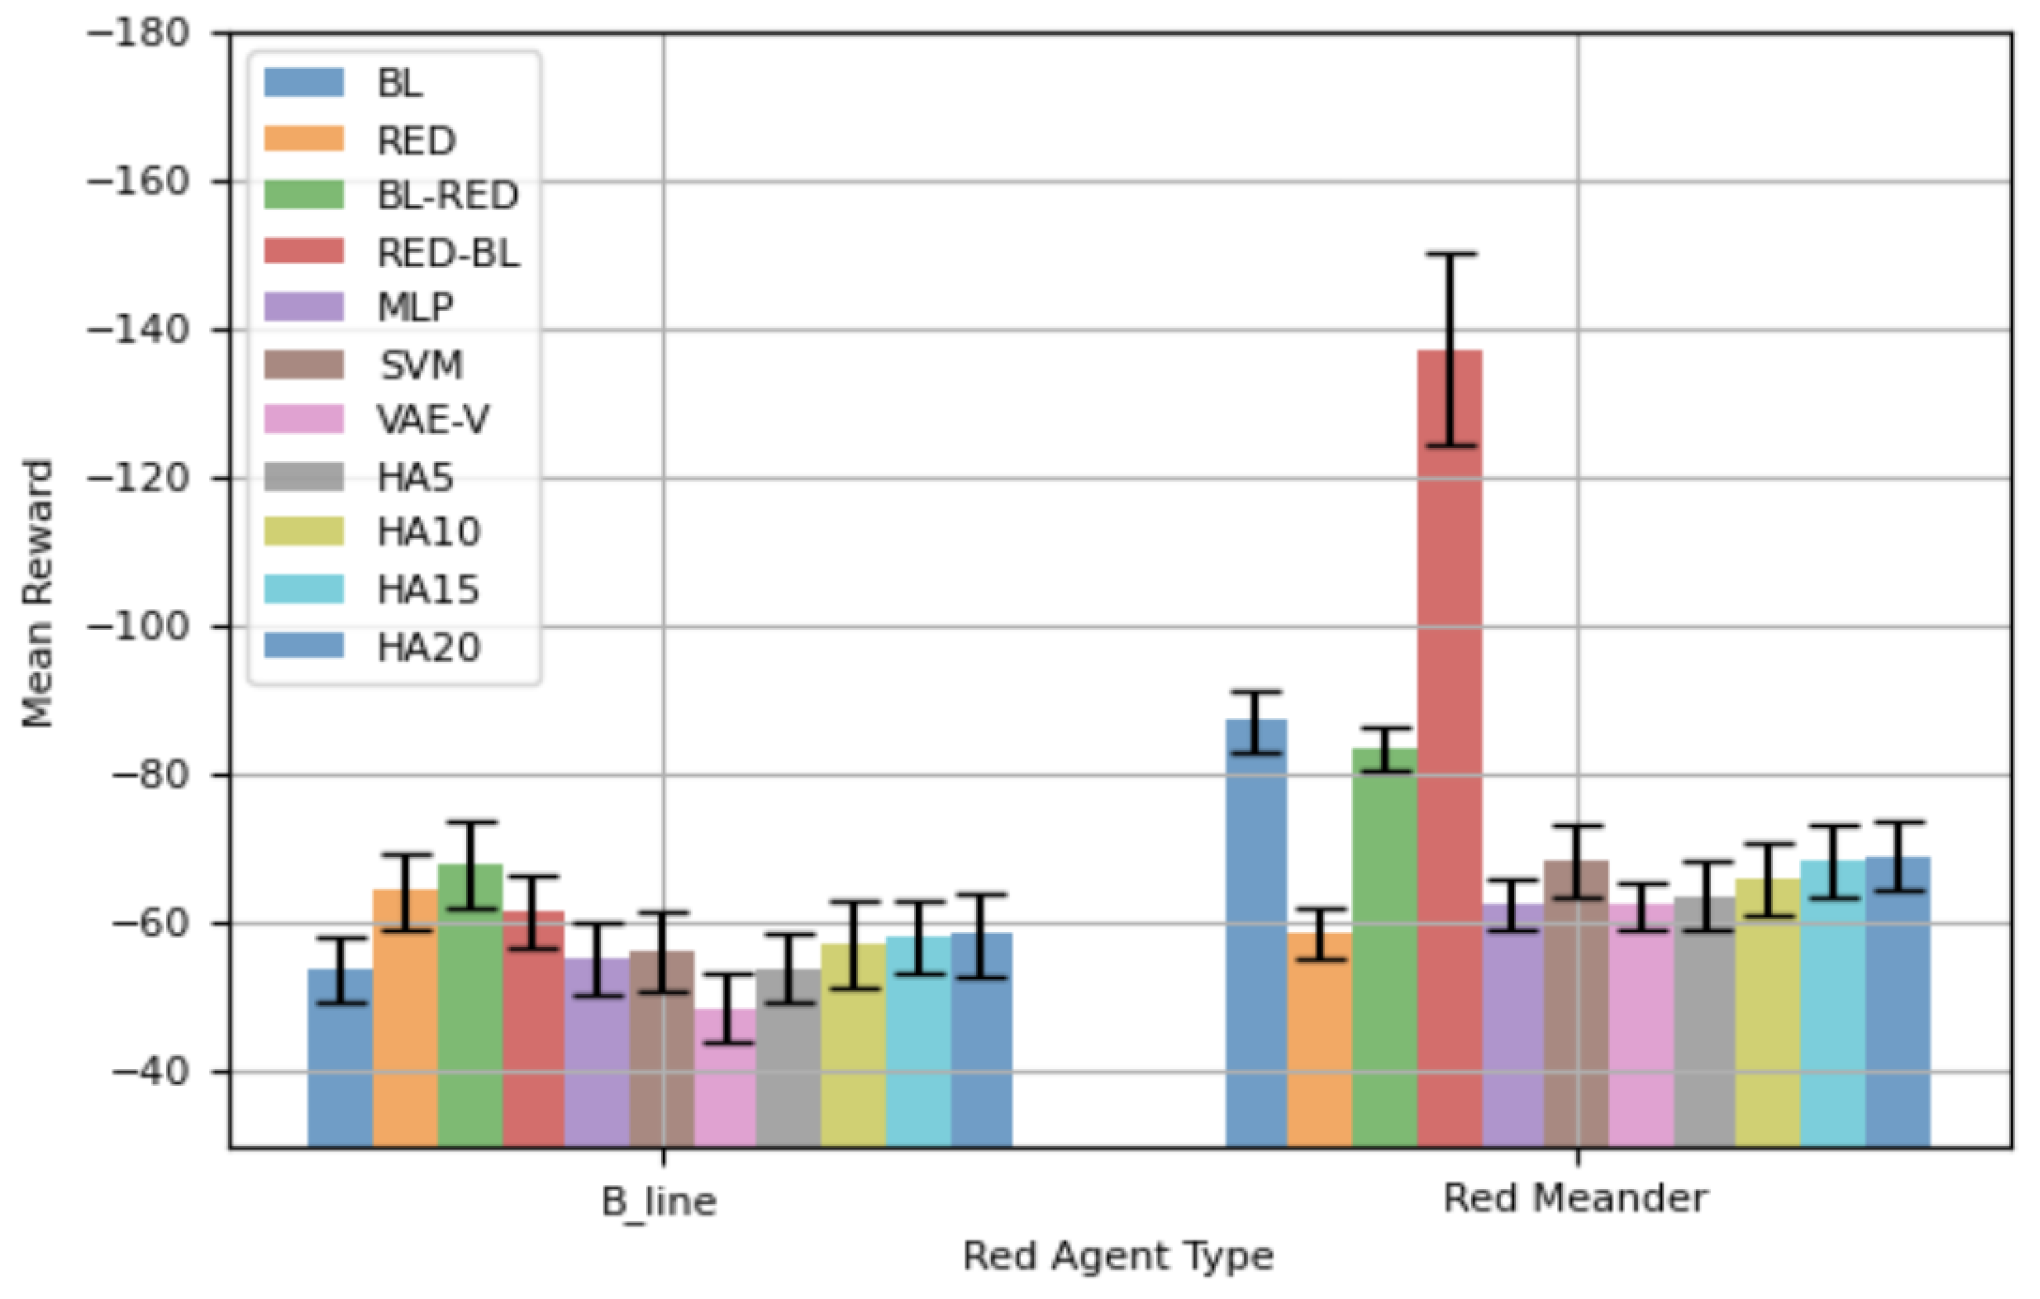
Figure 7 displays the mean total reward, along with the 95% confidence interval (CI), for different blue agents against
and
in 100-step episodes. When the network is attacked by
, agents trained using the proposed framework show better mean rewards compared to other agents, except BL. Notably, our VAE-V agent achieves the highest mean reward—even better than that of BL, the agent specifically trained for
. However, this difference is not statistically significant. The REDagent trained specifically for
performs poorly against
, and this difference is statistically significant. Similarly, BL-RED and RED-BL perform worse against
. BL-RED performs worse than RED-BL because RED-BL is an agent retrained for
after having initially been trained for
. Consequently, it demonstrates a better mean reward compared to BL-RED, which was originally trained for
, then retrained for
. This indicates that the agent forgets features of the
red agent while retraining. All HA agents show lower mean rewards compared to BL, but the differences in performance are not statistically significant.
For agents’ performance against (), the RED agent achieves the best mean reward, as it is specifically trained for . VAE-V and MLP agents, trained using the proposed framework, show similar performance to RED. BL, BL-RED, and RED-BL perform worse compared to RED, with the difference being statistically significant. Notably, RED-BL exhibits a lower mean reward compared to BL-RED, highlighting that retraining of an agent leads to the forgetting of features of the red agent it was originally trained against. HA agents also perform worse compared to RED, and as the error rate in selecting the correct blue agent increases, the performance difference becomes statistically significant between HAs and RED. VAE-V shows a better mean reward compared to HAs, and MLP also demonstrates a better mean reward compared to some HAs.
Table 7 shows the total mean reward demonstrated by different agents considering both red agents. MLP and VAE-V exhibit superior total mean rewards, with SVM also outperforming most other agents. The overall best performance is achieved by VAE-V with a score of −110.90, highlighted in bold. The proposed framework trains a single blue agent to handle both
and
. The results in
Table 7 indicate that agents trained using the proposed framework possess generalizability, enabling them to effectively handle both types of red agents.
Previously, all results were based on episodes of 100 steps. Here, we present results from another set of experiments with an episode length of 50 steps. Prior findings have shown that retraining agents is counterproductive, so retrained agents are not considered in this analysis.
Figure 8 shows the mean total rewards, along with 95% CIs, for different blue agents. The performance of the blue agents against
is similar to that shown in
Figure 7. VAE-V demonstrates the best mean reward, followed by MLP and SVM. However, the performance difference between the blue agents trained using the proposed framework and BL is not statistically significant. The RED agent shows the worst performance against
, as it is specifically trained against
. Most HAs also demonstrate worse mean rewards compared to BL and the blue agents trained using the proposed framework, with the differences in performance for VAE-V and HA20 being statistically significant. The blue agents’ performance against
is, again, similar to what is shown in
Figure 7. The RED agent demonstrates the best performance, with VAE-V and MLP showing comparable performance to RED, as the differences are not statistically significant. BL performs the worst, since it is trained for
. The mean reward for HAs decreases as the percentage error in selecting the appropriate blue agent increases, although their performance is generally similar to RED.
Table 8 lists the mean total rewards as demonstrated by the blue agents against both red agents. Among the blue agents trained using the proposed framework, VAE-V achieves the highest total mean reward, indicated by the bold font. HA5 achieves the same total mean reward, while MLP and SVM also exhibit comparable total mean rewards. The results in
Table 8 indicate that agents trained with the proposed framework exhibit a certain degree of generalizability, enabling them to effectively handle both types of red agents using a single blue agent.
4.2. Varying the Network Topology
To delve deeper into the generalization capability of the proposed framework, we examine it using network topologies distinct from the network topology employed to train blue agents.
4.2.1. Topology 2 Results
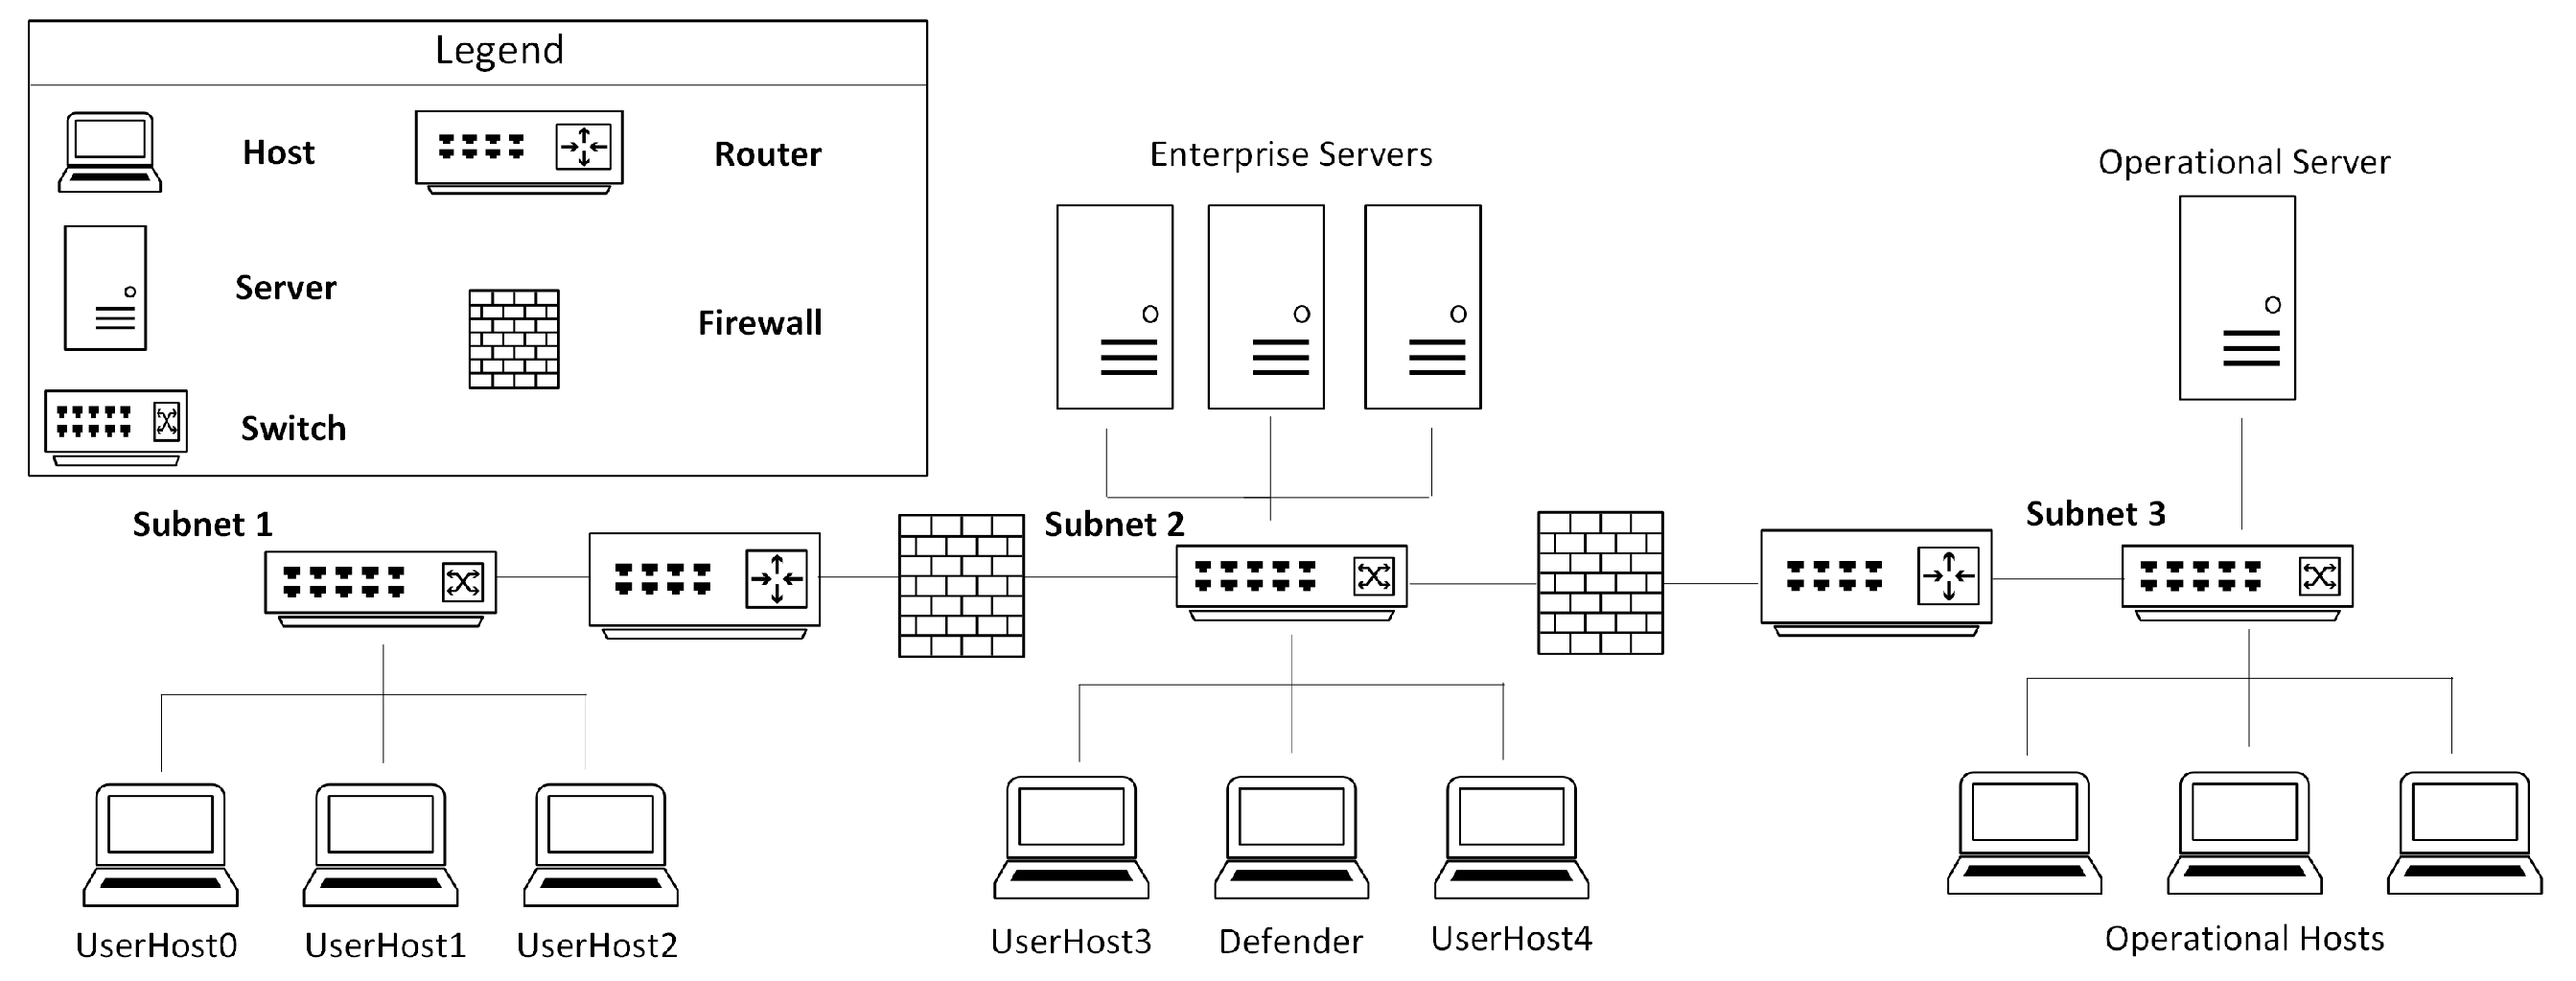
Figure 9 depicts the network topology utilized for assessing the efficacy of various blue agent training methods. Henceforth, this topology will be referred to as “Topology 2”. Compared to the original topology used to train blue agents, the difference here is that
UserHost3 and
UserHost4 have been moved from
subnet1 to
subnet2. This change should not significantly affect the existing red agents,
and
, for the following reasons: (i)
knows the previous network topology required to reach critical resources and impact the operational server, and moving UserHost3 and UserHost4 does not affect the route to the operational server. (ii)
systematically discovers the network topology, so its behavior should not be significantly impacted. Consequently, no changes were made to the existing red agent scripts. The blue agents trained using the proposed framework should be the ones potentially affected by this change, as the number of hosts in is decreased in one subnet and increased in the other.
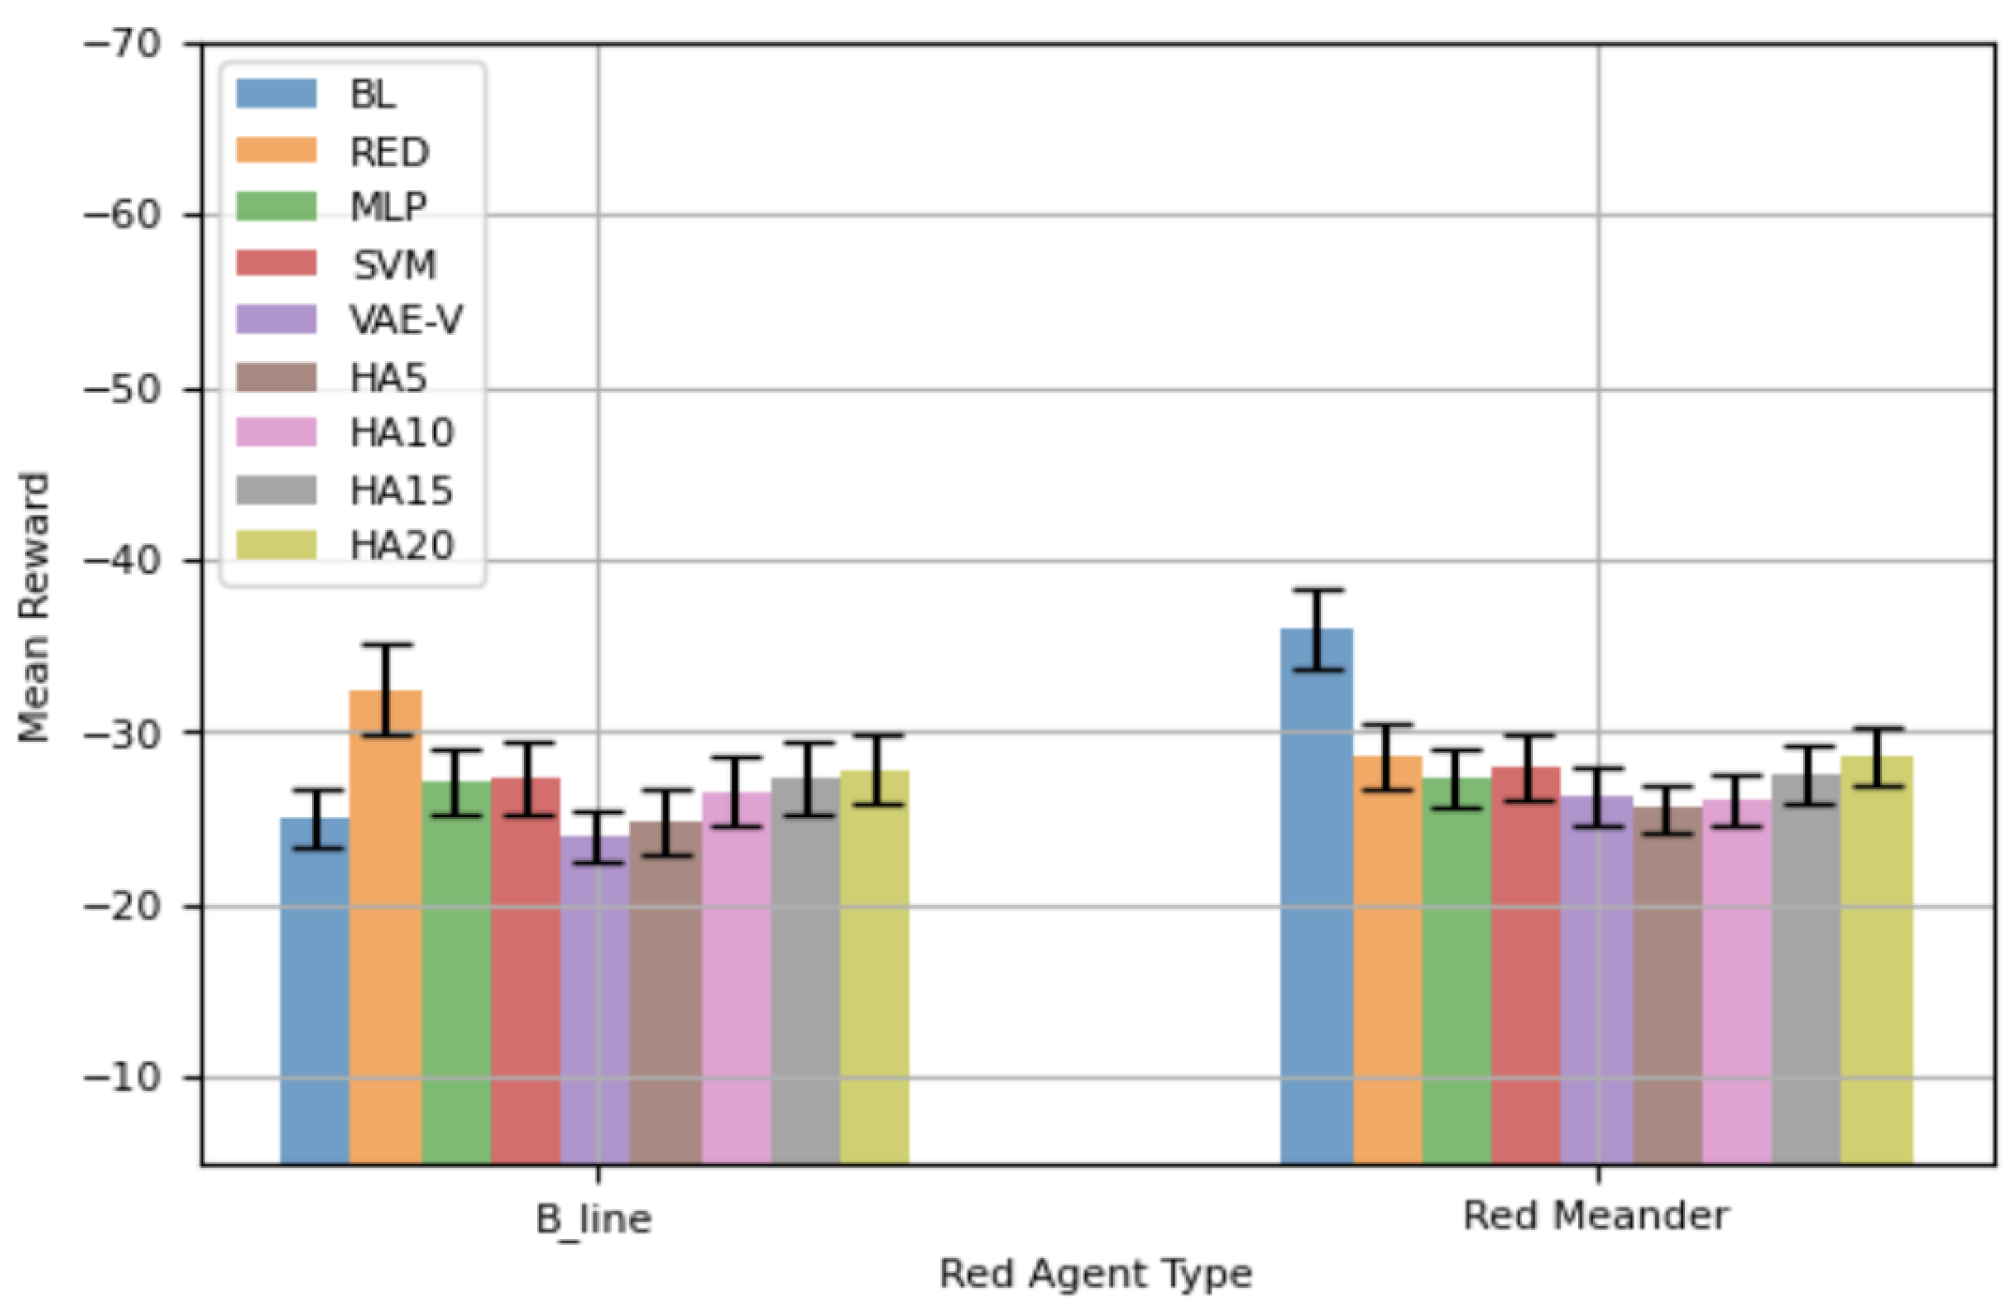
Figure 10 shows the mean reward achieved by different blue agents against the red agents. The results in
Figure 10 were collected over 100 episodes, each consisting of 100 steps. Against
, VAE-V demonstrates the highest mean reward among the evaluated blue agents, followed by SVM, MLP, BL, and HA5. However, the differences in performance are not statistically significant. The RED agent shows the worst performance. Against
, VAE-V, again, achieves the best mean reward, followed by SVM, RED, and HA5. Similarly, the performance differences are not statistically significant. BL performs the worst against
.
Table 9 lists the total mean reward demonstrated by the blue agents considering both red agents, showing that VAE-V achieves the highest total mean reward (indicated by the bold face), followed by SVM, HA5, and MLP. Comparing
Table 7 and
Table 9 reveals the following:
- -
The performance of all blue agents trained solely with reinforcement learning (BL, RED, and all HAs) is deteriorated in this modified environment.
- -
The performance of the single blue agent trained with the proposed framework either deteriorates (MLP and VAE-V) or, in the case of SVM, actually demonstrates a slightly improved total mean reward.
Table 9.
Total mean reward—100-step episode (Topology 2).
Table 9.
Total mean reward—100-step episode (Topology 2).
| Agent Type | BL | RED | MLP | SVM | VAE-V |
|---|
| Total Mean Reward | −148 | −132.0 | −122.2 | −119 | −116.45 |
| Agent Type | HA5 | HA10 | HA15 | HA20 | |
| Total Mean Reward | −120.08 | −126.14 | −128.32 | −130.5 | |
In summary, combining RL with supervised learning outperforms other defensive agents against the agent, while most defensive agents trained using the proposed framework exhibit comparable performance against the agent when evaluated on a network topology different from the one used during training. Overall, our approach demonstrates the best performance, with the performance of BL, RED, and hierarchical agents showing a more pronounced decline. These findings indicate that the proposed framework for defensive agent training possesses a degree of generalizability to variations in network topology.
Figure 11 presents the mean reward demonstrated by the evaluated blue agents for a shorted episode length, i.e., 50 steps. Overall, results are similar to those for 100-step episode, i.e., VAE-V demonstrates the best performance (indicated in bold face), followed by HA5, MLP, and SVM. BL and RED demonstrate the worst performance, as also shown in
Table 10. It is important to note here that VAE-V demonstrates statistically better mean rewards compared to RED against
. When agents’ performance for 50-step episodes using Topology 2 with the topology used for agents’ training, the performance of blue agents trained through the proposed framework is improved against the
agent but is slightly deteriorated against the
agent. Most of the HAs performance is slightly deteriorated in this case.
4.2.2. Topology 3 Results
Figure 12 shows another network topology utilized for assessing the efficacy of various blue agent training methods. Hereafter, this topology is referred to as “Topology 3”. In Topology 3,
UserHost0 is moved to the
enterprise subnet. Since red agents access the network through
UserHost0, this change can impact the performance of the
red agent, as its information about the network topology is now inaccurate. However,
discovers the network topology as part of the attack; hence, with this change, its overall approach should not be impacted. In general, the red agents are rule-based, and they consider the host when they decide about the next action to take; hence, their performance should not be significantly impacted with this change. Additionally, the host that both red agents use to access the network is now closer to their target, so the red agents may not perform poorly or could even perform better. Topology 3 is more challenging for the trained blue agents because the red agents now need fewer actions to compromise the operational server. Therefore, Topology 3 can provide more insights into the generalizability of the trained blue agents with regard to network topology variations.
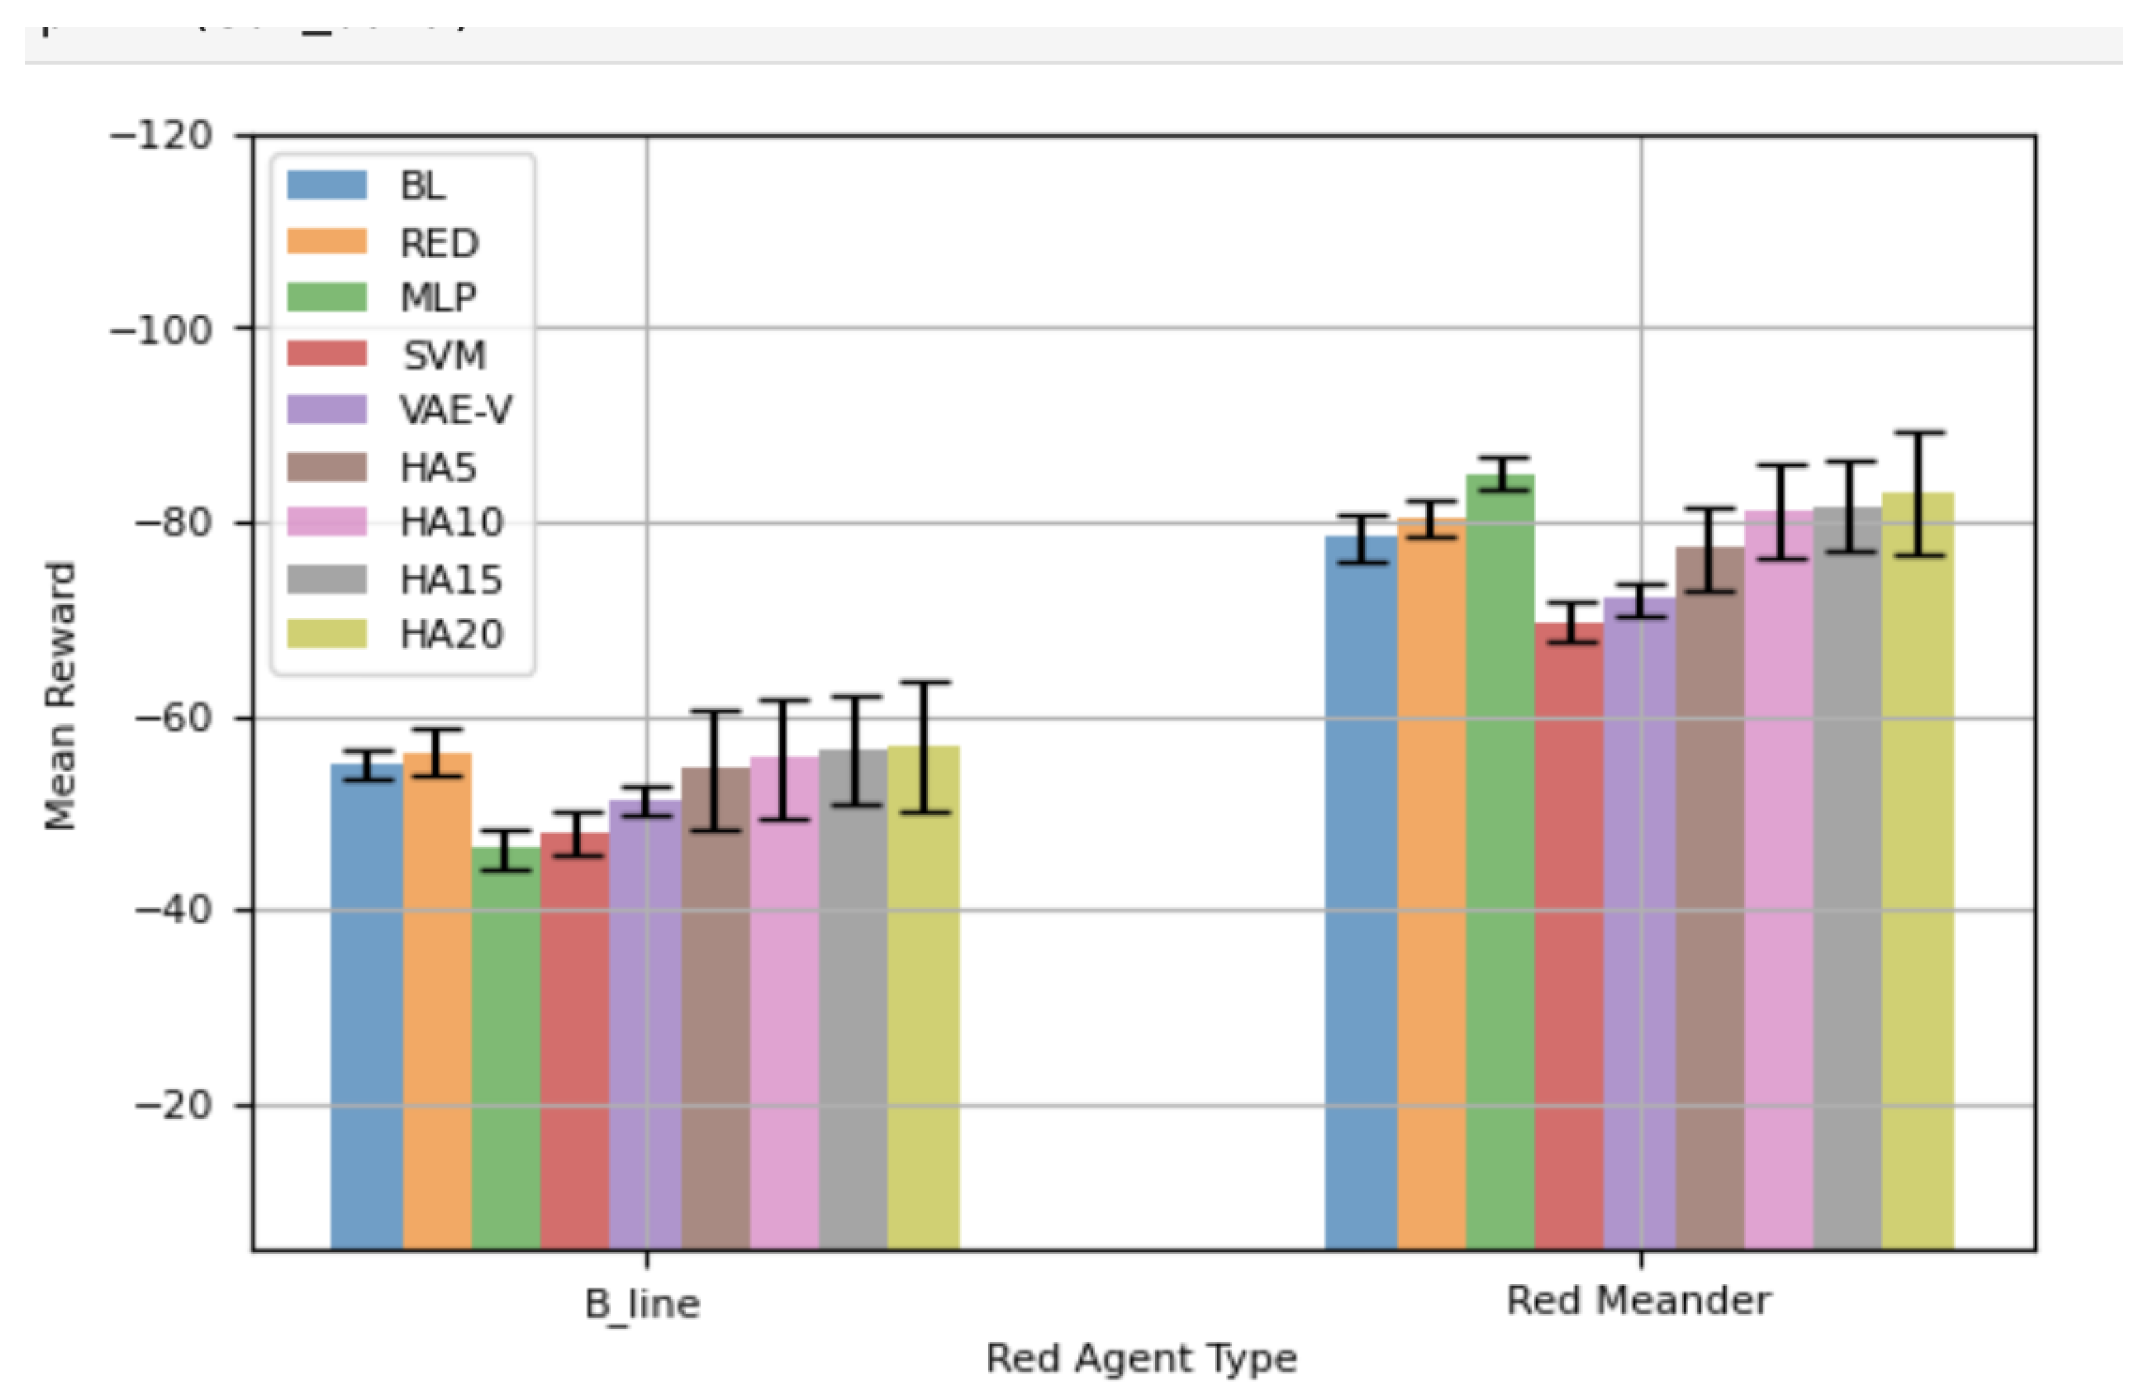
Figure 13 presents the performance of various blue agents against
and
over Topology 3. MLP shows a statistically significantly higher mean reward compared to all other trained blue agents evaluated in this study. Notably, all blue agents trained using the proposed framework demonstrate a statistically significantly better mean reward compared to BL, the blue agent specifically trained for
. All variants of HAs show a higher mean reward compared to BL and RED; however, this difference is not statistically significant. Against
, SVM and VAE-V exhibit statistically significantly better performance compared to RED, the blue agent specifically trained for
. Furthermore, SVM shows statistically significantly better performance compared to all other evaluated blue agents in this scenario, while MLP demonstrates a comparatively poor performance, albeit slightly better than that of the blue agents trained solely via RL. Overall, against both red agents, the blue agents trained through the proposed framework showed a better mean reward compared to all other evaluated blue agents. Two out of three blue agents trained with the proposed framework achieve a statistically significantly higher mean reward compared to pure RL blue agents.
Table 11 shows the total mean reward exhibited by the blue agents while considering both red agents. SVM exhibits the highest mean reward (shown in bold face), followed by VAE-E and MLP.
Comparing
Figure 7 with
Figure 13 reveals the following about the trained blue agents’ performance against the red agents:
- -
When the attacking red agent is , BL and VAE-V demonstrate similar performance in both topologies. SVM, VAE-V, RED, and all HAs demonstrate better performance in Topology 3.
- -
When the attacking red agent is , all blue agents’ performance deteriorates in Topology 3.
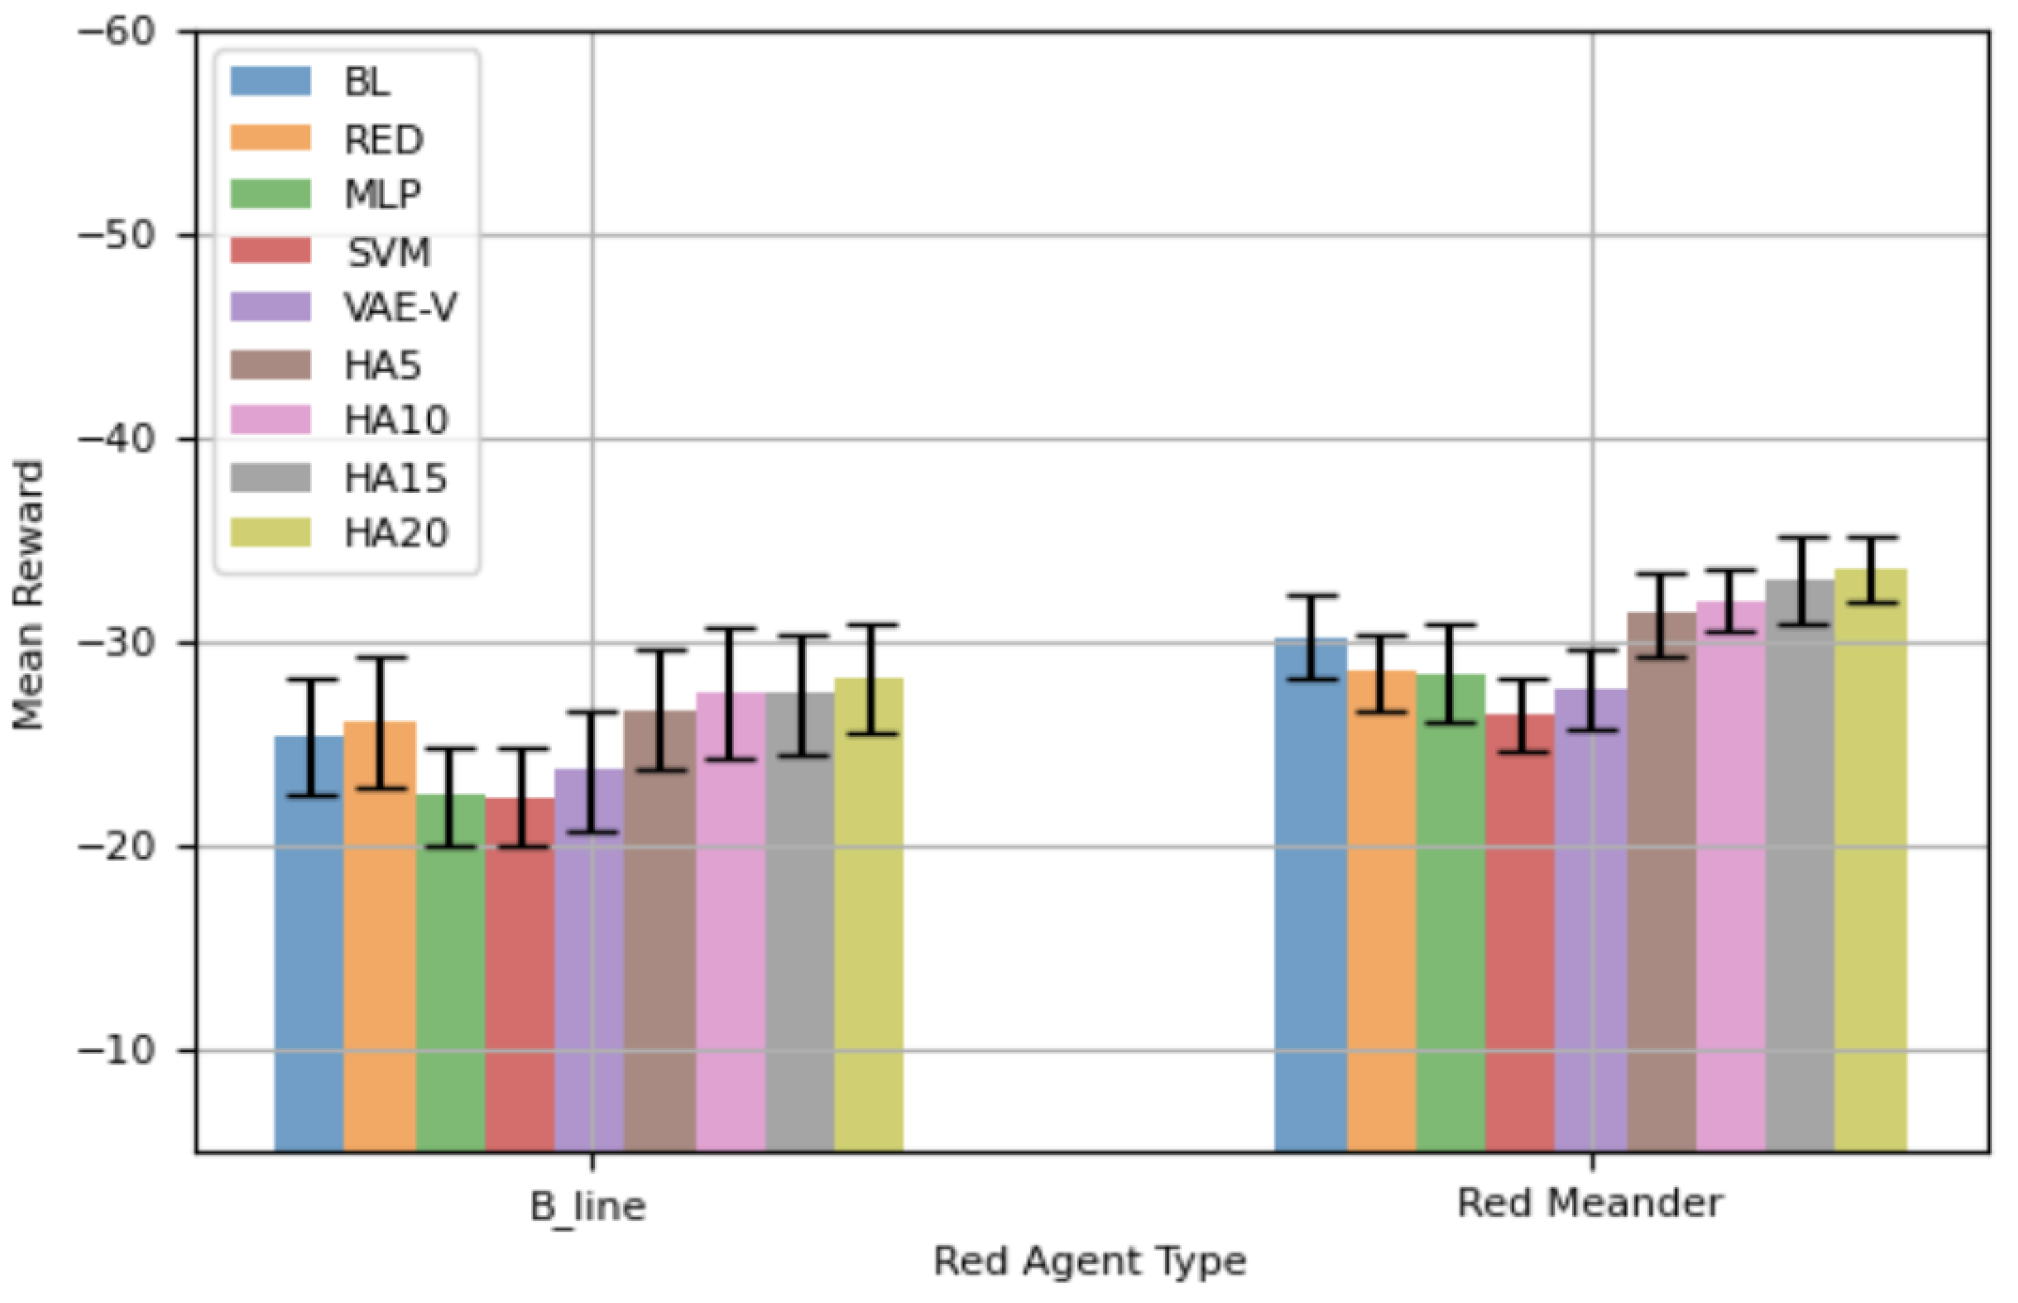
Figure 14 shows the mean reward of the blue agents against both red agents over a 50-step episode. Generally, the trends in
Figure 14 are similar to those in
Figure 13. The agents trained using the proposed framework exhibit better mean rewards, with instances of statistically significantly better performance compared to a blue agent specifically trained against a particular red agent. Similarly, the trends in
Table 12 mostly mirror those in
Table 12, where SVM demonstrates the highest total mean reward (shown in bold face), followed by VAE-V and MLP. Variants of HAs show the lowest total mean reward when considering their performance against both red agents. Comparing
Figure 14 with
Figure 8 reveals that, by and large, the trained blue agents demonstrate similar performance for both topologies. Also, there are instances where agents trained using the proposed framework demonstrate a higher mean reward, i.e., better performance.
In general, our single blue agents perform comparably to blue agents specifically trained against particular red agents, if not achieving superior performance. This indicates that the proposed framework effectively develops a generic blue agent with regard to specific attackers. Since network topologies can vary from one network to another, it is crucial for a blue agent to adapt its behavior as the network topology changes. Therefore, we evaluated blue agents on network topologies different from those used for training (the total number of nodes in the network remained the same, but the number of nodes in each subnet was altered). Across these different network topologies, the blue agents trained with the proposed framework demonstrate statistically significantly better performance compared to other evaluated blue agents. This underscores the generalizability of the proposed framework in adapting to specific network topology changes.


