
Modeling Correlation between Android Permissions Based on Threat and Protection Level Using Exploratory Factor Plane Analysis


Abstract
:1. Introduction
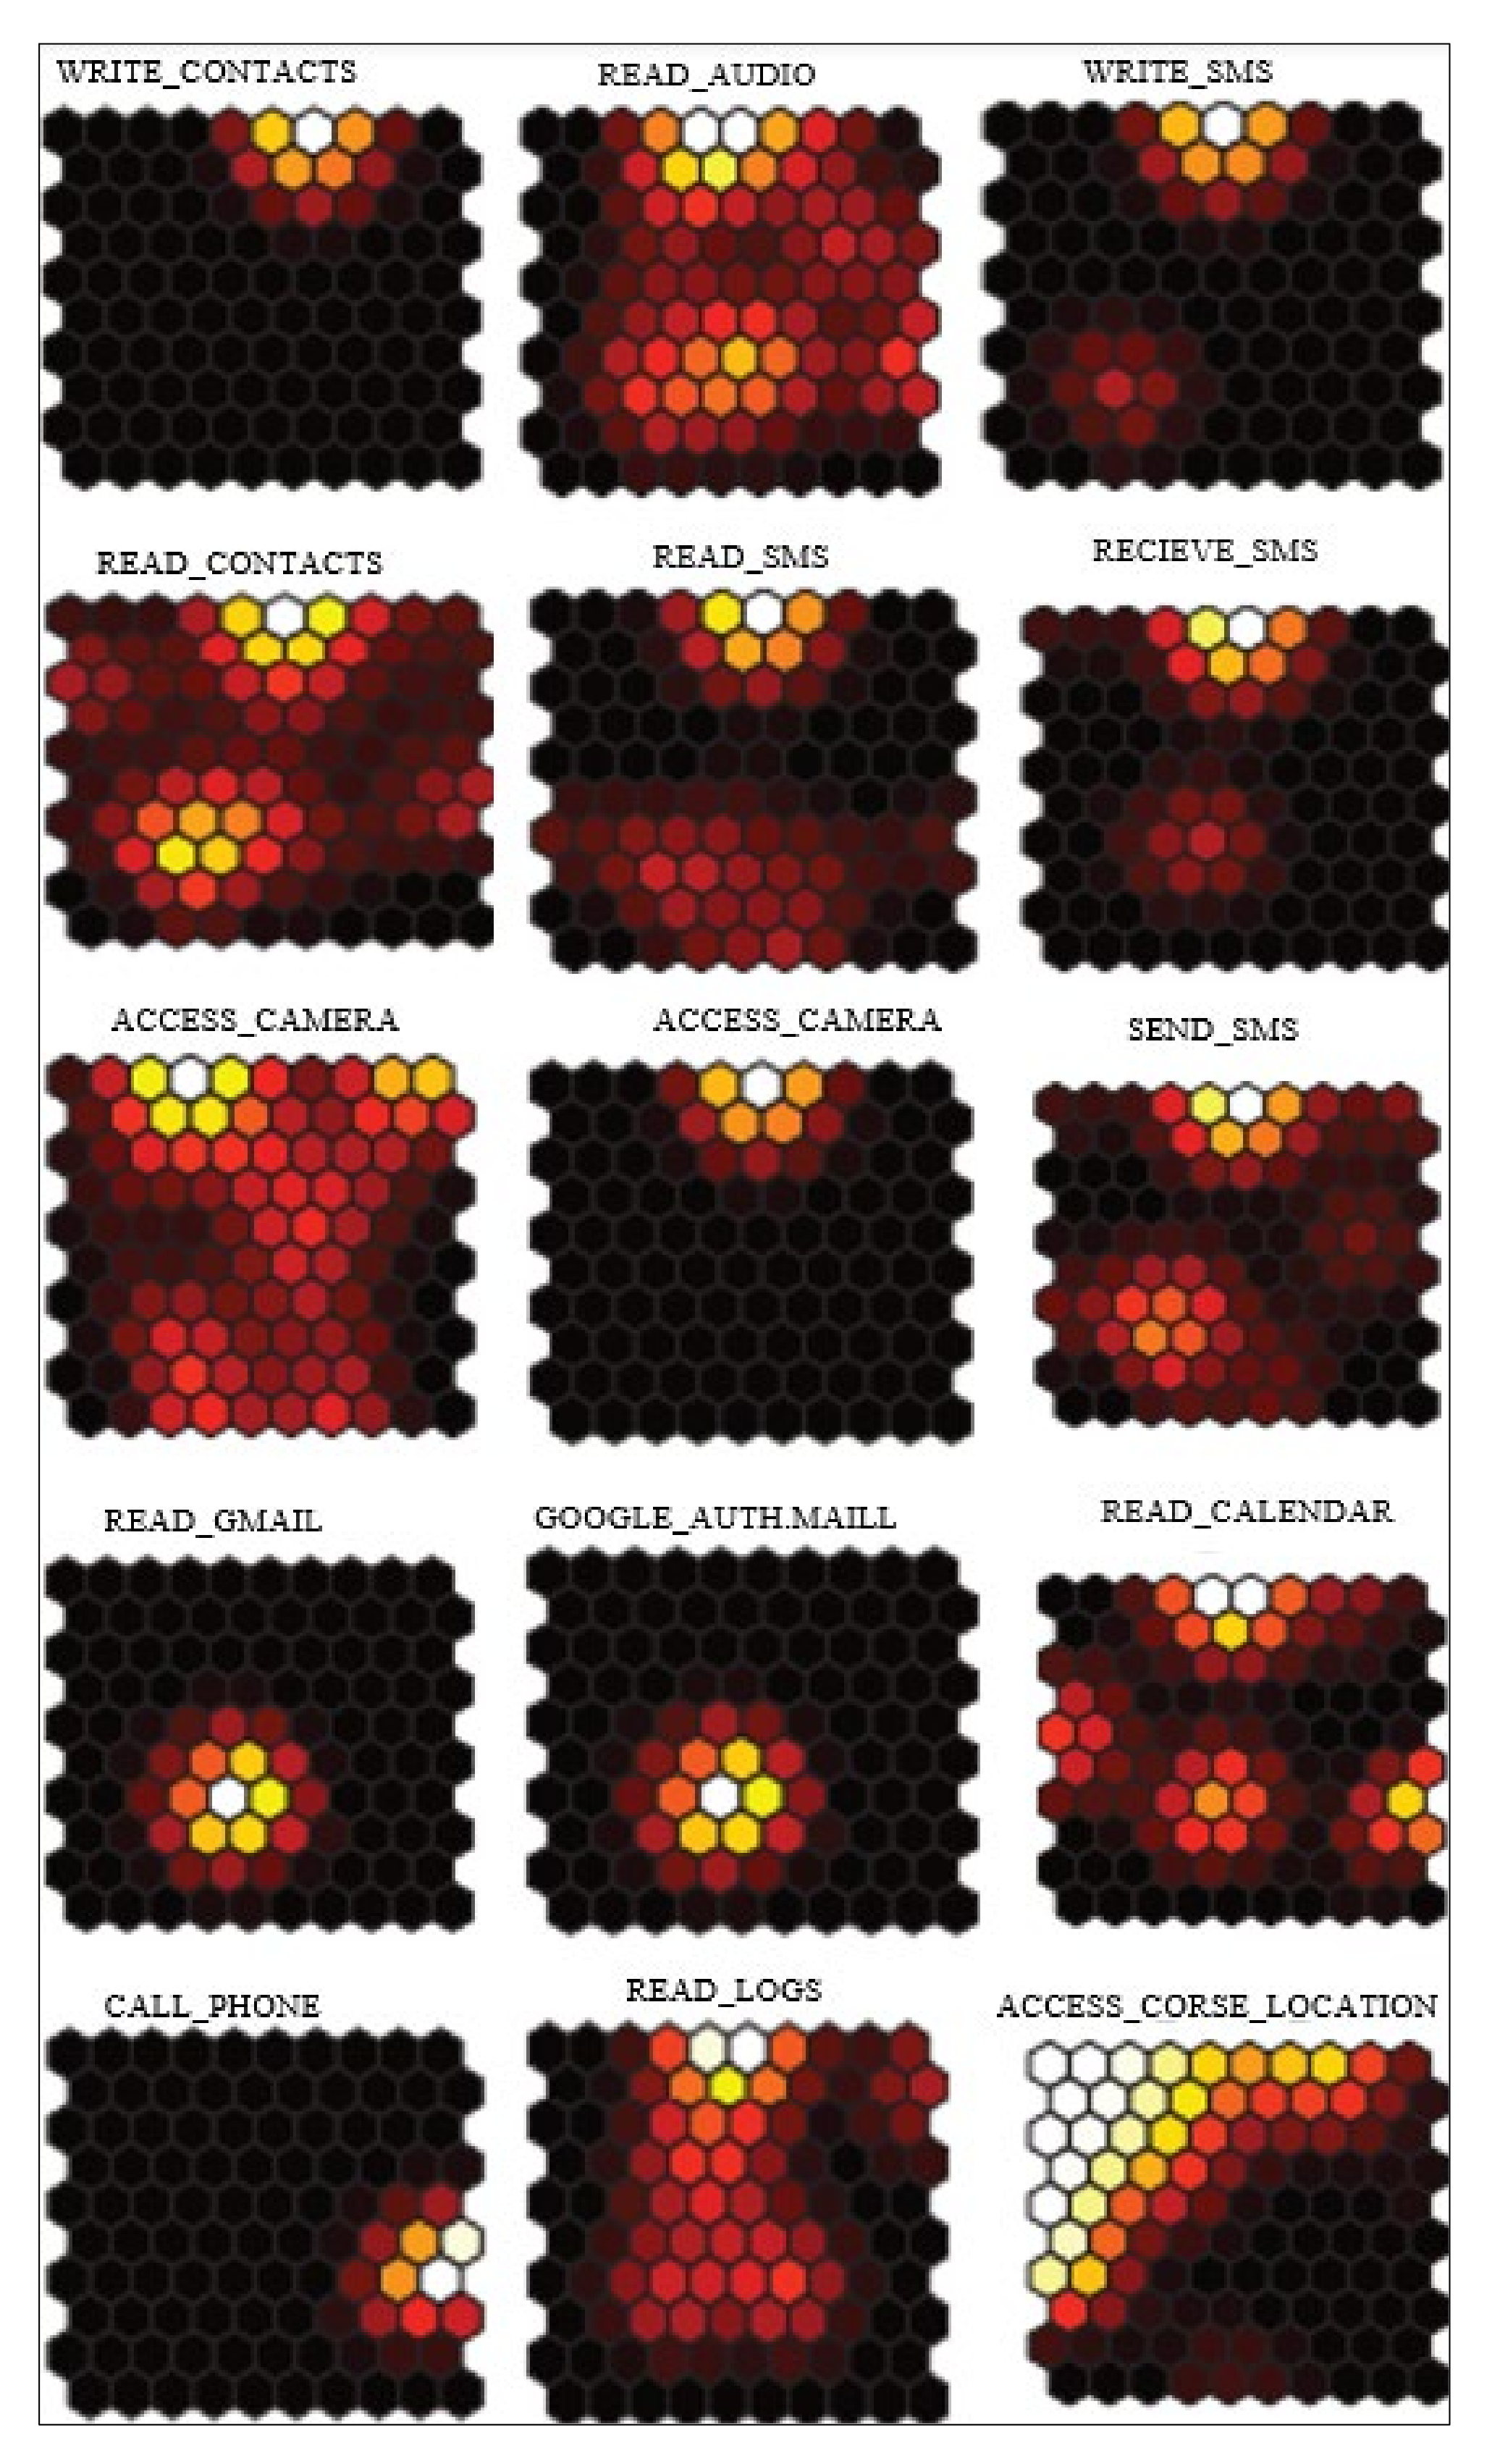
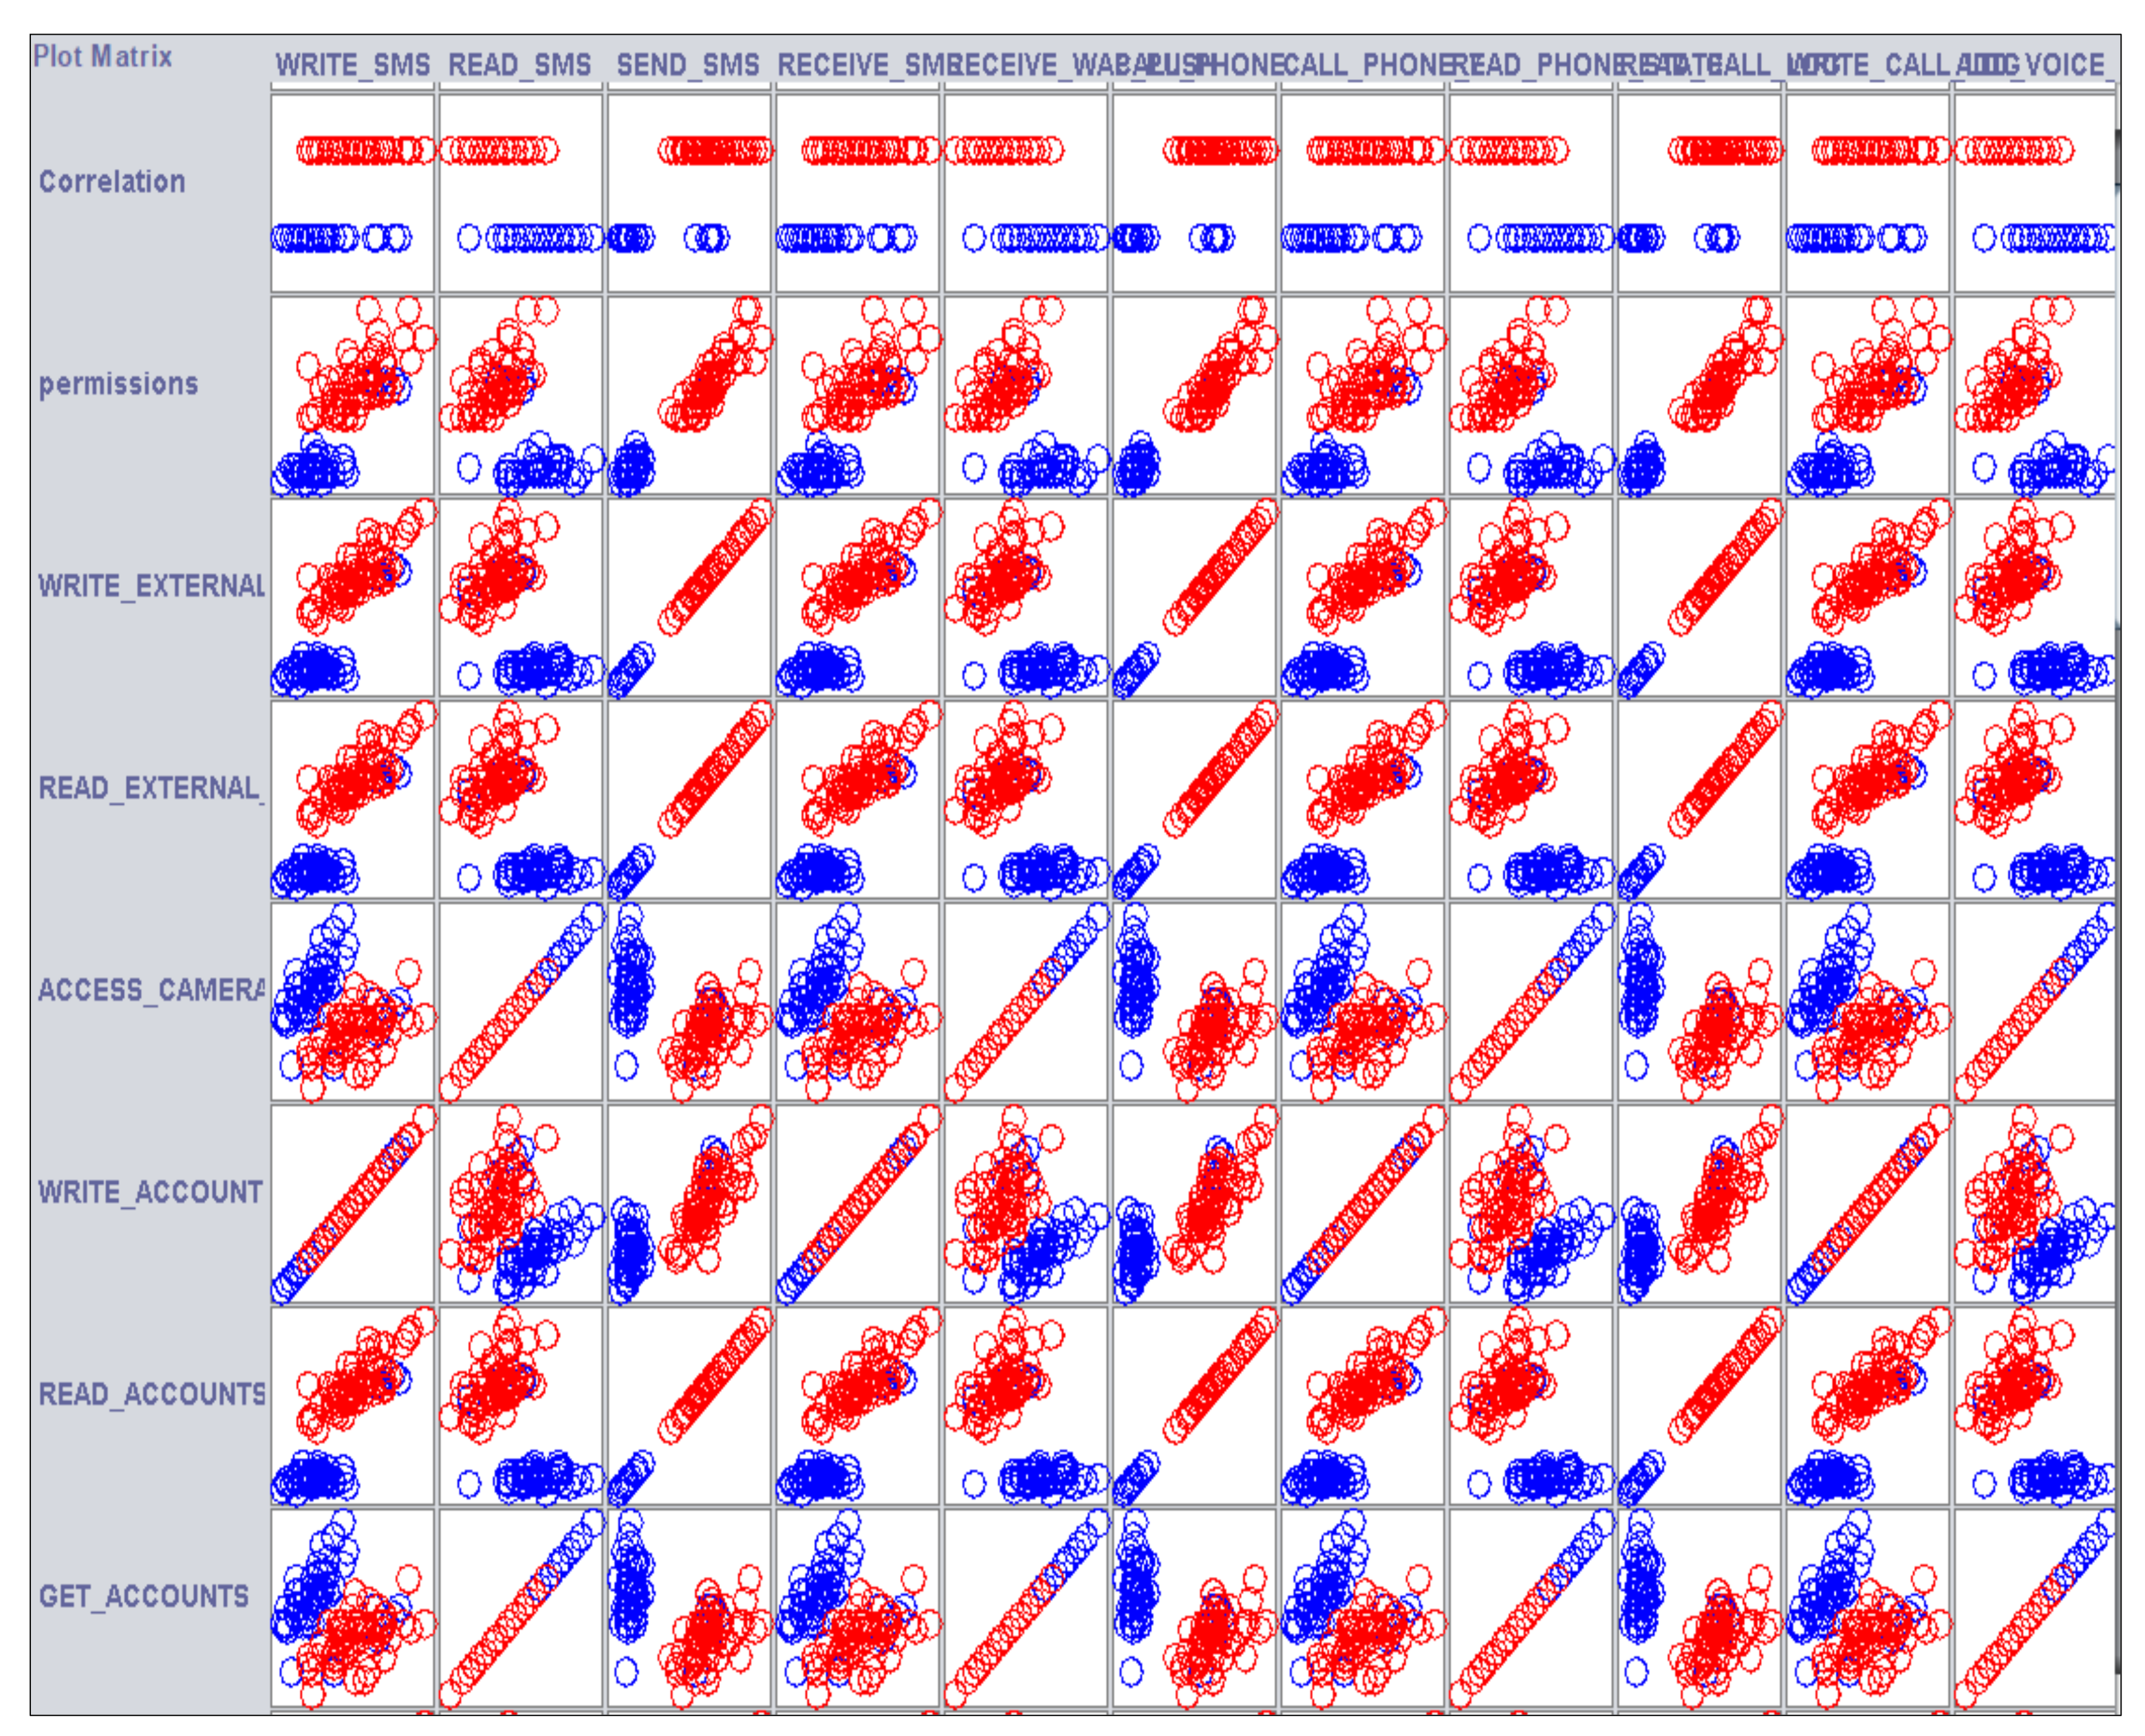
- We present a model for visualizing the correlation between Android permissions using the t-Distribution stochastic neighbor embedding (t-SNE) and Self-Organizing Map (SOM) techniques.
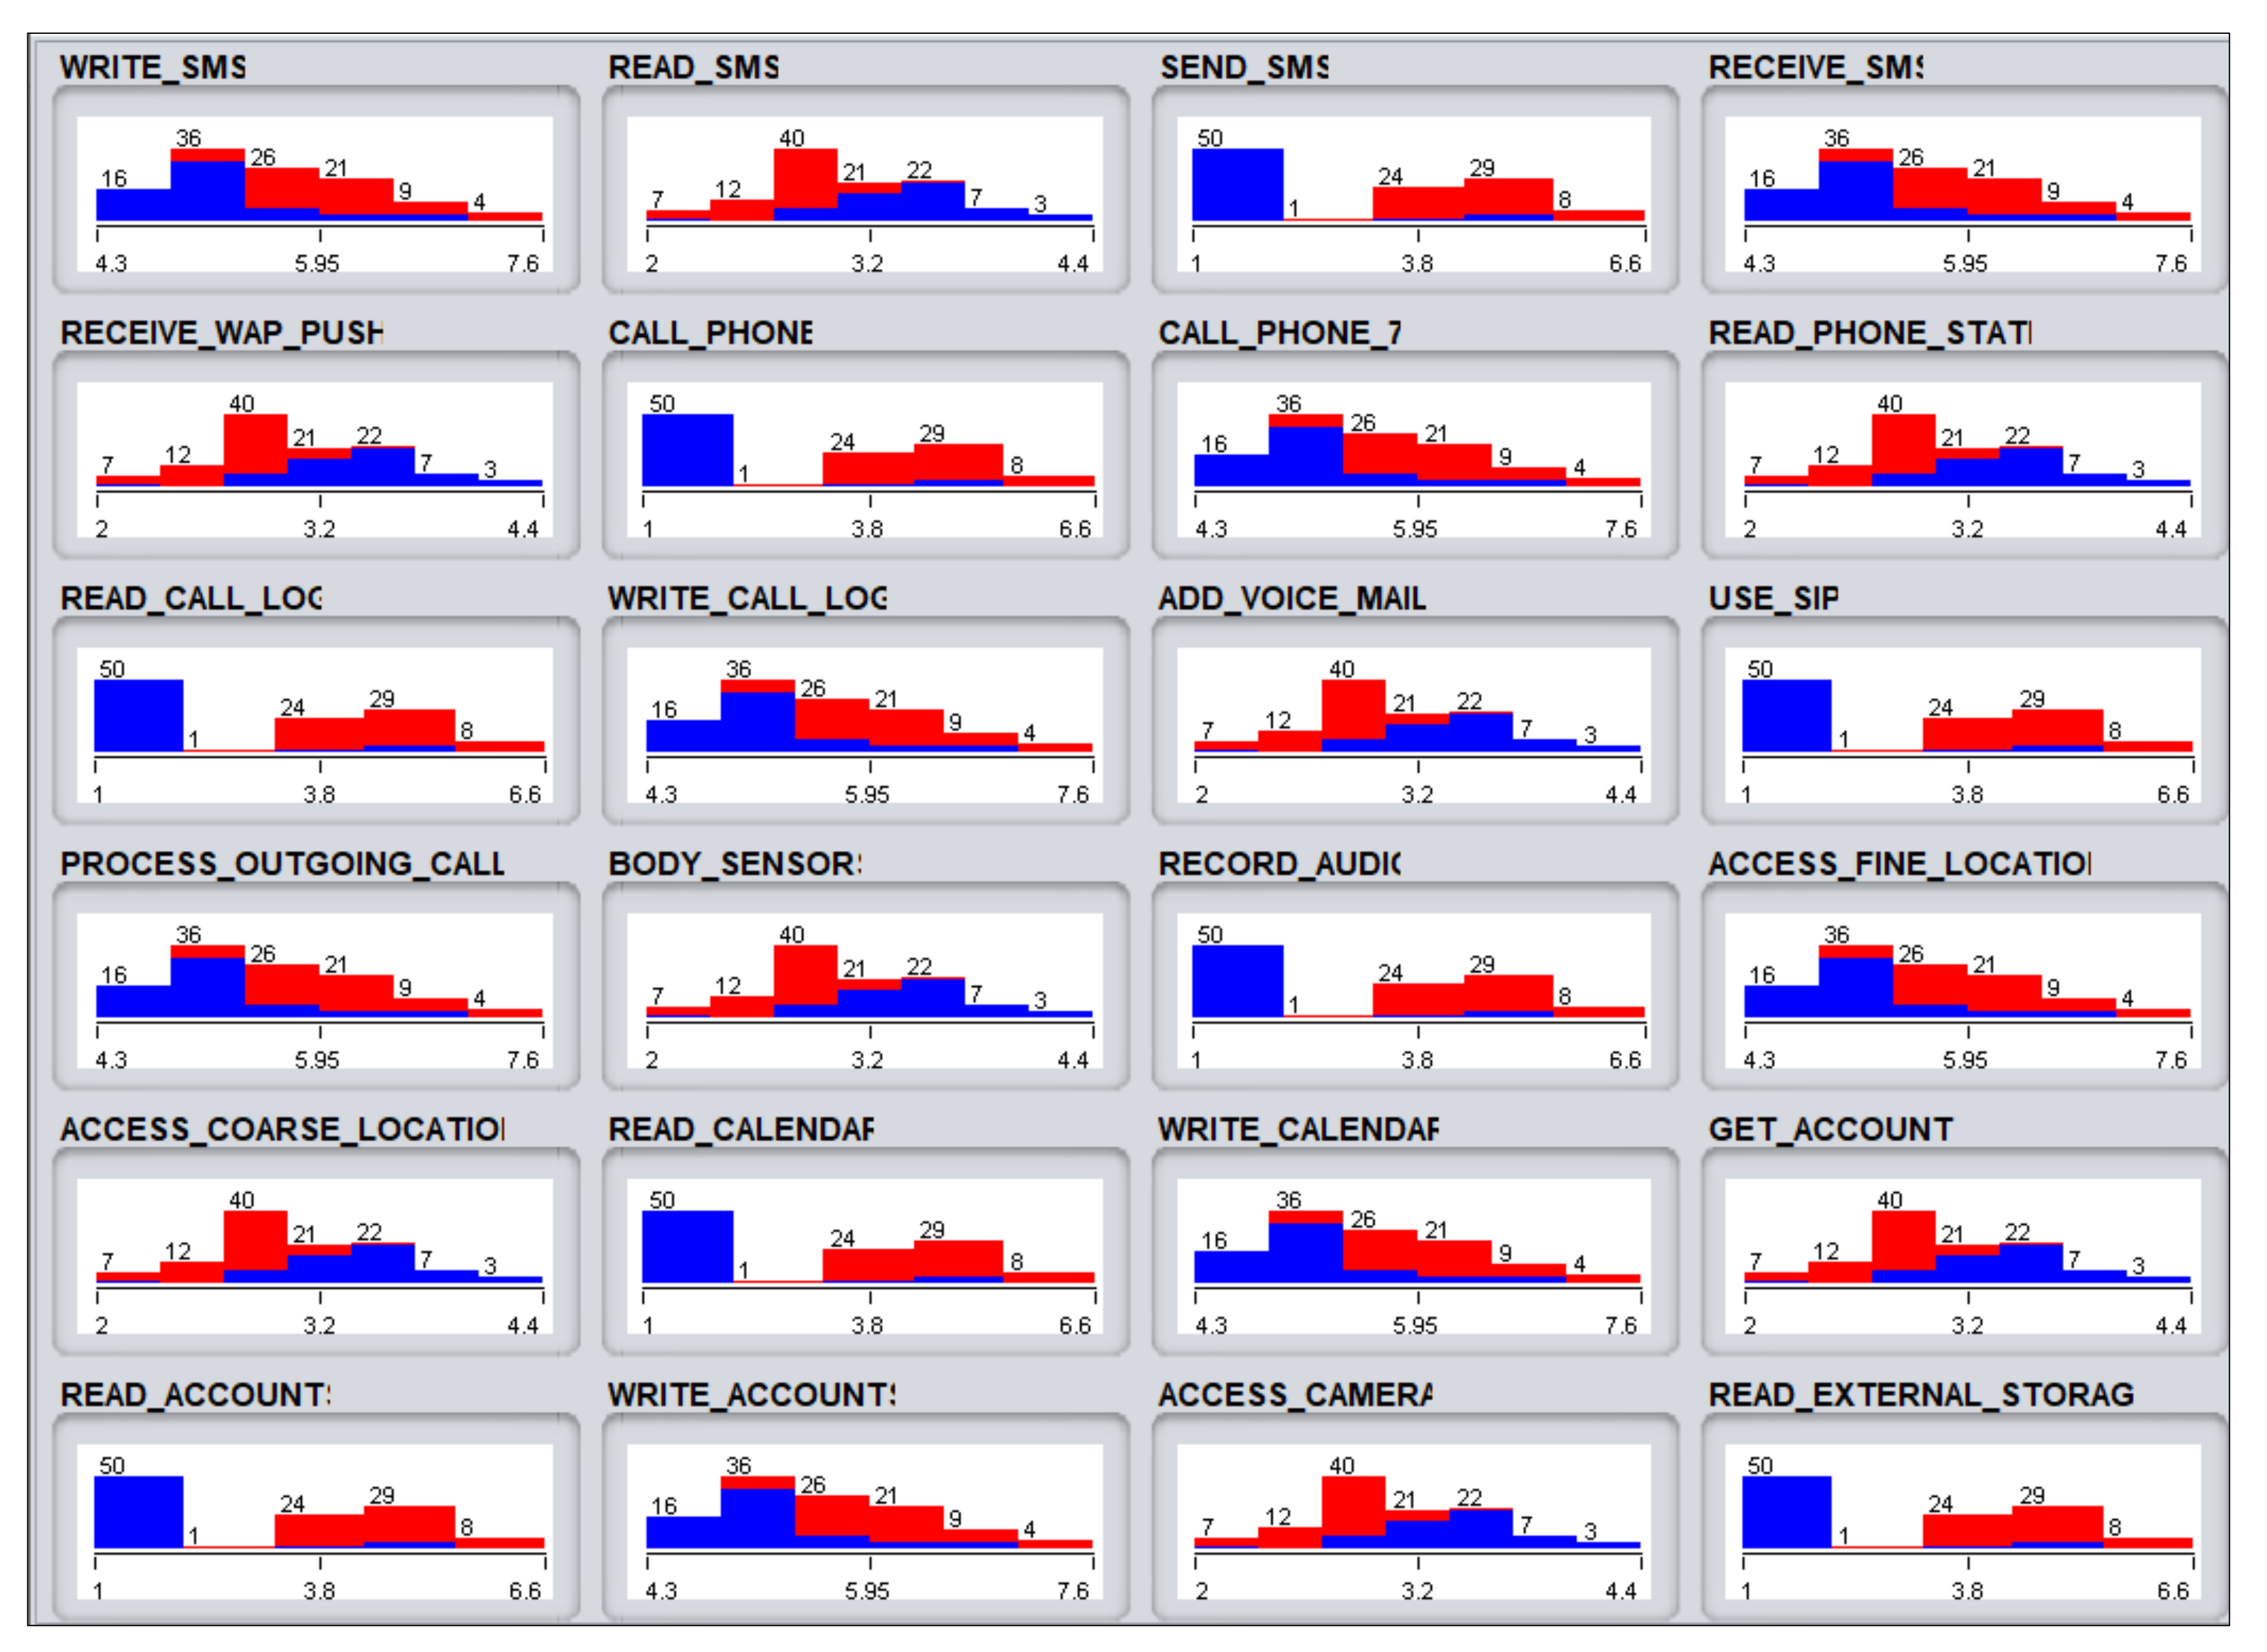
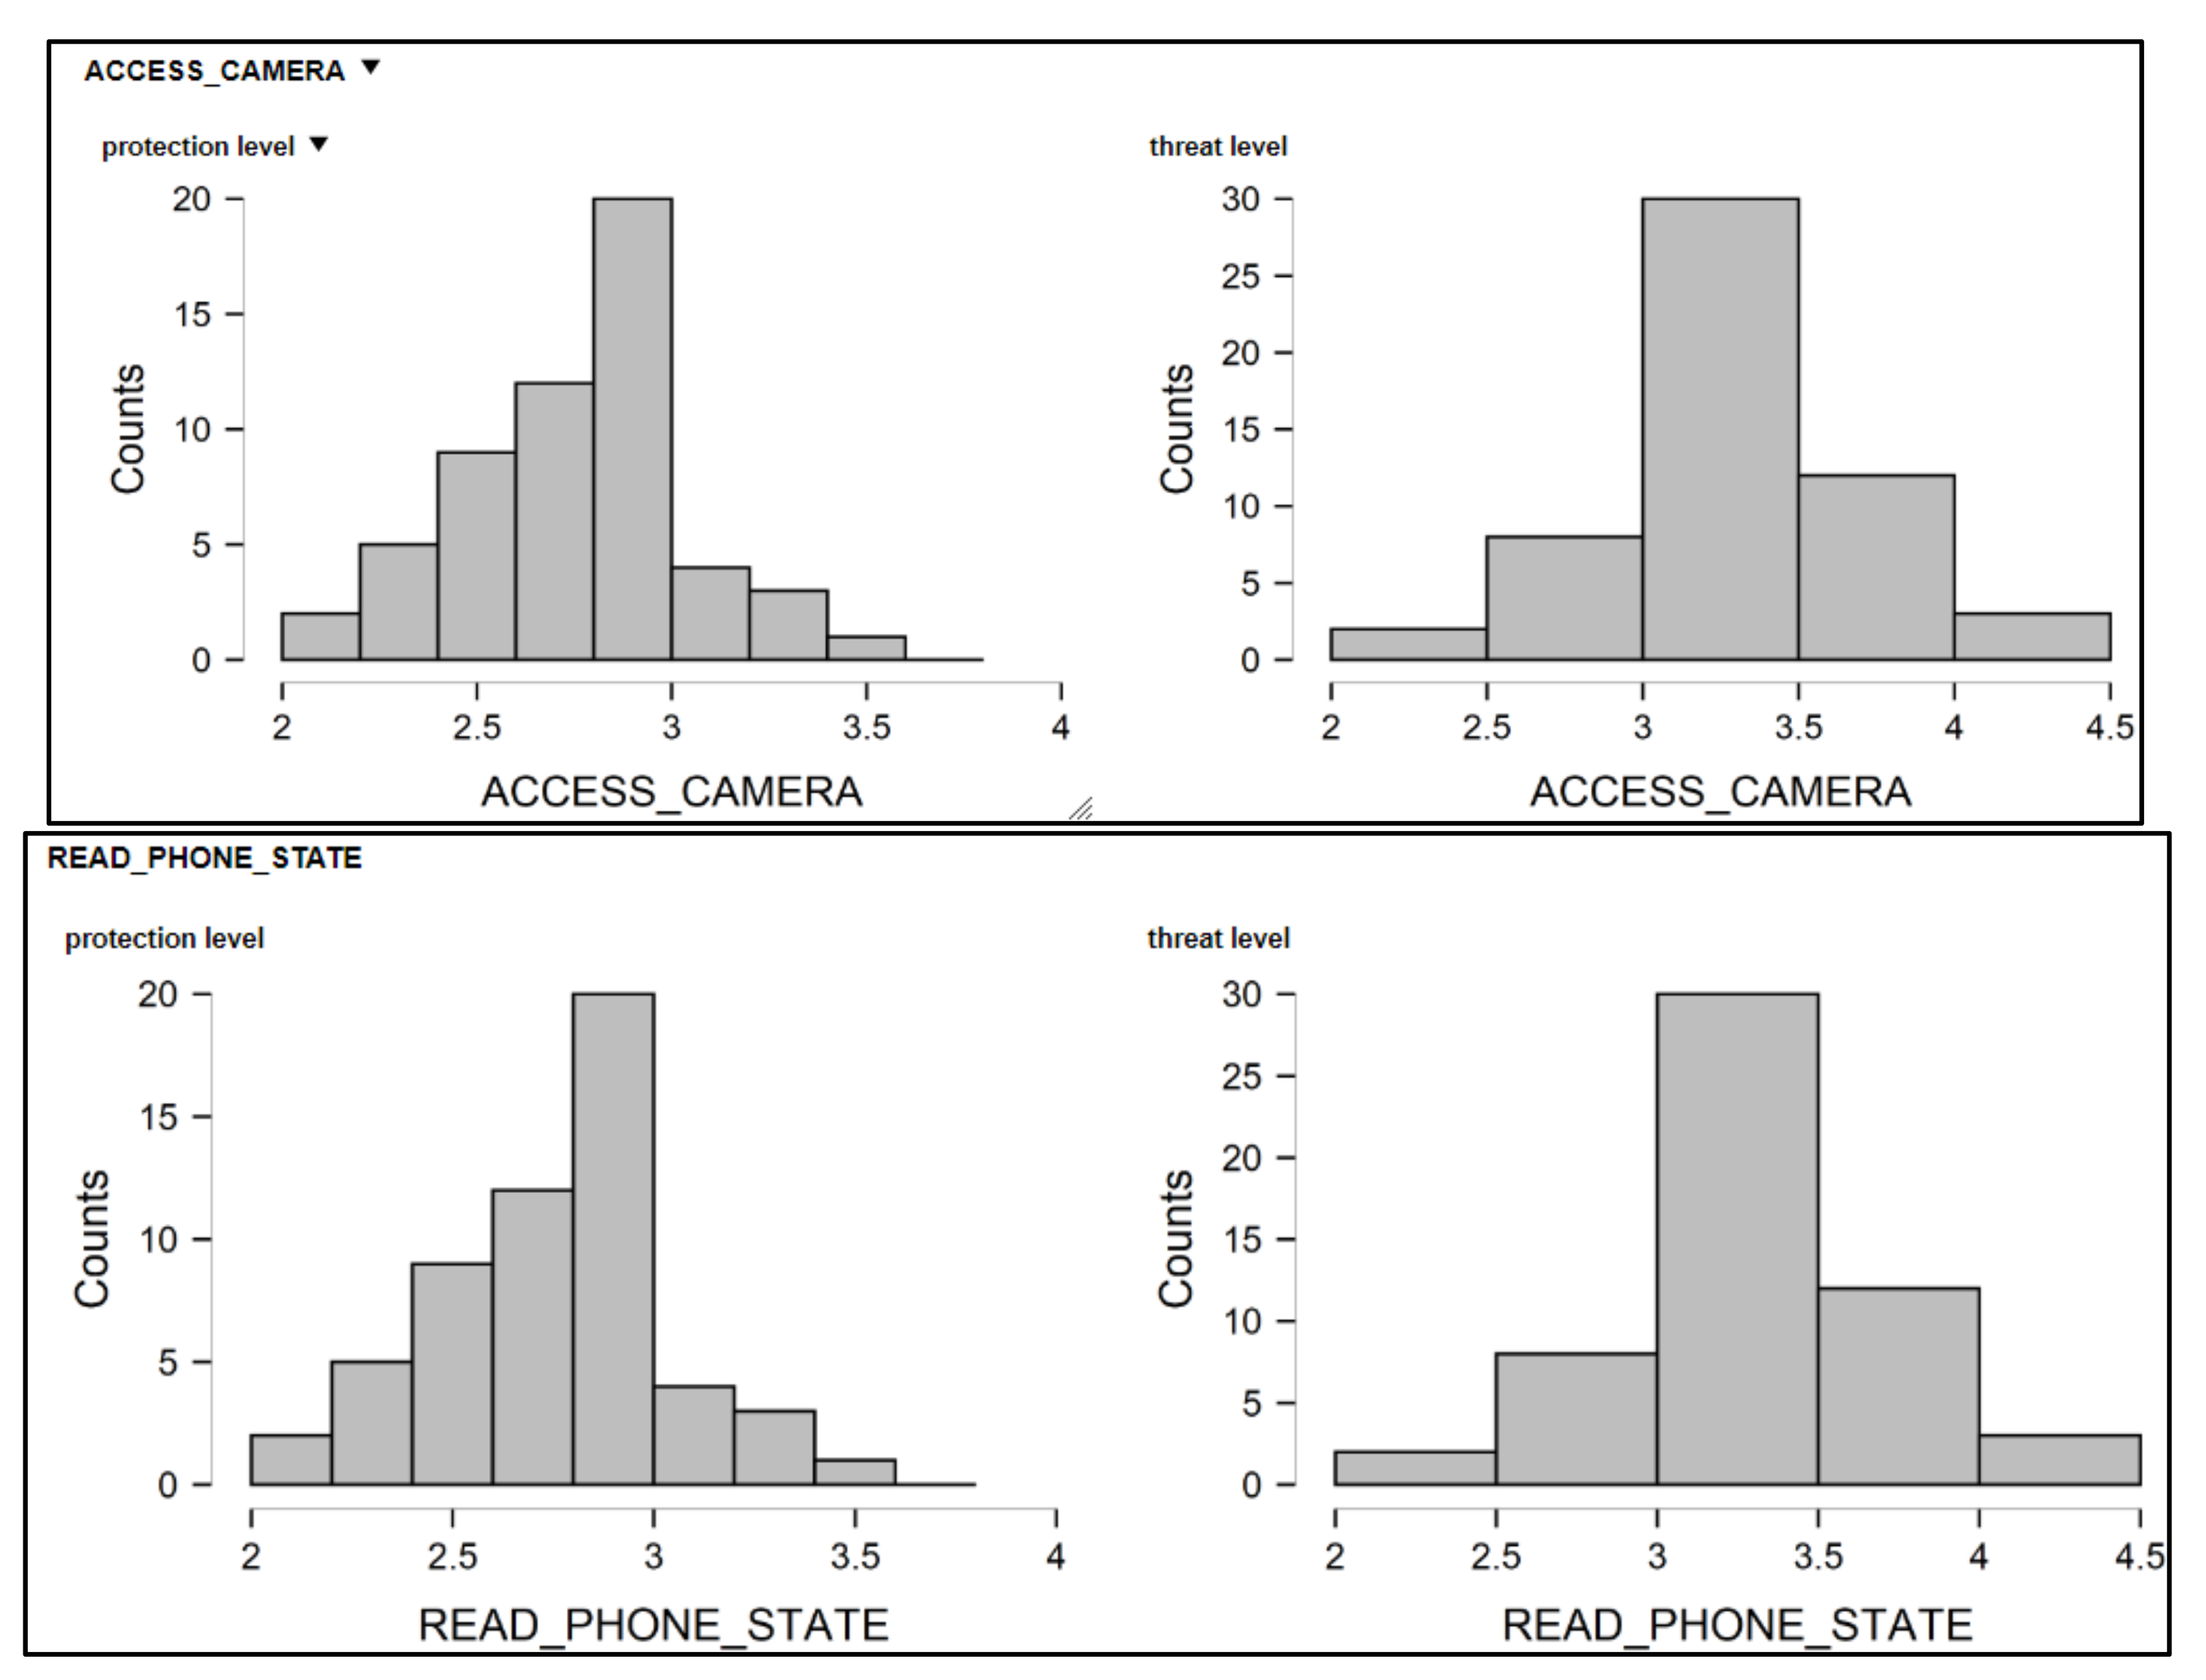
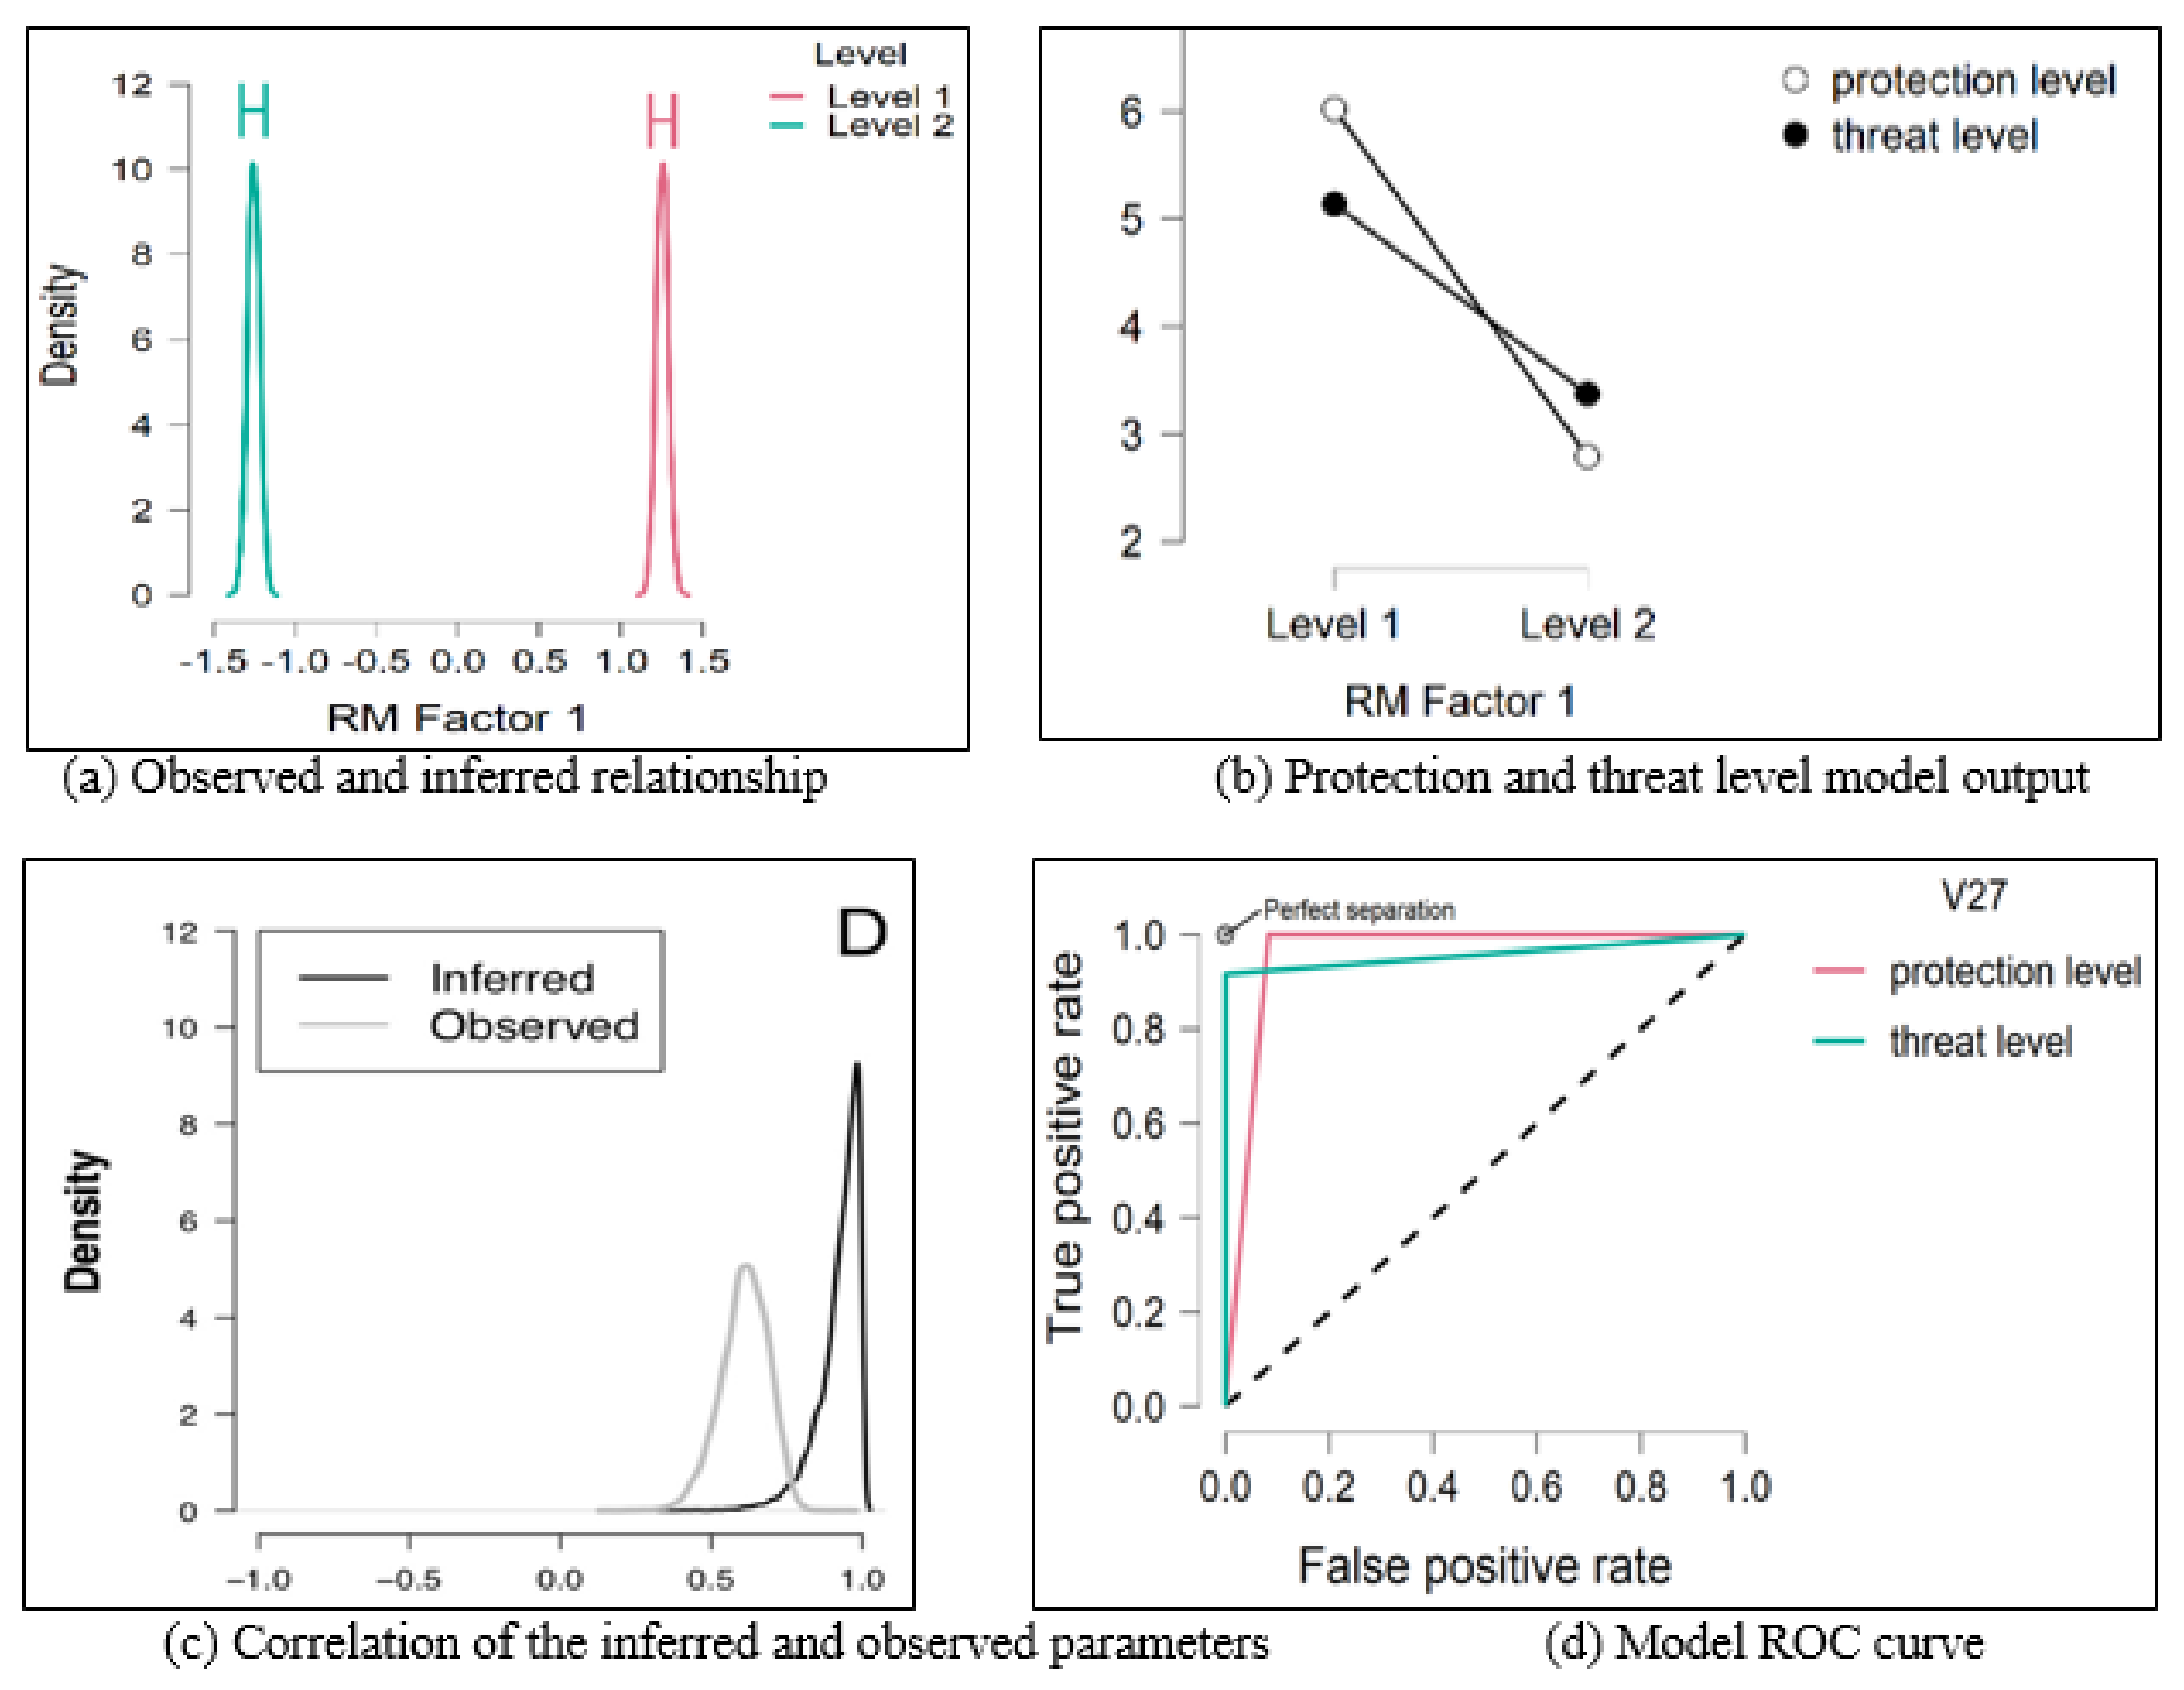
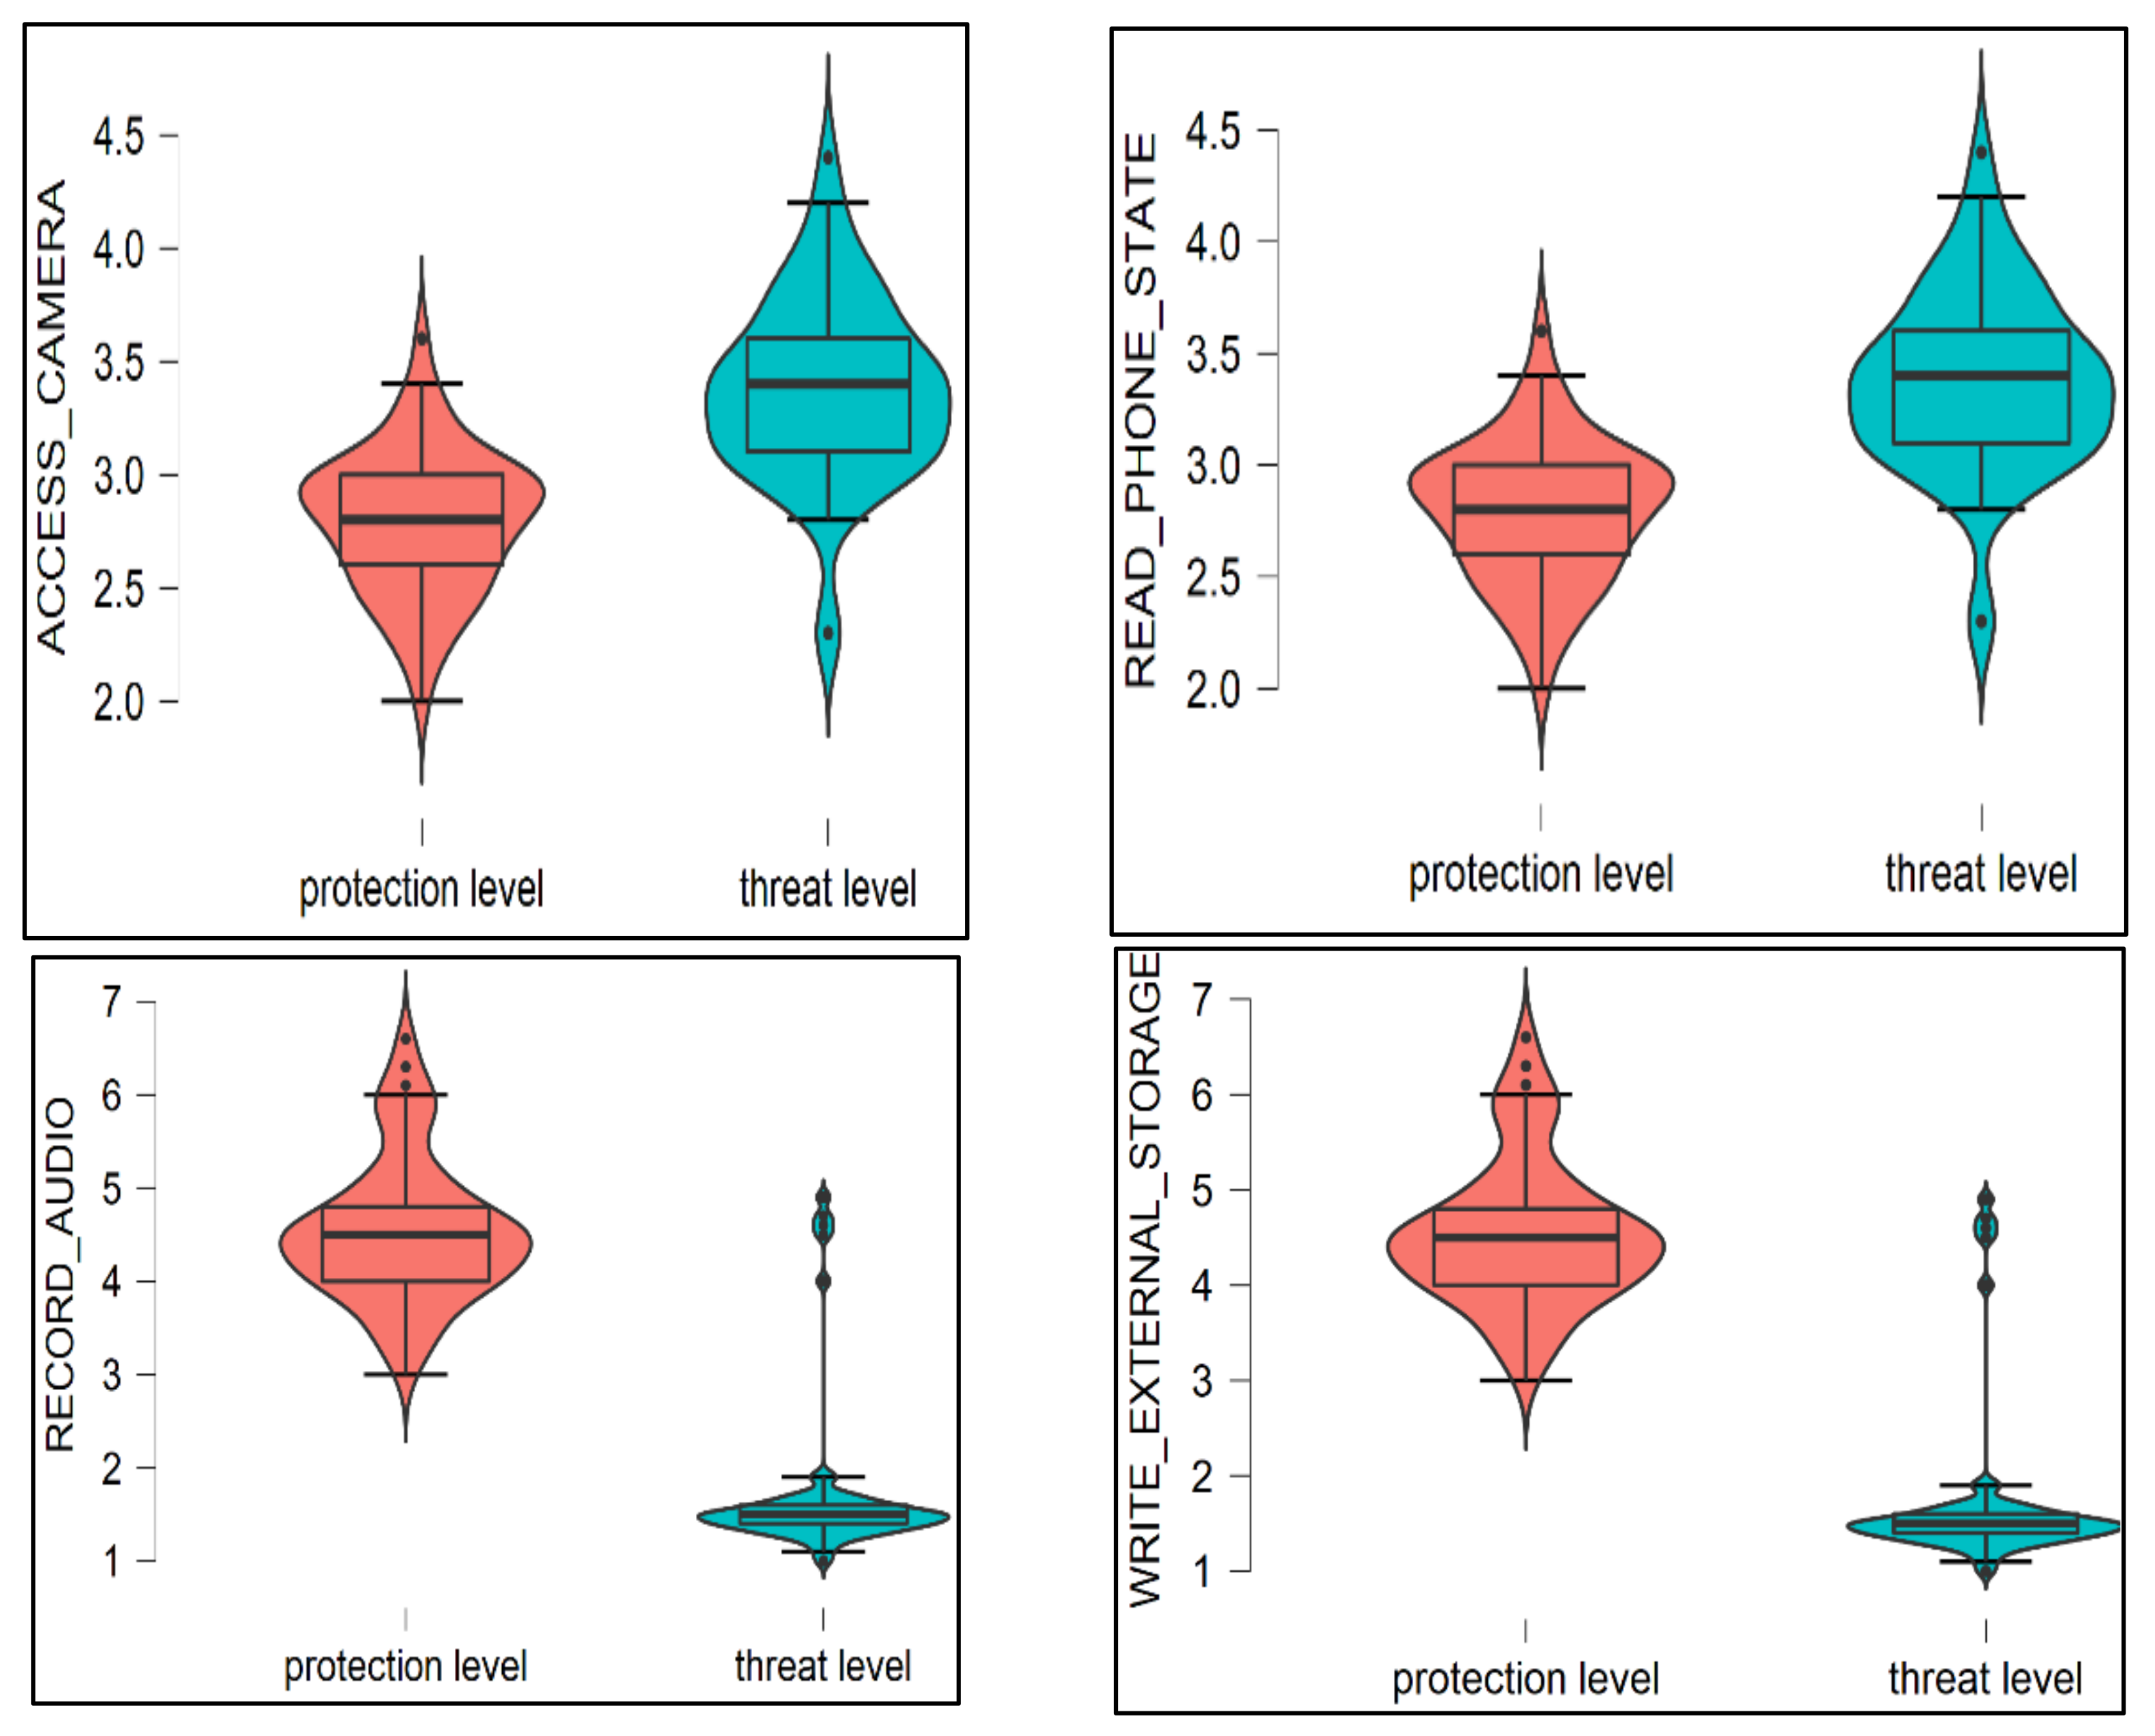
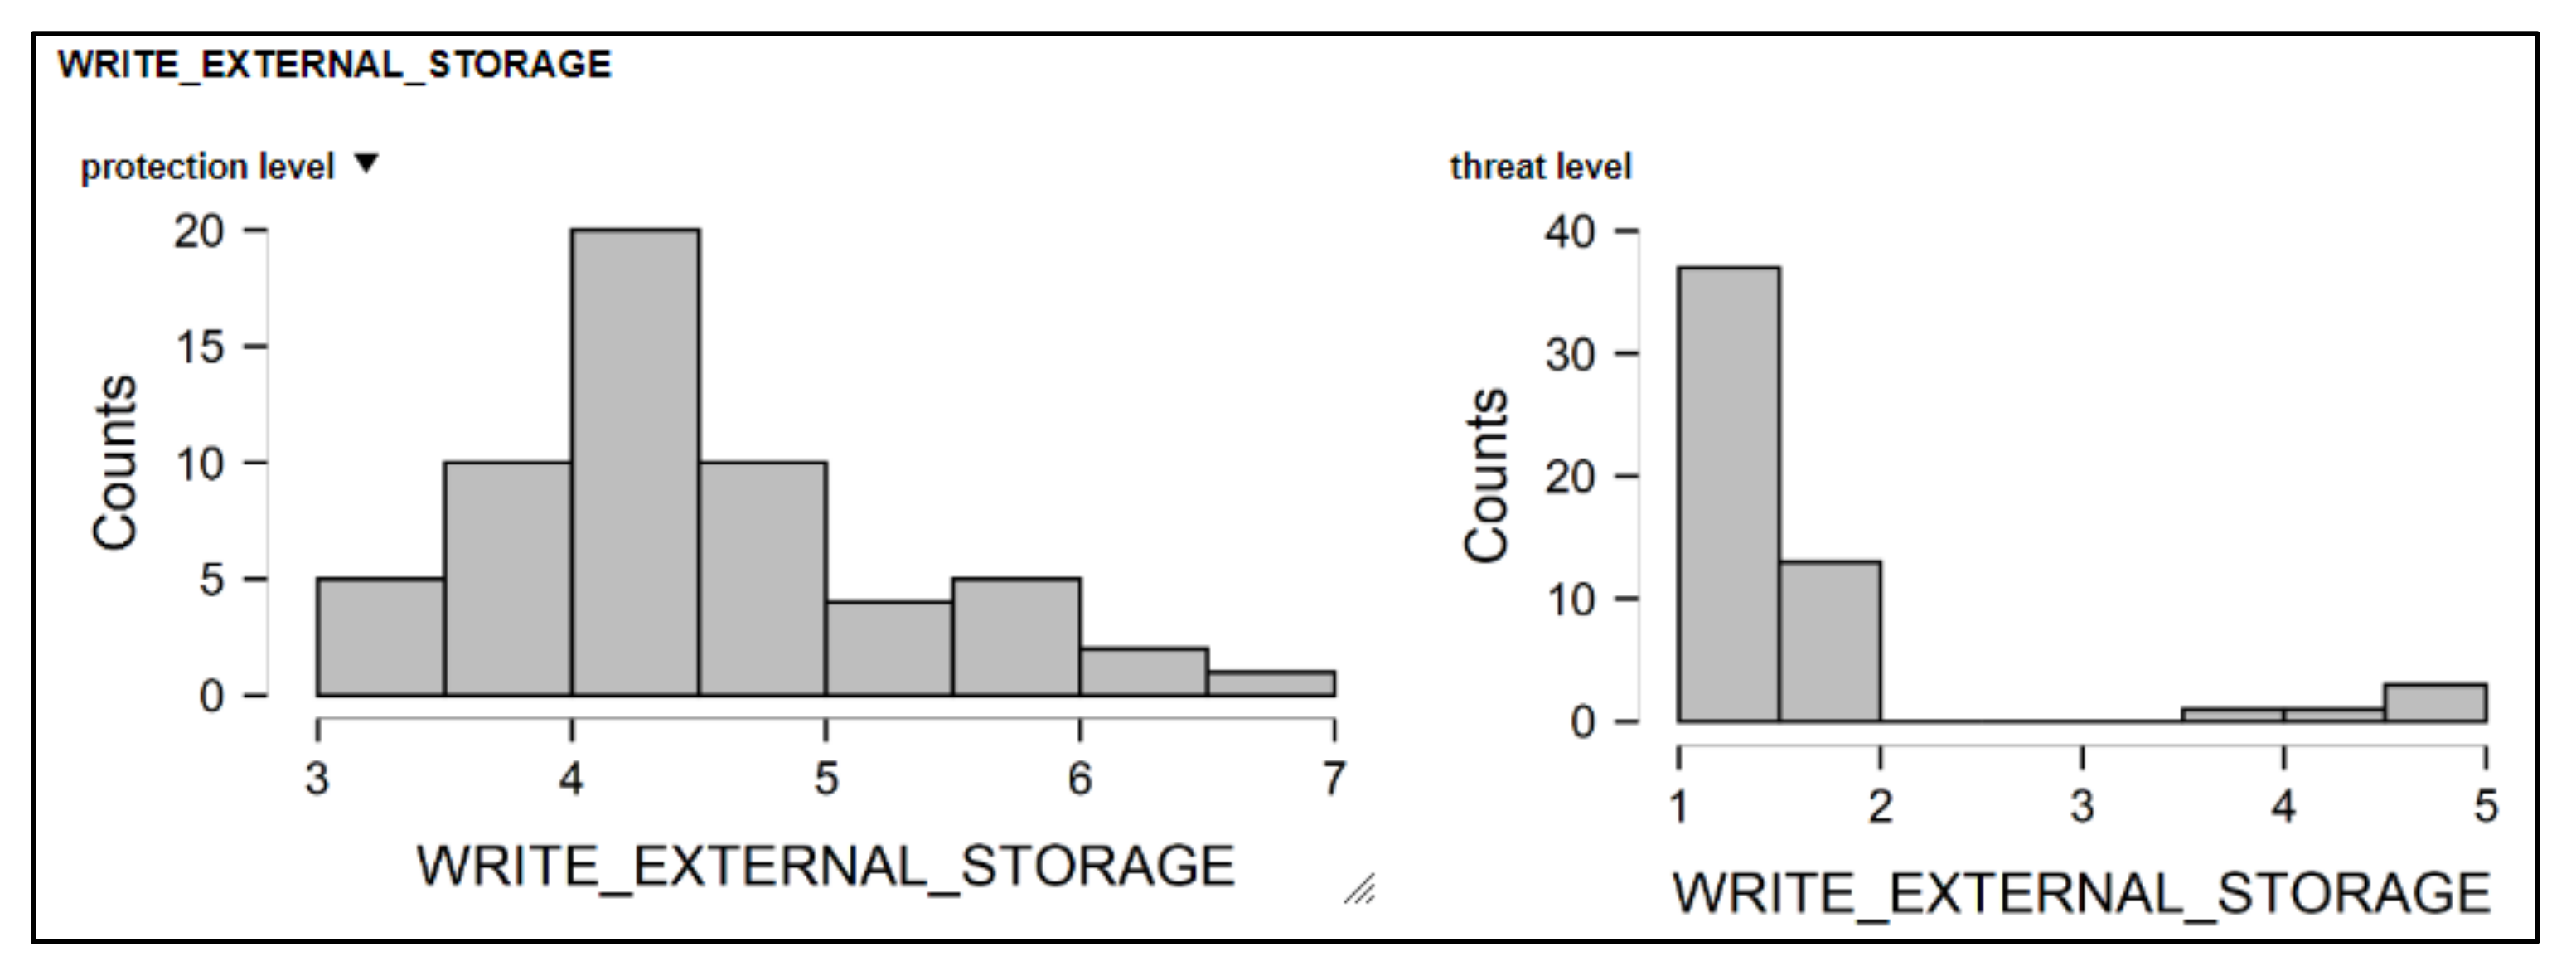
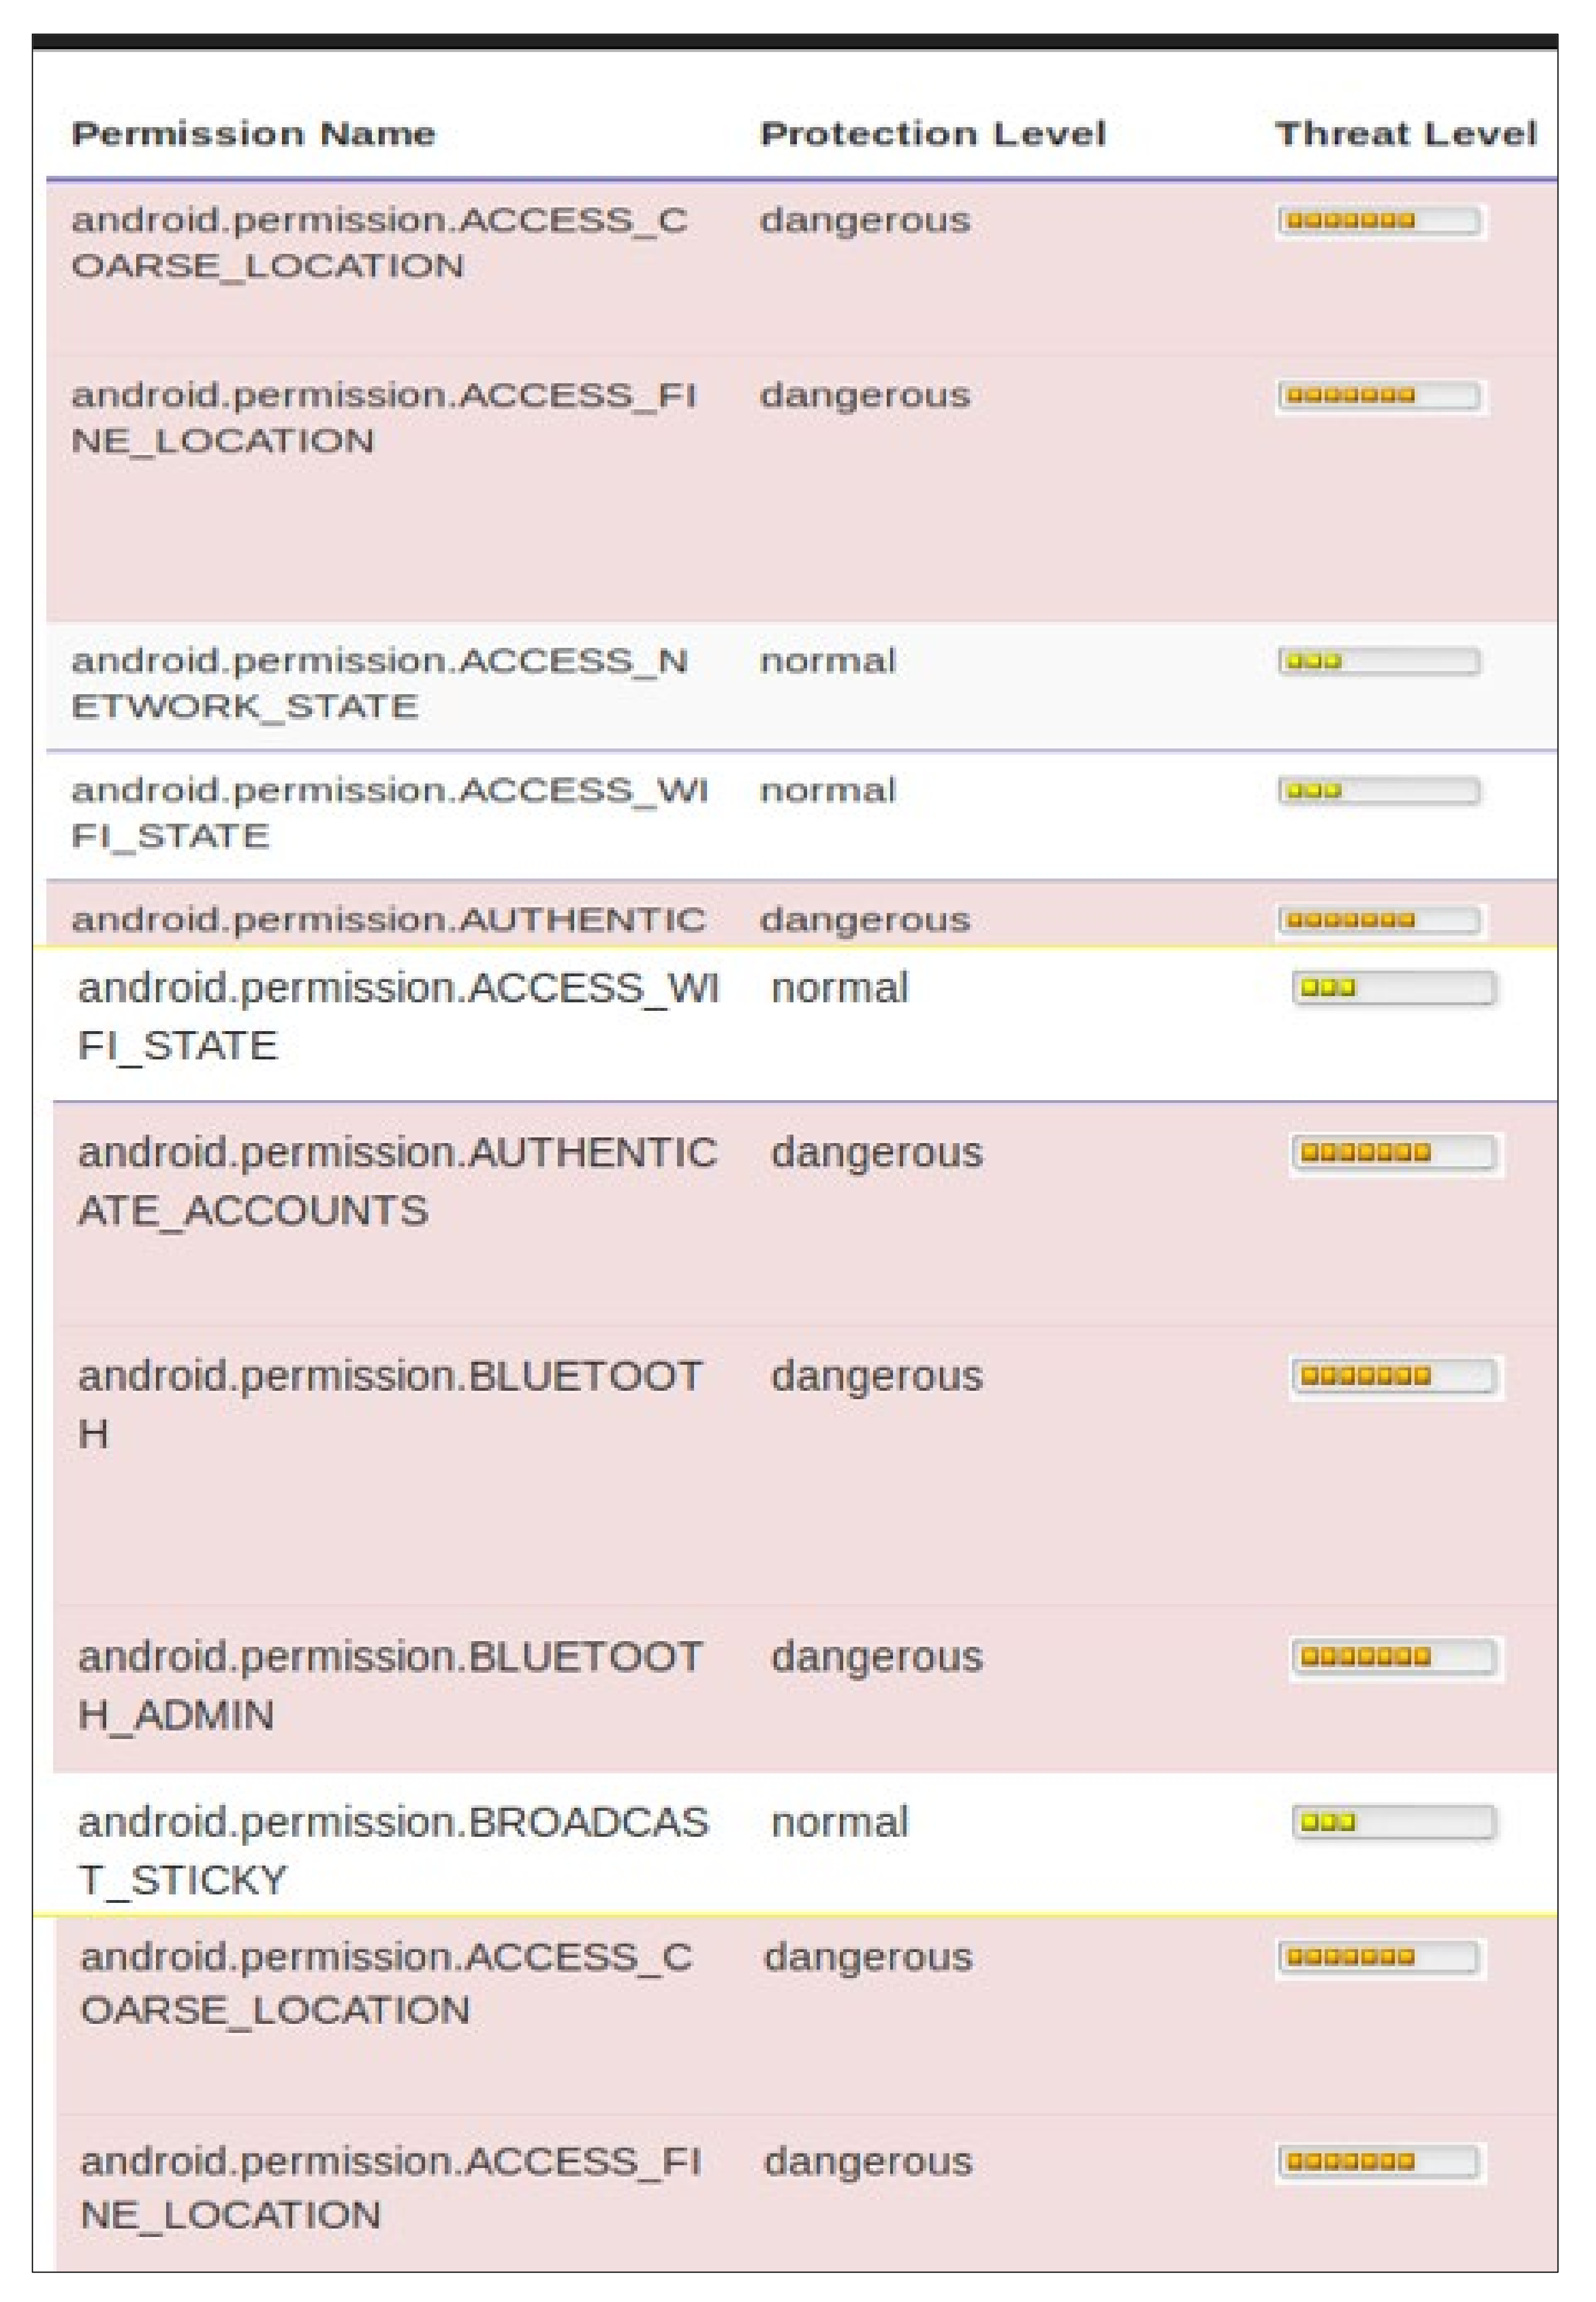
- We demonstrate results that show the relationship between a threat and protection level in Android permissions using exploratory factor plane analysis. The results show that every permission, whether normal or dangerous, has a threat level.
- We identify that Android permissions with the same protection level have the same threat level. However, the threat level in the individual applications differ.
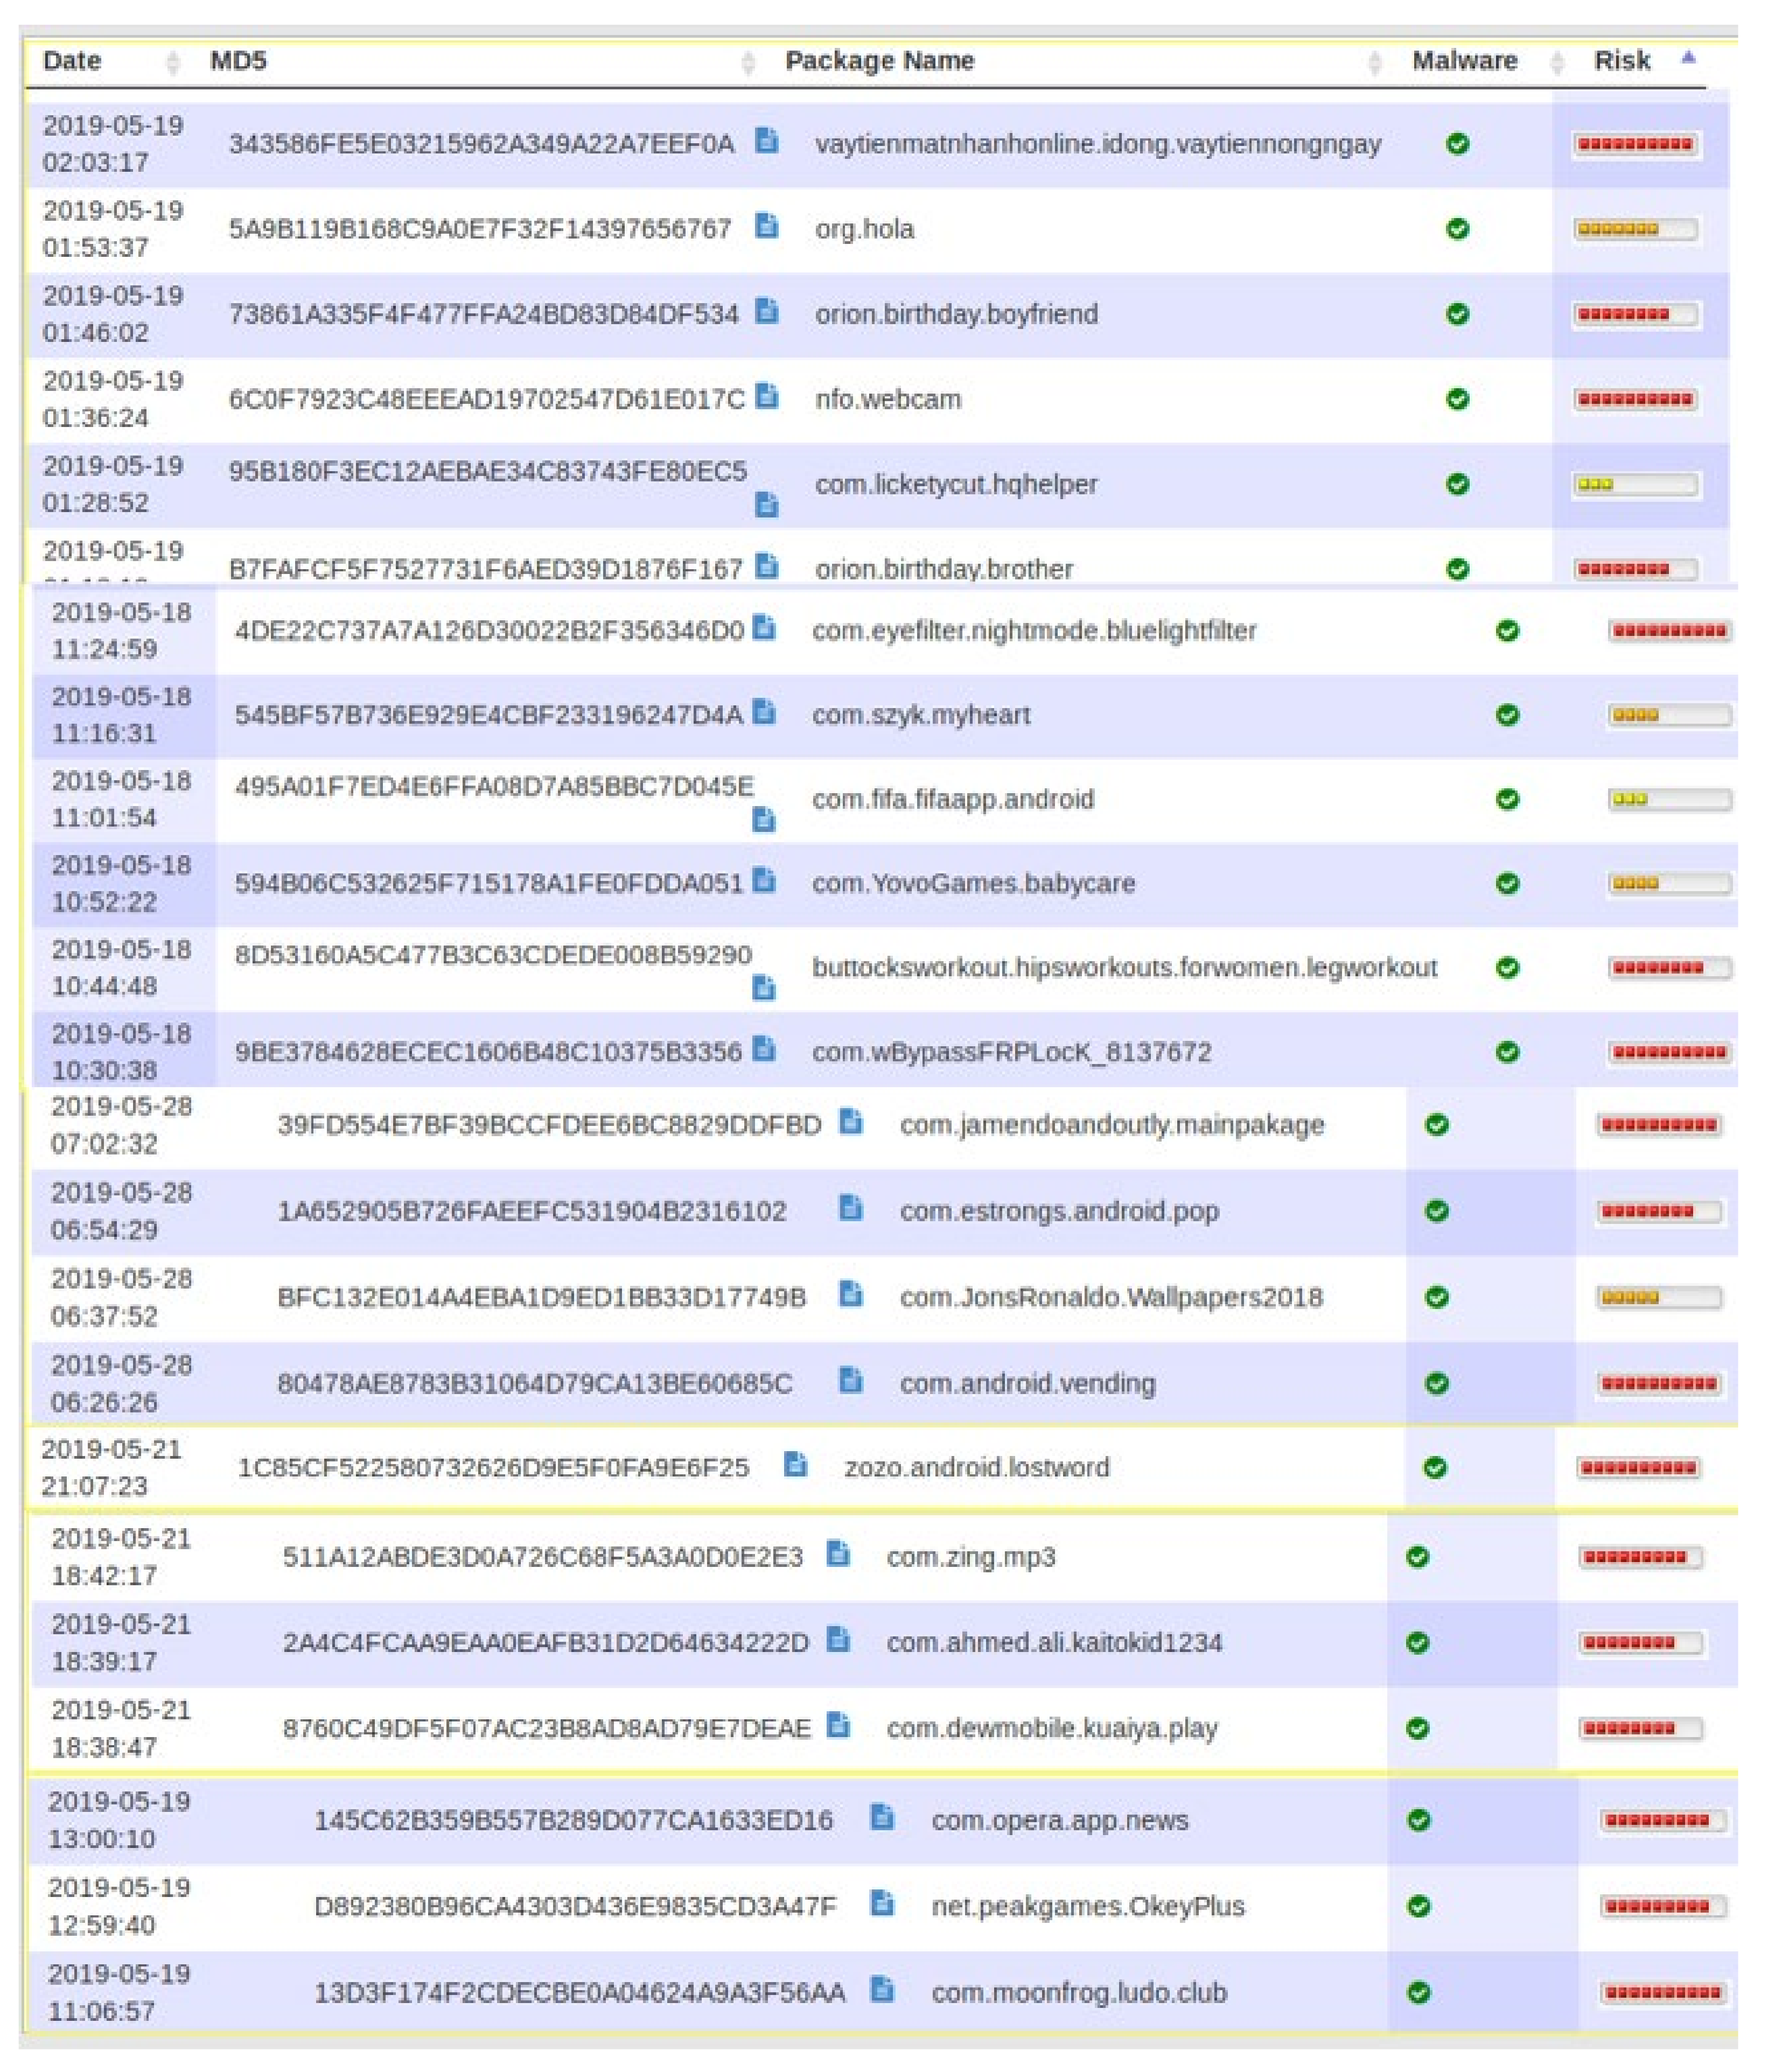
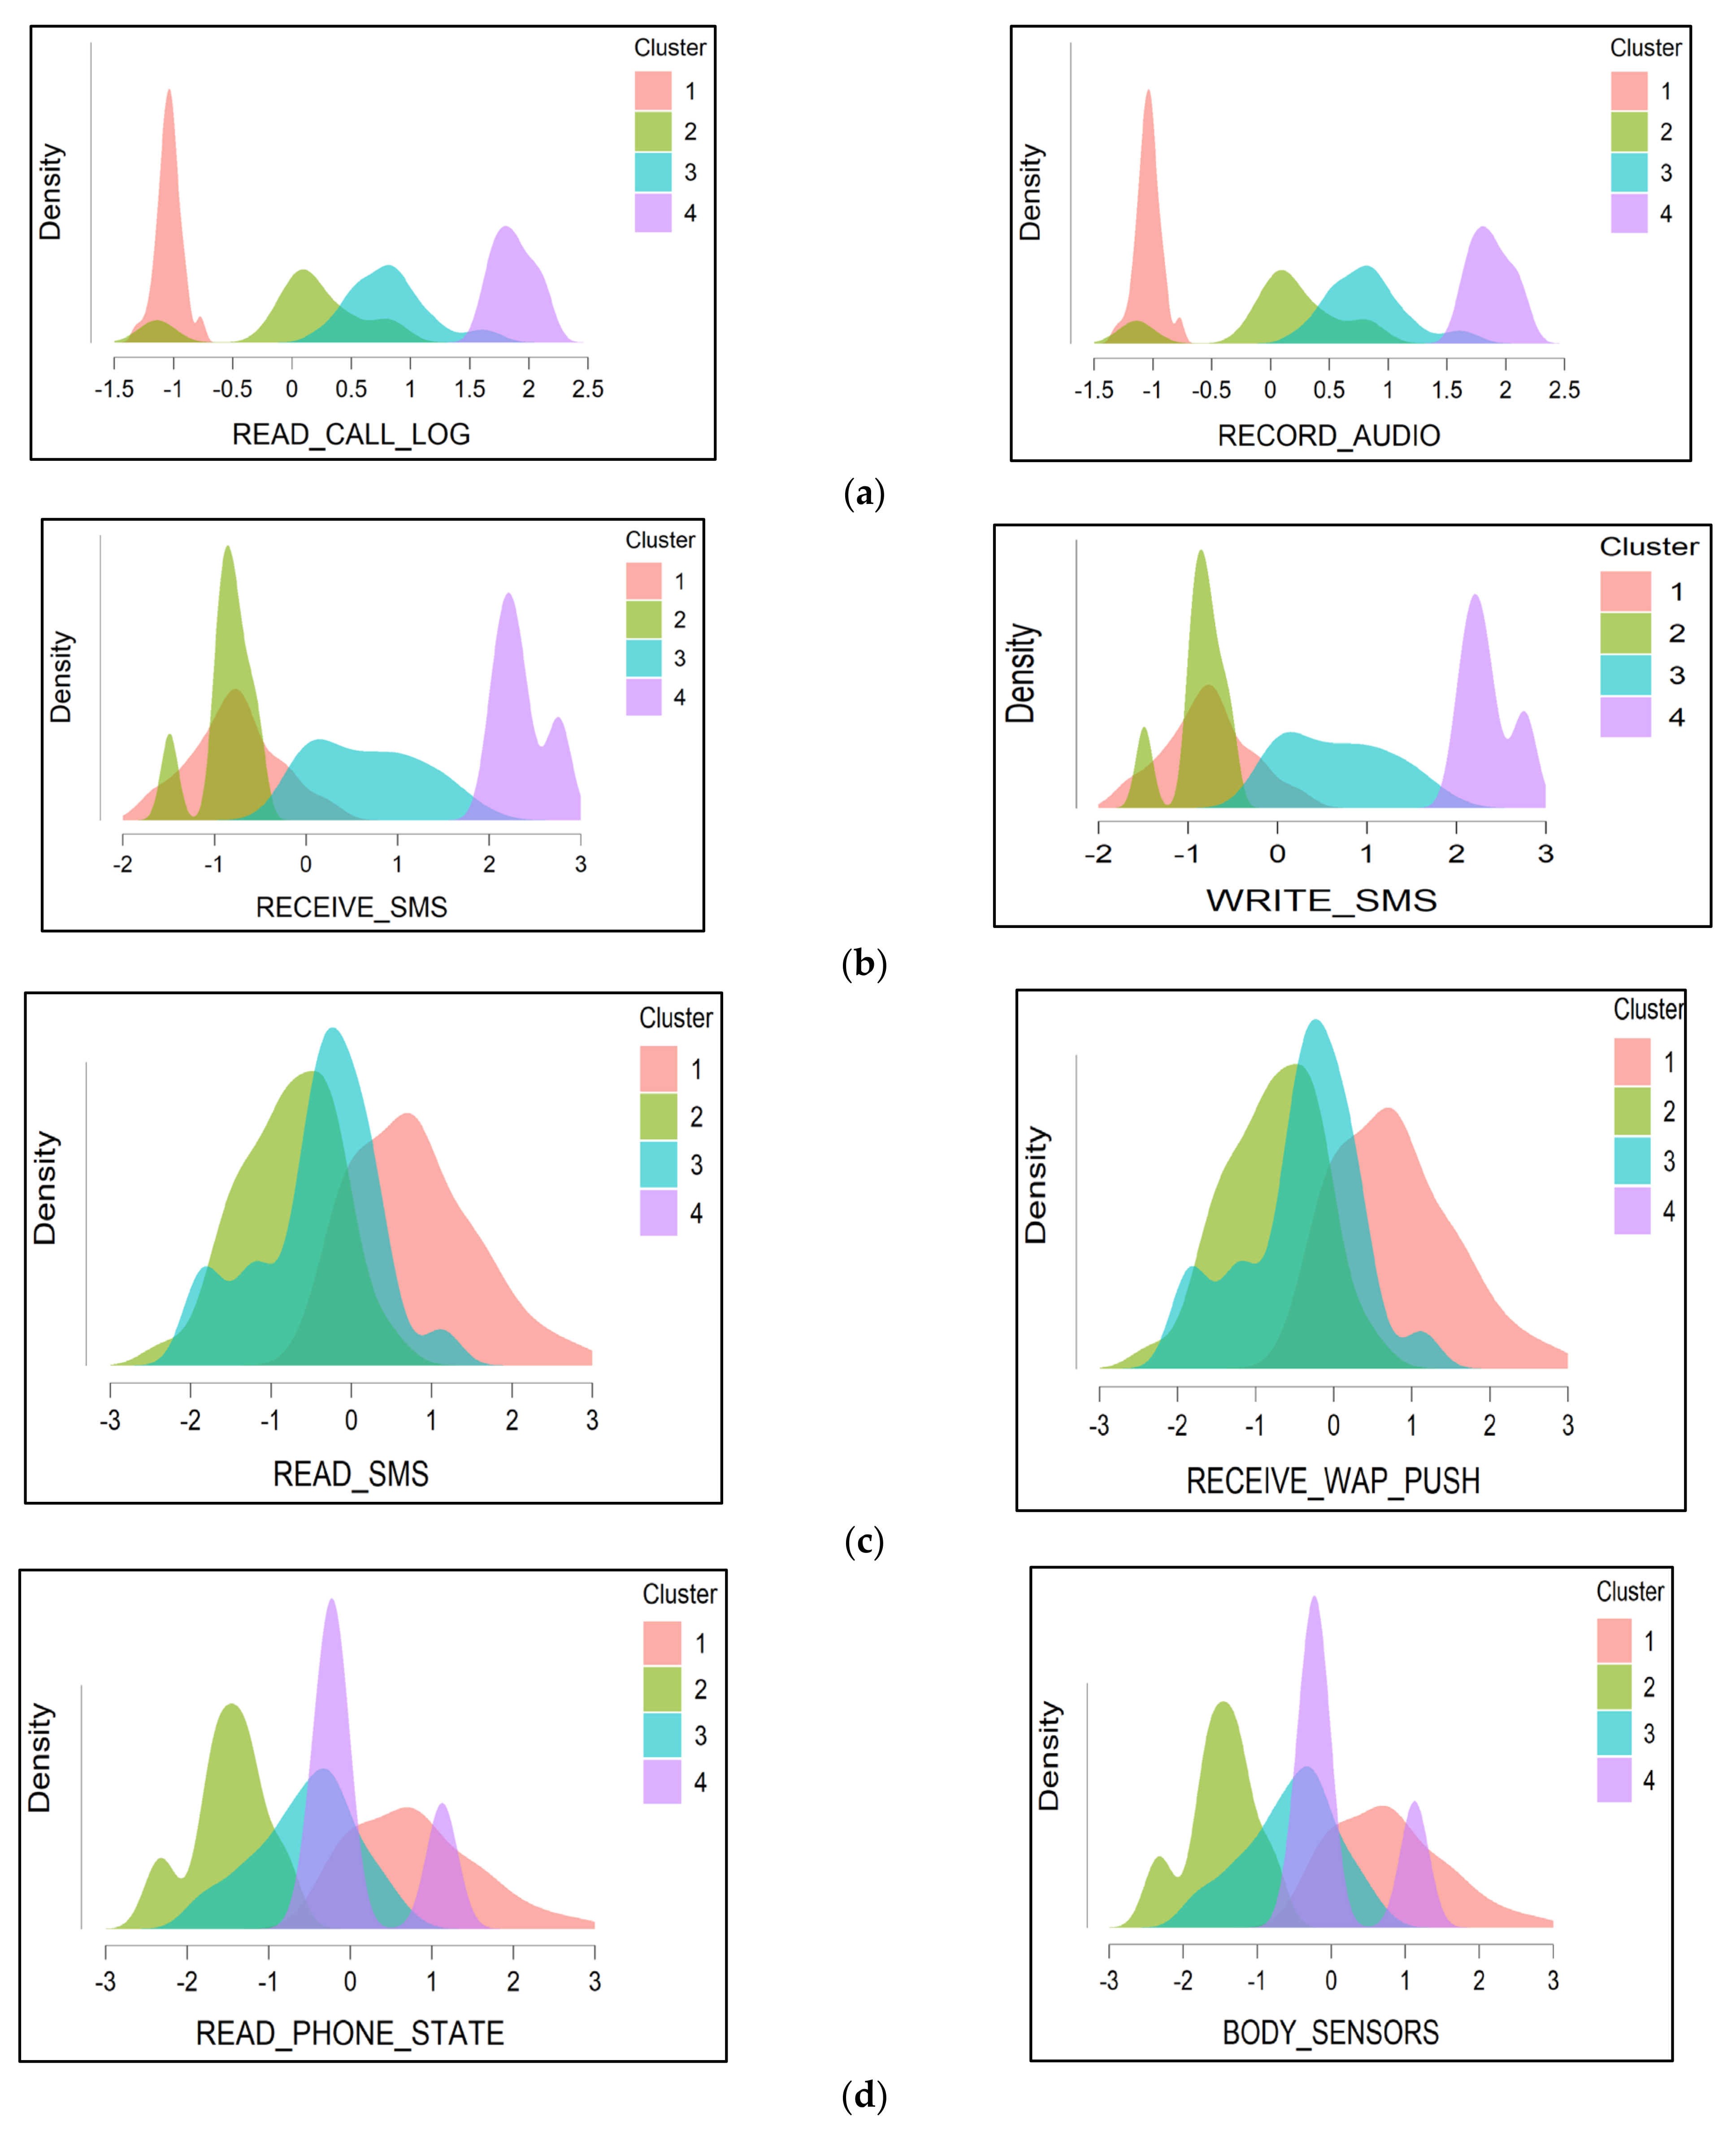
- To examine Android permissions commonly requested and disseminated to classify Android applications as malicious or benign. Our results demonstrate that the proposed model can determine families of malware based on the similarities by understanding their clusters. This demonstrates that Android permissions in the same cluster have similar attributes.
- We build on the existing work to expand Android permission request state-of-the-art by providing a comprehensive study on the current state of permissions systems.
2. Background
2.1. Android Permission Architecture and Other Components
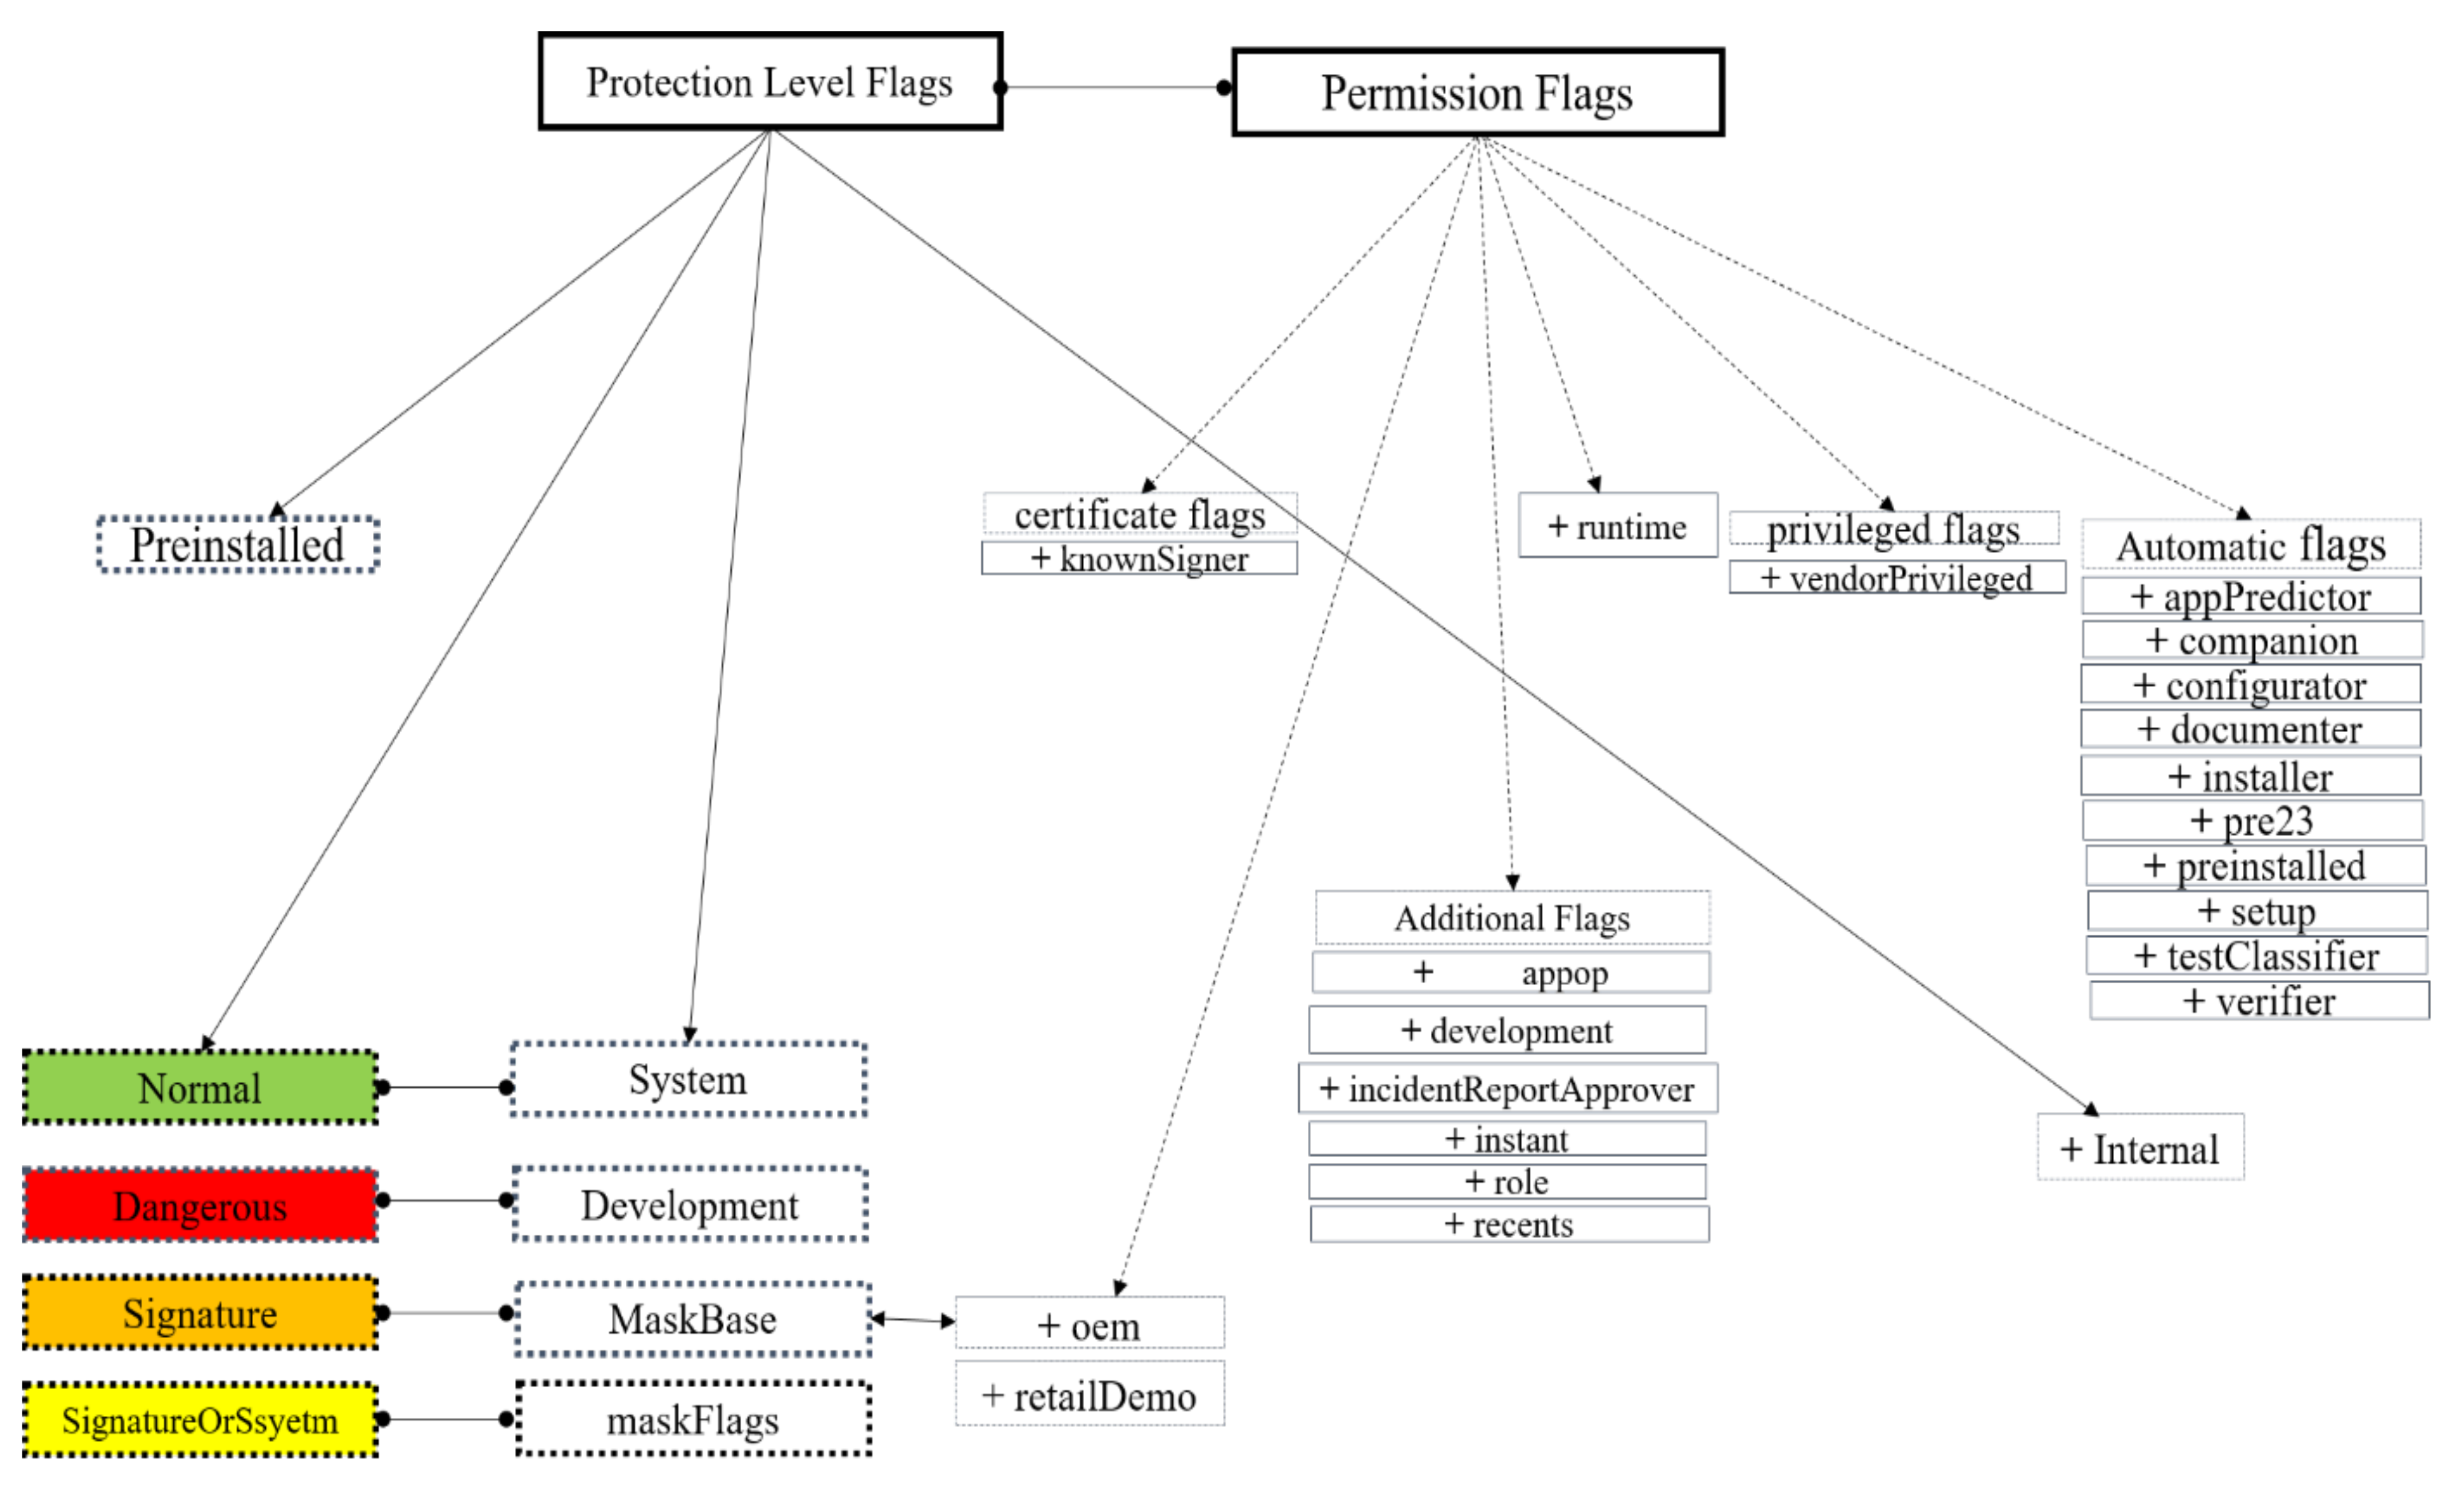
2.2. Protection Levels and Permission Flags
2.2.1. Normal Protection Level
2.2.2. Signature Protection Level
2.2.3. Dangerous Protection Level
2.2.4. Signature or System Protection Level
2.3. Intent Message
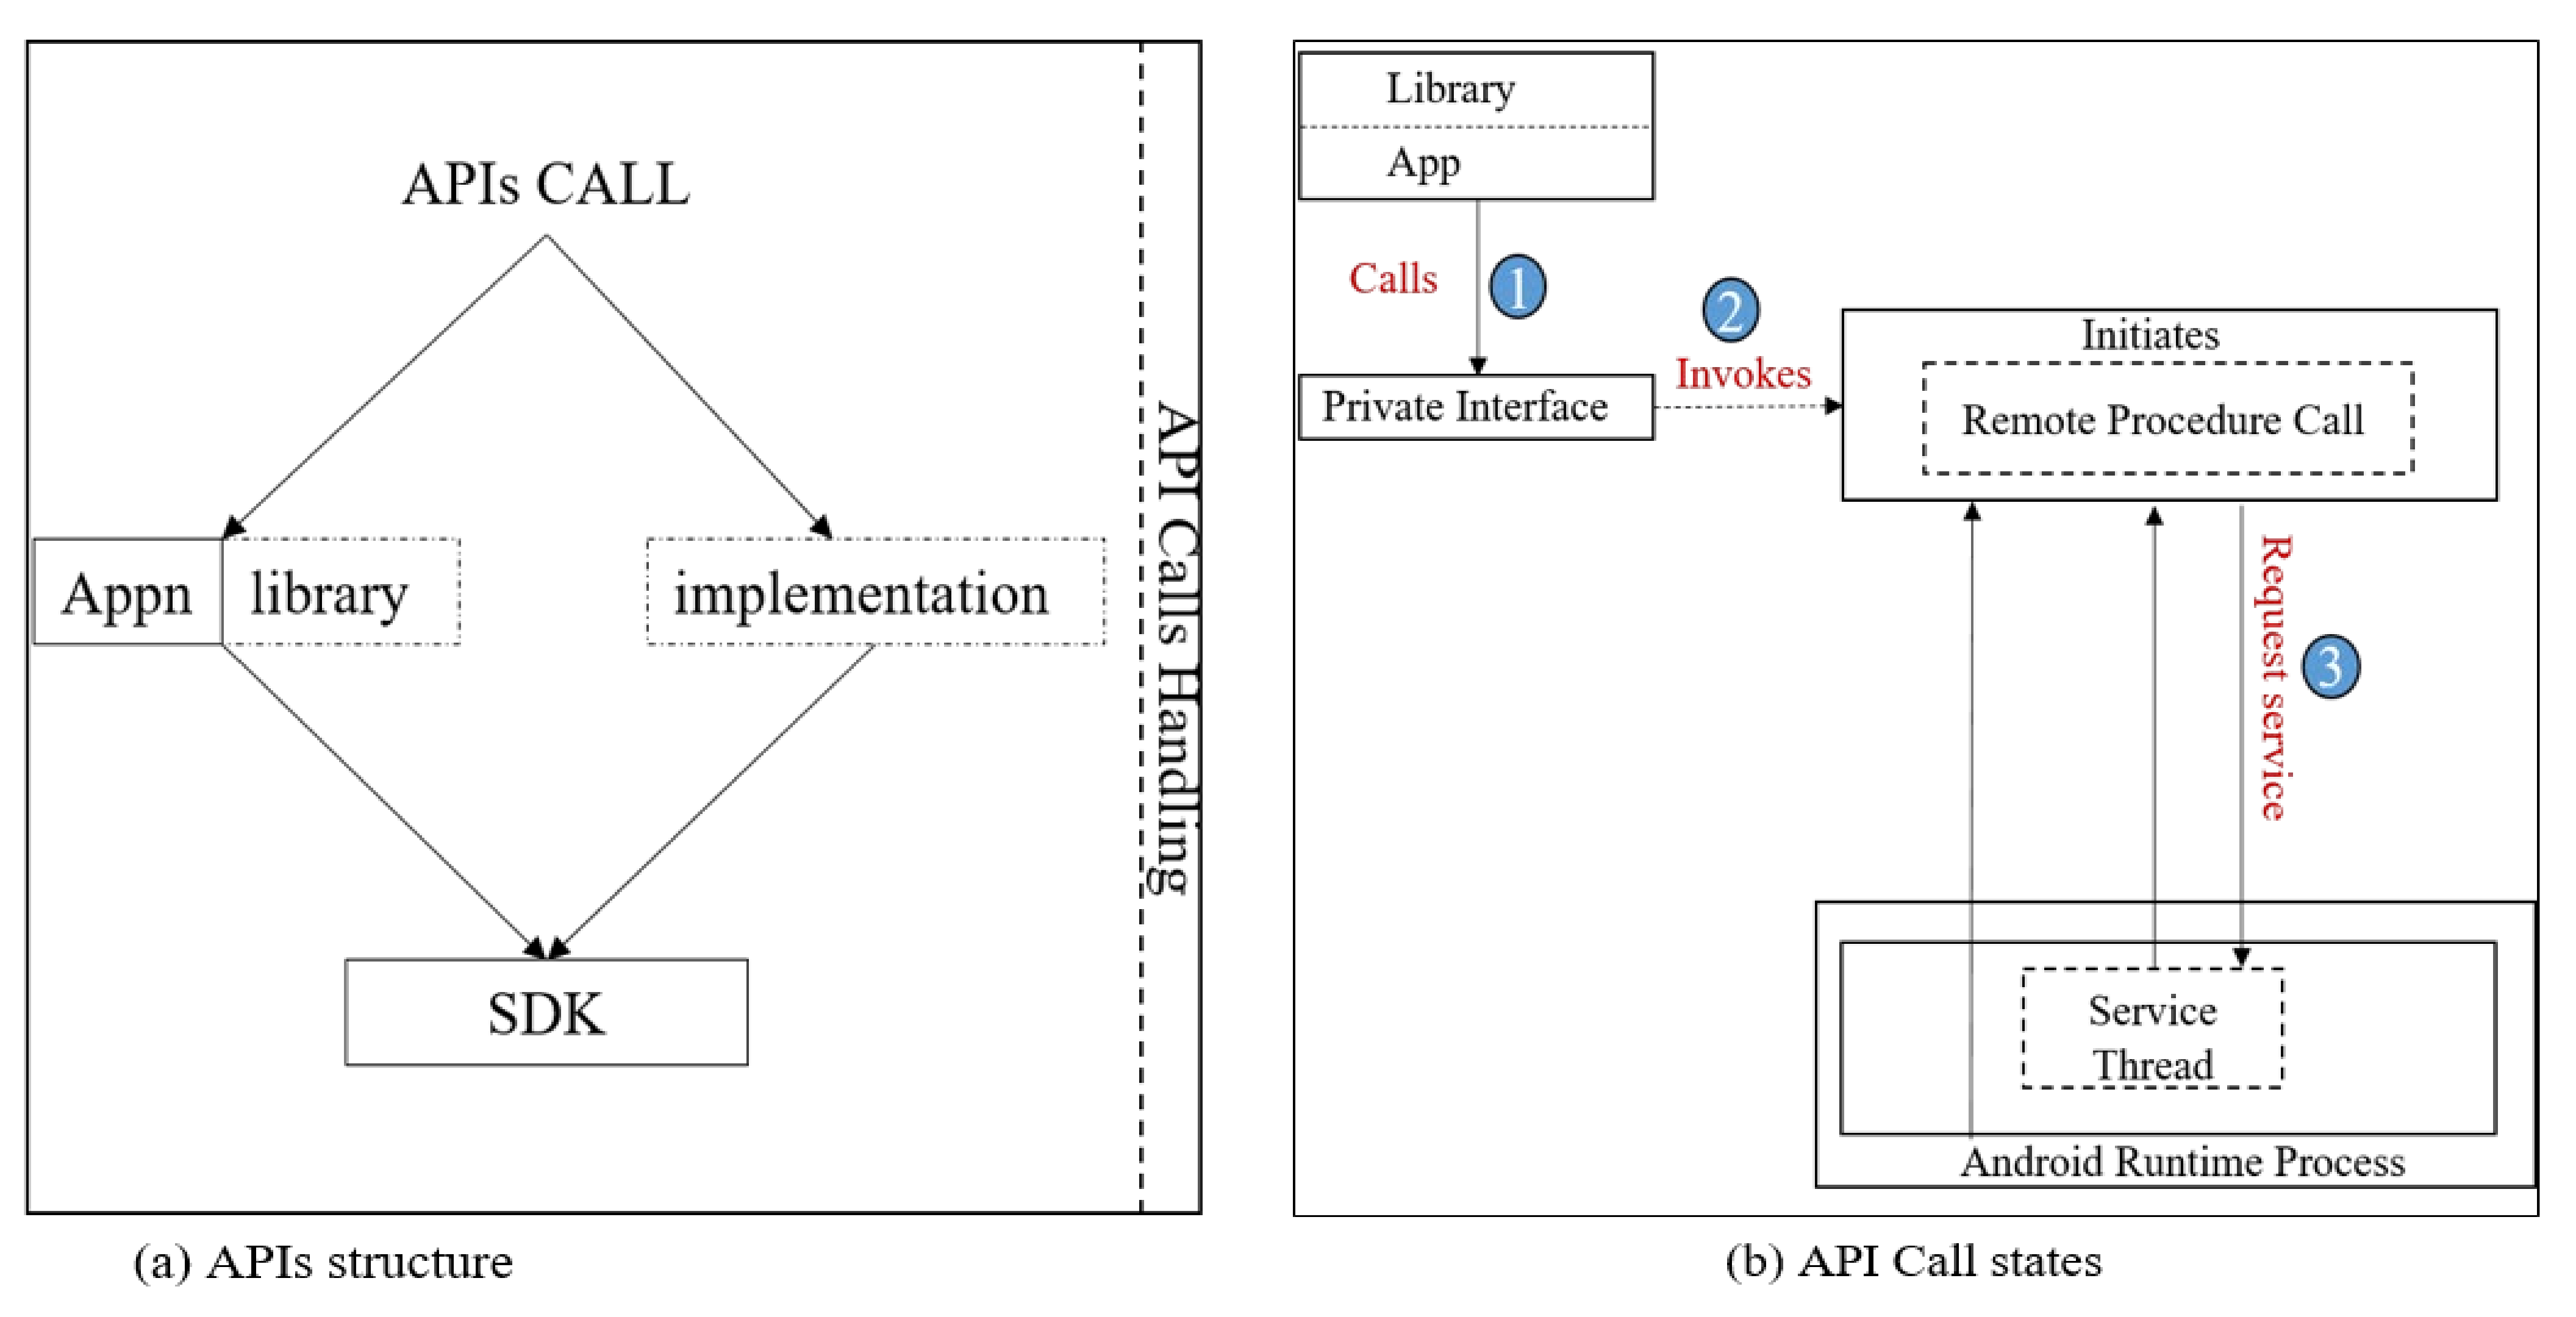
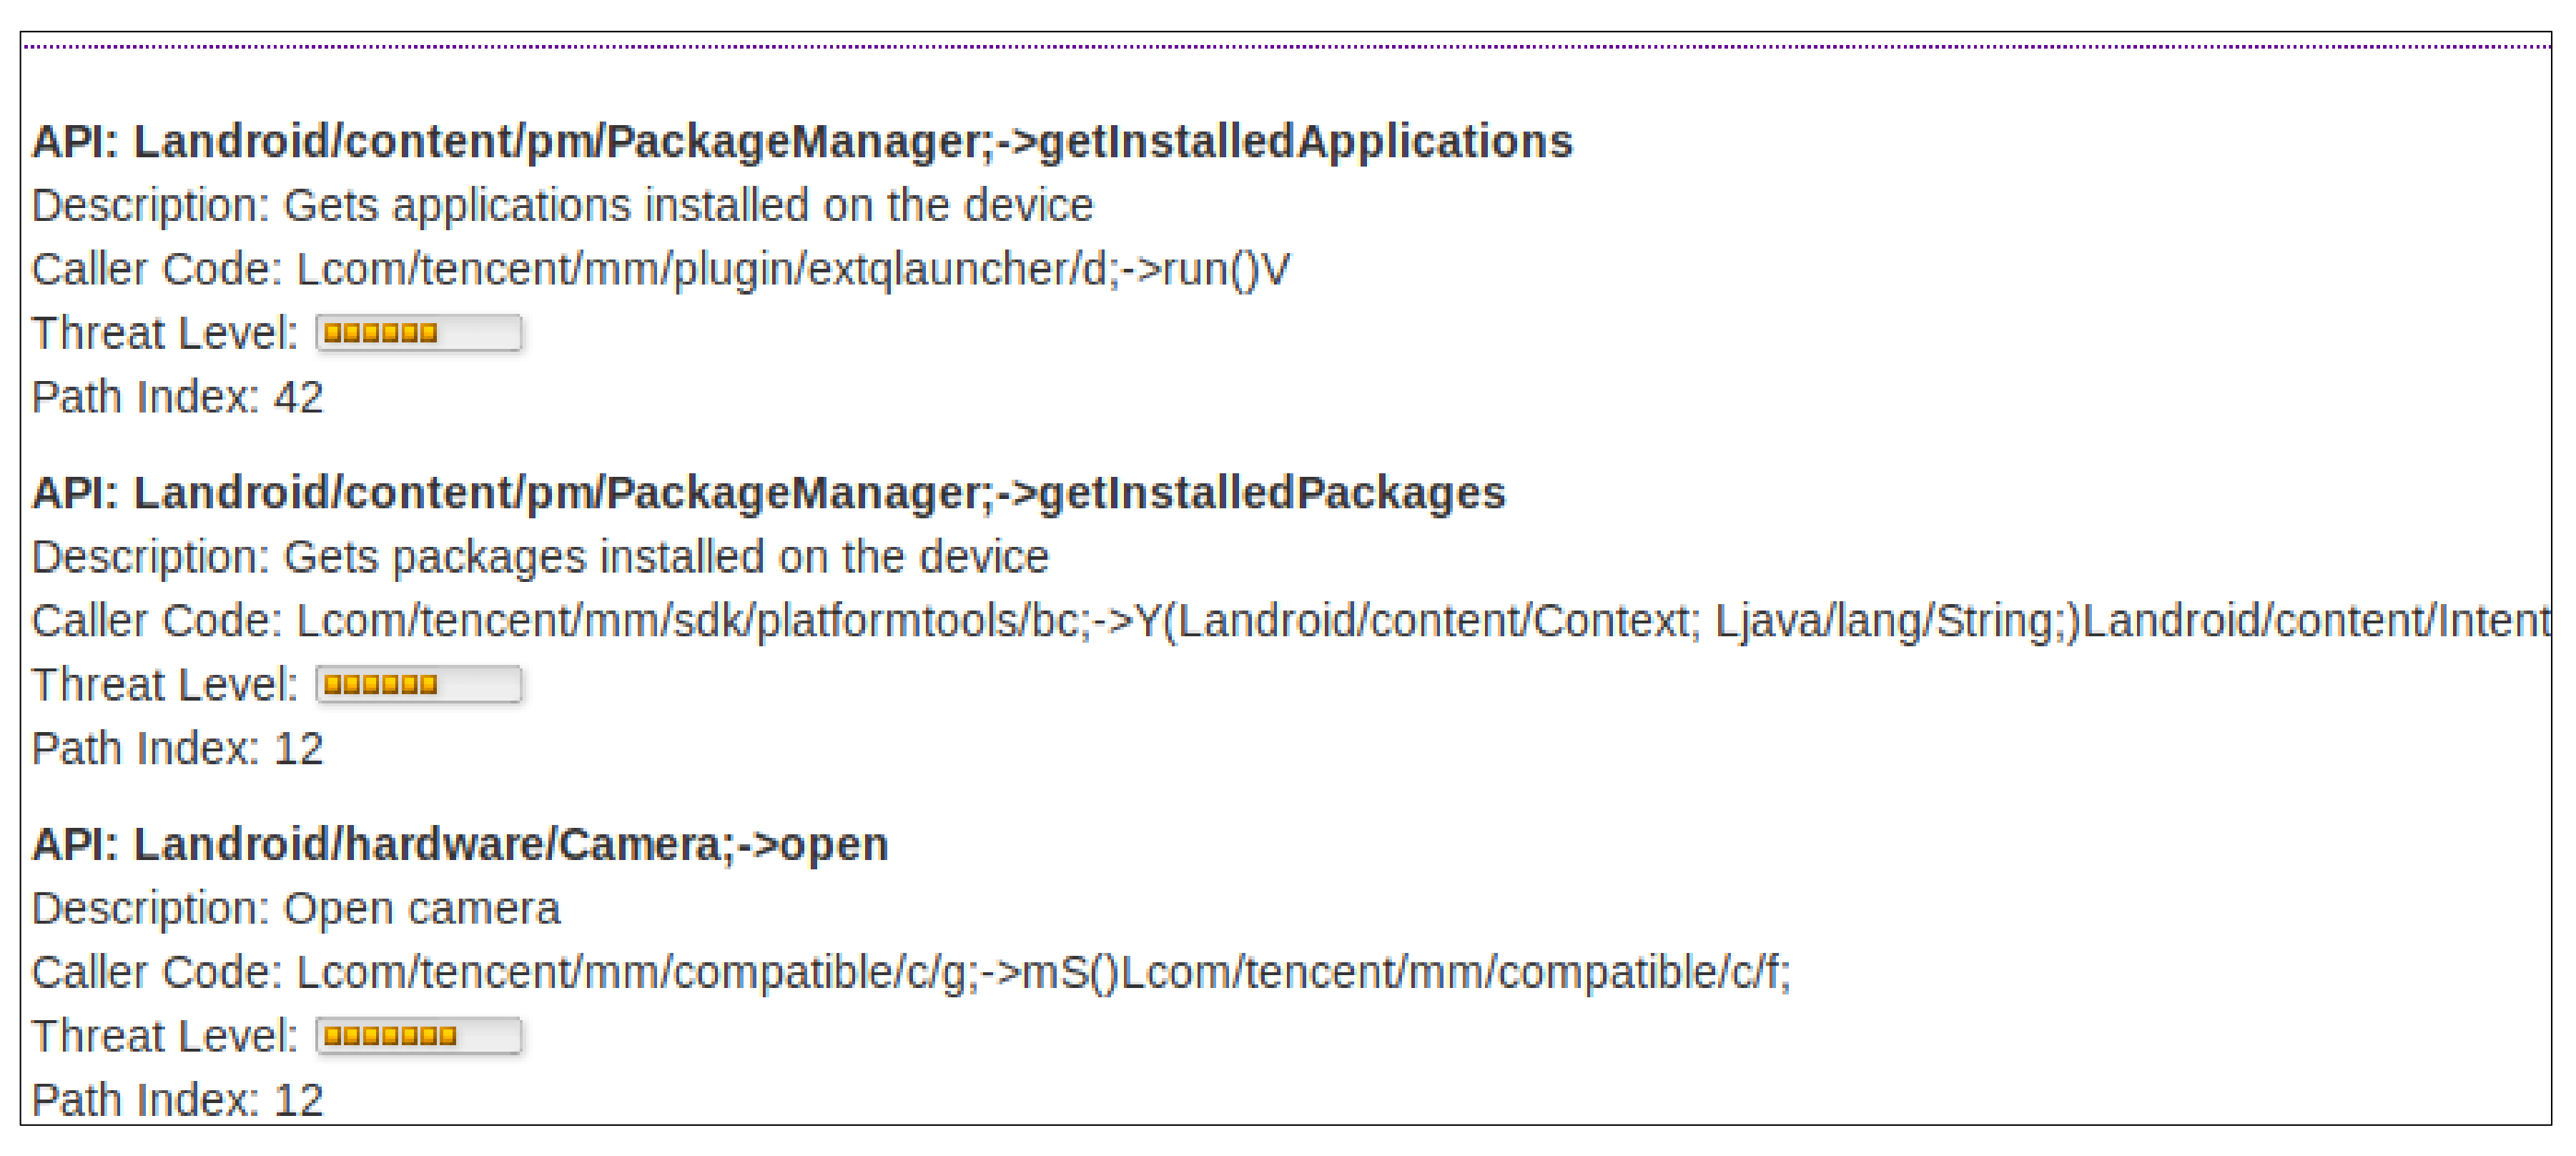
2.4. API Calls
3. Related Work
3.1. Permission-Based Detection and Feature Extraction
3.2. Control Flow Graph and Information Gain
3.3. Bayesian Correlation, Opcode Sequence, and t-Distribution Stochastic Neighbor Embedding (t-SNE)
4. Materials and Methods
4.1. Data Set
4.2. The t-Distribution Stochastic Neighbor Embedding
4.3. The Self-Organizing Map (SOM)
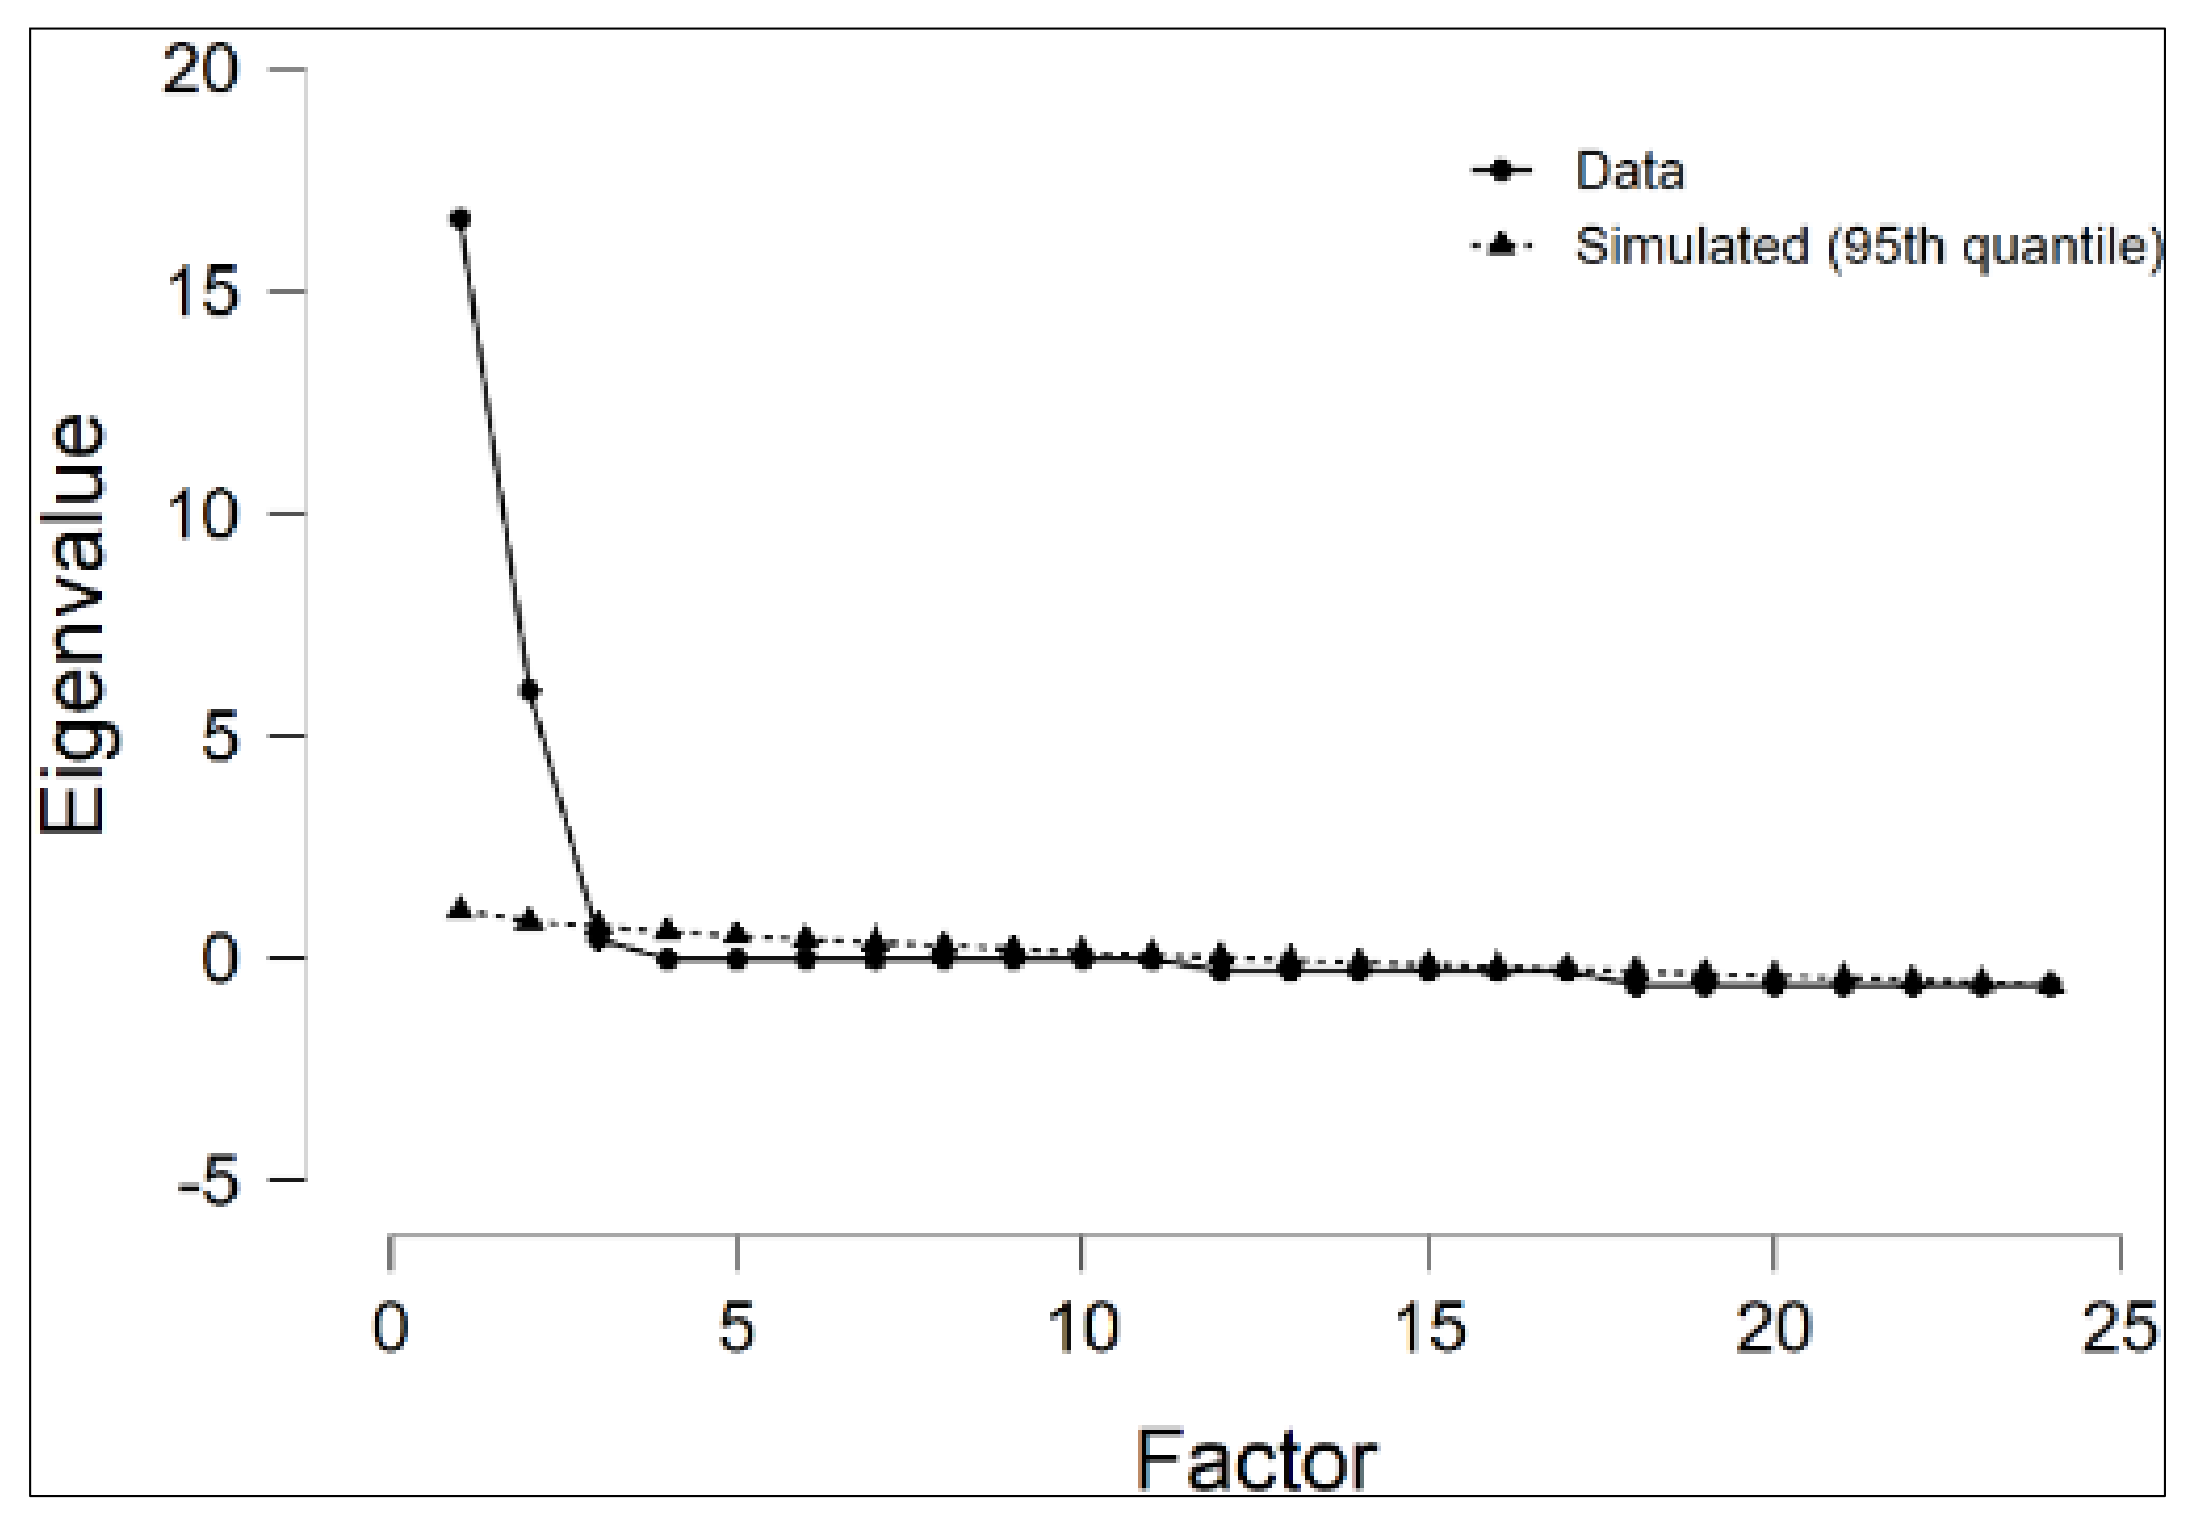
4.4. Exploratory Factor Analysis
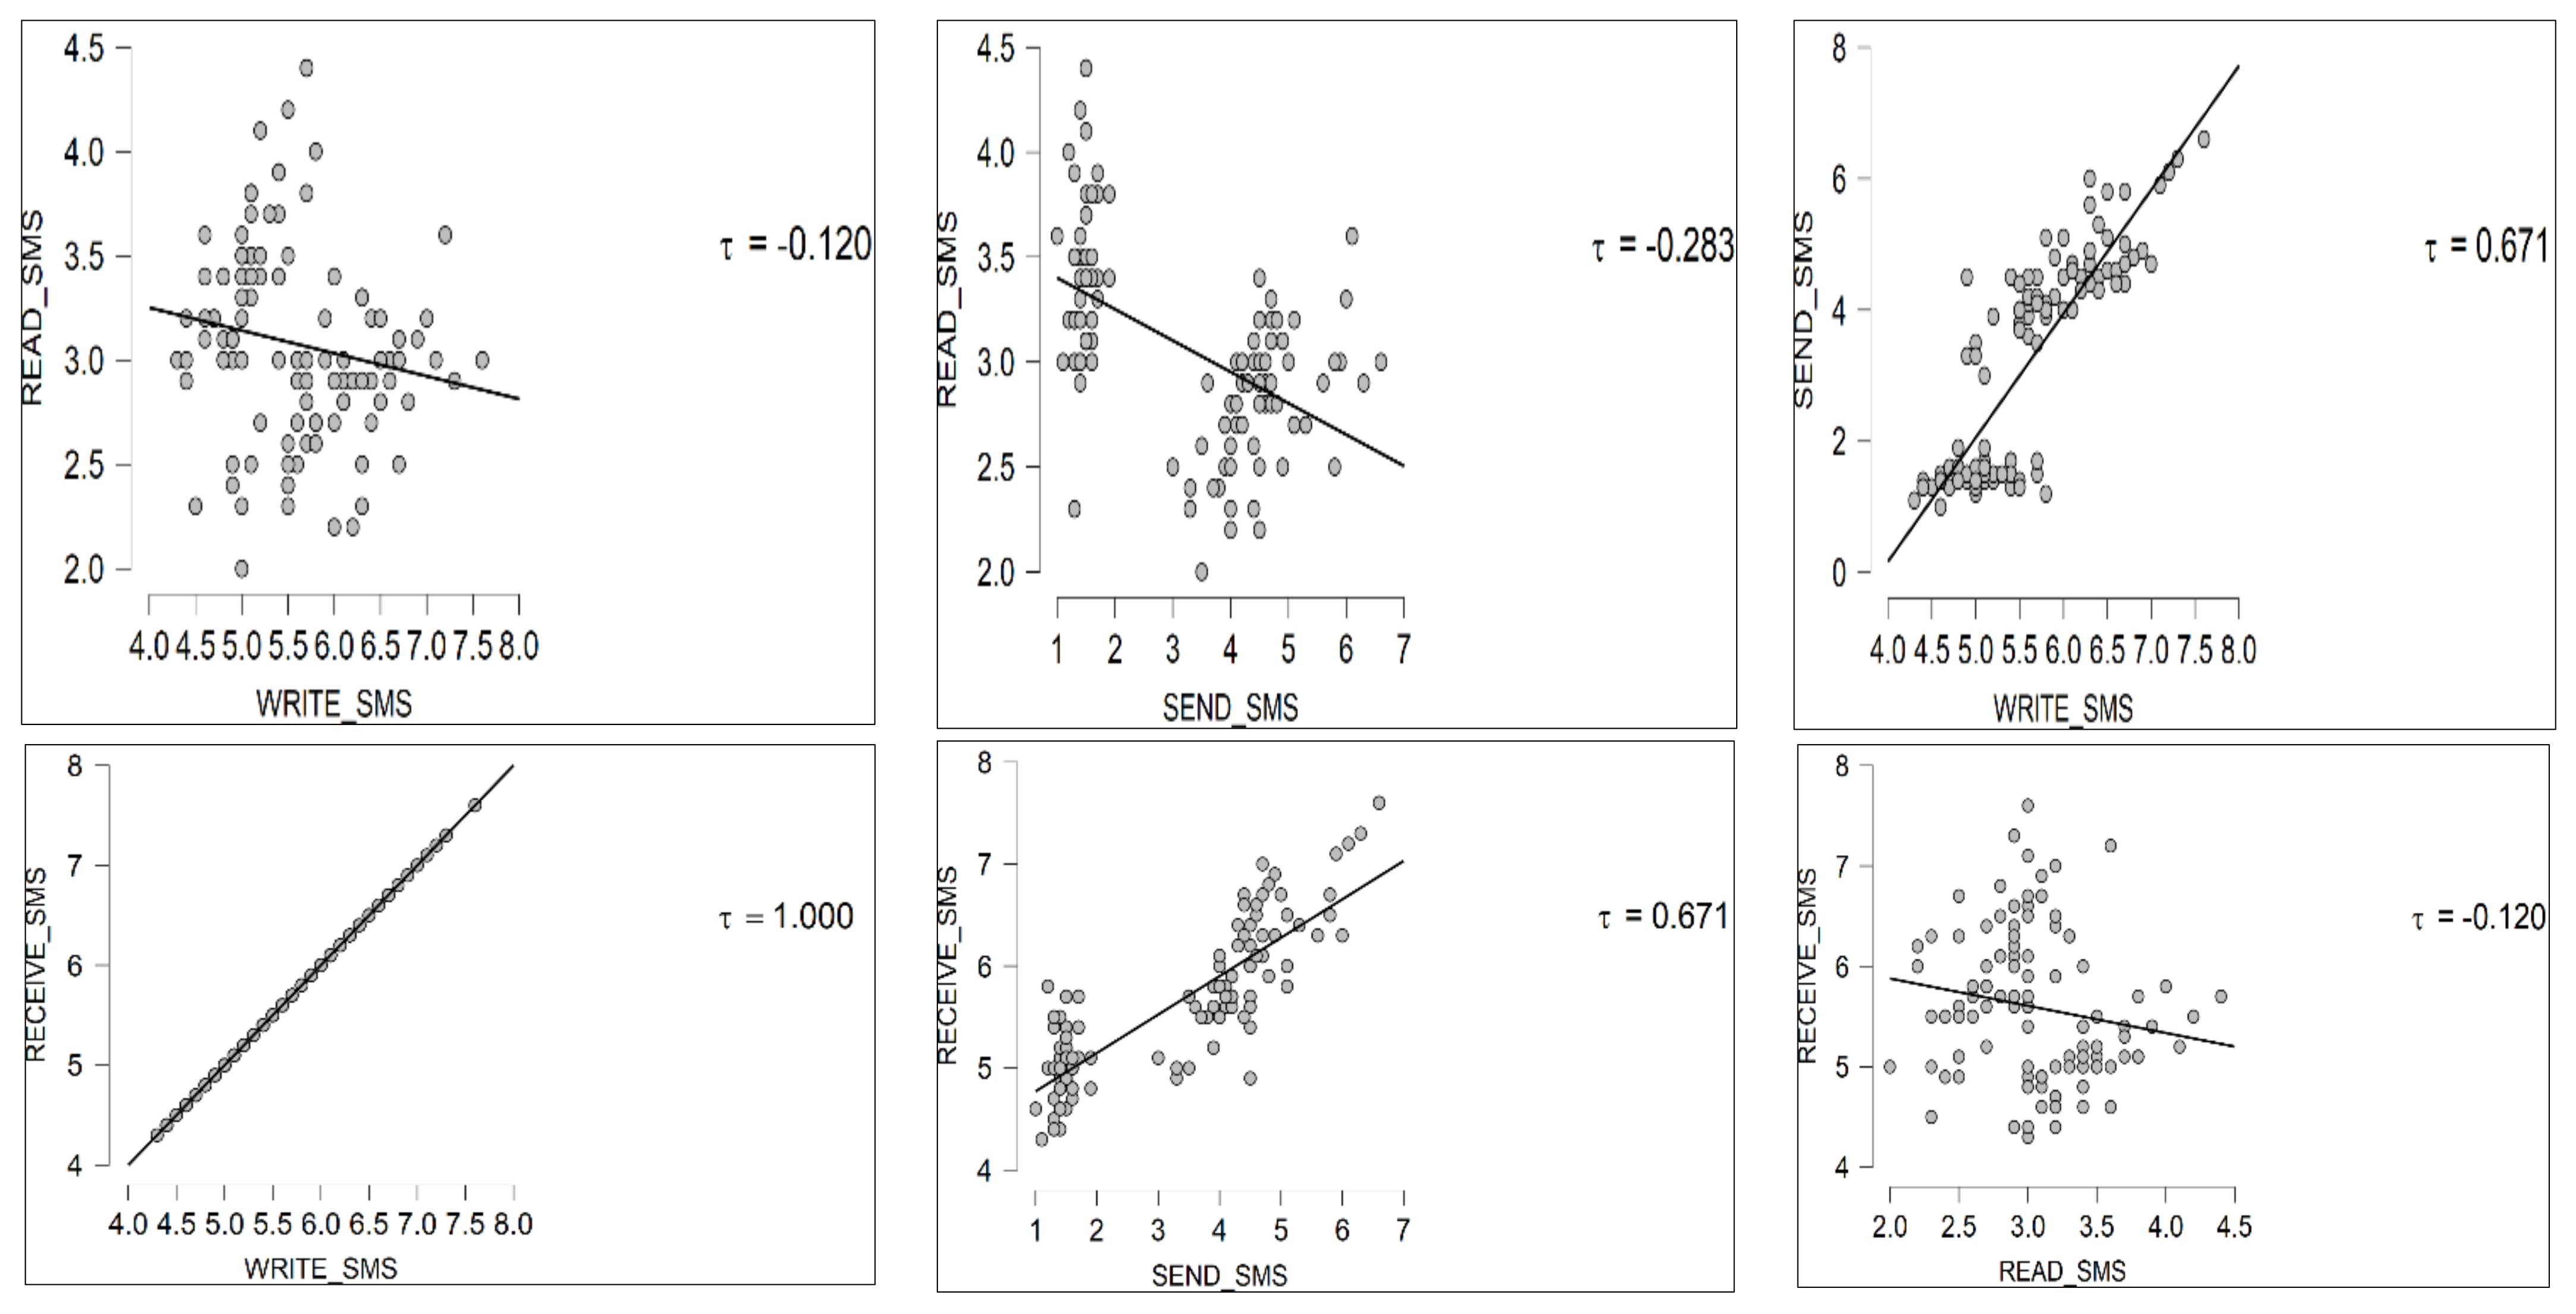
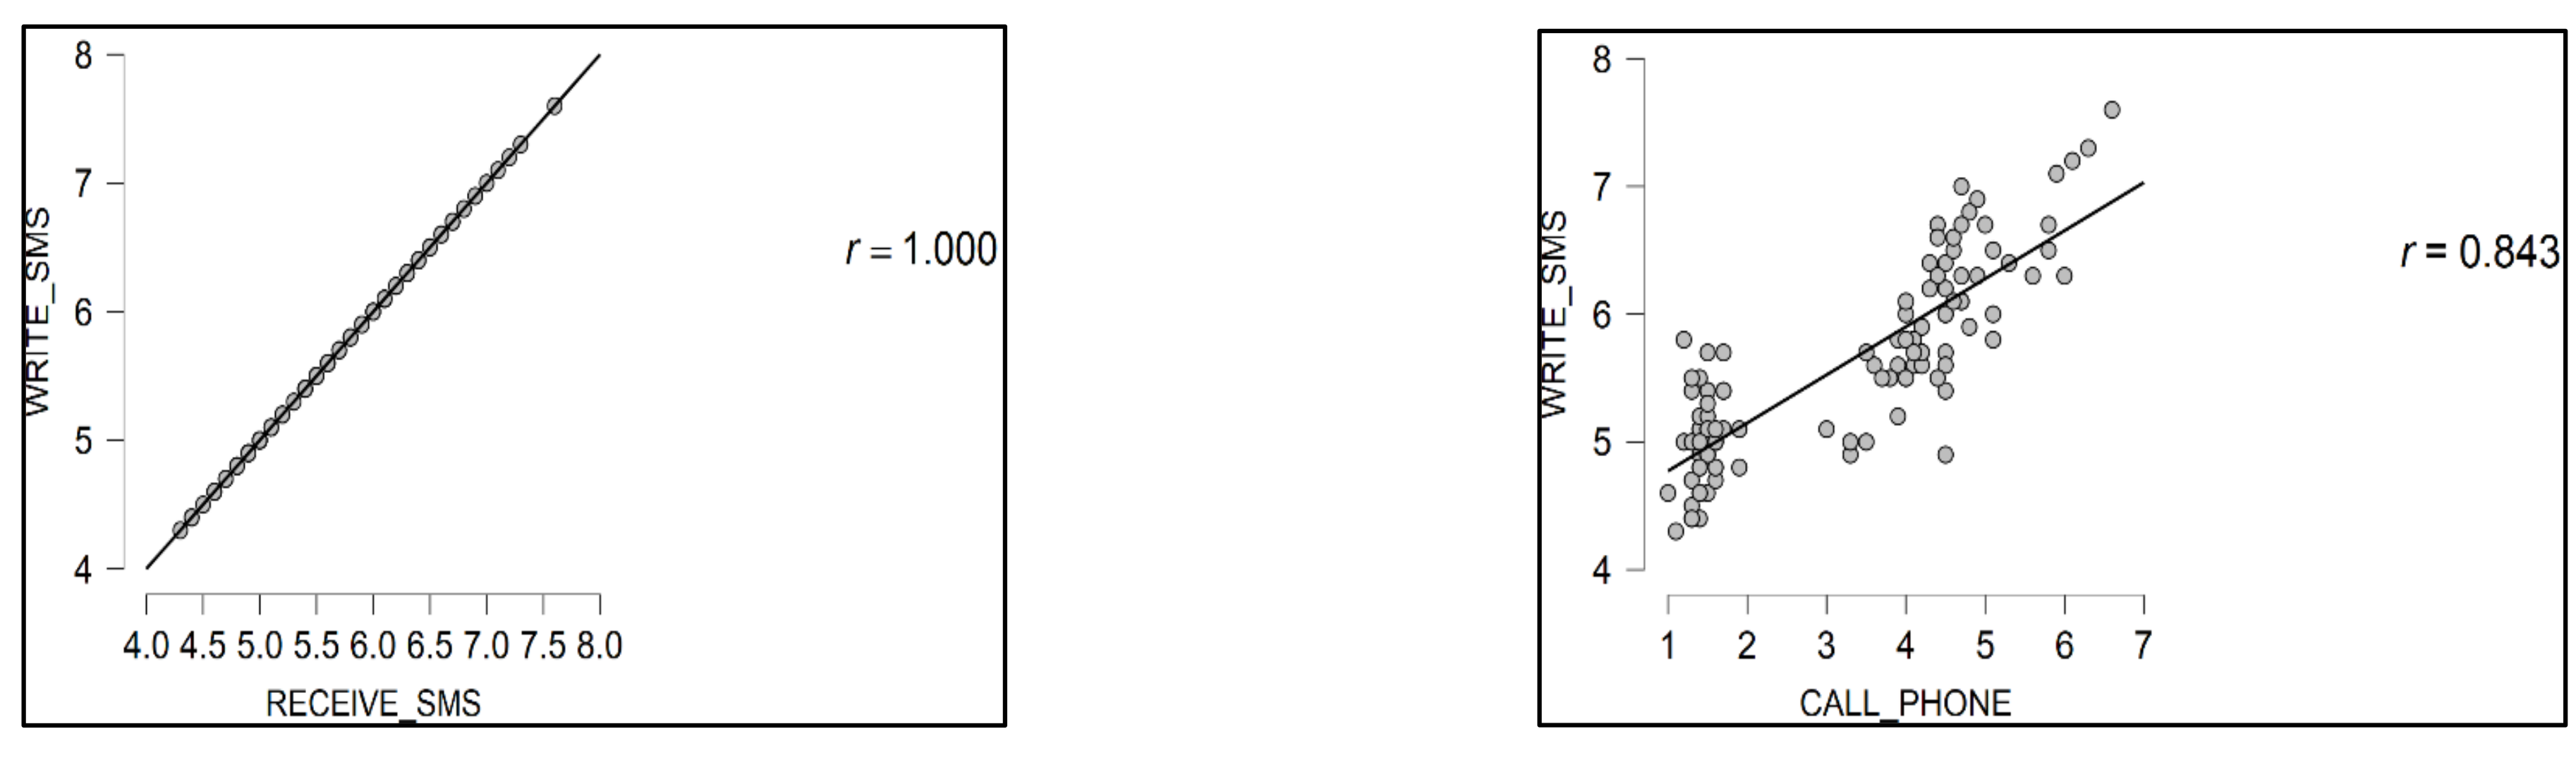
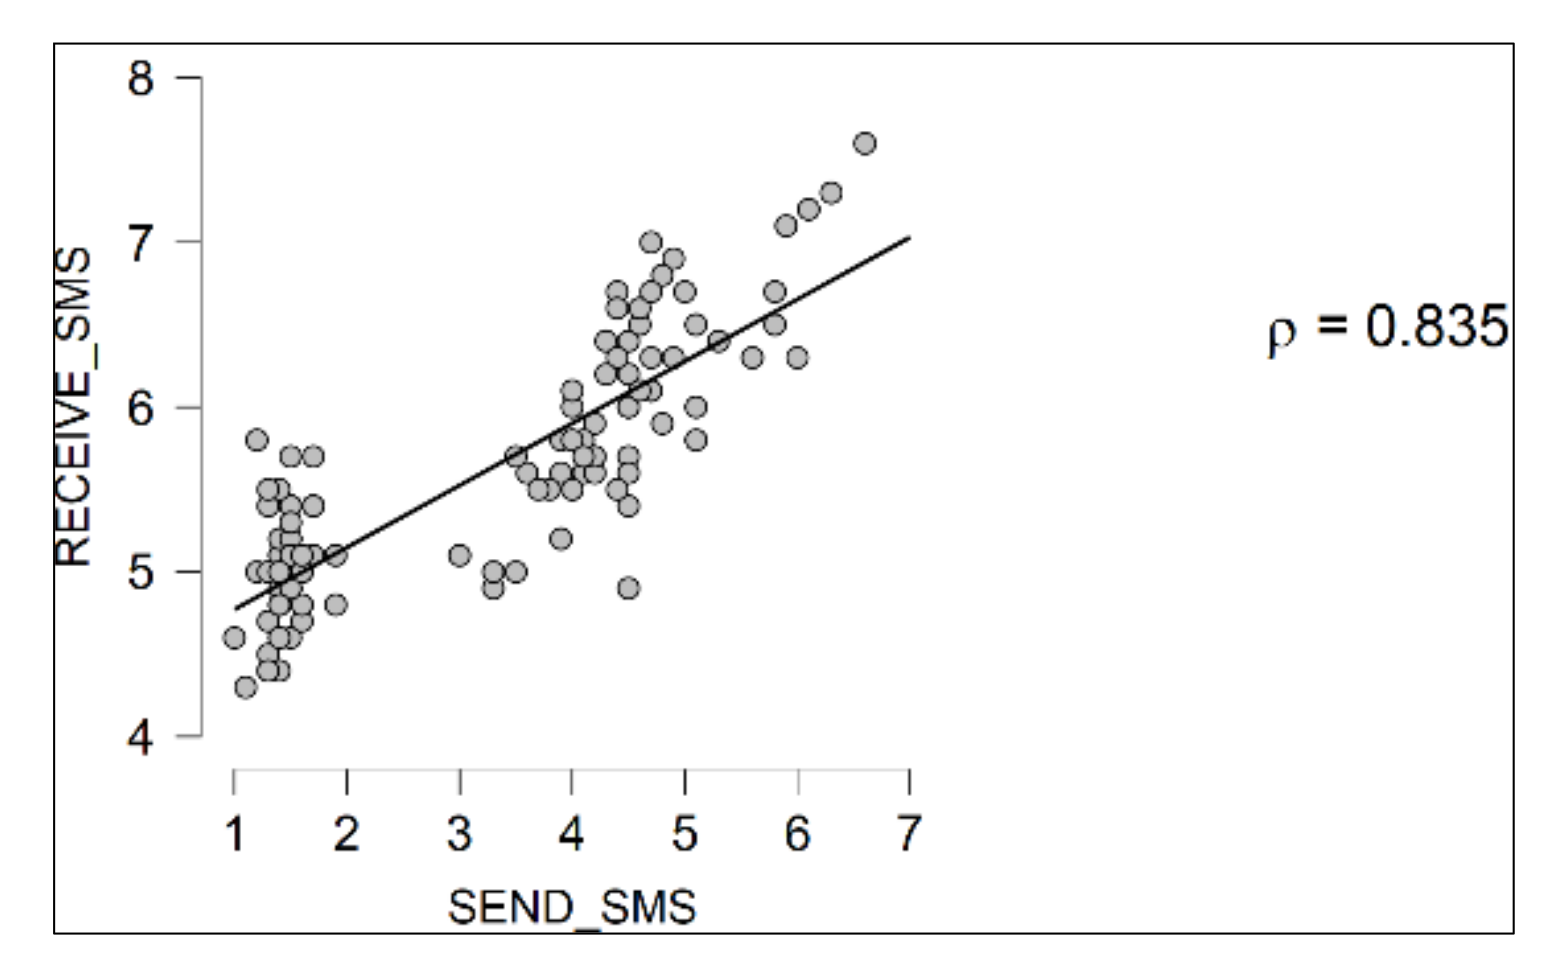
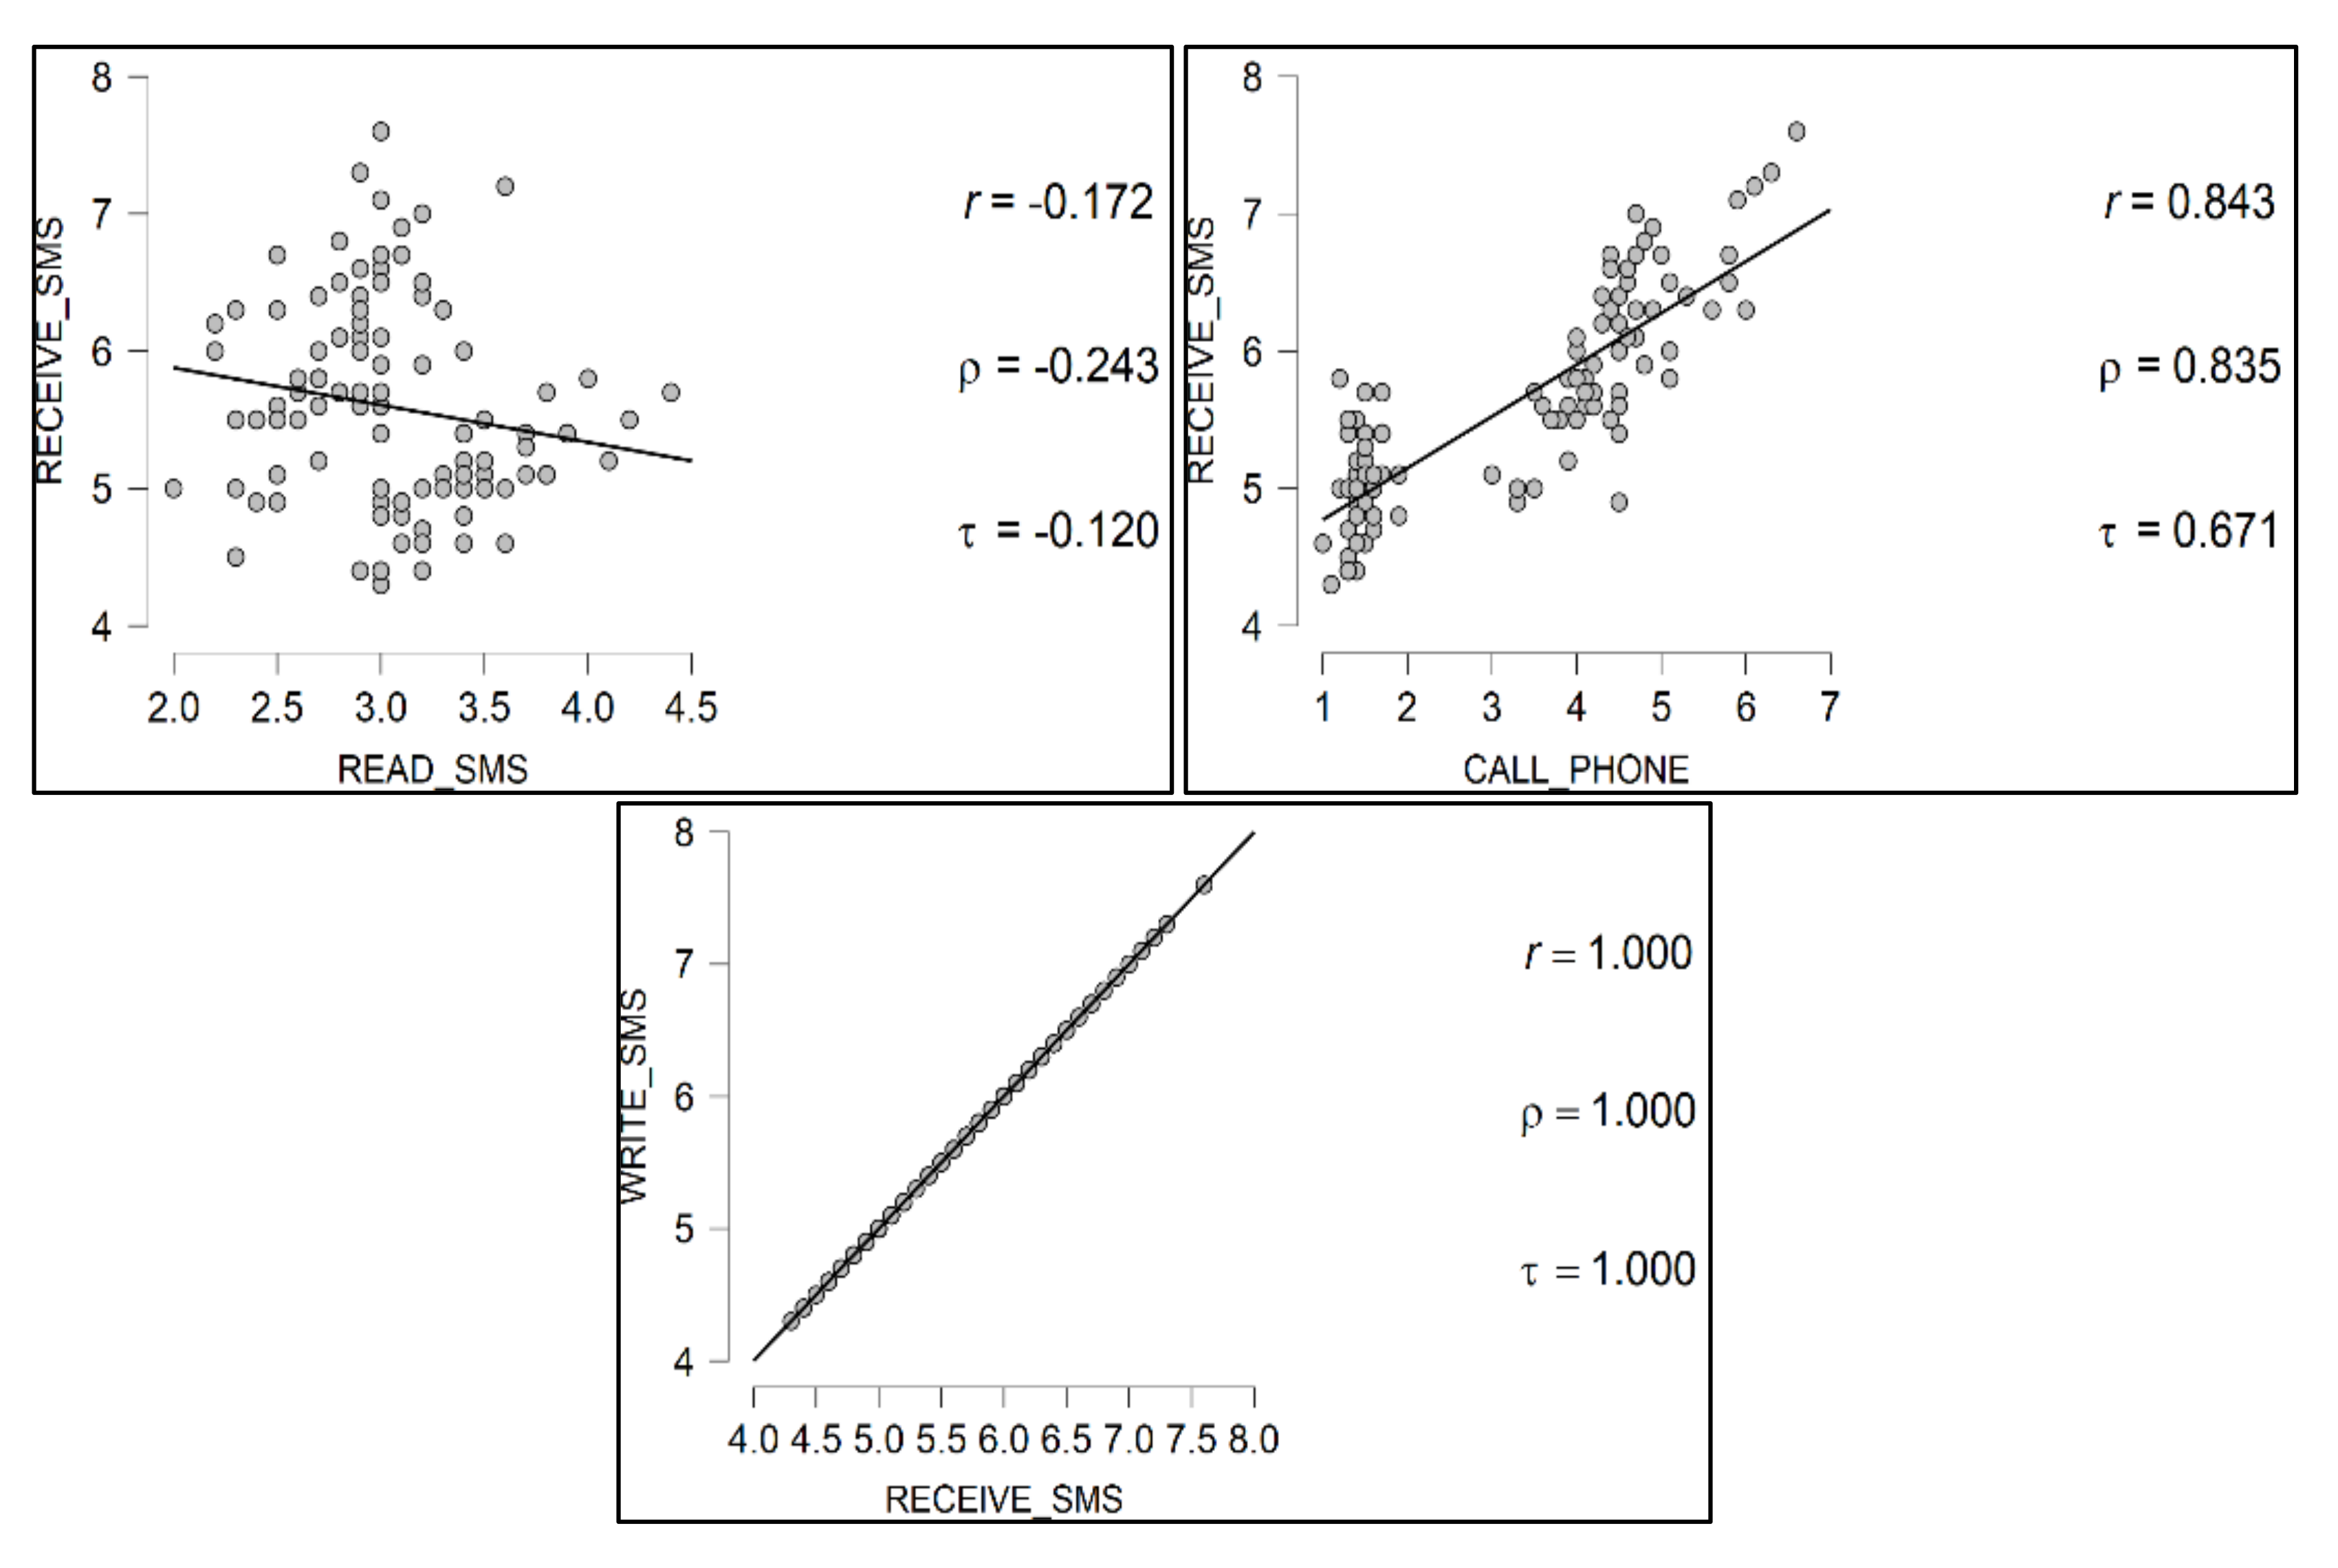
4.5. Correlation between Android Permissions
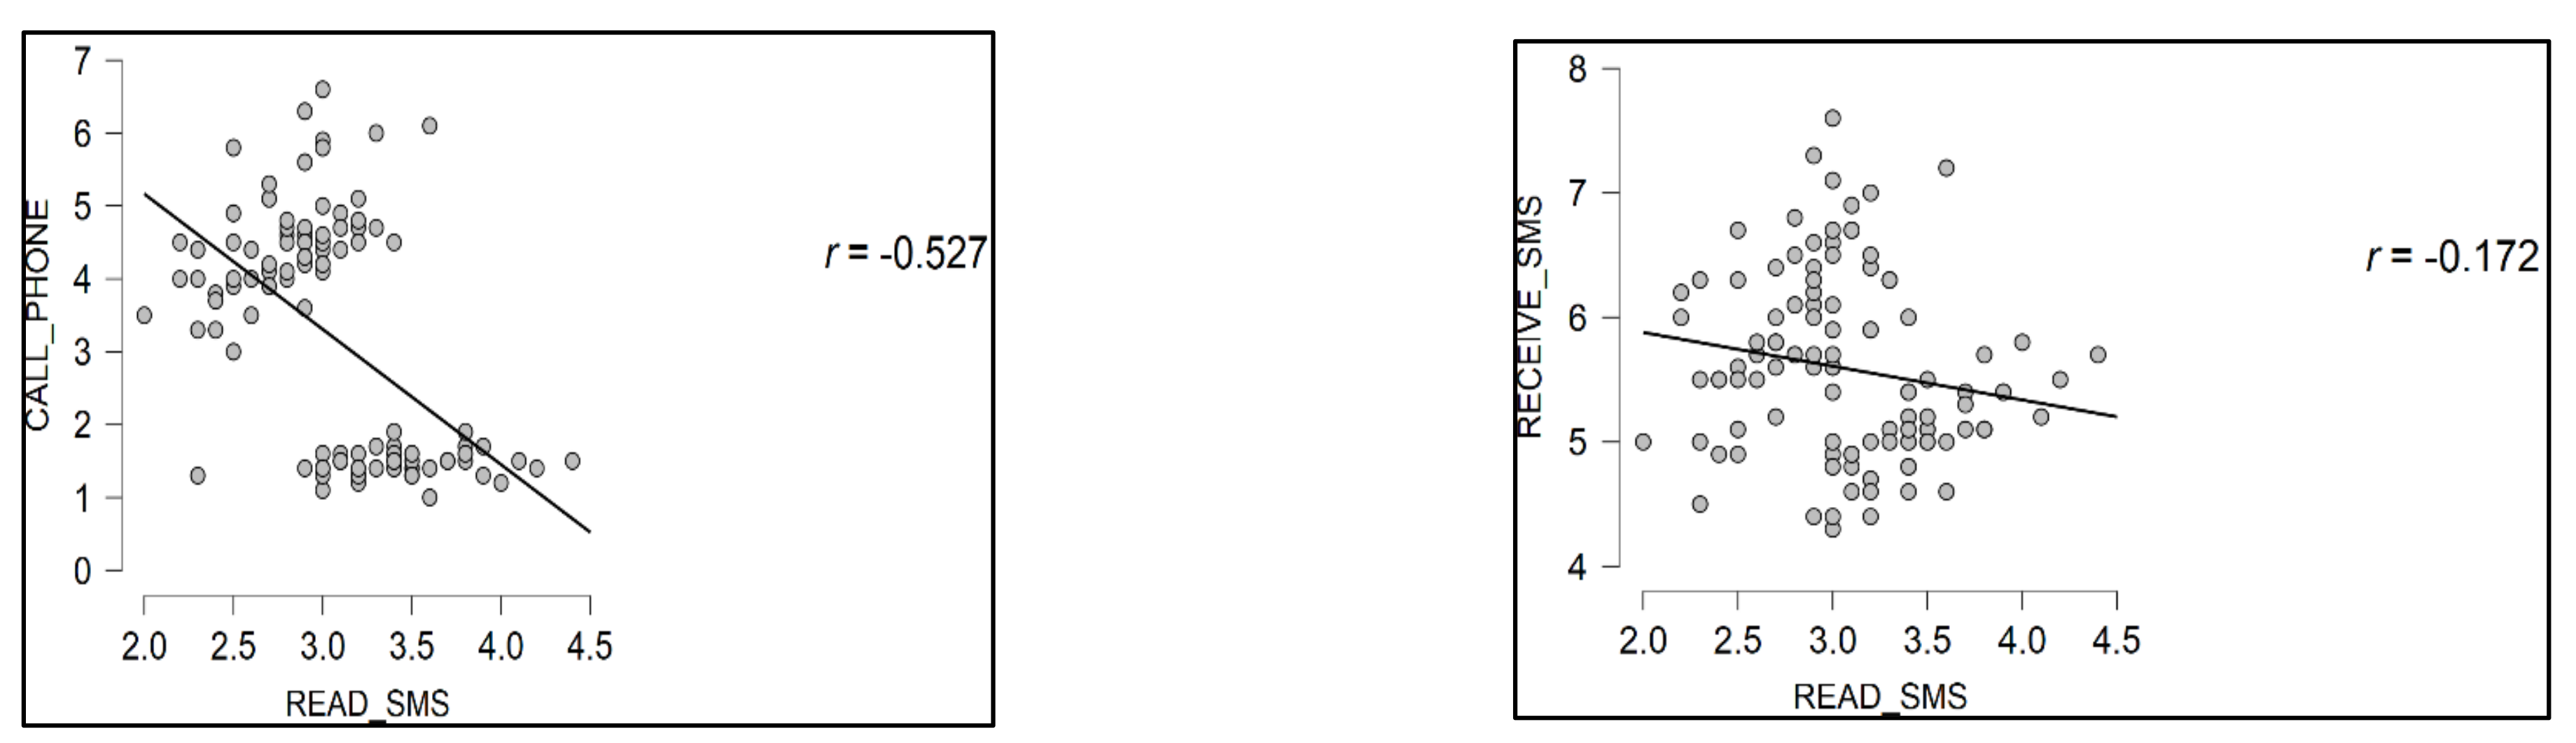
4.5.1. Pearson Correlation
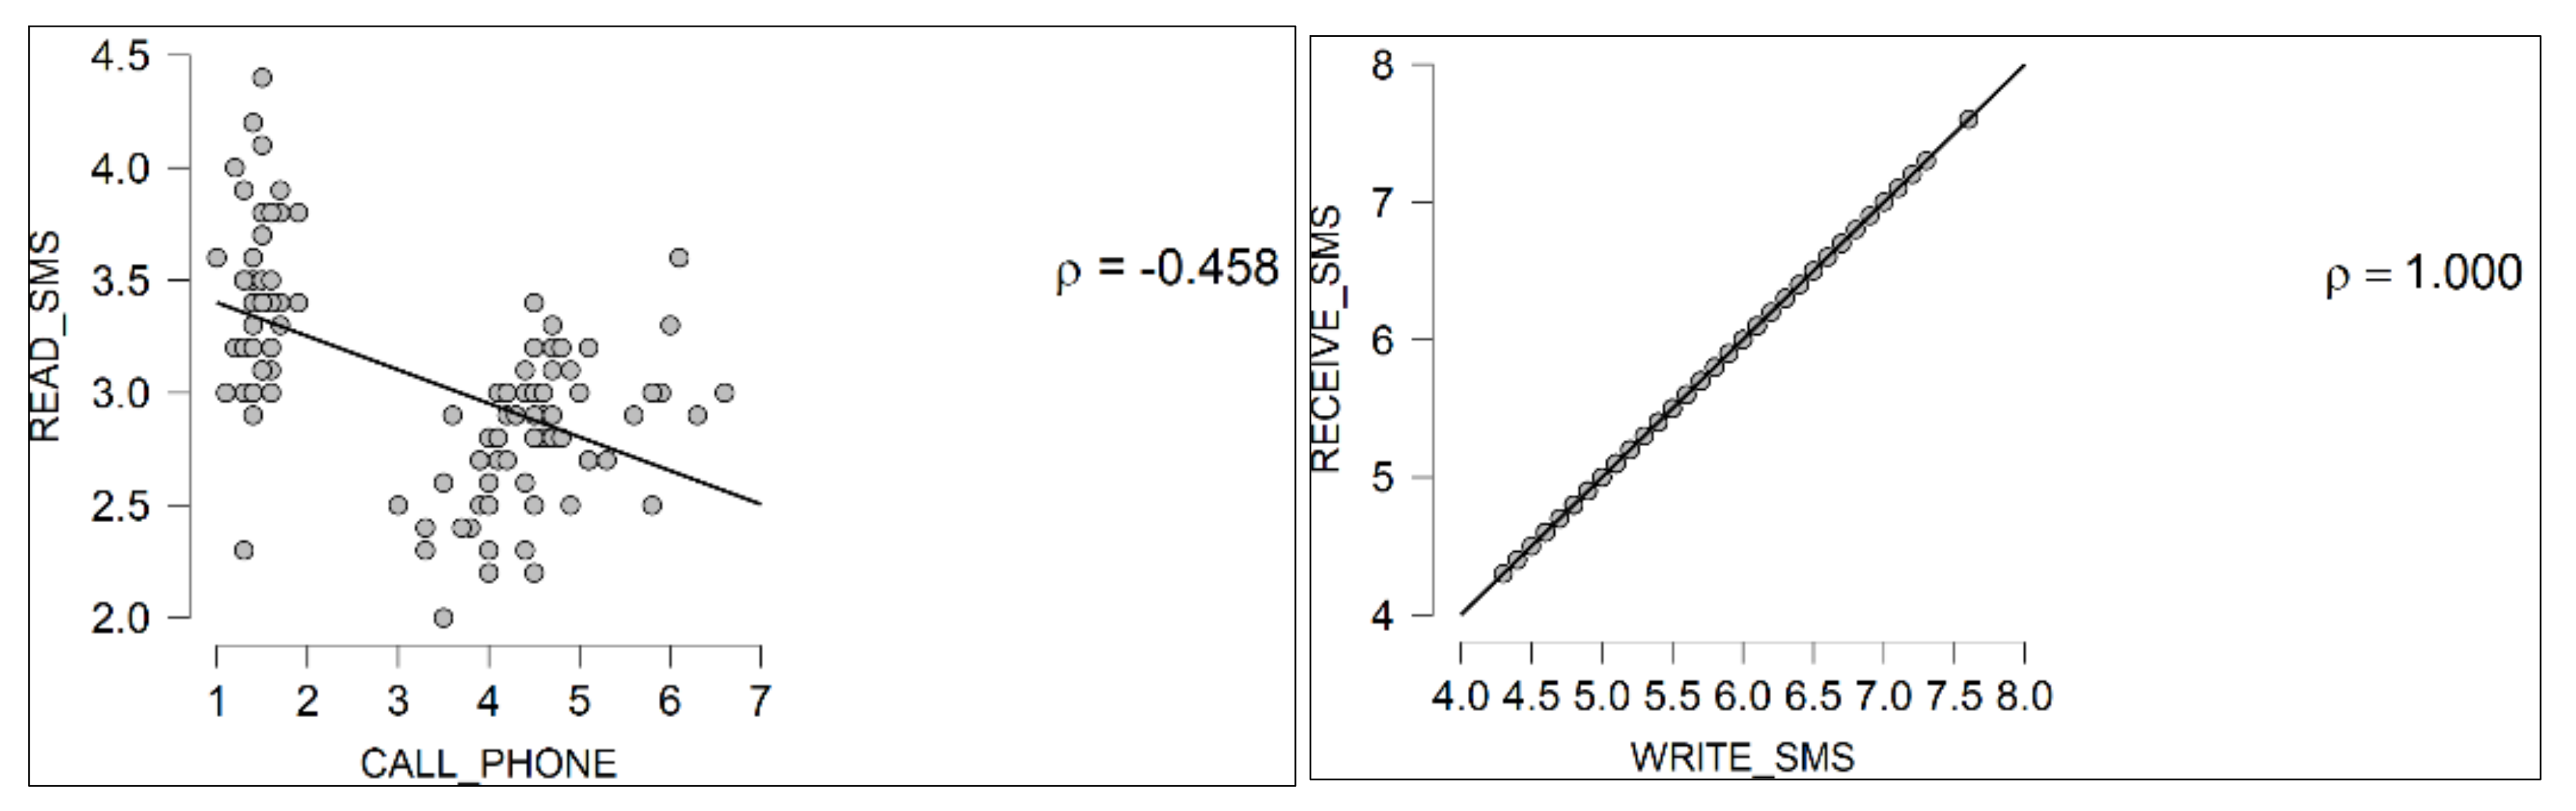
4.5.2. Spearman Correlation
4.5.3. Kendall Correlation
4.6. Comparison of the Correlation Coefficients
4.7. Threat and Protection Levels Evaluation
5. Results and Discussion
Attackers and Permission Request to Escalate Its Privileges
6. Conclusions
Author Contributions
Funding
Data Availability Statement
Conflicts of Interest
Appendix A. Decision Cluster Tree
Tree
References
- Almomani, I.M.; Al Khayer, A. A Comprehensive Analysis of the Android Permissions System. IEEE Access 2020, 8, 216671–216688. [Google Scholar] [CrossRef]
- Peng, S.; Cao, L.; Zhou, Y.; Xie, J.; Yin, P.; Mo, J. Challenges and Trends of Android Malware Detection in the Era of Deep Learning. In Proceedings of the 2020 IEEE 8th International Conference on Smart City and Informatization (iSCI), Guangzhou, China, 31 December 2020–1 January 2021; pp. 37–43. [Google Scholar] [CrossRef]
- Ren, Z.; Wu, H.; Ning, Q.; Hussain, I.; Chen, B. End-to-end malware detection for android IoT devices using deep learning. Ad Hoc Netw. 2020, 101, 102098. [Google Scholar] [CrossRef]
- Hussain, S.J.; Ahmed, U.; Liaquat, H.; Mir, S.; Jhanjhi, N.; Humayun, M. IMIAD: Intelligent Malware Identification for Android Platform. In Proceedings of the 2019 International Conference on Computer and Information Sciences (ICCIS), Sakaka, Saudi Arabia, 3–4 April 2019; pp. 1–6. [Google Scholar] [CrossRef]
- Faruki, P. AndroSimilar: Robust Statistical Feature Signature for Android Malware Detection. In Proceedings of the 6th International Conference on Security of Information and Networks, Aksaray, Turkey, 26–28 November 2013; pp. 152–159. [Google Scholar]
- Feng, J.; Shen, L.; Chen, Z.; Wang, Y.; Li, H. A Two-Layer Deep Learning Method for Android Malware Detection Using Network Traffic. IEEE Access 2020, 8, 125786–125796. [Google Scholar] [CrossRef]
- Yu, L.; Guan, X.; Fan, M.; Luo, X.; Liu, T.; Liu, J. Android malware detection: A survey. Sci. Sin. Inf. 2020, 50, 1148–1177. [Google Scholar] [CrossRef]
- Ashawa, M.; Morris, S. Host-Based Detection and Analysis of Android Malware. Int. J. Inf. Secur. Res. 2019, 9, 871–880. [Google Scholar] [CrossRef]
- Ashawa, M.; Morris, S. Analysis of Android Malware Detection Techniques: A Systematic Review. Int. J. Cyber-Secur. Digit. Forensics 2019, 8, 177–187. [Google Scholar] [CrossRef]
- Felt, A.P.; Chin, E.; Hanna, S.; Song, D.; Wagner, D. Android permissions demystified. In Proceedings of the 18th ACM conference on Computer and communications security, Chicago, IL, USA, 17–21 October 2011; pp. 627–638. [Google Scholar] [CrossRef] [Green Version]
- Felt, A.P.; Ha, E.; Egelman, S.; Haney, A.; Chin, E.; Wagner, D. Android permissions: A perspective combining risks and benefits. In Proceedings of the Eighth Symposium on Usable Privacy and Security (SOUPS ‘12). Association for Computing Machinery, New York, NY, USA, 11–13 July 2012; pp. 1–14. [Google Scholar] [CrossRef]
- Kesler, R.; Kummer, M.E.; Schulte, P. Mobile Applications and Access to Private Data: The Supply Side of the Android Ecosystem. SSRN Electron. J. 2018, 17, 17–75. [Google Scholar] [CrossRef] [Green Version]
- Nguyen-Vu, L.; Ahn, J.; Jung, S. Android Fragmentation in Malware Detection. Comput. Secur. 2019, 87, 101573. [Google Scholar] [CrossRef]
- Ifip, A.; Conference, W.G.; Hutchison, D. Data and Applications Security and Privacy XXVII; Springer: Cham, Switzerland, 2013. [Google Scholar]
- Wei, X.; Gomez, L.; Neamtiu, I.; Faloutsos, M. Permission evolution in the Android ecosystem. In Proceedings of the 28th Annual Computer Security Applications Conference (ACSAC ‘12), Association for Computing Machinery, New York, NY, USA, 3–7 December 2012; pp. 31–40. [Google Scholar] [CrossRef] [Green Version]
- Gorski, S.A.; Enck, W. ARF: Identifying redelegation vulnerabilities in Android system services. In Proceedings of the 12th Conference on Security and Privacy in Wireless and Mobile Networks (WiSec ‘19). Association for Computing Machinery, New York, NY, USA, 15–17 May 2019; pp. 151–161. [Google Scholar] [CrossRef]
- Monrose, F.; Dacier, M.; Blanc, G.; Garcia-Alfaro, J. Research in Attacks, Intrusions, and Defenses. In Proceedings of the 19th International Symposium, RAID 2016, Paris, France, 19–21 September 2016. [Google Scholar]
- Zhauniarovich, Y.; Gadyatskaya, O. Small Changes, Big Changes: An Updated View on the Android Permission System; Sringer: Cham, Switzerland, 2016; pp. 346–367. [Google Scholar] [CrossRef]
- Mahmood, R.; Mirzaei, N.; Malek, S. EvoDroid: Segmented Evolutionary Testing of Android apps; Springer: Cham, Switzerland, 2014; pp. 599–609. [Google Scholar] [CrossRef]
- Gallingani, D.; Zanero, S.; Venkatakrishnan, V.N. Practical exploit generation for intent message vulnerabilities in android. In Proceedings of the 5th ACM Conference on Data and Application Security and Privacy (CODASPY ’15). Association for Computing Machinery, New York, NY, USA, 2–4 March 2015; pp. 155–157. [Google Scholar] [CrossRef]
- Elish, K.O.; Yao, D.D.; Ryder, B.G.; Tech, V. On the need of precise inter-app ICC classification for detecting Android malware collusions. In Proceedings of IEEE Mobile Security Technologies (MoST), in Conjunction with the IEEE Symposium on Security and Privacy. 2015. Available online: https://www.ieee-security.org/TC/SPW2015/MoST/papers/s2p4.pdf (accessed on 9 July 2021).
- Pektaş, A.; Acarman, T. Deep learning for effective Android malware detection using API call graph embeddings. Soft Comput. 2019, 24, 1027–1043. [Google Scholar] [CrossRef]
- Cao, S.; Sun, X.; Bo, L.; Wei, Y.; Li, B. BGNN4VD: Constructing Bidirectional Graph Neural-Network for Vulnerability Detection. Inf. Softw. Technol. 2021, 136, 106576. [Google Scholar] [CrossRef]
- Wu, Y.; Lu, J.; Zhang, Y. Vulnerability Detection in C/C ++ Source Code with Graph Representation Learning. In Proceedings of the 2021 IEEE 11th Annual Computing and Communication Workshop and Conference (CCWC), Nevada, NV, USA, 27–30 January 2021; pp. 1519–1524. [Google Scholar]
- Alasmary, H.; Abusnaina, A.; Jang, R.; Abuhamad, M.; Anwar, A.; Nyang, D.; Mohaisen, D. Soteria: Detecting Adversarial Examples in Control Flow Graph-based Malware Classifiers. In Proceedings of the 2020 IEEE 40th International Conference on Distributed Computing Systems (ICDCS), Singapore, 29 November–1 December 2020; pp. 888–898. [Google Scholar] [CrossRef]
- Feng, Y.; Chen, L.; Zheng, A.; Gao, C.; Zheng, Z. AC-Net: Assessing the Consistency of Description and Permission in Android Apps. IEEE Access 2019, 7, 57829–57842. [Google Scholar] [CrossRef]
- Rashidi, B.; Fung, C.; Nguyen, A.; Vu, T.; Bertino, E. Android User Privacy Preserving Through Crowdsourcing. IEEE Trans. Inf. Forensics Secur. 2017, 13, 773–787. [Google Scholar] [CrossRef]
- Wang, X.; Li, C.; Song, D.; Wang, C. CrowdNet: Identifying Large-Scale Malicious Attacks Over Android Kernel Structures. IEEE Access 2020, 8, 15823–15837. [Google Scholar] [CrossRef]
- Irshad, M.; Al-Khateeb, H.; Mansour, A.; Ashawa, M.; Hamisu, M. Effective methods to detect metamorphic malware: A systematic review. Int. J. Electron. Secur. Digit. Forensics 2018, 10, 138. [Google Scholar] [CrossRef]
- Mishra, P.; Aggarwal, P.; Vidyarthi, A.; Singh, P.; Khan, B.; Alhelou, H.H.; Siano, P. VMShield: Memory Introspection-Based Malware Detection to Secure Cloud-Based Services Against Stealthy Attacks. IEEE Trans. Ind. Inform. 2021, 17, 6754–6764. [Google Scholar] [CrossRef]
- Joux, A. Attacks on stream ciphers. Taylor and Francis Group, algorithmic cryptanalysis. 2009, pp. 391–414. Available online: https://www.iacr.org/books/2010_tf_Joux_AlgorithmicCryptanalysis.pdf (accessed on 9 July 2021). [CrossRef]
- Yuan, Y.; Wu, L.; Zhang, X.; Yang, Y. Side-channel collision attack based on multiple-bits. In Proceedings of the 2017 11th IEEE International Conference on Anti-counterfeiting, Security, and Identification (ASID), Xiamen, China, 27–29 October 2017; pp. 1–5. [Google Scholar] [CrossRef]
- Song, L.; Tang, Z.; Li, Z.; Gong, X.; Chen, X.; Fang, D.; Wang, Z. AppIS: Protect Android Apps Against Runtime Repackaging Attacks. In Proceedings of the 2017 IEEE 23rd International Conference on Parallel and Distributed Systems (ICPADS), Shenzhen, China, 15–17 December 2017; pp. 25–32. [Google Scholar] [CrossRef] [Green Version]
- Arnaldy, D.; Perdana, A.R. Implementation and Analysis of Penetration Techniques Using the Man-In-The-Middle Attack. In Proceedings of the 2019 2nd International Conference of Computer and Informatics Engineering (IC2IE), Banyuwangi, Indonesia, 10–11 September 2019; pp. 188–192. [Google Scholar] [CrossRef]
- Aung, Z.; Zaw, W. Permission-Based Android Malware Detection. Int. J. Sci. Technol. Res. 2013, 2, 228–234. [Google Scholar]
- Sahin, D.; Kural, O.E.; Akleylek, S.; Kılıç, E. A novel permission-based Android malware detection system using feature selection based on linear regression. Neural Comput. Appl. 2021, 1–16. [Google Scholar] [CrossRef]
- Mcdonald, J.; Herron, N.; Glisson, W.; Benton, R. Machine Learning-Based Android Malware Detection Using Manifest Permissions. In Proceedings of the 54th Hawaii International Conference on System Sciences, Kauai, HI, USA, 5–8 January 2021; p. 6976. [Google Scholar] [CrossRef]
- Mathur, A.; Podila, L.M.; Kulkarni, K.; Niyaz, Q.; Javaid, A.Y. NATICUSdroid: A malware detection framework for Android using native and custom permissions. J. Inf. Secur. Appl. 2021, 58, 102696. [Google Scholar] [CrossRef]
- Shahriar, H.; Islam, M.; Clincy, V. Android malware detection using permission analysis. SoutheastCon 2017, 2017, 1–6. [Google Scholar] [CrossRef]
- Al Ajrawi, S.; Agrawal, A.; Mangal, H.; Putluri, K.; Reid, B.; Hanna, G.; Sarkar, M. Evaluating business Yelp’s star ratings using sentiment analysis. Mater. Today Proc. 2021. [Google Scholar] [CrossRef]
- Paper, F. Latent Semantic Indexing: An overview. Techn. Rep. INFOSYS 2000, 240, 1–16. [Google Scholar]
- Li, J.; Sun, L.; Yan, Q.; Li, Z.; Srisa-An, W.; Ye, H. Significant Permission Identification for Machine-Learning-Based Android Malware Detection. IEEE Trans. Ind. Inform. 2018, 14, 3216–3225. [Google Scholar] [CrossRef]
- Arora, A.; Peddoju, S.K.; Conti, M. PermPair: Android Malware Detection Using Permission Pairs. IEEE Trans. Inf. Forensics Secur. 2019, 15, 1968–1982. [Google Scholar] [CrossRef]
- Khariwal, K.; Singh, J.; Arora, A. IPDroid: Android Malware Detection using Intents and Permissions. In Proceedings of the 2020 Fourth World Conference on Smart Trends in Systems, Security and Sustainability (WorldS4), London, UK, 27–28 July 2020; pp. 197–202. [Google Scholar] [CrossRef]
- Wang, H.; Li, Y.; A Khan, S.; Luo, Y. Prediction of breast cancer distant recurrence using natural language processing and knowledge-guided convolutional neural network. Artif. Intell. Med. 2020, 110, 101977. [Google Scholar] [CrossRef]
- Wu, X.; Zhao, Y.; Radev, D.; Malhotra, A. Identification of patients with carotid stenosis using natural language processing. Eur. Radiol. 2020, 30, 4125–4133. [Google Scholar] [CrossRef]
- Peddoju, S.K.; Upadhyay, H.; Soni, J.; Prabakar, N. Natural Language Processing based Anomalous System Call Sequences Detection with Virtual Memory Introspection. Int. J. Adv. Comput. Sci. Appl. 2020, 11, 455. [Google Scholar] [CrossRef]
- 2Xipeng, Q.I.U.; Tianxiang, S.U.N.; Yige, X.U.; Yunfan, S.; Ning, D.A.I.; Xuanjing, H. Pre-trained models for natural language processing: A survey. Sci. China Technol. Sci. 2020, 63, 1–26. [Google Scholar] [CrossRef]
- Vu, L.N.; Jung, S. AdMat: A CNN-on-Matrix Approach to Android Malware Detection and Classification. IEEE Access 2021, 9, 39680–39694. [Google Scholar] [CrossRef]
- Mahindru, A.; Singh, P. Dynamic Permissions based Android Malware Detection using Machine Learning Techniques. In Proceedings of the 10th Innovations in Software Engineering Conference, Jaipur, India, 5–7 February 2017; pp. 202–210. [Google Scholar] [CrossRef]
- Leeds, M.; Keffeler, M.; Atkison, T. A comparison of features for android malware detection. In Proceedings of the SouthEast Conference, New York, NY, USA, 13–15 April 2017; pp. 63–68. [Google Scholar] [CrossRef]
- Zhang, L.; Ji, Q. A Bayesian Network Model for Automatic and Interactive Image Segmentation. IEEE Trans. Image Process. 2011, 20, 2582–2593. [Google Scholar] [CrossRef] [PubMed] [Green Version]
- Sullivan, J.; Blake, A.; Isard, M.; MacCormick, J. Object localization by Bayesian correlation. In Proceedings of the Seventh IEEE International Conference on Computer Vision, Kerkyra, Greece, 20–27 September 1999; Volume 2, pp. 1068–1075. [Google Scholar] [CrossRef]
- Dahman, G.; Flordelis, J.; Tufvesson, F. Cross-Correlation of Large-Scale Parameters in Multi-Link Systems: Analysis Using the Box-Cox Transformation. IEEE Access 2018, 6, 13555–13564. [Google Scholar] [CrossRef]
- Sarder, P.; Schierding, W.; Cobb, J.P.; Nehorai, A. Estimating Sparse Gene Regulatory Networks Using a Bayesian Linear Regression. IEEE Trans. NanoBioscience 2010, 9, 121–131. [Google Scholar] [CrossRef] [PubMed]
- Safayani, M.; Momenzadeh, S.; Mirzaei, A.; Razavi, M.S. A latent variable model for two-dimensional canonical correlation analysis and the variational inference. Soft Comput. 2020, 24, 8737–8749. [Google Scholar] [CrossRef]
- Bai, H.; Xie, N.; Di, X.; Ye, Q. FAMD: A fast multifeature Android malware detection framework, design and implementation. IEEE Access 2020, 8, 1. [Google Scholar] [CrossRef]
- Zhang, X.; Lashkari, A.H.; Ghorbani, A.A. Classifying and clustering malicious advertisement uniform resource locators using deep learning. Comput. Intell. 2020, 37, 511–537. [Google Scholar] [CrossRef]
- Ahirwal, R.R.; Ahke, M. Elliptic Curve Diffie-Hellman Key Exchange Algorithm for Securing Hypertext Information on Wide Area Network. Int. J. Comput. Sci. Inf. Technol. 2013, 4, 363–368. [Google Scholar]
- Barrera, D.; Kayacik, H.G.; van Oorschot, P.C.; Somayaji, A. A methodology for empirical analysis of permission-based security models and its application to android. In Proceedings of the 17th ACM conference on Computer and communications security, Chicago, IL, USA, 4–8 October 2010. [Google Scholar] [CrossRef] [Green Version]
- Wang, Y.; Han, F.; Zhu, L.; Deussen, O.; Chen, B. Line Graph or Scatter Plot? Automatic Selection of Methods for Visualizing Trends in Time Series. IEEE Trans. Vis. Comput. Graph. 2017, 24, 1141–1154. [Google Scholar] [CrossRef] [PubMed]
- Schlegel, S.; Korn, N.; Scheuermann, G. On the Interpolation of Data with Normally Distributed Uncertainty for Visualization. IEEE Trans. Vis. Comput. Graph. 2012, 18, 2305–2314. [Google Scholar] [CrossRef]
- Lee, J.; Son, H.; Lee, G.; Lee, J.; Cho, S.; Lee, S. Deep color transfer using histogram analogy. Vis. Comput. 2020, 36, 1–15. [Google Scholar] [CrossRef]
- Van Der Maaten, L. Accelerating t-SNE using Tree-Based Algorithms. J. Mach. Learn. Res. 2014, 15, 3221–3245. [Google Scholar]
- Arora, S. An Analysis of the t-SNE Algorithm for Data Visualization. In Proceedings of the Conference on Learning Theory, Stockholm, Sweden, 5–9 July 2018; Volume 75, pp. 1–8. [Google Scholar]
- Faradonbeh, R.S.; Haghshenas, S.S.; Taheri, A.; Mikaeil, R. Application of self-organizing map and fuzzy c-mean techniques for rockburst clustering in deep underground projects. Neural Comput. Appl. 2019, 32, 8545–8559. [Google Scholar] [CrossRef]
- Teanby, N. An icosahedron-based method for even binning of globally distributed remote sensing data. Comput. Geosci. 2006, 32, 1442–1450. [Google Scholar] [CrossRef]
- Contagio Malware Dump. Available online: https://www.impactcybertrust.org/dataset_view?idDataset=1273 (accessed on 12 July 2021).
- VirusShare. VirusShare.com—Because Sharing is Caring. Available online: https://virusshare.com/login (accessed on 9 July 2021).
- AndroZoo. AndroZoo Access Conditions. Available online: https://androzoo.uni.lu/access (accessed on 9 July 2021).
- Impact Cyber Trust. The Drebin Dataset. Available online: https://www.impactcybertrust.org/dataset_view?idDataset=1372 (accessed on 9 July 2021).
- Ashawa, M.; Morris, S. Android Permission Classifier: A deep learning algorithmic framework based on protection and threat levels. Secur. Priv. 2021, 4, e164. [Google Scholar] [CrossRef]
- Van Erven, T.; Harremoës, P. Rényi Divergence and Kullback—Leibler Divergence. IEEE Trans. Inform. Theory 2014, 60, 3797–3820. [Google Scholar] [CrossRef] [Green Version]
- Aronsson, J.; Butt, K.; Jeffrey, I.; I Okhmatovski, V. The Barnes–Hut Hierarchical Center-of-Charge Approximation for Fast Capacitance Extraction in Multilayered Media. IEEE Trans. Microw. Theory Tech. 2010, 58, 1175–1188. [Google Scholar] [CrossRef]
- Khan, M.; Shah Khan, S. Data and Information Visualization Methods, and Interactive Mechanisms: A Survey. Int. J. Comput. Appl. 2011, 34, 975–8887. [Google Scholar]
- Myasnikov, E. Nearest Neighbor Search in Hyperspectral Data Using Binary Space Partitioning Trees. In Proceedings of the 11th Workshop on Hyperspectral Imaging and Signal Processing: Evolution in Remote Sensing (WHISPERS), Amsterdam, The Netherlands, 24–26 March 2021; pp. 1–4. [Google Scholar] [CrossRef]
- Nielsen, F. Bregman vantage point trees for efficient nearest neighbor queries. In Proceedings of the 2009 IEEE International Conference on Multimedia and Expo, New York, NY, USA, 28 June–3 July 2009; pp. 878–881. [Google Scholar]
- Kohonen, T. Essentials of the self-organizing map. Neural Netw. 2013, 37, 52–65. [Google Scholar] [CrossRef]
- Manera, M. Exploratory Factor Analysis of Rainbow Trout Serum Chemistry Variables. Int. J. Environ. Res. Public Health 2021, 18, 1537. [Google Scholar] [CrossRef] [PubMed]
- Viloria, A.; Bucci, N.; Luna, M.; Lis-Gutiérrez, J.-P.; Parody, A.; Bent, D.E.S.; López, L.A.B. Determination of Dimensionality of the Psychosocial Risk Assessment of Internal, Individual, Double Presence and External Factors in Work Environments; Springer: Cham, Switzerland, 2018; pp. 304–313. [Google Scholar] [CrossRef]
- Matzke, D.; Ly, A.; Selker, R.; Weeda, W.D.; Scheibehenne, B.; Lee, M.D.; Wagenmakers, E.-J. Bayesian Inference for Correlations in the Presence of Measurement Error and Estimation Uncertainty. Collabra Psychol. 2017, 3, 25. [Google Scholar] [CrossRef]
- Tan, P.; Filter, A.P. An Adaptive Particle Filter Based on Posterior. In Proceedings of the 2010 8th World Congress on Intelligent Control and Automation, Jinan, China, 7–9 July 2010; pp. 5886–5890. [Google Scholar]
- An, E.; Ctor, I. Modeling heavy-tailed bounded data by the trapezoidal beta distribution with applications. Revstat. Appear 2021, 1–19. [Google Scholar]
- Tonhauser, J.; Matthewson, L. Empirical Evidence in Research on Meaning. Master’s Thesis, The Ohio State University and University of British Columbia, Ohio, OH, USA, 2015; pp. 2010–2015. [Google Scholar]
- Vinkenburg, C.J.; Weber, T. Managerial career patterns: A review of the empirical evidence. J. Vocat. Behav. 2012, 80, 592–607. [Google Scholar] [CrossRef]
- Balakrishnan, N.; Chimitova, E.; Galanova, N.; Vedernikova, M. Testing Goodness of Fit of Parametric AFT and PH Models with Residuals. Commun. Stat. Simul. Comput. 2013, 42, 1352–1367. [Google Scholar] [CrossRef]
- Wanke, P.; Chen, Z.; Zheng, X.; Antunes, J. Sustainability efficiency and carbon inequality of the Chinese transportation system: A Robust Bayesian Stochastic Frontier Analysis. J. Environ. Manag. 2020, 260, 110163. [Google Scholar] [CrossRef] [PubMed]
- Zhang, J.-T.; Zhou, B.; Guo, J.; Liu, X.; Ibm, X.-A. A Modified Bartlett Test for Heteroscedastic Two-way MANOVA. J. Adv. Stat. 2016, 1. [Google Scholar] [CrossRef]
- Niemi, J. Parameter Estimation. Norm. Model 2015, 1–35. [Google Scholar]
- Parra-Frutos, I. Testing homogeneity of variances with unequal sample sizes. Comput. Stat. 2012, 28, 1269–1297. [Google Scholar] [CrossRef]
- Sataeva, T.S.; Lemeshko, B.Y. About properties and power of classical tests of homogeneity of variances. In Proceedings of the 2016 11th International Forum on Strategic Technology (IFOST), Novosibirsk, Russia, 1–3 June 2016; pp. 350–354. [Google Scholar] [CrossRef]
- Ghazal, M.; Amer, A. Homogeneity Localization Using Particle Filters with Application to Noise Estimation. IEEE Trans. Image Process. 2010, 20, 1788–1796. [Google Scholar] [CrossRef] [PubMed]
- Lu, M. An embedded method for gene identification problems involving unwanted data heterogeneity. Hum. Genom. 2019, 13, 45. [Google Scholar] [CrossRef] [PubMed]
- Kumar, K. A Beginner’s Guide to Structural Equation Modeling, 3rd ed.; Psychology Press: East Sussex, UK, 2012; Volume 175, no. 3. [Google Scholar]
- Jacobs, R.; Smith, P.; Goddard, M. CENTRE FOR H EALTH E CONOMICS Measuring performance: An Examination of Composite Performance Indicators; Centre of Health Economics, University of York: York, UK, 2004. [Google Scholar]
- Hoskins, T.J. Proofs of the Twin Primes and Goldbach Conjectures. arXiv 2019, 1–33. [Google Scholar]
- Robert, C.; Chopin, N.; Rousseau, J. Harold Jeffreys’s Theory of Probability Revisited. Stat. Sci. 2009, 24. [Google Scholar] [CrossRef]
- Qin, C.; Schlemper, J.; Caballero, J.; Price, A.N.; Hajnal, J.V.; Rueckert, D. Convolutional Recurrent Neural Networks for Dynamic MR Image Reconstruction. IEEE Trans. Med Imaging 2018, 38, 280–290. [Google Scholar] [CrossRef] [PubMed] [Green Version]
- Behseta, S.; Berdyyeva, T.; Olson, C.R.; Kass, R.E. Bayesian Correction for Attenuation of Correlation in Multi-Trial Spike Count Data. J. Neurophysiol. 2009, 101, 2186–2193. [Google Scholar] [CrossRef] [PubMed] [Green Version]


| Code Name | Platform Version | API Level | Number of Permissions |
|---|---|---|---|
| Android 11 beta | 11 | 30 | 167 |
| Q | 10 | 29 | 158 |
| PI | 9 | 28 | 148 |
| Oreo | 8.0−8.1 | 26−27 | 144 |
| Nougat | 7.0−7.1 | 24−25 | 135 |
| Marshmallow | 6 | 23 | 131 |
| Lollipop | 5.0−5.1 | 21−22 | 120 |
| KitKat Watch | 4.4 W | 20 | 113 |
| KitKat | 4.4 | 19 | 112 |
| Jelly Bean | 4.1−4.3.1 | 16−18 | 104 |
| Ice Cream Sandwich | 4.0.1−4.0.4 | 14−15 | 98 |
| Honeycomb | 3.0.−3.2 | 11−13 | 95 |
| Gingerbread | 2.0−2.3.5 | 9−10 | 94 |
| Froyo | 2.2. | 8 | 87 |
| Éclair | 2.0−2.1 | 5−7 | 86 |
| Donut | 1.6 | 4 | 85 |
| Cupcake | 1.5 | 3 | 81 |
| Base | 1−1.1 | 1−2 | 73 |
| Factor 1 | Factor 2 | Factor 3 | |
|---|---|---|---|
| WRITE_SMS | 0.972 | 0.077 | −0.220 |
| READ_SMS | −0.252 | 0.967 | |
| SEND_SMS | 0.934 | −0.302 | 0.191 |
| RECEIVE_SMS | 0.972 | 0.077 | −0.220 |
| RECEIVE_WAP_PUSH | −0.252 | 0.967 | |
| CALL_PHONE | 0.934 | −0.302 | 0.191 |
| READ_PHONE_STATE | −0.252 | 0.967 | |
| READ_CALL_LOG | 0.934 | −0.302 | 0.191 |
| WRITE_CALL_LOG | 0.972 | 0.077 | −0.220 |
| ADD_VOICE_MAIL | −0.252 | 0.967 | |
| USE_SIP | 0.934 | −0.302 | 0.191 |
| PROCESS_OUTGOING_CALLS | 0.972 | 0.077 | −0.220 |
| GET_ACCOUNTS | −0.252 | 0.967 | |
| READ_ACCOUNTS | 0.934 | −0.302 | 0.191 |
| WRITE_ACCOUNTS | 0.972 | 0.077 | −0.220 |
| ACCESS_CAMERA | −0.252 | 0.967 | |
| READ_EXTERNAL_STORAGE | 0.934 | −0.302 | 0.191 |
| WRITE_EXTERNAL_STORAGE | 0.934 | −0.302 | 0.191 |
| READ_CALENDAR | 0.934 | −0.302 | 0.191 |
| ACCESS_COARSE_LOCATION | −0.252 | 0.967 | |
| ACCESS_FINE_LOCATION | 0.972 | 0.077 | −0.220 |
| RECORD_AUDIO | 0.934 | −0.302 | 0.191 |
| WRITE_CALENDAR | 0.972 | 0.077 | −0.220 |
| n | |||
|---|---|---|---|
| n1 | 15.925 | 2.130 | 0.708 |
| n2 | 16.002 | 3.403 | 0.611 |
| n3 | 16.201 | 3.342 | 0.579 |
| n4 | 15.925 | 2.133 | 0.731 |
| n5 | 16.002 | 2.421 | 0.816 |
| n6 | 15.001 | 3.342 | 0.903 |
| n7 | 15.521 | 2.530 | 0.881 |
| n8 | 15.106 | 3.501 | 0.908 |
| n9 | 17.067 | 2.367 | 0.736 |
| Mean | SD | Lower | Upper | BF₁₀ | ||||
|---|---|---|---|---|---|---|---|---|
| Fixed effects | μ | 5.585 | 0.274 | 5.030 | 6.117 | 2.8x1084 | ||
| Random effects | μ | 5.588 | 0.276 | 5.049 | 6.124 | 7.2x1051 | ||
| τ | 0.209 | 0.163 | 0.010 | 0.601 | 0.291 | ᵃ | ||
| Averaged | μ | ᵇ | 5.586 | 0.273 | 5.045 | 6.119 | ∞ | |
| τ | ᶜ | 0.291 | ||||||
| Precision | Recall | F1 Score | Support | AUC | |
|---|---|---|---|---|---|
| Protection level | 0.917 | 1.000 | 0.957 | 11 | 0.996 |
| Threat level | 1.000 | 0.909 | 0.952 | 11 | 0.975 |
| Models | P(M) | P(M|data) | BF M | BF 10 | error % |
|---|---|---|---|---|---|
| RM Factor 1 + Correlation + SEND_SMS + RECEIVE_SMS + RM Factor 1 ✻ Correlation | 0.050 | 0.966 | 535.883 | 1.000 | |
| RM Factor 1 + Correlation + RECEIVE_SMS + RM Factor 2 ✻ Correlation | 0.050 | 0.034 | 0.674 | 0.035 | 0.070 |
| RM Factor 1 + Correlation + SEND_SMS + RM Factor 3 ✻ Correlation | 0.050 | 1.044 × 10⁻²¹ | 1.984 × 10⁻²⁰ | 1.081 × 10⁻²¹ | 0.537 |
| RM Factor 2 + Correlation + RM Factor 1 ✻ Correlation | 0.050 | 1.005 × 10⁻²⁹ | 1.910 × 10⁻²⁸ | 1.041 × 10⁻²⁹ | 0.979 |
| RM Factor 2 + SEND_SMS + RECEIVE_SMS + RM Factor 2 ✻ Correlation | 0.050 | 3.255 × 10−38 | 6.184 × 10−37 | 3.370 × 10−38 | 0.411 |
| RM Factor 2 + Correlation + SEND_SMS + RM Factor 3 ✻ Correlation | 0.050 | 1.184 × 10−38 | 2.250 × 10⁻¹³ | 1.226 × 10−38 | 0.321 |
| RM Factor 3 + Correlation + RECEIVE_SMS + RM Factor 1 ✻ Correlation | 0.050 | 5.025 × 10−39 | 9.547 × 10−38 | 5.203 × 10−39 | 0.960 |
| RM Factor 3 + RECEIVE_SMS + RM Factor 2 ✻ Correlation | 0.050 | 1.378 × 10−41 | 2.617 × 10−40 | 1.426 × 10−41 | 0.173 |
| RM Factor 3 + Correlation + SEND_SMS + RM Factor 3 ✻ Correlation | 0.050 | 3.116 × 10−49 | 5.919 × 10−48 | 3.226 × 10−49 | 0.265 |
| Correlation + RECEIVE_SMS | 0.050 | 1.790 × 10⁻¹³ | 3.402 × 10⁻³² | 1.854 × 10⁻³³ | 0.007 |
| SEND_SMS + RECEIVE_SMS | 0.050 | 1.347 × 10 −13 | .559 × 10−32 | 1.395 × 10⁻³³ | 0.580 |
| Correlation + SEND_SMS | 0.050 | 8.379 × 10⁻¹⁴ | 1.592 × 10⁻³² | 8.676 × 10⁻³⁴ | 0.885 |
| Correlation + SEND_SMS + RECEIVE_SMS | 0.050 | 3.802 × 10⁻¹⁴ | 7.224 × 10⁻³³ | 3.937 × 10⁻³⁴ | 0.793 |
| Null model (incl. subject) | 0.050 | 7.182 × 10⁻¹³ | 1.365 × 10−37 | 7.437 × 10⁻³⁵ | 0.529 |
| SEND_SMS | 0.050 | 5.468 × 10⁻¹³ | 1.039 × 10⁻³⁵ | 5.662 × 10⁻³⁵ | 0.740 |
| Correlation | 0.050 | 1.428 × 10⁻¹³ | 2.714 × 10−41 | 1.479 × 10⁻³⁵ | 0.660 |
Publisher’s Note: MDPI stays neutral with regard to jurisdictional claims in published maps and institutional affiliations. |
© 2021 by the authors. Licensee MDPI, Basel, Switzerland. This article is an open access article distributed under the terms and conditions of the Creative Commons Attribution (CC BY) license (https://creativecommons.org/licenses/by/4.0/).
Share and Cite
Ashawa, M.; Morris, S. Modeling Correlation between Android Permissions Based on Threat and Protection Level Using Exploratory Factor Plane Analysis. J. Cybersecur. Priv. 2021, 1, 704-742. https://doi.org/10.3390/jcp1040035
Ashawa M, Morris S. Modeling Correlation between Android Permissions Based on Threat and Protection Level Using Exploratory Factor Plane Analysis. Journal of Cybersecurity and Privacy. 2021; 1(4):704-742. https://doi.org/10.3390/jcp1040035
Chicago/Turabian StyleAshawa, Moses, and Sarah Morris. 2021. "Modeling Correlation between Android Permissions Based on Threat and Protection Level Using Exploratory Factor Plane Analysis" Journal of Cybersecurity and Privacy 1, no. 4: 704-742. https://doi.org/10.3390/jcp1040035
APA StyleAshawa, M., & Morris, S. (2021). Modeling Correlation between Android Permissions Based on Threat and Protection Level Using Exploratory Factor Plane Analysis. Journal of Cybersecurity and Privacy, 1(4), 704-742. https://doi.org/10.3390/jcp1040035