Article

The Occurrence of Widespread Slush Flow Events as an Indicator of Accelerating Climate Change in the Northwestern Italian Alps

1
Interregional Association of Coordination and Documentation for Snow and Avalanche Issues (AINEVA), 38122 Trento, Italy
2
Department of Natural and Environmental Risks, Regional Agency for Environmental Protection of Piedmont (Arpa Piemonte), 10135 Turin, Italy
*
Author to whom correspondence should be addressed.
GeoHazards 2026, 7(2), 67; https://doi.org/10.3390/geohazards7020067
Submission received: 5 May 2026 / Revised: 26 May 2026 / Accepted: 28 May 2026 / Published: 3 June 2026

Abstract

Slush flows are rapid mass movements of water-saturated snow and debris that develop when the liquid water content of the snowpack exceeds the critical threshold for the fully funicular regime, resulting in viscoplastic flow behavior fundamentally distinct from that of dry snow avalanches. These phenomena have been extensively documented globally as responsible for fatalities and economic damage comparable to those of snow avalanches. In the northwestern Italian Alps, the situation is markedly different. Until 2025, rain-on-snow (ROS) events in this region had produced amplified effects on the ground in the form of increased landslide activity, debris flow mobilization, and flooding, as typical consequences of snowmelt superimposed on pre-saturated soils but had not generated widespread slush flow phenomena. The 2025 season marked a critical threshold: for the first time, diffuse and unambiguous slush flow events were documented in Italian northwestern Alpine sectors, signaling a qualitative shift in the hazard regime rather than a mere quantitative intensification of known processes. Documented emergence of slush flows in the Italian Alps must be interpreted not as an anomaly but as a measurable indicator of climate change and of its progressive effects on the Alpine environment.

1. Introduction

Slush flows are rapid mass movements of water-saturated snow, capable of eroding and transporting debris, sediment, ice blocks, and organic material across considerable distances. Their systematic scientific description began with [1] in Scandinavian alpine environments. They were formally defined at the international Circum-Arctic Slushflow Workshop (Kirovsk, Russia) in 1992, summarized by [2], as “flowing mixtures of water and snow” in which the snow matrix is fully water-saturated and behaves as a viscoplastic fluid. Unlike dry snow avalanches, which typically release from slopes steeper than ~30°, slush flows can initiate on slopes as gentle as 5–10° and continue flowing over nearly flat terrain [2,3,4,5,6].
Rain-on-snow (ROS) events and rapid snowmelt can destabilize the snowpack and, when extreme, trigger cascading sequences of mass movements (snow avalanches, debris flows, and erosive water runoff) in which each process alters the boundary conditions for the next [7,8]. The July 2022 event in New Zealand’s Southern Alps illustrates the upper end of this spectrum: 547.8 mm of mid-winter rainfall over 72 h onto an above-average snowpack produced a large wet avalanche cycle followed by debris flows and channelized runoff that eroded several meters into the alluvial fan and overtopped a purpose-built deflection berm [8]. At volcanic sites, analogous slush flow-forming processes have been reconstructed under far more extreme thermal forcing: the 18 May 1980 pyroclastic surge at Mount St. Helens melted near-saturated spring snow at the surge base, generating thousands of small slush flows that coalesced downslope into catastrophic lahars travelling at over 100 km/h [9].
Slush flows are a documented lethal hazard. A single event in Japan in 1945 caused 88 fatalities [10]. In Norway over 150 years, cumulative economic damage from slush flows has been comparable to that from snow avalanches [2]. Eight fatalities occurred in Norway in the winters of 2010 and 2011 alone, prompting development of the world’s first operational regional slush flow early warning system [5]. Communities on the Faroe Islands were struck by damaging slush flows in December 2022. The Bildudalur valley in north-western Iceland has experienced at least ten events since 1900, with individual volumes of 6000–8000 m3 threatening the local community [11].
At Kistrandfjellet, Nordland County, Norway, Morken et al. [12] mapped three major events via aerial imagery, identifying 25 individual flows in total across 2021, 2023, and 2024. Against this ground truth, the national database held only 5 registered events, specifically 2 of 12 in 2021, 2 of 6 in 2023, and 1 of 7 in 2024. This sixfold undercount for 2021 undermines frequency-magnitude statistics derived from databases alone.
These phenomena are well documented in the northernmost regions of Europe, while they are decidedly rare and almost undocumented at lower latitudes. However, in the last two years, slush flows have been observed more frequently than ever in the Alps, particularly in the northwestern Italian Alps, as reported in Section 3. During the spring of 2025, following a ROS event, as previously observed in these Alpine regions, widespread slush flow triggers of significant magnitude occurred. The hypothesis is that these phenomena have appeared, or increased in number and magnitude, only in recent years due to ongoing climate change caused by the progressive warming of the Alpine environment.

1.1. State of the Art

The Circum-Arctic Slushflow Network Workshop (Kirovsk, Russia, 1992) definition, summarized in [2], characterizes slush flows as flowing water–snow mixtures in the fully saturated (funicular) regime. Two kinematic categories have been distinguished based on flow regime and velocity: minor slush flows characterized by sub-critical turbulent flow (Froude number Fr < 1) and velocities ranging from 0.3 to 3 m/s following [13]; slush torrents characterized by supercritical very rapid flows (Fr > 2) with velocities exceeding 20 m/s [14].
Hestnes [2] identifies three release types based on terrain morphology: (1) drainage channels and gullies on slopes; (2) snowpack impounded against narrow constrictions such as cirques or moraine ridges; and (3) bogs, flat depressions, and valley floors on impermeable substrates. D’Amboise et al. [14] revise Hastens’ classification [2], taking into account the following: stream channels or dominant terrain features where water naturally converges; shallow depressions where water pooling; open slopes characterized by bare rock faces, frozen ground or grass-covered land; bogs and lakes or nearly horizontal areas where snow can become completely soaked. A further classification is based on the mixture of materials contained in the flow, as proposed by [4], which distinguishes pure slush flows from those that evolve into debris flows through erosion and the incorporation of sediments.
The term “slush avalanche” is used interchangeably in the Norwegian and Icelandic literature [11,15]; this review follows [2] in preferring “slush flow”.
Diagnostic morphological characteristics, documented by [15] for Svalbard events and consistent with Norwegian and Icelandic cases, include the following: (a) lateral levees flanking the flow track; (b) a lobate, blunt terminus rather than a spreading fan; (c) preferential confinement to pre-existing gorges or drainage channels; and (d) incorporation of englacial and subglacial material. Hamre et al. [3] observed at Atigun Pass, Alaska, that repeated slush flows through confined gullies progressively incise and reshape the channel geometry, an effect documented in the form of distinctive “whaleback” debris fans at each gully mouth. From the global questionnaire study of Onesti and Hestnes [16] (n ≈ 300 events), approximately 70% of slush flows are released within stream channels or topographic depressions, and approximately 55% of flow tracks remain channel-confined.
Terminological inconsistency long hampered cross-national comparison. A workshop held at Kirovsk (Khibiny Mountains, Russia) in August 1992, bringing together researchers from Norway, Russia, and the United States, established a common nomenclature codified by [17] as follows: slush flow denotes the predominantly linear flow of water-saturated snow; the path is subdivided into starting zone, track, and runout zone; and slush flow fan (or whaleback) refers to fan-shaped debris deposits at the foot of recurrent gullies. The Russian term snow water flow was retained for qualitative description of flow consistency. The resulting terminology has since become the international reference for the field [2,5,6].
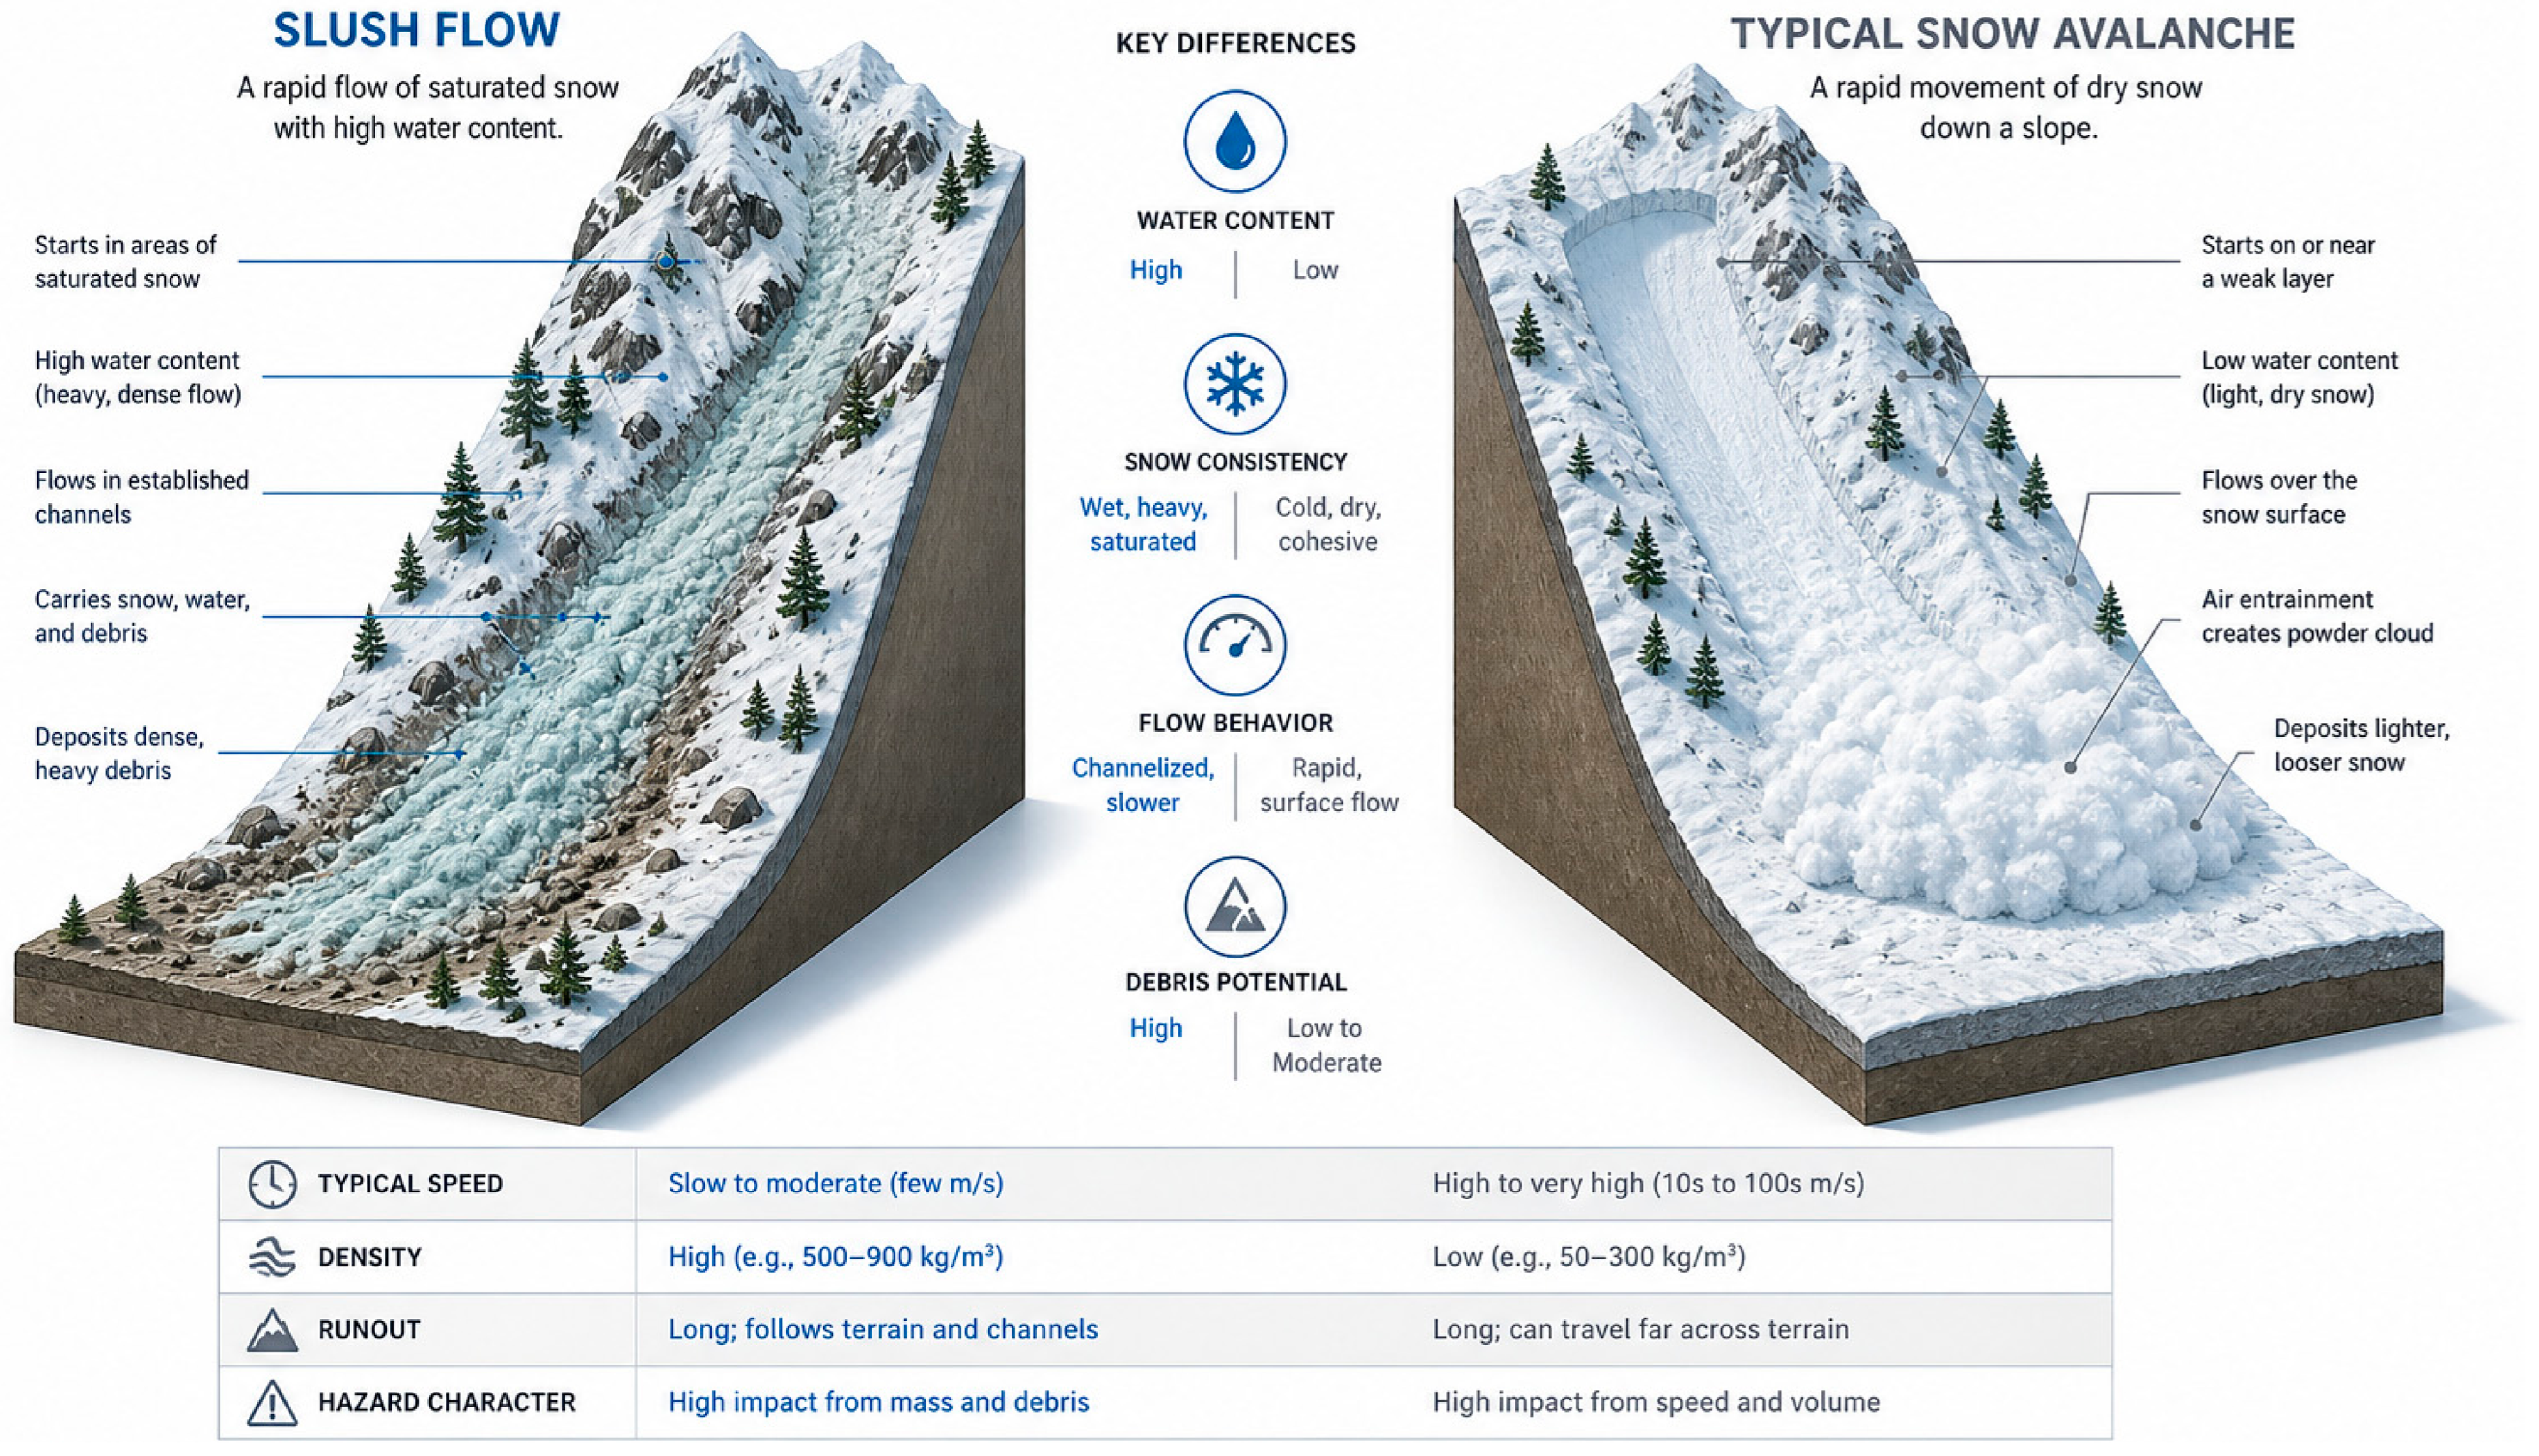
Slush flows must be distinguished from wet snow avalanches (Figure 1) and from debris flows, which originate in saturated soils and debris rather than snowpack. Post-event morphological discrimination can be ambiguous; Decaulne and Saemundsson [11] note that slush flows and debris flows can be coupled in the same event in Iceland when water-saturated snow overruns soil-mantled slopes.

1.2. Global Distribution and Occurrence Records

1.2.1. Norway: Norwegian National Rapid Mass Movement Database

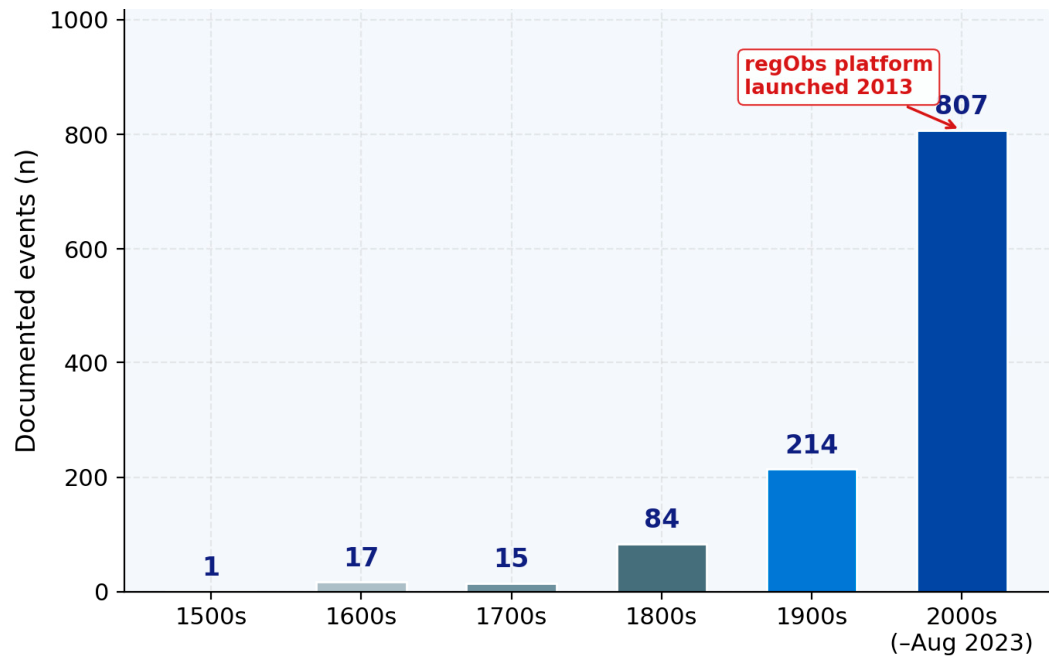
The Norwegian National Rapid Mass Movement Database (NSDB) is the world’s largest and most systematically maintained national slush flow record. As of 21 August 2023, it contained 1142 registered slush flow events spanning 1581–2023 [18]. The temporal distribution is heavily right-skewed: 807 events (70.7%) originate from the 2000s, reflecting the introduction of the crowdsourced Varsom regObs platform in 2013 and the expansion of the Norwegian Water Resources and Energy Directorate (NVE) National Landslide Forecasting and Warning Service (NLFWS) from 2013–2014 [5,19]. Per-century counts are as follows: 1 (1500s), 17 (1600s), 15 (1700s), 84 (1800s), 214 (1900s), and 807 (2000s to August 2023) [18] (Figure 2).
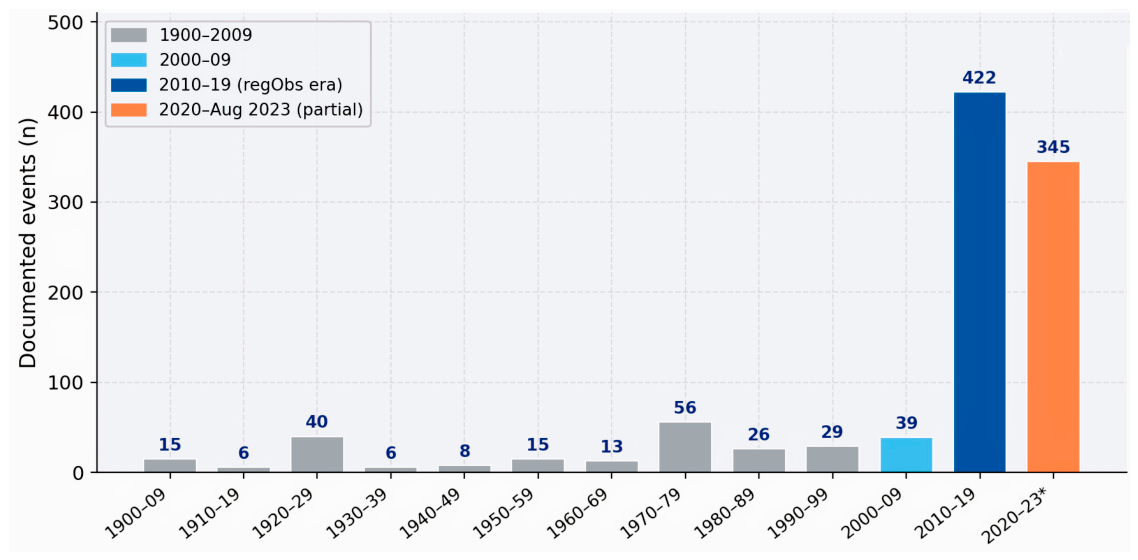
Decadal counts for 1900–2023 [18] are presented in Figure 3. The jump from 29 events in 1990–1999 to 422 in 2010–2019 reflects both improved reporting infrastructure and a possible real increase in event frequency. Lunde et al. [18] note that trend attribution is not straightforward due to the simultaneous change in monitoring effort.
Of the 1142 events, 666 have been subjected to formal quality control and assigned a rating A (best, n = 30, 2.6%) through D (worst, n = 75, 6.6%); 476 (41.7%) remain unreviewed. Only quality levels A and B (combined n = 207, 18.1%) are considered reliable for quantitative threshold calibration [5,18]. The monthly distribution shows a strong peak in February, with the great majority of events between December and March and near-zero occurrences in August and September.
The severity of underreporting was quantified by [11] at Kistrandfjellet, Nordland County, using multitemporal aerial imagery. For 2021, 12 individual slush flows were identified but only 2 were registered in the NSDB (detection rate 16.7%). For 2023: 6 actual vs. 2 registered; for 2024: 7 actual vs. 1 registered. Across all three events, 25 flows were mapped and only 5 registered (overall detection rate 20%). The authors recommend systematic aerial image acquisition as a supplement to the national monitoring protocol.
Norway operates the world’s first dedicated regional slush flow early warning service, established in 2013–2014 as part of the NVE NLFWS [19]. Sund et al. [5] provides a comprehensive methodological description. Daily bulletins are issued via the Varsom platform (varsom.no) covering four danger levels (green 1 through red 4), spatially resolved to regions of minimum ~7500 km2. The assessment integrates the following: (1) ground conditions, soil frost depth from HBV model; groundwater level from ~65 stations; (2) snow properties type: facets/depth hoar (FC/DH), new snow particles (PP), melt forms (MF), snow other type (OTH); depth from seNorge; Liquid Water Content (LWC) from snowpack; (3) water supply (QPF from MET Norway; snowmelt from energy balance model); and (4) regional expert input. The WSR (water supply-to-snow depth ratio) is the primary quantitative decision threshold [5].
Devoli et al. [20] evaluated NLFWS performance, finding a correct-warning rate exceeding 90%. Krøgli et al. [19] documented 19 warning days with danger level ≥3 for slush flows in the first three operational winters (2013–2016), with confirmed slush flow events on 17 of those 19 days (89%). The Nordland January 2023 case study [5]: 3-day water supply 75–141 mm on snowpack depths 39–115 cm, maximum WSR ~3, danger level 4; 43 slush flows registered in NSDB during the period. Only 207 events (18.1%) in the NSDB reach quality A or B [18]. Sund et al. [5] report that 394 quality-controlled slush flows are available from autumn 2013 to spring 2023, of which 152 are quality A or B, the subset used for WSR threshold calibration. The sixfold undercount documented by [12] implies that even these calibration datasets systematically underestimate true event frequency.

1.2.2. Iceland

Iceland is a high-density slush flow environment due to its subarctic oceanic climate combining heavy winter precipitation, rapid snowmelt episodes, and steep fjord topography over basaltic bedrock. Decaulne and Saemundsson [11] documented the historical record of the Bildudalur valley, north-western Iceland, identifying at least 10 events since the beginning of the twentieth century. Flow path length is approximately 600 m; volumes were estimated at 6000–8000 m3 per event using geomorphological field mapping. The 1997 and 1998 events were reconstructed using daily meteorological station data, confirming triggering by combined heavy rainfall and snowmelt during winter cyclonic activity.
Eckerstorfer and Christiansen [15] documented slush flows in Svalbard in the winters of 2009–2010 and 2010–2011, triggered by mid-winter rain events (January 2010: 11.7 mm rain; March 2011: 25.7 mm at Longyearbyen Airport). Their analysis confirmed that Svalbard slush flows are controlled by gorge topography and funicular-regime LWC, consistent with the wider literature.

1.2.3. Other Regions

The broadest global evidence comes from [16], whose questionnaire study (n ≈ 300 events) confirmed slush flow occurrence in all countries with seasonal snow cover. Japan is documented by Kobayashi et al. [16]: 88 fatalities from a single 1945 event. Larocque et al. [21] provided dendrogeomorphological evidence of slush flows in the Gaspé Peninsula, Québec, Canada, establishing centennial-scale frequencies from tree-ring disturbance records. Rapp and Nyberg [1] documented events in northern Scandinavia. Hamre et al. [3] describe a series of slush flows near Atigun Pass (Brooks Range), Alaska, dating back to 1982. Blatny et al. [6] provide the first detailed combined observational and three-dimensional numerical analysis of these Alaskan events (Bear Valley, Grand Whaleback, Sheep Gully, 1981–1982), reporting observed maximum velocities of 15–25 m/s over path lengths of 1000–2000 m on mean slope angles of 7–15°. These are among the highest velocities directly observed for slush flows and are consistent with superelevation measurements in channel bends (18–28 m/s) [3]. In Central Europe, Juras et al. [22] documented four slush avalanches in the Krkonoše Mountains (Czech Republic) triggered by slope springs, meltwater drainage from slush fields, and temporary brooks, confirming that the phenomenon occurs in mid-latitude mountain environments well outside the traditional Arctic and sub-Arctic focus area. Their photographic documentation shows flowing water within the starting zones, consistent with the Hestnes [2] classification of bogs and spring areas as a recognised release type. Slush avalanche occurrence in the Krkonoše area between 1962 and 2006 represents 9.4% of all recorded avalanche events in that database [22]. No equivalent systematic national database exists outside Norway.

1.3. Initiation Mechanisms and Threshold Conditions

1.3.1. Snowpack Liquid Water Content

The fundamental physical prerequisite for slush flow initiation is transition of the snowpack into the fully-funicular LWC regime. Denoth [23] characterized the pendular-to-funicular transition using dielectric measurements, establishing transition LWC values of 7–12% by volume for coarse-grained snow and 13–18% for new snow (Table 1).
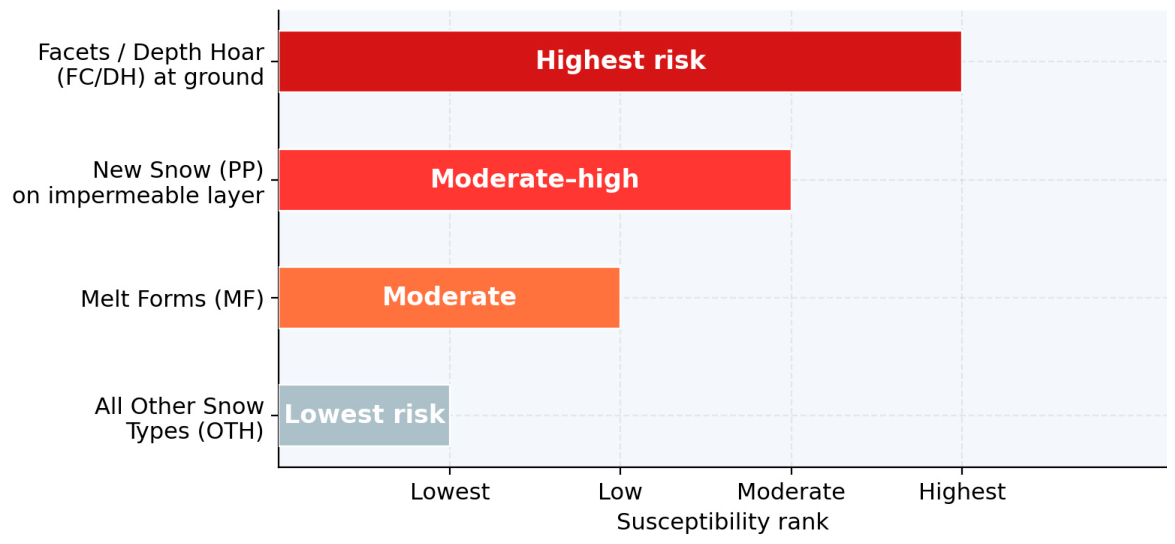
Fierz et al. [24] classified snowpack wetness into five classes: dry (<3% LWC), moist (3–8%), wet (8–15%), and soaked (>15%); the soaked class, in which all pore space is water-connected and gravitational drainage occurs, is the accepted trigger threshold for slush flows adopted in the Norwegian Slush Flow Early Warning (SFEWS) [5] (Figure 4).
How rapidly LWC builds toward the funicular threshold depends on the internal transport of meltwater through the snowpack. Marshall et al. [7], in a multi-year instrumented study on a 25–35° slope at Bogus Basin, Idaho, showed using dye tracers and stable isotopes that meltwater travels preferentially along stratigraphic boundaries, reaching topographic depressions and drainage gullies within hours while leaving the lower snowpack largely unsaturated. Ice layers, with permeability 5–10 times below that of surrounding snow [25] route water laterally and promote ponding, a mechanism consistent with the spring-fed and slush-field-derived triggering documented by [22] in the Krkonoše Mountains. The operational significance is clear: neither SNOWPACK nor the NVE seNorge model reproduces these preferential flow and lateral redistribution processes [5,7] which currently limits physically-based LWC forecasting within early warning frameworks.
Figure 4. Snow type susceptibility ranking for slush flow release [5,26].
Geohazards 07 00067 g004
Hestnes and Bakkehøi [26] conducted immersion experiments demonstrating that cohesionless new snow and porous coarse-grained snow fail rapidly upon full saturation, while dense icy layers withstand submersion for more than three days. This experimental result underpins the four-level snow-type susceptibility ranking adopted operationally by NVE [5]: FC/DH at or near the ground is highest risk; PP on an impermeable layer second; MF third; all OTH lowest. Sund et al. [5] validated this ranking against 394 quality-controlled slush flow events from autumn 2013 to spring 2023.
During a ROS event, four interacting processes govern runoff generation. (i) Rainfall input delivers water at rates exceeding radiation-driven snowmelt. (ii) Latent and sensible heat transfer from warm, humid air masses to the snowpack surface accelerates melt, especially in wind-exposed settings [27,28]. (iii) Capillary storage: the snowpack retains liquid water until its volumetric content reaches approximately 5–8%, after which preferential flow channels develop, and outflow begins rapidly [29]. (iv) Soil conditions: if underlying soils are already saturated or frozen, rainwater and snowmelt bypass soil storage and generate near-instantaneous surface runoff [27]. (Würzer et al. [27] introduced the operationally important distinction between “passive” snowpacks—which absorb rainfall with minimal melt contribution—and “active” snowpacks characterized by a large positive energy balance that amplifies runoff through synchronous melt at rates of 20–40 mm d−1. In Piedmont, mid-elevation autumn snowpacks (1000–2000 m a.s.l.) deposited during early cold spells are frequently converted from passive to active states when warm foehn or southwest Mediterranean intrusions deliver rain at air temperatures of +4 to +10 °C.

1.3.2. Triggering Mechanisms

The triggering of a slush flow results from a complex interaction between a significant influx of liquid water and the physical properties of the snowpack. The snowpack’s ability to store, allow to flow, or block liquid water is a decisive factor. Liquid water from rain or melting moves through the snowpack according to two main flow regimes, the predominance of which depends on the structure (diameter and shape of snow grains/crystals and quality of bonds).
Matrix Flow: This regime is characterized by a semi-uniform wetting front that advances slowly through the interconnected porous spaces between snow crystals. It is typical of mature, isothermal (at 0 °C) snow with a homogeneous structure, such as melt forms grains (MF) [22].
Preferential Flow: In this case, water follows certain preferential paths (known as ‘flow fingers’) and drains more rapidly, albeit in a localized manner. This regime is favored by heterogeneity in the snowpack, especially in immature and stratified snow, such as that containing fresh snow (PP). The presence of internal permeability barriers, such as ice layers or capillary barriers, can force water to stagnate or move laterally, concentrating at specific points and creating these preferential channels [22]. An impermeable or water-saturated substrate is a necessary precondition for snowpack saturation [30]. NVE identifies three relevant ground states: frozen soil, bare rock, and saturated unfrozen soil. In the SFEWS operational framework, ground frost depth is simulated by the HBV-based NVE hydrological model [31], and groundwater levels are monitored at approximately 65 telemetered stations. In Iceland, thin soils over impermeable basaltic bedrock create near-universal impermeable conditions when frost-free, facilitating rapid snowpack saturation during cyclonic events [11].
Hestnes [2] classified slush flow triggers based on 25 years of NGI consulting experience: (1) ROS events during cyclonic warm fronts; and (2) rapid snowmelt events driven by solar radiation and/or warm air advection. Hestnes et al. [30] analyzed 80 Norwegian slush flow events and found that during warm-front ROS events, snowmelt contributed 5–45% of total water input. Jaedicke et al. [32] found from five major Norwegian events (2008–2013) that rain-dominated triggering prevails in mid-winter, while spring events are primarily snowmelt-driven.
Scherer et al. [33] emphasized that the timing of energy input relative to snowpack LWC state is crucial: meltwater percolation rate through snow layers controls the rate of LWC increase and hence the onset of the funicular regime. Decaulne and Saemundsson [11] documented that both the 1997 and 1998 Bildudalur events were triggered by combined heavy rainfall and rapid snowmelt during cyclonic activity. Sund et al. [5] report that one of the 2010–2011 Norwegian events causing four fatalities occurred during sunny weather (pure snowmelt forcing), emphasizing that absence of precipitation does not preclude slush flow initiation.

1.3.3. Rheological Properties

The most systematic published experimental data on slush flow rheology derive from chute experiments conducted by [34] at the Weissfluhjoch facility of the WSL Institute for Snow and Avalanche Research (SLF), Switzerland. The experimental setup was a 30 m × 2.5 m instrumented chute; 14 runs were conducted using snow volumes of 10–15 m3. Key results from Table 2: effective viscosity of slush 67 Pa·s at φ = 0.60, versus ~0.3 Pa·s for dry snow (ratio ~ 220×); maximum basal shear rate 200 s−1 (slush) versus 600 s−1 (dry snow); observed maximum flow height approximately 0.4 m.
These results confirm viscoplastic (Bingham-type) behavior, as theorized by [35]. In the Bingham constitutive model, shear stress τ = τ0 + μ (∂u/∂z), where τ0 is yield stress (Pa), μ is dynamic viscosity (Pa·s), and ∂u/∂z is vertical shear rate (s−1). The high yield stress enables slush to cease motion on shallow slopes and form the diagnostic blunt-lobe morphology [2,15].
Sund et al. (2024) [5] note that current operational snow cover models, including SNOWPACK and the NVE seNorge model [36], do not adequately simulate preferential meltwater flow and ponding processes, limiting physically based LWC forecasts in the SFEWS.
Recent advances in continuum numerical modelling have substantially improved the ability to simulate slush flow dynamics. Blatny et al. [6] applied both a depth-averaged Bingham–Coulomb model (implemented in the SAMOS-AT solver) and a fully three-dimensional Material Point Method (MPM) model with an elasto-viscoplastic Drucker–Prager rheology to the 1981–1982 Atigun Pass events, the first time a depth-resolved 3D approach has been applied to documented slush flows. The depth-averaged simulations reproduced maximum velocities of 20–24 m/s (Bear Valley, Grand Whaleback, Sheep Gully), consistent with field superelevation estimates of 25 m/s [37]. The MPM simulations yielded depth-averaged velocities of 10–17 m/s, with maximum surface velocities reaching 20–35 m/s—approximately twice the depth-averaged values—underscoring the need to distinguish between depth-averaged and surface velocity metrics when comparing models with field observations. The Bingham viscosity parameters calibrated in both approaches (ηB = 10–30 Pa·s) fall within the range experimentally determined by [10,38] of 1–60 Pa·s, supporting the validity of the Bingham–Coulomb constitutive law as a first-order rheological model for single-phase slush. However, Blatny et al. [6] emphasize that single-phase models cannot reproduce the drainage of the water phase during final runout, and that future development of two-phase (water + snow) models is essential for accurate slush flow hazard assessment. Once triggered, the slush flow behaves like a highly mobile, dense mixture, and the flow is characterized by a steep, turbulent front, like a flood wave. Average front velocities, estimated via seismic analysis, indicate values ranging from 27 to 51 m/s [39]. Field observations have revealed that the moving flow can take on a teardrop or lobed shape, which tends to maintain a stable configuration for much of its flow path [3]. During this phase, the slush flow can easily erode and incorporate additional snow, soil, and plant and rock debris, increasing its mass and destructive potential, and in some cases transforming into a full-blown debris flow [5].
Laboratory studies on the interaction between the flow and the protective structures have identified three distinct phases of the impact:
  • “Splash”: The initial, short-lived impact against the obstacle generates a violent jet that can exceed the theoretical height predicted by the conservation of energy by more than double;
  • “Jets/Fountains”: Following the collapse of the initial splash, a semi-steady flow is established that flows over the obstacle;
  • “Hydraulic Jump”: Upstream of the obstacle, a hydraulic jump forms—a sudden transition from a supercritical flow (fast and shallow) to a subcritical flow (slow and deep)—which dissipates a considerable amount of energy.

Table 2 synthetizes main characteristics of slush flow compared with snow avalanches.
Table 2. Morphological and physical comparison: slush flows vs. snow avalanche types [2,15,16,24,34,40].
ParameterSlush FlowDry-Snow AvalancheWet-Snow AvalancheSlab Avalanche
Initiation slope2–15° (very gentle)30–55°20–40°28–50°
Runout slope0–5° (flat terrain
possible)
10–30°5–20°15–35°
TriggerRain-on-snow/rapid
snowmelt; LWC > 15%
vol. (soaked state)
Overloading/wind slab
instability on steep
terrain
Snowmelt/rain;
weak basal layer
failure
Weak layer under slab;
overloading or
temperature change
RheologyViscoplastic—Bingham
fluid; η ≈ 67 Pa·s
at φ = 0.60
Granular/fluidized;
η ≈ 0.3 Pa·s
(dry granular)
Dense viscous flow;
intermediate
viscosity
Brittle fracture →
granular flow
of broken blocks
Velocity1–10 m/s50–300 m/s5–50 m/s20–150 m/s
Deposit formBlunt lobe +
lateral levees
Wide spreading fan;
powder cloud
Rounded lobe;
surface flow
furrows
Angular blocks;
pressure ridges
Lateral spreadNarrow—channel/
gorge confined
(70–100% of events)
Very wide—no
confinement;
freely spreading
Partial—semi-
channeled;
wider than slush
Wide—lateral scarps
mark release zone
Runout lengthVariable; flat terrain
possible
Very long (>1 km)Moderate (0.3–1 km)Long (0.5–2 km)
Snow stateFully water-saturated
(funicular regime)
Dry, cold, low-
density snow
Wet snow, partially
saturated
Consolidated slab
over weak layer
Key diagnosticSaturated snow matrix;
blunt lobate terminus;
lateral levees
High-speed powder
cloud; low-density
deposit; no confinement
Dense, heavy mass;
surface furrow marks;
rounded front
Crown fracture scar;
lateral scarps;
angular block deposits

2. Materials and Methods

To investigate the marked increase in such phenomena in the northwestern Alps, several factors were considered: the quantification of the recent climate changes together with a systematic analysis of the ROS events that occurred since the regional database has been able to record them and, of course, a systematic search for slush flow events documented in public regional archives and in research products published in scientific literature, focusing on Piedmont (northwestern Alpine Italian region).

2.1. The Piedmont Region (Northwestern Italian Alpine Region)

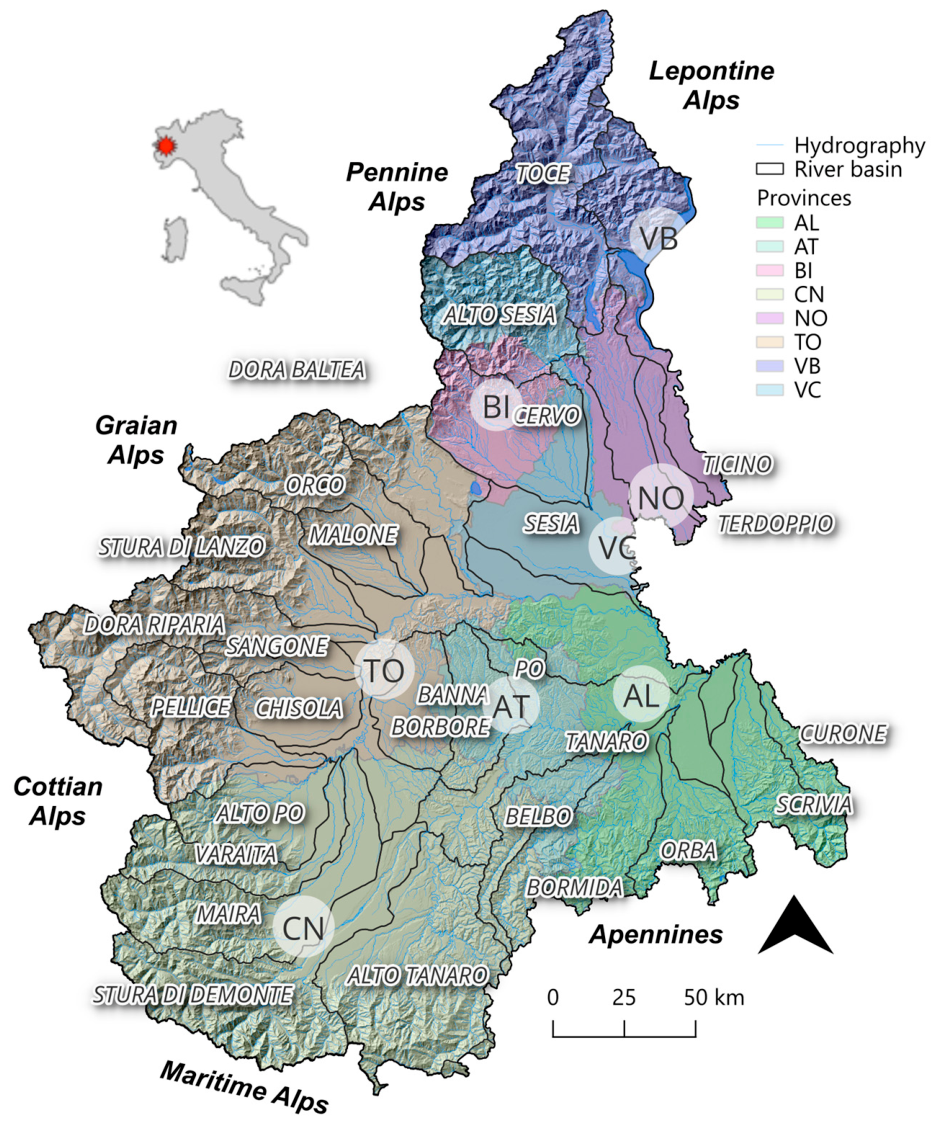
Piedmont is a northwestern region of Italy, covering an area of approximately 25,387 km2. The region exhibits a pronounced amphitheatrical morphology: the Po Plain, which occupies the eastern and central sectors, is enclosed on three sides by an arc of Alpine ranges to the north, west, and south, and opens eastward toward the Lombardy Plain (Figure 5). The Alpine arc encompasses the Maritime, Cottian, Graian, Pennine, and Lepontine Alps, reaching maximum elevations exceeding 4600 m a.s.l. at Monte Rosa (4634 m). The Apennine divide delimits the region to the southeast along the Ligurian watershed. From a geological standpoint, Piedmont straddles two of the most structurally complex tectonic domains of the European Alps. The crystalline basement of the Western Alps —predominantly composed of polymetamorphic gneisses, micaschists, and eclogites associated with the subduction and collision of the European plate—outcrops extensively in the innermost Alpine zones (Sesia–Lanzo Zone, Monte Rosa nappe). The Pennine nappes expose ophiolitic sequences (Piemonte Zone, Zermatt–Saas ophiolite) that testify to the closure of the Ligurian Tethys Ocean during the Cretaceous. The Apennine sector is characterized by Oligocene–Miocene turbiditic flysch sequences (Langhe flysch) and Pliocene marine sediments underlying the Monferrato hills. The Po Plain is underlain by Quaternary alluvial deposits of variable thickness (10–600 m), largely derived from glaciofluvial reworking during the Pleistocene glaciations, which emplaced extensive moraine systems and outwash fans across the piedmont zone [41]. The main hydrographic network is organized around the Po River and its major left-bank tributaries (Dora Baltea, Dora Riparia, Stura di Lanzo, Tanaro, and Bormida rivers) draining the Alpine arc and collecting precipitation from both Atlantic and Mediterranean moisture sources. The geomorphological legacy of repeated glacial cycles is pervasive: U-shaped valleys, overdeepened lake basins (Orta, Maggiore), and extensive glaciofluvial terraces define the macrorelief of the Alpine foreland.
The climate of Piedmont is governed by the interplay between Atlantic westerly airflow, Mediterranean moisture advection from the south, and the orographic barrier of the Alps. The resulting spatial heterogeneity in precipitation distribution is substantial. Acquaotta and Fratianni [42] documented, across the Piedmont station network, a marked gradient from the driest sectors of the northeastern Po Plain (approximately 600–700 mm mean annual precipitation) to the pre-Alpine belt and the foot of the Maritime and Cottian Alps, where orographically enhanced cyclonic systems from the Gulf of Genoa produce the highest rainfall intensities in the entire Alpine arc (locally exceeding 1800 mm yr−1). The seasonal precipitation regime is bimodal over most of the region, with primary peaks in spring (April–May) and autumn (October–November), and a relative summer minimum in the lowlands. Mean annual air temperature in Piedmont ranges from approximately 13–14 °C in the Po Plain to below 0 °C above 3000 m a.s.l. The lowland areas experience a subcontinental thermal regime with cold winters and warm summers. Garzena et al. [43], in an analysis of the long-term homogenized series for Turin (1870–2016), documented clear warming trends over the twentieth century, with an acceleration in recent decades, accompanied by increases in tropical nights and warm days. The Alpine valleys exhibit marked temperature inversions during anticyclonic winter conditions, while south-facing slopes at mid-elevations are subject to pronounced foehn-driven warming. Acquaotta et al. [44], analyzing 16 high-altitude stations in the NW Italian Alps over the period 1961–2010, documented a significant increase in temperature particularly at sites located above 1600 m a.s.l., with greater increases in spring and winter maximum temperatures. Snow cover in Piedmont is strongly controlled by elevation. In the lowlands, snowfall is episodic and generally restricted to December–February. At mid-elevations (500–1500 m a.s.l.), seasonal snow cover is established for 3–5 months. Above 1500 m a.s.l., snow cover persists for 6–8 months and constitutes the dominant hydrological input during the cold season. Matiu et al. [45], in a comprehensive analysis of more than 2000 Alpine snow stations, including 15 stations from the Regional Agency for Environmental Protection of Piedmont (Arpa Piemonte), documented the climatological and trend characteristics of snow depth across the European Alps for the period 1971–2019. The snow water equivalent stored in Piedmont alpine catchments at the seasonal maximum (typically March–April) represents a critical resource for summer streamflow and irrigation, and its variability is closely linked to interannual circulation anomalies.
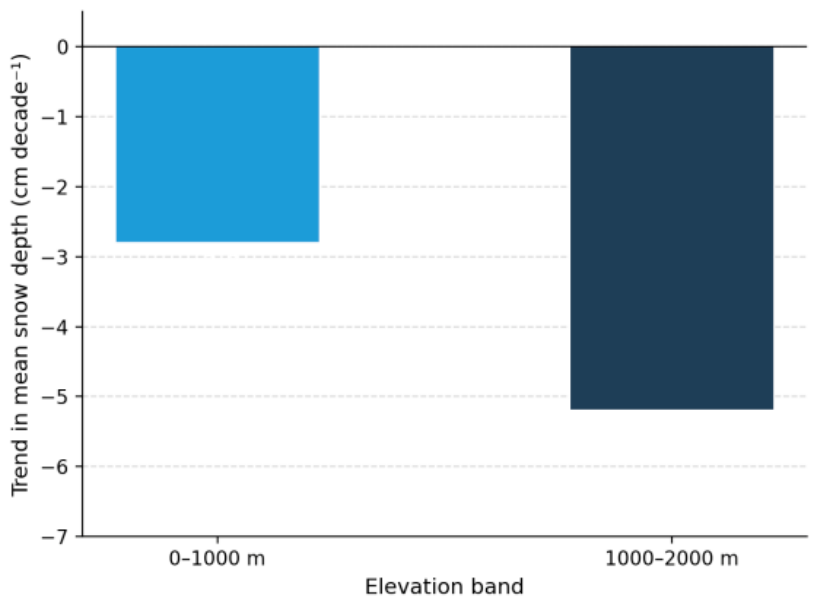
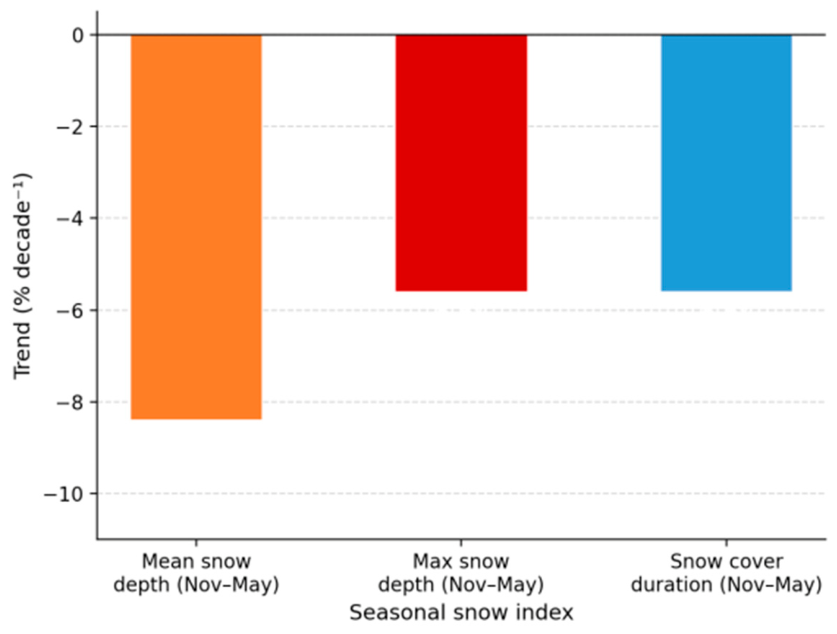
The Piedmont Alps are among the most climatically sensitive regions in Europe. Brunetti et al. [46], based on homogenized instrumental records extending back to the nineteenth century for the NW Italian Alps and Po Plain, documented a statistically significant warming trend over the 1865–2003 period, with acceleration in the post-1980 decades. The HISTALP database [47] confirmed a 20th-century temperature increase of +1.2 °C for the annual Greater Alpine Region mean, with the rate of warming in the second half of the century approximately twice the global average. Concomitant with the warming trend, significant changes in the Alpine snowpack have been documented. Matiu et al. [45], in the most comprehensive pan-Alpine analysis to date, quantified linear trends in monthly mean snow depth (meanHS), maximum snow depth (maxHS), and snow cover duration (SCD) for the period 1971–2019 across more than 800 stations from six Alpine countries. For the pan-Alpine average across all stations and all elevation bands, the seasonal (November–May) meanHS decreased at a rate of −8.4% per decade, seasonal maxHS at −5.6% per decade, and seasonal SCD at −5.6% per decade. Disaggregating by elevation band for the southern region of the Alps, which encompasses the Piedmont Alps, Matiu et al. [45] reports a seasonal meanHS trend of −2.8 cm per decade in the 0–1000 m band and of −5.2 cm per decade in the 1000–2000 m band, with the more pronounced decline at higher elevations consistent with a mid-elevation amplification of the albedo-feedback mechanism. The 15 Arpa Piemonte weather stations included in the Matiu et al. [45] dataset contribute directly to these regional estimates, making the reported trends directly relevant to Piedmont. Figure 6 and Figure 7 summarize the trend values for mean snow depth and snow cover duration. Figure 6 shows the absolute seasonal meanHS trend by 1000 m elevation band for the southern Alpine region; Figure 7 shows the pan-Alpine relative trends for the three main seasonal snow indices.
Precipitation trends in Piedmont over the same period have been less spatially coherent. Acquaotta and Fratianni [42] identified a statistically significant decreasing tendency in annual precipitation in certain lowland sectors over the period of record, without detecting consistent regional trends in total annual amounts across the full station network.

2.2. Climate Change Drivers in Alpine Environment

The Italian Alps are warming at approximately 1.5–2× the European mean rate [48] with the HISTALP long-term instrumental dataset [47] showing a rise of approximately 150–250 m in the 0 °C isotherm since 1980. This isotherm rise extends the zone of ROS events upward into terrain previously protected by persistent subzero temperatures. Brunetti et al. [46] documented significant trends toward more frequent high-percentile precipitation events in northern Italy, with statistically significant increases in Lombardy, Piedmont, and Trentino-Alto Adige. Brunetti et al. [49] and Isotta et al. [50] confirmed increased frequency of extreme precipitation events (>99th percentile) over the southern Alps for 1971–2008.
Colucci and Guglielmin [51] documented rapid permafrost degradation in the Italian Alps, warning that permafrost loss increases pore-water pressure in periglacial slopes and reduces substrate drainage capacity, indirectly enhancing slush flow susceptibility. Under RCP 4.5 and RCP 8.5 scenarios, Gobiet et al. [48] project further Alpine warming of 2–4 °C by 2100, accompanied by changes in precipitation phase (rain vs. snow) that increase the probability of winter ROS events.
In snow-fed mountain watersheds, the coincidence of liquid precipitation with a snow-covered ground generates a compound hydrological forcing that may substantially exceed the individual contributions of rainfall or snowmelt alone. During ROS events, the snowpack acts as a temporary storage reservoir whose capacity depends on its liquid water content, cold content, and the thickness of pre-existing ice layers [27]. When rainfall intensity exceeds the snowpack’s refreezing capacity, rainwater and synchronous meltwater combine to produce a rapid and intense total water input to the soil and drainage network, routinely triggering floods and shallow landslides simultaneously [52,53] or apparently less common slush flow events. The Piedmontese Alps are particularly exposed to ROS hazards for three reasons. First, their orographic setting promotes southwesterly Mediterranean air-mass intrusions that deliver warm, moist precipitation onto pre-existing snowpacks in autumn and late spring, the two climatological precipitation maxima of the region [42]. Second, the region hosts a dense network of deeply incised torrent basins with rapid hydrological response.

2.3. Literature and Data Search

The identification of ROS events and slush flows documented in Piedmont was carried out through a multi-source search strategy covering the period 1960–2025, using the search keywords “ROS”, “rain-on snow”, “slush flow”, “wet snow avalanche” “debris-snow avalanche” within the regional public databases consisting essentially of the Arpa Piemonte, AINEVA and CNR-IRPI repositories a, which archive hydrometeorological and mass-movement event data at the regional scale (https://webgis.arpa.piemonte.it/portal/apps/experiencebuilder/experience/?id=6c07e6b79a404cfa85a48342f53eb108, accessed on 28 April 2026), SIVA webportal (https://webgis.arpa.piemonte.it/portal/apps/experiencebuilder/experience/?id=04d98ab767c94dd3b1eab694608c39c4&page=Home, accessed on 28 April 2026) and the Interregional Association of Coordination and Documentation for Snow and Avalanche Issues (AINEVA) seasonal reports (https://aineva.it/relazioni-stagionali/, accessed on 28 April 2026) and the Population at Risk from Landslides and Floods in Italy (POLARIS) database (https://polaris.irpi.cnr.it/, accessed on 28 April 2026). Peer-reviewed scientific literature was systematically searched in the Scopus (Elsevier) and Web of Science (Clarivate) databases using the following keywords, applied individually and in Boolean combination: ROS, slush flow, and wet snow avalanche. No language restriction was applied, and the temporal scope of the search was set to 1960–2025. Additional literature was retrieved through the academic search engine Google Scholar, which was queried using the same keyword set and allowed the inclusion of grey literature, conference proceedings, and non-indexed regional publications. To broaden the identification of thematically related works and trace citation networks, the AI-assisted discovery platforms Semantic Scholar (https://www.semanticscholar.org/, accessed on 28 April 2026), ResearchRabbit (https://www.researchrabbit.ai/, accessed on 28 April 2026), and Connected Papers (https://www.connectedpapers.com/, accessed on 28 April 2026) were employed. These tools perform graph-based mapping of bibliographic relationships, enabling the identification of seminal references, forward and backward citations, and conceptually adjacent studies that may not have surfaced through conventional keyword-based queries. All retrieved sources were manually screened for relevance, and only records containing verifiable observational data pertaining to the study area or directly comparable Alpine environments were retained for analysis.

3. Results

3.1. Historical Slush Flow and ROS Events

Documented evidence of slush flows in the Italian Alps is limited but exists. A slush flow event is recorded in 1972, then according to [54] it was caused by an avalanche that fell into Lake Lillet (Orco Valley, TO), causing it to overflow and flow along the watershed until it reached the valley floor and the opposite slope, extending beyond the known limits of “traditional” avalanches. Tropeano et al. [55] documented widespread shallow mass movements in Piedmont during the November 2000 ROS event, including snow–water mixtures flowing in stream channels with characteristics consistent with the Hestnes [2] definition of slush flows. The November 2000 Piedmont event involved widespread concurrent mass movements triggered by a prolonged ROS episode and represents the best-documented Italian Alpine case analogous to the Norwegian mass slush flow scenarios documented by [19].
No systematic Italian slush flow catalogue comparable to the Norwegian NSDB exists. The AINEVA national avalanche network records wet snow avalanche events, some of which may represent small slush flows under the Hestnes [2] definition, but systematic reclassification has not been performed. This absence of documentation does not imply absence of slush flow events; it reflects a monitoring gap analogous to the pre-2013 situation in Norway, where the absence of a dedicated service led to severe underreporting [12].
However, there are not many documented slush flow cases, and, in many cases, they are small or not clearly distinguishable from other gravitational snow-based phenomena, such as snow avalanches. This also emerges from an in-depth analysis of archive documentation which reports the ground effects recorded during all historically known ROS phenomena. Luino [52,54] documented a characteristic three-phase cascade for major ROS-driven hydrometeorological events in the Piedmontese Alps. In the first phase, intense rainfall and shallow snowmelt saturate steep slopes, generating soil slips and mud-debris flows in catchments <20 km2. In the second phase, tributary streams flood as accumulated runoff concentrates. In the third phase, the flood wave propagates to the main river channel (Tanaro, Po, Sesia, Toce rivers). This sequence was explicitly documented for the 1968, 1977, 1978, 1993, 1994, and 2000 events in Piedmont.
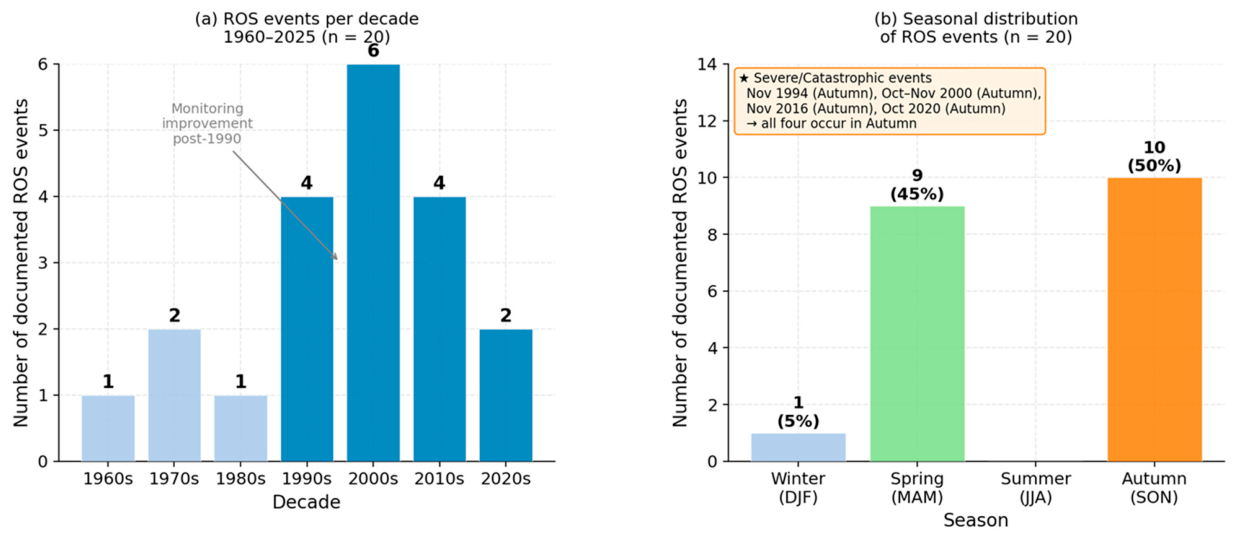
Table 3 lists all 20 documented ROS events for the Piedmontese Alps, ordered chronologically. The four events classified as high severity events (1994, 2000, 2016, 2020) are marked with ★ in Table 1.
An event is included if: (i) a documented snowpack was present at the affected elevation range at event onset; and (ii) the published source identifies snowmelt as a contributing component of total runoff. The framework follows [52,54] for flood events and [56] for the gauge-contamination diagnostic used for the 2016 event, with a severity scale: 1 minor, 2 moderate, 3 significant, 4 severe, 5 catastrophic.
Autumn (October–November) dominates: 11 of 20 events (55%) (Figure 8a). This is consistent with the climate regime in which first cold periods of autumn deposit snow at sub-montane and montane elevations, subsequently exposed to warm Mediterranean precipitation intrusions. Spring (April–May) accounts for five events (25%), reflecting the active-snowmelt season at subalpine elevations (1400–2200 m a.s.l.). Winter events are least frequent (one event, 5%), likely because winter precipitation in inner Piedmont is drier and snowpacks are cold (passive), limiting the active-melt contribution. Figure 8b shows the full seasonal breakdown.
The November 1994 Tanaro flood remains the benchmark catastrophic ROS event in Piedmont. Luino [54] documented that 18 of 92 long-term rain gauge stations in Piedmont exceeded their previous 24 h rainfall maxima, and that peak unit discharge in Tanaro tributaries reached 7.3 m3 s−1 km−2, a value without precedent in the regional record. Buzzi et al. [57] confirmed through mesoscale modeling that the three-day precipitation anomaly was primarily orographically forced. The snowpack contribution, documented from Arpa Piemonte snow stations, amplified the flood peak in the western sub-basins.
The October–November 2000 Po basin and VB event (Event 9, severity 4) is distinguished by its extreme precipitation totals exceeding 600 mm over 96 h in the Verbano–Ossola sector. The Po River at Moncalieri reached an estimated discharge corresponding to a 150–200 year return period.
The November 2016 event (Event 16, severity 3–4) is scientifically significant for providing the first radar-based evidence of ROS gauge contamination in Piedmont. Cremonini and Tiranti [56] demonstrated that five Alpine stations recorded precipitation amounts 18–35% higher than the Quantitative Precipitation Estimate (QPE) detected by weather radar, due to liquid water from melting snow accumulating on the rain gauge.
The October 2020 Sesia/Toce basins event (Event 19, severity 4) occurred during an anomalously warm autumn. The compound sequence (early-October snowfall above 1600 m followed within 24 h by warm rainfall descending to 1200 m) illustrates the elevation-migration of the ROS hazard zone that is consistent with the snowline-rise implied by the Acquaotta et al. [44] warming rate, though a formal quantitative attribution is beyond the scope of the available station data.

3.2. The ROS Event of 15–17 April 2025 Causing Widespread Slush Flow Phenomena

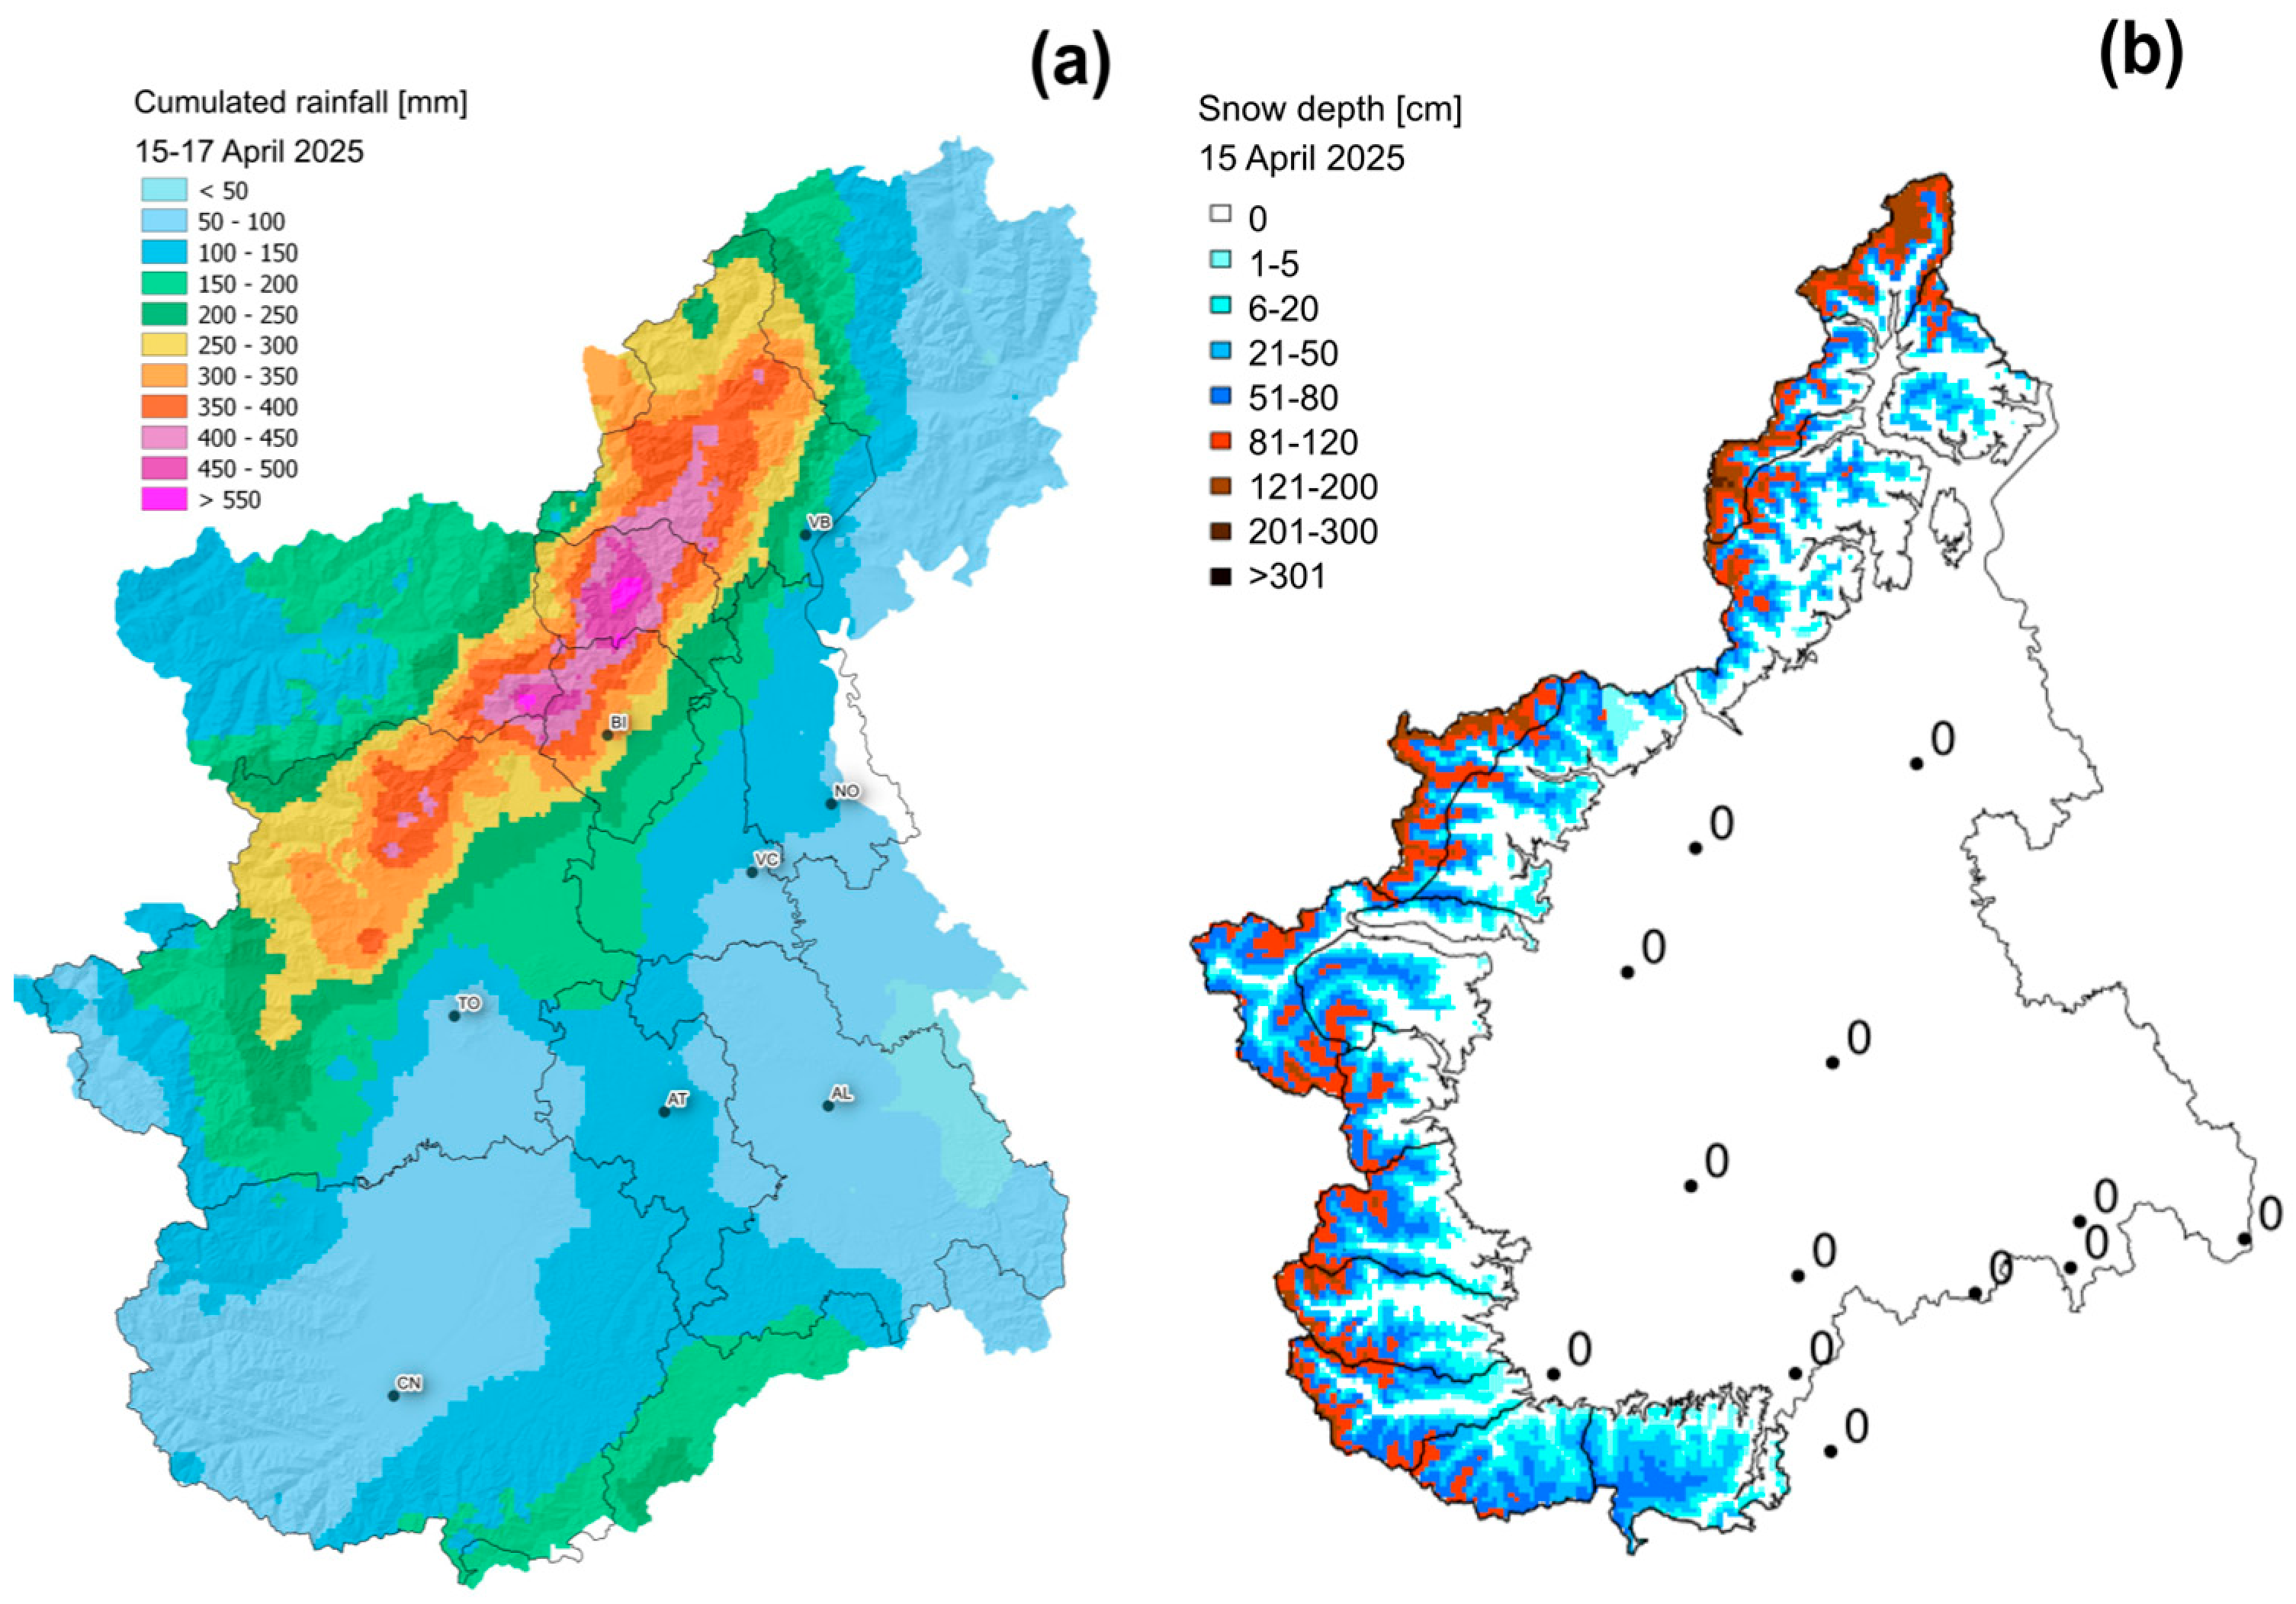
In April 2025, an important ROS event occurred in Piedmont. The event of 15–17 April was characterized by a sequence of low-pressure systems over the Ligurian Gulf, which led to very intense precipitation across the entire Piedmont Alpine sector. The most significant accumulation, exceeding 300 mm and locally surpassing 550 mm, occurred in the mountainous and foothill areas of north Piedmont. In the Apennine areas in the south-east of the region, cumulative precipitation exceeded 150 mm. Overall, total accumulated precipitation across the entire Piedmont region was widely above 100 mm (Figure 9a).
Snowfall was particularly abundant above 2500 m, while the snowline generally remained between 1800 and 2000 m a.s.l., with local lowering to 1000–1200 m a.s.l. in inner valleys. Within 48 h, exceptional accumulations were recorded, with 120–140 cm of new snow at 2500 m a.s.l. or even greater at higher elevations. The new snow accumulated on top of a substantial pre-existing snowpack (Figure 9b).
The snowfall was characterized by a high liquid water content and unusually high snow densities, which caused rapid wetting and densification of the snowpack even at high elevations. The weight of the new snow induced strong increase in snow density, resulting in measured snow depths lower than actual inputs but with a significant increase in load. Below 2000 m, rainfall promoted full saturation of the snowpack, creating widespread instability. This combination allows the release of large wet avalanches, often reaching valley floors due to the high fluidity of the water-saturated snow mass.
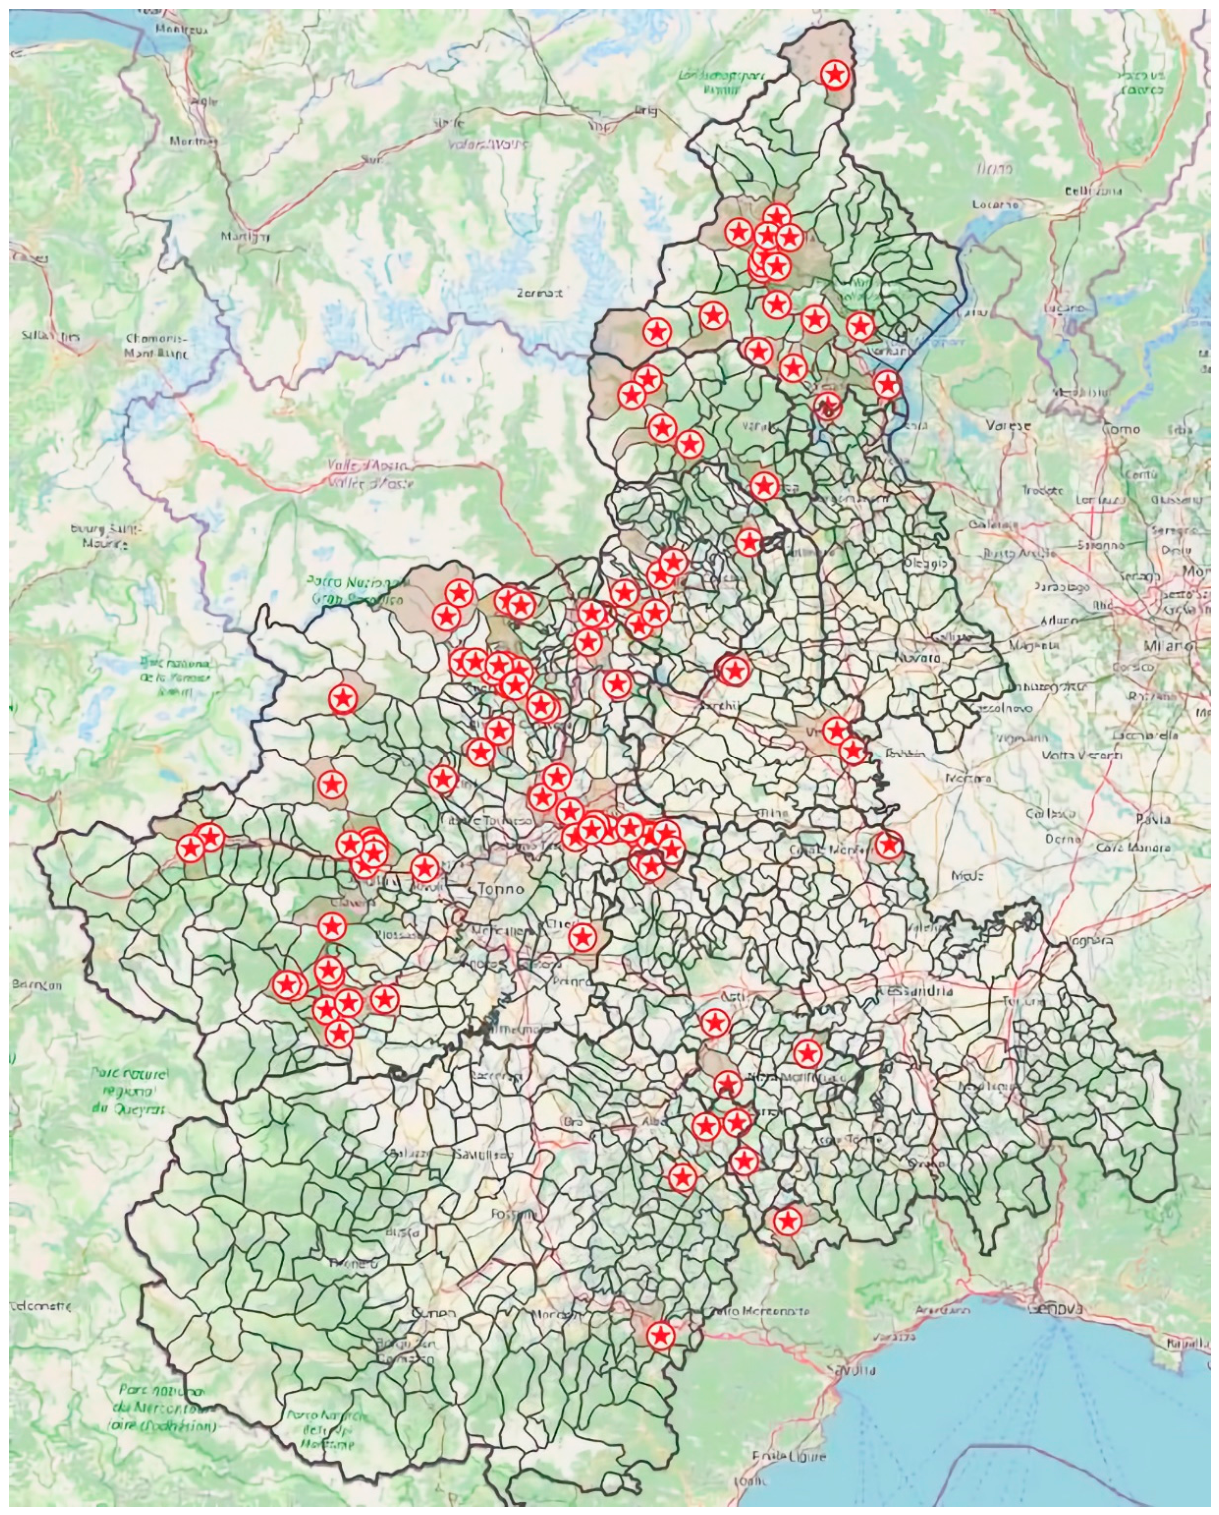
As during historical ROS events, the amplification effects of rain on snow have caused widespread and numerous landslides and flooding phenomena (Figure 10).
But contrary to what happened in the past, numerous slush flows occurred, particularly in the northern and northwestern sectors of the alpine environment where precipitation was most intense.
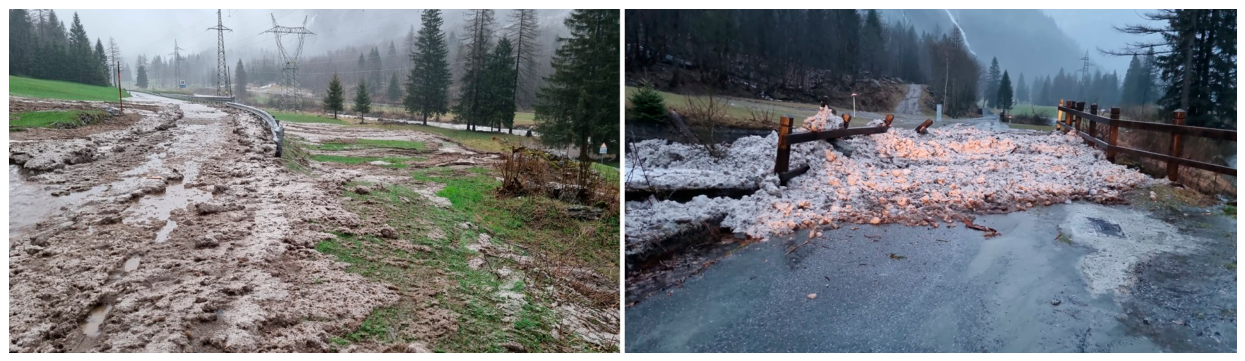
The observed slush flows showed similarities to debris flows, consisting of a mixture of water-saturated snow, water, mud, and entrained debris, capable of traveling long distances even on gentle slopes and reaching inhabited areas (Figure 11).
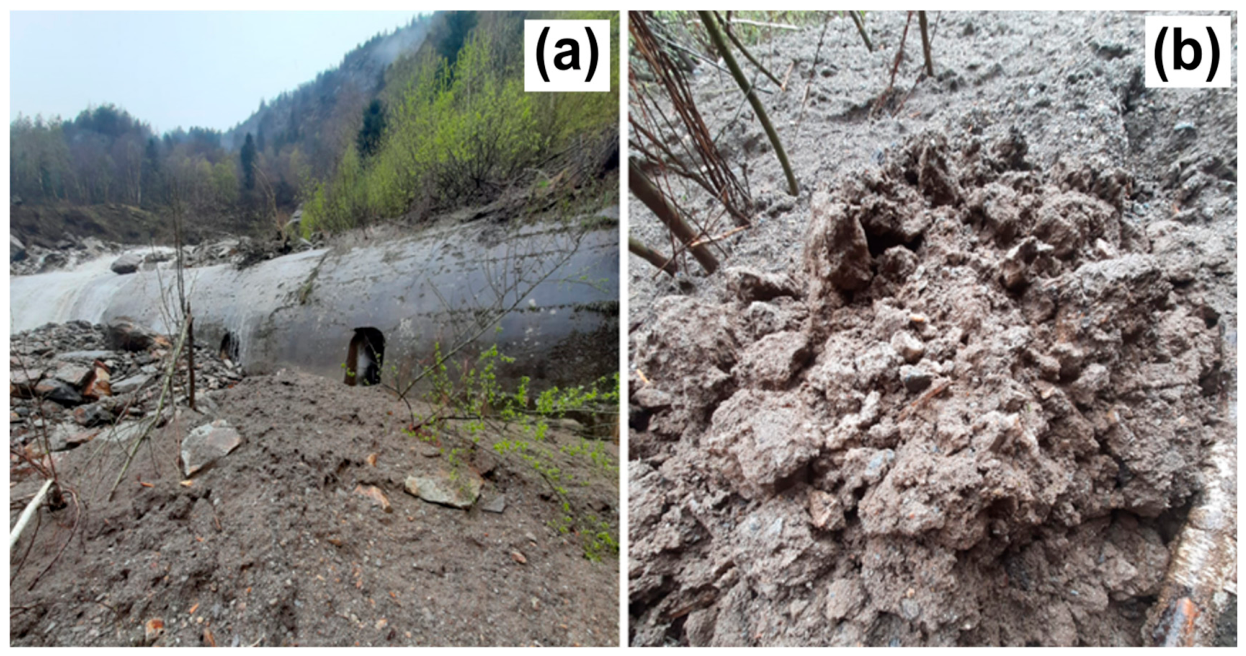
A significant case also occurred in Macugnaga municipality (VB) where a large slush flow invaded an avalanche tunnel, highlighting the reduced effectiveness of such structures under high liquid-content conditions (Figure 12). Fortunately, the road had already been closed further downstream due to the risk of landslides.
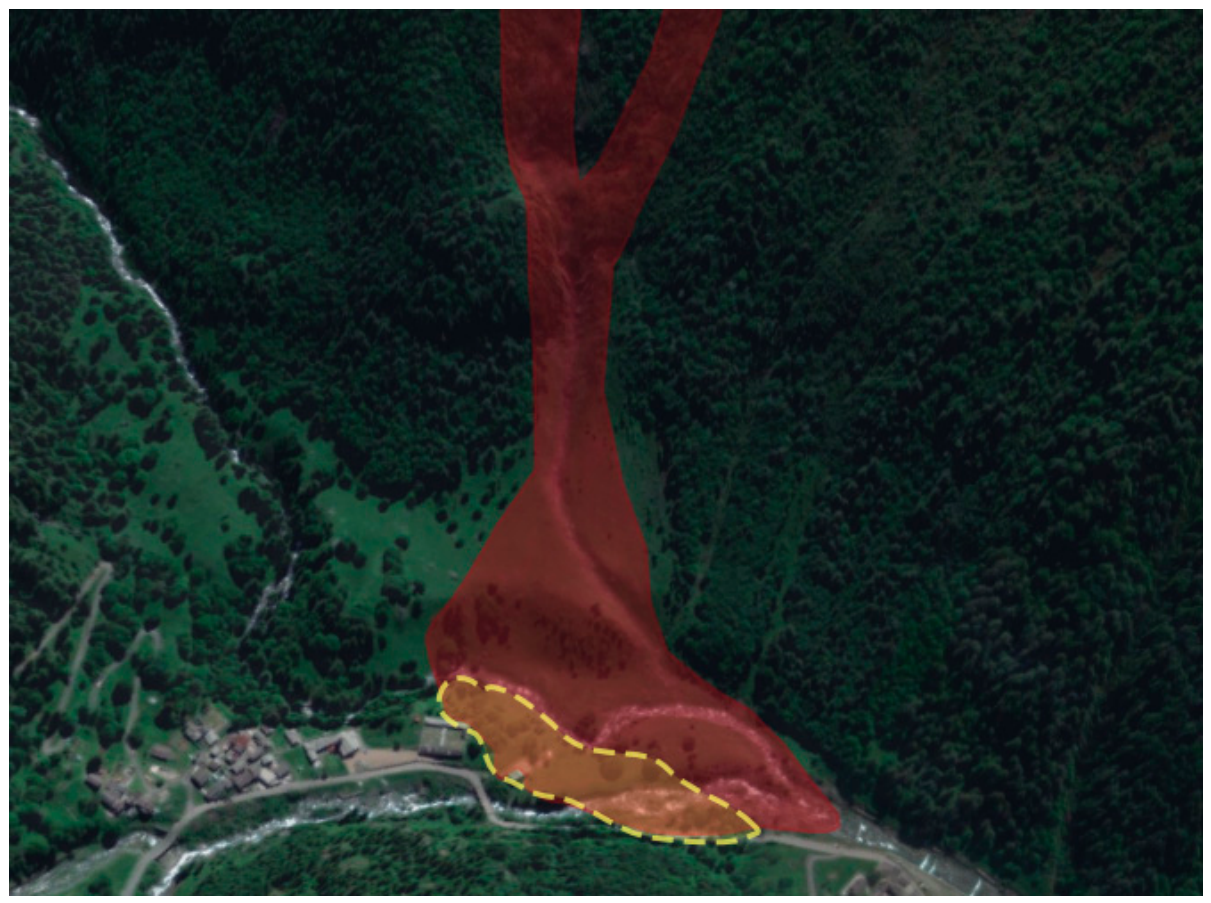
A more remarkable phenomenon occurred in the Valprato Soana municipality, Soana Valley (TO), caused by a complete snowpack saturation combined with erosion of the waterlogged ground produced a dense, highly mobile mass capable of exceeding historical runout limits of common avalanches in this valley and causing severe structural damage. In fact, the slush flow exceeded the known mapped propagation boundaries within the SIVA (Avalanche Information System in Piedmont-https://geoportale.arpa.piemonte.it/app/public/?pg=mappa&ids=e8f8f03dc3714702bd024b0e9f7c429a, accessed on 28 April 2026) (Figure 13).
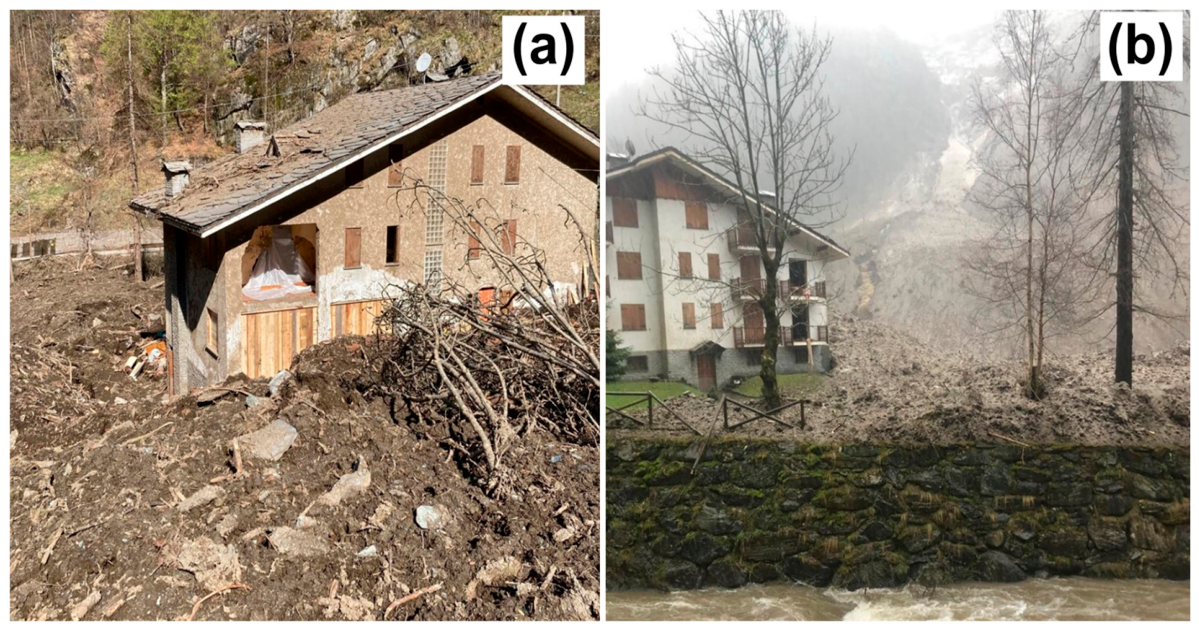
The Valprato Soana (TO) slush flow caused severe damage to a building (Figure 14), fortunately not permanently inhabited but used only during summer or holiday periods. The snow debris mass, very wet due to intense nighttime precipitation (rainfall up to elevations above 2000 m), involving the entire catchment area. As it passed through the lower runout zone, the phenomenon eroded the water-saturated soil substrate, incorporating a new large amount of debris.
The peak of slope phenomena initiation, including the slush flows, occurred between the evening of 16 April and the night of 17 April, coinciding with maximum precipitation inputs. As weather conditions improved and temperatures dropped, there was a rapid decrease in processes on the slopes. This geohydrological event highlights how the combination of ROS conditions, high-density precipitation, and snowpack saturation is a key driver for slush flow generation, phenomena that are particularly hazardous due to their high mobility, unpredictability, and ability to directly impact infrastructure and valley bottom areas.

4. Discussion

4.1. Why Was the April 2025 Event Different from Previous Ones?

The ROS event of 15–17 April 2025 produced widespread, morphologically unambiguous slush flow phenomena across the northern and northwestern Piedmontese Alps (phenomena absent from the documented record of all 20 preceding catalogued events). Understanding why this event crossed a process threshold that had not been reached even during the more hydrometeorologically severe episodes of 1994 and 2000 requires examination of the physical boundary conditions that determine whether a snowpack responds to liquid water input through conventional runoff and shallow landsliding or through slush flow mobilization.
The fundamental physical prerequisite for slush flow initiation is attainment of the fully funicular LWC regime, in which all interstitial pore space becomes water-connected and gravitational drainage begins. Fierz et al. [24] define this as the ‘soaked’ wetness class (>15% volumetric LWC), which Sund et al. [5] adopt as the operational trigger threshold in the Norwegian SFEWS. Transition to this regime requires two concurrent conditions: (i) sufficient liquid-water supply (from rainfall, snowmelt, or both) to overcome the snowpack’s capillary storage capacity; and (ii) an impermeable or saturated substrate that prevents drainage and promotes ponding. The rate at which the funicular threshold is approached is controlled by the snowpack’s cold content (the quantity of heat that must be supplied before the bulk temperature reaches 0 °C throughout) and by its initial LWC state.
The April 2025 event differed from all prior Piedmontese ROS events in precisely these determinative boundary conditions. By mid-April, the seasonal snowpack at high elevations across the northwestern Alps had undergone several months of thermal ripening. Unlike the early-season autumn snowpacks that characterize the majority of the catalogue events (particularly 1994, 2000, 2016, and 2020), the spring snowpack in April was at or near isothermal conditions at 0 °C throughout its depth, meaning that its cold content had been substantially or entirely depleted by antecedent solar radiation and warm-air advection. An isothermal snowpack requires no additional heat input to initiate melting and is primed for immediate transition to the funicular LWC regime under any additional liquid-water supply. This contrasts fundamentally with the early-October 2020 sequence, in which snowfall above 1600 m had occurred only 24 h before the warm rainfall onset, and with the early-November 1994 snowpack at 800–1400 m a.s.l., in which cold content and grain-scale bonding would have provided a substantial buffer against rapid saturation. This distinction in initial snowpack thermal state is compounded by the structural characteristics of a late-winter/early-spring snowpack. Following months of temperature cycling, the snowpack typically contains well-developed stratigraphic discontinuities (ice layers, melt-freeze crusts, and interfaces between snow layers of contrasting grain morphology and permeability). Albert and Perron [25] measured hydraulic permeabilities of ice layers five to ten times lower than surrounding snow. Marshall et al. [7] demonstrated experimentally, using dye tracers and stable isotopes in a multi-year instrumented study on a 25–35° slope, that meltwater routes preferentially along such stratigraphic boundaries and concentrates in topographic depressions and drainage gullies within hours, while the lower snowpack remains largely unsaturated. This preferential flow mechanism is particularly efficient in generating localized funicular-regime saturation, and thus slush flow release, on slopes where such lateral concentration pathways intersect with gully or channel topography.
The precipitation characteristics of the April 2025 event provided exceptional liquid water supply to a snowpack already predisposed to rapid saturation. Cumulated rainfall exceeded 300 mm across broad sectors of northern Piedmont and locally surpassed 550 mm within 48 h, a total comparable in absolute magnitude to the VB sector totals of the October–November 2000 event (>600 mm over 96 h) but concentrated over a shorter duration and delivered to a snowpack with far lower buffering capacity. Simultaneously, exceptional new snowfall accumulations of 120–140 cm over 48 h at 2500 m a.s.l. introduced a high-density, high-LWC snow mass onto the pre-existing spring snowpack. The documented anomalously high density of this new snow (which produced measured snow depths lower than expected for the given precipitation input, with a disproportionate increase in snowpack load) is consistent with formation under near-0 °C conditions, yielding large rounded grains and melt-form crystal habits with minimal cold content and near-immediate susceptibility to capillary saturation upon additional water input. Below approximately 2000 m a.s.l., where the snowline descended locally to 1000–1200 m in inner valleys, direct rainfall promoted full snowpack saturation, eliminating any residual buffering and generating the widespread instability that ultimately produced the slush flow events observed across the northern and northwestern sectors (Arpa Piemonte event reports: https://www.arpa.piemonte.it/pubblicazione/rapporto-evento-15–17-aprile-2025, accessed on 28 April 2026).
Taken together, these observations confirm that the April 2025 events represent a qualitative shift in the hazard regime rather than a quantitative intensification of known processes.

4.2. Climate Change Acceleration in the Piedmontese Alps (2024–2025) and Its Role in Enabling Slush Flow Formation

The transition documented in April 2025 cannot be attributed to a single anomalous meteorological event operating against a static environmental background. It reflects the convergence of multiple progressive climate-driven modifications to the Alpine cryosphere, modifications that, as of the 2024–2025 season, had collectively advanced to the point at which the snowpack boundary conditions necessary for widespread canonical slush flow initiation became achievable under a meteorological forcing regime consistent with recurrent Piedmontese ROS events.
The primary driver is the long-term warming of the Italian Alps. The HISTALP long-term instrumental dataset [47] documents a rise of approximately 150–250 m in the mean elevation of the 0 °C isotherm since 1980, and the Italian Alps as a whole are warming at approximately 1.5–2× the European mean rate [48]. This isotherm rise has two direct consequences for slush flow susceptibility. First, it extends the elevation band within which winter and spring air temperatures remain consistently above 0 °C, thereby expanding the zone in which snowpacks can reach isothermal conditions earlier in the spring season and in which mid-winter thaw episodes can partially prime the snowpack toward the funicular LWC regime. Second, it raises the elevation of the boundary between liquid precipitation and snowfall, exposing progressively deeper and thermally more mature snowpacks to direct rainfall during ROS events. The October 2020 event, in which warm rainfall descended to 1200 m a.s.l. within 24 h of snowfall above 1600 m, already illustrated the compression of the thermal buffer zone between snowline and freezing level that this isotherm rise produces. By the 2024–2025 season, this compression had advanced sufficiently that the spring snowpack across the 1800–2500 m a.s.l. elevation band was characterized by reduced cold content relative to antecedent decades, lowering the threshold liquid water input required to trigger funicular-regime saturation.
Progressive warming also modifies snowpack internal structure in ways that enhance slush flow susceptibility independently of mean LWC trends. More frequent mid-winter thaw–refreeze cycles (a documented consequence of the positive temperature trend) generate ice layers and melt-freeze crusts within the seasonal snowpack at progressively higher elevations. As noted above, such layers act as lateral-flow redirectors that concentrate meltwater in gullies and topographic depressions, facilitating the rapid LWC increase necessary for slush flow initiation [7]. A snowpack that has undergone multiple partial-melt cycles during the preceding winter arrives at the spring ROS season with a stratigraphic architecture that is substantially more efficient at routing infiltrating water toward saturation zones than the more homogeneous, cold-content-rich snowpack that characterizes winters with fewer thaw interruptions.
A further consequence of regional warming that directly bears on the April 2025 outcome is permafrost degradation. Colucci and Guglielmin [51] documented rapid permafrost loss in the Italian Alps, with warming of mountain permafrost reducing the structural stability of periglacial slopes and diminishing substrate drainage capacity. The loss of permafrost converts previously permeable coarse-debris and fractured-bedrock substrates into near-impermeable boundary conditions for infiltrating meltwater, precisely the substrate condition identified by [30] as a necessary precondition for snowpack saturation sufficient to initiate slush flows. The erosion of waterlogged soil substrate documented during the Fontanetta runout phase is consistent with substrate moisture conditions promoted by degraded or absent permafrost, and the large debris component incorporated into the flow mass reflects the destabilization of slope material that permafrost degradation facilitates.
Superimposed on the thermal trend is the documented intensification of extreme precipitation events across northern Italy. Brunetti et al. [46] identified statistically significant trends toward more frequent high-percentile precipitation events in Piedmont, Lombardy, and Trentino-Alto Adige, and Isotta et al. [50] confirmed increased frequency of events exceeding the 99th percentile over the southern Alps for the period 1971–2008. More frequent and more intense extreme precipitation events translate directly into more frequent delivery of high liquid-water volumes to vulnerable snowpacks, increasing the probability that any given spring ROS event will provide sufficient water supply to drive the snowpack across the funicular threshold. The April 2025 precipitation totals—locally exceeding 550 mm in 48 h across sectors of northern Piedmont—fall in the extreme tail of the regional precipitation distribution and are consistent with the intensification trend documented in the literature.
The convergence of these factors (progressive reduction in snowpack cold content through warming, increased frequency of mid-winter thaw cycles promoting ice layer formation, permafrost degradation expanding the areal extent of impermeable substrate conditions, and intensification of extreme precipitation events increasing water supply inputs) explains why a process threshold that had not been observably crossed during any of the 20 catalogued Piedmontese ROS events between 1968 and 2023, including episodes of substantially greater absolute precipitation magnitude, was crossed in April 2025. The April 2025 event operated in an environmental context that has been systematically modified by several decades of accelerating climate change, and it encountered a snowpack whose boundary conditions, in terms of cold content, internal structure, and substrate drainage capacity, had been progressively preconditioned by those modifications. It represents, in the terminology applicable to nonlinear dynamical systems, the crossing of a tipping threshold rather than an extreme outlier within a stationary distribution.

4.3. Monitoring Gaps, Underreporting, and Implications for Hazard Assessment

A necessary caveat in interpreting the April 2025 events as the “first” occurrence of widespread slush flows in the Piedmontese Alps is the acknowledged systematic underreporting of such phenomena in the Italian record. No national Italian slush flow database comparable to the Norwegian NSDB exists. The AINEVA avalanche network records wet snow avalanche events, some of which may represent slush flows under the Hestnes [2] definition, but no systematic reclassification of the AINEVA archive against formal slush flow criteria has been performed. The magnitude of underreporting documented by Morken et al. [12] at a single Norwegian site, where multitemporal aerial imagery revealed 25 slush flow events against the 5 registered in the NSDB (an overall detection rate of 20%), illustrates the scale of potential undercount even in the world’s most systematically maintained national record. The Italian pre-2025 record, lacking even a dedicated database, is likely characterized by far more severe underreporting. It is, therefore, possible that slush flow events of limited spatial extent or lower mobility than the April 2025 cases have occurred in the Piedmontese Alps during the catalogue period but were misclassified as wet snow avalanches, debris flows, or mass movement events of uncertain genesis.
However, the April 2025 events are qualitatively distinguished from potential earlier unrecorded occurrences by their spatial extent, their morphological unambiguity (large debris-laden flows reaching inhabited valley floors over gentle terrain, structural damage at distances beyond SIVA-mapped propagation boundaries), and their explicit documentation by operational observers and in the scientific literature. The Valprato Soana slush flow runout exceedance of SIVA boundaries is a particularly robust indicator: had events of comparable magnitude occurred at that site during the period in which SIVA was maintained, they would have been incorporated into the hazard mapping that now constitutes the planning perimeter. The combination of documented absence from historical archives and the physical arguments developed in Section 3.2 therefore provides a reasonable scientific basis for the interpretation that April 2025 marked, if not the strict first occurrence, then the first occurrence at a scale and intensity constituting a qualitatively new hazard configuration for the region.
The operational implications of this assessment extend across hazard zonation, protective infrastructure, and early warning. SIVA avalanche hazard maps, calibrated against historical dry and wet snow avalanche events without systematic incorporation of slush flow runout characteristics, require revision at sites where the April 2025 events exceeded mapped boundaries. The structural failure of the Macugnaga avalanche tunnel under slush flow loading demonstrates that protective works dimensioned for standard avalanche impact scenarios are inadequate in a regime where high-LWC, highly mobile slush masses generate impact pressures and loading geometries outside the design envelope. The Norwegian WSR-based SFEWS framework [5], integrating ground frost depth, snow type susceptibility, water supply, and snow depth into a spatially resolved four-level warning, represents the most operationally tested conceptual model for slush flow early warning currently available. Its adaptation to the Piedmontese Alpine context, using the documented April 2025 event as a calibration anchor, represents a concrete and scientifically grounded pathway toward operational preparedness for a hazard that is no longer prospective but present.

5. Conclusions

This study presents the first analysis of widespread slush flows occurrence in the Piedmontese Alps within a systematic ROS event catalogue framework and a climate change context grounded in verified published data.
The 20-event ROS catalogue for the Piedmontese Alps (1968–2023) demonstrates that ROS events are a climatologically recurrent and physically explicable hazard, with a strong seasonal concentration in autumn (55% of events) and a consistent primary hazard expression, across all severity classes, including the catastrophic 1994 and 2000 episodes, in the form of shallow landslides, debris flows, and riverine flooding following the three-phase cascade documented by [54,56]. No slush flow event, as formally defined by [2] was identified as a primary process in any of the 20 catalogued events.
The ROS event of 15–17 April 2025 produced widespread, morphologically unambiguous slush flow phenomena across the northern and northwestern Piedmontese Alps. The Fontanetta event (Val Soana) exceeded the runout boundaries mapped in the SIVA avalanche information system and caused severe structural damage at distances outside the established hazard planning perimeter. The Macugnaga event (Anzasca Valley) demonstrated the inadequacy of existing avalanche protective infrastructure under high-LWC slush flow loading conditions. These outcomes constitute evidence of a qualitative transition in the regional hazard regime, not a quantitative intensification of known processes.
The April 2025 threshold crossing is attributable to the convergence of snowpack boundary conditions that were absent or substantially weaker in all prior catalogued events: a spring snowpack at or near isothermal conditions at 0 °C throughout its depth, with depleted cold content and a stratified internal architecture promoting preferential lateral water routing; exceptional liquid water supply (locally exceeding 550 mm in 48 h) concentrated over a period shorter than that of hydrometeorologically more severe historical events; new snow of anomalously high density and LWC deposited above 2500 m; and full snowpack saturation below approximately 2000 m a.s.l. These conditions collectively drove the snowpack across the funicular LWC threshold (>15% volumetric) [5,24] across broad sectors simultaneously. These snowpack boundary conditions reflect the cumulative and accelerating effects of documented climate change in the Piedmontese and broader Italian Alps: progressive rise of the 0 °C isotherm by 150–250 m since 1980 [47,48] increasing frequency of mid-winter thaw–refreeze cycles modifying snowpack internal architecture, progressive permafrost degradation reducing substrate drainage capacity in periglacial terrain [51] and intensification of extreme precipitation events [46,50]. The April 2025 event represents the crossing of a process threshold that these progressive modifications had been approaching for years, not a random meteorological outlier within a stationary climate.
Slush flow occurrence in the northwestern Italian Alps must be interpreted as a measurable and physically grounded indicator of climate-driven modification of the Alpine cryosphere, analogous in its diagnostic significance to glacier retreat, snowline rise, and permafrost degradation. Under the warming trajectories projected by [48] the frequency and spatial extent of slush flow episodes in the Piedmontese Alps are expected to increase as the fraction of terrain satisfying the necessary conditions of depleted cold content, ice-layer-enhanced preferential flow, and impermeable substrate progressively expands.
The operational consequences are immediate. Slush flow hazard zonation, structural design standards for protective works, and early warning frameworks in the northwestern Italian Alps require systematic revision considering the documented events of April 2025. The SIVA system, the AINEVA database, and the regional network of protective avalanche structures were designed for a hazard regime that no longer fully describes the process environment. The development of a systematic Italian slush flow inventory, adaptation of the Norwegian WSR-based early warning framework to Piedmontese conditions, and revision of impact force design criteria for avalanche protective structures in high-vulnerability sectors represent the minimum necessary scientific and operational responses to a hazard that has transitioned from a prospective concern to a documented and recurring reality.

Author Contributions

Conceptualization, D.T. and I.C.; methodology, D.T. and I.C.; software, D.T.; validation, D.T., I.C., L.L. and A.S.; formal analysis, D.T., I.C. and L.L.; investigation, D.T., I.C., L.L. and A.S.; resources, D.T., I.C., L.L. and A.S.; data curation, D.T., I.C., L.L. and A.S.; writing—original draft preparation, D.T., I.C. and L.L.; writing—review and editing, D.T., I.C., L.L. and A.S.; visualization, D.T., I.C. and L.L.; supervision, D.T. All authors have read and agreed to the published version of the manuscript.

Funding

This research received no external funding.

Data Availability Statement

Data are available at Arpa Piemonte hydrometeorological and mass-movement events database (https://webgis.arpa.piemonte.it/portal/apps/experiencebuilder/experience/?id=6c07e6b79a404cfa85a48342f53eb108, accessed on 28 April 2026); SIVA webportal (https://webgis.arpa.piemonte.it/portal/apps/experiencebuilder/experience/?id=04d98ab767c94dd3b1eab694608c39c4&page=Home, accessed on 28 April 2026); AINEVA seasonal reports (https://aineva.it/relazioni-stagionali/, accessed on 28 April 2026); Arpa Piemonte event reports (https://www.arpa.piemonte.it/ricerca/pubblicazioni?field_tema_target_id=56, accessed on 28 April 2026); April 2026 ROS event mapped on the Geoportal of Arpa Piemonte (https://geoportale.arpa.piemonte.it/app/public/?pg=mappa&ids=e3084362159542fd82ef0f1fce88d03a, accessed on 28 April 2026); The Population at Risk from Landslides and Floods in Italy (POLARIS) database (https://polaris.irpi.cnr.it/, accessed on 28 April 2026).

Conflicts of Interest

The authors declare no conflicts of interest.

References

  1. Rapp, A.; Nyberg, R. Alpine debris flows in northern Scandinavia: Morphology and dating by lichenometry. Geogr. Ann. Ser. A 1981, 63, 183–196. [Google Scholar] [CrossRef]
  2. Hestnes, E. Slushflow hazard—Where, why and when? 25 years of experience with slushflow consulting and research. Ann. Glaciol. 1996, 26, 370–376. [Google Scholar] [CrossRef]
  3. Hamre, D.; Blatny, L.; Gaume, J.; Gauer, P.; Mears, A. Observations and Modeling of Slushflows—Atigun Pass, Alaska. In Proceedings of the International Snow Science Workshop (ISSW), Tromsø, Norway, 23–27 September 2024; pp. 718–724. [Google Scholar]
  4. Hestnes, E.; Bakkehøi, S. Slushflow hazard prediction and warning. Ann. Glaciol. 2004, 38, 45–51. [Google Scholar] [CrossRef]
  5. Sund, M.; Grønsten, H.A.; Seljesæter, S.Å. A regional early warning for slushflow hazard. Nat. Hazards Earth Syst. Sci. 2024, 24, 1185–1201. [Google Scholar] [CrossRef]
  6. Blatny, L.; Hamre, D.; Gaume, J.; Gauer, P.; Mears, A. Observations and modeling of slushflows from Atigun Pass, Alaska. Cold Reg. Sci. Technol. 2026, 245, 104812. [Google Scholar] [CrossRef]
  7. Marshall, H.-P.; CryoGARS Group. Water in snow likes to go with the flow: Dynamics of liquid water in snow and its impact on stability. In Proceedings of the International Snow Science Workshop (ISSW), Banff, AB, Canada, 29 September–3 October 2014; pp. 43–47. [Google Scholar]
  8. Miller, A.D.; Redpath, T.A.N.; Sirguey, P.; Cox, S.C.; Bartelt, P.; Bogie, D.; Conway, J.P.; Cullen, N.J.; Bühler, Y. Unprecedented winter rainfall initiates large snow avalanche and mass movement cycle in New Zealand’s Southern Alps/Kā Tiritiri o te Moana. Geophys. Res. Lett. 2023, 50, e2022GL102105. [Google Scholar] [CrossRef]
  9. Waitt, R.B. Swift snowmelt and floods (lahars) caused by great pyroclastic surge at Mount St. Helens volcano, Washington, 18 May 1980. Bull. Volcanol. 1989, 52, 138–157. [Google Scholar] [CrossRef]
  10. Kobayashi, S.; Izumi, K.; Kamiishi, I. Slushflow disasters in Japan and its characteristics. In Proceedings of the International Snow Science Workshop, Snowbird, UT, USA, 30 October–3 November 1994; pp. 657–665. Available online: https://arc.lib.montana.edu/snow-science/item/1387 (accessed on 28 April 2026).
  11. Decaulne, A.; Saemundsson, T. Meteorological conditions during slush-flow release and their geomorphological impact in northwestern Iceland. Geogr. Ann. Ser. A 2006, 88, 187–197. [Google Scholar] [CrossRef]
  12. Morken, E.; Sund, M.; Eiken, T.; Lunde, E.N. Slushflows: Large discrepancy between reported and actual incidents. J. Glaciol. 2025, 71, e96. [Google Scholar] [CrossRef]
  13. Gude, M.; Scherer, D. Snowmelt and slushflows—Hydrological and hazard implications. Ann. Glaciol. 1998, 26, 381–384. [Google Scholar] [CrossRef]
  14. D’Amboise, C.; Hansen, V.; Hendrikx, J.; Vick, L. Motivation for slushflow classification. In Proceedings of the International Snow Science Workshop (ISSW), Tromsø, Norway, 23 September 2024; Available online: https://arc.lib.montana.edu/snow-science/item/3223 (accessed on 28 April 2026).
  15. Eckerstorfer, M.; Christiansen, H.H. Meteorology, topography and snowpack conditions causing two extreme mid-winter slush and wet slab avalanche periods in high Arctic maritime Svalbard. Permafr. Periglac. Process. 2012, 23, 15–25. [Google Scholar] [CrossRef]
  16. Onesti, L.; Hestnes, E. Slush-flow questionnaire. Ann. Glaciol. 1989, 13, 226–230. [Google Scholar] [CrossRef][Green Version]
  17. Onesti, L.J. Slushflow/slush avalanche terminology. ICE News Bull. Int. Glaciol. Soc. 1995, 107, 20. [Google Scholar]
  18. Lunde, E.N.; Morken, E.; Devoli, G.; Sund, M. Registrerte og kontrollerte sørpeskred i Norge: Statistisk oversikt og metodegrunnlag; NVE Rapport 31/2023; Norwegian Water Resources and Energy Directorate: Oslo, Norway, 2023. [Google Scholar]
  19. Krøgli, I.K.; Devoli, G.; Colleuille, H.; Boje, S.; Sund, M.; Engen, I.K. The Norwegian forecasting and warning service for rainfall- and snowmelt-induced landslides. Nat. Hazards Earth Syst. Sci. 2018, 18, 1427–1450. [Google Scholar] [CrossRef]
  20. Devoli, G.; Tiranti, D.; Cremonini, R.; Sund, M.; Boje, S. Comparison of landslide forecasting services in Piedmont (Italy) and Norway, illustrated by events in 2016. Nat. Hazards Earth Syst. Sci. 2018, 18, 1351–1372. [Google Scholar] [CrossRef]
  21. Larocque, S.J.; Hétu, B.; Filion, L. Geomorphic and dendroecological impacts of slushflows in central Gaspé Peninsula (Québec, Canada). Geogr. Ann. Ser. A 2001, 83, 191–201. [Google Scholar] [CrossRef]
  22. Juras, R.; Spusta, V.; Kociánová, M.; Špatenková, I.; Pavlásek, J. Water saturated avalanches in the Krkonosě Mts. In Advances in Avalanche Forecasting; ACADEMIA: Podbanké, Slovakia, 2012; Available online: https://www.academia.edu/2378208/Water_saturated_avalanches_in_the_Krkonoše_Mts (accessed on 28 April 2026).
  23. Denoth, A. Effect of grain geometry on electrical properties of snow. J. Glaciol. 1982, 28, 273–278. [Google Scholar] [CrossRef]
  24. Fierz, C.; Armstrong, R.L.; Durand, Y.; Etchevers, P.; Greene, E.; McClung, D.M.; Nishimura, K.; Satyawali, P.K.; Sokratov, S.A. The International Classification for Seasonal Snow on the Ground; IHP-VII Technical Documents in Hydrology No. 83; UNESCO: Paris, France, 2009. [Google Scholar]
  25. Albert, M.R.; Perron, F.E. Ice layer and surface crust permeability in a seasonal snow pack. Hydrol. Process. 2000, 14, 3207–3214. [Google Scholar] [CrossRef]
  26. Hestnes, E.; Bakkehøi, S. Observations on water level fluctuations in snow due to rain and snowmelt. In Proceedings of the International Conference on Avalanches and Related Subjects, Proceedings, Kirovsk, Russia, 2–6 September 1996; Production Association Apatit: Cherepovets, Russia, 1996; pp. 2–6. [Google Scholar]
  27. Würzer, S.; Jonas, T.; Wever, N.; Lehning, M. Influence of initial snowpack properties on runoff formation during rain-on-snow events. J. Hydrometeorol. 2016, 17, 1801–1815. [Google Scholar] [CrossRef]
  28. Garvelmann, J.; Pohl, S.; Weiler, M. Spatio-temporal controls of snowmelt and runoff generation during rain-on-snow events in a mid-latitude mountain catchment. J. Hydrol. 2015, 520, 576–589. [Google Scholar] [CrossRef]
  29. Singh, P.; Spitzbart, G.; Hübl, H.; Weinmeister, H.W. Hydrological response of snowpack under rain-on-snow events: A field study. J. Hydrol. 1997, 202, 1–20. [Google Scholar] [CrossRef]
  30. Hestnes, E. A contribution to the prediction of slush avalanches. Ann. Glaciol. 1985, 6, 1–4. [Google Scholar] [CrossRef]
  31. Beldring, S.; Engeland, K.; Roald, L.A.; Sælthun, N.R.; Voksø, A. Estimation of parameters in a distributed precipitation-runoff model for Norway. Hydrol. Earth Syst. Sci. 2003, 7, 304–316. [Google Scholar] [CrossRef]
  32. Jaedicke, C.; Høydal, Ø.A.; Midtbø, K.H. Identification of slushflow situations from regional weather models. In Proceedings of the International Snow Science Workshop, Grenoble, France, 7–11 October 2013; ANENA: Grenoble, France, 2013; pp. 177–182. Available online: https://hdl.handle.net/11250/3083329 (accessed on 28 April 2026).
  33. Scherer, D.; Gude, M.; Gempeler, M.; Parlow, E. Atmospheric and hydrological boundary conditions for slushflow initiation due to snowmelt. Ann. Glaciol. 1998, 26, 377–380. [Google Scholar] [CrossRef][Green Version]
  34. Jaedicke, C.; Kern, M.; Gauer, P.; Baillifard, M.; Platzer, K. Chute experiments on slushflow dynamics. Cold Reg. Sci. Technol. 2008, 51, 156–167. [Google Scholar] [CrossRef]
  35. Washburn, A.L. Geocryology: A Survey of Periglacial Processes and Environments; Edward Arnold: London, UK, 1980. [Google Scholar]
  36. Saloranta, T.M. Operational snow mapping with simplified data assimilation using the seNorge snow model. J. Hydrol. 2016, 538, 314–325. [Google Scholar] [CrossRef]
  37. Mears, A. Release and Motion of Arctic Slushflows. In Proceedings of the 1982 International Snow Science Workshop, Bozeman, MT, USA, 1982; pp. 3–4. Available online: https://mearsandwilbur.com/pubs.html (accessed on 4 May 2026).
  38. Pérez-Guillén, C.; Tsunematsu, K.; Nishimura, K.; Issler, D. Seismic location and tracking of snow avalanches and slush flows on Mt. Fuji, Japan. Earth Surf. Dyn. 2019, 7, 989–1007. [Google Scholar] [CrossRef]
  39. McClung, D.; Schaerer, P. The Avalanche Handbook, 3rd ed.; The Mountaineers Books: Seattle, WA, USA, 2006; ISBN 978-0898867671. [Google Scholar]
  40. Piana, F.; Fioraso, G.; Irace, A.; Mosca, P.; d’Atri, A.; Barale, L.; Falletti, P.; Monegato, G.; Morelli, M.; Tallone, S.; et al. Geology of Piemonte region (NW Italy, Alps–Apennines interference zone). J. Maps 2017, 13, 395–405. [Google Scholar] [CrossRef]
  41. Acquaotta, F.; Fratianni, S. Analysis on long precipitation series in Piedmont (North-West Italy). Am. J. Clim. Change 2013, 2, 14–24. [Google Scholar] [CrossRef]
  42. Garzena, D.; Acquaotta, F.; Fratianni, S. Analysis of the long-time climate data series for Turin and assessment of the city’s urban heat island. Weather 2019, 74, 353–359. [Google Scholar] [CrossRef]
  43. Acquaotta, F.; Fratianni, S.; Garzena, D. Temperature changes in the North-Western Italian Alps from 1961 to 2010. Theor. Appl. Climatol. 2015, 122, 619–634. [Google Scholar] [CrossRef]
  44. Matiu, M.; Crespi, A.; Bertoldi, G.; Carmagnola, C.M.; Marty, C.; Morin, S.; Schöner, W.; Cat Berro, D.; Chiogna, G.; De Gregorio, L.; et al. Observed snow depth trends in the European Alps: 1971 to 2019. Cryosphere 2021, 15, 1343–1382. [Google Scholar] [CrossRef]
  45. Brunetti, M.; Maugeri, M.; Monti, F.; Nanni, T. Temperature and precipitation variability in Italy in the last two centuries from homogenised instrumental time series. Int. J. Climatol. 2006, 26, 345–381. [Google Scholar] [CrossRef]
  46. Auer, I.; Böhm, R.; Jurkovic, A.; Lipa, W.; Orlik, A.; Potzmann, R.; Schöner, W.; Ungerspöck, M.; Matulla, C.; Briffa, K.; et al. HISTALP—Historical instrumental climatological surface time series of the Greater Alpine Region. Int. J. Climatol. 2007, 27, 17–46. [Google Scholar] [CrossRef]
  47. Gobiet, A.; Kotlarski, S.; Beniston, M.; Heinrich, G.; Rajczak, J.; Stoffel, M. 21st century climate change in the European Alps—A review. Sci. Total Environ. 2014, 493, 1138–1151. [Google Scholar] [CrossRef]
  48. Brunetti, M.; Lentini, G.; Maugeri, M.; Nanni, T.; Auer, I.; Böhm, R.; Schöner, W. Climate variability and change in the Greater Alpine Region over the last two centuries based on multi-variable analysis. Int. J. Climatol. 2009, 29, 2197–2225. [Google Scholar] [CrossRef]
  49. Isotta, F.A.; Frei, C.; Weilguni, V.; Percec Tadic, M.; Lassègues, P.; Rudolf, B.; Pavan, V.; Cacciamani, C.; Antolini, G.; Ratto, S.M.; et al. The climate of daily precipitation in the Alps: Development and analysis of a high-resolution grid dataset from pan-Alpine rain-gauge data. Int. J. Climatol. 2014, 34, 1657–1675. [Google Scholar] [CrossRef]
  50. Colucci, R.R.; Guglielmin, M. Climate change and rapid ice melt: Suggestions from abrupt permafrost degradation and ice melting in an alpine ice cave. Prog. Phys. Geogr. 2019, 43, 561–573. [Google Scholar] [CrossRef]
  51. Harr, R.D. Some characteristics and consequences of snowmelt during rainfall in western Oregon. J. Hydrol. 1981, 53, 277–304. [Google Scholar] [CrossRef]
  52. Luino, F. The flood and landslide event of November 4–6, 1994 in Piedmont Region: Causes and related effects in Tanaro Valley. Phys. Chem. Earth Part B 1999, 24, 123–129. [Google Scholar] [CrossRef]
  53. Barbolini, M.; Gauer, P.; Stefanini, F. The Lillet Lake avalanche: A potential slushflow case for Italian Alps. In Proceedings of the International Snow Science Workshop (ISSW 2024), Tromsø, Norway, 23 September 2024; pp. 766–772. Available online: https://arc.lib.montana.edu/snow-science/objects/ISSW2024_P6.5.pdf (accessed on 28 April 2026).
  54. Luino, F. Sequence of instability processes triggered by heavy rainfall in northern Italy. Geomorphology 2004, 66, 13–39. [Google Scholar] [CrossRef]
  55. Tropeano, D.; Turconi, L.; Sanna, S. Debris flows after the November 2002 and 2003 storms in Italy. In Proceedings of the INTERPRAEVENT 2004, Riva del Garda, Italy, 24–27 May 2004; INTERPRAEVENT: Klagenfurt, Austria, 2004; Volume 1, pp. 121–132. [Google Scholar]
  56. Cremonini, R.; Tiranti, D. The weather radar observations applied to shallow landslides prediction: A case study from North-Western Italy. Front. Earth Sci. 2018, 6, 134. [Google Scholar] [CrossRef]
  57. Buzzi, A.; Tartaglione, N.; Malguzzi, P. Numerical simulations of the 1994 Piedmont flood: Role of orography and moist processes. Mon. Weather. Rev. 1998, 126, 2369–2383. [Google Scholar] [CrossRef]
Figure 1. Slush flow vs. typical dry slab avalanche. Sketch of processes, properties and typical ranges in natural snow conditions.
Geohazards 07 00067 g001
Figure 2. Documented slush flow events in the Norwegian NSDB: events per century, 1500s–2020s.
Geohazards 07 00067 g002
Figure 3. Documented slush flow events in the Norwegian NSDB: events per decade, 1900–August 2023. The asterisk indicates a partial year (2023 is not complete).
Geohazards 07 00067 g003
Figure 5. Piedmont map representing main river basis and province distribution. The red dot on the schematic map of Italy represents the location of the Piedmont region.
Geohazards 07 00067 g005
Figure 6. Trends in Alpine snowpack indices for the period 1971–2019: seasonal (November–May) mean snow depth trend (cm decade−1) by 1000 m elevation band for the southern Alpine region.
Geohazards 07 00067 g006
Figure 7. Trends in Alpine snowpack indices for the period 1971–2019: pan-Alpine average trends (% decade−1) for seasonal mean snow depth (meanHS), maximum snow depth (maxHS), and snow cover duration (SCD).
Geohazards 07 00067 g007
Figure 8. (a) ROS events per decade, Piedmontese Alps (1960–2025, n = 20). (b) Seasonal distribution of the same 20 events. Source Arpa Piemonte event reports (https://www.arpa.piemonte.it/ricerca/pubblicazioni?field_tema_target_id=56, accessed on 28 April 2026).
Geohazards 07 00067 g008
Figure 9. (a) Cumulated rainfall of 15–17 April 2025; (b) Antecedent cumulated snowfall on 15 April 2025.
Geohazards 07 00067 g009
Figure 10. Distribution of landslide and flood reports (red stars) for 15–17 April 2025, in Piedmont.
Geohazards 07 00067 g010
Figure 11. Two slush flows occurred between 16 and 17 April 2025 in Formazza Valley (VB) involving the main road network of the valley.
Geohazards 07 00067 g011
Figure 12. (a) Slush flow deposit affected the avalanche barrier (avalanche tunnel) along the road leading to Macugnaga (VB). (b) A close-up of the deposit where the snow component mixed with debris is still clearly visible (Anzasca Valley, VB).
Geohazards 07 00067 g012
Figure 13. The Valprato Soana (TO) slush flow that has reached the cemetery and a building (yellow dashed line delimiting the invasion area), exceeding the historical runout record (red area) of dry snow avalanches that spread in that area. Image modified from 3D View of SIVA portal (https://webgis.arpa.piemonte.it/portal/apps/experiencebuilder/experience/?id=04d98ab767c94dd3b1eab694608c39c4&page=Home, accessed on 28 April 2026).
Geohazards 07 00067 g013
Figure 14. (a) The Valprato Soana (TO) slush flow that damaged a building, the large debris component incorporated into the snow mass is visible; (b) frontal view of slush flow deposit from slope.
Geohazards 07 00067 g014
Table 1. Snowpack LWC regimes and published trigger thresholds [5,23,24].
LWC Range
(% vol.)
Regime/StateHazard Relevance
0–3Dry snow (pendular)No significant hazard
3–8Moist (pendular)Wet slab avalanche trigger (3–8%)
7–12Funicular onset (coarse snow)Transitional
13–18Funicular onset (new snow)Transitional
>15Soaked (funicular)Slush flow trigger
Table 3. Catalogue of documented ROS events in Piedmont (1968–2023). ★ indicates a severity ≥ 4 (Severe/Catastrophic), Fat. indicates confirmed fatalities. Abbreviations of the provinces of Piedmont: TO—Turin, CN—Cuneo, AT—Asti, AL—Alessandria, NO—Novara, BI—Biella, VC—Vercelli, VB—Verbano–Cusio–Ossola. Source Arpa Piemonte event reports (https://www.arpa.piemonte.it/ricerca/pubblicazioni?field_tema_target_id=56, accessed on 28 April 2026).
N.DateSeasonMain Areas AffectedSnowpack Elev. (m a.s.l.)Max Rainfall (mm/Duration)Dominant ROS MechanismPrimary EffectsFat.
1Nov 1968AutumnWestern Alps Po tributaries (CN–TO)800–1200~150/48 hWarm Mediterranean intrusion + early-season snowmelt at sub-montane elevationsRiverine floods; shallow landslides on forested slopesSeveral
2Feb 1977WinterSusa Valley, Dora Riparia river (TO)600–1000~100/36 hFoehn + Atlantic frontal rain on low-elevation snowpack; sensible heat flux drives active meltFlooding of Dora Riparia; soil slips on steep valley flanks2
3Oct–Nov 1978AutumnMultiple geographic sectors (CN–VB)900–1400~180/48 hCyclonic precipitation on early-season snowpack; rapid liquid water equivalent releaseMulti-basin flooding; debris flows in Alpine catchments4
4May 1984SpringChisone Valley, Germanasca Valley, Pellice river (TO)1400–2000~120/24 hLate-spring rainstorm on persistent subalpine snowpack; active melt under high solar radiationShallow landslides; torrent flooding; road closures1
5Nov 1990AutumnUpper Tanaro basin, Maritime Alps
(CN)
800–1200~160/36 hAtlantic front + passive-to-active snowpack transition at 800–1200 m a.s.l.Riverine flooding; road and infrastructure damage0
6Oct–Nov 1993AutumnMultiple geographic sectors
(CN, TO, AT, AL)
700–1400~190/48 hPersistent cyclone; synchronous snowmelt at sub-montane and montane elevationsWidespread shallow landslides; multi-basin flooding8
74–6 Nov 1994 ★AutumnTanaro, Belbo, Bormida, Orba; Dora Baltea, Orco, Sesia rivers
(CN, AL, AT, TO, BI, VC, NO)
800–1400264/24 h (CN); >300/36 h (other provinces)Persistent NW European depression; extreme orographic rainfall on early-season snowpack; convective precipitation + snowmelt Maritime Alps → TanaroCatastrophic flooding (Tanaro Valley); >2000 buildings destroyed; 38 towns inundated; unit discharge 0.6–7.3 m3 s−1 km−2 (never recorded before)44
8Apr–May 1997SpringVaraita Valley, Maira Valley, Grana Valley (CN)1600–2200~130/48 hWarm frontal rain on spring snowpack; high solar radiation accelerates meltShallow landslides; torrent flooding; road damage0
913–16 Oct 2000 ★AutumnPo, Sesia, Orco, Dora Baltea, Toce rivers (TO, BI, VC, NO, VB)1000–2000>600/96 h (VB)Extreme cyclonic precipitation + snowmelt from Monte Rosa and Pennine Alps; exceptional orographic enhancement Most intense Po River flood in 200 years; parts; Multiple rivers ≥200-yr return period28
10May 2002SpringSesia Valley, Mastallone river (VC)1400–2000~110/24 hSpring rainstorm on late-lying snowpack; latent heat transfer accelerates meltShallow landslides; stream flooding; road closures0
11Nov 2002AutumnUpper Verbano, Ossola (VB)1000–1600~150/36 hAtlantic front + November snowmelt; synchronous runoff Toce and tributariesFlooding of Toce; infrastructures damaged2
12Apr 2003SpringGraian Alps, Val Soana Valley (TO)1600–2200~90/24 hSpring rain + accelerated snowmelt (anomalously warm spring 2003)Torrent flooding; minor debris flows0
13May 2008SpringMaritime Alps, Vermenagna Valley (CN)1400–2000~115/48 hMediterranean front + late-spring snowmelt; active snowpack (high liquid water content)Shallow landslides; road damages; torrent flooding0
14Apr 2009SpringChisone Valley, Susa Valley (TO)1400–2000~100/36 hWarm frontal rain on spring snowpack; passive snowpack became active above 0 °CMinor shallow landslides; stream flooding; road closures A320
15May 2013SpringCottian Alps, Pellice Valley (TO–CN)1500–2200~120/48 hCutoff low pressure + snowmelt 1500–2200 m; soil saturation by combined meltwater + rainfallShallow landslides; torrent flooding; road network interruptions0
1621–25 Nov 2016 ★AutumnUpper Tanaro basin, Pellice–Chisone basins (CN, TO)900–1600~200/12 hMediterranean cyclone + rain on Oct–Nov snowpack; snowmelt contaminates rain-gauge records at 5 Alpine stations (documented ROS gauge artefact)Widespread shallow landslides; river flooding1
17May 2017SpringSesia Valley, Mastallone river (VC)1500–2200~130/48 hAtlantic front + active spring snowmelt; peak runoff amplified by snowpack drainageTorrent flooding; road damage; bank erosion0
18Nov 2019AutumnMultiple geographic sectors (CN, TO, AT, VC) 1000–1600~190/48 hExtended Atlantic–Mediterranean depression + November snowmelt at montane elevationsMulti-basin flooding; shallow landslides; transport network disruption2
193–4 Oct 2020 ★AutumnSesia and Toce rivers, Ossola, Verbano (BI, VC, NO, VB)1200–2200~400/48 h Extreme orographic precipitation + snowmelt from Pennine and Lepontine Alps; October snowfall > 1600 m followed within 24 h by warm rainfall to 1200 mSevere riverine flooding; compound ROS in anomalously warm year5
20May 2023SpringPellice Valley, Chisone Valley, Susa Valley (TO)1500–2200~110/36 hLate-spring rainstorm on above-average snowpack (exceptional 2022–23 snow year); accelerated melt by warm advectionModerate torrent flooding; road damage; isolated shallow landslides0
Disclaimer/Publisher’s Note: The statements, opinions and data contained in all publications are solely those of the individual author(s) and contributor(s) and not of MDPI and/or the editor(s). MDPI and/or the editor(s) disclaim responsibility for any injury to people or property resulting from any ideas, methods, instructions or products referred to in the content.