Article

Experimental Insight on Hydraulic Performance of Surface Roughness in Eco-Engineered Flood Defenses

by
Nadir Murtaza
1,2 and
Ghufran Ahmed Pasha
1,*
1
Department of Civil Engineering, University of Engineering and Technology, Taxila 47050, Pakistan
2
Department of Civil Engineering, CECOS University of IT and Emerging Sciences, Peshawar 25000, Pakistan
*
Author to whom correspondence should be addressed.
GeoHazards 2026, 7(2), 73; https://doi.org/10.3390/geohazards7020073

Submission received: 8 April 2026 / Revised: 3 June 2026 / Accepted: 11 June 2026 / Published: 13 June 2026

Abstract

Flooding has become increasingly severe due to rapid urbanization and changing hydrological conditions, necessitating effective and sustainable mitigation strategies. This study investigates the hydraulic performance of a hybrid flood defense system comprising a dike, a moat, and vegetation under varying surface roughness conditions. The results demonstrate that increasing roughness significantly enhances flood mitigation performance by improving energy dissipation and delaying the propagation of floodwater. A maximum energy reduction of approximately 75.56% and a delay in floodwater arrival of up to 65% were observed under higher roughness conditions. In contrast, increasing flow intensity reduced system efficiency, highlighting the importance of optimizing roughness under varying hydraulic conditions. The findings reveal that surface roughness is the dominant factor controlling flow resistance, turbulence generation, and hydraulic jump formation within the system. The novelty of this study lies in systematically quantifying the combined effect of roughness across structural and vegetative components within a hybrid defense framework. These results provide a practical basis for the design and optimization of eco-engineered flood defense systems, offering a cost-effective approach for reducing flood risk in riverine environments.

1. Introduction

Pakistan is highly vulnerable to flooding due to its monsoon-dominated climate, snow-fed river systems, and rapidly expanding settlements within floodplains. Rapid urbanization and land-use change have significantly increased impervious surfaces, altering natural hydrological processes and intensifying surface runoff generation at the watershed scale [1]. Coupled with increasing storm intensity due to climate variability, these changes have amplified flood frequency and severity, making flooding one of the most destructive natural hazards worldwide [2]. In regions such as South Asia, Southeast Asia, and East Asia, extreme flood events have caused substantial damage to infrastructure, agriculture, and human settlements [3]. Notable flood events include the Indus Basin floods in Pakistan (2010 and 2022), the Chao Phraya River flooding in central Thailand (2011), and the Yangtze River basin floods in China (2021), all of which caused severe socio-economic disruptions and highlighted vulnerabilities in existing flood management systems [4,5,6]. These flood risks are further exacerbated by changes in rainfall patterns and runoff response, which directly influence flow regimes and hydraulic behavior in riverine systems.
Many examples of overflow during high inflows of monsoons and upstream glacial melt may be seen with special reference to the Indus River Basin, which covers most parts of Pakistan [7]. The socio-economic implications are raised on a rather high level in the rural areas where people largely rely on agriculture as the source of livelihoods and are, therefore, more vulnerable to extended flooding [8,9]. Moreover, there is uncontrolled urbanization in floodplains, destruction of forests on catchment land, and inadequate management of protection infrastructure, which increases vulnerability [10,11]. As the problem of floods increases because of population growth and climatic changes, Pakistan has a pressing need to implement flood mitigation techniques that will be long-term. Hence, the need to be educated on hydrodynamic behaviors and the enhancement of structural and eco-engineered defense is fundamental to minimize the losses, safeguard livelihoods, and increase national resilience.
To mitigate these risks, structural and eco-engineered flood defenses such as dikes, moats, and vegetation have been widely explored. These systems influence flow dynamics by altering velocity distribution, enhancing turbulence, and promoting energy dissipation. In particular, hybrid systems combining structural and ecological elements provide a promising approach for sustainable flood mitigation.
For this purpose, researchers and scientists work on developing different types of flood mitigation measures, including structural (dike, moat, and vegetation) and non-structural [12,13]. Dikes, moats, and vegetation, or a combination of these structures, are the most common structural measures proposed by different researchers for effective flood management [14,15,16,17,18,19]. A dike acts as an obstruction to the floodwater, helping to avoid overflow and redirection of the flow. A moat serves the purpose of a retention basin that stores water for a certain period, delaying floodwater from moving downstream. Previous studies used a dike and a moat individually and in combination to investigate various flow characteristics, including energy reduction, velocity reduction, hydraulic forces, and hydraulic jump formation [19,20]. Vegetation of various types, based on density, spacing, and porosity, has been predominantly proposed by researchers due to its contributions to flow resistance, sediment transport, and energy reduction [21,22,23,24]. The combination of these elements (dike, moat, and vegetation) provides a defense system named a hybrid defense system, in which the dike and moat act as a hard solution while vegetation has the capability of hydraulic and ecological function, considered as a soft solution.
Eco-engineered defenses are becoming an increasingly prominent alternative across international borders as a climate-adaptable option to provide structural protection while restoring the environment [25]. Nevertheless, the design should take into account local hydrology, sediment load, the type of vegetation, and socio-economic limitations to be technically economical, as well as feasible. For the understanding of the flow interaction with structures, researchers have used both computational fluid dynamics (CFD) and experimental modeling under varying scenarios of the flood events.
Researchers provide a precise simulation of the flow dynamics, including velocity distribution, turbulence patterns, and backwater rise around the dike, vegetation, and moat, or a combination of these structures [26,27,28,29]. Flow parameters such as water depth, velocity, and energy dissipation can be accurately measured in a reduced-scale laboratory flume under controlled replications of real-world flood scenarios. Analyses have considered not only individual elements (dikes, vegetation, or storage basins) but also combinations, although these are often not accompanied by a systematic variation in roughness or by integration of all three. An experimental investigation of the defense system provides a clearer picture of how flood mitigation is working. However, the literature continues to lack a substantive approach to hybrid systems that combine dike, moat, and vegetation under different roughness conditions, especially in situations involving sub-critical flow regimes and flooding.
Despite previous research, few studies have systematically investigated the combined influence of surface roughness in hybrid defense systems comprising a dike, a moat, and vegetation under subcritical flow conditions. This study hypothesizes that increasing surface roughness enhances turbulence generation and hydraulic resistance, leading to improved energy dissipation and delayed flood propagation. Therefore, this study aims to: (i) quantify backwater rise, energy reduction, and delay in flood arrival under varying roughness conditions; (ii) analyze hydraulic jump characteristics; and (iii) develop a predictive model for energy reduction.

2. Materials and Methods

2.1. Local Geomorphic Context and Experimental Design

The experimental framework adopted in this study is designed to represent flood conditions commonly observed in the Indus River Basin, Pakistan, where riverine flooding occurs under subcritical flow regimes within confined channels bounded by embankments. These channels are often influenced by engineered structures such as dikes and natural elements such as vegetation, which collectively alter flow dynamics and energy dissipation processes. In such geomorphic settings, floodwaters interact with surface roughness elements, including sediment deposits, vegetation, and engineered barriers, resulting in complex hydraulic behavior characterized by turbulence, backwater effects, and hydraulic jump formation. To replicate these conditions, a scaled physical model was developed using geometric and Froude similarity (see flow conditions, vegetation conditions, and modeling of dike and moat). The experimental setup integrates a hybrid defense system comprising dikes, a moat, and vegetation to simulate eco-engineered flood mitigation strategies. The selected configuration allows systematic evaluation of flow interaction with varying roughness conditions, representing real-world scenarios of floodplain and embankment-controlled flow systems.
The experimental model was developed based on geometric and dynamic similarity principles. A geometric scale ratio of 1:100 was adopted to represent prototype floodplain conditions. Dynamic similarity was ensured by maintaining Froude number equivalence between the model and the prototype, which is appropriate for free-surface flow dominated by gravity. Although complete similarity of all dimensionless parameters (e.g., Reynolds number) cannot be achieved simultaneously, the experiments were conducted under fully turbulent flow conditions to minimize viscous effects. Therefore, the model provides a reliable representation of hydraulic behavior relevant to flood flow interactions with structural and vegetative elements.
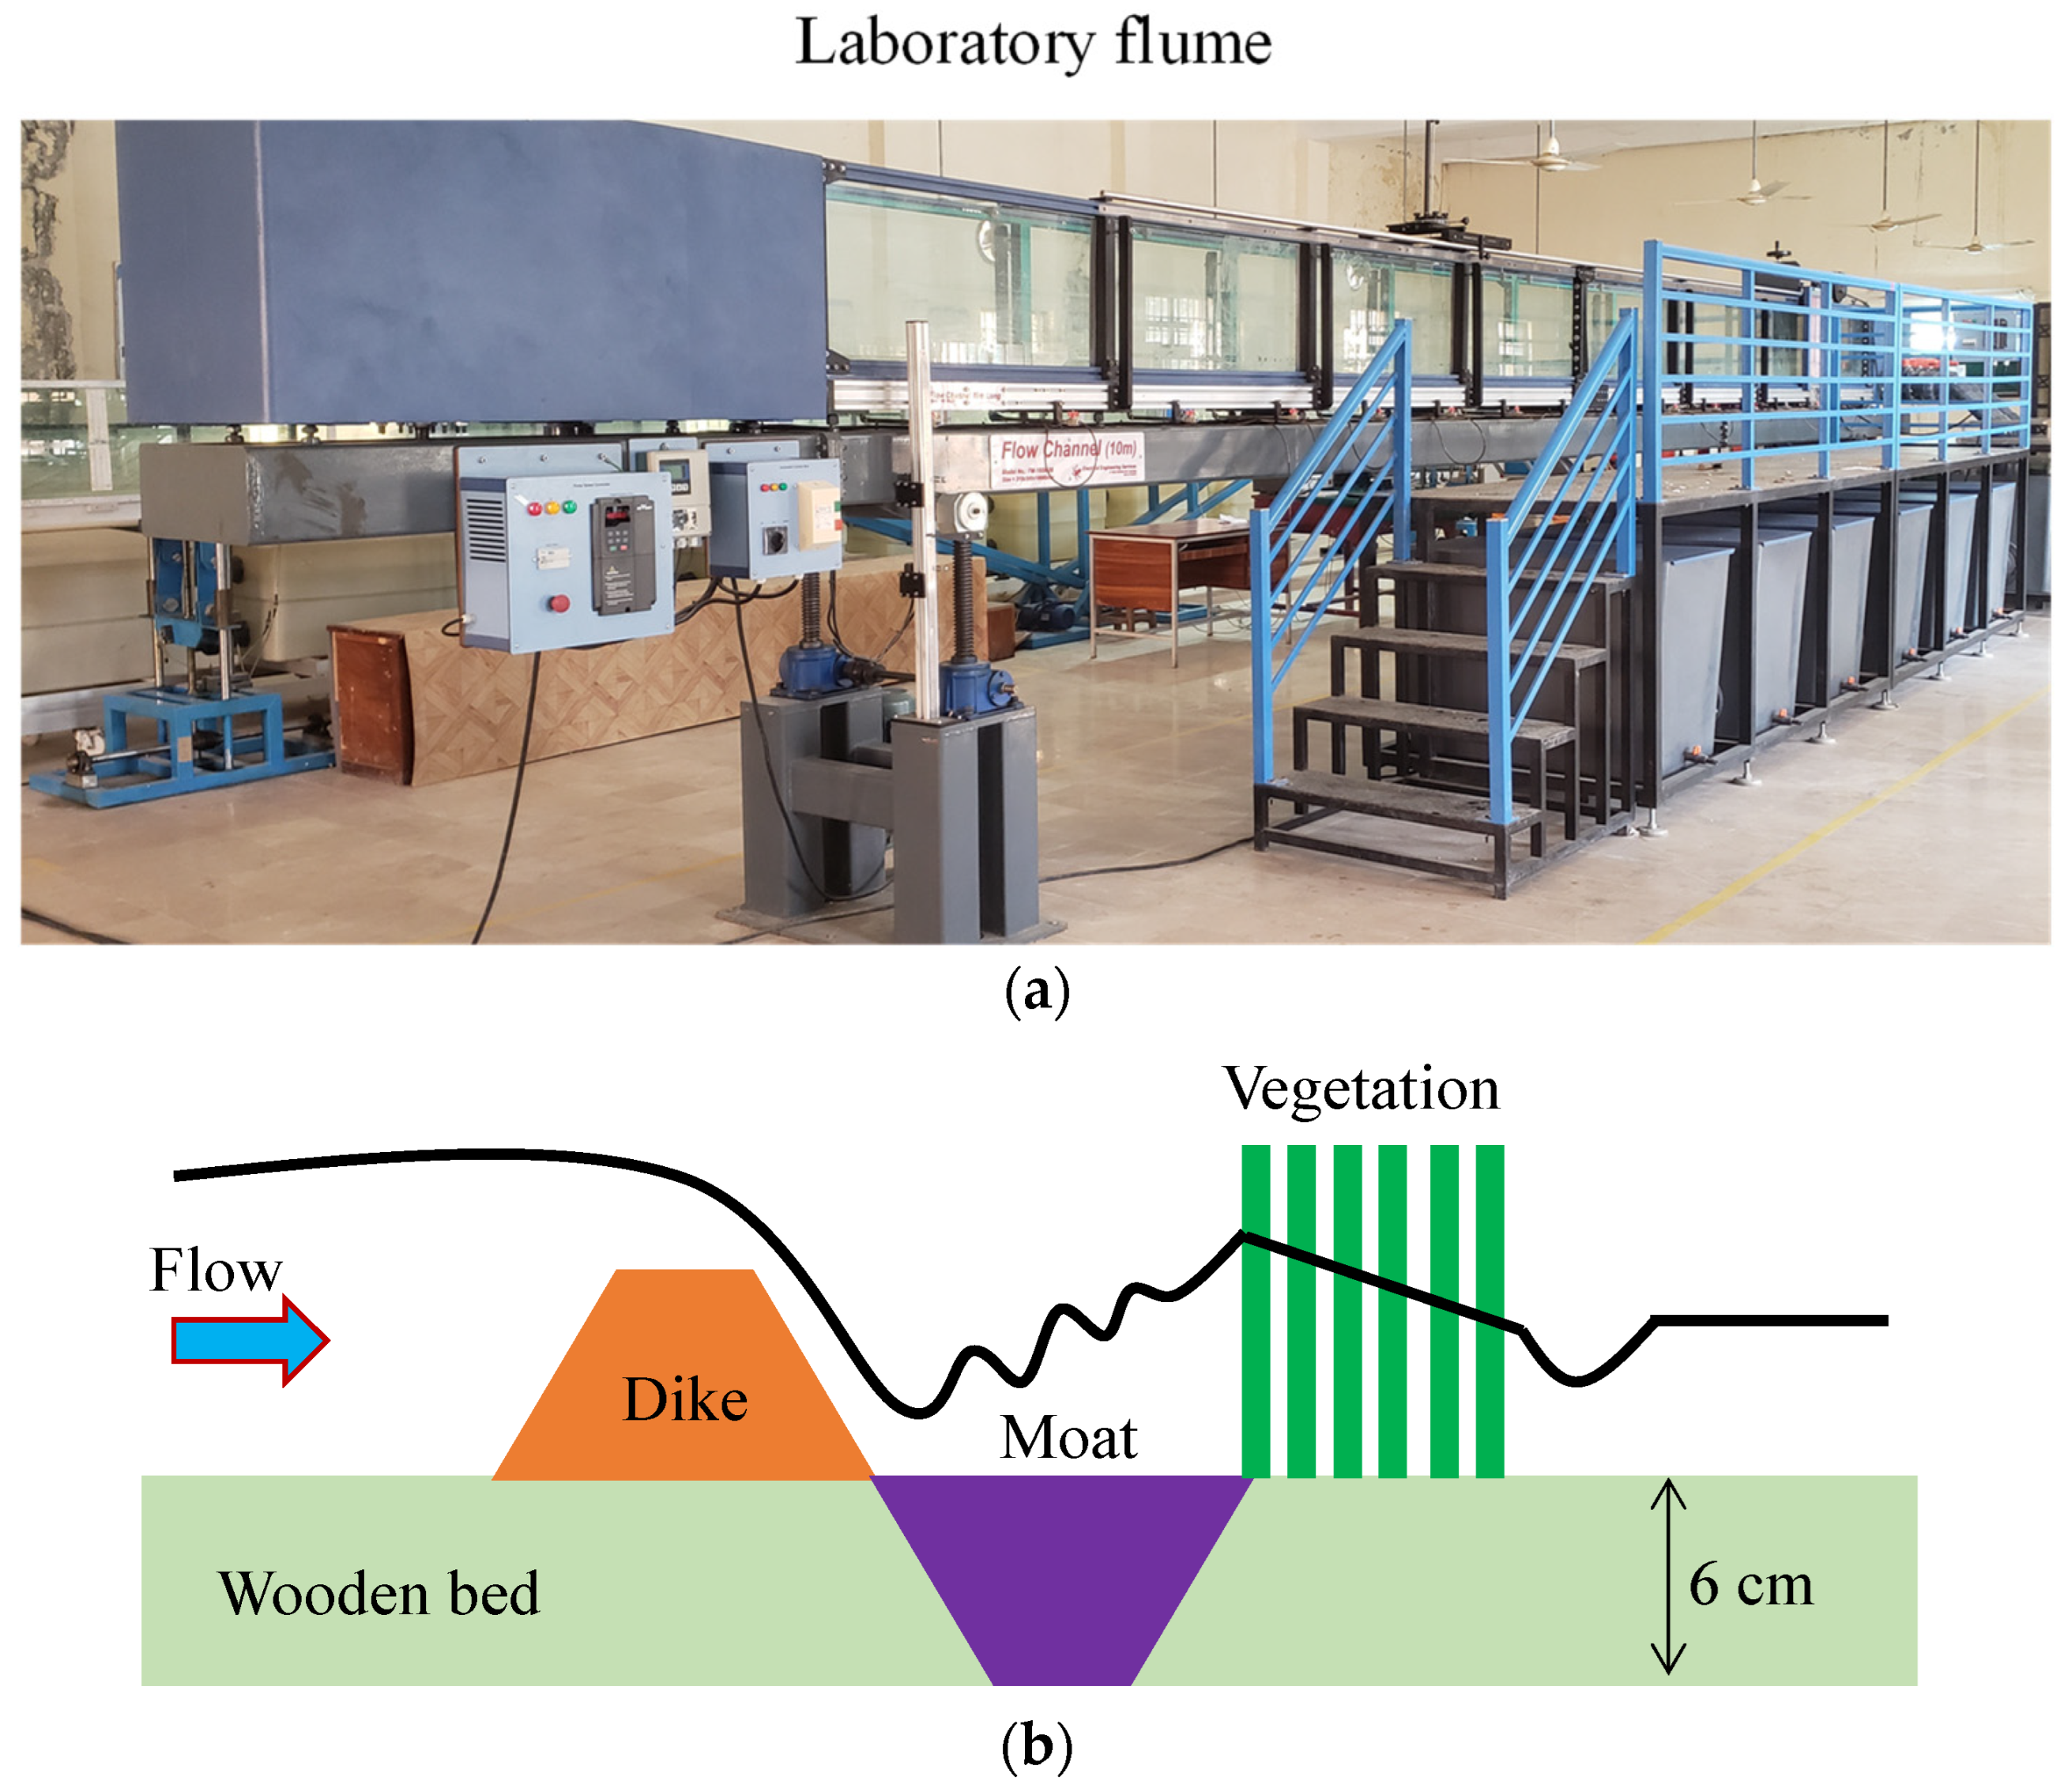
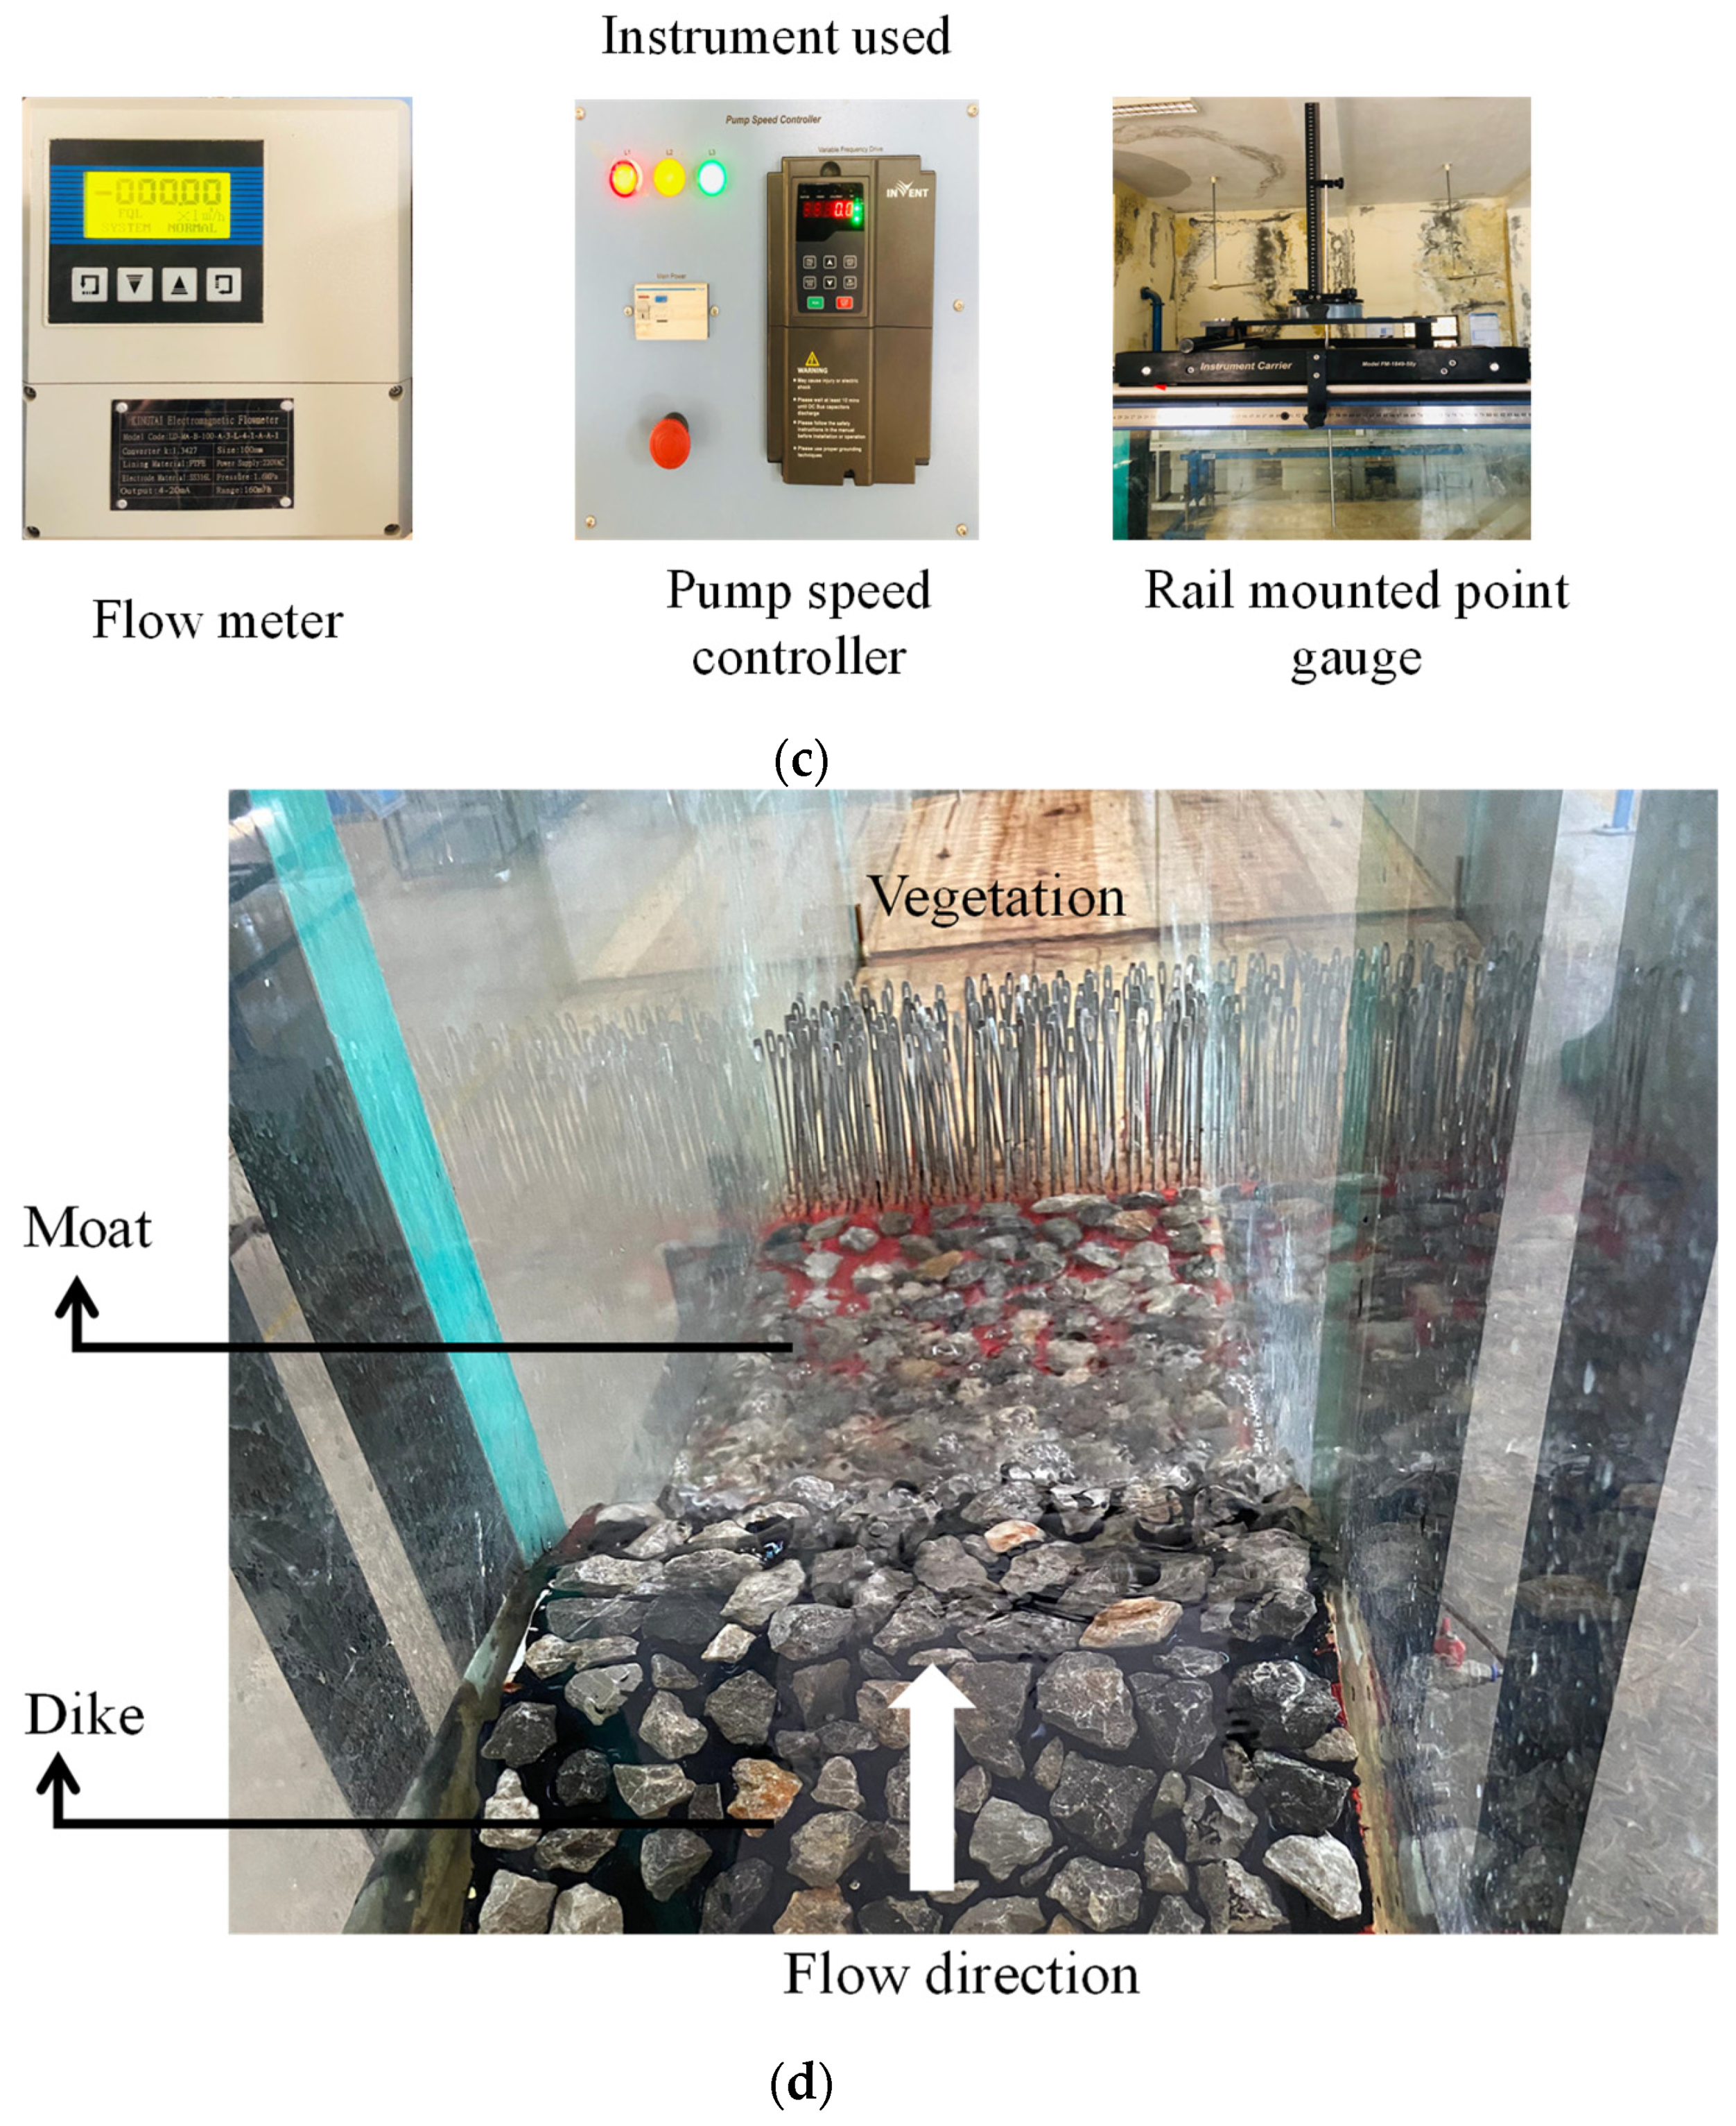
All experiments in the current research were conducted in an electronic open channel in the Water Resources Engineering Laboratory at the University of Engineering and Technology, Taxila. The channel has dimensions of 10 m in length, 0.31 m in width, and 0.5 m in height, as shown in Figure 1a–d. The flume depth is greater than its width, which differs from natural wide river channels but is consistent with controlled laboratory studies designed to minimize lateral flow effects and ensure uniform flow conditions. This configuration represents confined-flow conditions typically observed near embankments and engineered channels, where the vertical flow structure and energy-dissipation processes are dominant. The sides of the channel are made of transparent glass. This channel consists of different parts, including a speed-controller pump, a digital flow meter, and a rail-mounted point gauge. The inlet discharge supply to the channel was measured using the digital flow meter, and the speed of the pump controller controlled the discharge. The water level throughout the desired testing section was measured through a rail-mounted point gauge. The 10 m length of the channel was divided into three sections: that is, the inlet, the testing section (4 m away from the inlet), and the outlet. At the outlet section of the channel, a storage tank was installed to recirculate water to the channel towards the inlet section.
The channel works under a flow recirculation system mechanism, where water flows from the inlet section controlled by the pump, passing through the testing section towards the outlet, and again flows towards the inlet section through large pipes installed at the storage tank. The channel has a fixed steel bed; however, for the present research, a wooden bed of 6 cm thickness (Figure 1b) was installed to create a moat of equal size to the dike (see Section 2.5. Modeling of Dike and Moat). The inner body of the channel was properly cleaned of contaminants, including particles/pollutants, to avoid flow disturbance before conducting experimental trials. After cleaning, the channel was operated without placing any model to select flow conditions for experimentation (see Section 2.3. Flow Condition). Once the flow conditions were selected, a hybrid defense system comprising a dike and moat of varying roughness and vegetation was placed in the channel at a distance of 4 m from the inlet.
Each experimental condition was repeated three times to ensure repeatability and consistency of the measured parameters. The reported values of water depth, energy reduction, and backwater rise represent the average of these repeated measurements. The variation among repeated runs was found to be within ±3%, indicating good experimental reliability. Subsequently, various flow parameters, including backwater rise, energy reduction, delay in floodwater arrival, and hydraulic jump, were assessed.

2.2. Instrumentation and Uncertainty

In the present research, a rail-mounted point gauge and an electromagnetic velocity meter were employed to measure water depth and flow velocity, respectively (Figure 1c). The point gauge and electromagnetic velocity meter provided measurement accuracies of up to ±0.1 mm and ±0.5% m/s, respectively. Before each experimental run, both instruments were calibrated according to the manufacturer’s guidelines to ensure the reliability and accuracy of the recorded data.
For the calibration of the point gauge, the reading was initially set to zero once the flow reached steady-state conditions. Subsequently, water level measurements were obtained at 10 cm intervals along the upstream and downstream sections, as well as within the defense system (dike–moat–vegetation), covering a distance of 1 m from the defense system. This interval was selected to capture detailed variations in water surface profiles across the study section.
Similarly, the electromagnetic velocity meter was reset to zero before each set of measurements. The adopted calibration and measurement procedures were consistent with those reported in previous studies. In addition, measurements for each experimental trial were repeated at multiple locations to improve the precision and consistency of the experimental results.
According to a previous study within hydraulic studies, the permissible limit of the error is ±1.5% [30]. Considering the limitation mentioned in the previous study, the error margin in the current investigation was maintained below this optimal limit. For assessing flow parameters, the uncertainties in water depth (point-gauge) and flow velocity (electromagnetic velocity meter) were estimated using the standard error propagation method. This routine calibration of these instruments improves the reliability of the results and reduces the chance of error in calculating various flow parameters.
The uncertainty in measured parameters was estimated based on instrument precision and repeatability of observations. The propagated uncertainty in derived parameters, such as energy reduction and backwater rise, was evaluated using standard error propagation methods. The overall uncertainty in energy reduction was estimated to be within ±5%, while water depth measurements exhibited an uncertainty of ±2 mm. These uncertainty levels do not significantly affect the observed trends and conclusions of the study.

2.3. Flow Conditions

In present research, the flow conditions in the current research were replicated, considering the history of the flood event in Pakistan. Pakistan faced twenty-four major flood events, out of which the 2022 flood was the most catastrophic, resulting in excessive damage. Therefore, the replication of the flow conditions (Froude’s number: Fr) in a channel with a history of 59 years of flood events in Pakistan was studied from the Federal Flood Commission (FFC) report on their website (https://ffc.gov.pk) and repeated visits to their head office (located in Islamabad). This dataset of the flow conditions was also replicated in previous studies by employing a defense system for flood risk management [20,24]. The data series of the flood events collected from FFC shows that floods generated from the Indus River have a range of Fr between 0.17 and 0.89, and a similar trend was adopted in previous studies [31].
To replicate flow conditions in this range, the concept of Froude’s similarity was used. However, in this paper, to calculate the Fr value, water depth was measured through a point gauge, and flow velocity was measured using an electromagnetic velocity meter. The water depth was measured at different points to obtain a correct result, and a similar trend was followed for flow velocity. Therefore, in the present work, a water depth ranging from 4.5 to 9.6 cm (without a hybrid flood defense system) was measured under varying discharge conditions while keeping the channel bed slope constant (1/250). Based on the measured values of the water depth, the corresponding values obtained for Fr ranged between 0.36 and 0.60 (Table 1).
Although historical flood events in the Indus River Basin exhibit a wider range of Froude numbers (Fr = 0.17–0.89), the present study focuses on a sub-range (Fr = 0.36–0.60) to ensure stable subcritical flow conditions within the laboratory flume. Extremely low values (Fr < 0.3) result in minimal flow interaction with the defense system, while higher values (Fr > 0.6) approach transitional conditions, which are beyond the scope of the present study. Therefore, the selected range represents typical riverine flood conditions while maintaining experimental stability. This selection may limit direct extrapolation to extreme flow regimes; however, it provides reliable insights into the subcritical flood behavior commonly observed. Several experiments were performed at each value of the Fr under varying roughness conditions to investigate different flow characteristics. All symbols and units are defined as follows: h (initial water depth, m), Fr (Froude number), Q (discharge, m3/s), Ke (equivalent roughness height, mm), G/d (vegetation density), and d (diameter of vegetation cylinder, m).

2.4. Vegetation Conditions

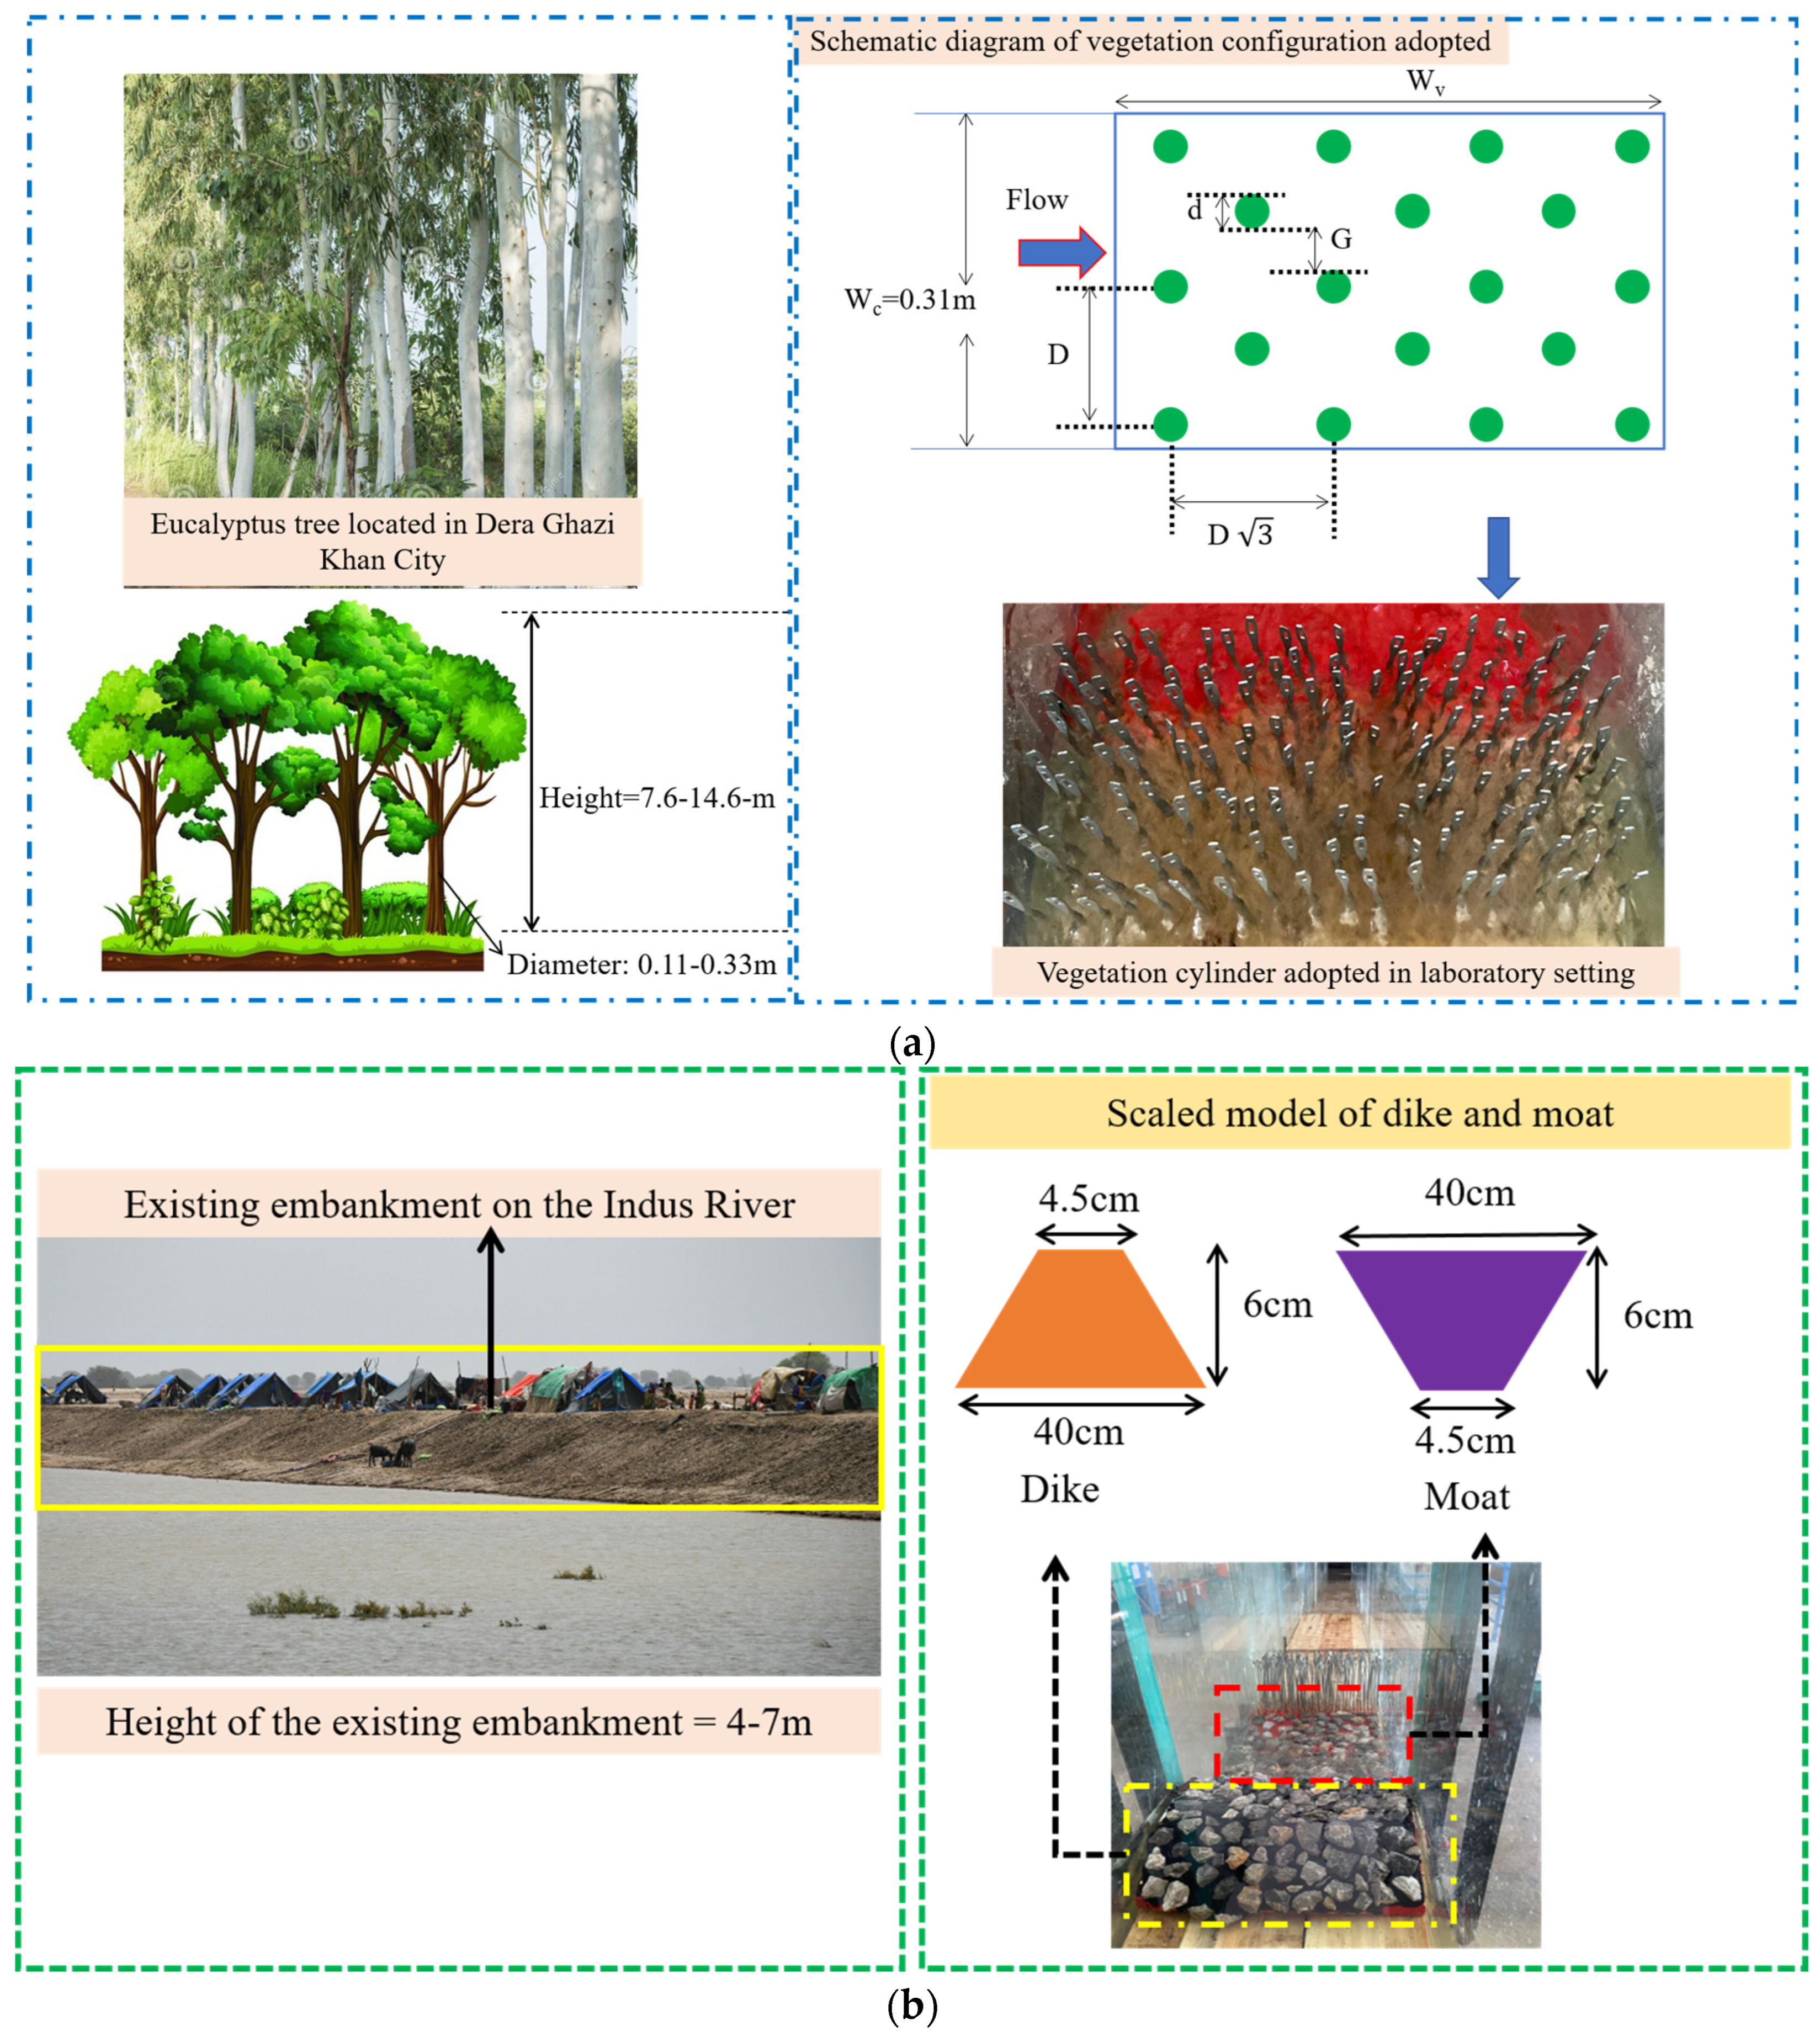
Previous studies reported the significant impact of vegetation on flow dynamics [14,32]. For this purpose, real-world vegetation located in the southern Punjab district, city of Dera Ghazi Khan (D. G. Khan), was replicated in the current study. The D. G. Khan City is located at the border of Sindh province, where excessive damage was observed in the 2022 flood in Pakistan. In the city of D. G. Khan, the Eucalyptus tree (Sufaida) is planted due to its ability to absorb water. Eucalyptus (Sufaida) vegetation was selected in this study due to its widespread presence in flood-prone regions of southern Punjab, Pakistan, particularly near the Indus River floodplain. These trees are characterized by relatively deep root systems, rigid stems, and comparatively high water uptake capacity, which contribute to bank stabilization and increased hydraulic resistance during flood events. In eco-engineered flood defense applications, such vegetation can reduce flow velocity, enhance turbulence generation, and promote energy dissipation, thereby decreasing the destructive impact of floodwater. In addition to hydraulic benefits, vegetation-based approaches may support ecological stability by reducing soil erosion, improving sediment retention, and enhancing floodplain resilience. Therefore, the selected vegetation type provides both hydraulic and ecological relevance for sustainable flood mitigation strategies. Previous research recommends the utilization of this type of tree in flood risk management [20,33]. This type of rigid vegetation has a height ranging between 7.6 and 14.6 m and a diameter ranging from 0.11 to 0.33 m, respectively, and a similar dimension was reported in past studies [33]. Thus, in the current research, a scale of 1/100 was utilized to replicate the vegetation conditions using the concept of geometric similarity (Figure 2a). Based on the geometric similarity concept, in this study, a vegetation cylinder of 0.003 m (diameter: d) was selected.
Takemura and Tanaka [34] conducted a study examining the classification of vegetation configurations (G/d, where G: spacing between adjacent cylinders and d: diameter of a cylinder) concerning vortex street formations. Their findings indicated that Large Karman Vortices (LKV) develop when G/d is less than 0.4, whereas Primary Karman Vortex streets (PKV) form when G/d exceeds 1.8, occurring downstream of individual vegetation elements. Building upon these findings, Pasha and Tanaka [33] further categorized vegetation configurations into three distinct types based on the thresholds established by Takemura and Tanaka [34]: dense (G/d < 0.4), intermediate (0.4 < G/d < 1.8), and sparse (G/d > 1.8). In the current study, sparse vegetation (Figure 2a) was utilized along with varying roughness conditions of the dike and moat. Sparse vegetation (G/d > 1.8) was selected based on previous studies indicating that this configuration promotes the formation of individual wake zones and vortex shedding, thereby enhancing energy dissipation without excessively obstructing the flow. Dense vegetation, while increasing resistance, may lead to excessive backwater rise and reduced conveyance capacity. Therefore, sparse vegetation provides an optimal balance between flow attenuation and hydraulic efficiency.
The sparse type of vegetation can be easily implemented in real-world scenarios due to its effective growth capability. The vegetation used in this study represents scaled cylindrical elements simulating Eucalyptus (Sufaida) trees, commonly found in flood-prone regions of southern Punjab, Pakistan. These trees are characterized by relatively rigid stems and sparse foliage, making them suitable for representing flow resistance elements in hydraulic studies. Previous research has demonstrated that such rigid vegetation significantly influences turbulence generation, velocity reduction, and energy dissipation. The selection of this vegetation type aligns with its practical applicability in eco-engineered flood management systems. Besides the density of vegetation, a previous study conducted by Pasha and Tanaka [14] utilized a wide range of vegetation thickness (dn = 180 to 580 cm No) for investigating flow characteristics in a vegetated open channel. Therefore, in the current study, the values of dn were 180 No. Cm. The value of dn was calculated using dn = 2 3 D W v × 10 2 , where D is the distance between two consecutive vegetation cylinders, and Wv is the width of the vegetation model.

2.5. Modeling of Dike and Moat

Dikes play a critical role in flood management by serving as a barrier that prevents overflow of water from natural rivers or the sea. During extreme weather scenarios, susceptible flooding can be prevented by the construction of a dike. Similarly, a moat acts as a retention aid against floodwater and can store water for a certain time. A moat enhances the delay time of floodwater arrival by storing the initial overflow through a dike. For replicating a dike and moat in the laboratory setting, a real-world dike located along the Indus River (the largest river in Pakistan, which often experiences flooding) was considered. A previous study conducted by Lakusic et al. [35] reported that the optimal height of the embankment located along the Indus River is 4–7 m, with 1.2–1.8 m additional height of freeboard, and a similar dimension was selected by other researchers [13,19,20].
Therefore, in this paper, a dike and moat were scaled down to 1/100 to replicate a physical model in a laboratory setting using the concept of geometric similarity. Considering the limitation of the channel geometry, the selected scale was chosen to replicate a dike and moat model. Thus, a dike and moat model of 6 cm in height, including freeboard, was selected for investigating various flow parameters. The dimension of the scaled-down dike and moat model is depicted in Figure 2b. During flood scenarios, flowing water takes a different direction depending on its intensity. However, Mahtabi and Arvanaghi [36] reported that the direction of flowing water in flood events depends upon the installation of the obstruction. Therefore, in this paper, the dike and moat models were installed in the perpendicular direction to the flow, and a similar approach was adopted in previous research [15,20,37].

2.6. Roughness Conditions

When a river overtops its embankments during flooding, the overland flow encounters varying surface roughness conditions as it moves inland. Roughness plays a critical role in influencing flow velocity, depth, and energy dissipation. The roughness of the dike and moat bodies plays a significant role in enhancing their stability and flood protection. The flow around the structures is greatly influenced by roughness [38,39]. Previous studies reported various types of roughness conditions adopted for analyzing hydraulic phenomena [40]. Chen et al. [38] and Niu et al. [41] observed various flow characteristics around the dike by introducing different roughness scenarios. Therefore, in this study, roughness conditions of the dike and moat were selected based on the consideration adopted by Gupta et al. [40] and Benabid et al. [42].
Moreover, the Indus River has boulder sizes ranging from 0.5 m to 4.3 m, depending upon the transition of the river (narrow gorge to wider valley) as reported by Cornwell and Hamidullah [43]. The Indus River has an average and largest boulder size of 1.2 m and 4.3 m, respectively. The equivalent roughness height (Ke) was determined based on a scaled representation of median boulder sizes observed in the Indus River. Using geometric similarity, prototype particle sizes were converted to model scale, representing hydraulic roughness elements that influence boundary resistance and turbulence generation. This approach aligns with established methods of representing bed roughness in physical hydraulic modeling. To adopt the roughness conditions of the dike and moat, the size of the boulder located in the Indus River was replicated at a scale of 1/100 using the concept of geometric similarity.
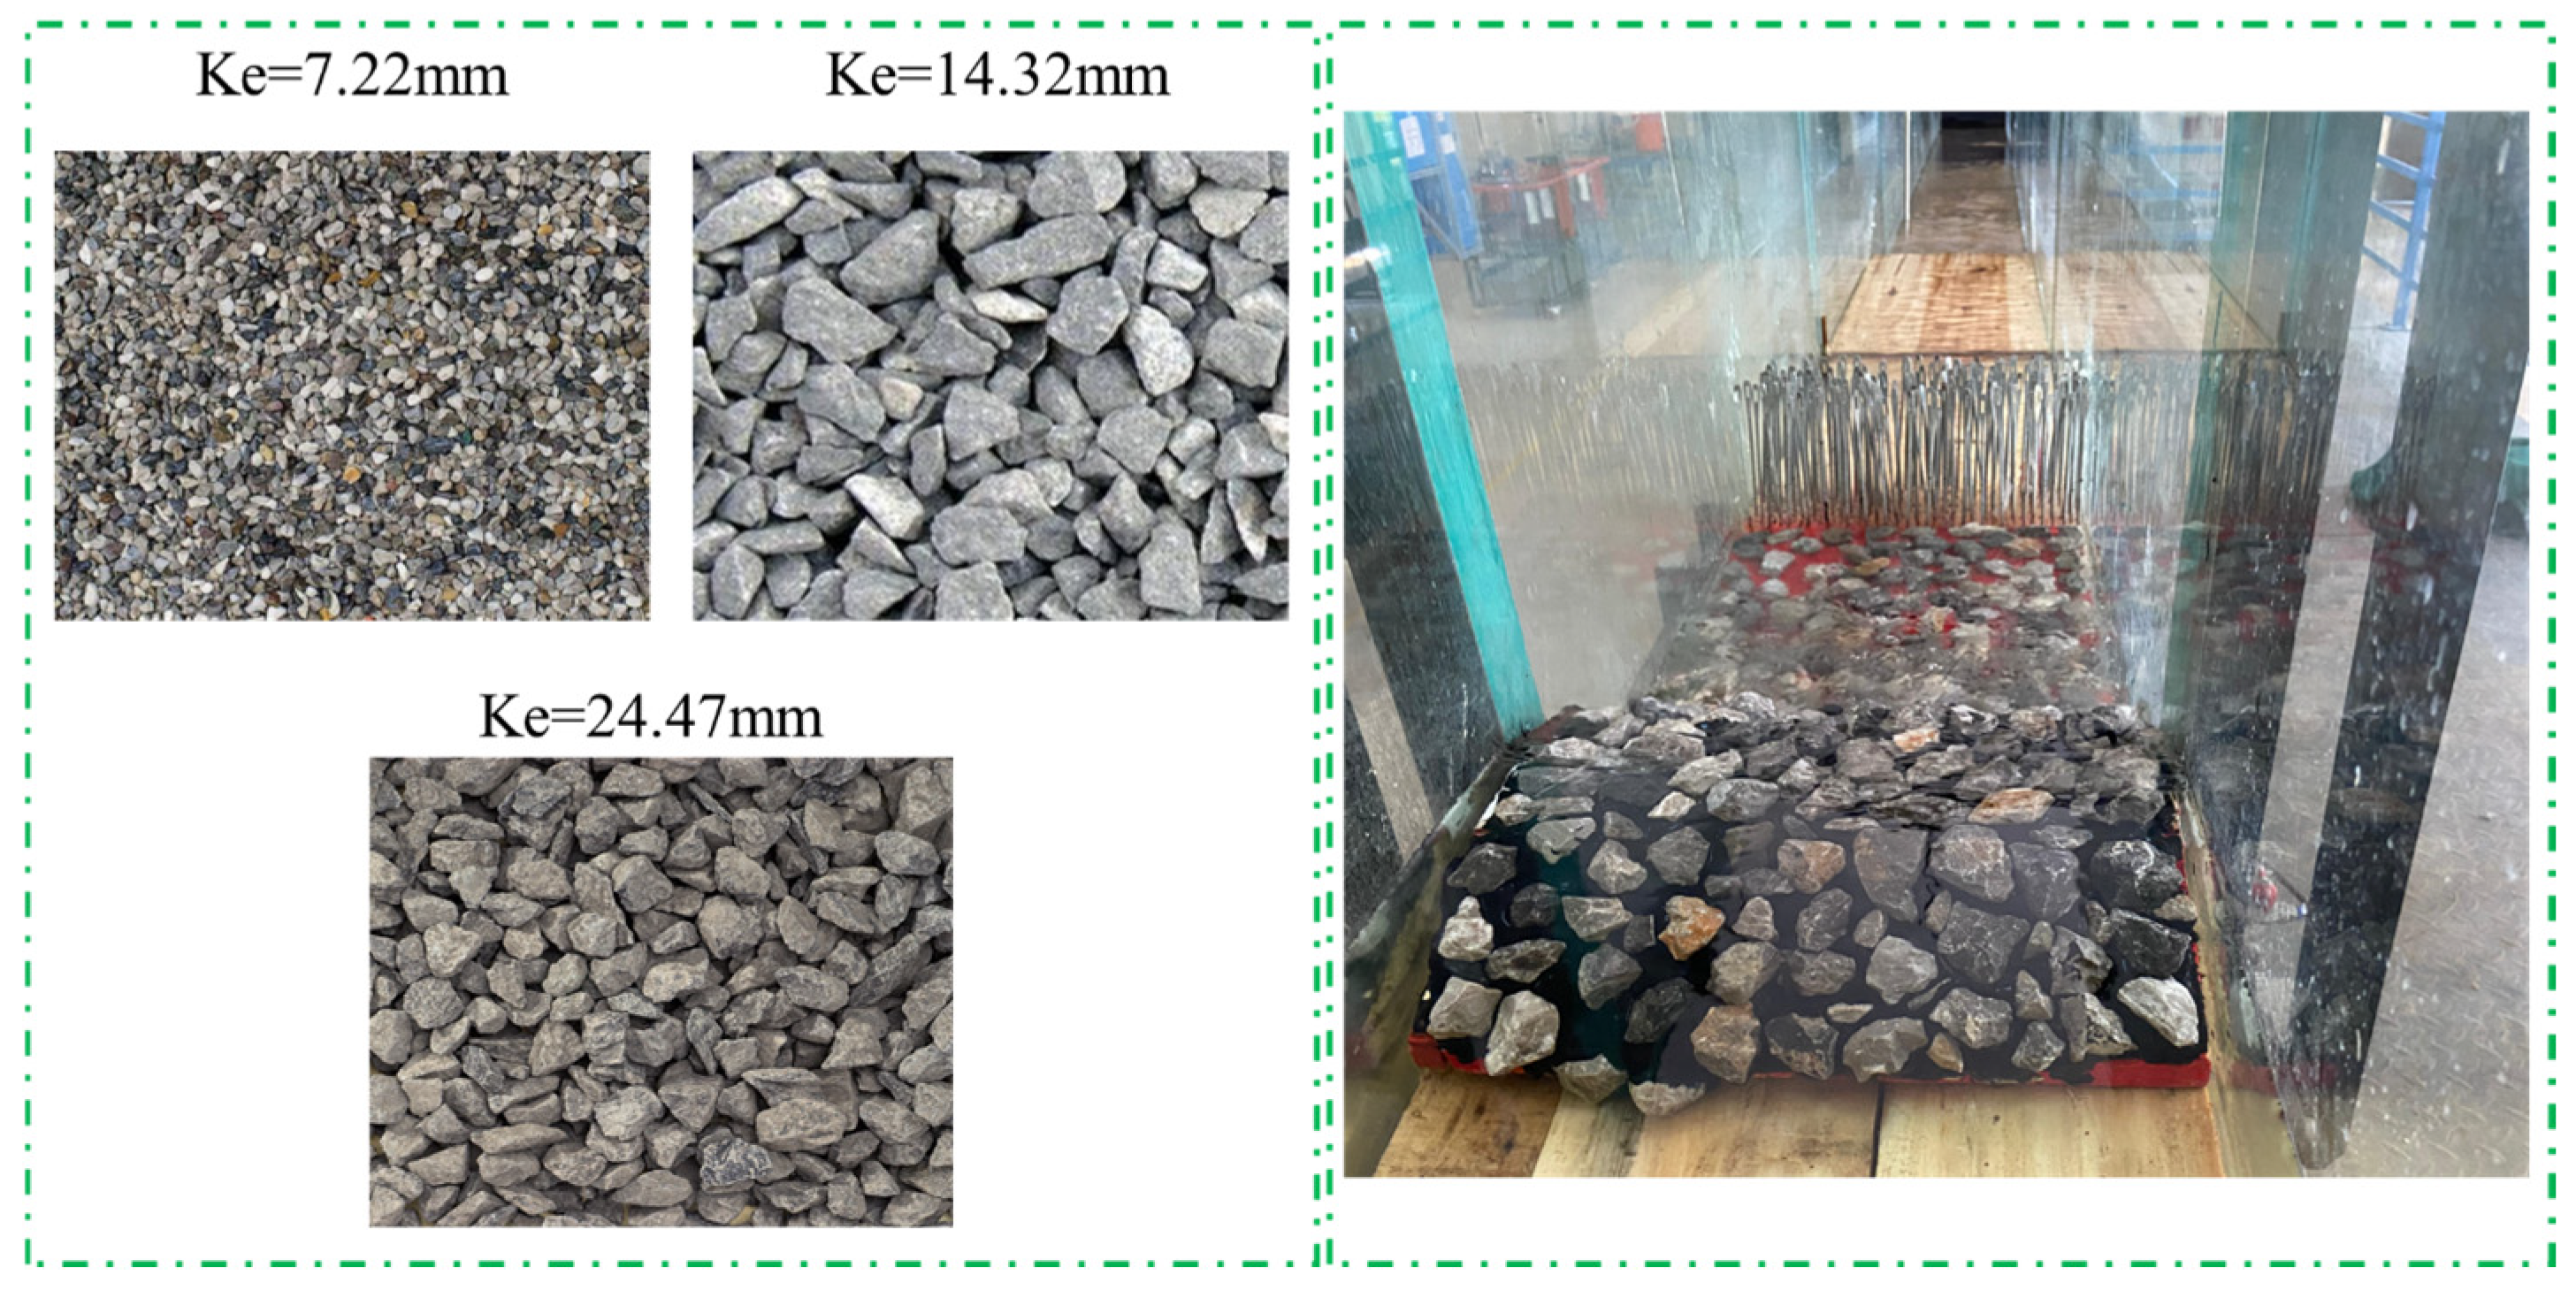
Therefore, in this study, roughness (Ke) values of 7.22 mm, 14.32 mm, and 24.47 mm were selected, as shown in Figure 3. To ensure the reliability of the result, roughness was induced properly over the body of the dike and moat through a layer of bitumen collected from the Taxila Institute of Transportation Engineering (TITE) laboratory. The roughness was induced at the same level on both the upstream and downstream sides of the dike and moat to promote realistic interaction of the flow with the defense system, avoid an incident jet generated behind the dike (at the center of the moat body), and minimize cavitation risk, as reported by Ead and Rajaratnam [44].

2.7. Measurement of Energy Reduction

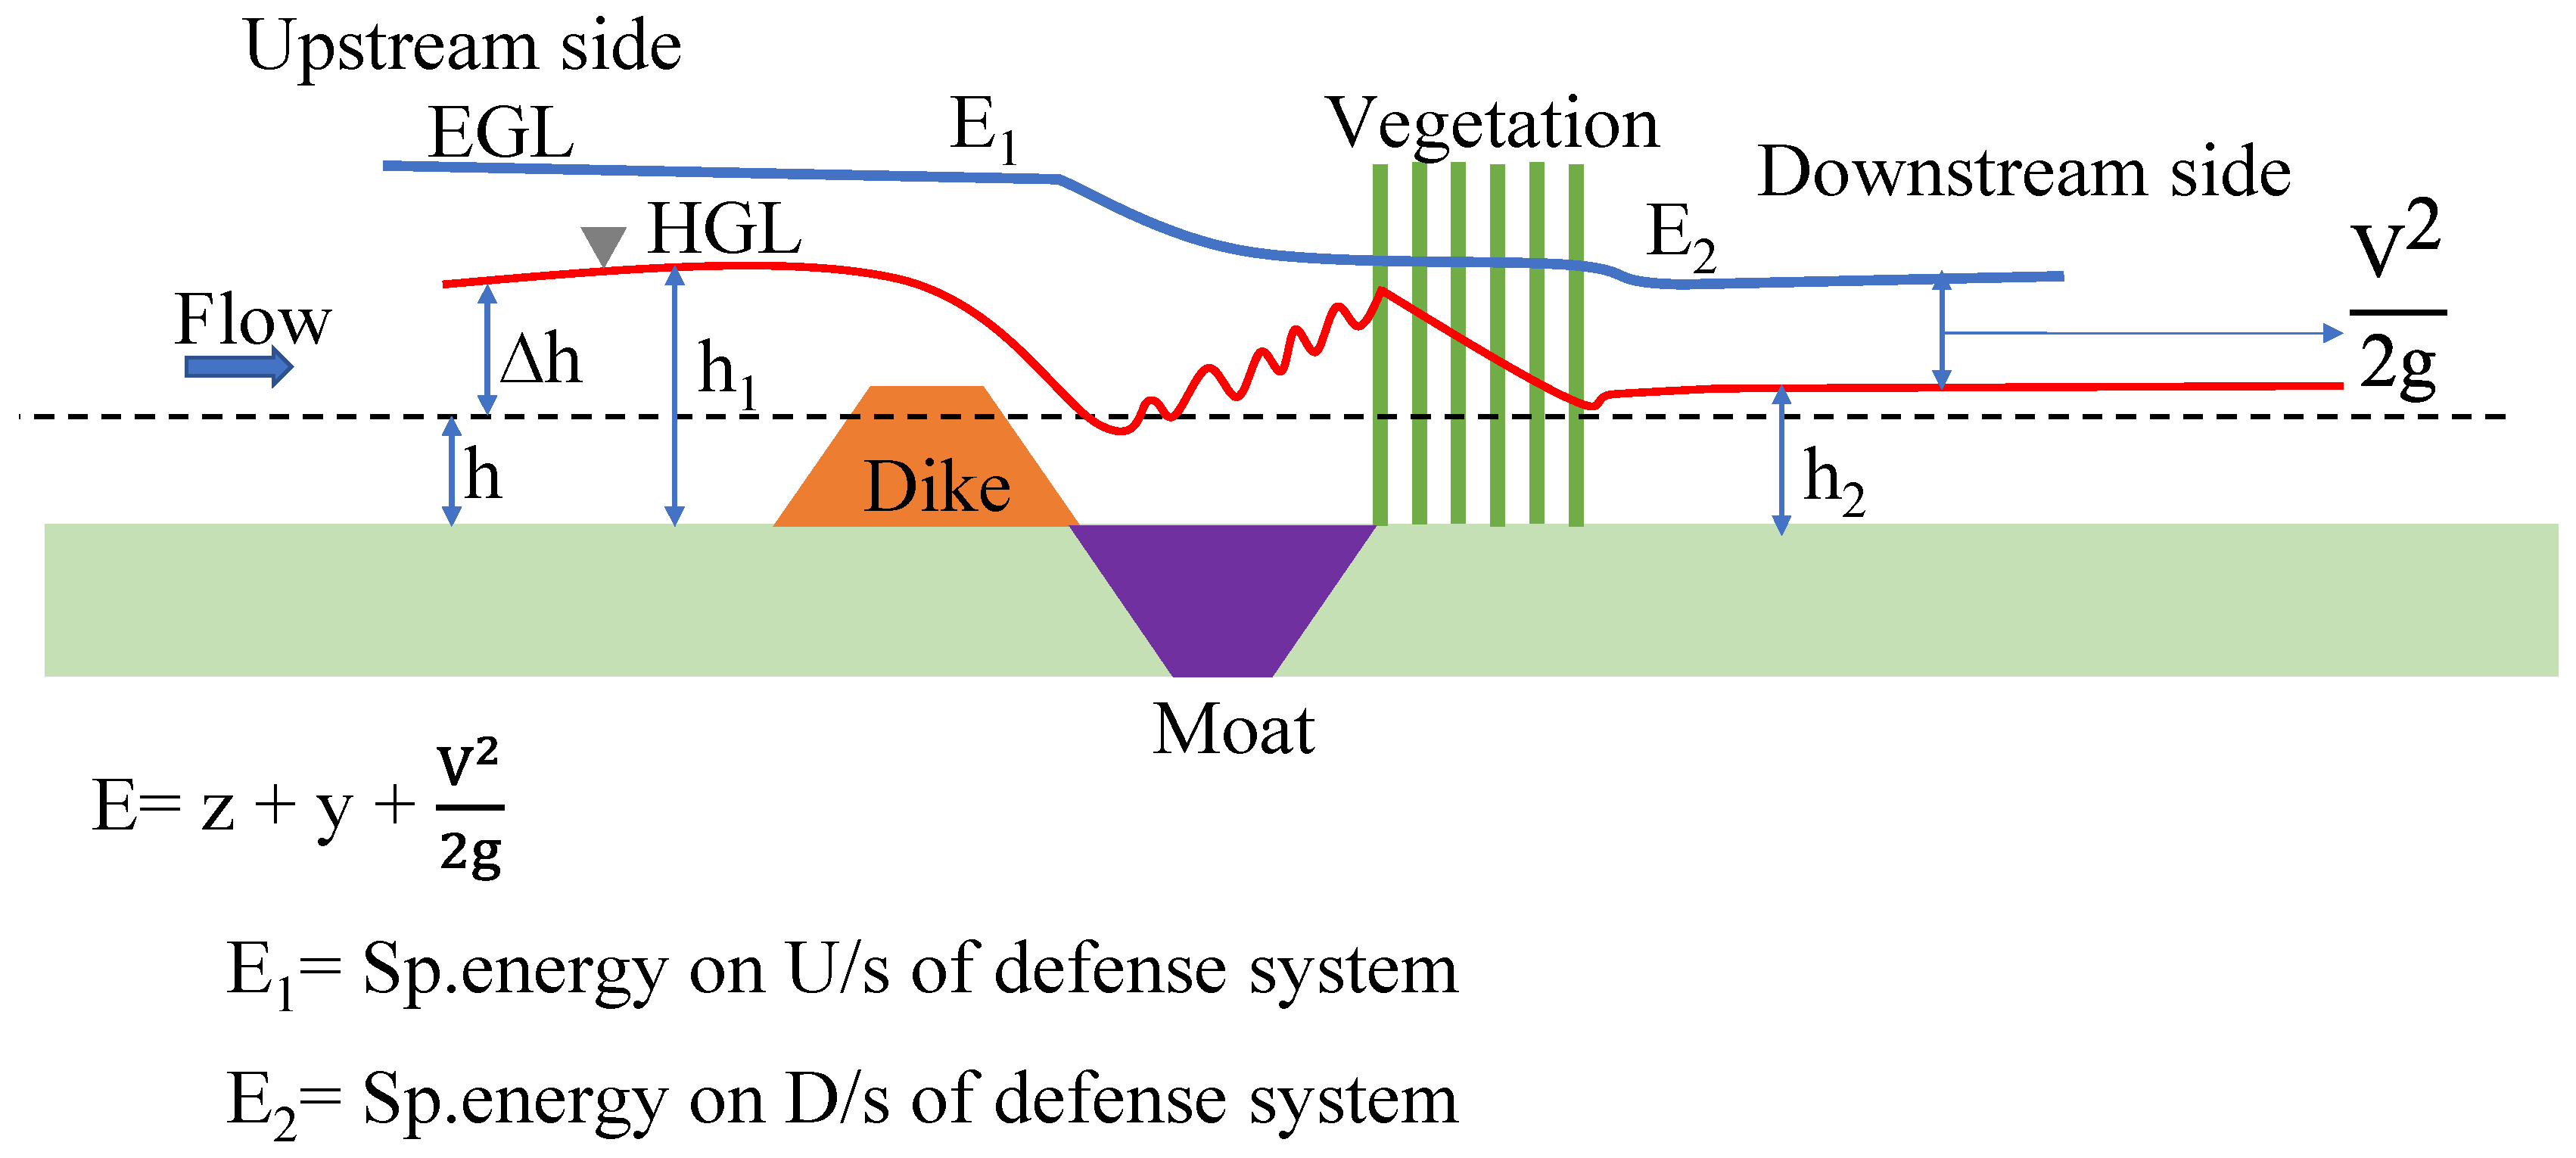
The reduction in floodwater energy (∆E) plays a critical role in understanding effective water management strategies and enhancing the structural resilience of flood mitigation systems, particularly under the increasing threat of extreme flood events driven by climate change. In this study, energy reduction was assessed by comparing the relative specific energy levels measured upstream and downstream of the defense system, which featured varying roughness conditions of the dike and moat. This assessment was carried out using Equation (1). Figure 4 illustrates how flow energy reduces as it moves through the defense system. The value of ∆E was obtained by subtracting the downstream specific energy from the upstream value, providing a quantitative measure of how a defense system contributes to energy dissipation within the flow.
E = z + h + α V 2 2 g
Here, E represents the total specific energy, z is the elevation of the channel bed, h is the flow depth, V denotes the flow velocity, g is the gravitational acceleration, and the velocity coefficient (α) is assumed to be unity, following the approach used in previous studies [45]. Using these parameters, energy reduction was calculated through the application of Equation (2), which is based on the concept of relative specific energy.
E = E 1 E 2 E 1   ×   100
In Equation (2), ∆E = energy reduction, E1 = specific energy on the defense system upstream side, and E2 = specific energy on the defense system downstream side.
In this study, energy reduction due to the hydraulic jump was assessed to understand the variation in the flow structure downstream of the dike (the body of the moat). The energy reduction by the hydraulic jump was calculated using E j = E 1 E 3 E 1 and a similar equation was used in previous studies [45], where ∆Ej, E1, and E3 are the energy reduction by the hydraulic jump, specific energy at the toe end of the jump, and average specific energy after the formation of the hydraulic jump.

2.8. Development of Regression Model

The framework of deriving equations based on input and output parameters is essential for understanding the relationship between variables and predicting outcomes. In this study, a regression model was developed using MATLAB (version: R2026a) The purpose of developing the regression model was to understand the relationship between input and output parameters. Based on input parameters such as the Froude number (Fr), backwater rise (∆h/ho), and roughness (Ke), and the output parameter (energy reduction), a regression model was developed. To evaluate the robustness of the regression model, the dataset was split into training (70%) and validation (30%) subsets. The model was developed using the training dataset, while its predictive performance was assessed on the validation dataset. The results indicated consistent agreement between predicted and observed values across both datasets, suggesting strong generalization.
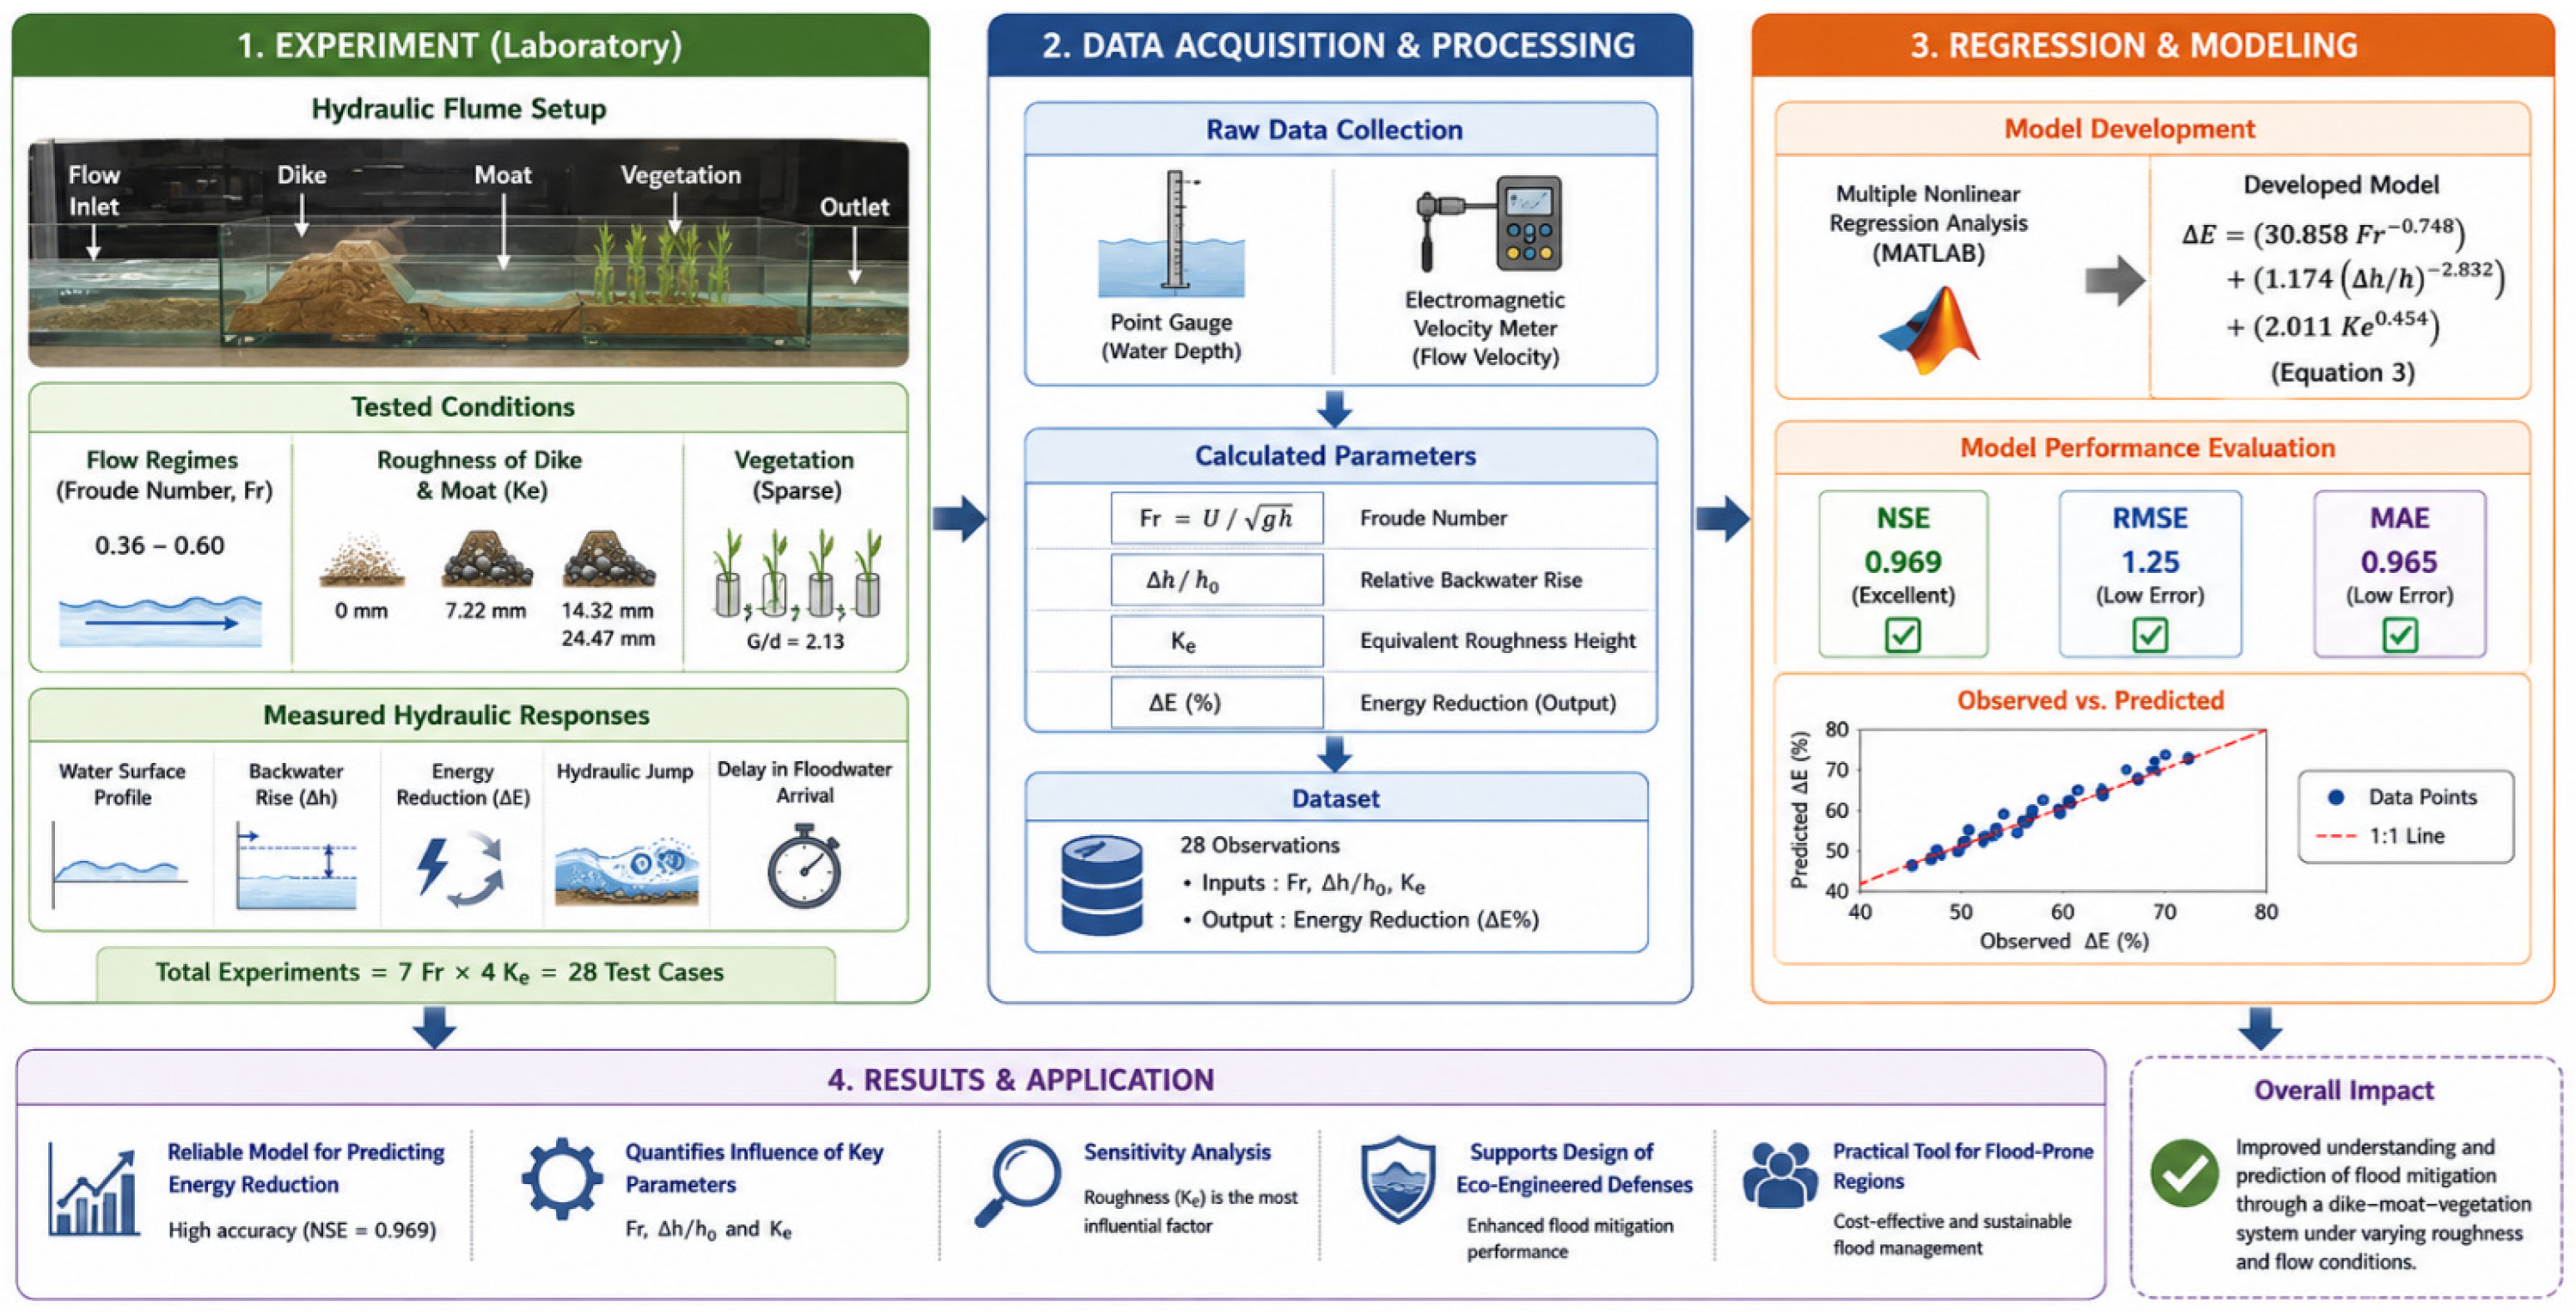
Given the relatively small dataset, the potential for overfitting was considered. However, the consistency of performance metrics (NSE, RMSE, MAE) across training and validation datasets indicates that overfitting is minimal. Nonetheless, future studies with larger datasets are recommended to further validate the model. Figure 5 depicts the workflow diagram, from the experimental setup to the development of the regression model. The performance of the developed equation was assessed by considering Nash–Sutcliffe Efficiency (NSE), root mean square error (RMSE), and mean absolute error (MAE).

3. Results

3.1. Water Surface Profile

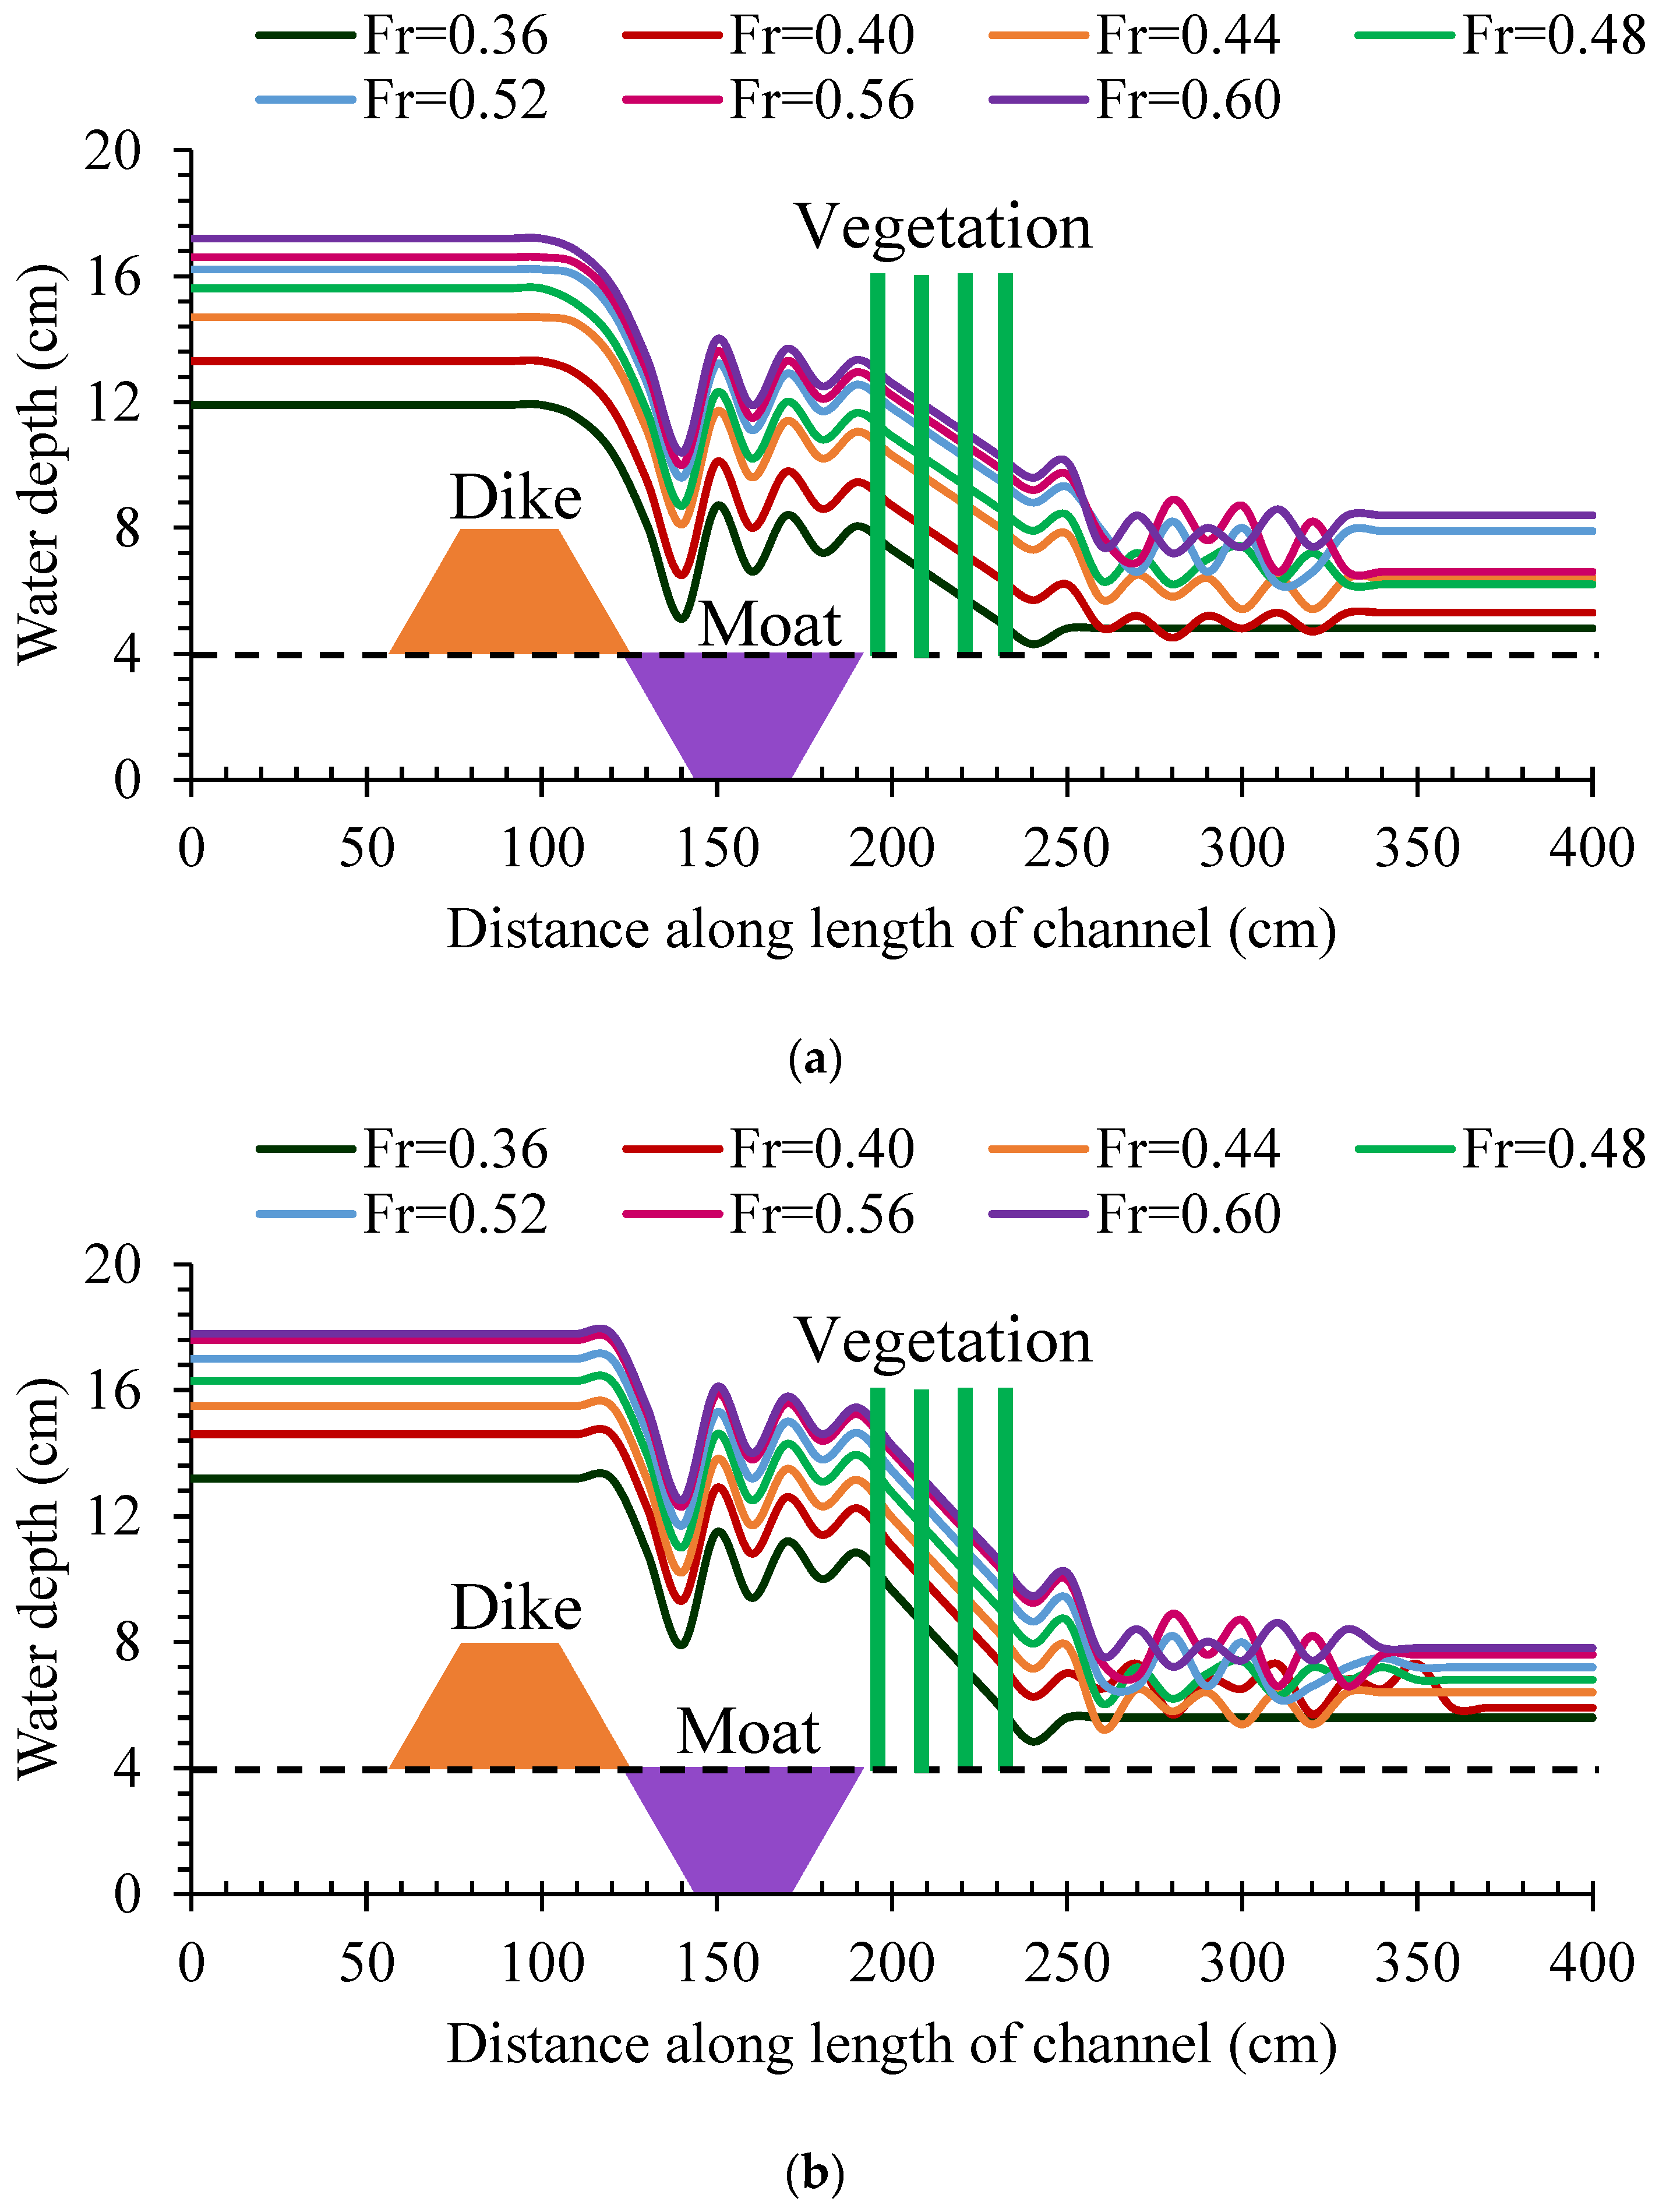
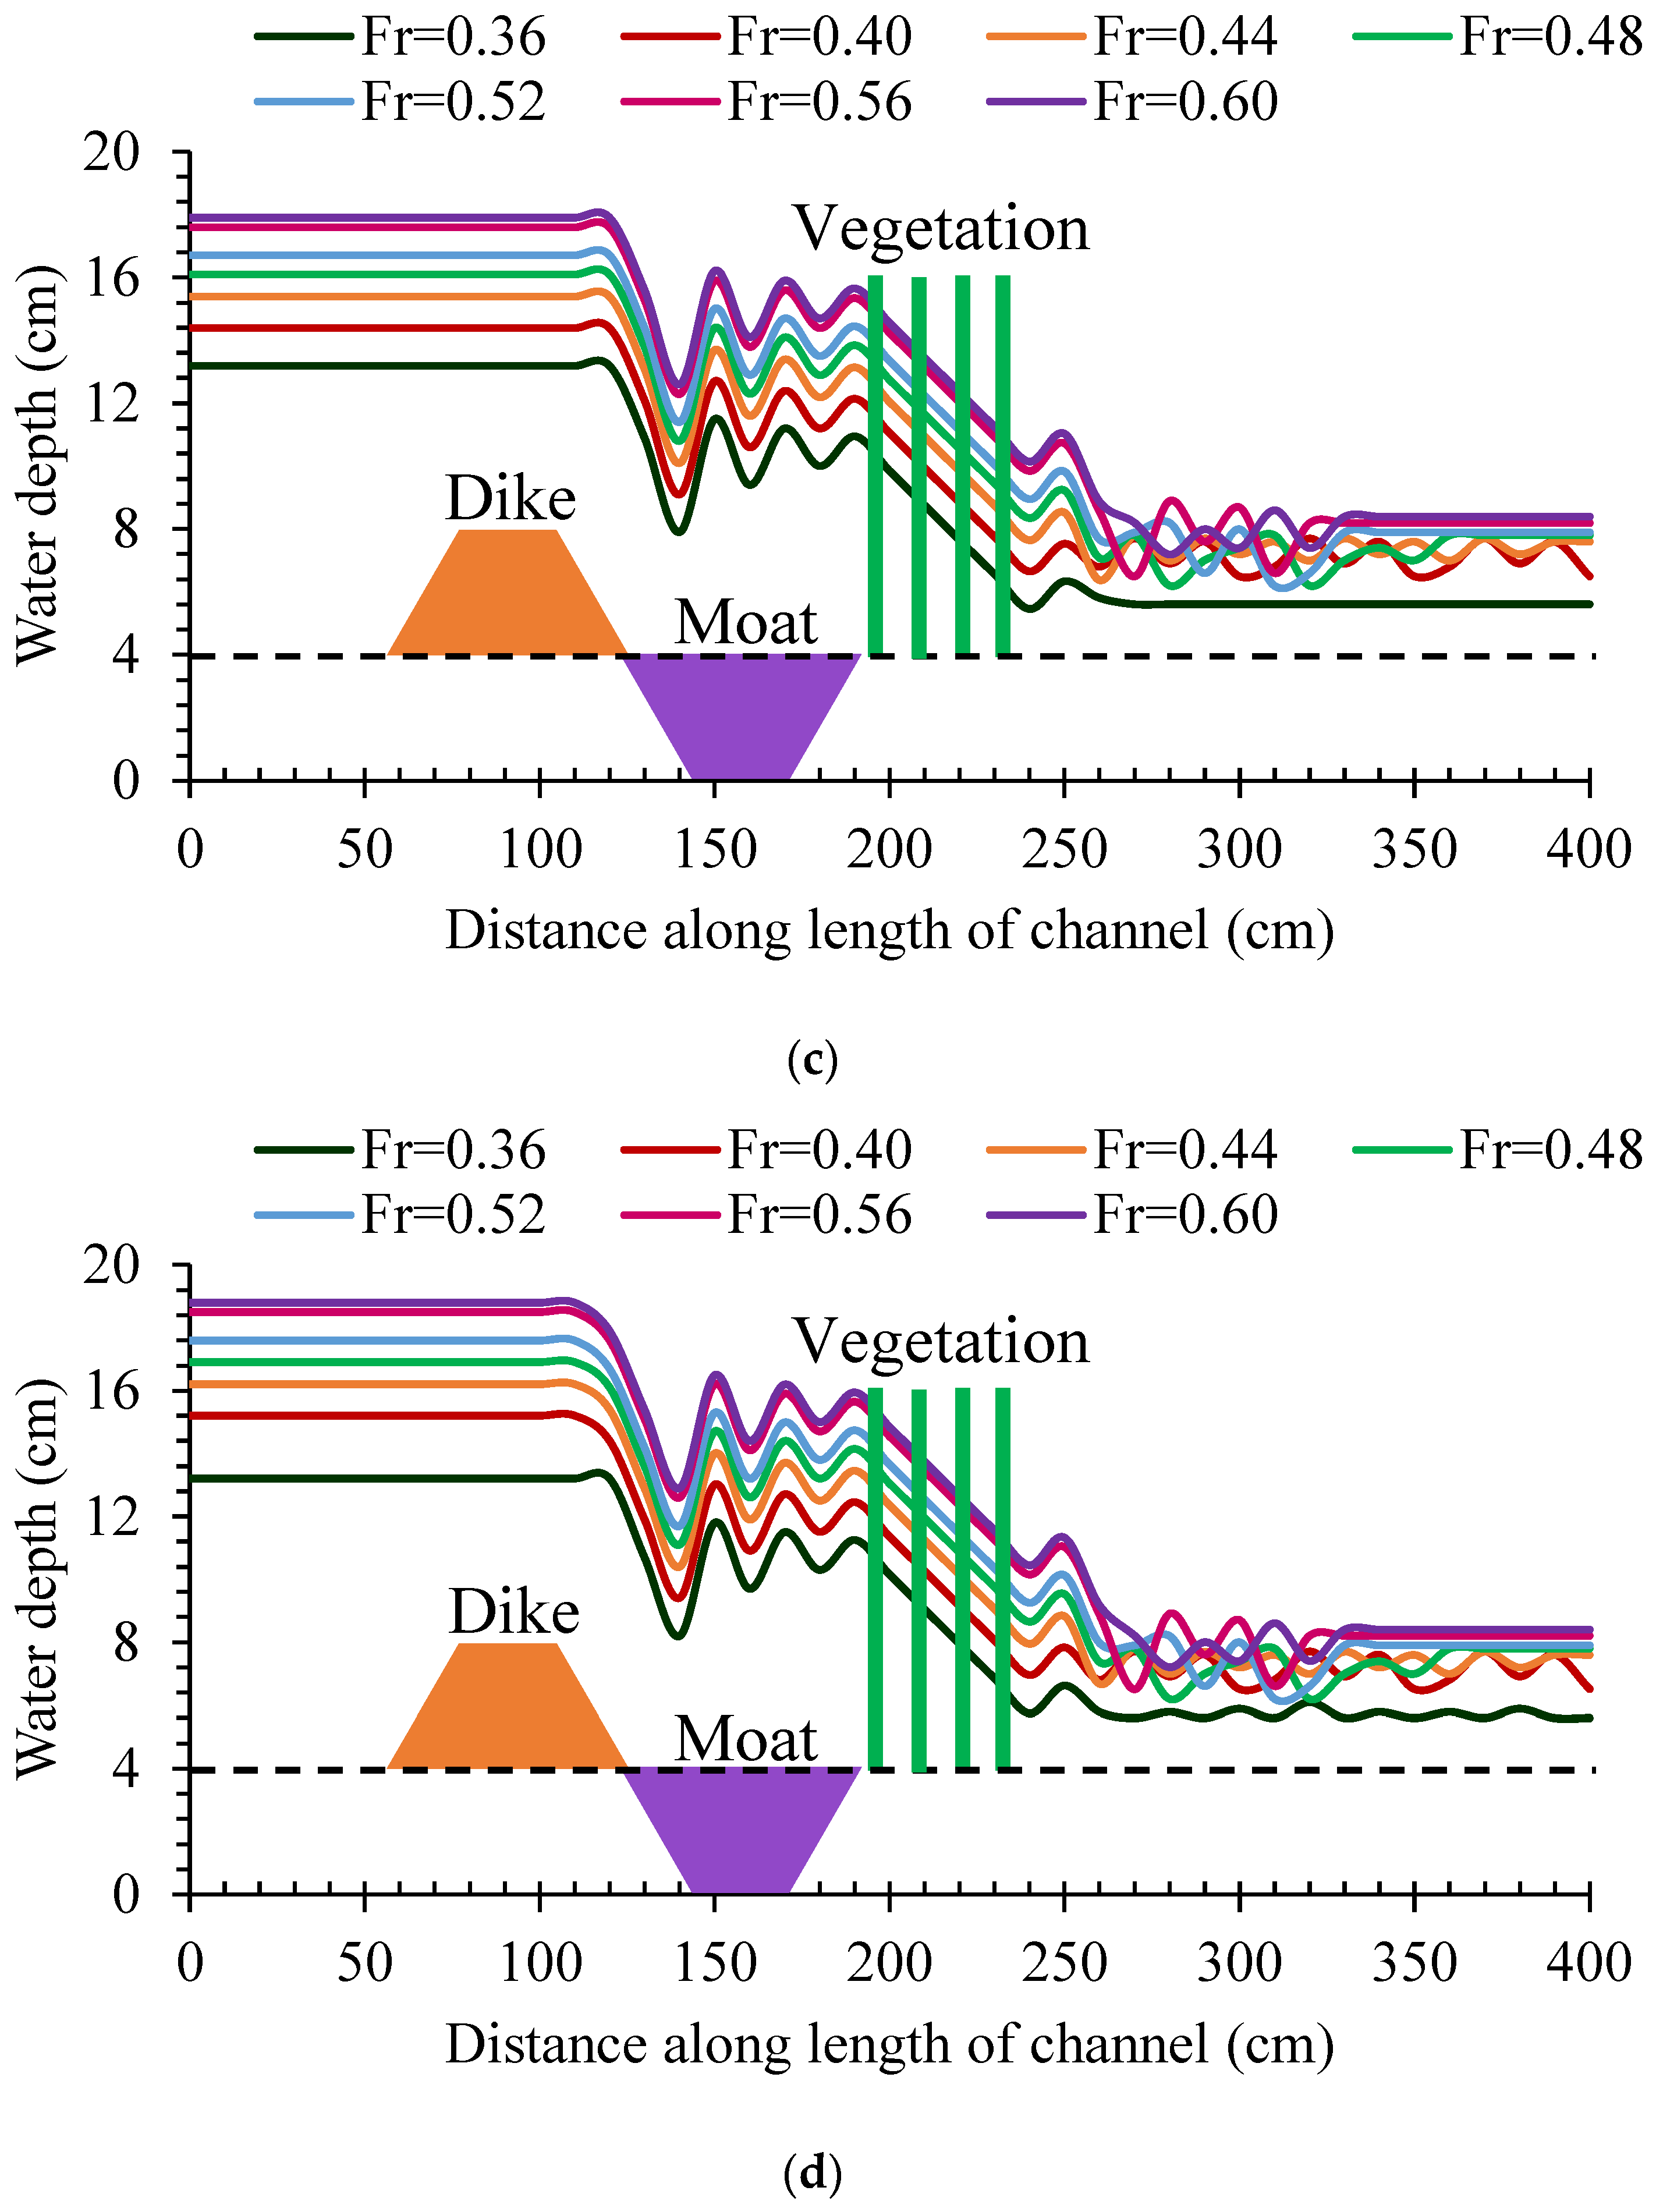
In the present research, a defense system was placed at a distance of 4 m from the inlet of the channel. However, the water surface profile was measured at a distance of 1.5 m (upstream and downstream sides) of the defense system, which is 2.5 m from the inlet of the channel. For plotting the water surface profile, the origin (starting point) of the profile was set to 1.5 m from the defense system. That is why, in Figure 6a–d, the plot started from zero reading, which was considered to be the origin point of the measurement.
The water surface profile computed in this study is presented in Figure 6a–d. It was observed that there was an increase in upstream water depth (backwater rise) by 13% with changing roughness conditions from Ke = 0 to Ke = 24.47 mm. The reported 13% increase in water surface profile represents the maximum observed value across tested Froude numbers and roughness conditions. The 13% increase in the water surface profile with higher roughness (Ke = 24.47 mm) is attributed to increased flow resistance due to enhanced turbulence and energy dissipation along the dike and moat surfaces. The added roughness elements slow the flow, reduce conveyance capacity, cause upstream backwater effects, and raise the water surface elevation within the defense system. The observed variation in flow characteristics indicates that increasing roughness enhances flow resistance and promotes turbulence, which contributes to higher energy dissipation within the system.
The profile was measured at the desired section at an interval of 10 cm. This interval was selected based on the variation observed in the water surface profile during each experimental trial. It was observed that the water surface profile changed at a distance of 10 cm because of larger undulations reported in the experimental phase. However, no variation was observed in the water level upstream of the defense system due to the presence of the dike. A measurement interval of 10 cm was selected to capture spatial variations in the water surface profile while maintaining practical measurement accuracy. Preliminary observations indicated that significant variations in flow depth occurred at this scale.
Smaller spacing could provide higher resolution data, particularly in regions of hydraulic jump formation; however, it would increase measurement uncertainty and experimental complexity.

3.2. Backwater Rise

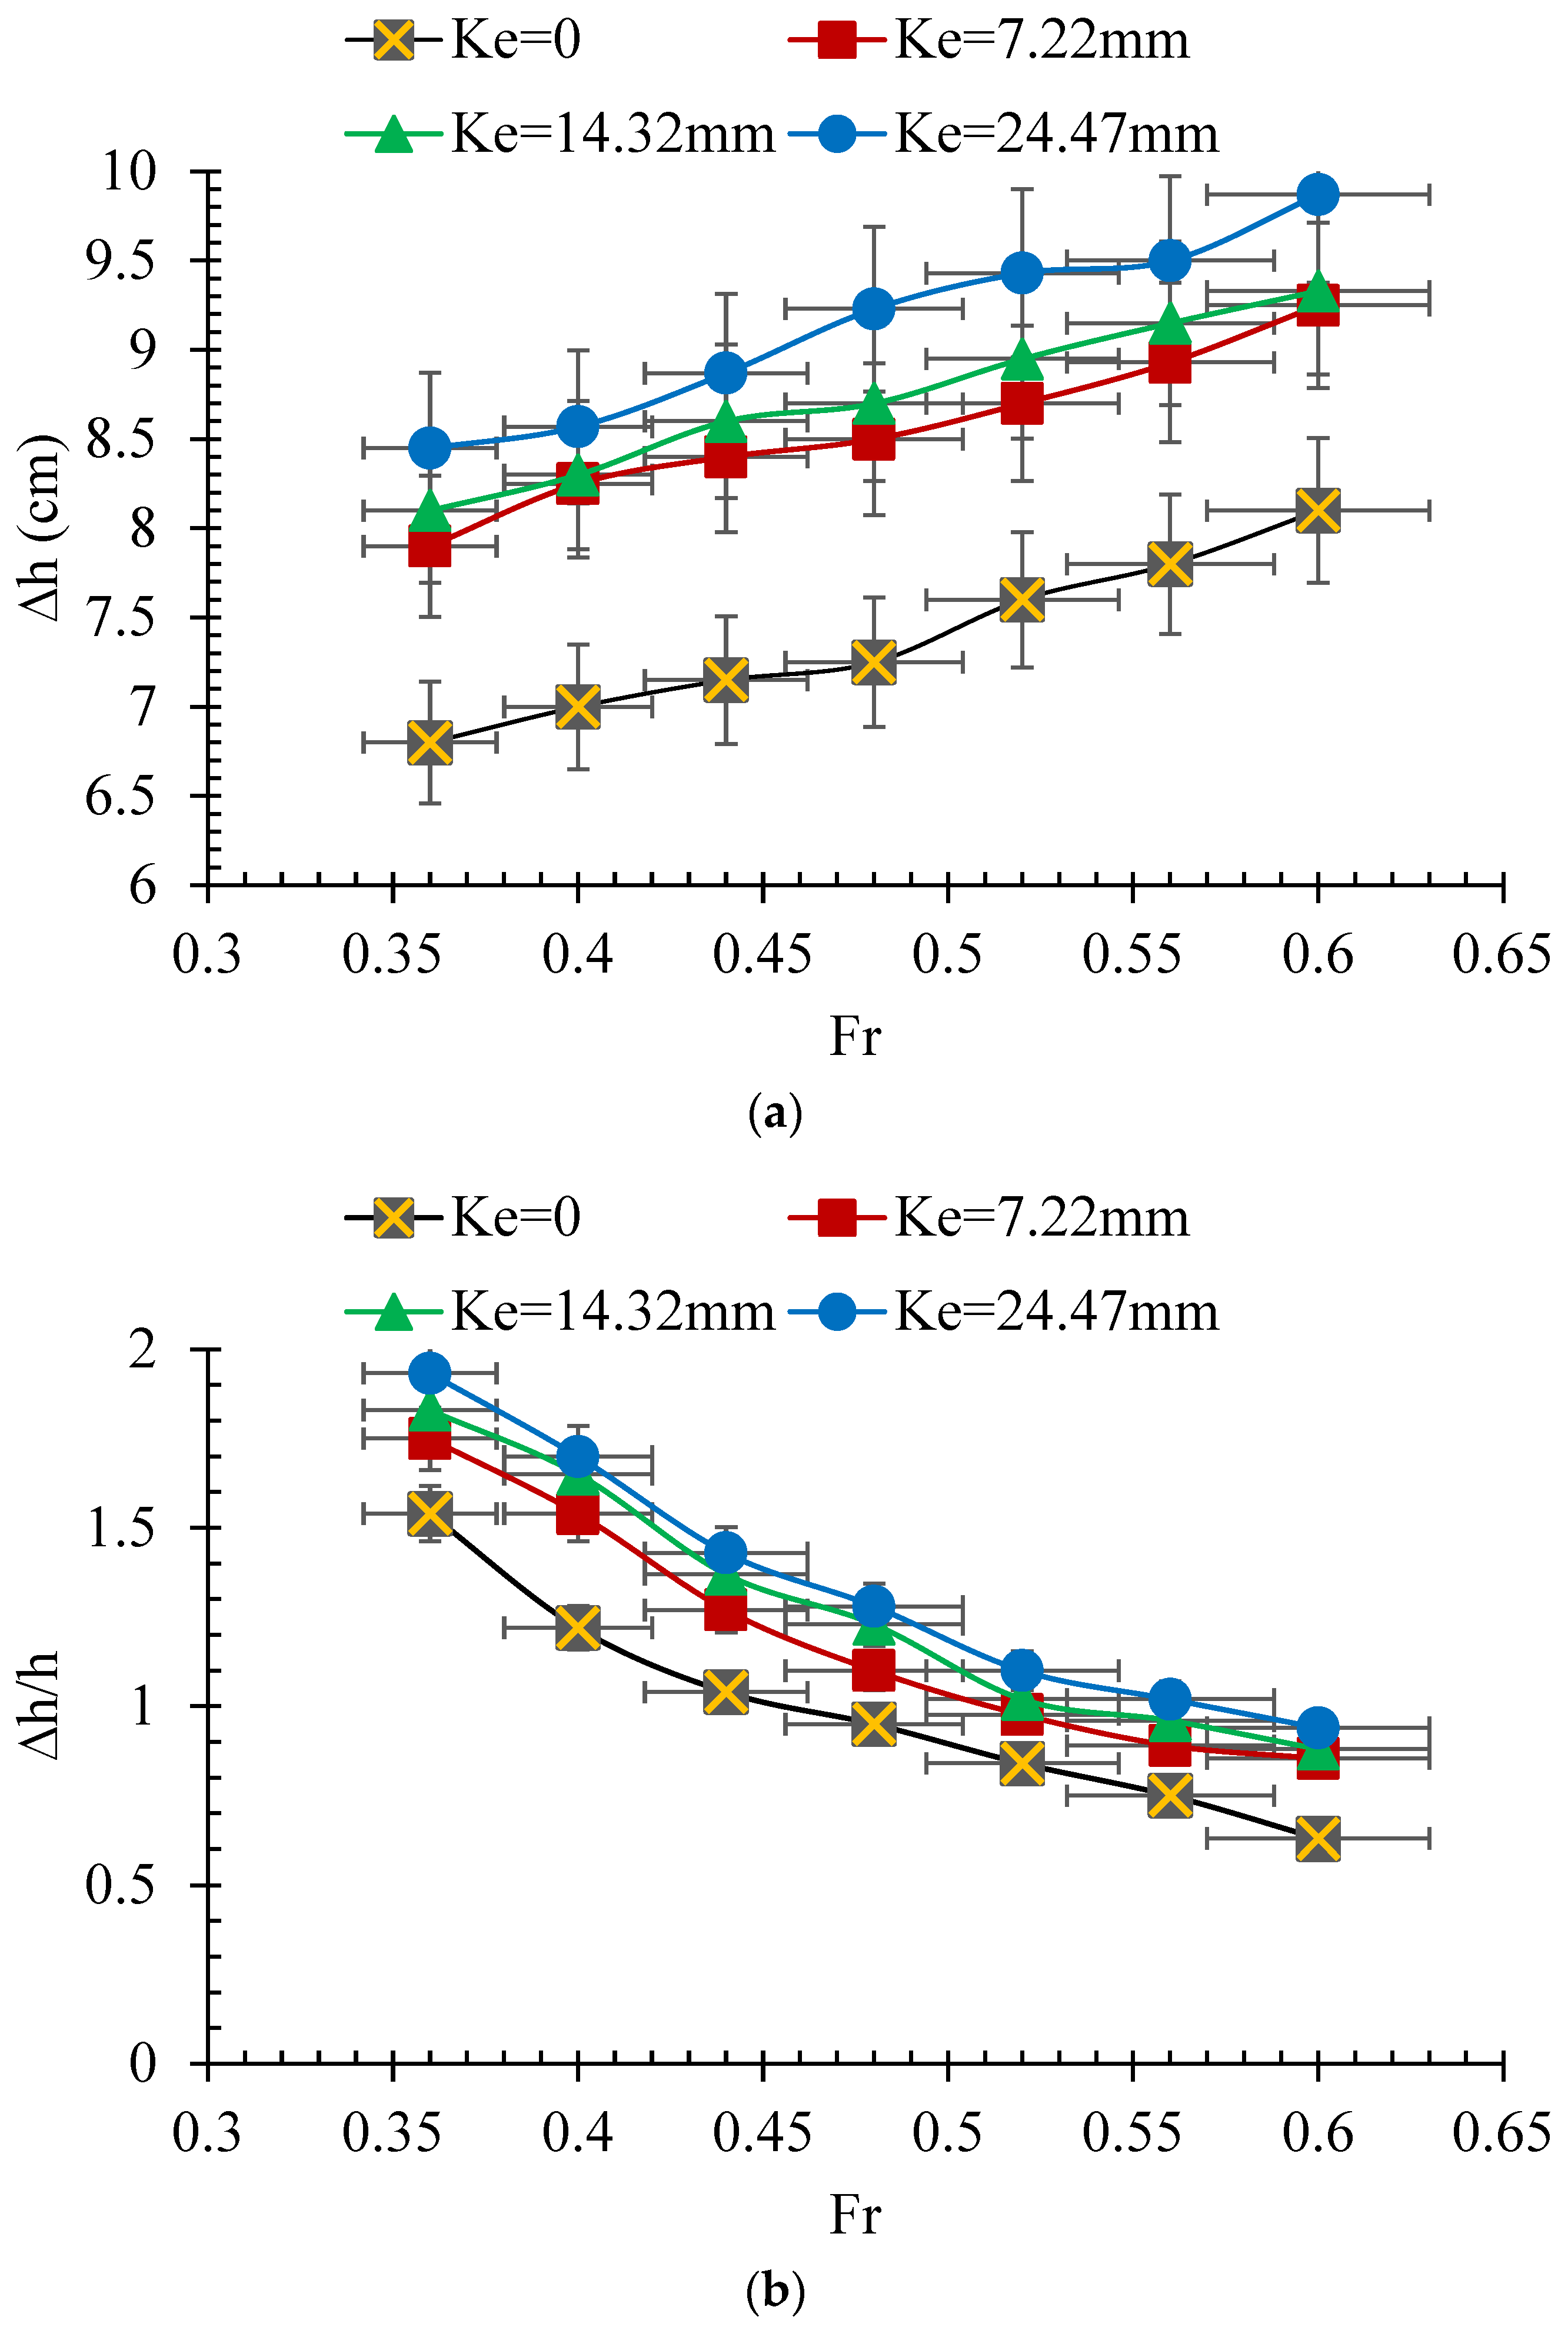
Backwater rise (∆h) is the difference between the water depth on the upstream side with and without a defense system in a channel, as shown in Figure 4. In this study, backwater rise was calculated by the difference in water depth with the defense system (dike–moat–vegetation) and without the defense system in a channel under varying flow and roughness conditions, as depicted in Figure 7a. The result of the backwater rise determined in this study is presented in Figure 7a. The plot depicted in Figure 7a indicates an increase in the values of backwater rise by increasing the Froude number. It was reported that the backwater rise increased by 16% when the Froude number was changed from 0.36 to 0.60.
In the current study, it was observed that increasing the roughness of the dike and moat also increased the backwater rise due to the resistance they offered to flow patterns. Increasing the roughness (Ke) values from 7.22 mm to 24.47 mm, a significant increase in the backwater rise was observed. It was observed that the backwater rise increased by up to 12% compared to scenarios without roughness (Ke = 0) when the roughness value was increased to 7.22 mm. However, the value of the backwater rise increased by 15% as the Froude number increased from 0.36 to 0.60.
However, in the current paper, the backwater rise was increased by changing roughness values from 7.22 mm to 14.32 mm. The maximum backwater rise was observed by increasing the roughness value to 24.47 mm. The backwater rise observed at a roughness value of 24.47 mm was 9.87 cm. Upon comparison to Ke = 0, Ke = 7.22 mm, and Ke = 14.32 mm, it was observed that backwater rise increases by up to 18%, 6%, and 5.5%, respectively, in the case of Ke = 24.47 mm.
The result of the relative backwater rise is presented in Figure 7b. The result demonstrates a reduction in the relative backwater rise with increasing values of the Froude number. This reduction is because of the smaller influence of the initial water depth on the relative backwater rise for the tested values of the Froude number, and a similar trend was reported in previous studies [16,17]. The findings of the current study demonstrate a significant role of the dike and moat roughness in increasing the water level on the upstream side.

3.3. Energy Reduction

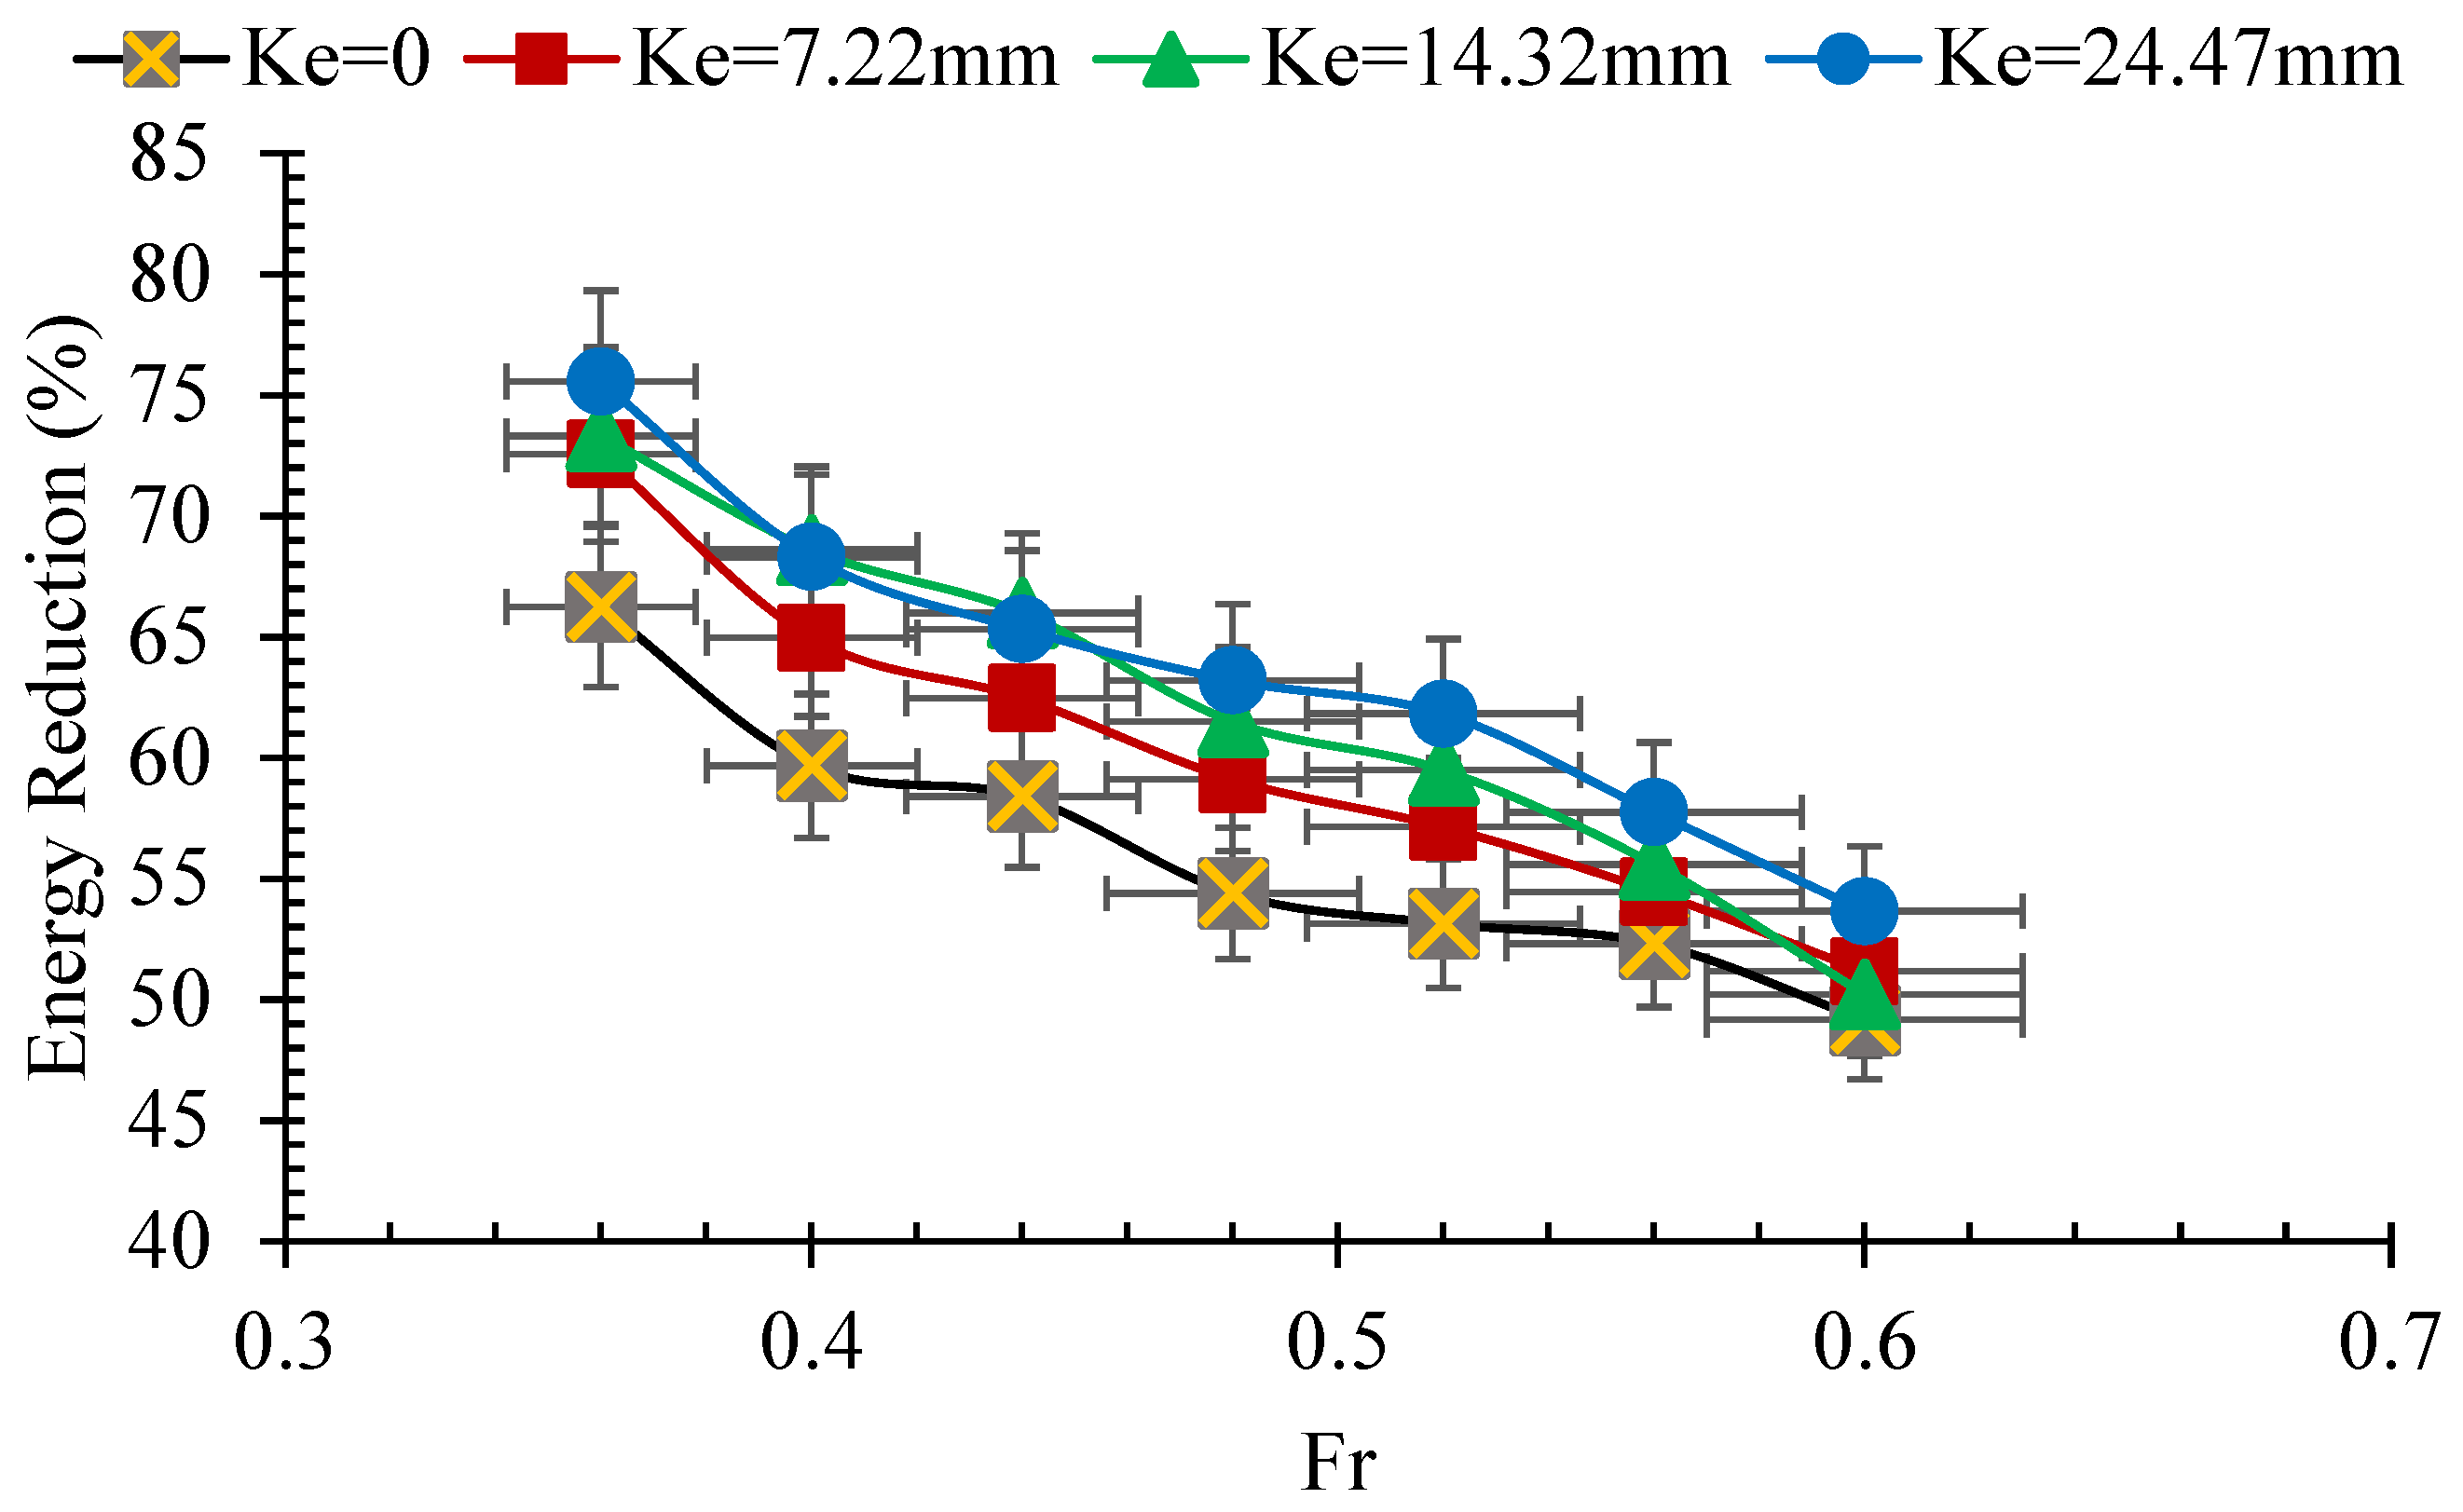
In this paper, floodwater energy reduction was assessed under varying scenarios of roughness and flow conditions, as shown in Figure 8. The plot in Figure 8 shows the effectiveness of the defense system in reducing floodwater energy under varying conditions. It was observed that energy reduction decreases with increasing values of the Froude number under roughness conditions of Ke = 0. The result presented in Figure 8 shows the energy reduction under different values of roughness of the dike and moat depicted in different lines. The result demonstrated a maximum energy reduction of 66.25% in the case without roughness (Ke = 0). However, the energy reduction through a defense system decreased with increasing values of the Froude number from 0.36 to 0.60 under constant roughness (Ke = 0).
The energy reduction increased by up to 26% as the Froude number was increased from 0.36 to 0.60 under Ke = 0. The drop was because, as the Froude number increases, flow velocity and momentum are increased, which reduces the time available to interact with the defense system and decreases the efficiency of turbulence-induced energy dissipation. By introducing roughness to the dike and moat, it was observed that energy reduction increased to 72.58% under roughness conditions of Ke = 7.22 mm.
Under constant roughness conditions of Ke = 7.22 mm, it was observed that energy reduction decreased up to 29.5% by increasing the Fr value from 0.36 to 0.60. Upon comparison to the case without roughness condition under a constant value of Fr = 0.36, it was observed that energy reduction increased up to 9% in the case of Ke = 7.22 mm. Further increasing the roughness values of the dike and moat to Ke = 14.32 mm and 24.47 mm under a constant value of Fr = 0.36, it was observed that energy reduction reached 73.32% and 75.56%, respectively.
Upon comparison to conditions without roughness (Ke = 0), it was observed that energy reduction increased up to 10% and 12% in the case of Ke = 14.32 mm and 24.47 mm. The result demonstrated a similar trend of energy reduction under different roughness conditions; however, more energy of the floodwater was reduced in the case of higher values of the roughness compared to the low roughness conditions.
Upon comparison of the energy reduction caused under varying flow and roughness conditions, it was observed that energy dissipation improved by 9.31% at Fr = 0.36 and 4.5% at Fr = 0.60 by increasing roughness values from 0 to 24.47 mm. Likewise, at Fr = 0.44, the energy reduction rises to 66% and 65.32% (Ke = 14.32 mm and Ke = 24.47 mm) at moderate flow conditions, which suggests that the effect of roughness is more significant at lower to moderate values of Fr. But above Fr = 0.52, the energy reductions at higher Ke values (Ke = 14.32 mm and Ke = 24.47 mm) approach each other due to the prevalence of flow inertia.

3.4. Types of Hydraulic Jump

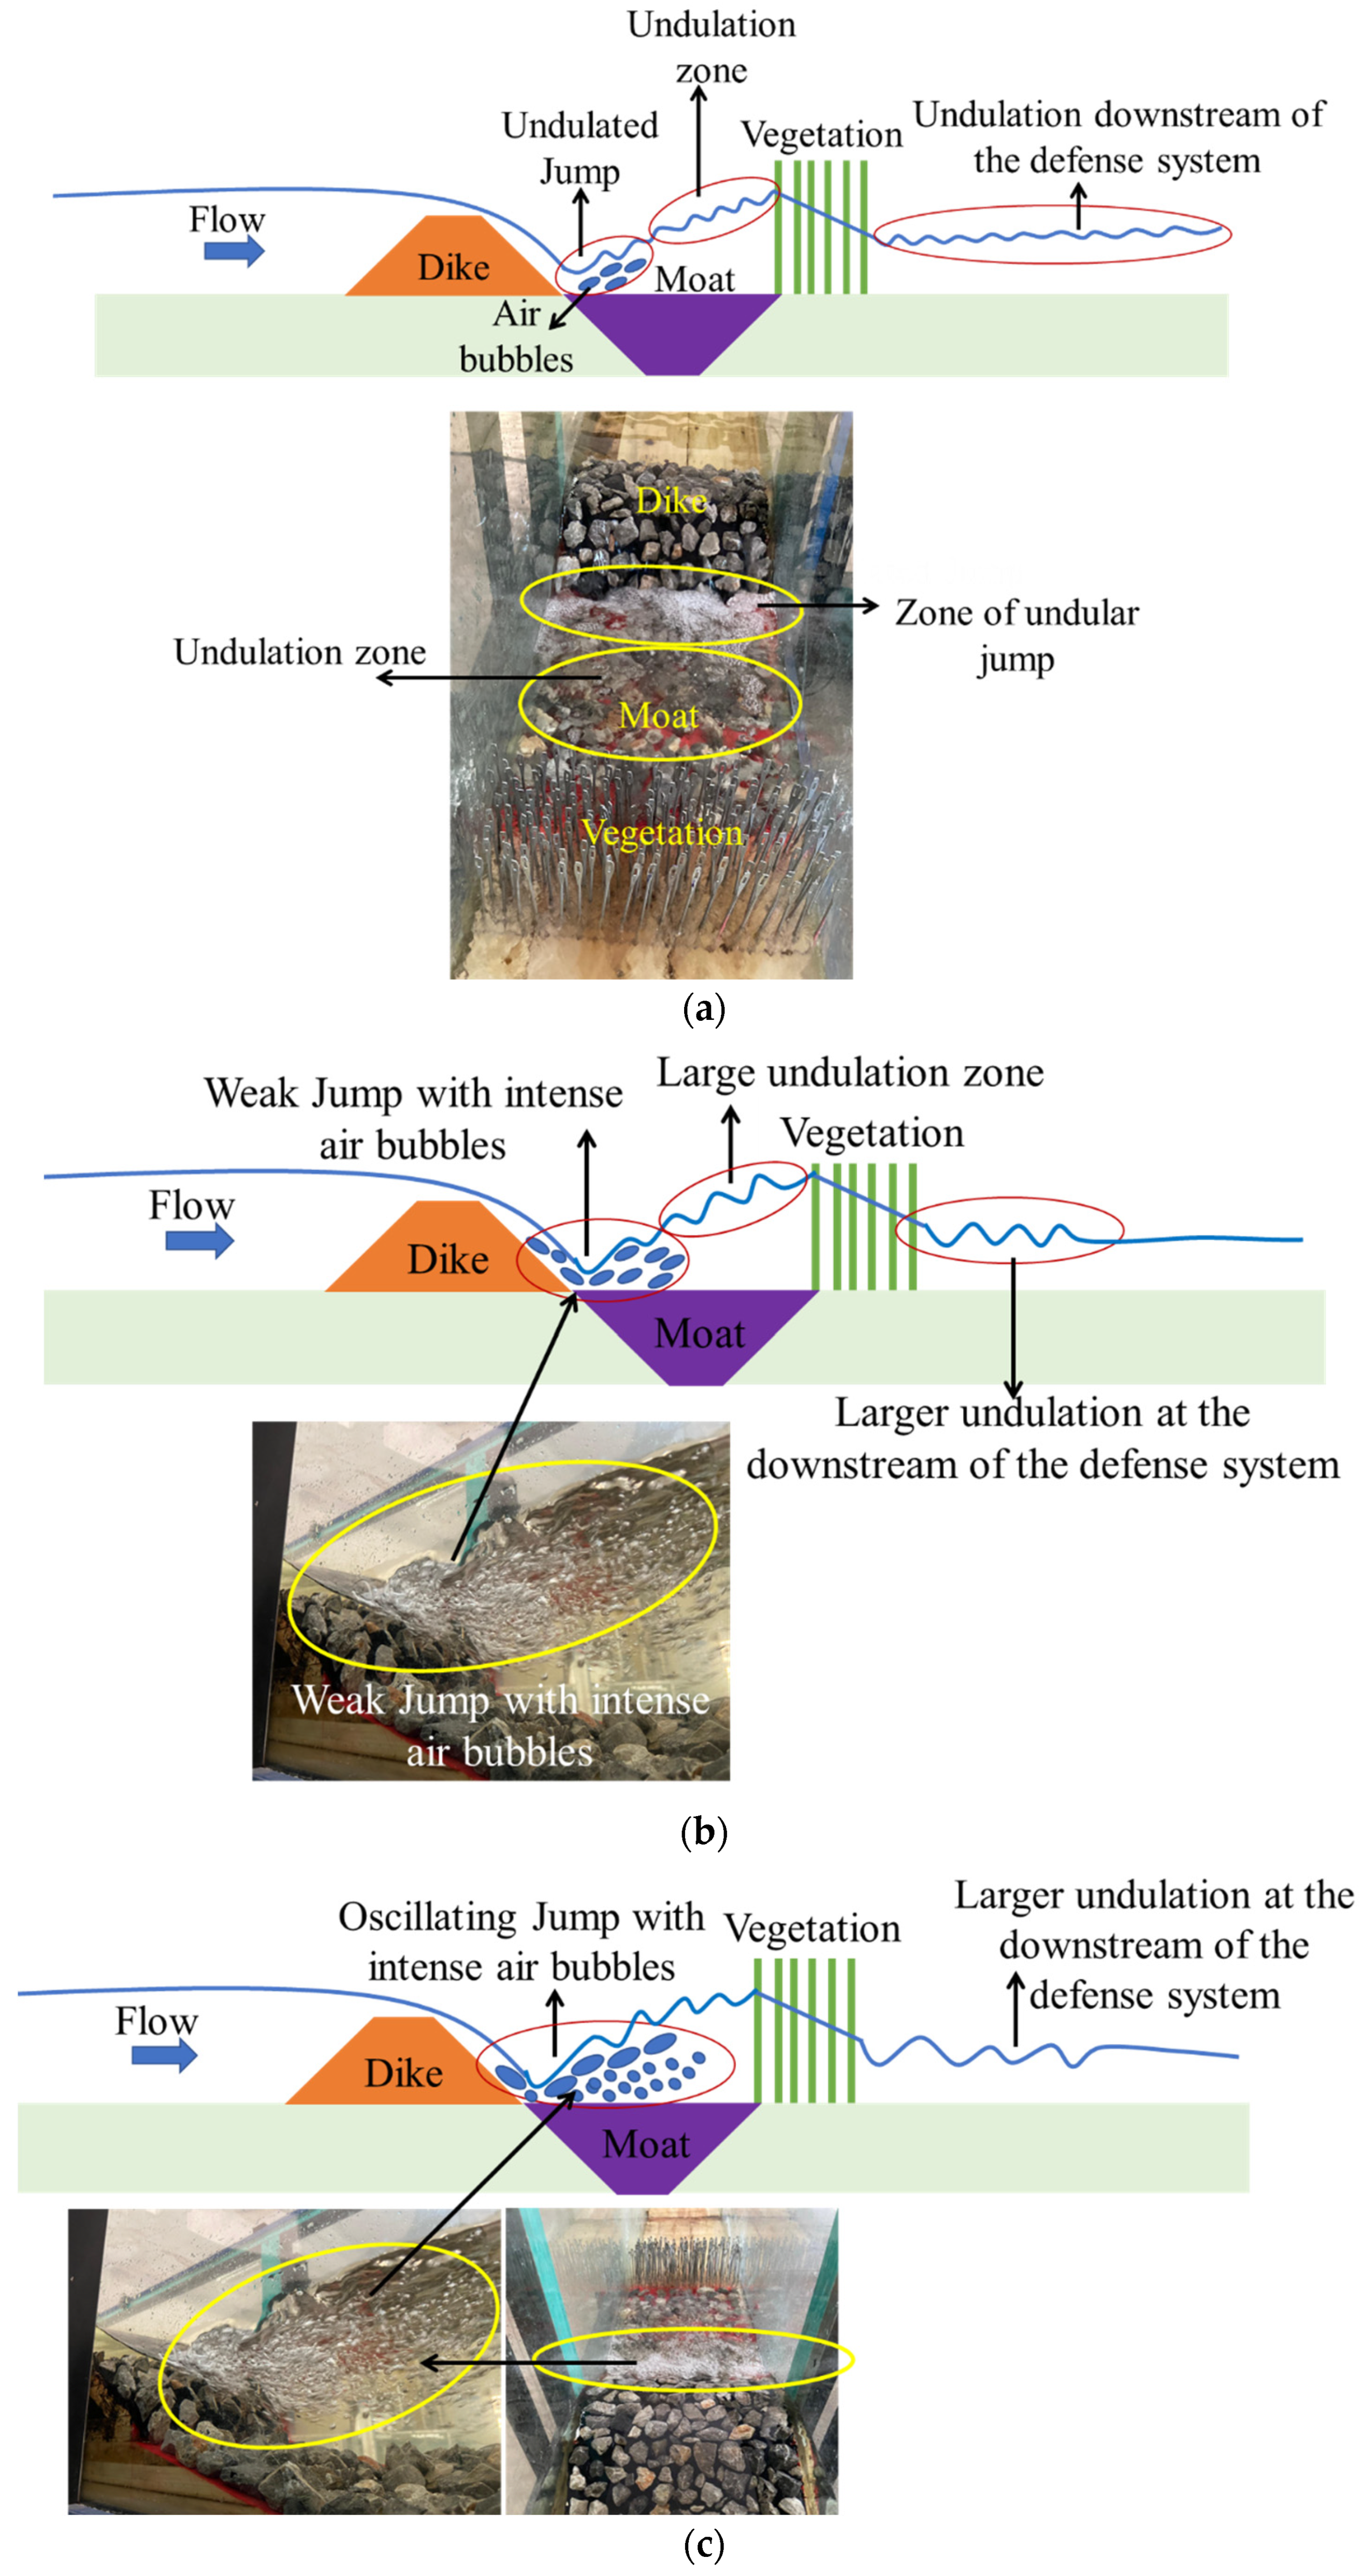
In this paper, various types of hydraulic jumps were assessed considering a defense system comprising the dike–moat–vegetation (Figure 9a–c). The hydraulic jump formed in this study was predominantly observed in the body of a moat (located downstream of the dike), depending upon flow conditions (Figure 9a–c). Upon evaluation, this study observed various types of jumps, including undular (UJ), weak (WJ), and oscillating jump (OJ). The Froude number values were used to evaluate the types of jumps formed at the body of the moat.
However, in this study, the formation of the hydraulic jump was affected by the roughness and flow conditions across each case. The types and frequency of the jump were significantly influenced by the roughness conditions, which were changed from Ke = 0 to Ke = −24.47 mm. In the case of Ke = 0, an undular hydraulic jump with intense air bubbles was predominantly observed for initial Froude numbers ranging from 0.36 to 0.44 (Figure 9a). For higher values of initial Froude number (Fr = 0.48 to 0.60), no jump (NJ) was observed in the body of a moat; instead, a larger undulation was observed extending from the starting position of a moat toward vegetation (Table 2).
Further, by introducing a roughness value of 7.22 mm to the dike and moat, it was observed that an undulated jump formed with larger air bubbles covering more distance in the body of a moat compared to a scenario without roughness. However, it was observed that a UJ-type jump formed for the lower values of the initial Froude number (0.36 to 0.48), and NJ formed at higher values of Froude number (0.52 to 0.60).
The hydraulic jump observed in the present study predominantly formed within the moat region downstream of the dike, confirming its role as an energy dissipation basin. The classification of hydraulic jumps into undular, weak, and oscillating types was based on visual observations and corresponding Froude number ranges. However, this classification remains qualitative in nature. For a more strict characterization, future studies should incorporate quantitative parameters such as sequent depth ratio, jump length, roller length, and energy loss coefficients. Despite this limitation, the observed behavior is consistent with established hydraulic-jump theory and provides meaningful insight into flow–structure interactions within eco-engineered defense systems.
Upon increasing the roughness conditions to 14.32 mm and 24.47 mm, it was observed that an undulated hydraulic jump formed in the body of a moat, and larger undulations were observed at the downstream side of the vegetation model for Fr values of 0.36 to 0.60. In the case of a roughness value of 14.32 mm, a weak jump was observed in the body of the moat for lower values of Fr (0.36 to 0.40) (Figure 9b), while an undulated jump was observed for higher values of Fr (0.44 to 0.56), and no jump was observed for Fr = 0.60.
Further, in the case of a roughness value of 24.47 mm, a weak and oscillating jump was observed in the body of the moat (Figure 9b,c). For both weak and oscillating jumps, it was observed that air bubbles of larger size were also generated in the body of the moat, striking with a vegetation model at higher velocity compared to Ke = 0 and 7.22 mm.

3.5. Energy Reduction by Hydraulic Jump

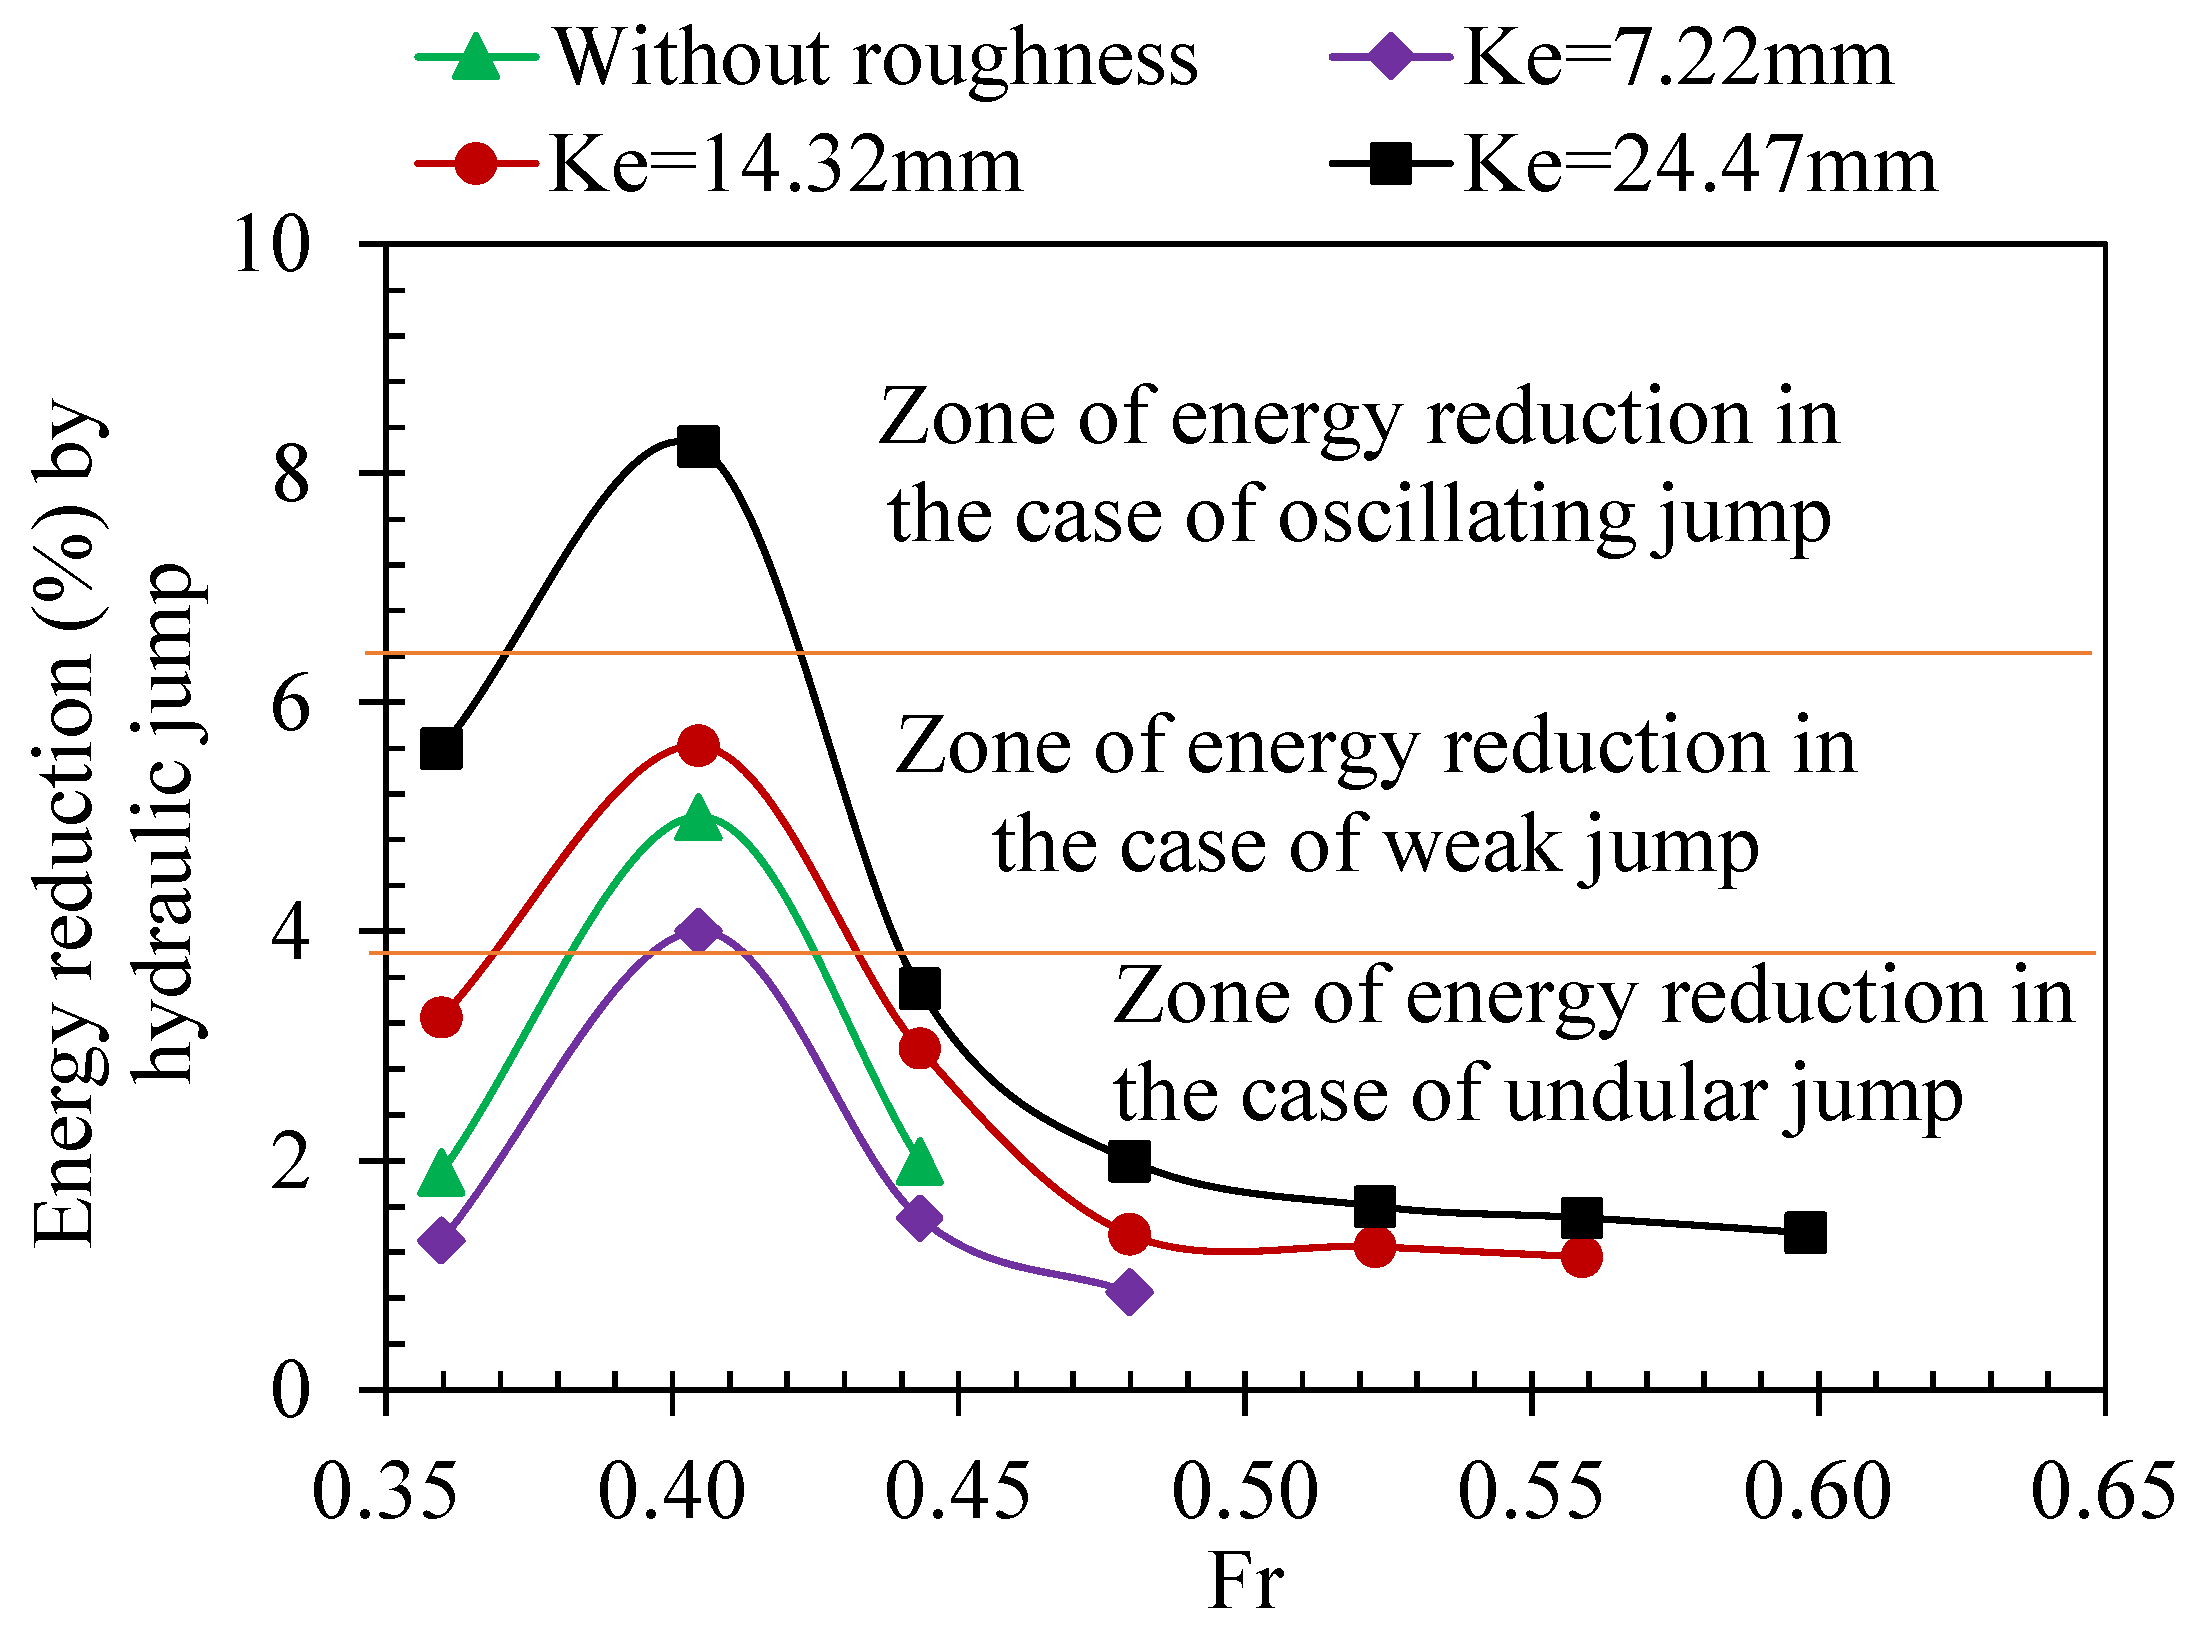
Figure 10 depicts energy reduction caused by different types of hydraulic jumps under diverse hydraulic and roughness conditions. The result shows that the highest energy reduction occurred at a moderate value of initial Froude number (Fr = 0.40). This was due to the satisfactory balance between flow velocity and turbulence generation, enhancing flow interaction with the defense system and improving momentum dissipation without flow deflection. In the case of roughness conditions (Ke = 0), it was observed that 5% of flow energy was reduced and decreased for higher values of roughness, i.e., 4.00% for Ke = 7.22 mm, 5.63% for Ke = 14.32 mm, and 8.24% for Ke = 24.47 mm.
The result demonstrates a significant reduction in energy through the hydraulic jump under higher roughness of the dike and moat. However, the trend of the energy reduction decreases with increasing values of Fr. This was because of the formation of different types of hydraulic jump: undular, weak, and oscillating jump as depicted in Figure 9. At higher Fr values of 0.56 and 0.60, the lowest energy reduction was observed under diverse roughness conditions due to the nature of the jump formed, aligning with the zone of undular jump reported by [46].

3.6. Delay in Floodwater Arrival

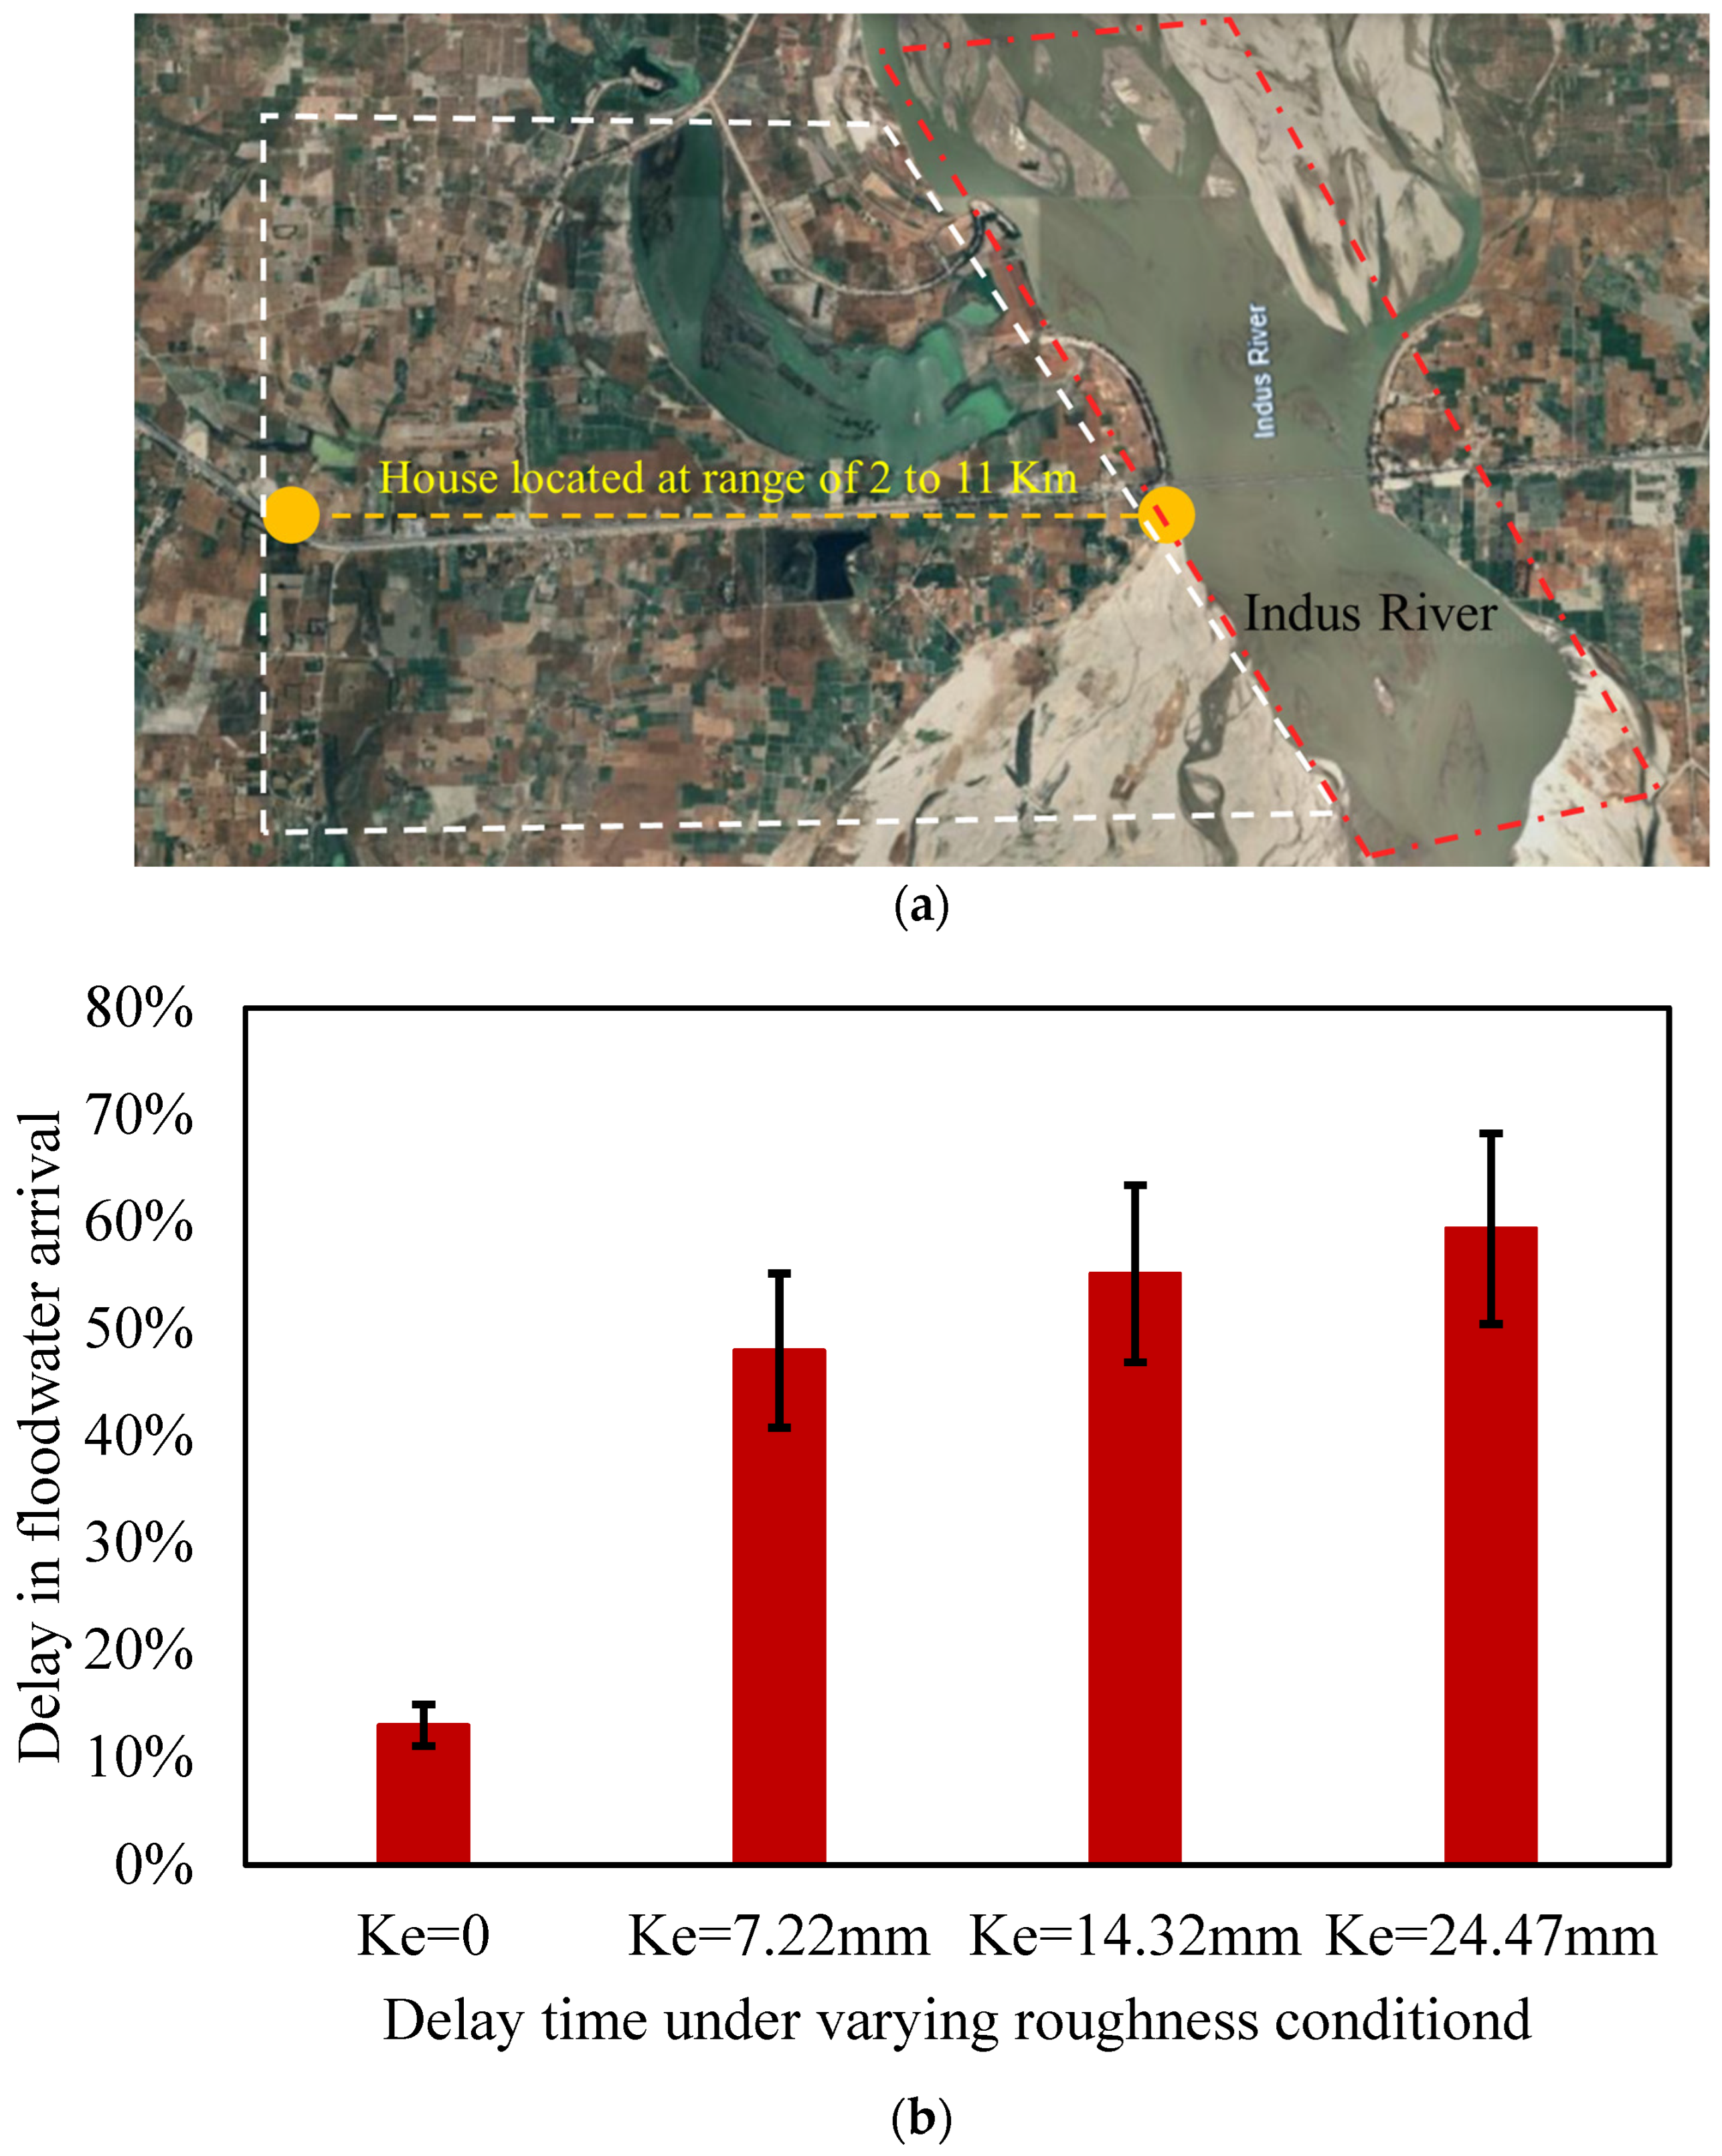
For an effective flood management and mitigation approach, a delay in floodwater arrival time is important to understand. A delay in the arrival of floodwater contributes to the safe evacuation of the community within a specific time frame, reduces potential damage and loss of life, and supports the implementation of preventive measures. In this study, the delay in floodwater arrival time was determined by considering the time taken by floodwater from the inlet to 5.5 m towards the outlet of the channel (1 m downstream of the defense system). In this research, a distance of 5.5 m was selected towards the outlet of the channel (1 m downstream of the defense system). This specific distance was chosen to represent residential structures in the Dera Ghazi Khan district of Punjab, Pakistan. Along the Indus River in this district, houses are generally situated 2–11 km away, as depicted in Figure 11a, with data obtained via Google Earth Pro, and a similar approach was adopted in a previous study [13].
For experimental purposes, a 5.5 m distance in the model corresponds to 0.55 km in reality, based on a scale ratio of 1:100. This scaling approach enables the assessment of flood impacts on residences situated at practical and representative distances. Point G thus serves as a reference location for evaluating the delay in floodwater arrival to a house or building. The arrival of floodwater at the downstream of the defense system was calculated for each scenario, and a similar approach was adopted in a previous study [17,20]. The findings demonstrate the effectiveness of the defense system comprising a dike, moat, and vegetation in effective flood management under varying roughness conditions, as shown in Figure 11b.
The result shows that, under varying roughness conditions ranging from 0 to 24.47 mm, the delay in floodwater arrival time increases. The percentage reduction in delay time occurred from 48% to 65% for roughness conditions of Ke = 0 to Ke = 24.47 mm. The highest reduction in delay time was observed at a roughness condition of 24.47 mm. The result presented in Figure 11b demonstrates that increasing the surface roughness of the dike and moat increases the effectiveness of the defense system by controlling the arrival of floodwater.

3.7. Regression Analysis

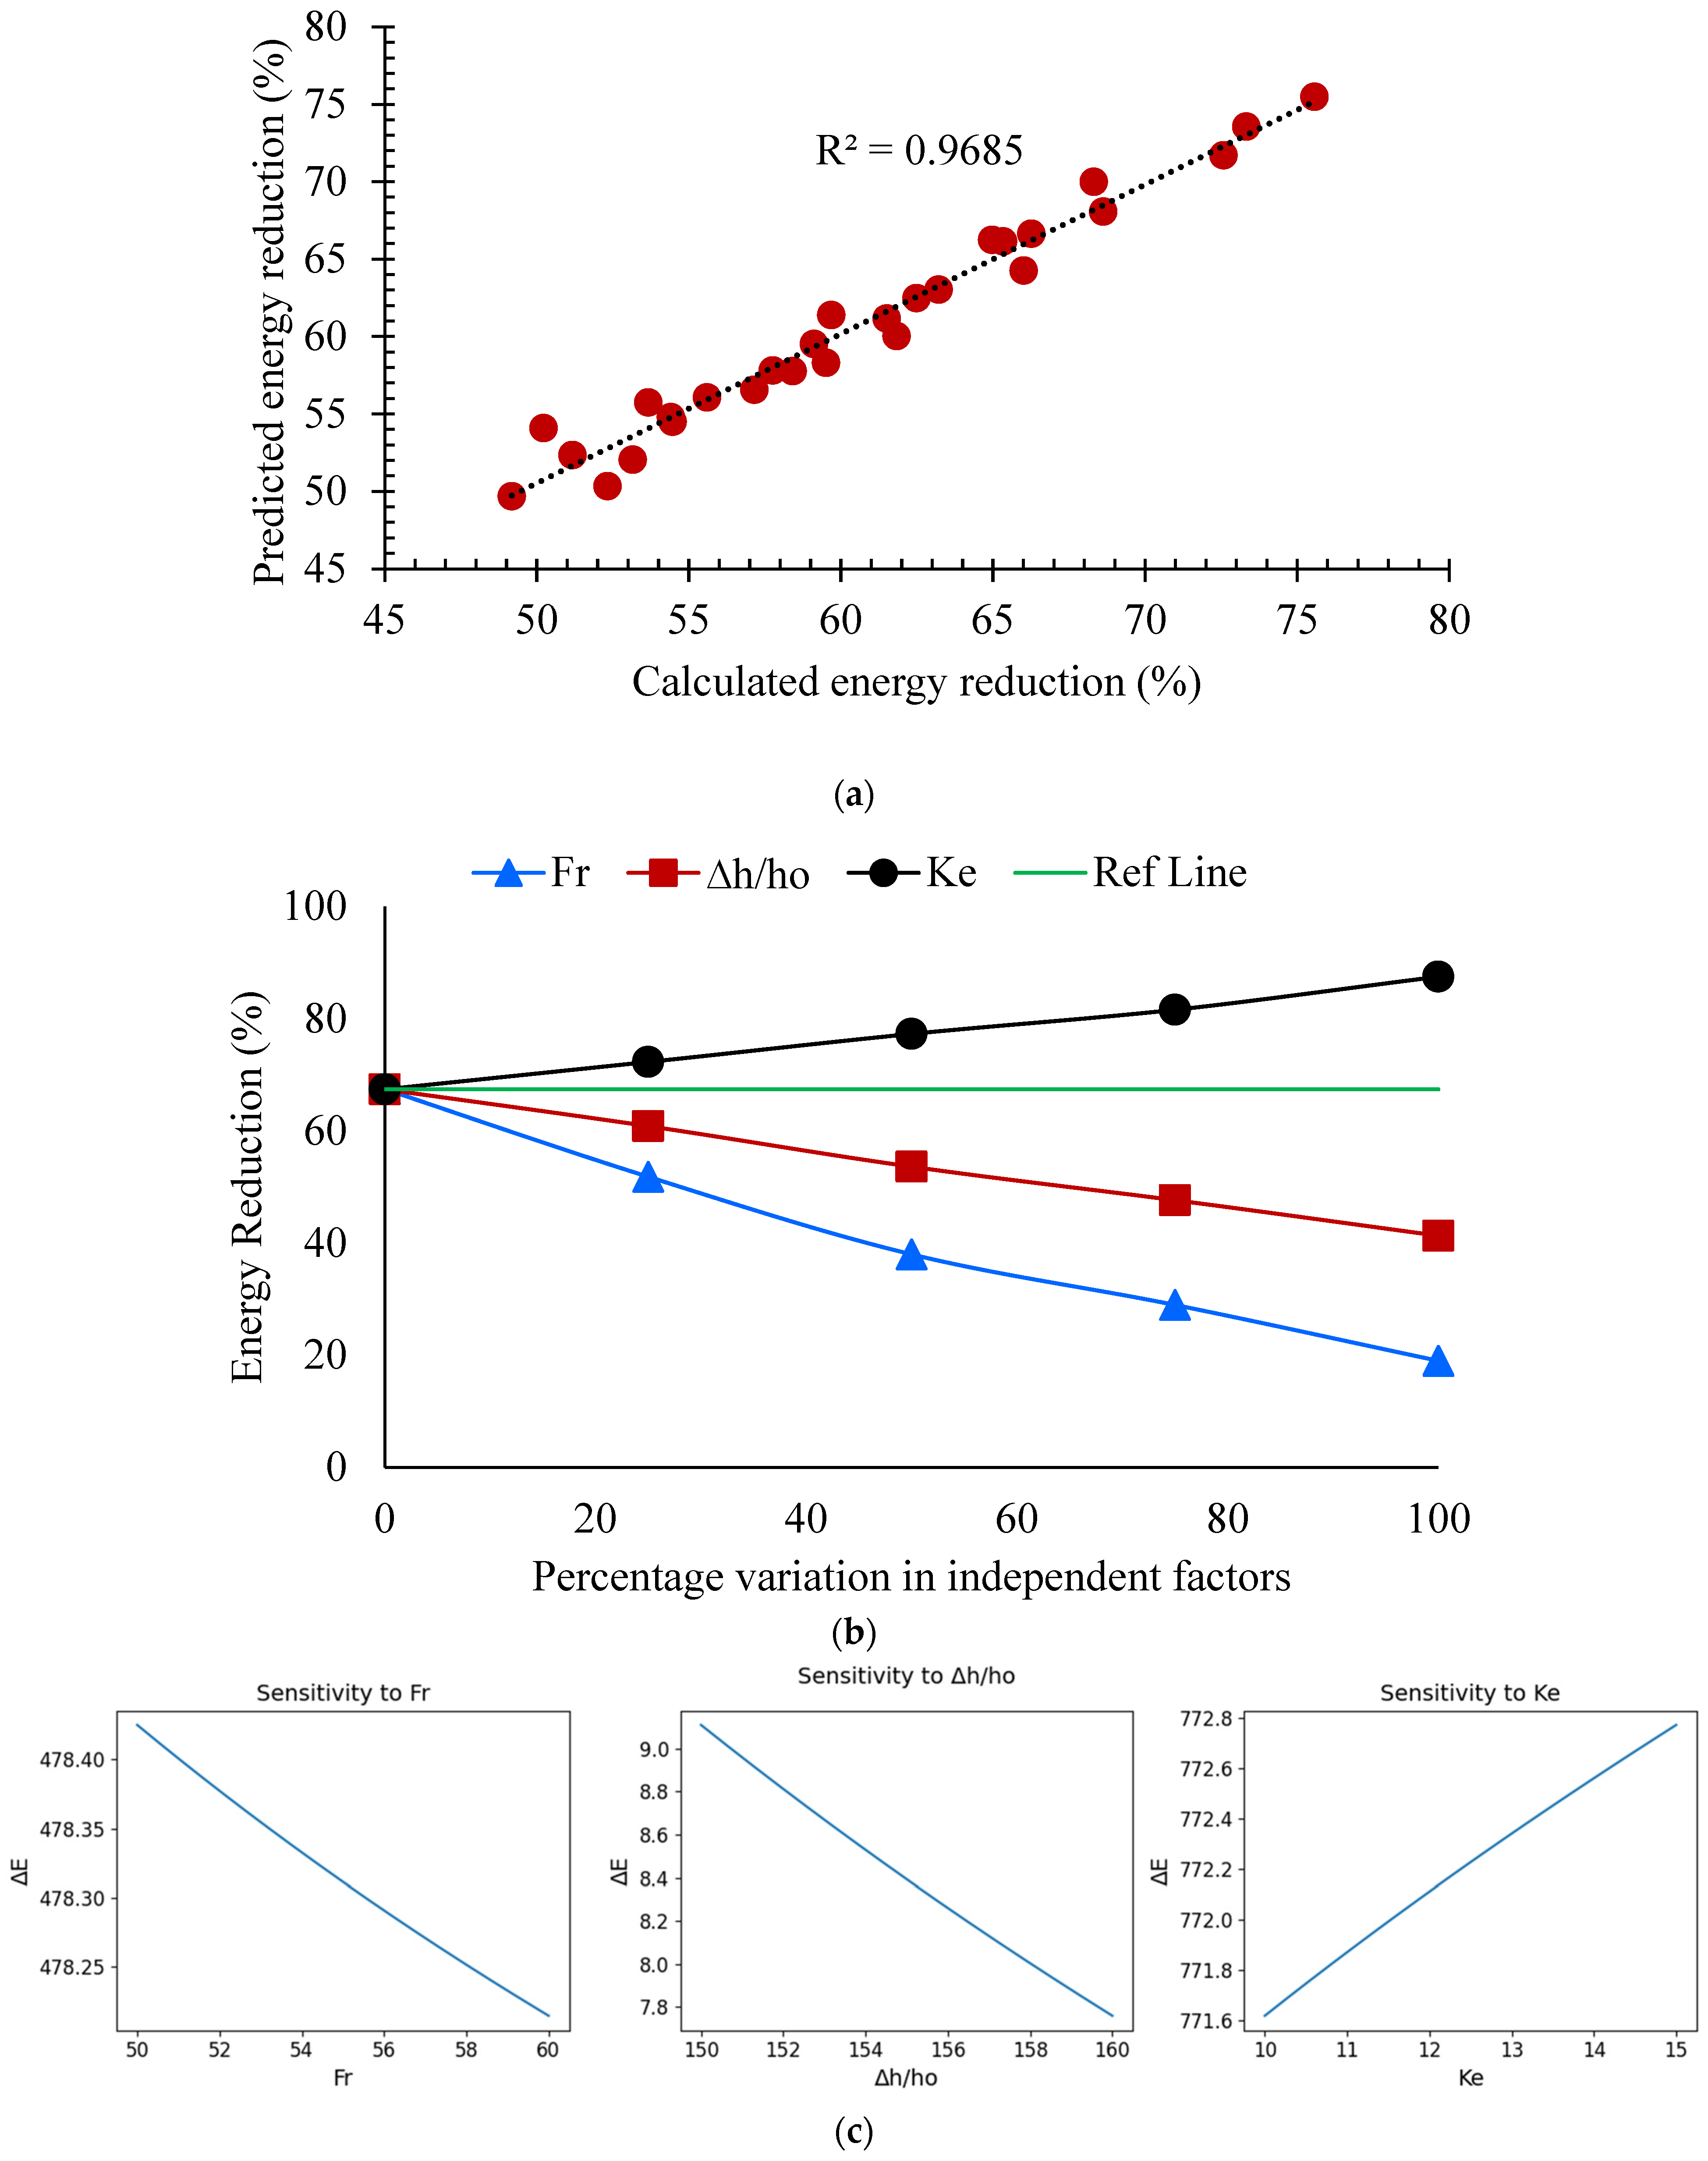
The developed model has an NSE value of 0.969, indicating 96.6% of predicted values of the energy reduction matched with actual values. Further, previous studies reported that NSE values of the hydraulic modeling close to 1 signify a good fit [31,47]. Therefore, the NSE value reported in the current paper demonstrates better performance while predicting floodwater energy reduction, as shown in Figure 12a.
Further, the reported RMSE value (1.25) in this study shows the average errors between the predicted and actual values of the energy reduction. The RMSE value of 1.25 shows the reasonable performance of the developed regression model. Following the RMSE values, the MAE value of the developed model was observed to be 0.956, further supporting the good performance of the model, indicating the mean absolute difference between the predicted and observed values of the energy reduction. Based on these performance indicators, the current paper recommends the accuracy and robustness of the developed model in predicting floodwater energy reduction. Despite providing valuable insight into flow–structure interaction within eco-engineered flood defense systems, the present study has several limitations that should be considered when interpreting the results. The experiments were conducted under controlled laboratory conditions using a relatively narrow fixed-bed flume and simplified rigid vegetation elements, which may not fully represent the complexity of natural floodplain environments. In addition, the selected Froude number range was limited to subcritical flow conditions, thereby restricting direct application to extreme flood regimes. Therefore, the developed regression model and observed hydraulic behavior should be considered as preliminary experimental findings that support future large-scale experimental and field-based investigations rather than direct real-world prediction tools. Future studies incorporating movable beds, wider channels, flexible vegetation, and broader hydraulic conditions are recommended to improve field applicability.
E = ( 30.858 F r 0.748 ) + ( 1.174 × ( h h ) 2.832 ) + ( 2.011 × K e 0.454 )

3.8. Sensitivity Analysis

This analysis is useful for determining the most influential input parameters affecting the output parameter. Therefore, in this study, sensitivity analysis was performed to check the influence of the input parameters, like Froude number, backwater rise, and roughness conditions of the dike and moat, on the floodwater energy reduction, as shown in Figure 12b. For performing this analysis, Equation (3) derived from the regression model was tested in a way that one parameter was increased by 25% while the other two were kept constant. This approach was adopted for all input parameters by increasing their values from 0 to 100%.
The developed regression model explicitly establishes a functional relationship between energy reduction and surface roughness (Ke). The positive exponent associated with Ke in Equation (3) indicates that energy dissipation increases with increasing roughness, following a nonlinear power-law trend. This demonstrates that roughness plays a dominant role in controlling hydraulic resistance and turbulence generation within the defense system. Unlike conventional approaches that characterize roughness solely based on particle size, the present model directly quantifies its influence on energy reduction, providing a more practical framework for the design and optimization of eco-engineered flood defense systems.
The result plotted in Figure 12b demonstrates a greater influence of the dike and moat roughness on energy reduction compared to Froude number and backwater rise. This is of special concern in flood control systems where surface roughness can be introduced to improve the overall efficiency of flood structures like dikes and moats at dissipating the energy in the flood water and mitigating the possible losses to such structures. It was observed that the energy reduction increases with increasing roughness conditions of the dike and moat. This suggests that the roughness of the dike and moat increases resistance to the flow, contributing to significant energy reduction.
In contrast, the Froude number and backwater rise have a lower impact on the energy reduction because of their relevance to variation in water surface profile and flow conditions, instead of resistance to the flow (Figure 12c). The Fr is coupled to the velocity of the flow in the sense that, usually, when Fr increases, the flow velocities increase so that a smaller energy reduction occurs. This emphasizes the significance of surface roughness to the design and optimization of flood defense structures, since it contributes to improving energy reduction and reducing the destructive capabilities of floodwater.

4. Discussion

The water surface profile shows the variation in water depth along the channel. This is important in diverse applications of engineering and hydrological applications, including the design of flood control projects, the determination of stream channel design capacity, and the analysis of open-channel flow characteristics [48]. Profiles of water surfaces play a critical role in the determination of flood levels as well as the determination of the need to implement flood controls through the construction of levees and floodways to help ease the destruction caused and prevent the loss of lives and property [49]. The ponding water level on the upstream side of the dike is uniform, followed by variation starting from the top of the dike, as shown in Figure 6a–d.
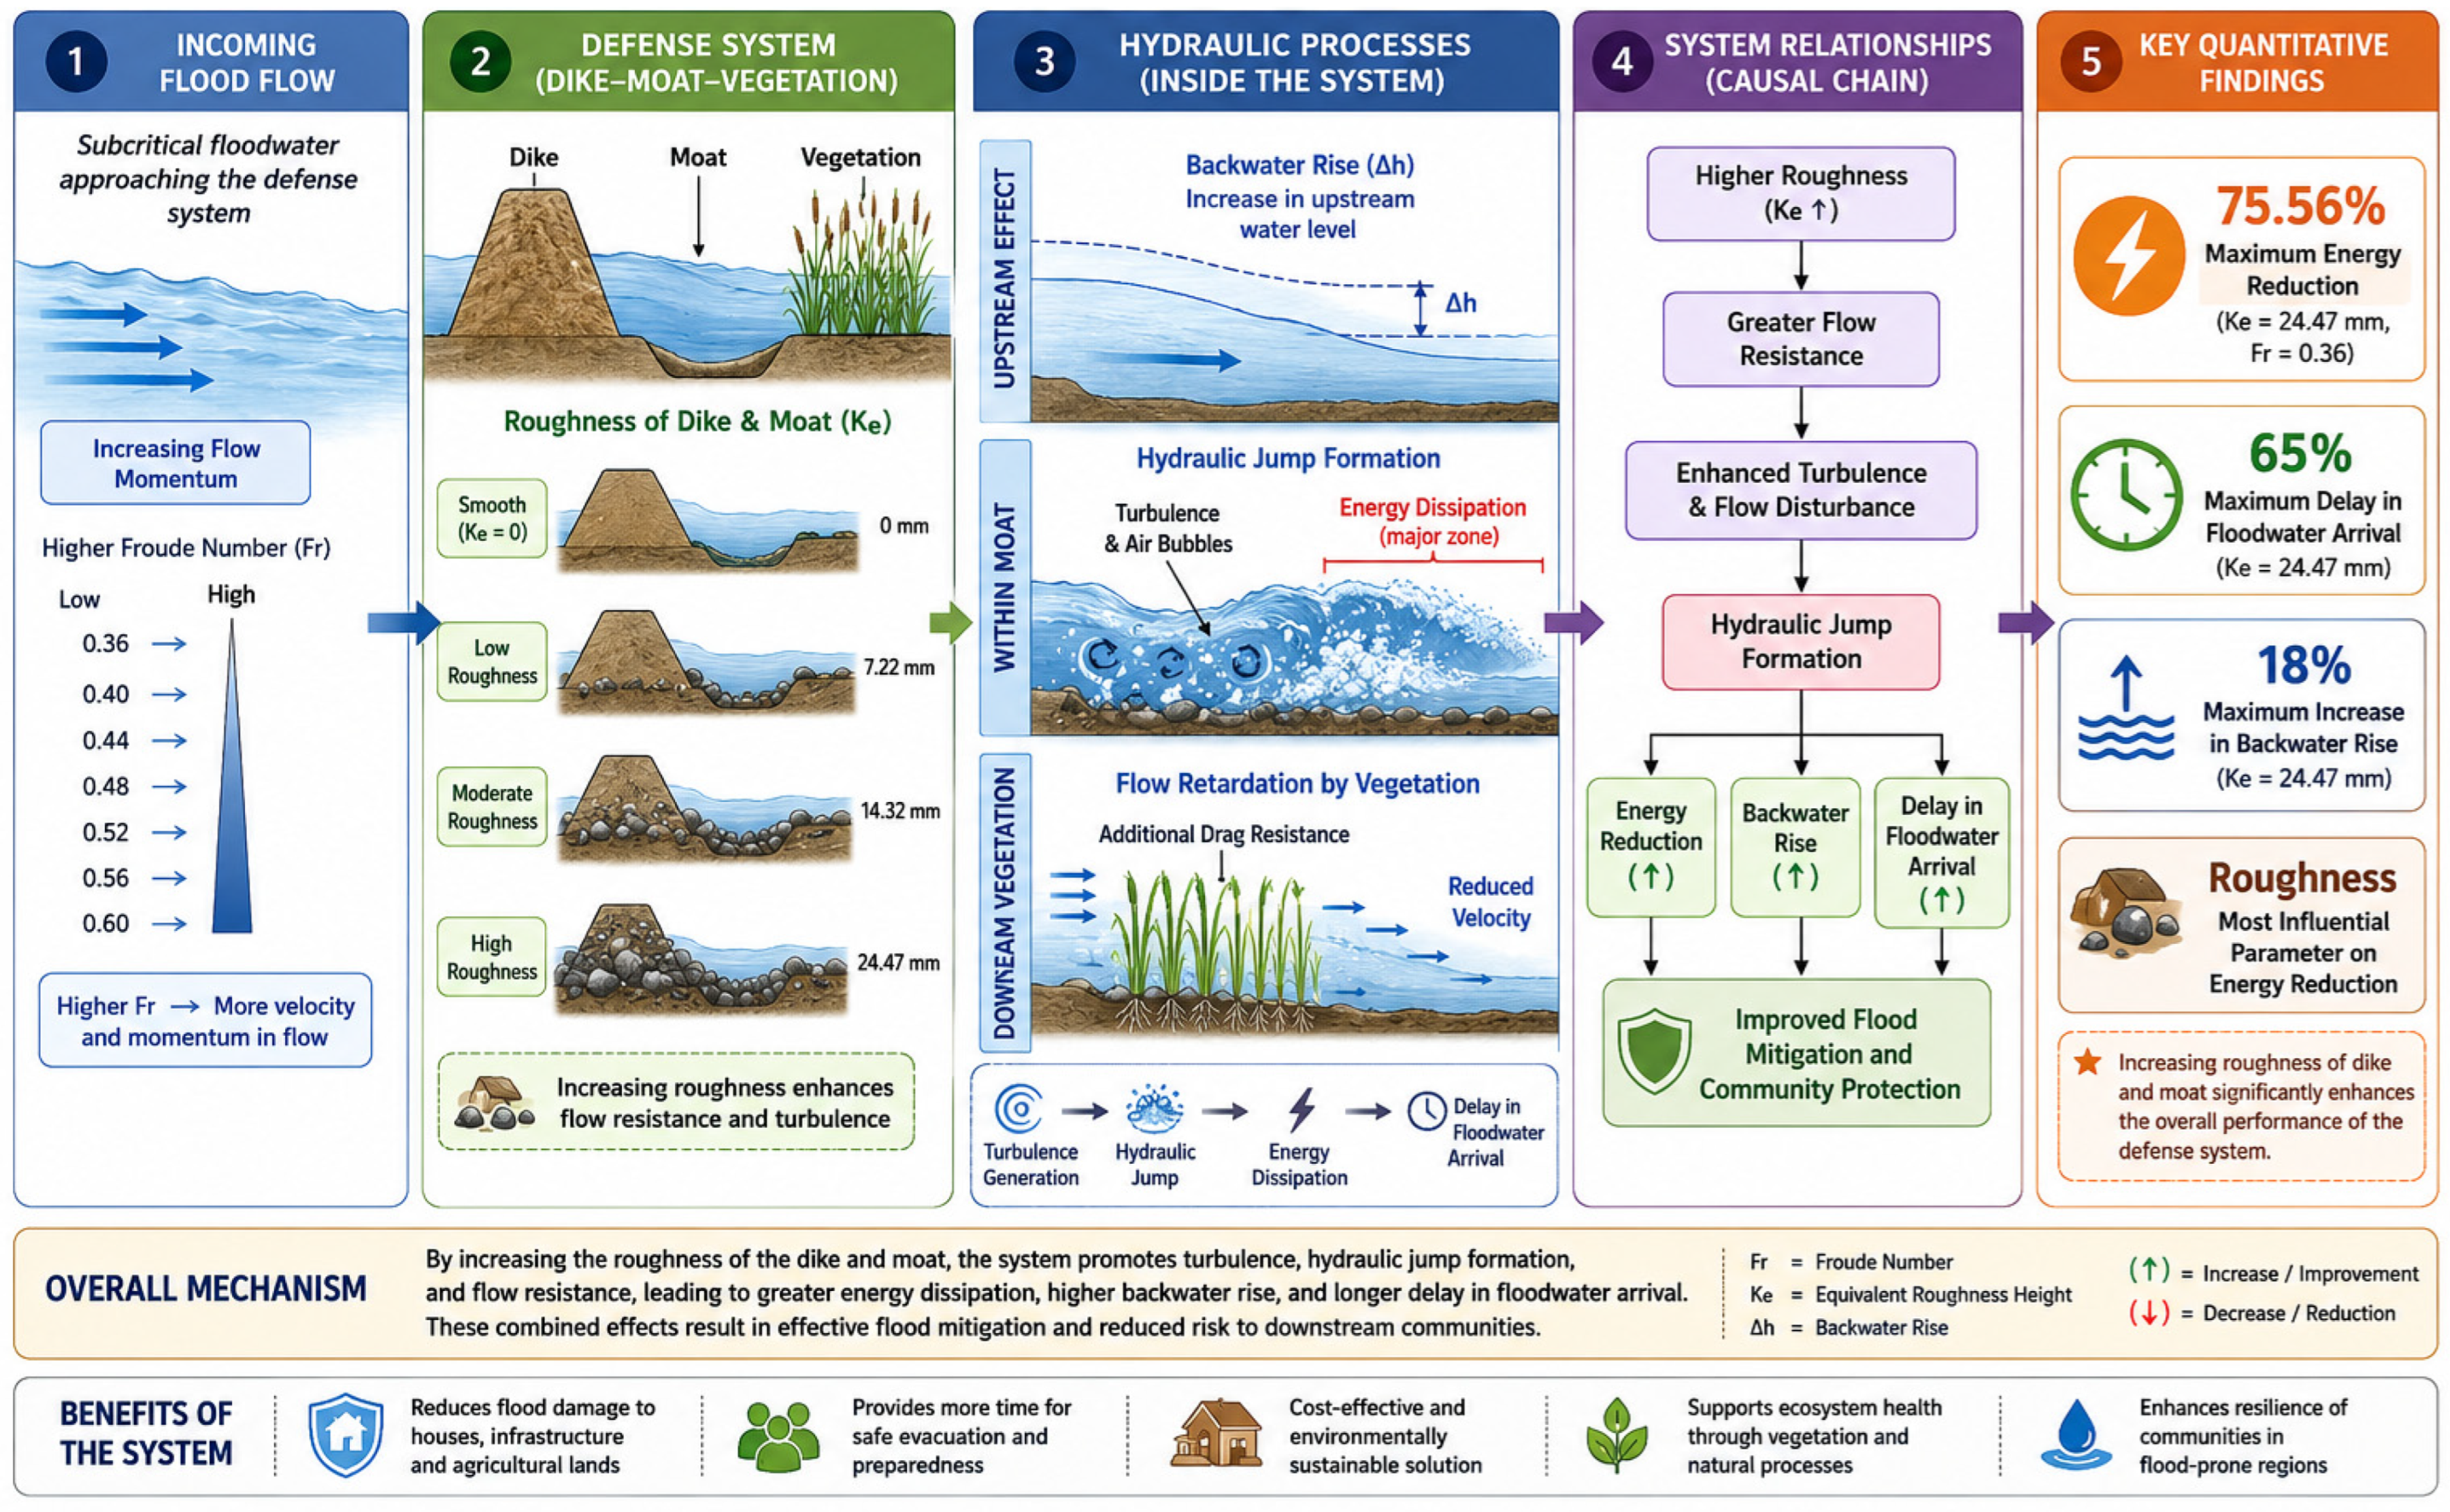
The profile shows greater variation in the body of a moat; the undulation in the body of the moat increases with increasing Froude number and roughness values. Further, the water surface profile shows variation within the body of the vegetation model and becomes almost consistent at the downstream side of the vegetation. The water-surface profiles reported in this study are useful for understanding the variation in water depth upstream of the defense system under different roughnesses of the dike and moat. This variation in the water depth helps in the precise prediction of the energy backwater rise and dissipation zones. The findings show that the effect of enhanced roughness on water depth significantly increases the upstream water levels and demonstrate the pattern of trade-off between flow attenuation and floodwater storage that would be critical in the optimization of flood control designs and locations. Figure 13 depicts a conceptual infographic illustrating the hydraulic interaction mechanism of the eco-engineered flood defense system under varying roughness conditions.
Backwater rise on the upstream side of the hydraulic structures is significant for evaluating the risk of flooding and the design of mitigation measures [50,51]. Therefore, the measurement of the backwater rise is a major factor in flood control, environmental protection, and the design of infrastructure. This increase in the backwater rise was due to the ponding effect of the dike located at the front end of the defense system, and a similar trend was reported by previous studies [17,18,20].
The presence of the dike increases the water level on the upstream side to a certain extent, followed by the overtopping effect towards the body of the moat. Previous studies conducted by Pasha and Tanaka [14] reported that backwater rise depends on the spacing between adjacent vegetation elements; however, the effect significantly increased with increasing Froude number. Further, Ahmed and Ghumman [20] reported that the backwater rise effect increases with increasing water surface slope within the defense system, which was also observed in this study. The roughness of the structures greatly altered flow behavior by resisting flow due to irregularities and surface disruption [52].
The result signifies that the roughness of the dike and moat provides greater resistance to flow by altering the flow pattern, aligning with findings of the previous study [40,53,54]. Additionally, by increasing the value of Ke to 14.32 mm, it was observed that the backwater rise increased by 16% compared to the scenarios without roughness. This shows that by increasing the roughness of the dike and moat, a significant resistance to the flow is offered, influencing flow patterns from upstream of the dike to the body of the moat (downstream of the dike), and a similar trend was reported in a study conducted by Sherzai et al. [55]. Sherzai et al. [55] reported that the roughness on the slope of the embankment/dike significantly impacts flow velocity and erosive action.
The results obtained on the rise in backwater are of vital importance in the management of flooding risks and infrastructure. The results are useful because they enable engineers to optimize flood defense systems and advance the protection of the flood defense system by quantifying the increased water level of dike–moat–vegetation systems at different levels of flow and roughness. Additionally, the reported 16 percent rise in backwater with higher Froude numbers and roughness values suggested floodwater control and detention by the defense system. This benefits the community, agricultural lands, and urban areas from flooding while at the same time working with environmental concerns. It also advances the significance of cost-effective mitigation responses as it establishes the most cost-effective roughness.
For effective flood management and community protection, it is essential to understand flood energy reduction by minimizing floodwater volume and force, resulting in a reduction in damage to property, infrastructure, agricultural lands, and the displacement of populations [56]. Therefore, the major objective of flood energy reduction through a defense system reported by previous studies was to reduce floodwater velocity and destructive power, thus protecting vulnerable regions [15].
The result suggests that increasing the values of Fr minimizes the effectiveness of the defense system in dissipating floodwater energy, and improving the structure roughness greatly mitigates this reduction. The findings of this study align with previous research indicating that by increasing roughness conditions of the structures, resistance to the flow and turbulence increases, causing higher energy reduction [57]. The decrease in energy dissipation with Fr can be explained by the domination of the inertial regime in the flows that reduces the efficiency of roughness elements to disturb the momentum of the incoming flow [58].
The flow obstructing capability of the dike results in head loss due to redirection or partial obstruction to the flow, causing greater energy reduction in the case of increasing roughness conditions. The moat located at the downstream side of the dike acts as a dissipative basin where most of the energy loss occurs due to the formation of a hydraulic jump and the distribution of kinetic energy along different directions. Further, the vegetation model located downstream of the moat provides additional resistance to the flow, reducing the velocity gradient by enhancing turbulence, as reported by Nepf [59,60]. These effects are experienced more intensively as the Ke increases to form more wakes and vortex wakes, which are one of the major contributors to energy loss.
Nevertheless, the effect of roughness on the hydraulic performance of the defense system at higher Froude numbers aligns with the findings of Choi’s [61], which state that the flow around roughness elements in high-velocity flows tends to smooth out, thereby minimizing drag forces and the energy dissipation associated with them. Therefore, these findings are consistent with the theoretical and experimental work in eco-hydraulics and green infrastructure design, reaffirming that optimized roughness configurations can substantially enhance the performance of defense systems in flood mitigation.
A hydraulic jump is the sudden change (supercritical to subcritical) in flow velocity resulting in greater turbulence and variation in the water surface. A previous study reported that the location of the hydraulic jump depends on the flow conditions [61]. The types of jumps were selected by the range of the Froude number as reported in the previous studies [17,36]. Undular types of jumps usually have small undulations on the water surface and the air bubbles formed at the downstream location of the jump, and a similar trend was observed in the previous research [62,63]. The air bubbles formed within the hydraulic jump were due to air entrainment and a free shear layer in turbulent flow (the transition of high-velocity flow into low velocity), and this mechanism has also been reported in previous studies [64,65].
The result demonstrates that a lower value of roughness does not disrupt intense flow significantly; as a result, no jump formed, while only undulation was observed. The difference observed at Ke = 7.22 mm upon comparing to Ke = 0 was the undulation on the downstream side of the vegetation model, which was not observed in the latter case. This was because a greater water surface slope formed within the vegetation model by the turbulent flow in the case of roughness induced in the body of a moat, and a similar trend was reported by [66]. According to Kazem et al. [66], roughness in a channel significantly alters the flow structure and momentum transfer; therefore, the flow exhibits different characteristics compared to scenarios without roughness.
The formation of air bubbles indicates greater turbulence in the flow, suggesting that the low velocity was high enough to generate a localized pressure zone, resulting in bubble formation [67]. This is a common response of turbulent flows whereby eddies and vortices are generated, disrupting the smoothness of the flow and the generation of visible surface turbulence [68]. The result of this study demonstrates the greater influence of the dike and moat roughness conditions on the formation of the hydraulic jump. Greater roughness of the dike and moat results in an increase in the intensity of the hydraulic jump with air bubbles, promoting energy dissipation of the floodwater.
In real-world applications, moats may not always remain dry, as groundwater seepage or prolonged inundation during flood events can lead to partial or complete water filling. This condition may influence the storage capacity and hydraulic performance of the system. A water-filled moat may enhance energy dissipation through increased flow interaction, but it may also reduce its capacity to store additional floodwater. Therefore, the design of such systems should account for local hydrogeological conditions and groundwater levels.
The dike–moat–vegetation-based defense system proves effective in flood management by enhancing energy dissipation. Hydraulic jumps, observed primarily in the moat, are influenced by roughness and flow conditions. With increasing roughness (Ke), the intensity of jumps, including undular, weak, and oscillating types, increases, generating air bubbles. These bubbles indicate turbulent flow, promoting energy dissipation and helping mitigate flood impacts. The proposed defense system, comprising dike–moat–vegetation, dissipates floodwater energy by the formation of the hydraulic jump, providing an effective flood management approach. Therefore, the findings demonstrate that roughness conditions of the defense system promote greater energy reduction by the formation of undular, weak, and oscillating jumps in the body of a moat, and flow is further reduced by the vegetation models, which aid in mitigating flood damages to local communities.
The transition between various types of hydraulic jumps, including undulated, weak, and oscillating jumps, was due to the significant influence of dike and moat roughness conditions, which result in dissipating floodwater energy in an open channel. Further, researchers also reported that the formation of the hydraulic jump depends on various conditions such as roughness, bed slope, shape of the channel, and flow conditions [69,70]. The findings of the present paper demonstrate that roughness conditions of the dike and moat significantly enhanced energy reduction in the floodwater. Therefore, it is essential to analyze the formation of the hydraulic jump to understand its effectiveness in the design of a sustainable flood risk management framework.
The floodwater was initially restricted by a dike and moat, which created resistance to the flow due to the roughness, thus reducing the velocity of the floodwater. Besides the dike and moat, the vegetation elements located downstream of the moat further enhance resistance to the flow, improving the overall impact of the defense system on floodwater arrival, and a similar trend was studied in a previous study [20,37]. These results emphasize the need to optimize the roughness of the flood defense system to maximize the effectiveness of such a system on flood management. When designed and installed correctly, such defense systems can be of great assistance in preventing the catastrophic effects of flooding, especially in vulnerable locations.
In natural flood conditions, sediment-laden flows can significantly influence hydraulic behavior by modifying bed and structural roughness. The present study employs clear-water conditions to isolate the effects of structural roughness and vegetation on flow dynamics. However, in real-world scenarios, sediment deposition may occur on the surface of dikes and within moats, potentially filling surface irregularities and reducing effective roughness height (Ke). This smoothing effect can decrease flow resistance and turbulence, thereby reducing the defense system’s energy dissipation efficiency of the defense system over time. Conversely, in some cases, sediment accumulation may also create additional roughness depending on deposition patterns and particle sizes. Therefore, the hydraulic performance of eco-engineered flood defenses may evolve dynamically under sediment-laden conditions. Future studies should incorporate mobile bed conditions and sediment transport processes to evaluate the long-term performance and adaptability of such systems under realistic flood scenarios.
While the experimental model follows geometric and Froude similarity, certain scale effects remain unavoidable in physical modeling. In particular, Reynolds number similarity cannot be fully achieved, which may influence viscous effects at smaller scales. Additionally, sediment transport and vegetation flexibility in natural systems are not fully represented in the laboratory setup.
Despite these limitations, the model provides a reliable representation of flow behavior under subcritical conditions, as inertial and gravitational forces dominate the flow dynamics. Therefore, the results apply to real-world scenarios with similar hydraulic conditions, although caution should be exercised when extrapolating to highly turbulent or sediment-laden flows.
While the experimental results provide valuable insights into flow–structure interaction and energy dissipation mechanisms, certain limitations should be acknowledged. The study is based on a laboratory-scale physical model, which inherently introduces scale effects despite maintaining geometric and Froude similarity. In particular, Reynolds number similarity is not fully satisfied, which may influence viscous behavior and turbulence characteristics at smaller scales. Furthermore, the experimental setup assumes a predominantly one-dimensional flow with perpendicular alignment of the defense system relative to the incoming flow. In natural river systems, flow conditions are often three-dimensional, with oblique flow interactions, secondary currents, and channel irregularities influencing hydraulic behavior. Additionally, the study focuses exclusively on subcritical flow conditions (Fr = 0.36–0.60), which are typical of riverine flooding but do not represent extreme supercritical or transitional flow regimes. Therefore, caution should be exercised when extrapolating the findings to highly dynamic or rapidly varying flood conditions.
The regression model developed in this study demonstrates strong predictive performance, as indicated by high NSE values and low RMSE and MAE. However, the dataset used for model development consists of a limited number of experimental observations, which may introduce potential bias in parameter estimation.
Although a training–validation approach was adopted, the relatively small dataset may still pose a risk of overfitting, where the model captures dataset-specific patterns rather than generalized relationships. Despite this, the consistency of model performance across datasets suggests that the model retains reasonable predictive capability. Future work should incorporate larger datasets and additional hydraulic conditions to further validate and generalize the proposed relationship.
The findings of this study provide important insights into the design of eco-engineered flood defense systems, particularly in riverine environments where subcritical flow conditions dominate. The demonstrated influence of surface roughness on energy dissipation suggests that strategic enhancement of roughness elements, such as vegetative barriers and engineered surfaces, can significantly improve flood mitigation performance. However, field conditions are inherently more complex due to the presence of sediment transport, variable channel geometry, flexible vegetation, and unsteady flow. These factors may influence the effectiveness of the defense system differently than observed in controlled laboratory conditions. Therefore, while the results provide a strong conceptual and quantitative basis, field-scale validation is necessary before full-scale implementation.
The results of the present study are consistent with findings from computational fluid dynamics (CFD) studies, which show that increased surface roughness enhances turbulence generation and energy dissipation in open-channel flows. CFD-based investigations have also demonstrated that roughness elements contribute to vortex formation and momentum redistribution, supporting the trends observed in this experimental study.
Similarly, field-scale observations in vegetated floodplains indicate that the presence of natural and engineered roughness elements significantly reduces flow velocity and attenuates flood peaks. The agreement between experimental, numerical, and field-based findings reinforces the reliability of the observed hydraulic behavior.
However, CFD models often use idealized boundary conditions, whereas field studies account for additional complexities, such as sediment transport and vegetation deformation. Therefore, integrating experimental, numerical, and field approaches is essential for developing comprehensive flood management strategies.

5. Conclusions

This research investigated the hydraulic performance of a hybrid flood defense system comprising dikes, a moat, and vegetation under varying surface roughness conditions. The results demonstrate that surface roughness plays a dominant role in controlling flow resistance, turbulence generation, and energy dissipation within the system. Increasing roughness significantly improved flood mitigation performance, with a maximum energy reduction of approximately 75.56% and a delay in floodwater arrival of up to 65%. However, increasing flow intensity (Froude number) reduced system efficiency, highlighting the importance of optimizing roughness under different hydraulic conditions.
  • The novelty of this study lies in systematically quantifying the combined influence of roughness across structural (dikes and moat) and ecological (vegetation) components within a unified experimental framework. Unlike previous studies that focus on individual elements, this work demonstrates the synergistic interaction between these components, leading to enhanced energy dissipation and improved flood attenuation.
  • The observed hydraulic behavior can be explained by the interaction between flow and roughness elements, which increases turbulence intensity, promotes hydraulic jump formation, and reduces flow velocity. The combined effects of dikes, moats, and vegetation create a multi-stage energy dissipation mechanism, resulting in increased backwater storage and delayed flood propagation.
  • The findings demonstrated a significant influence of the dike and moat roughness on the delay in floodwater arrival, enhancing evacuation time and other management measures for the local community. The utilization of the defense system comprising three structures (dike, moat, and vegetation) not only minimizes flow velocity but also improves the stability of the flood defenses. A hydraulic jump formed within the body of the moat further reduces the energy of the floodwater through the sudden change in velocity, while promoting turbulence, which are the most important factors for flood management. The proposed defense system demonstrates its effectiveness in mitigating floodwater energy by increasing the Froude number to 0.52, underscoring the need for careful design to optimize defense systems across various flood scenarios.
  • A regression model proposing the ability to predict the reduction in energy under different roughness conditions and the flow parameters is also one of the main contributions of this study. The developed model attained a large predictive accuracy (NSE = 0.969) with low error (RMSE = 1.25, MAE = 0.956), and the model can be applied to estimate the performance of other flood defense systems in other regions. The sensitivity analysis performed indicated that, among the factors, the most influential factor in determining the reduction in energy is roughness, which thus plays a critical role in flood control solutions. Such observations can help efficiently develop flood defenses that are economical, especially in areas that are prone to floods.
  • The observed enhancement in energy dissipation and delay in floodwater propagation can be attributed to the combined hydraulic effects of surface roughness, structural configuration, and flow interaction within the defense system. Increasing the roughness of the dike and moat surfaces introduces additional resistance to the flow, which disrupts the velocity distribution and promotes turbulence generation. This results in increased momentum exchange and energy loss within the flow. Furthermore, the presence of the moat facilitates the formation of hydraulic jumps, particularly under moderate flow conditions, which act as an efficient mechanism for dissipating kinetic energy. The interaction between the incoming flow and roughness elements leads to the formation of vortices and wake regions, further enhancing energy dissipation. In addition, vegetation located downstream of the moat contributes to flow retardation by increasing drag forces and reducing velocity gradients. The combined effect of these mechanisms leads to a reduction in flow velocity, an increase in backwater storage upstream of the system, and a delay in flood wave propagation. These findings highlight that the improved performance of the hybrid defense system is not solely due to individual components but rather the synergistic interaction between structural roughness, flow regime, and eco-hydraulic processes.
Despite these findings, several limitations should be acknowledged. The study is based on a laboratory-scale physical model, which may introduce scale effects despite maintaining Froude similarity. The experiments were conducted under subcritical flow conditions and assumed perpendicular flow alignment, which may not fully represent complex field conditions. Additionally, sediment transport and vegetation flexibility were not considered, which may influence real-world performance.

Author Contributions

Conceptualization, N.M. and G.A.P.; methodology, N.M.; software, N.M. and G.A.P.; validation, N.M. and G.A.P.; formal analysis, N.M.; investigation, N.M.; resources, G.A.P.; data curation, N.M. and G.A.P.; writing—original draft preparation, N.M.; writing—review and editing, G.A.P.; visualization, N.M. and G.A.P.; supervision, G.A.P. All authors have read and agreed to the published version of the manuscript.

Funding

This research was carried out with funding support from the Punjab Higher Education Commission (PHEC) under the Research and Development Clusters program in the “Water” thematic area.

Data Availability Statement

The data presented in this study are available on request from the corresponding author due to privacy.

Acknowledgments

The authors extend their appreciation to the Civil Engineering Department of the University of Engineering and Technology Taxila for providing the tools required for this research. During the preparation of this review paper, generative AI tools and Grammarly were used to improve language proficiency. The authors take full responsibility for the content of the paper upon publication.

Conflicts of Interest

The authors declare no conflicts of interest.

References

  1. Komolafe, A.A.; Adeyemi, A.B.; Babalola, C.A.; Ebijuoworih, E.J.; Lawal, S.O.; Odedeyi, O.B.; Akande, S.O.; Adegboyega, S.A.-A. Urbanization driven land cover change and floodplain transformation in the Ogun River Basin using HAND and CA-Markov models. Discov. Geosci. 2026, 4, 164. [Google Scholar] [CrossRef]
  2. Jahani, E.; Ullah, F.; Heravi, A. Compound flooding risks in coastal cities: A review of causes, mechanisms, and assessment methodologies. Nat. Hazards 2026, 122, 426. [Google Scholar] [CrossRef]
  3. Talukder, A.; Shahid, S.; Rahman, S.H.; Hwang, S.; Thorp, K.R.; Eshita, N.R.; Rahman, S.M.H.; Shaw, R.; Ibn Mujib, H.; Kamruzzaman, M. Extreme Precipitation Risks in South Asia: Future Climate Change Impacts on Population and Cropland. Int. J. Clim. 2025, 45, e70057. [Google Scholar] [CrossRef]
  4. Loc, H.H.; Park, E.; Chitwatkulsiri, D.; Lim, J.; Yun, S.-H.; Maneechot, L.; Phuong, D.M. Local rainfall or river overflow? Re-evaluating the cause of the Great 2011 Thailand flood. J. Hydrol. 2020, 589, 125368. [Google Scholar] [CrossRef]
  5. Iqbal, A.; Nazir, H. Community perceptions of flood risks and their attributes: A case study of rural communities of Khipro, District Sanghar, Pakistan. Urban Clim. 2023, 52, 101715. [Google Scholar] [CrossRef]
  6. Islam, M.Z.; Wang, C. Cost of high-level flooding as a consequence of climate change driver? A case study of China’s flood-prone regions. Ecol. Indic. 2024, 160, 111944. [Google Scholar] [CrossRef]
  7. Wang, Y.; Cui, P.; Zhang, C.-D.; Zhang, G.-T.; Hao, J.-S.; Yuan, X.; Jiang, Y.-Z.; Wang, L. Antecedent snowmelt and orographic precipitation contributions to water supply of Pakistan disastrous floods, 2022. Adv. Clim. Change Res. 2024, 15, 419–430. [Google Scholar] [CrossRef]
  8. Shamshad Akhtar, S.A. The South Asiatic Monsoon and Flood Hazards in the Indus River Basin, Pakistan. J. Basic Appl. Sci. 2011, 101–115. [Google Scholar] [CrossRef]
  9. Bazai, N.A.; Cui, P.; Hussain, T.; Zhang, G.-T.; Wang, Y.; Akhter, M.G.; Wang, H.; Alam, M. Exploring the roles of recorded unprecedented rainfall-runoff characteristics and uplifted riverbeds in the catastrophic 2022 Pakistan megaflood. Adv. Clim. Change Res. 2025, 16, 409–424. [Google Scholar] [CrossRef]
  10. Rana, I.A.; Bhatti, S.S. Lahore, Pakistan—Urbanization challenges and opportunities. Cities 2018, 72, 348–355. [Google Scholar] [CrossRef]
  11. Deopa, R.; Thakur, D.A.; Kumar, S.; Mohanty, M.P.; Asha, P. Discerning the dynamics of urbanization-climate change-flood risk nexus in densely populated urban mega cities: An appraisal of efficient flood management through spatiotemporal and geostatistical rainfall analysis and hydrodynamic modeling. Sci. Total Environ. 2024, 952, 175882. [Google Scholar] [CrossRef]
  12. Chan, N.W.; Ghani, A.A.; Samat, N.; Hasan, N.N.N.; Tan, M.L. Integrating Structural and Non-Structural Flood Management Measures for Greater Effectiveness in Flood Loss Reduction in the Kelantan River Basin, Malaysia; Springer International Publishing: Cham, Switzerland, 2020; pp. 1151–1162. [Google Scholar] [CrossRef]
  13. Murtaza, N.; Pasha, G.A.; Khan, Z.U.; Alotaibi, S.; Akbar, Z.; Khedher, K.M. Impact of dyke and vegetation on fluid force and moment reduction under sub and supercritical flow conditions. Phys. Fluids 2024, 36, 105196. [Google Scholar] [CrossRef]
  14. Pasha, G.A.; Tanaka, N. Undular hydraulic jump formation and energy loss in a flow through emergent vegetation of varying thickness and density. Ocean Eng. 2017, 141, 308–325. [Google Scholar] [CrossRef]
  15. Murtaza, N.; Pasha, G.A.; Hamidifar, H.; Ghani, U.; Ahmed, A. Enhancing flood resilience: Comparative analysis of single and hybrid defense systems for vulnerable buildings. Int. J. Disaster Risk Reduct. 2025, 116, 105078. [Google Scholar] [CrossRef]
  16. Murtaza, N.; Pasha, G.A.; Tanaka, N.; Ghani, U.; Anjum, N.; Iqbal, K. Analysis of Hydraulic Jump and Energy Dissipation in Flow Through Emergent Vegetation Under Varying Froude Numbers. Iran. J. Sci. Technol. Trans. Civ. Eng. 2024, 49, 2759–2777. [Google Scholar] [CrossRef]
  17. Murtaza, N.; Pasha, G.A.; Tanaka, N.; Hamidifar, H.; Ghani, U.; Ahmed, A. Optimal configuration of a hybrid defense system for hill torrents: An experimental investigation for effective management. Nat. Hazards 2025, 121, 13029–13066. [Google Scholar] [CrossRef]
  18. Iqbal, K.; Ghani, U.; Pasha, G.A.; Murtaza, N.; Ullah, M.K.; Anjum, N. Laboratory investigation of flow behavior in an open channel with emerged porous rigid and flexible vegetation. J. Hydrodyn. 2025, 36, 1181–1199. [Google Scholar] [CrossRef]
  19. Murtaza, N.; Pasha, G.A.; Khan, Z.U.; Khedher, K.M.; Salem, M.A. Assessing Dyke and Moat systems for hydrodynamic reduction in super-critical flow: A laboratory and ANN approach. Innov. Infrastruct. Solut. 2025, 10, 14. [Google Scholar] [CrossRef]
  20. Ahmed, A.; Ghumman, A.R. Experimental Investigation of Flood Energy Dissipation by Single and Hybrid Defense System. Water 2019, 11, 1971. [Google Scholar] [CrossRef]
  21. Pasha, G.A.; Tanaka, N. Characteristics of a Hydraulic Jump Formed on Upstream Vegetation of Varying Density and Thickness. J. Earthq. Tsunami 2020, 14, 2050012. [Google Scholar] [CrossRef]
  22. Anjum, N.; Ghani, U.; Pasha, G.A.; Latif, A.; Sultan, T.; Ali, S. To Investigate the Flow Structure of Discontinuous Vegetation Patches of Two Vertically Different Layers in an Open Channel. Water 2018, 10, 75. [Google Scholar] [CrossRef]
  23. Pasha, G.A.; Asghar, M.; Murtaza, N.; Ghumman, A.R.; Ahmed, A.; Iqbal, K. Impact of floating debris on houses during floods and vegetation-based mitigation. Proc. Inst. Civ. Eng. Water Manag. 2025, 178, 126–141. [Google Scholar] [CrossRef]
  24. Aqeel, M.; Murtaza, N.; Ahmed, W.; Pasha, G.A.; Ghumman, A.R.; Ahmed, A.; Riaz, K.; Zhao, X. Soil erosion on steep hills with varying vegetation patterns. Phys. Fluids 2025, 37, 015130. [Google Scholar] [CrossRef]
  25. Abbass, K.; Qasim, M.Z.; Song, H.; Murshed, M.; Mahmood, H.; Younis, I. A review of the global climate change impacts, adaptation, and sustainable mitigation measures. Environ. Sci. Pollut. Res. 2022, 29, 42539–42559. [Google Scholar] [CrossRef]
  26. Rezzoug, A.; Khan, A.; Murtaza, N.; Rizvi, S.A.S. Predicting flood energy reduction in vegetated open channel: Comparative assessment of hybrid artificial intelligence techniques. Eng. Appl. Artif. Intell. 2025, 159, 111756. [Google Scholar] [CrossRef]
  27. Anjum, N.; Tanaka, N. Study on the flow structure around discontinued vertically layered vegetation in an open channel. J. Hydrodyn. 2020, 32, 454–467. [Google Scholar] [CrossRef]
  28. Anjum, N.; Tanaka, N. Effects of tree crown height on the flow hydrodynamics and tsunami energy reduction around the coastal forest. Landsc. Ecol. Eng. 2024, 20, 495–511. [Google Scholar] [CrossRef]
  29. Ahmed, A.; Valyrakis, M.; Ghumman, A.R.; Pasha, G.A.; Farooq, R. Experimental Investigation of Flood Energy Dissipation through Embankment Followed by Emergent Vegetation. Period. Polytech. Civ. Eng. 2021, 65, 1213–1226. [Google Scholar] [CrossRef]
  30. Ren, W.; Wei, J.; Xie, Q.; Miao, B.; Wang, L. Experimental and Numerical Investigations of Hydraulics in Water Intake with Stop-Log Gate. Water 2020, 12, 1788. [Google Scholar] [CrossRef]
  31. Khan, Z.U.; Khan, D.; Murtaza, N.; Pasha, G.A.; Alotaibi, S.; Rezzoug, A.; Benzougagh, B.; Khedher, K.M. Advanced Prediction Models for Scouring Around Bridge Abutments: A Comparative Study of Empirical and AI Techniques. Water 2024, 16, 3082. [Google Scholar] [CrossRef]
  32. Pasha, G.A.; Tanaka, N. Critical Resistance Affecting Sub- to Super-Critical Transition Flow by Vegetation. J. Earthq. Tsunami 2019, 13, 1950004. [Google Scholar] [CrossRef]
  33. Ahmed, A.; Valyrakis, M.; Ghumman, A.R.; Pasha, G.A.; Farooq, R. Experimental investigation of flood energy reduction through vegetation at various angles. River Res. Appl. 2021, 37, 644–655. [Google Scholar] [CrossRef]
  34. Takemura, T.; Tanaka, N. Flow structures and drag characteristics of a colony-type emergent roughness model mounted on a flat plate in uniform flow. Fluid Dyn. Res. 2007, 39, 694–710. [Google Scholar] [CrossRef]
  35. Lakusic, S. Reference water levels for the design of dykes and earthfill dams. J. Croat. Assoc. Civ. Eng. 2018, 70, 225–233. [Google Scholar] [CrossRef]
  36. Mahtabi, G.; Arvanaghi, H. Experimental and numerical analysis of flow over a rectangular full-width sharp-crested weir. Water Sci. Eng. 2018, 11, 75–80. [Google Scholar] [CrossRef]
  37. Kimiwada, Y.; Tanaka, N.; Zaha, T. Differences in effectiveness of a hybrid tsunami defense system comprising an embankment, moat, and forest in submerged, emergent, or combined conditions. Ocean Eng. 2020, 208, 107457. [Google Scholar] [CrossRef]
  38. Chen, W.; van Gent, M.R.A.; Warmink, J.J.; Hulscher, S.J.M.H. The influence of a berm and roughness on the wave overtopping at dikes. Coast. Eng. 2020, 156, 103613. [Google Scholar] [CrossRef]
  39. Lashley, C.H.; Jonkman, S.N.; van der Meer, J.; Bricker, J.D.; Vuik, V. The influence of infragravity waves on the safety of coastal defences: A case study of the Dutch Wadden Sea. Nat. Hazards Earth Syst. Sci. 2022, 22, 1–22. [Google Scholar] [CrossRef]
  40. Gupta, S.K.; Dwivedi, V.K. Effect of Surface Roughness and Channel Slope on Hydraulic Jump Characteristics: An Experimental Approach Towards Sustainable Environment. Iran. J. Sci. Technol. Trans. Civ. Eng. 2024, 48, 1695–1713. [Google Scholar] [CrossRef]
  41. Niu, C.; Hu, C.; Li, M.; Zhao, L.; Xie, T.; Li, W.; Wen, K.; Dou, S. The influence of roughness in the floodplain of the lower yellow river on water depth and flow velocity of overbank floods. J. Hydrol. Reg. Stud. 2025, 59, 102422. [Google Scholar] [CrossRef]
  42. Benabid, S.; Cherhabil, S.; Ouakouak, A.; Djafri, S.A. Influence of transverse slope and bed roughness on hydraulic jump dynamics: An experimental and theoretical investigation. Multiscale Multidiscip. Model. Exp. Des. 2025, 8, 349. [Google Scholar] [CrossRef]
  43. Cornwell, K.; Hamidullah, S. Geomorphic evidence of catastro g along the middle Indus valley. J. Himal. Earth Sci. 1992, 25, 113–121. [Google Scholar]
  44. Ead, S.A.; Rajaratnam, N. Hydraulic Jumps on Corrugated Beds. J. Hydraul. Eng. 2002, 128, 656–663. [Google Scholar] [CrossRef]
  45. Muhammad, R.A.H.; Tanaka, N. Energy Reduction of a Tsunami Current through a Hybrid Defense System Comprising a Sea Embankment Followed by a Coastal Forest. Geosciences 2019, 9, 247. [Google Scholar] [CrossRef]
  46. Bose, S.K.; Castro-Orgaz, O.; Dey, S. Free Surface Profiles of Undular Hydraulic Jumps. J. Hydraul. Eng. 2012, 138, 362–366. [Google Scholar] [CrossRef]
  47. Akbar, Z.; Murtaza, N.; Pasha, G.A.; Iqbal, S.; Ghumman, A.R.; Abbas, F.M. Predicting scour depth in a meandering channel with spur dike: A comparative analysis of machine learning techniques. Phys. Fluids 2025, 37, 045158. [Google Scholar] [CrossRef]
  48. Tian, L.; Wei, Y.; Wang, S.; Zhang, G.; Zhao, C.; Huang, X.; Huang, W. Method for calculating a water surface profile at the watershed scale with little observed data based on ASTER GDEM: A case study in the Naoli River, northeast China. Front. Environ. Eng. 2024, 3, 1432465. [Google Scholar] [CrossRef]
  49. Kaushik, V.; Kumar, M. Water surface profile prediction in non-prismatic compound channel using support vector machine (SVM). AI Civ. Eng. 2023, 2, 6. [Google Scholar] [CrossRef]
  50. Buddhacharya, R.; Maharjan, S.; Choudhary, R.; Khadka, S.S.; Chaudhary, S. Backwater effect in lowland regions due to bridge structure: A case study of Shreekhandapur, Kavre, Nepal. Proc. Int. Assoc. Hydrol. Sci. 2024, 387, 65–71. [Google Scholar] [CrossRef]
  51. Fei, G.; Wang, X. A review of large wood dynamics relevant to hazard characteristics for built structures. Geomorphology 2024, 453, 109152. [Google Scholar] [CrossRef]
  52. Kadivar, M.; Tormey, D.; McGranaghan, G. A review on turbulent flow over rough surfaces: Fundamentals and theories. Int. J. Thermofluids 2021, 10, 100077. [Google Scholar] [CrossRef]
  53. Sikora, M.; Bohdal, T.; Tandecka, K.; Kacalak, W.; Mathia, T.G. The Effect of Channel Surface Roughness on Two–Phase Flow Patterns: A Review. Energies 2024, 17, 5483. [Google Scholar] [CrossRef]
  54. Liu, C.; Li, Y.; Zhou, Z.; Wiśniewski, P. Effect of Cascade Surface Roughness on Boundary Layer Flow Under Variable Conditions. Front. Energy Res. 2022, 9, 818828. [Google Scholar] [CrossRef]
  55. Sherzai, J.H.; De Costa, R.; Tanaka, N. Effects of Roughness of an Embankment Slope or Application of a Geo-Grid or Moat on Scouring Phenomena Downstream of an Embankment. Arab. J. Sci. Eng. 2023, 48, 4769–4784. [Google Scholar] [CrossRef]
  56. Todini, E. Understanding and Mitigating Urban Flood Risk. Hydrology 2025, 12, 146. [Google Scholar] [CrossRef]
  57. Aberle, J.; Järvelä, J. Flow resistance of emergent rigid and flexible floodplain vegetation. J. Hydraul. Res. 2013, 51, 33–45. [Google Scholar] [CrossRef]
  58. Kim, D.; Yeo, I.W. Flow Visualization of Transition from Linear to Nonlinear Flow Regimes in Rock Fractures. Water Resour. Res. 2022, 58, e2022WR032088. [Google Scholar] [CrossRef]
  59. Nepf, H.M. Flow and Transport in Regions with Aquatic Vegetation. Annu. Rev. Fluid Mech. 2012, 44, 123–142. [Google Scholar] [CrossRef]
  60. Yamasaki, T.N.; Jiang, B.; Janzen, J.G.; Nepf, H.M. Feedback between vegetation, flow, and deposition: A study of artificial vegetation patch development. J. Hydrol. 2021, 598, 126232. [Google Scholar] [CrossRef]
  61. Chow, V.T. Open Channel Hydraulics; McGraw-Hill Education: Columbus, OH, USA, 2021; Available online: https://books.google.com.pk/books/about/Open_channel_Hydraulics.html?id=JAj7swEACAAJ&redir_esc=y (accessed on 11 August 2025).
  62. Wüthrich, D.; Shi, R.; Chanson, H. Hydraulic jumps with low inflow Froude numbers: Air–water surface patterns and transverse distributions of two-phase flow properties. Environ. Fluid Mech. 2022, 22, 789–818. [Google Scholar] [CrossRef]
  63. Ohtsu, I.; Yasuda, Y.; Gotoh, H. Flow Conditions of Undular Hydraulic Jumps in Horizontal Rectangular Channels. J. Hydraul. Eng. 2003, 129, 948–955. [Google Scholar] [CrossRef]
  64. Chanson, H.; Murzyn, F. Froude Similitude and Scale Effects Affecting Air Entrainment in Hydraulic Jumps. In Proceedings of the World Environmental and Water Resources Congress 2008, Honolulu, HI, USA, 12–16 May 2008; American Society of Civil Engineers: Reston, VA, USA, 2008; pp. 1–10. [Google Scholar] [CrossRef]
  65. Valero, D.; Felder, S.; Kramer, M.; Wang, H.; Carrillo, J.M.; Pfister, M.; Bung, D.B. Air–water flows. J. Hydraul. Res. 2024, 62, 319–339. [Google Scholar] [CrossRef]
  66. Kazem, M.; Afzalimehr, H.; Sui, J. Characteristics of Turbulence in the Downstream Region of a Vegetation Patch. Water 2021, 13, 3468. [Google Scholar] [CrossRef]
  67. Gualtieri, C.; Chanson, H. Physical and numerical modelling of air-water flows: An Introductory Overview. Environ. Model. Softw. 2021, 143, 105109. [Google Scholar] [CrossRef]
  68. Ali, S.A.; Khan, N.M.; Sarwar, M.K.; Zaffar, M.W.; Tariq, A.U.R.; Ullah, U.; Abbas, Y. Hydraulic investigation of flows at high-head overflow spillway with multiple aerators: A physical and numerical study of Mohmand Dam, Pakistan. AQUA Water Infrastruct. Ecosyst. Soc. 2024, 73, 1725–1740. [Google Scholar] [CrossRef]
  69. Omid, M.H.; Varaki, M.E.; Narayanan, R. Gradually expanding hydraulic jump in a trapezoidal channel. J. Hydraul. Res. 2007, 45, 512–518. [Google Scholar] [CrossRef]
  70. Parsamehr, P.; Farsadizadeh, D.; Dalir, A.H.; Abbaspour, A.; Esfahani, M.J.N. Characteristics of hydraulic jump on rough bed with adverse slope. ISH J. Hydraul. Eng. 2017, 23, 301–307. [Google Scholar] [CrossRef]
Figure 1. Experimental setup adopted in the present research: (a) laboratory flume used; (b) schematic diagram of experimental setup; (c) instruments used in this research; (d) roughness induced on the body of the dike and moat.
Geohazards 07 00073 g001aGeohazards 07 00073 g001b
Figure 2. Selected components of the defense system: (a) vegetation conditions; (b) dike and moat conditions.
Geohazards 07 00073 g002
Figure 3. Various types of roughness induced in the body of the dike and moat.
Geohazards 07 00073 g003
Figure 4. Schematic diagram of energy reduction through the defense system, where h, h1, h2, and ∆h are the water depth without the defense system, water depth on the upstream side of the defense system, water depth on the downstream side of the defense system, and backwater rise, where EGL represents the Energy Grade Line, and HGL represents the Hydraulic Grade Line.
Geohazards 07 00073 g004
Figure 5. Workflow diagram illustrating the experimental design, data acquisition, and regression-based model development for predicting energy reduction in a dike–moat–vegetation flood defense system. The workflow progresses from laboratory experiments under varying flow and roughness conditions to measurement of hydraulic responses and parameter extraction, and finally to regression modeling, performance evaluation, and application for flood mitigation analysis.
Geohazards 07 00073 g005
Figure 6. Variation in water surface profile along the channel under different roughness conditions of the dike and moat: (a) Ke = 0 mm, (b) Ke = 7.22 mm, (c) Ke = 14.32 mm, and (d) Ke = 24.47 mm. The horizontal axis represents the longitudinal distance from the reference origin, while the vertical axis shows the flow depth. The profiles illustrate the influence of increasing surface roughness on upstream water level rise and flow resistance within the defense system. The legend represents different Froude number conditions (Fr = 0.36–0.60). Increasing roughness results in higher water surface elevations due to enhanced resistance and turbulence.
Geohazards 07 00073 g006aGeohazards 07 00073 g006b
Figure 7. Backwater rise upstream of the defense system under varying hydraulic and roughness conditions: (a) absolute backwater rise (∆h) and (b) relative backwater rise (∆h/h). The plots show the relationship between Froude number (Fr) and backwater rise for different roughness values (Ke = 0, 7.22, 14.32, and 24.47 mm). Each curve corresponds to a specific roughness condition (Ke). The increase in ∆h with Fr and Ke indicates enhanced flow resistance and upstream water accumulation. Error bars represent measurement variability.
Geohazards 07 00073 g007
Figure 8. Energy reduction (%) through the defense system as a function of Froude number under varying roughness conditions (Ke = 0, 7.22, 14.32, and 24.47 mm). The figure illustrates the combined effect of flow regime and surface roughness on energy dissipation efficiency. The legend distinguishes different roughness levels. Higher roughness results in greater energy dissipation, while increasing Froude number reduces dissipation efficiency due to dominant inertial effects.
Geohazards 07 00073 g008
Figure 9. Observed hydraulic jump types within the moat region under different roughness and flow conditions: (a) undular jump (UJ), (b) weak jump (WJ), and (c) oscillating jump (OJ). The images illustrate variations in flow structure, turbulence intensity, and air entrainment. UJ, WJ, and OJ denote undular, weak, and oscillating jumps, respectively. The formation of each type depends on the Froude number and roughness condition, influencing turbulence generation and energy dissipation.
Geohazards 07 00073 g009
Figure 10. Result of energy loss due to hydraulic jump, indicating energy loss by undular, weak, and oscillating hydraulic jump.
Geohazards 07 00073 g010
Figure 11. (a) Schematic representation of residential locations along the Indus River (scaled model representation), and (b) delay in floodwater arrival (%) under varying roughness conditions of the defense system. The results highlight the effectiveness of roughness in increasing floodwater travel time. The bars represent different roughness conditions (Ke). Increased roughness enhances flow resistance, resulting in greater delay in floodwater propagation.
Geohazards 07 00073 g011
Figure 12. (a) Comparison between predicted and observed energy reduction values using the developed regression model, (b) sensitivity analysis showing the influence of input parameters (Fr, ∆h/h, and Ke) on energy reduction, and (c) contribution of individual input parameter to energy reduction. The diagonal line in (a) represents perfect agreement. In (b), each curve shows the effect of varying one parameter while keeping others constant, highlighting the dominant role of roughness.
Geohazards 07 00073 g012
Figure 13. Conceptual infographic illustrating the hydraulic interaction mechanism of the eco-engineered flood defense system under varying roughness conditions. Increasing roughness of the dike and moat enhances turbulence generation, hydraulic jump formation, and flow resistance, resulting in greater energy dissipation, backwater rise, and delay in floodwater arrival, thereby improving flood mitigation performance.
Geohazards 07 00073 g013
Table 1. Experimental and hydraulic conditions adopted in the present research.
Case IDh (m)Q (m3/s)FrKe (mm)G/dd (m)
10.0450.00710.360, 7.22, 14.32, 24.472.130.003
20.0650.00880.400, 7.22, 14.32, 24.472.130.003
30.0730.01040.440, 7.22, 14.32, 24.472.130.003
40.080.01180.480, 7.22, 14.32, 24.472.130.003
50.0860.01290.520, 7.22, 14.32, 24.472.130.003
60.090.0140.560, 7.22, 14.32, 24.472.130.003
70.0960.0140.600, 7.22, 14.32, 24.472.130.003
Table 2. Summary of different types of hydraulic jump observed in this study.
RoughnessFroude Number
0.360.400.440.480.520.560.60
0UJUJUJNJNJNJNJ
7.22 mmUJUJUJUJNJNJNJ
14.32 mmWJWJUJUJUJUJNJ
24.47 mmWJOJWJUJUJUJUJ
NJ: no jump, UJ: undular jump, WJ: weak jump, and OJ: oscillating jump.
Disclaimer/Publisher’s Note: The statements, opinions and data contained in all publications are solely those of the individual author(s) and contributor(s) and not of MDPI and/or the editor(s). MDPI and/or the editor(s) disclaim responsibility for any injury to people or property resulting from any ideas, methods, instructions or products referred to in the content.