Article

Machine Learning and Morphometric Analysis for Evaluating the Vulnerability of Tundra Landscapes to Thermokarst Hazards in the Lena Delta: A Case Study of Arga Island

V.S. Sobolev Institute of Geology and Mineralogy, Siberian Branch of the Russian Academy of Sciences, 630090 Novosibirsk, Russia
GeoHazards 2025, 6(2), 31; https://doi.org/10.3390/geohazards6020031
Submission received: 3 April 2025 / Revised: 9 June 2025 / Accepted: 9 June 2025 / Published: 13 June 2025

Abstract

:
Analyses of thermokarst hazard risk are becoming increasingly crucial in the context of global warming. A significant aspect of thermokarst research is the mapping of landscapes based on their vulnerability to thermokarst processes. The exponential growth of remote sensing data and the advent of novel techniques have paved the way for the creation of sophisticated techniques for the study of natural disasters, including thermokarst phenomena. This study applies machine learning techniques to assess the vulnerability of tundra landscapes to thermokarst by integrating supervised classification using random forest with morphometric analysis based on the Topography Position Index. We recognized that the thermokarst landscape with the greatest potential for future permafrost thawing occupies 20% of the study region. The thermokarst-affected terrains and water bodies located in the undegraded uplands account for 13% of the total area, while those in depressions and valleys account for 44%. A small part (6%) of the study region represents areas with stable terrains within depressions and valleys that underwent topographic alterations and are likely to maintain stability in the future. This approach enables big geodata-driven predictive modeling of permafrost hazards, improving thermokarst risk assessment. It highlights machine learning and Google Earth Engine’s potential for forecasting landscape transformations in vulnerable Arctic regions.

1. Introduction

The analysis of atmospheric and earthly conditions reveals a trend towards an increase in global temperatures [1]. The past ten years have been the warmest in recorded history, with all ten of the hottest years occurring within this period (2014–2023) [1]. Simultaneously, the rate of increase in the average surface temperature in the Arctic region is approximately twice the global average rate [2]. With the increasing global temperature, there have been significant changes to Arctic ecosystems and landscapes [2,3,4,5]. Permafrost degradation, which covers 22% of the land area in the Northern Hemisphere, has been exposed to extensive degradation due to climate change [6]. This phenomenon presents significant risks to human life and infrastructure [7].
The degradation of permafrost is manifested through various processes that are related to the melting of frozen ground. Due to the complex nature of the interactions between these processes and the fact that they often occur simultaneously, we employ the term “thermokarst” in a comprehensive manner in accordance with [8]. In other words, in this study, the term “thermokarst” is used to describe all processes that change landforms as a result of permafrost degradation. The activation of thermokarst processes could have significant consequences for Arctic ecosystems and infrastructure. Consequently, it has become increasingly important to localize thermokarst-affected areas, assess the intensity of thermokarst processes, and predict the resulting landscape transformations [9,10,11,12,13]. The analysis of remotely sensed data is a highly effective means of achieving these tasks.
Permafrost degradation is associated with a range of surface features and processes that can be identified and monitored through satellite imagery over time and space [14]. By observing these target characteristics, it is possible to assess the state of permafrost [10,14]. In particular, thermokarst processes have an impact on the paths of ecosystem evolution particularly with regard to soil, vegetation, and hydrological conditions. [15,16,17]. The distinct spectral signatures of different landscapes in satellite imagery enable thermokarst mapping through remote sensing (RS). For example, classification techniques can be used to identify areas that are undergoing thermokarst activity.
Today, the analysis of RS data has become one of the most significant methods for permafrost research [13,18,19]. The Landsat, Sentinel, and other space missions have generated an extensive collection of images, which are now accessible to researchers [19,20]. Satellite imagery resolutions are continually advancing with the launch of additional satellites. The advancement of analysis methods, particularly the use of machine learning (ML) techniques, also simplifies the GIS analysis and mapping process [18,19,20]. ML algorithms operate by analyzing data and generating forecasts or making choices without significant human intervention. Another significant aspect of the development of RS analysis is the emergence of cloud-based technology. This technology allows for the investigation of large volumes of RS data and the identification of temporal and spatial trends in landscape changes. Moreover, it provides a free opportunity for cloud computing for researchers. Google Earth Engine (GEE) represents a cloud computing platform offering specialized services for geospatial analysis and earth science study [21,22,23]. Numerous recent studies demonstrate how researchers are utilizing ML techniques on the GEE to investigate permafrost and Arctic landscape mapping [24,25,26,27]. Therefore, the study proceeded on the basis that (1) it is an important task to localize thermokarst-affected areas, (2) thermokarst processes manifest themselves in changes to the land cover, and (3) current advances in the analysis of RS data make it possible to identify and assess these.
Thus, this study aims to map Arctic tundra landscapes based on their level of vulnerability to thermokarst processes by means of supervised classification and morphometric analysis. We conducted mapping on the territory of Arga Island, situated in the Lena Delta. Arga Island’s primary composition consists of periglacial terrains and its distinctive geographical location, along with specific geological and geomorphological features, make it a notably interesting area.
The study itself consisted of the following stages: First, we prepared the data by selecting cloud-free satellite imagery, creating indices, normalizing all used bands, and finally creating the composite image. The second stage involved recognizing the land cover (LC) classes that are relevant to various stages of the thermokarst process. Furthermore, training polygons were manually delineated for each land cover class. In stage three, we conducted random forest classification of the composite and evaluated its accuracy. The fourth stage involved calculating the topographic position index (TPI) and analyzing the spatial distribution of LC classes within positive and negative TPI values. Finally, we created a map that not only illustrates the present condition of thermokarst terrains on Arga Island but also enables the prediction of the possible future development of these landscapes in the study area.

2. Materials and Methods
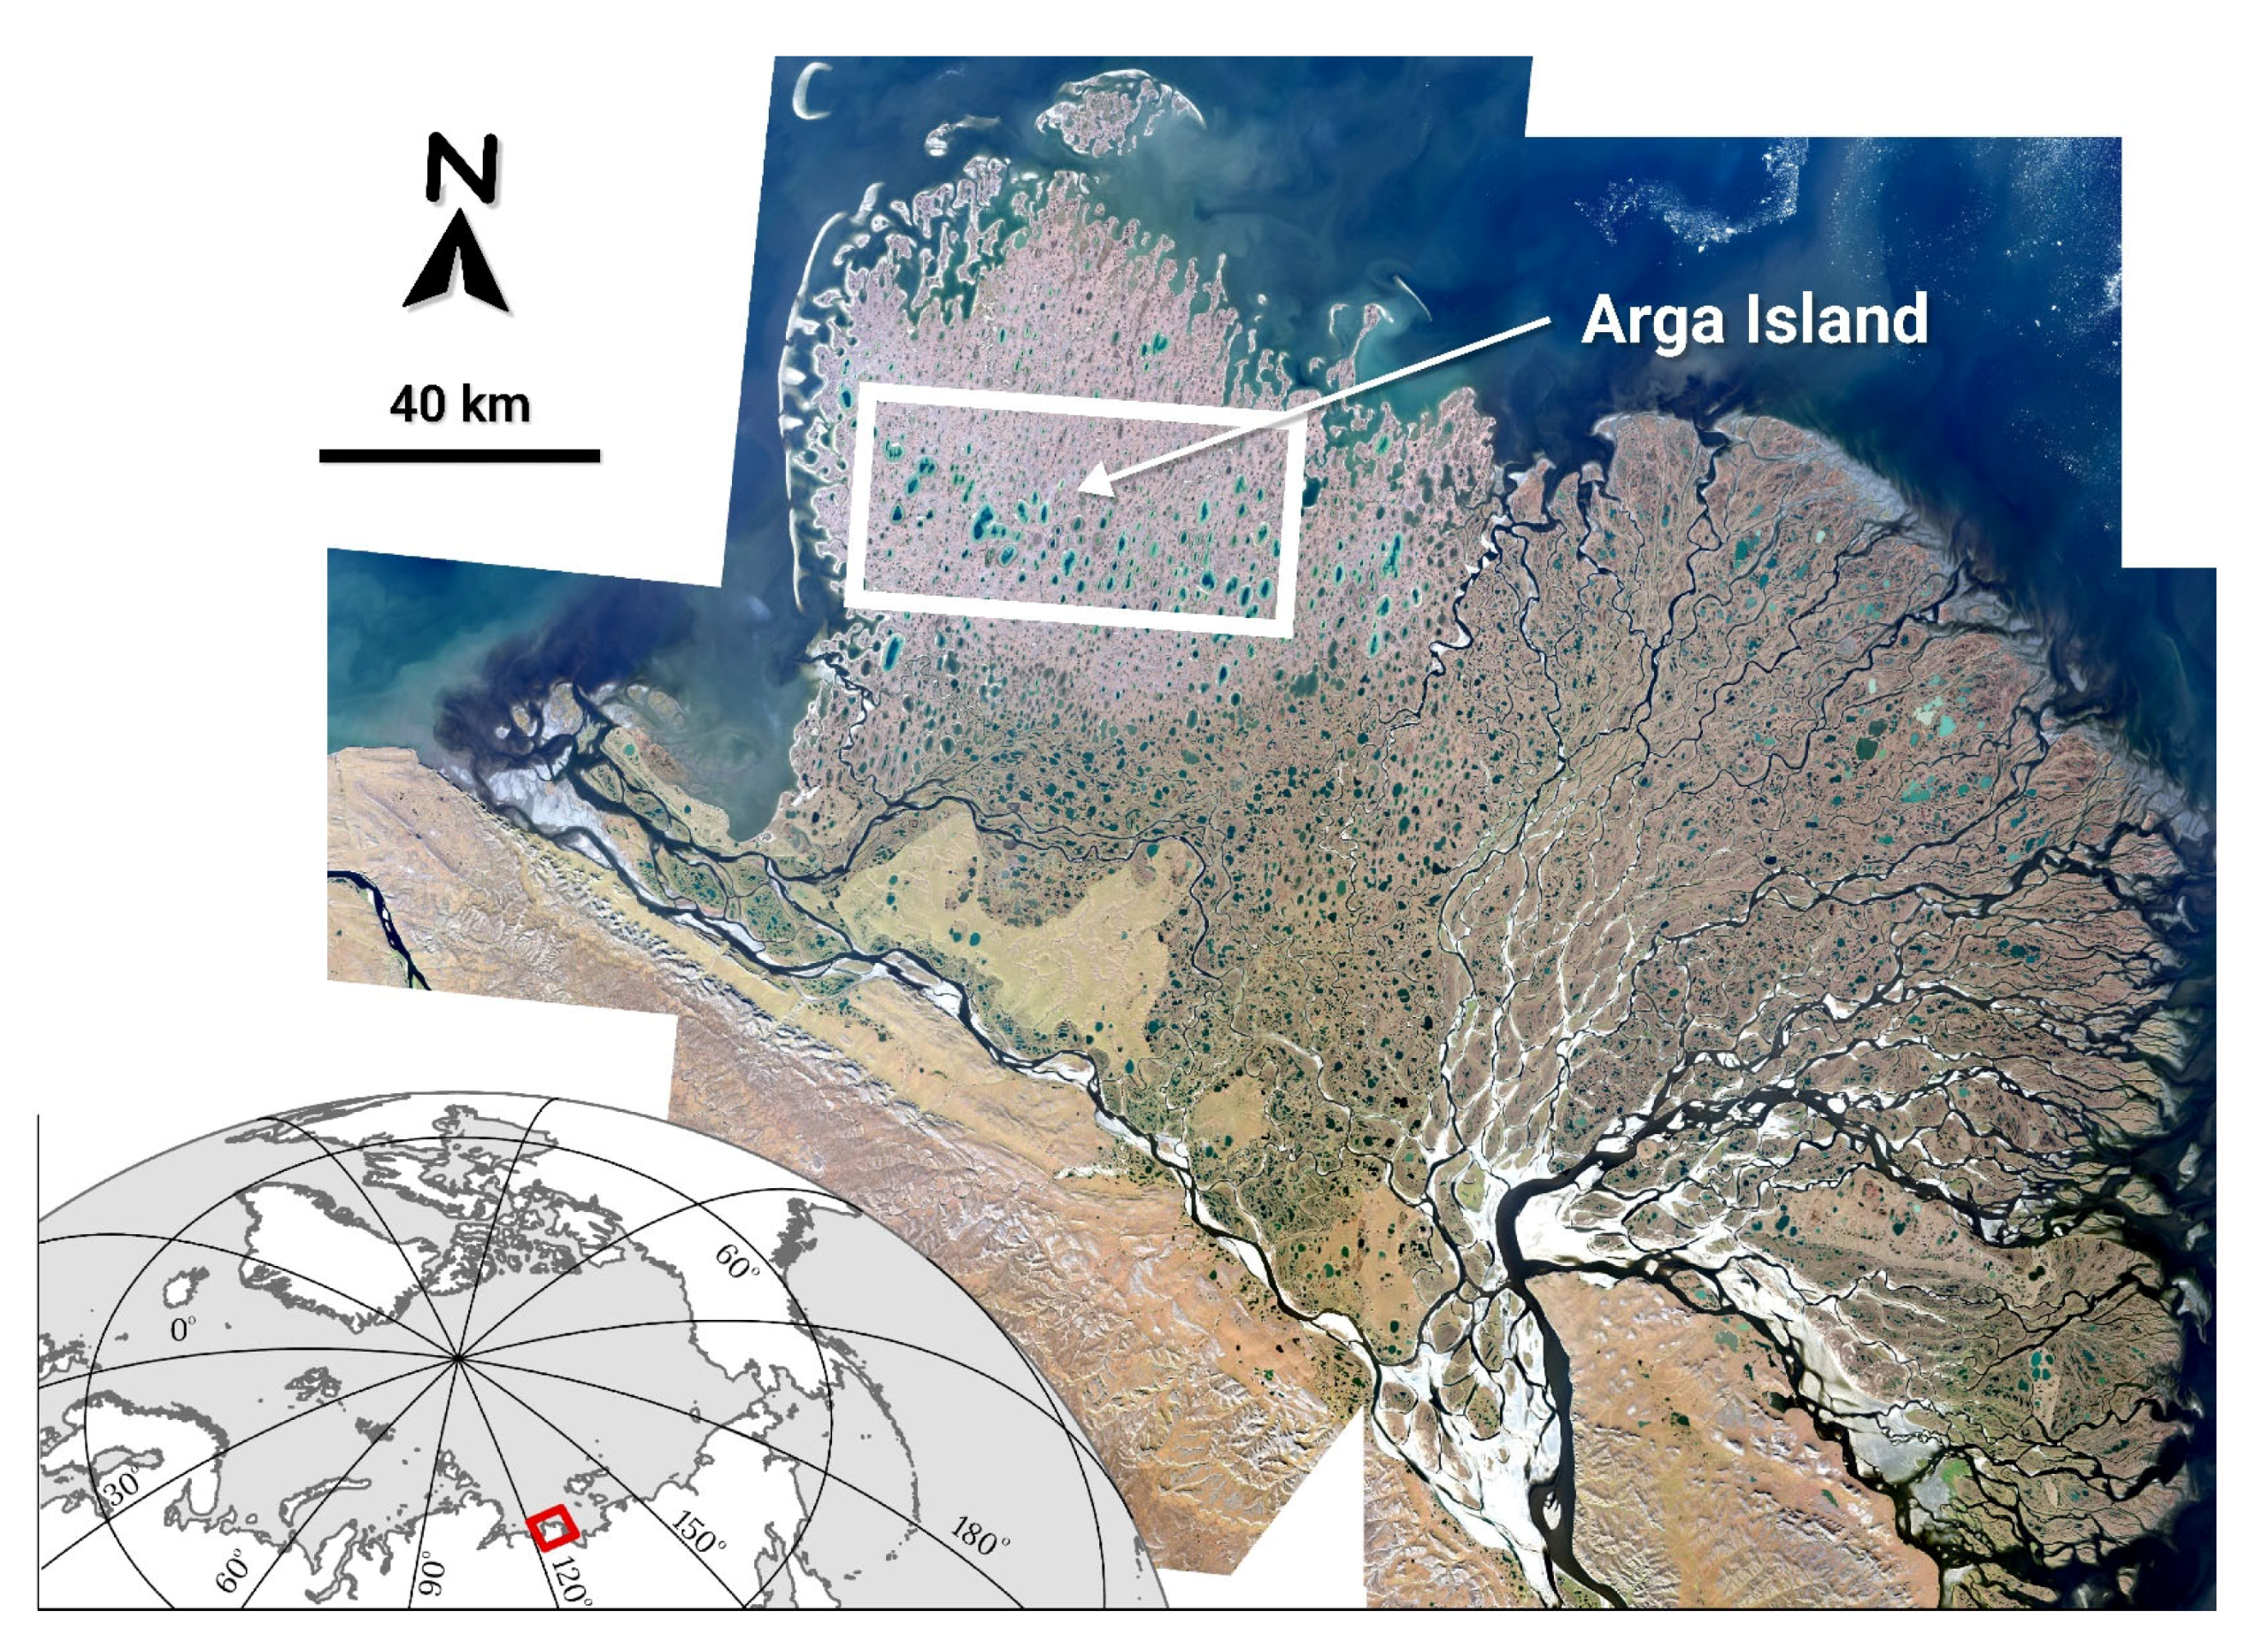
2.1. Study Area

The study area was selected in the central part of Arga Island, which is situated in the northwestern region of the Lena Delta (Figure 1). According to numerous previous studies, the Lena Delta consists of three terraces. They all have different ages and a unique number of landforms and comprise various deposits [28,29,30,31,32]. Arga Island belongs to the second terrace. It should be noted that the area of the Lena Delta is influenced by ongoing tectonic activity [29,30,33,34,35]. This has resulted in differences in the elevation of terraces above sea level and the development of a distinct topography. Consequently, the current tectonic activity contributes to the deterioration of permafrost, and it is one of the reasons for the variations in the geomorphological characteristics of different islands.
Arga Island has an elevation of 10–30 m above sea level and is characterized by a limited number of landforms, including flat upland plains, thermal erosion valleys, and thermokarst depressions. In addition, numerous sub-meridional thermokarst lakes are located within depressions [28,36]. The polygonal microrelief is less distinct compared to other platforms [28]. The depth of the permafrost in this region ranges from 400 to 1000 m [35]. The active layer in the Arga sediments is approximately 20 to 40 cm thick, and its cryostructure is massive with thin, polygonal ice wedges [28]. Fluvial deposits, which have a fine grain size and do not contain silt, clay, or organic matter, constitute the island across the entire area [28,36]. Histosols and inceptisols are the predominant soil types on Arga Island [37]. Generally, “dry” conditions are prevalent on Arga Island, in accordance with the past land cover analysis of the Lena Delta [38]. The habitat map of the Lena Delta indicates that the majority of the study area is covered by “dwarsh shrub-herb communities” [39]. Currently, the northern coastal region of Middle Siberia is undergoing rapid warming, and numerous observations indicate that these areas are experiencing significant hydrological changes [40,41]. Boike and colleagues presented a detailed description of the climate conditions in the Lena Delta in reference [40].
Thus, Arga Island presents an ideal location for the development of a method for GIS mapping of thermokarst landscapes and the identification of previously undiscovered patterns in the evolution of thermokarst landforms. The island is located at the interface between the continent and the sea, and its terrain is particularly vulnerable to the effects of climate shifts. Modern tectonic and permafrost degradation processes simultaneously influence the landscapes of Arga Island. Consequently, novel correlations between the island’s geology, contemporary tectonic processes, and permafrost degradation-related physical phenomena could be established. LC mapping of Arga Island is facilitated by the uniformity of thermokarst landforms and generally flat topography. Additionally, the restricted quantity of LC classes in the study area simplifies the mapping process. Moreover, Arga Island is not accessible for fieldwork, making the analysis of RS data the only approach of monitoring landscape and environmental changes in a substantial portion of the largest Arctic delta. To minimize coastal marine effects, we studied a rectangular region covering the island’s interior, excluding near-shore areas.

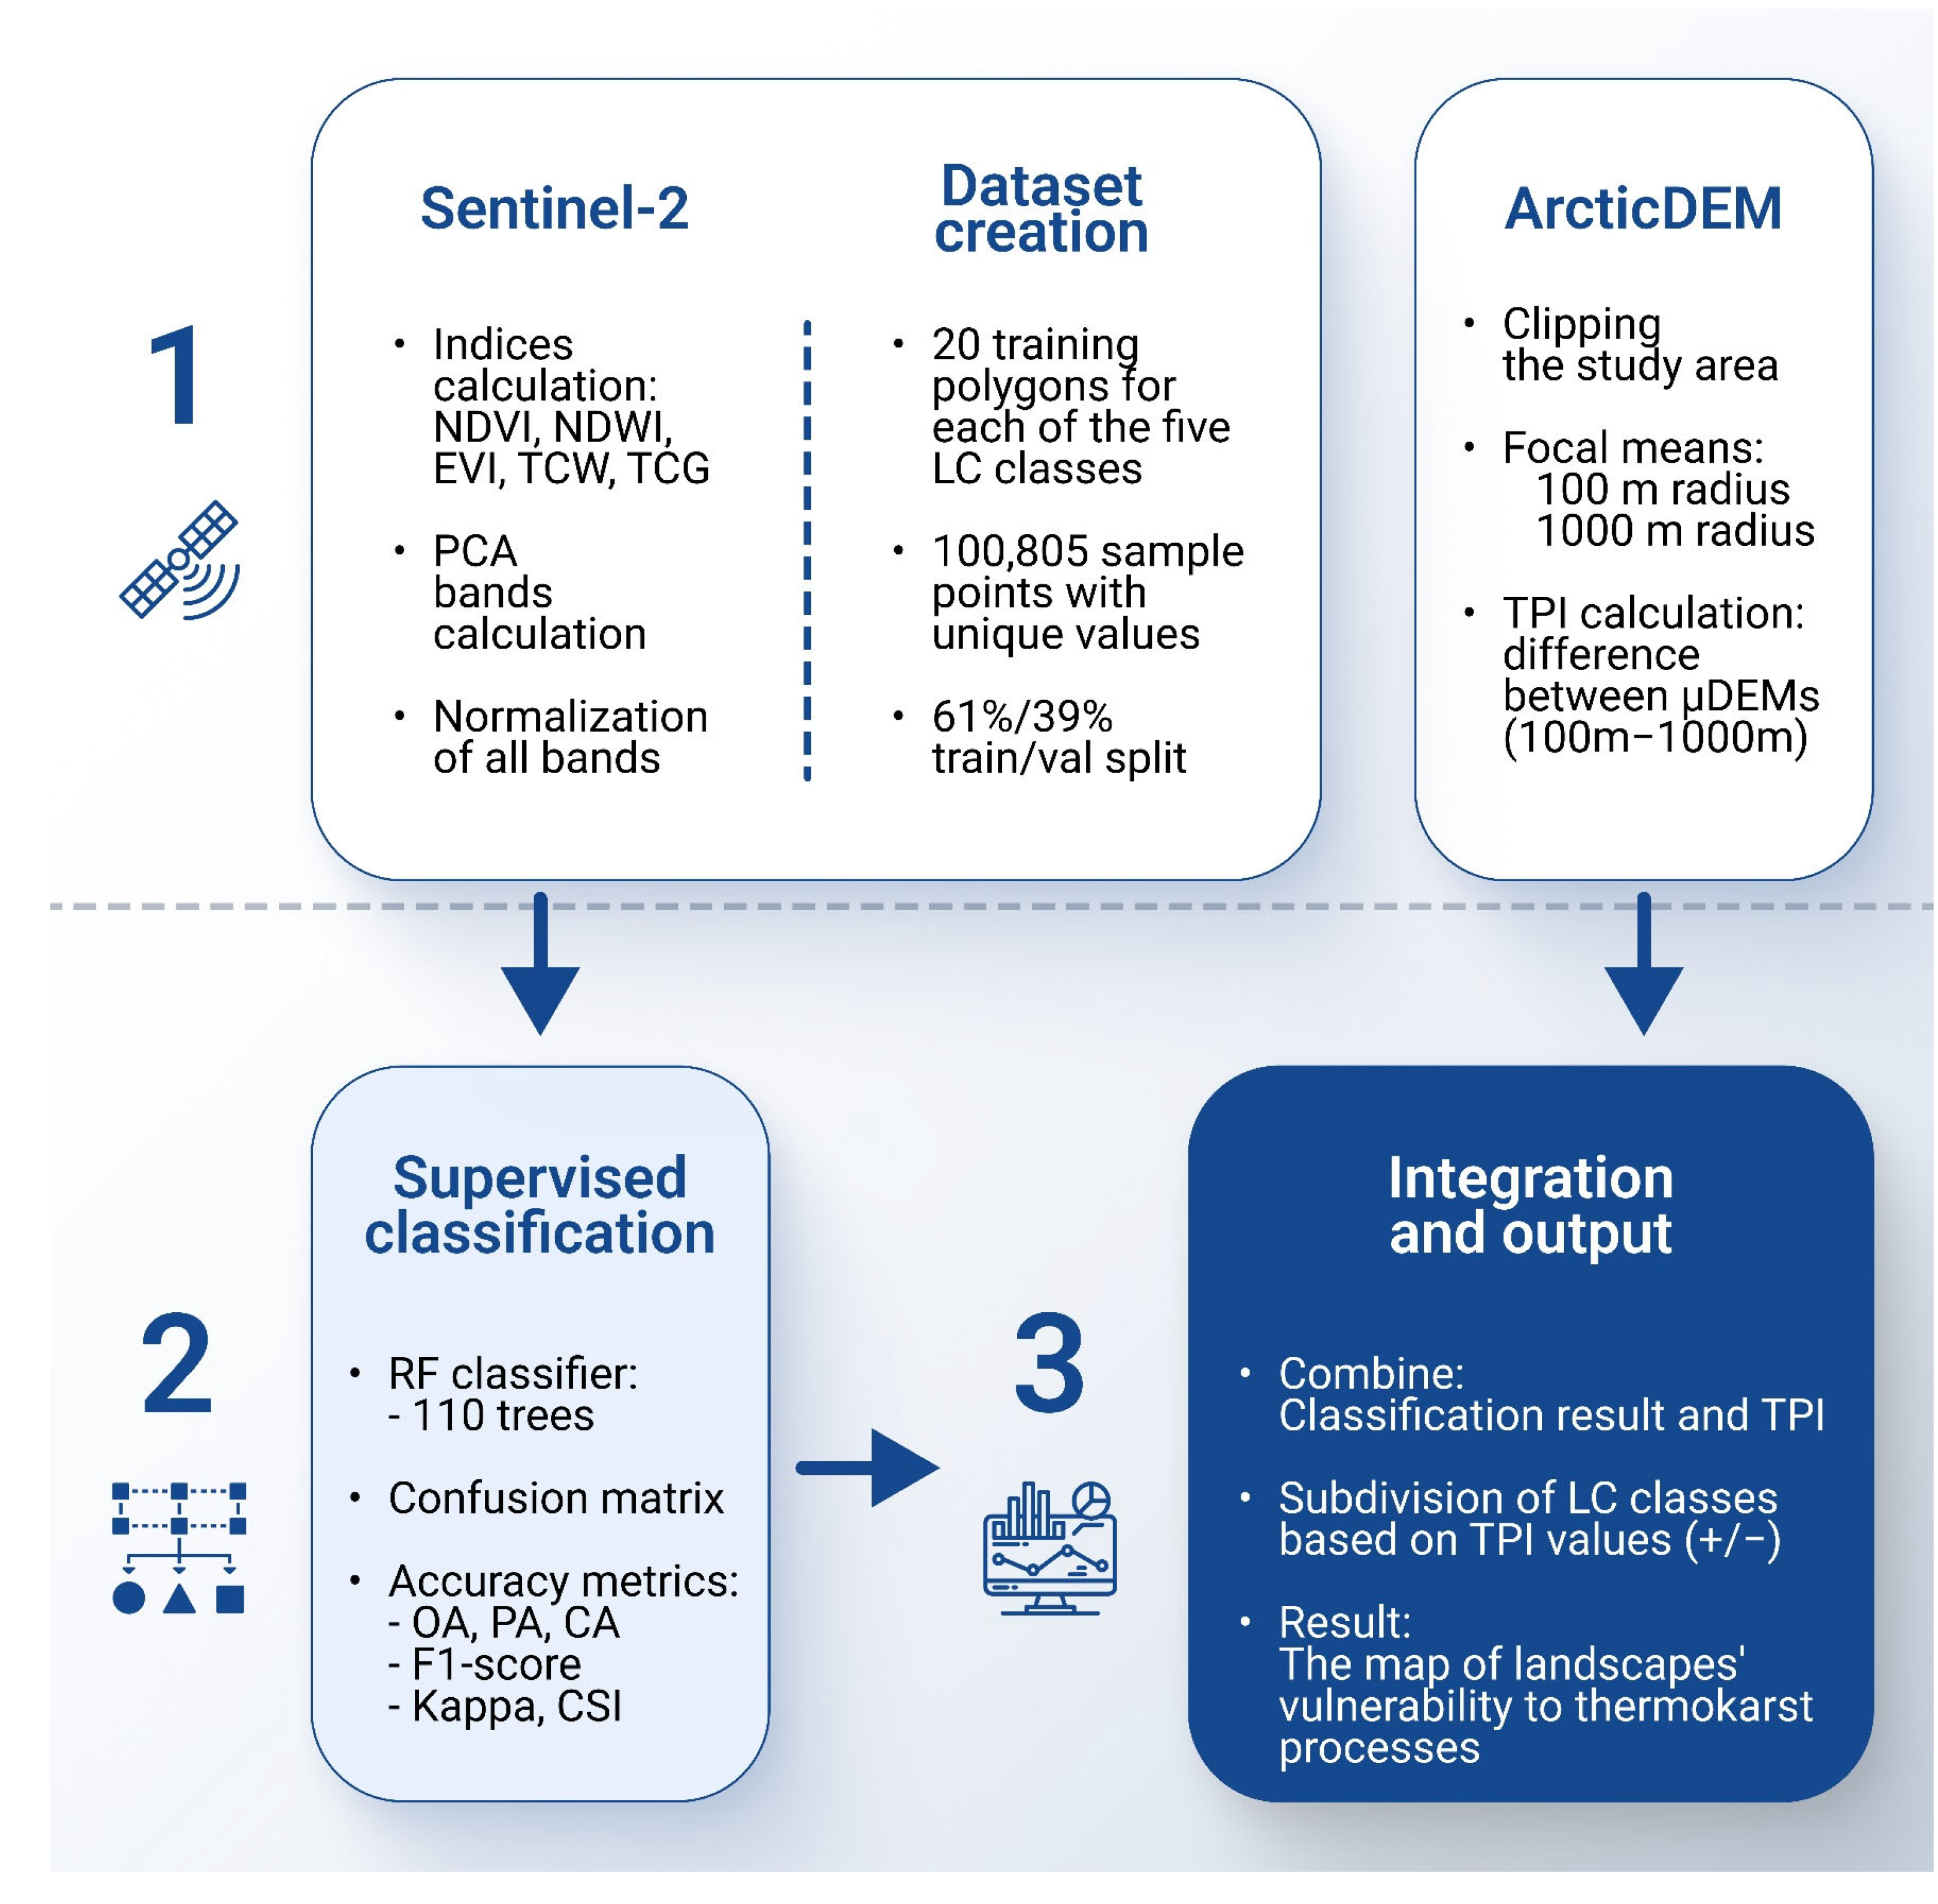
2.2. Data Processing

The whole process of data preparation, including the creation of vector polygons and data collection, were carried out on the GEE platform. The primary data source for the study was the Sentinel-2 (Level-2A) image (Table 1), which was selected after filtering out cloud coverage. The image with the most suitable characteristics for our purposes was the cloud-free Sentinel-2 satellite image taken on 29 July 2021.
Thermokarst processes have a significant impact on the spectral characteristics of the Earth’s surface by altering vegetation cover and hydrological conditions. Due to this, we calculated several indices that can reflect these changes. The following spectral indices were calculated and added to the dataset: NDVI [43], NDWI [44], and EVI [45] (Table 2). The results of the Tasseled Cap transformation for wetness (TCW) and greenness (TCG) were also included in the analysis [46,47] (Table 2). The NDVI is a commonly employed spectral index for assessing the conditions of plant cover. The EVI was added to improve the ability to detect changes in vegetation and to complement the information provided by the NDVI [45]. The use of TCG provides a more detailed understanding of vegetation changes due to its ability to distinguish various aspects of vegetation reflectivity [48]. The TCW and NDWI were used as indicators of the presence of water on the surface and soil moisture levels [47]. In the final stage of data processing, the original spectral bands of the Sentinel-2 image were normalized and combined with calculated indices to form a single composite image. The application of principal component analysis (PCA) yielded three statistically independent spectral bands. The first three PCA bands were incorporated into the dataset after normalization. Hence, the obtained dataset comprises normalized Sentinel-2 Level-2A channels; calculated indices including the NDVI, NDWI, EVI, TCW, and TCG; as well PCA results: PCA1, PCA2, and PCA3.

2.3. Supervised Classification and Its Accuracy Estimation

In the previous study, the mapped LC classes were described in detail [50]. We simplified the categorization of thermokarst terrains and established common categories that can be associated with the level of permafrost degradation. Essentially, our LC classification focused on surface types corresponding to intact permafrost, previously degraded permafrost, and areas exhibiting active degradation during the observation period. Therefore, the territory was classified into the following five LC classes: water bodies, stable terrains, thermokarst-affected terrains, slopes, and blowouts. The visual representations of LC classes and a demonstration of their differences in spectral characteristics are provided in our previous research as well [50]. To conduct the supervised classification, 20 training polygons were manually mapped for each LC class. A total of 100,805 unique sample points were then identified within the mapped training polygons. Finally, the final dataset was split into two subsets: a training set (61%) and a validation set (39%).
The GEE platform empowers users to employ a variety of ML approaches that are frequently employed for land use and land cover mapping. We opted for the random forest classifier for our study owing to its extensive application in the field of LC classification. This choice was made based on the classifier’s versatility, resilience, and its frequent superior performance [25,51]. The foundations of this method are explained in [52,53]. Random forest is an ensemble method that trains numerous decision trees, each on a random data sample and feature subset. The model’s final prediction is derived by aggregating the individual tree predictions: selecting the prevalent category label for categorization or averaging the predicted values for regression [53]. The model integrates the outcomes of each individual tree in the ensemble to generate the final prediction.
An accuracy assessment of all models was conducted with the aim of comparing them based on metrics derived from a confusion matrix (CM). The CM was calculated using the ee.Classifier.confusionMatrix() method of GEE. This method was employed to compare the anticipated outcomes with the results obtained from the validation dataset after the classifier was trained and the dataset as classified. As a result, the following metrics were calculated for the classifier’s accuracy. The overall accuracy (OA) was computed as the ratio of correctly classified instances (true positives plus true negatives) to the total number of validation samples [54,55]. Subsequently, the recall (producer’s accuracy, PA) was determined by dividing the number of correctly classified pixels in a specific class by the count of pixels in that category [54,55]. Precision (consumer’s accuracy, CA) was calculated as true positive pixels divided by all pixels predicted to be in the class [54,55]. The F1 score was then determined by calculating the harmonic mean between the precision and recall metrics [56]. Finally, the Kappa coefficient was calculated in order to determine the level of agreement between multiple measurements of accuracy [57]. In addition, the classification success index (CSI) was calculated as a metric designed specifically to evaluate classification performance [58,59]. This metric was calculated as the sum of recall and precision minus one.

2.4. Morphometric Analysis

This study primarily focuses on integrating supervised classification results with morphometric analysis [60,61]. TPI is a technique for categorizing terrain based on the elevation of each data point in relation to its surrounding area. If a point is higher than its surroundings, the index will be positive, as in the case of ridges and hilltops. Conversely, if a point is lower than its surroundings, the index will be negative, as in the case of valleys. In general, TPI is calculated as the difference between the values from a digital elevation model (DEM) and the mean DEM. The ArcticDEM, a high-resolution and high-quality digital surface model of the Arctic, was used in reference [62]. It features a 2 m spatial resolution. Two raster images were generated from the original ArcticDEM dataset using the ee.Image.focalMean function. These were the mean DEM values calculated in moving windows with radii of 100 and 1000 m, respectively. Finally, a TPI image was generated that contains both positive and negative values through the calculation of the difference between mean DEM values. The overall research workflow is illustrated in Figure 2.

3. Results and Discussion

3.1. Classification Result and Accuracy Assessment

In our previous study, the RF method was used for classification [50]. In this study, we simplified the classification process and did not select specific bands of the composite image. This was not necessary as the number of training points was significantly reduced by selecting only unique instances. Therefore, we utilized all bands during the supervised classification process. Band importance evaluation identified B1 (8.9%) as the most significant spectral channel. Other bands with a high level of importance were PCA2, B12, B11, and PCA1, with relative importance values of 7.5%, 6.8%, 6.2%, and 5.8%, respectively. Furthermore, several calculations were conducted to determine the lowest possible number of trees in the classifier that would produce the highest level of accuracy. While the overall accuracy was comparable across all tested tree counts, the classifier with 110 trees demonstrated the highest accuracy, reaching 98.62%. The recall and precision metrics achieved 98.64% and 98.63%, respectively. The overall F1 score, Kappa coefficient, and CSI were 98.62, 98.28, and 97.27, respectively. As a result (Figure 3), a map of LC classes was obtained.
This map illustrates the current state of the thermokarst landscape on Arga Island. However, upon closer examination, there are certain specific aspects of the map that should be highlighted (Figure 4). For example, the classifier mapped some areas within thermokarst depressions as stable terrain class. This means that these areas underwent a complete degradation process and have now reached a state of stability. On the other hand, thermokarst-affected terrains, initially identified in depression areas, were also detected across upland surfaces. This suggests that thaw processes have already begun in previously stable uplands, indicating their vulnerability to advancing permafrost degradation. Thus, stable terrains and thermokarst-affected terrains can be split into four subclasses each. They are stable thermokarst terrains; thermokarst-affected terrains that are currently undergoing degradation; thermokarst-affected uplands; and stable, non-degraded uplands. However, we should utilize morphometric analysis in order to conduct these divisions. It was necessary to identify uplands and thermokarst depressions and valleys of the analyzed region.
The spatial distribution LC classes within the hypsometric categories of relief also indicate a correlation between them (Figure 5). The stable terrains correspond to the highest elevations, and their area decreases as the elevation diminishes. Conversely, the area of thermokarst-affected terrains increases as elevation decreases. Therefore, the observation of the classification results and statistics of the mapped LC classes in relation to topography informed the further morphometric study.

3.2. TPI

The TPI was used to identify uplands and thermokarst landforms such as depressions and valleys. The TPI image was generated by calculating the difference between the mean DEMs that were generated using moving window radii of 100 and 1000 m (Figure 6a). The analysis of the spatial distribution of LC classes within positive and negative TPI value ranges revealed significant differences between these areas (Figure 6b). Stable terrains are typically associated with positive TPI values, while thermokarst-affected areas and water bodies tend to be concentrated in depressions and valley areas, which are identified by negative TPI values. The resulting TPI map demonstrates the localization of areas with positive and negative TPI values (Figure 6c).

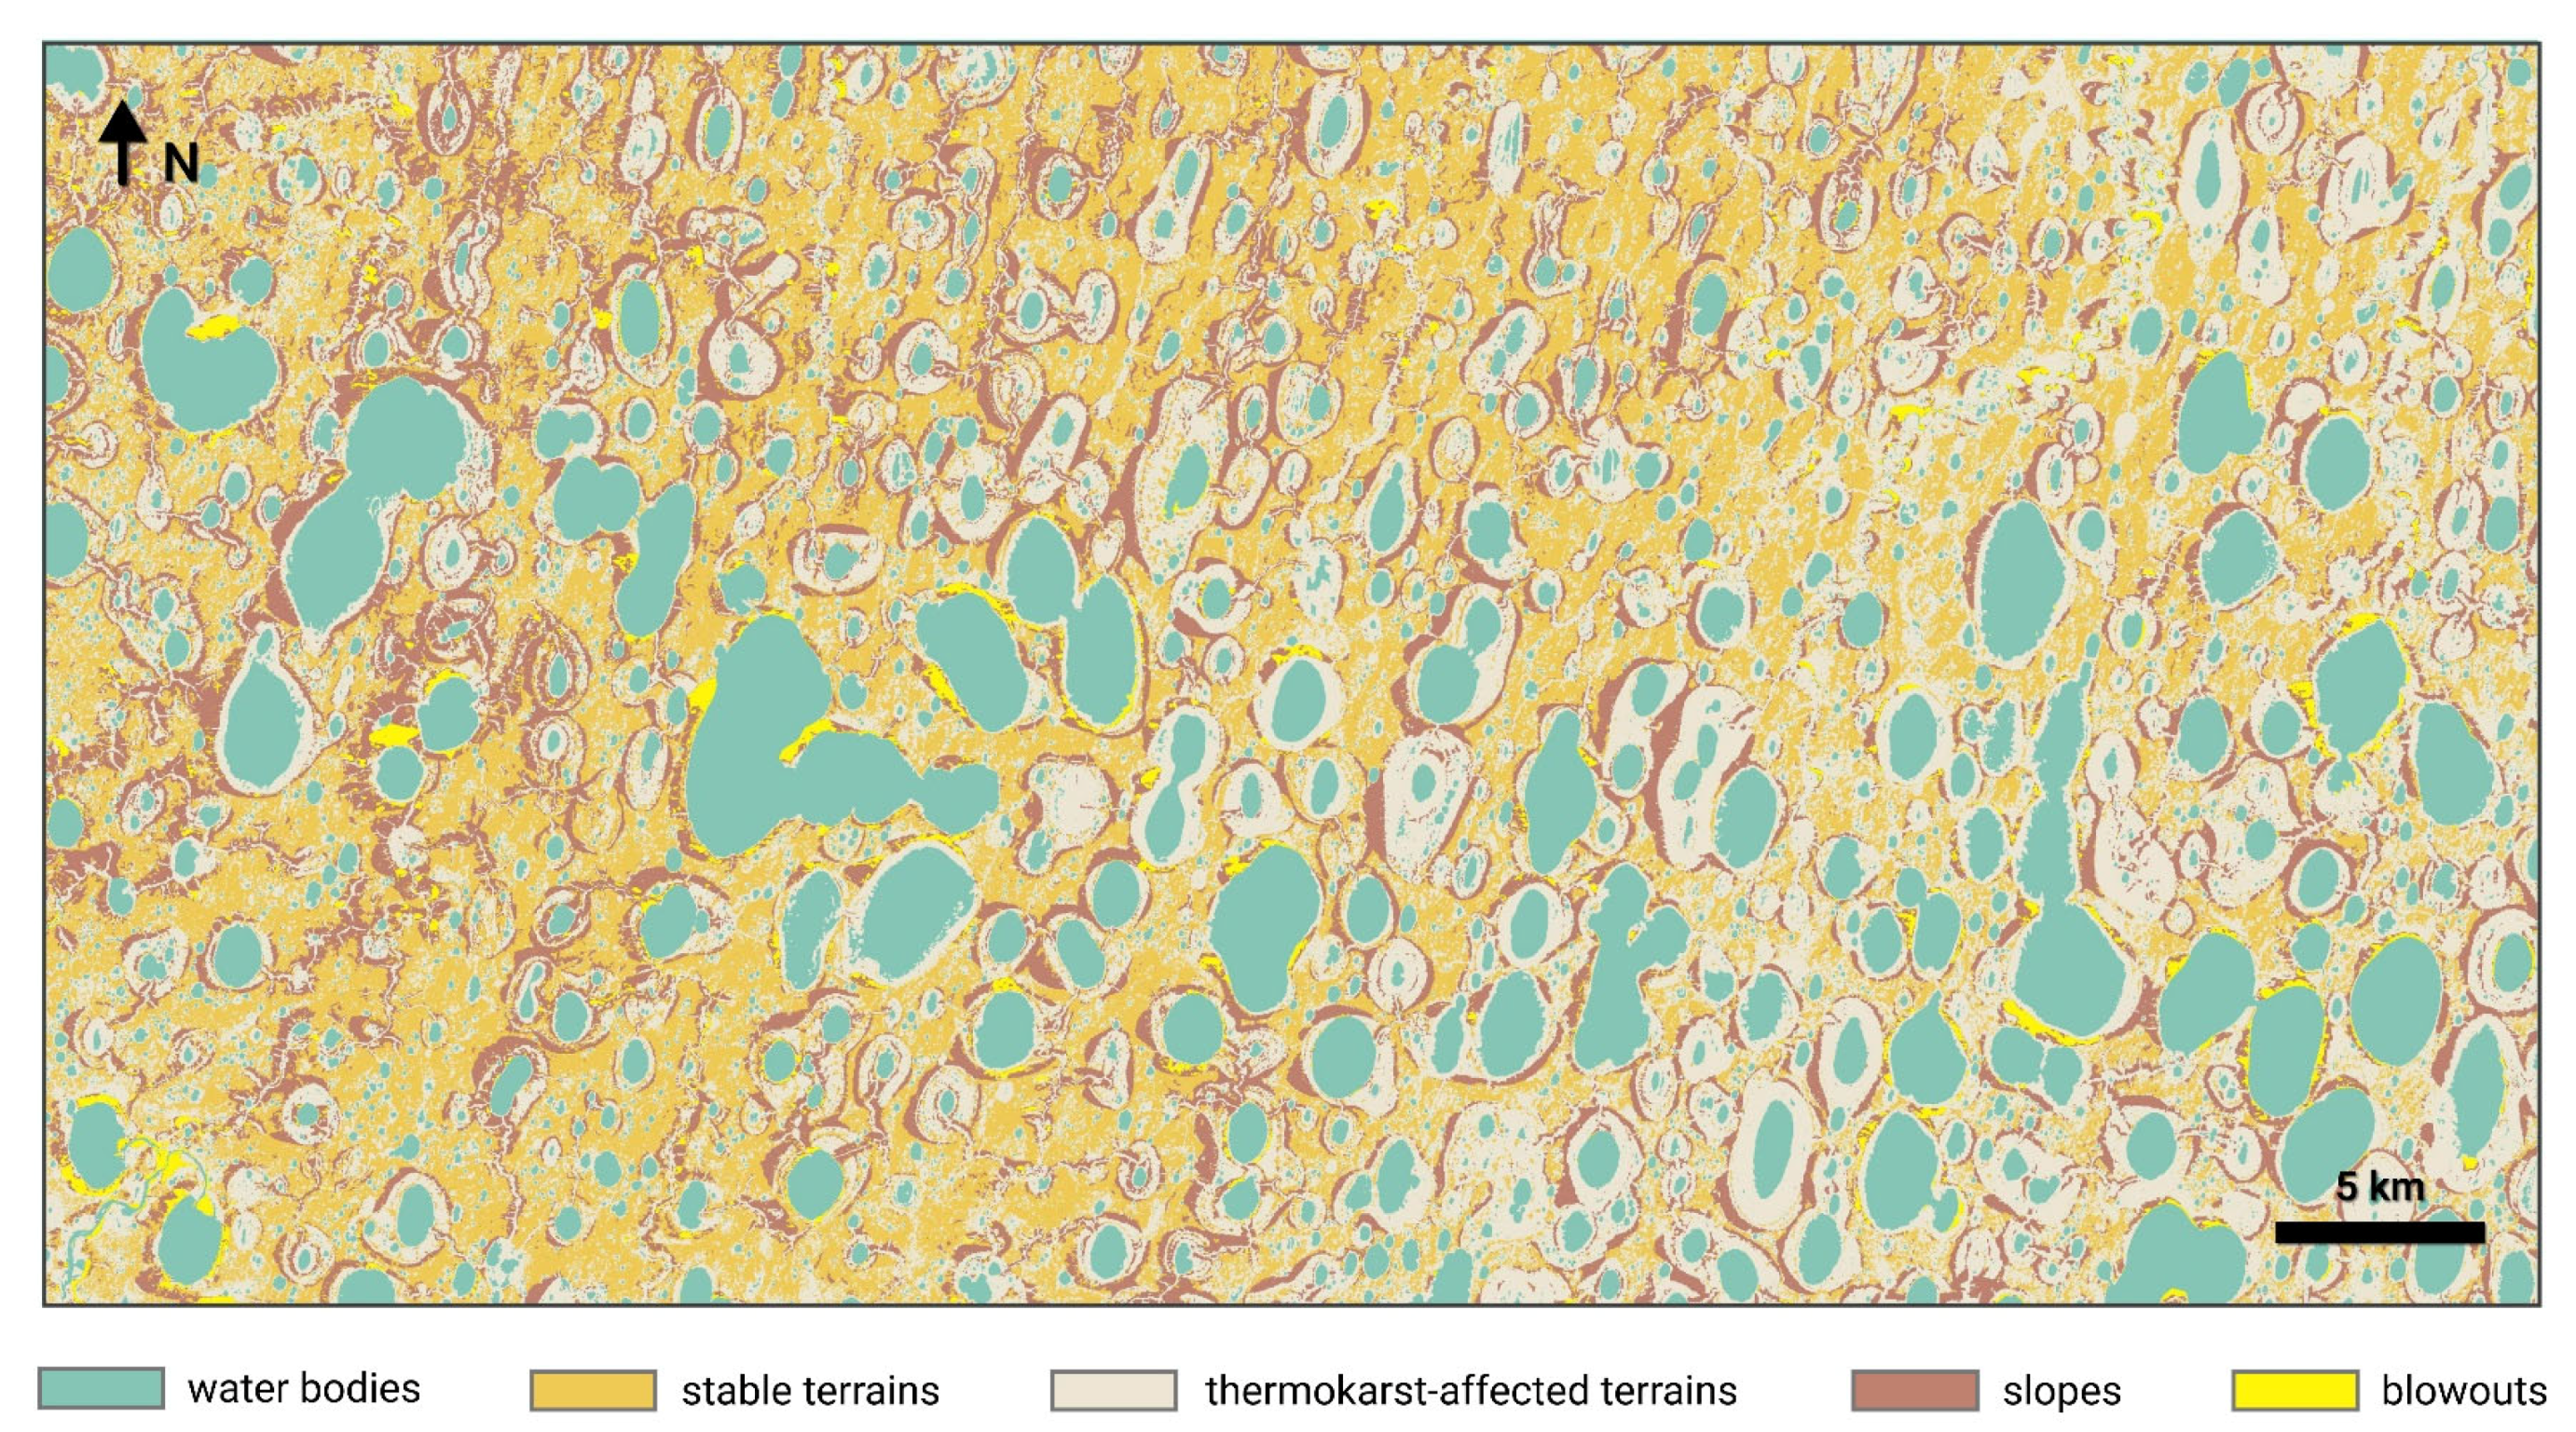
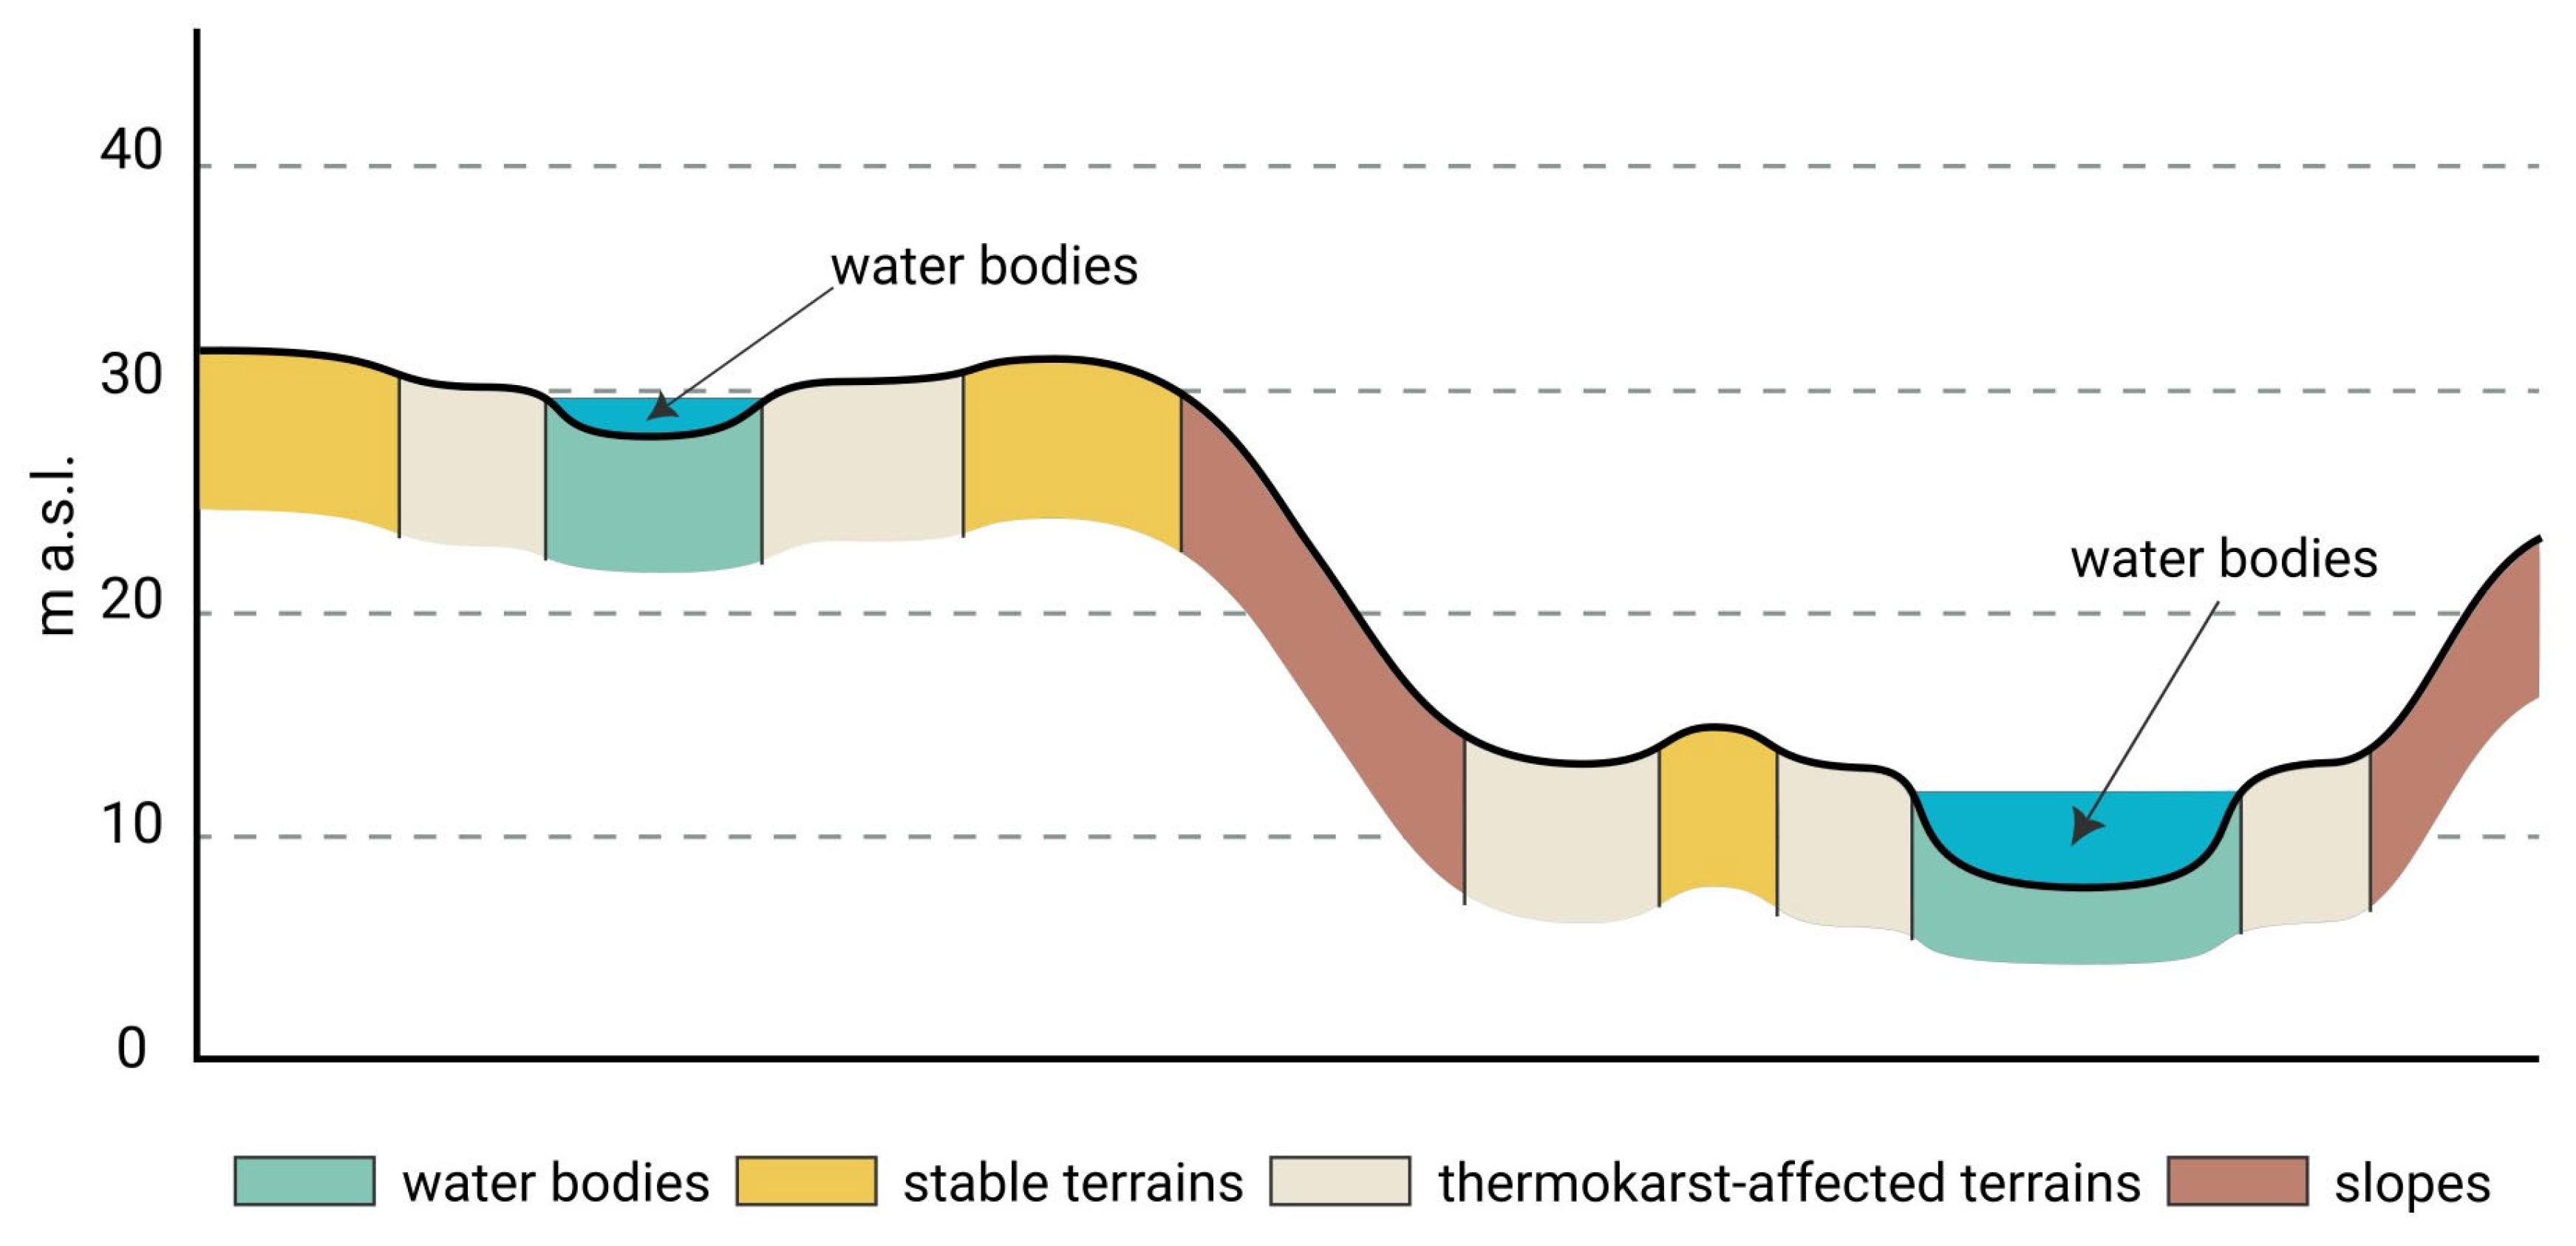
3.3. The Mapping of Areas Based on Their Vulnerability to Thermokarst Processes

In the final stage of our study, we identified the level of vulnerability of areas within the analyzed territory to thermokarst processes. In order to achieve this goal, we combined the results of supervised classification and morphometric analysis. This enabled us to determine the sequence of LC transformation under the influence of the thermokarst process and map areas that correspond to different stages of landscape evolution. Thus, we divided the stable and thermokarst-affected terrains into categories based on their TPI values. The stages of landscape evolution and the corresponding final map categories, along with their estimated areas, are presented below (Figure 7).
1.
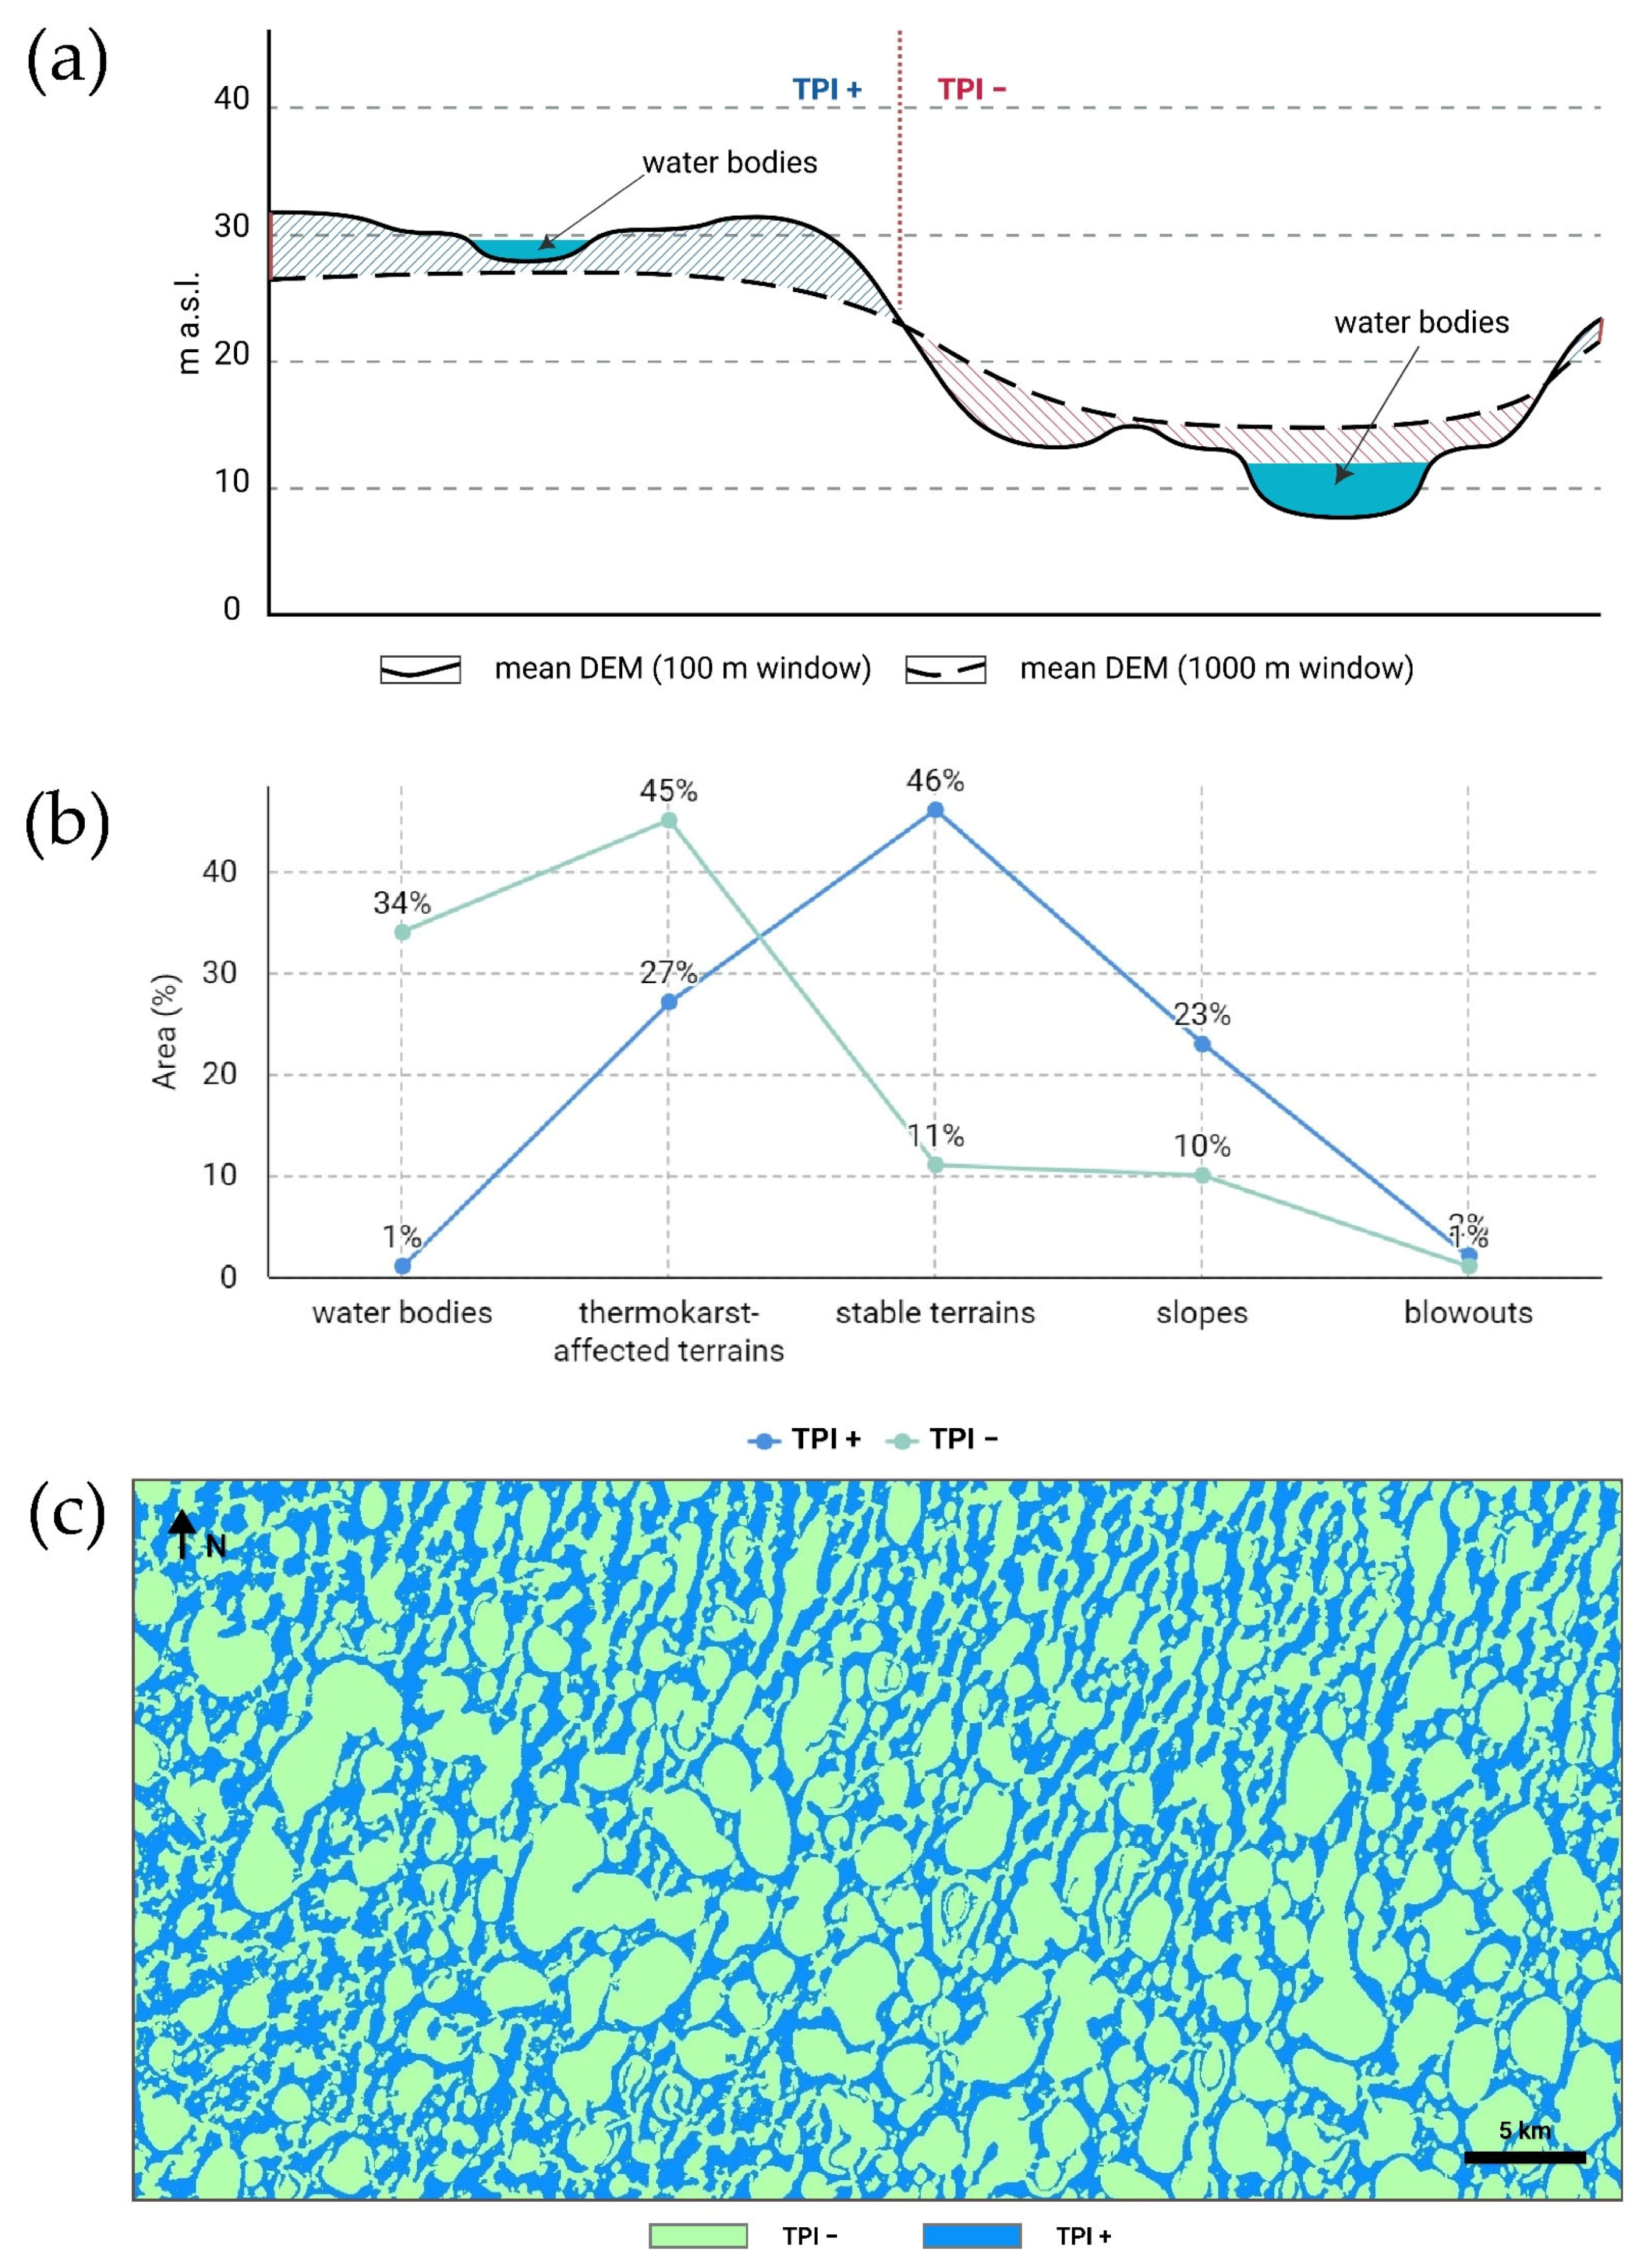
The areas of stable terrains in the undegraded uplands (with positive TPI values) are relevant to the first stage of landscape evolution. The thermokarst processes in this area are not currently active. However, these areas have the highest potential for future permafrost degradation and associated landscape changes. Our estimation indicates that around one fifth of the analyzed area is relevant to this first stage of landscape evolution.
2.
The thermokarst-affected terrains and water bodies in the undegraded uplands (with positive TPI values) concern the second stage. These areas have already begun to experience the effects of thermokarst activity, although the considerable degradation of permafrost has not yet occurred. Based on the area estimation, approximately 13% of the study area is covered by these terrains. We can reasonably expect that these areas will undergo significant changes in the near future, and they are hotspots of permafrost degradation.
3.
The thermokarst-affected terrains and water bodies in the depressions and valleys (negative TPI values) refer to the third stage. They occupy a substantial amount of the study area (44%). A significant portion of the permafrost deposits have already been degraded in these areas. Nonetheless, thermokarst processes continue to occur within these territories, and the landscape has not yet reached a finished condition.
4.
The stable terrains within the depressions and valleys (negative TPI values) are indicative of the final stage in the thermokarst landscape evolution. A minor part of the analyzed area comprises these stable surfaces, accounting for only 6%. The sandy permafrost deposits in this area have been completely degraded, and the elevation of the land surface is close to sea level. However, these areas have been stable for a sufficiently long period of time. They have become drier, and a later botanical succession is typical of them. We can assume that these areas have already undergone significant topographic changes and will remain stable in the future.
We have not categorized the slopes and blowouts into certain stages. The inclined surfaces in permafrost regions have unique ground characteristics and are influenced by specific slope processes [9,63,64]. The development of slopes could alter drainage networks, potentially leading to significant variations in runoff volumes and timing [64]. Additionally, the solifluction process begins after the slope reaches two degrees [65]. However, slope processes are largely dependent on the orientation of the slope with respect to the sun, its inclination, surface runoff, and other factors [9]. In other words, slopes with an elevation of 30 m a.s.l. are generally equivalent here to slopes with smaller elevation values. Due to this, it is not appropriate to subdivide slopes into other categories for the purposes of this study. However, slopes account for approximately 16% of the study area according to our assessment. The LC class of blowouts has been identified based on their specific spectral characteristics in order to prevent errors in classification. Blowouts are not common in the study area (only 2%), and therefore, we did not analyze their spatial distribution. Furthermore, their development is more dependent on wind-driven processes rather than thermokarst activity.
The present study demonstrates that the combination of supervised classification and morphometric analysis allows for mapping of the territory based on their degrees of vulnerability to thermokarst processes. This method could be used for the risk assessment of thermokarst hazards in permafrost wetlands, which comprise up to two-thirds of the Arctic landscape [66]. The presented method has some limitations. These include the fact that the study area should have a limited set of LC classes relevant to thermokarst processes, tundra vegetation lacking forest cover, and low topographic amplitudes. However, the advantages of this method include the simplicity of analysis and the ability to map significant areas, as well as identifying terrains that are vulnerable to permafrost degradation and are likely to undergo topographic changes in the near future. Future research may focus on applying the proposed method to study areas with human infrastructure in order to assess the risk of thermokarst hazards and provide relevant recommendations.
Our integrated approach (RF and TPI) demonstrates advantages for thermokarst mapping compared to common Arctic methodologies. Although many modern studies are based on the analysis of satellite imagery [12,27,66,67,68], the combination of supervised classification and morphometric analysis enables the assessment of the degree of permafrost degradation and the identification of the stage of thermokarst landscape development in analyzed landforms. The developed technique is comparable to other studies that have analyzed optical remote sensing imagery and DEM for the identification and assessment of different types of periglacial landscapes [24,69,70].

4. Conclusions

This study presents a geoinformatics-driven approach to assess thermokarst vulnerability in Arctic tundra landscapes by integrating machine learning (random forest) and morphometric analysis (Topography Position Index). A composite image was created by combining the normalized bands from Sentinel-2 Level-2A imagery with calculated indices. We then identified LC classes that are relevant to different stages of the thermokarst process activity and conducted supervised classification using the RF technique. The next stage of the study involved morphometric analysis, which included the calculation of the TPI. Finally, the results of the supervised classification and the TPI map were combined to identify areas that have varying degrees of vulnerability to thermokarst processes. The analysis of the revealed landscape category map enabled us to estimate their spatial distribution. For instance, we recognized that the thermokarst landscape, which has the highest potential for future permafrost degradation and associated landscape change, occupies twenty percent of the study area. The thermokarst-affected terrains and water bodies in the undegraded uplands and in depressions and valleys accounted for 13% and 44%, respectively. A small portion (6%) of the analyzed territory represents areas with stable terrain within depressions and valleys that have already undergone significant topographic changes and are likely to remain stable in the future. Additionally, slopes (16%) and blowouts (2%) were identified within the study area.
Thus, the study’s findings quantitatively characterize the present condition of Arga Island’s thermokarst landscape. These findings can serve as a basis for future research and monitoring of thermokarst landscapes that are affected by global climate change. It is particularly significant that these findings yield a distinctive understanding of thermokarst conditions within this geologically unique region. Furthermore, the findings may be beneficial for interdisciplinary research within the Lena Delta region. Additionally, this study highlights the potential of machine learning algorithms and GEE for evaluating the risk of thermokarst-related hazards. The proposed approach could be employed to identify areas prone to thermokarst processes, particularly in Arctic regions characterized by diverse land cover classes associated with thermokarst formation. This information could be valuable for both applied research and academic investigations.

Funding

This research was funded by the Russian Science Foundation (Project #23-77-01029 https://rscf.ru/en/project/23-77-01029/ (accessed on 10 June 2025)).

Data Availability Statement

This study utilized data exclusively sourced from the publicly accessible Earth Engine Data Catalog. Derived classification outputs can be obtained by contacting the corresponding author, subject to verification that no ethical, legal, or privacy concerns would be compromised by such disclosure.

Acknowledgments

The author gratefully acknowledges the valuable guidance and support provided by his academic supervisor, Ivan Zolnikov, and expresses sincere appreciation to the administration of the IGM SB RAS for their institutional assistance. The author also wishes to extend profound gratitude to the anonymous reviewers for their constructive and insightful comments, which have significantly contributed to improving the scholarly quality of this manuscript.

Conflicts of Interest

The author declares no conflicts of interest.

Abbreviations

The following abbreviations are used in this manuscript:
CAConsumer’s accuracy
CMConfusion matrix
CSIClassification success index
DEMDigital elevation model
EVIEnhanced vegetation index
GEEGoogle Earth Engine
GISGeographic information system
LCLand cover
MLMachine learning
NDVINormalized difference vegetation index
NDWINormalized difference water index
OAOverall accuracy
PAProducer’s accuracy
PCAPrincipal component analysis
RFRandom forest
RSRemote sensing
TCGTasseled cap transformation for greenness
TCWTasseled cap transformation for wetness
TPITopographic position index

References

  1. Lee, H.; Calvin, K.; Dasgupta, D.; Krinner, G.; Mukherji, A.; Thorne, P.; Trisos, C.; Romero, J.; Aldunce, P.; Barrett, K.; et al. Climate Change 2023: Synthesis Report. Contribution of Working Groups I, II and III to the Sixth Assessment Report of the Intergovernmental Panel on Climate Change; IPCC: Geneva, Switzerland, 2023. [Google Scholar]
  2. Cohen, J.; Screen, J.A.; Furtado, J.C.; Barlow, M.; Whittleston, D.; Coumou, D.; Francis, J.; Dethloff, K.; Entekhabi, D.; Overland, J.; et al. Recent Arctic Amplification and Extreme Mid-Latitude Weather. Nat. Geosci. 2014, 7, 627–637. [Google Scholar] [CrossRef]
  3. Serreze, M.C.; Barrett, A.P.; Stroeve, J.C.; Kindig, D.N.; Holland, M.M. The Emergence of Surface-Based Arctic Amplification. Cryosphere 2009, 3, 11–19. [Google Scholar] [CrossRef]
  4. Jansen, E.; Christensen, J.H.; Dokken, T.; Nisancioglu, K.H.; Vinther, B.M.; Capron, E.; Guo, C.; Jensen, M.F.; Langen, P.L.; Pedersen, R.A.; et al. Past Perspectives on the Present Era of Abrupt Arctic Climate Change. Nat. Clim. Chang. 2020, 10, 714–721. [Google Scholar] [CrossRef]
  5. Ziaja, W.; Ostafin, K. Origin and Location of New Arctic Islands and Straits due to Glacial Recession. Ambio 2019, 48, 25–34. [Google Scholar] [CrossRef]
  6. Obu, J.; Westermann, S.; Bartsch, A.; Berdnikov, N.; Christiansen, H.H.; Dashtseren, A.; Delaloye, R.; Elberling, B.; Etzelmüller, B.; Kholodov, A.; et al. Northern Hemisphere Permafrost Map Based on TTOP Modelling for 2000–2016 at 1 km2 Scale. Earth-Sci. Rev. 2019, 193, 299–316. [Google Scholar] [CrossRef]
  7. Streletskiy, D.; Anisimov, O.; Vasiliev, A. Chapter 10—Permafrost Degradation. In Snow and Ice-Related Hazards, Risks, and Disasters; Shroder, J.F., Haeberli, W., Whiteman, C., Eds.; Academic Press: Boston, MA, USA, 2015; pp. 303–344. ISBN 978-0-12-394849-6. [Google Scholar]
  8. Jorgenson, M.T. 8.20 Thermokarst Terrains. In Treatise on Geomorphology; Shroder, J.F., Ed.; Academic Press: San Diego, CA, USA, 2013; pp. 313–324. ISBN 978-0-08-088522-3. [Google Scholar]
  9. French, H.M. The Periglacial Environment, 4th ed.; Wiley, Blackwell: Hoboken, NJ, USA, 2017; ISBN 978-1-119-13281-3. [Google Scholar]
  10. Jorgenson, M.T.; Grosse, G. Remote Sensing of Landscape Change in Permafrost Regions. Permafr. Periglac. Process. 2016, 27, 324–338. [Google Scholar] [CrossRef]
  11. Duncan, B.N.; Ott, L.E.; Abshire, J.B.; Brucker, L.; Carroll, M.L.; Carton, J.; Comiso, J.C.; Dinnat, E.P.; Forbes, B.C.; Gonsamo, A.; et al. Space-Based Observations for Understanding Changes in the Arctic-Boreal Zone. Rev. Geophys. 2020, 58, e2019RG000652. [Google Scholar] [CrossRef]
  12. Chen, Y.; Liu, A.; Cheng, X. Landsat-Based Monitoring of Landscape Dynamics in Arctic Permafrost Region. J. Remote Sens. 2022, 2022, 9765087. [Google Scholar] [CrossRef]
  13. Philipp, M.; Dietz, A.; Buchelt, S.; Kuenzer, C. Trends in Satellite Earth Observation for Permafrost Related Analyses—A Review. Remote Sens. 2021, 13, 1217. [Google Scholar] [CrossRef]
  14. Westermann, S.; Duguay, C.R.; Grosse, G.; Kääb, A. Remote Sensing of Permafrost and Frozen Ground. In Remote Sensing of the Cryosphere; John Wiley & Sons, Ltd.: Hoboken, NJ, USA, 2015; pp. 307–344. ISBN 978-1-118-36890-9. [Google Scholar]
  15. Grosse, G.; Harden, J.; Turetsky, M.; McGuire, A.D.; Camill, P.; Tarnocai, C.; Frolking, S.; Schuur, E.A.G.; Jorgenson, T.; Marchenko, S.; et al. Vulnerability of High-Latitude Soil Organic Carbon in North America to Disturbance. J. Geophys. Res. Biogeosci. 2011, 116, 1–23. [Google Scholar] [CrossRef]
  16. Kokelj, S.V.; Jorgenson, M.T. Advances in Thermokarst Research. Permafr. Periglac. Process. 2013, 24, 108–119. [Google Scholar] [CrossRef]
  17. Schuur, E.A.G.; Mack, M.C. Ecological Response to Permafrost Thaw and Consequences for Local and Global Ecosystem Services. Annu. Rev. Ecol. Evol. Syst. 2018, 49, 279–301. [Google Scholar] [CrossRef]
  18. Beamish, A.; Raynolds, M.K.; Epstein, H.; Frost, G.V.; Macander, M.J.; Bergstedt, H.; Bartsch, A.; Kruse, S.; Miles, V.; Tanis, C.M.; et al. Recent Trends and Remaining Challenges for Optical Remote Sensing of Arctic Tundra Vegetation: A Review and Outlook. Remote Sens. Environ. 2020, 246, 111872. [Google Scholar] [CrossRef]
  19. Dubovik, O.; Schuster, G.L.; Xu, F.; Hu, Y.; Bösch, H.; Landgraf, J.; Li, Z. Grand Challenges in Satellite Remote Sensing. Front. Remote Sens. 2021, 2, 619818. [Google Scholar] [CrossRef]
  20. Phiri, D.; Simwanda, M.; Salekin, S.; Nyirenda, V.R.; Murayama, Y.; Ranagalage, M. Sentinel-2 Data for Land Cover/Use Mapping: A Review. Remote Sens. 2020, 12, 2291. [Google Scholar] [CrossRef]
  21. Gorelick, N.; Hancher, M.; Dixon, M.; Ilyushchenko, S.; Thau, D.; Moore, R. Google Earth Engine: Planetary-Scale Geospatial Analysis for Everyone. Remote Sens. Environ. 2017, 202, 18–27. [Google Scholar] [CrossRef]
  22. Zhao, Q.; Yu, L.; Li, X.; Peng, D.; Zhang, Y.; Gong, P. Progress and Trends in the Application of Google Earth and Google Earth Engine. Remote Sens. 2021, 13, 3778. [Google Scholar] [CrossRef]
  23. Yang, L.; Driscol, J.; Sarigai, S.; Wu, Q.; Chen, H.; Lippitt, C.D. Google Earth Engine and Artificial Intelligence (AI): A Comprehensive Review. Remote Sens. 2022, 14, 3253. [Google Scholar] [CrossRef]
  24. Hong, G.; Zhang, Y. Mapping Land Cover in the Low Arctic Using Multiple Sources of Earth Observation Data. Can. J. Remote Sens. 2024, 50, 2430496. [Google Scholar] [CrossRef]
  25. Merchant, M.; Brisco, B.; Mahdianpari, M.; Bourgeau-Chavez, L.; Murnaghan, K.; DeVries, B.; Berg, A. Leveraging Google Earth Engine Cloud Computing for Large-Scale Arctic Wetland Mapping. Int. J. Appl. Earth Obs. Geoinf. 2023, 125, 103589. [Google Scholar] [CrossRef]
  26. Kokelj, S.V.; Gingras-Hill, T.; Daly, S.V.; Morse, P.D.; Wolfe, S.A.; Rudy, A.C.A.; van der Sluijs, J.; Weiss, N.; Brendan O’Neill, H.; Baltzer, J.L.; et al. The Northwest Territories Thermokarst Mapping Collective: A Northern-Driven Mapping Collaborative toward Understanding the Effects of Permafrost Thaw. Arct. Sci. 2023, 9, 886–918. [Google Scholar] [CrossRef]
  27. Liu, C.; Xu, X.; Feng, X.; Cheng, X.; Liu, C.; Huang, H. CALC-2020: A New Baseline Land Cover Map at 10 m Resolution for the Circumpolar Arctic. Earth Syst. Sci. Data 2023, 15, 133–153. [Google Scholar] [CrossRef]
  28. Grigoriev, M.N. Criomorphogenesis in the Lena Delta; Permafrost Institute Press: Yakutsk, Russia, 1993; p. 176. [Google Scholar]
  29. Feliks Are; Reimnitz, E. An Overview of the Lena River Delta Setting: Geology, Tectonics, Geomorphology, and Hydrology. J. Coast. Res. 2000, 16, 1083–1093. [Google Scholar]
  30. Schwamborn, G.; Rachold, V.; Grigoriev, M.N. Late Quaternary Sedimentation History of the Lena Delta. Quat. Int. 2002, 89, 119–134. [Google Scholar] [CrossRef]
  31. Schwamborn, G.; Schirrmeister, L.; Mohammadi, A.; Meyer, H.; Kartoziia, A.; Maggioni, F.; Strauss, J. Fluvial and Permafrost History of the Lower Lena River, North-Eastern Siberia, over Late Quaternary Time. Sedimentology 2023, 70, 235–258. [Google Scholar] [CrossRef]
  32. Zolnikov, I.D.; Glushkova, N.V.; Kartoziya, A.A.; Chupina, D.A. The Geomorphological Zonation of the Lena River Delta East Part by Using GIS-Analysis. Geol. Miner. Resour. Sib. 2023, 1, 3–11. [Google Scholar] [CrossRef]
  33. Imaeva, L.P.; Gusev, G.S.; Imaev, V.S. Dynamics of the Relief and Sesmotectonic Activity of the Modern Structures in the Delta of the River Lena. Geotectonics 2019, 62–77. [Google Scholar] [CrossRef]
  34. Dergach, P.A.; Eponeshnikova, L.Y.; Ponasenko, S.N.; Kartoziia, A.A.; Geissler, W.H.; Duchkov, A.A.; Shibaev, S.V.; Zobnin, G.Y. Building a tomographic velocity model for Samoylov Island area (Lena Delta) from local seismological data for the period of 2019–2021. Geodin. Tektonofiz. 2022, 13, 627. [Google Scholar] [CrossRef]
  35. Zaplavnova, A.A.; Deev, E.V.; Potapov, V.V. Structure of the Upper Part of the Earth’s Crust in the Area of the Lena River Delta: The First Magnetotelluric Data. Dokl. Earth Sci. 2024, 514, 249–254. [Google Scholar] [CrossRef]
  36. Schwamborn, G.; Andreev, A.A.; Rachold, V.; Hubberten, H.-W.; Grigoriev, M.N.; Tumskoy, V.E.; Pavlova, E.Y.; Dorozhkina, M. Evolution of Lake Nikolay, Arga Island, Western Lena River Delta, during Late Pleistocene and Holocene Time. Polarforschung 2002, 70, 69–82. [Google Scholar]
  37. Andreev, A.; Tarasov, P.; Schwamborn, G.; Ilyashuk, B.; Ilyashuk, E.; Bobrov, A.; Klimanov, V.; Rachold, V.; Hubberten, H.-W. Holocene Paleoenvironmental Records from Nikolay Lake, Lena River Delta, Arctic Russia. Palaeogeogr. Palaeoclimatol. Palaeoecol. 2004, 209, 197–217. [Google Scholar] [CrossRef]
  38. Schneider, J.; Grosse, G.; Wagner, D. Land Cover Classification of Tundra Environments in the Arctic Lena Delta Based on Landsat 7 ETM+ Data and Its Application for Upscaling of Methane Emissions. Remote Sens. Environ. 2009, 113, 380–391. [Google Scholar] [CrossRef]
  39. Lisovski, S.; Runge, A.; Shevtsova, I.; Landgraf, N.; Morgenstern, A.; Okoth, R.R.; Fuchs, M.; Lashchinskiy, N.; Stadie, C.; Beamish, A.; et al. A New Habitat Map of the Lena Delta in Arctic Siberia Based on Field and Remote Sensing Datasets. Earth Syst. Sci. Data Discuss. 2023, 2023, 1707–1730. [Google Scholar] [CrossRef]
  40. Boike, J.; Nitzbon, J.; Anders, K.; Grigoriev, M.; Bolshiyanov, D.; Langer, M.; Lange, S.; Bornemann, N.; Morgenstern, A.; Schreiber, P.; et al. A 16-Year Record (2002–2017) of Permafrost, Active-Layer, and Meteorological Conditions at the Samoylov Island Arctic Permafrost Research Site, Lena River Delta, Northern Siberia: An Opportunity to Validate Remote-Sensing Data and Land Surface, Snow, and Permafrost Models. Earth Syst. Sci. Data 2019, 11, 261–299. [Google Scholar] [CrossRef]
  41. Chalov, S.; Prokopeva, K.; Magritsky, D.; Grigoriev, V.; Fingert, E.; Habel, M.; Juhls, B.; Morgenstern, A.; Overduin, P.P.; Kasimov, N. Climate Change Impacts on Streamflow, Sediment Load and Carbon Fluxes in the Lena River Delta. Ecol. Indic. 2023, 157, 111252. [Google Scholar] [CrossRef]
  42. Harmonized Sentinel-2 MSI: MultiSpectral Instrument, Level-2A. Available online: https://developers.google.com/earth-engine/datasets/catalog/COPERNICUS_S2_SR_HARMONIZED (accessed on 20 January 2025).
  43. Rouse, J.W.; Haas, R.H.; Deering, D.W.; Schell, J.A.; Harlan, J.C. Monitoring the Vernal Advancement and Retrogradation (Green Wave Effect) of Natural Vegetation; Great Plains Corridor; NASA: Washington, DC, USA, 1973. [Google Scholar]
  44. Gao, B. NDWI—A Normalized Difference Water Index for Remote Sensing of Vegetation Liquid Water from Space. Remote Sens. Environ. 1996, 58, 257–266. [Google Scholar] [CrossRef]
  45. Huete, A.; Didan, K.; Miura, T.; Rodriguez, E.P.; Gao, X.; Ferreira, L.G. Overview of the Radiometric and Biophysical Performance of the MODIS Vegetation Indices. Remote Sens. Environ. 2002, 83, 195–213. [Google Scholar] [CrossRef]
  46. Kauth, R.J.; Thomas, G.S. The Tasseled Cap—A Graphic Description of the Spectral-Temporal Development of Agricultural Crops as Seen by Landsat. In Proceedings of the Symposium on Machine Processing of Remotely Sensed Data, West Lafayette, IN, USA, 29 June–1 July 1976; pp. 41–51. [Google Scholar]
  47. Shi, T.; Xu, H. Derivation of Tasseled Cap Transformation Coefficients for Sentinel-2 MSI At-Sensor Reflectance Data. IEEE J. Sel. Top. Appl. Earth Obs. Remote Sens. 2019, 12, 4038–4048. [Google Scholar] [CrossRef]
  48. Crist, E.P.; Cicone, R.C. Application of the Tasseled Cap Concept to Simulated Thematic Mapper Data. Photogramm. Eng. Remote Sens. 1984, 50, 343–352. [Google Scholar]
  49. IDB—Index DataBase. Available online: https://www.indexdatabase.de/ (accessed on 20 January 2025).
  50. Kartoziia, A. Using Google Earth Engine to Assess the Current State of Thermokarst Terrain on Arga Island (the Lena Delta). Earth 2024, 5, 228–243. [Google Scholar] [CrossRef]
  51. Zhou, L.; Luo, T.; Du, M.; Chen, Q.; Liu, Y.; Zhu, Y.; He, C.; Wang, S.; Yang, K. Machine Learning Comparison and Parameter Setting Methods for the Detection of Dump Sites for Construction and Demolition Waste Using the Google Earth Engine. Remote Sens. 2021, 13, 787. [Google Scholar] [CrossRef]
  52. Belgiu, M.; Drăguţ, L. Random Forest in Remote Sensing: A Review of Applications and Future Directions. ISPRS J. Photogramm. Remote Sens. 2016, 114, 24–31. [Google Scholar] [CrossRef]
  53. Breiman, L. Random Forests. Mach. Learn. 2001, 45, 5–32. [Google Scholar] [CrossRef]
  54. Stehman, S.V. Selecting and Interpreting Measures of Thematic Classification Accuracy. Remote Sens. Environ. 1997, 62, 77–89. [Google Scholar] [CrossRef]
  55. Congalton, R.G.; Green, K. Assessing the Accuracy of Remotely Sensed Data: Principles and Practices, 2nd ed.; CRC Press: Boca Raton, FL, USA, 2008; ISBN 978-0-429-14397-7. [Google Scholar]
  56. Sasaki, Y.; The Truth of the F-Measure. University of Manchester, Technical Report, Version. Available online: https://people.cs.pitt.edu/~litman/courses/cs1671s20/F-measure-YS-26Oct07.pdf (accessed on 8 June 2025).
  57. Cohen, J. A Coefficient of Agreement for Nominal Scales. Educ. Psychol. Meas. 1960, 20, 37–46. [Google Scholar] [CrossRef]
  58. Koukoulas, S.; Blackburn, G.A. Introducing New Indices for Accuracy Evaluation of Classified Images Representing Semi-Natural Woodland Environments. Photogramm. Eng. Remote Sens. 2001, 67, 499–510. [Google Scholar]
  59. Labatut, V.; Cherifi, H. Evaluation of Performance Measures for Classifiers Comparison. arXiv 2011, arXiv:1112.4133. [Google Scholar]
  60. Weiss, A. Topographic Position and Landforms Analysis. In Proceedings of the Poster Presentation, ESRI User Conference, San Diego, CA, USA, 9–13 July 2001; Volume 200. [Google Scholar]
  61. De Reu, J.; Bourgeois, J.; Bats, M.; Zwertvaegher, A.; Gelorini, V.; De Smedt, P.; Chu, W.; Antrop, M.; De Maeyer, P.; Finke, P.; et al. Application of the Topographic Position Index to Heterogeneous Landscapes. Geomorphology 2013, 186, 39–49. [Google Scholar] [CrossRef]
  62. Porter, C.; Howat, I.; Noh, M.-J.; Husby, E.; Khuvis, S.; Danish, E.; Tomko, K.; Gardiner, J.; Negrete, A.; Yadav, B.; et al. ArcticDEM-Mosaics, Version 4.1. [Dataset]. Harv. Dataverse. 2023. Available online: https://dataverse.harvard.edu/dataset.xhtml?persistentId=doi:10.7910/DVN/3VDC4W (accessed on 8 June 2025).
  63. McRoberts, E.C.; Morgenstern, N.R. The Stability of Thawing Slopes. Can. Geotech. J. 1974, 11, 447–469. [Google Scholar] [CrossRef]
  64. Rowland, J.C.; Jones, C.E.; Altmann, G.; Bryan, R.; Crosby, B.T.; Hinzman, L.D.; Kane, D.L.; Lawrence, D.M.; Mancino, A.; Marsh, P.; et al. Arctic Landscapes in Transition: Responses to Thawing Permafrost. Eos Trans. Am. Geophys. Union 2010, 91, 229–230. [Google Scholar] [CrossRef]
  65. Rowley, T.; Giardino, J.R.; Granados-Aguilar, R.; Vitek, J.D. Chapter 13—Periglacial Processes and Landforms in the Critical Zone. In Developments in Earth Surface Processes; Giardino, J.R., Houser, C., Eds.; Elsevier: Amsterdam, The Netherlands, 2015; Volume 19, pp. 397–447. [Google Scholar]
  66. Walker, D.A.; Raynolds, M.K.; Daniëls, F.J.A.; Einarsson, E.; Elvebakk, A.; Gould, W.A.; Katenin, A.E.; Kholod, S.S.; Markon, C.J.; Melnikov, E.S.; et al. The Circumpolar Arctic Vegetation Map. J. Veg. Sci. 2005, 16, 267–282. [Google Scholar] [CrossRef]
  67. Liu, C.; Huang, H.; Sun, F. A Pixel-Based Vegetation Greenness Trend Analysis over the Russian Tundra with All Available Landsat Data from 1984 to 2018. Remote Sens. 2021, 13, 4933. [Google Scholar] [CrossRef]
  68. Chen, Z.; Pasher, J.; Duffe, J.; Behnamian, A. Mapping Arctic Coastal Ecosystems with High Resolution Optical Satellite Imagery Using a Hybrid Classification Approach. Can. J. Remote Sens. 2017, 43, 513–527. [Google Scholar] [CrossRef]
  69. Grosse, G.; Schirrmeister, L.; Malthus, T.J. Application of Landsat-7 Satellite Data and a DEM for the Quantification of Thermokarst-Affected Terrain Types in the Periglacial Lena–Anabar Coastal Lowland. Polar Res. 2006, 25, 51–67. [Google Scholar] [CrossRef]
  70. Bergstedt, H.; Jones, B.M.; Hinkel, K.; Farquharson, L.; Gaglioti, B.V.; Parsekian, A.D.; Kanevskiy, M.; Ohara, N.; Breen, A.L.; Rangel, R.C.; et al. Remote Sensing-Based Statistical Approach for Defining Drained Lake Basins in a Continuous Permafrost Region, North Slope of Alaska. Remote Sens. 2021, 13, 2539. [Google Scholar] [CrossRef]
Figure 1. The study region (indicated by the white rectangle, 2000 km2) within a composite of Sentinel-2 images of the Lena River Delta. The red frame in the globe indicates the Lena Delta.
Geohazards 06 00031 g001
Figure 2. Flowchart of study. The blue numbers indicate the stages of the study.
Geohazards 06 00031 g002
Figure 3. The map of land cover classes.
Geohazards 06 00031 g003
Figure 4. The localization of the mapped LC classes in the topographic profile.
Geohazards 06 00031 g004
Figure 5. The proportion of mapped LC classes in each elevation category.
Geohazards 06 00031 g005
Figure 6. The results of the morphometric analysis: a topographic profile that demonstrates the positive and negative values of the TPI regarding relief (a); the spatial distribution of LC classes within the positive (blue) and negative (green) ranges of TPI values (b); and the TPI map (c).
Geohazards 06 00031 g006
Figure 7. The results of combining supervised classification with morphometric analysis: a map that illustrates the categories according to their level of vulnerability to thermokarst processes (a); the topographic profile with mapped categories (b); and the spatial distribution of mapped categories (c). Legend: 1—the stable terrains in the undegraded uplands; 2—the thermokarst-affected terrains and water bodies in the undegraded uplands; 3—the thermokarst-affected terrains and water bodies in the depressions and valleys; 4—stable terrains within the depressions and valleys; 5—slopes; 6—blowouts.
Geohazards 06 00031 g007
Table 1. Spectral characteristics of Sentinel-2 MSI bands [42].
BandPixel Size (m)Central Wavelength (nm)Description
B160442.3Aerosols
B210492.1Blue
B310559Green
B410665Red
B520703.8Red Edge 1
B620739.1Red Edge 2
B720779.7Red Edge 3
B810833NIR
B8A20864Red Edge 4
B960943.2Water vapor
B11201610.4SWIR 1
B12202185.7SWIR 2
Table 2. The spectral indices employed in the research. The formulas were derived from the index database [49]. The band names in the formulas correspond to those listed in Table 1.
IndexFormula
Normalized Difference Vegetation Index (NDVI)(B8 − B4)/(B8 + B4)
Normalized Difference Water Index (NDWI)(B3 − B8)/(B3 + B8)
Enhanced Vegetation Index (EVI)2.5 × (B8 − B4)/((B8 + 6.0 × B4 − 7.5 × B2) + 1.0)
Tasseled Cap transformation—wetness (TCW)0.1509 × B2 + 0.1973 × B3 + 0.3279 × B4 + 0.3406 × B8 + 0.7112 × B11 + 0.4572 × B12
Tasseled Cap transformation—greenness (TCG)−0.2848 × B2 − 0.2435 × B3 − 0.5436 × B4 + 0.7243 × B8 + 0.0840 × B11 − 0.1800 × B12
Disclaimer/Publisher’s Note: The statements, opinions and data contained in all publications are solely those of the individual author(s) and contributor(s) and not of MDPI and/or the editor(s). MDPI and/or the editor(s) disclaim responsibility for any injury to people or property resulting from any ideas, methods, instructions or products referred to in the content.

