Abstract
Post-earthquake fires are typically of great concern for fire protection services, which are expected to be in high demand immediately after a strong earthquake. The post-earthquake functionality of fire stations is necessary after strong earthquakes to reduce potential fire damage and improve emergency services. A reliable assessment of the seismic vulnerability and expected damage for fire stations is therefore a necessary step towards the identification of the most vulnerable structures and the prioritization of seismic retrofit activities. This article presents the development of a methodology for the damage assessment of fire stations based on earthquakes scenarios. The framework is based on four models: seismic hazard, inventory, fragility and impact. The seismic hazard model represents ground shaking in terms of intensity measure at each station using a ground motion prediction equation for Eastern Canada. The inventory model categorizes all the fire stations in building classes based on construction material and seismic code level. The fragility model associates building classes with fragility functions that provide the relationship between intensity measure and expected damage probabilities. The impact model converts damage probabilities into a mean damage state. All Montreal fire stations were selected as case study demonstrations. Simulations were conducted by varying the epicenter location and magnitude for a total number of 345 scenarios. Simplified relationships that correlate the earthquake magnitude and expected damage were developed. The study showed that, for magnitude 6 earthquakes, 45% of stations on average would sustain at least moderate damage. The methodology is particularly useful for emergency planning and prioritization of seismic retrofit activities.
1. Introduction
In the collective mind, earthquakes mainly cause damage to buildings and infrastructure because of the vibrations induced in structures. Recent earthquakes events such as the 2023 Kahramanmaraş earthquake of magnitude 7.7 in Türkiye caused widespread damage. In the impacted cities, 32% of buildings sustained heavy damage or collapse of more than 100,000 buildings [1]. Damage statistics for buildings due to the 2024 Noto Peninsula earthquake of magnitude 7.5 in Japan showed that more than 8000 buildings were majorly damaged [2]. However, several historic earthquakes were followed by major fires, which caused even more damage than the shaking itself [3,4,5]. For example, the fire caused by the 1906 San Francisco earthquake destroyed 28,000 buildings, [4] and the fire following the 1923 Tokyo earthquake destroyed 212,000 buildings [5]. Various factors can contribute to the ignition and spread of fire, such as gas networks, construction type and building density. The fire risk is increased when buildings are made of wood, like in many regions of Canada, the United States and Japan [6,7,8]. In this context, it is essential for firefighters to be able to respond to emergency calls after an earthquake, as they will be faced with significant demand. Fire stations play a key role in protecting firefighters and their equipment, and thus these civil protection buildings must be designed in a way to minimize seismic induced damage. Risk assessment studies has been conducted to evaluate the expected performance of civil protection and critical facilities including fire stations [9] and hospitals [10,11]. To mitigate the consequences of an earthquake event and take the necessary measures, damage scenarios to critical facilities such as fire station buildings need to be assessed and quantified to evaluate the scale of disruption of the fire service and plan for mitigation actions.
Montreal is located within the Western Quebec Seismic Zone (WQSZ) with a recorded earthquake activity by Natural Resources Canada every five days on average [12] The WQSZ is composed of a series of earthquake clusters that collectively form a north-west trending band of intraplate seismicity measuring around 160 km wide and 500 km long [13] and was the site of at least three major damaging earthquakes in the past. In 1732, an earthquake estimated at magnitude 5.8 shook Montreal, causing significant damage. In 1935, the area of Temiscaming was shaken by an earthquake of magnitude 6.2. In 1944, an earthquake of magnitude 5.6, located between Cornwall, Ontario and Massena, New York state, caused property damage estimated as CAN$2 million (CAN$36 million in 2024) [12]. The recent seismic hazard assessment developed by Natural Resources Canada for seismic design parameters in the National Building Code of Canada NBCC [14] estimated that Montreal can be exposed to a horizontal peak ground acceleration (PGA) of 0.46 g with a probability of exceedance of 2% in 50 years, which is expected to cause damage to existing buildings.
This paper presents the development of a methodology for the seismic assessment of fire stations subjected to multiple simulated earthquake scenarios. The case study of Montreal fire stations illustrates the application of the methodology. The choice of the simulated scenario-based approach in Montreal is justified by the limited historical information available in Eastern Canada [15] and the possibility to consider the uncertainty in the location of the epicenter. Baset earthquake scenario studies estimated that the island of Montreal is at risk from post-earthquake fires, according to a report by [7] which estimates economic losses of between C$10 billion and C$30 billion depending on the scenario. The high density of wood buildings significantly increases the potential for fires to start and spread. This high risk of fire means that Montreal’s 2400 firefighters in 66 fire stations [16] must be able to respond immediately after a strong earthquake event, which means that firefighters and their equipment must be protected at all times to ensure that they are always operational to protect the island’s inhabitants, i.e., 23.6% of the population of Quebec (5.4% of the Canadian population) [17]. The pre-earthquake assessment will help in identifying the most vulnerable buildings so that seismic rehabilitation can be carried out in a targeted and cost-effective manner.
The two most common methods for earthquake assessment are the deterministic approach and the probabilistic approach [18]. To perform a deterministic seismic hazard analysis (DSHA), the location and characteristics of all significant potential earthquake sources that might affect the site should be established. For each source, the maximum credible earthquakes are assigned, and the appropriate ground motion prediction equations (GMPEs) are selected to estimate the site ground motion parameters as a function of earthquake magnitudes and the source to site distance of various sites [19]. DSHA has been applied for the assessment of seismic hazard as well as in vulnerability studies [20,21].
The probabilistic seismic hazard analysis (PSHA) approach produces ground motion intensities corresponding to specific probabilities such as the 2% probability of exceedance in 50 years. The objective of PSHA is to compute, for a given exposure time, the probability of exceedance corresponding to various levels of ground motion parameters such as the peak horizonal ground acceleration (PGA) and response spectra ordinates at several structural periods of vibrations [22,23]. These results are typically developed for seismic design in building codes and are not necessarily suited for scenario-based emergency planning. On the other hand, emergency plans and pre-earthquake assessment require knowledge of locations where earthquakes are likely to occur and of the consequences of an earthquake of different magnitudes [24].
The methodology presented in this paper involves the development of consecutive models: hazard assessment of the expected ground motion intensities for each scenario earthquake, inventory analysis and classification of fire stations according to their seismic vulnerability, fragility analysis to correlate damage state probabilities to earthquake intensity and impact analysis to quantify the mean damage states. These models are first described. An example application of a magnitude 6 earthquake below the city center is then presented. The uncertainty of the epicenter location is then incorporated, by considering several epicenters in the simulations, to generate statistical data on expected damage and develop relationships between damage state distributions and earthquake magnitudes. Epicenters are chosen based on the grid points of the seismic hazard maps developed by Natural Resources Canada for the use in seismic design in the National Building Code of Canada (NBCC).
2. Materials and Methods
2.1. Framework for Performance Assessment
The framework for the seismic performance assessment constitutes four models. The seismic hazard defines the expected ground motion intensities for various earthquake magnitude scenarios using ground motion prediction equations (GMPE). The inventory model defines the classification of fire station buildings according to their year of construction and structural system. The fragility model associates each fire station building class with a fragility function represented by a relationship between the probability of damage and a ground motion intensity measure (IM). IMs can be defined by peak ground motion such as PGA or using the response spectral values at specific structural periods of vibrations. For regional scale risk assessment studies, short (T = 0.3 s) or long (T = 1.0 s) periods could be used, both of which can be directly associated with seismic hazard values in the Canadian codes. Sa(1.0s) was found to demonstrate less dispersion with displacement demands based on the statistical analysis of a large number of structural analysis results for multiple earthquake scenarios on various types of buildings [25]. Fragility functions are obtained based on a regression analysis of the vulnerability analyses of various types of buildings that were conducted in the framework of the developments of the rapid risk evaluator (Evaluation Rapide de Risque, ER²) tool [26]. The impact model defines the interpretation of damage state probabilities in terms of a mean damage factor. Figure 1 shows the integration of these models and the sequence of analyses.
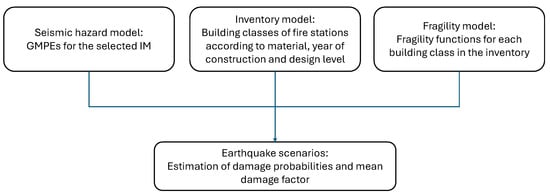
Figure 1.
Framework for earthquake scenario for performance assessment.
2.2. Seismic Hazard Model
The seismic hazard model considers the propagation of seismic waves between the epicenter and the location of each building. The GMPEs presented in [15] for eastern Canada are used to estimate the value of Sa(1.0s) at the site, taken as the intensity measure IM. The IM values are given originally in discrete intensity measures as a function of magnitude Mw and the distance to the epicenter (Repi) in a tabulated format for lower-bound, medium- and higher-bound estimates. Earthquake magnitude refers to a logarithmic scale that quantifies the size of an earthquake based on the seismic moment, which is a measure of the total energy released. Epicentral distance Repi is the ground distance between a specific point and the earthquake’s epicenter, the point on the Earth’s surface directly above the hypocenter (where the earthquake originates). To simplify the integration in a spreadsheet solution, closed-form equations are developed for the selected IM for damage assessments using regression as a function of Repi and various magnitudes ranging from 5 to 7. The distance Repi was considered up to 60 km. Given that the island of Montreal is about 50 km long at its longest point, this covers the island plus a few kilometers of the surrounding area. The closed-form equations are defined for five magnitude values and three estimate levels of GMPE are presented in Table 1 for Sa(1.0s) for low, medium and high estimates. GMPEs are given for a B/C seismic site class with an average shear wave velocity at 30 m (Vs30) of 760 m/s. To consider the amplification site effect, it is necessary to adjust the IM values obtained from the GMPEs. The IM values are first recalculated for a site class C by applying a conversion factor proposed by [27]. The IM values are then modified to consider the specific seismic site class at the location of each building, using the site coefficient [28]. The site class corresponds to the average shear wave velocities in the first 30 m of soil (Vs30) for each fire station location and was identified based on the microzoning study of the island of Montreal [29]. The site classes include hard rock (A; Vs30 > 1500 m/s), rock (B; 760 < Vs30 < 1500 m/s), very dense soil and soft rock (C; 360 < Vs30 < 760 m/s) and stiff soil (D; 180 < Vs30 < 360 m/s) (Table 2).

Table 1.
Closed-form equations for Sa(1.0s) based on the regression analysis of the tabulated values in [28] GMPE for Eastern Canada.
Table 2.
Site classes’ definitions and corresponding number of fire stations located at each class.
2.3. Inventory Model
The inventory model defines the classification of buildings according to construction types, the year of construction and seismic code levels. Each building class is then associated with a fragility function to predict damage. Determining a specific fragility function for each building would be time-consuming and a computationally intensive process. The use of building classes with similar expected seismic performance offers the advantage of simplicity and rapidity while it has proven to be computationally efficient in the context of the regional seismic risk assessment of a large number of buildings. The classification adopted is recommended by the standardized North America risk assessment tool, Hazus [30], along with the fragility function associated with each building class, which is determined based on structural type, height and building code level. The collection of inventory data for the regional scale risk assessment can be collected from multiple resources such as census data and geographical information system databases [31]. The method adopted for the inventory and structural characterization of fire stations in Montreal were carried out by the authors [32] using different sources of information including open source datasets such as those available online on the “Données Québec” website [33]; the Montreal firefighters’ website [34]; site visits of the inside and outside of the buildings with the authorization of firefighters and (iii) construction and renovation drawings available at the city archives. These sources were used to identify general information such as the date of construction and building height, as well as construction materials and the lateral load resisting system. Table 3 presents the building classification system and taxonomy adopted in this study and corresponding parameters.
Table 3.
Adopted building classification systems and parameters used in this study.
The average year of construction of fire stations in Montreal is 1958, i.e., an average age of 65 years [32]. Fire stations are civil protection buildings and are therefore subject to special regulations regarding their seismic design, which have evolved over the years in the NBCC [35]. Building code editions used for the construction of each fire station were determined based on the construction year. A code level is assigned to each building according to the reference years (prior to 1953 for pre-code, between 1953 and 1975 for low code, between 1975 and 2005 for medium code and after 2005 for high code). Figure 2 shows the number of fire stations built according to the edition of the NBCC and the code level to which they are assigned. The inventory determined that 71.2% of the 66 fire stations were built according to a building code that predated 1975, i.e., the introduction of dynamic analyses to determine seismic force design in the NBCC [35].
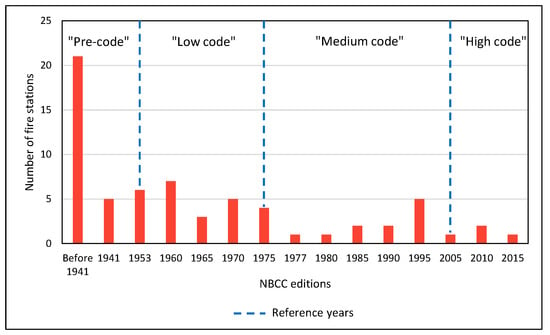
Figure 2.
NBCC editions used for the construction of the fire stations and their classification according to the seismic code levels.
Inventory analysis involved the characterization of each fire station building according to the standardized fragility-based classification system in Hazus [30] with the resulting statistics showing in Figure 3. This approach was followed to be able to correlate each building class to a corresponding fragility function that is used for damage assessment. Montreal fire stations tend to be low-rise: 69.7% have 2 stories or less, 25.8% have 3 stories and 4.5% have 4 stories. The materials used in the construction of fire stations vary according to the period of construction. Before 1930, load-bearing masonry walls and steel frames with masonry infill were the predominant structures used; between 1930 and 1980, concrete frames were predominant; and since 1970, steel frames have been the most popular structural system. The most common structures are concrete moment frames (C1) (32%), steel braced frames (S2) (17%), steel moment frames (S1) (15%) and unreinforced masonry bearing walls (URM) (14%).
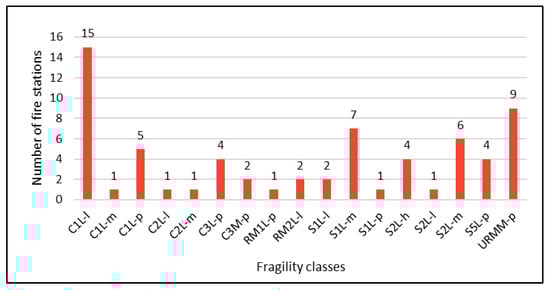
Figure 3.
Building types based on fragility classes of fire stations.
2.4. Fragility Model
The fragility model defines the relationship between the probability of being in different damage states (i.e., slight, moderate, extensive and complete) and the IM. Key aspects of the fragility function include the probability of exceedance, which shows the probability of a structure exceeding a predefined damage state, ground motion intensity, which is represented by an IM such as Sa(1.0s), and damage states. Fragility functions help engineers and decision-makers understand how likely a structure is to be damaged under different levels of a hazard, the potential for different levels of damage to occur and the implications for safety. Fragility functions can be developed based on empirical data from post-earthquake damage datasets, analytical modelling and structural analysis. For regions of scarce post-earthquake damage observations, the fragility analysis typically relies on analytical modelling. The fragility analysis integrated in the ER2 tool [26] developed fragility datasets based on nonlinear static seismic demand and the damage probability for single-degree-of-freedom models representative of a population of buildings with a specific construction material, seismic design level and height. This dataset is used to generate closed-form fragility functions for each identified building class in the inventory. The fragility database includes pre-calculated damage state probabilities for various earthquake magnitudes and distance combinations using standard vulnerability parameters available in Hazus [30] for different building classes. Regression analyses were conducted on the data points to correlate the damage state probabilities to the corresponding intensity measure for each earthquake scenario, in this case the spectral acceleration Sa(1.0s). An example of the fragility functions obtained for the unreinforced masonry, low-rise and pre-code (URML-p) class is shown in Figure 4. The parameters of the lognormal probability distributions for each building class identified in this study and for each damage state can be found in [32].
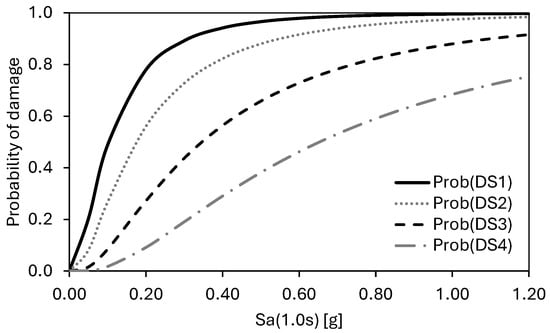
Figure 4.
Example fragility function for URML-p building class.
2.5. Impact Model
The impact model is used to translate damage probabilities into communicable terms. The mean damage factor MDF is used by adopting from [36]. The damage states “None” and “Slight” are combined, so there are four damage states retained: “None/Slight”, “Moderate”, “Extensive” and “Complete”. The table associates the damage states with Di values and MDF intervals. The expression of the MDF is given in Equation (1). Di is the average damage ratio of damage state i, and P(DSi) is the probability of being in structural damage state i. To identify the expected damage state for a given building, the predicted MDF is compared to the intervals of the MDF for each damage state (Table 4). For example, if the MDF from Equation (1) is 25%, the expected damage state is moderate (MDF ranges from 1 to 30%).
Table 4.
Definition of average damage ratio Di for damage state and corresponding MDF intervals.
3. Results and Discussion
3.1. Scenario-Based-Spreadsheet Integrated Tool
A spreadsheet interface was programmed to enable the user to select the simulation settings: epicenter coordinates, magnitude and GMPE level. The tool returns data identifying the fire stations, the damage probabilities and the state of damage according to the MDF, as well as a map of the fire stations with their respective damage and a graph of damage by class. The results of a simulation for an epicenter under the Mont Royal neighborhood and a magnitude of Mw = 6 is presented below. The damage map (Figure 5) provides a visual identification of the most affected buildings. The numerical results are summarized in Table 5. The importance of the GMPE level is clearly highlighted, with 18% of fire stations predicted to be in an “Extensive” state of damage for the “high” GMPE level, while no fire station reaches this state of damage for the “low” and “medium” levels.
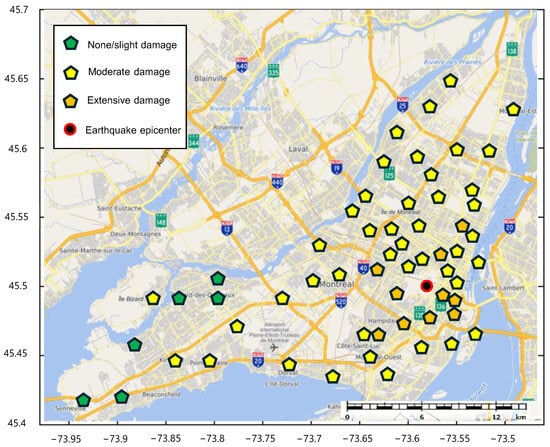
Figure 5.
Map of fire stations and their expected damage states for scenario M6 and high GMPE.
Table 5.
Number of fire stations in each damage state for scenario M6.
3.2. Simulations for Several Epicentres
In this study, several earthquake scenarios are selected, Mw = {5; 5.5; 6; 6.5; 7}. The uncertainty in the location of epicenters is considered using a grid of epicenters. It is thus possible to obtain statistical data on damage sustained by fire stations during an earthquake with a given magnitude and various epicentral locations. Instead of choosing epicenters randomly around Montreal Island, epicenters are chosen based on the calculation grid points of the seismic hazard maps produced by National Resources Canada. The seismic hazard map used for the 2015 version of the NBCC (NRCAN2015) was calculated for a square grid of points spaced 10 × 10 km apart [27]. For the 2020 version of the NBCC (NRCAN2020), the 10 × 10 km square grid of calculation points has been replaced by a triangular grid to eliminate certain points in large regions of Canada. The map is made up of 34,732 points with an average distance of 20 km between them [37]. A comparative analysis was conducted between the square grid and triangular grid points to evaluate the impact of the choice of the epicenter grid on the damage results.
3.2.1. Damage Scenarios for Epicenters Using Square Grid Points
To carry out the simulations, the grid points of the closest to the island of Montreal were selected, for a total of 23 points (Figure 6). For each 23 epicenters, 5 magnitudes were simulated, and for each the GMPE level varies (M5, M5.5, M6, M6.5 and M7), for a total number of 345 scenarios. Figure 7 shows the proportions of fire stations in different damage states for the different magnitudes, with standard deviations. The fire stations are subject to the following degrees of damage: for M5, “None/Slight” (99.4%) and “Moderate” (0.6%); for M5.5, “None/Slight” (88.7%) and “Moderate” (11.3%); for M6, “None/Slight” (59.1%), “Moderate” (40.4%) and “Extensive” (0.5%); for M6.5, “None/Slight” (26.2%), “Moderate” (65.1%) and “Extensive” (8.7%); and for M7, “None/Slight” (7%), “Moderate” (65.6%), “Extensive” (25.5%) and “Complete” (1.9%). The results show that an earthquake of magnitude 5 will have a minor impact on the fire stations. The results also show that “Complete” damage is rarely reached, except for a magnitude 7 earthquake with an average of two fire stations reaching this damage level.
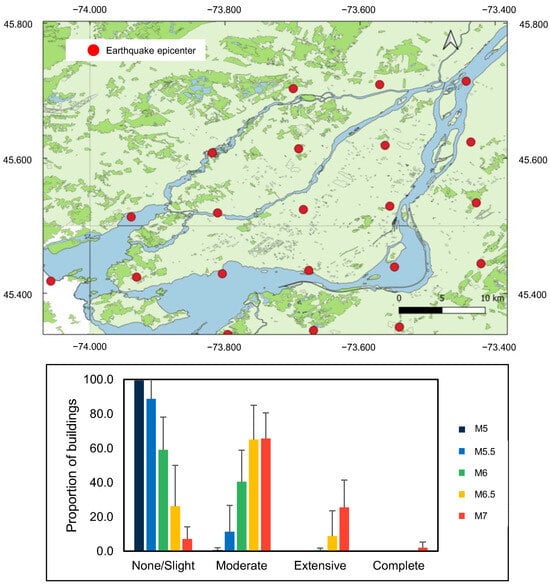
Figure 6.
Locations of the epicenters based on the square grid points and the corresponding damage state statistics.
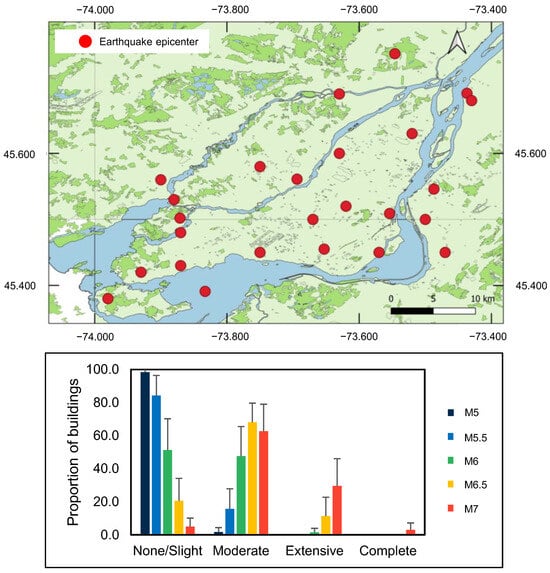
Figure 7.
Locations of the epicenters based on the triangular grid points and the corresponding damage state statistics.
3.2.2. Damage Scenario for Epicenters Using Triangular Grid Points
The points on the map closest to the island of Montreal were selected as epicenters (Figure 7). A total of five magnitudes and three GMPE levels are considered for each of the 25 epicenters, giving a total of 375 scenarios. Figure 8 shows the proportions of fire stations in the various damage states for the different magnitudes, with standard deviations. The fire stations are subject to the following degrees of damage: for M5, “None/Slight” (98.4%) and “Moderate” (1.6%); for M5.5, “None/Slight” (84.3%) and “Moderate” (15.7%); for M6, “None/Slight” (51.2%), “Moderate” (47.5%) and “Extensive” (1.4%); for M6.5, “None/Slight” (20.7%), “Moderate” (67.9%) and “Extensive” (11.4%); and for M7, “None/Slight” (4.9%), “Moderate” (62.6%), “Extensive” (29.5%) and “Complete” (2.9%). The magnitude 5 earthquake appears not to cause significant damage, with a prediction of 98.4% in a “slight” damage state and a standard deviation of 4.1%. The magnitude 6 earthquake is unlikely to cause “Extensive” damage, with an average of 1.4% of fire stations in this condition and a standard deviation of 3.9%.
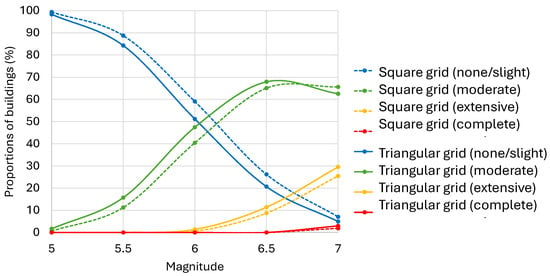
Figure 8.
Proportions of fire stations in each damage state for epicentral square and triangular grids.
4. Discussion
From the damage results obtained for the five magnitude values, it is possible to conduct a regression analysis on the points to obtain the damage functions and thus be able to interpolate the damage for any earthquake of magnitude between five and seven (Figure 8). The Propi (M) function therefore defines the proportion of fire stations in damage state i for a magnitude M. The different functions are given in Table 6. The two-epicenter series used for the calculation can be compared. The results show that the selection of the grid point formation has a minor impact on the predicted damage state. In both simulations, the “Complete” damage state is only reached for magnitude 7 earthquakes, with an average of 2% (square grid) and 3% (triangular grid) of fire stations. This observation can be correlated to the fragility functions used in this study. The mean values of the fragility functions for the “Complete” damage state of all fire station building classes vary between 0.51 g and 3.52 g [32]. Based on the generated scenarios, only 13 scenarios have an average Sa(1.0s) greater than 0.5 g, which explains the low proportion of fire stations in the “Complete” damage state in the simulation results. Similarly, the maximum mean value of Sa(1.0s) for magnitude 5 earthquakes is 0.036 g, while the smallest mean of the fragility functions for the damage state “None/Light” is 0.1061 g [32]. This indicates that, for a magnitude 5 earthquake, most fire stations are in a “None/Light” damage state. The regression equations are particularly useful to provide a rapid estimation of the expected number of fire stations in each damage state for a given magnitude with consideration of the uncertainty in the location of future earthquake events. The sensitivity of the results to the choice of the sets of GMPEs is outside the scope of this research. On the other hand, it is worth discussing the effect of using other GMPEs. A comparative assessment of predicted intensities of the AA13 GMPEs and next generation ground motion models GMPEs in Eastern North America (NGA-East) [38] has demonstrated that for many hazard scenarios more of the NGA-East GMPEs lie above the central AA13 relation than below which will increase mean ground motions and thus hazard [39]. Such an increase in the hazard would eventually shift the points of the probabilities shown in Figure 8 to the right, thus predicting more damage probabilities for a given magnitude.
Table 6.
Damage state prediction equations for Montreal fire stations.
Based on the predicted damage results, more detailed structural evaluations using advanced nonlinear static or dynamic analysis can be prioritized for vulnerable stations, and proposals for seismic strengthening can be made such as the improvement of the connections between masonry walls and floors, reinforcement of masonry walls with composite materials and adding shear walls for improved stiffness and strength [40].
5. Conclusions
The development of a methodology for the seismic assessment of fire stations through a simulated scenario-based approach has been presented in this article. The methodology was applied to Montreal fire stations, and the assessment is justified by the risk of post-earthquake fires on Montreal Island. The goal of this study was to identify the most vulnerable fire stations so that authorities can prioritize seismic rehabilitation activities and interventions. The article detailed a framework for damage assessment based on four models: seismic hazard, inventory, fragility and impact model. The seismic hazard model represents the spatial distribution of shakes giving the intensity measure Sa(1.0s) at each site. The inventory model defines a classification of fire station classes based on the structural characterization and the construction code used. The fragility model provides fragility functions giving the relationship between the intensity measure and the damage probabilities. The impact model converts damage probabilities into communicable terms of damage states. Various simulations of earthquakes have been conducted with variations of the epicenter location and magnitude. The results of these simulations are statistical data on Montreal fire stations’ expected damage states, which allows an expression of a relationship between magnitude and expected damage states. The selection of the grid points for the epicentral showed a minor impact on the predicted damage stat probabilities. Simplified regression equations for the rapid prediction of a damage state distribution for a given magnitude have been developed, which allows for the rapid assessment of seismic risk for the purpose of guiding mitigation planning and emergency response activities.
Author Contributions
T.L.: methodology, data collection, formal analysis, writing—original draft preparation; A.A.E.E.: conceptualization, methodology, supervision, funding acquisition, writing—review and editing; M.-J.N.: methodology, supervision, funding acquisition, writing—review and editing. All authors have read and agreed to the published version of the manuscript.
Funding
This research was funded by Ècole de technolgie superieure.
Data Availability Statement
The original contributions presented in this study are included in the article. Further inquiries can be directed to the corresponding author.
Conflicts of Interest
The authors declare no conflicts of interest.
References
- Sezgin, S.K.; Sakcalı, G.B.; Özen, S.; Yıldırım, E.; Avcı, E.; Bayhan, B.; Çağlar, N. Reconnaissance report on damage caused by the February 6, 2023, Kahramanmaraş Earthquakes in reinforced-concrete structures. J. Build. Eng. 2024, 89, 109200. [Google Scholar] [CrossRef]
- Goda, K.; Mori, N.; Miyashita, T.; De Risi, R.; Chang, Z. Near-fault ground motions and regional shaking damage assessment of the 2024 Noto Peninsula Earthquake in Japan. Bull. Earthq. Eng. 2025, 23, 1829–1858. [Google Scholar] [CrossRef]
- Mousavi, S.; Bagchi, A.; Kodur, V.K. Review of post-earthquake fire hazard to building structures. Can. J. Civ. Eng. 2008, 35, 689–698. [Google Scholar] [CrossRef]
- Scawthorn, C.; Eidinger, J.M.; Schiff, A. (Eds.) Fire Following Earthquake; ASCE: Reston, VA, USA, 2005. [Google Scholar]
- Schencking, J.C. The Great Kanto Earthquake and the culture of catastrophe and reconstruction in 1920s Japan. J. Jpn. Stud. 2008, 34, 295–331. [Google Scholar] [CrossRef]
- Himoto, K. Comparative analysis of post-earthquake fires in Japan from 1995 to 2017. Fire Technol. 2019, 55, 935–961. [Google Scholar] [CrossRef]
- Scawthorn, C. Fire Following Earthquake in the Montreal Region; Institute for Catastrophic Loss Reduction: Toronto, ON, Canada, 2019. [Google Scholar]
- Scawthorn, C. Fire Following Earthquake in the Vancouver Region; Institute for Catastrophic Loss Reduction: Toronto, ON, Canada, 2020. [Google Scholar]
- Hwang, H.H.M.; Lin, H.; Huo, J.-R. Seismic performance evaluation of fire stations in Shelby County, Tennessee. Earthq. Spectra 1997, 13, 759–772. [Google Scholar] [CrossRef]
- Miniati, R.; Iasio, C. Methodology for rapid seismic risk assessment of health structures: Case study of the hospital system in Florence, Italy. Int. J. Disaster Risk Reduct. 2012, 2, 16–24. [Google Scholar] [CrossRef]
- Favier, P.; Poulos, A.; Vásquez, J.A.; Aguirre, P.; de la Llera, J.C. Seismic risk assessment of an emergency department of a Chilean hospital using a patient-oriented performance model. Earthq. Spectra 2019, 35, 489–512. [Google Scholar] [CrossRef]
- Natural Resources Canada. Earthquake Zones in Eastern Canada. Available online: https://www.seismescanada.rncan.gc.ca/zones/eastcan-en.php#WQSZ (accessed on 1 December 2024).
- Ma, S.; Eaton, D.W. Western Quebec seismic zone (Canada): Clustered, midcrustal seismicity along a Mesozoic hot spot track. J. Geophys. Res. 2007, 112. [Google Scholar] [CrossRef]
- National Research Council of Canada (NRCC). National Building Code of Canada (NBCC) 2020; National Research Council of Canada (NRCC): Ottawa, ON, Canada, 2020; Volume 1, Division B, Part 4; pp. 4-1–4-127.
- Atkinson, G.M.; Adams, J. Ground motion prediction equations for application to the 2015 Canadian national seismic hazard maps. Can. J. Civ. Eng. 2013, 40, 988–998. [Google Scholar] [CrossRef]
- Service de Sécurité Incendie de Montréal. Rapport des Activités 2022. Available online: https://sim.montreal.ca/rapport-des-activites (accessed on 1 December 2024).
- Statistique Canada. Profil du Recensement, Recensement de la Population de 2021. Produit nº 98-316-X2021001 au Catalogue de Statistique Canada. Available online: https://www12.statcan.gc.ca/census-recensement/2021/dp-pd/prof/index.cfm?Lang=F (accessed on 1 December 2024).
- Roca, A.; Goula, X.; Oliveira, C.S. (Eds.) Assessing and Managing Earthquake Risk: Geo-Scientific and Engineering Knowledge for Earthquake Risk Mitigation: Developments, Tools, Techniques; Springer: Berlin/Heidelberg, Germany, 2006. [Google Scholar]
- Krinitzsky, E.L. Deterministic versus probabilistic seismic hazard analysis for critical structures. Eng. Geol. 1995, 40, 1–7. [Google Scholar] [CrossRef]
- Puri, N.; Jain, A. Deterministic seismic hazard analysis for the state of Haryana, India. Indian Geotech. J. 2015, 46, 164–174. [Google Scholar] [CrossRef]
- Mase, L.Z. Seismic hazard vulnerability of Bengkulu City, Indonesia, based on deterministic seismic hazard analysis. Geotech. Geol. Eng. 2020, 38, 5433–5455. [Google Scholar] [CrossRef]
- Gerstenberger, M.C.; Marzocchi, W.; Allen, T.; Pagani, M.; Adams, J.; Danciu, L.; Field, E.H.; Fujiwara, H.; Luco, N.; Ma, K.; et al. Probabilistic seismic hazard analysis at regional and national scales: State of the art and future challenges. Rev. Geophys. 2020, 58, e2019RG000653. [Google Scholar] [CrossRef]
- Peñarubia, H.C.; Johnson, K.L.; Styron, R.H.; Bacolcol, T.C.; Sevilla, W.I.G.; Perez, J.S.; Bonita, J.D.; Narag, I.C.; Solidum, R.U., Jr.; Pagani, M.M.; et al. Probabilistic seismic hazard analysis model for the Philippines. Earthq. Spectra. 2020, 36, 44–68. [Google Scholar] [CrossRef]
- Robinson, T.R.; Rosser, N.J.; Densmore, A.L.; Oven, K.J.; Shrestha, S.N.; Guragain, R. Use of scenario ensembles for deriving seismic risk. Proc. Natl. Acad. Sci. USA 2018, 115, E9532–E9541. [Google Scholar] [CrossRef]
- Nollet, M.-J.; El Ezz, A.A.; Surprenant, O.; Smirnoff, A.; Nastev, M. Earthquake magnitude and shaking intensity dependent fragility functions for rapid risk assessment of buildings. Geosciences 2018, 8, 16. [Google Scholar] [CrossRef]
- El Ezz, A.A.; Smirnoff, A.; Nastev, M.; Nollet, M.-J.; McGrath, H. ER2-Earthquake: Interactive web-application for urban seismic risk assessment. Int. J. Disaster Risk Reduct. 2019, 34, 326–336. [Google Scholar] [CrossRef]
- Halchuk, S.; Allen, T.I.; Adams, J.; Rogers, G.C. Fifth Generation Seismic Hazard Model Input Files as Proposed to Produce Values for the 2015 National Building Code of Canada; Geol. Surv; Canada, Open-File Report. 7576; Natural Resources Canada: Ottawa, ON, Canada, 2014. [Google Scholar]
- Humar, J. Background to some of the seismic design provisions of the 2015 National Building Code of Canada. Can. J. Civ. Eng. 2015, 42, 940–952. [Google Scholar] [CrossRef]
- Rosset, P.; Bour-Belvaux, M.; Chouinard, L. Microzonation models for Montreal with respect to VS 30. Bull. Earthq. Eng. 2015, 13, 2225–2239. [Google Scholar] [CrossRef]
- Federal Emergency Management Agency. Multi-Hazard Loss Estimation Methodology: Earthquake Model HAZUS-MH 2.1: Technical Manual; Federal Emergency Management Agency: Washington, DC, USA, 2011.
- Ruggieri, S.; Calò, M.; Cardellicchio, A.; Uva, G. Analytical-mechanical based framework for seismic overall fragility analysis of existing RC buildings in town compartments. Bull. Earthq. Eng. 2022, 20, 8179–8216. [Google Scholar] [CrossRef]
- Lessault, T. Évaluation de la Vulnérabilité Sismique des Casernes de Pompiers de Montréal. Master’s Thesis, École de Technologie Supérieure, Montréal, QC, Canada, 2023. [Google Scholar]
- Données Québec. Caserne des Pompiers. 2023. Available online: https://www.donneesquebec.ca/recherche/dataset/vmtl-casernes-pompiers/resource/5b9c0e1d-3f75-4e98-b53d-6e979c18cc98 (accessed on 1 December 2023).
- Service de Sécurité Incendie de Montréal. Building Maps-Fire Stations. Available online: https://sim.montreal.ca/en/map-fire-stations (accessed on 1 December 2023).
- Mitchell, D.; Paultre, P.; Tinawi, R.; Saatcioglu, M.; Tremblay, R.; Elwood, K.; Adams, J.; DeVall, R. Evolution of seismic design provisions in the National building code of Canada. Can. J. Civ. Eng. 2010, 37, 1157–1170. [Google Scholar] [CrossRef]
- Bai, J.-W.; Hueste, M.B.D.; Gardoni, P. Probabilistic assessment of structural damage due to earthquakes for buildings in Mid-America. J. Struct. Eng. 2009, 135, 1155–1163. [Google Scholar] [CrossRef]
- Kolaj, M.; Halchuk, S.C.; Adams, J.E. Sixth-Generation Seismic Hazard Model of Canada: Grid Values of Mean Hazard to be Used with the 2020 National Building Code of Canada; (Open File 8950); Natural Resources Canada: Ottawa, ON, Canada, 2023. [Google Scholar]
- Goulet, C.A.; Bozorgnia, Y.; Kuehn, N.; Al Atik, L.; Youngs, R.R.; Graves, R.W.; Atkinson, G.M. PEER 2017/03-NGA-East Ground-Motion Models for The U.S. Geological Survey National Seismic Hazard Maps; PEER Report No. 2017/03; Pacific Earthquake Engineering Research Center: Berkeley, CA, USA, 2017; pp. 1–180. [Google Scholar]
- Kolaj, M.; Allen, T.; Mayfield, R.; Adams, J.; Halchuk, S. Ground-motion models for the 6th Generation Seismic Hazard Model of Canada. In Proceedings of the 12th Canadian Conference on Earthquake Engineering, Quebec, QC, Canada, 17–20 June 2019; pp. 17–20. [Google Scholar]
- Federal Emergency Management Agency. Techniques for the Seismic Rehabilitation of Existing Buildings; FEMA 547; Federal Emergency Management Agency: Washington, DC, USA, 2006.
Disclaimer/Publisher’s Note: The statements, opinions and data contained in all publications are solely those of the individual author(s) and contributor(s) and not of MDPI and/or the editor(s). MDPI and/or the editor(s) disclaim responsibility for any injury to people or property resulting from any ideas, methods, instructions or products referred to in the content. |
© 2025 by the authors. Licensee MDPI, Basel, Switzerland. This article is an open access article distributed under the terms and conditions of the Creative Commons Attribution (CC BY) license (https://creativecommons.org/licenses/by/4.0/).