Article

The Identification of Flood-Prone Areas in Accra, Ghana Using a Hydrological Screening Method

by
Thomas Balstrøm
1,*,
Bent Hasholt
1,
Albert N. M. Allotey
2 and
Prince Martin Gyekye
3
1
Department of Geosciences and Natural Resources Management, Øster Voldgade 10, DK-1350 Copenhagen, Denmark
2
Council for Scientific and Industrial Research—Institute for Scientific and Technological Information, Accra P.O. Box CT 2211, Ghana
3
Department of Soil Science, School of Agriculture, University of Ghana, Legon, Accra P.O. Box LG 25, Ghana
*
Author to whom correspondence should be addressed.
GeoHazards 2024, 5(3), 755-779; https://doi.org/10.3390/geohazards5030038
Submission received: 13 May 2024 / Revised: 9 July 2024 / Accepted: 17 July 2024 / Published: 22 July 2024
(This article belongs to the Collection Geohazard Characterization, Modeling, and Risk Assessment)

Abstract

:
Information about flood-prone areas in Accra, Ghana, acting as obstacles to the main infrastructure was required as input for a transportation study. We successfully identified these areas using the hydrologic screening software Arc-Malstrøm. Earlier studies have used a digital elevation model with a spatial resolution of 30 m, which unfortunately is not a true digital terrain model as it includes elevations from ground surfaces, structures, and vegetation. However, this study shows the benefits of using a hydro-conditioned 10 m resolution digital terrain model from AirbusTM in predicting flood-prone areas. The entire investigation area covers approximately 23% of the Greater Accra Metropolitan Area (GAMA), including the entire Odaw River basin. In this area, 5018 landscape sinks with water depths ≥ 0.1 m and volumes ≥ 5 m3 were identified. From this, 163 flood-induced roadblocks were found with maximum depths ≥ 0.3 m, rendering them impassable to normal vehicles. Beyond the adaptation of infrastructures in the hydro-conditioning process, more steps were necessary along the Odaw River’s southernmost course before its outlet into the Gulf of Guinea due to local trash accumulation reflected in the DTM. To address the unforeseen stochastic flood effects from trash piling up along the river channels, a simulation was conducted showing the upstream consequences caused by a trash barrier at the river’s outlet into the ocean. This leads to a discussion of the hazards posed by improper waste handling, coupled with increasing runoff predictions within the river’s drainage basin. Finally, we discuss local alternatives to the establishment of large central retention and detention basins to reduce flood-prone areas in GAMA during periods when stormwater-induced floods become more frequent, primarily due to uncontrolled urbanization increasing runoff volumes.

1. Introduction

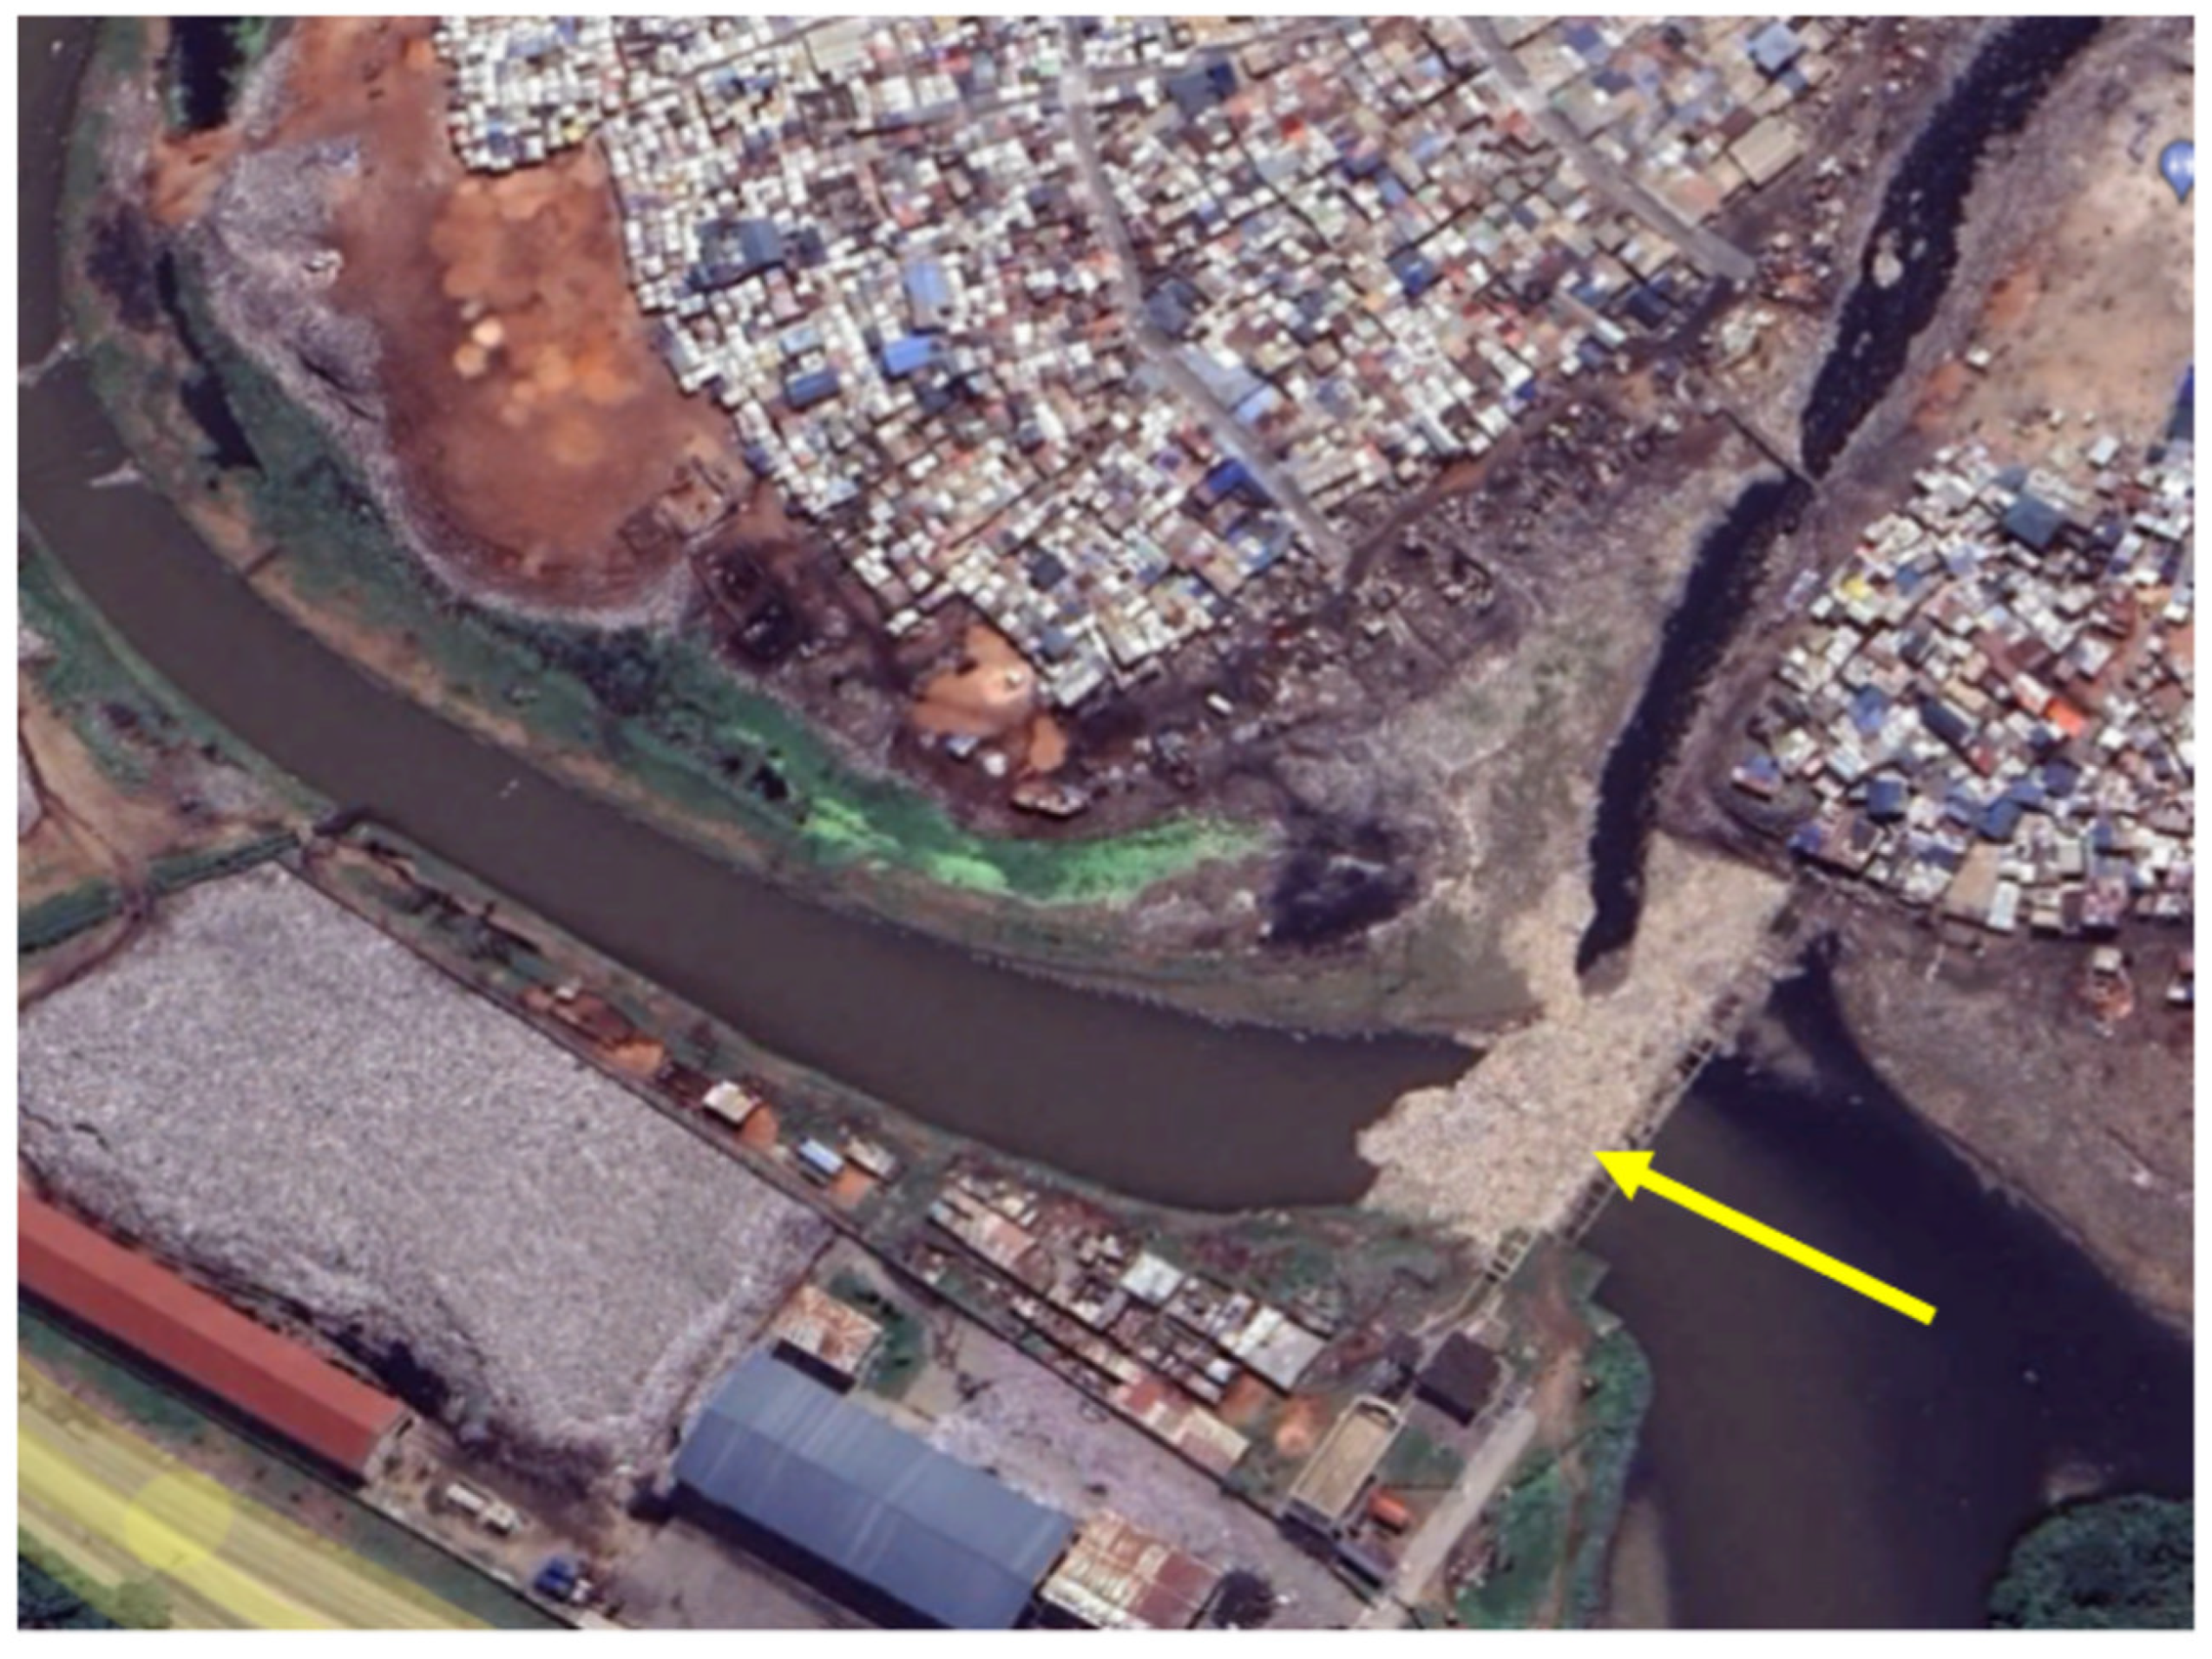
Like many other rapidly growing cities worldwide, Accra, the capital of Ghana, suffers from recurring floods that cause loss of life and costly property damage [1,2,3,4]. Additionally, citizens living in affected areas face severe problems when commuting to and from work, school, or transporting goods through flooded infrastructure [5]. Investigations of climate records for Accra by the authors and [6] show no significant increase in precipitation trends for the Greater Accra Metropolitan Area (GAMA) from 1950 to 2020. Meanwhile, according to [7], observations in Ghana indicate that climate change has considerably shortened the rainy season and increased the intensity of rainfall events, leading to frequent flooding. Another factor contributing to the impacts of floods in the GAMA is the extensive conversion of farmland into urbanized areas and paved infrastructures reducing soil infiltration. This transformation causes substantial increases in surface runoff volumes [8]. In Accra, this results in the undercutting and dislocation of concrete blocks that stabilize the sides of storm drains and river channels, as seen in Figure 1, leading to the local ponding of stormwater. Additionally, indiscriminate littering and trash dumping into the rivers in dry periods waiting for the garbage to be carried away by stormwater has been ongoing for years [9]; see Figure 2 and Figure 3 and Video S1 shared in the Supplemental Materials Section captured in October 2023. Beyond the devastating pollution effects on the marine environment when the waste is carried into the Gulf of Guinea [10], waste-clogging at road overpasses causes massive floods upstream. Moreover, floods occurring near the outlet into the sea at the Korle Lagoon, next to one of the world’s most heavily contaminated industrial areas, worsen pollution in the flooded regions [11].
Several research projects have contributed to understanding the major causes of flood risks in Accra and their societal consequences. However, the CLIMACCESS project [12], active from 2017 to 2023, collaborated with Ghanaian partners to investigate the links between climate change scenarios, urban accessibility, and the mobility of urban residents in GAMA, in particular.
Traditionally, flood-prone areas are identified using hydrodynamic 2D models. However, the Ghana Meteorological Agency [13] primarily provides rainfall data on a daily cumulative basis, lacking the time dimension for all precipitation events. Additionally, the absence of discharge measurements from official agencies makes it very challenging to estimate the propagation of local discharges throughout a drainage basin [7,14,15,16]. Consequently, no hydro-dynamic modelling software is used in this investigation.
Instead, the primary objective of this research is to demonstrate how a GIS-based hydrologic stormwater screening model, Arc-Malstrøm [17], can estimate flooded extents, depths of landscape sinks (bluespots), and critical runoff volumes along major transportation corridors, adding a new dimension to the modelling of intra-urban mobility [18]. The flooded extents and depths are presented for uniform rain events in the range of 30–150 mm added to the Odaw River basin and neighbouring basins in GAMA. In this context, the secondary objective is to demonstrate the upstream flood consequences caused by a simulated trash barrier at the Odaw River’s outlet into the Gulf of Guinea. This location was selected based on field inspections showing clear evidence of waste piled up along the Korle Lagoon’s extent.
The hydrological screening uses a satellite-based 10 m resolution digital elevation model (DTM) procured from AirbusTM [19]. Thus, this study is the first documented hydrologic analysis for the region based on a medium-resolution DTM, providing a more precise delineation of flooded extents and depths compared to previous studies that used a 30 m digital elevation model (DEM) from NASA’s SRTM missions [14,15,16,20]. Notably, a DEM is not a true DTM as it includes both the ground surface, structures, and vegetation. Due to the enhanced resolution of the procured DTM, occurrences of piled trash and dislocated concrete blocks stabilizing the river channels in the Odaw River caused disruptions of the modelled runoff. Moreover, initial results revealed that since the DTM represents the upper level of roads and railroads overpassing rivers, the modelled runoff was locally blocked causing erroneous predictions of upstream flooded areas. Therefore, the third objective is to demonstrate how to prepare a DTM to simulate unhindered runoff. The fourth objective is to demonstrate how a satellite-based land cover map combined with a soil map provides more realistic surface runoff estimations for semi- and totally built-up land. Finally, the fifth objective is to discuss the potential of establishing a few large detention and retention basins, as proposed in GAMA by [14] versus several local adaptation initiatives to mitigate the consequences of future floods.

2. Study Area

2.1. Location

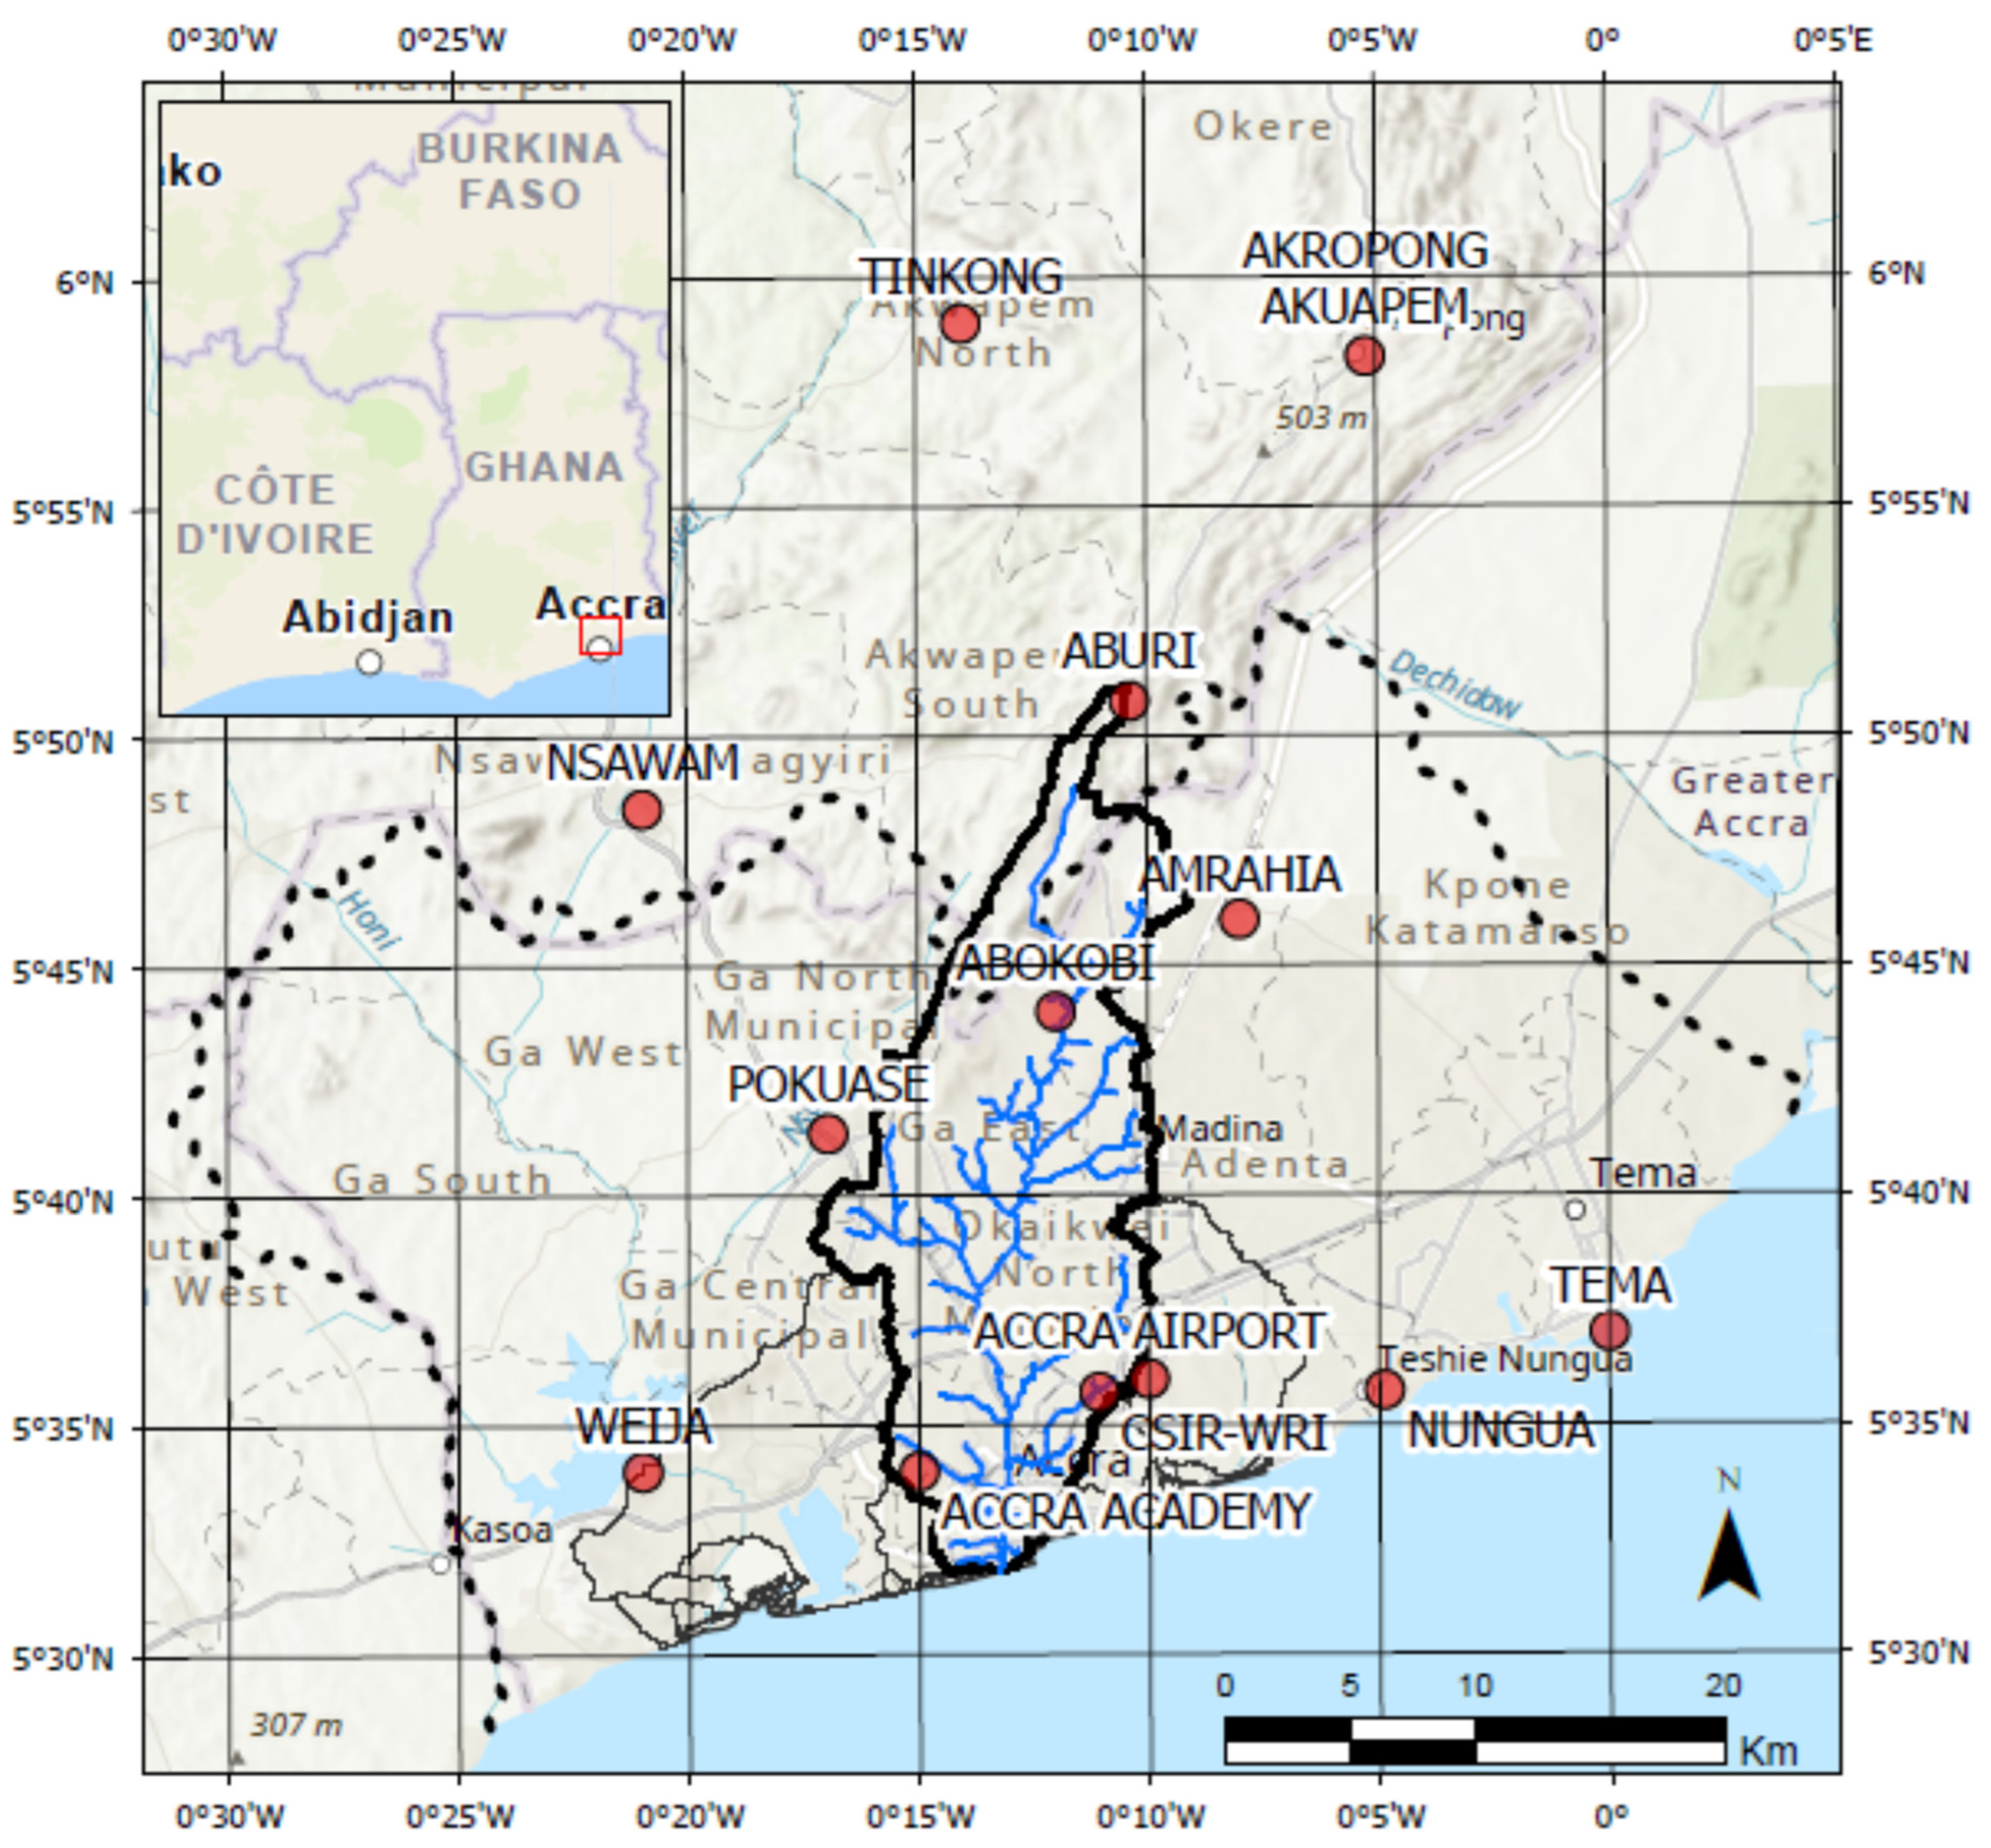
The study area is located in the southern part of GAMA, and the main drainage basin causing flood problems to Accra covers the central Odaw River basin extending from Aburi in the north at 5°51′ N to the river’s outlet into Korle Lagoon next to the Gulf of Guinea at 5°31′ N, see Figure 4. The drainage basin’s western–eastern extent is from Ofankor at 0°17′ W to Adenta at 0°9′ W. Its northern part is dominated by the Akwapim Hills with a max. elevation of 461 m asl. South of the hills, the terrain abruptly turns into Accra Plains with elevation values around 110 m asl. gently decreasing towards 4–5 m asl. downtown Accra. The main drainage basin’s area covers 269.8 km2 and the max. flow length throughout the drainage basin is 44.6 km.

2.2. Climate

GAMA is situated in the dry equatorial region within the intertropical convergence zone with two annual rainfall maxima in the main rain season from May to July and a minor one from September to November originating from two tropical airmasses: The dry continental Harmattan winds coming from the Sahara Desert during the fall/winter and the moister maritime monsoon winds arising from the Atlantic Ocean in the summer causing heavy precipitation [21]. These dynamics create annual average rainfalls for Accra (a low for Ghana) with 810 mm (1990–2020) measured at Kotoka Airport [13] like the 811 mm found by [9] for the period of 1960–2010 with June as its wettest month (205 mm) and January as its driest (15 mm). Temperatures for Accra range from 23 to 33 °C, coolest in August and warmest in February.

2.3. Geology

The region’s geology is mainly developed from the Precambrian Dahomeyan deposit dominated by metamorphic schists and gneiss, and the Togo formations are dominated by quartzites, schists, and sedimentary rocks [22,23]. The soil types developed are described in Section 3.2.

2.4. Vegetation

The Odaw River basin formerly included savannah grass and sporadic neem trees (Azadirachta indica) in the south and savannah semi-rain forest in the north reflecting the topography of the GAMA; grasses at the upper slope positions and trees with grass undergrowth are at the middle, lower, and bottom slope positions [24]. However, the GAMA is the most urbanized region in Ghana. As a result, a sizable part of the region’s natural vegetation has been extensively cleared and replaced by residential and commercial development [25] seriously increasing the runoff, but also the soil erosion [26].

3. Materials and Methods

3.1. Rainfall Data

The primary purpose of investigating rainfall data was twofold: (a) to reveal possible trends in recent years for the distribution of extreme rainfalls, and (b) to estimate the upper precipitation value for the upcoming stormwater screening. Daily rainfall data (mm) spanning over 51 years from 1970 to 2020 were derived from the Ghana Meteorological Agency in Accra, gathered from 13 synoptic, agrometeorological, and experimental stations covering the study area, except for the coastal region south of latitude 5°34′ N, see Figure 4.
A critical issue for the modelling is the lack of information about the duration and intensity of reported rain events. To validate the modelled occurrences of floods with remotely sensed observations from the Sentinel 2 satellite, it was prudent to obtain more detailed records to obtain information about rain intensities on an hourly basis. As daily summed precipitation data are reported to the meteorological head office via phone from the various weather stations, visits to the local weather stations were necessary to obtain their detailed records. As this task was challenging to accommodate, only one visit was made to obtain data from a specific rain event on 26 April 2020, when flash floods were reported in downtown Accra, and cloud-free satellite images were available for the day after the event. However, although high rainfall intensities were expected on that day, it appeared from the visits that while the summarized rainfall was in the range of 53–76 mm over the main central drainage basin, the rain lasted for 5–7 h. Therefore, this was not a typical stormwater event where precipitation in that range would fall within two hours or less. Meanwhile, 7 stations have not provided data continuously. Consequently, the validation was skipped, and data from 6 stations were investigated ahead, only for the period of 1979–2016.
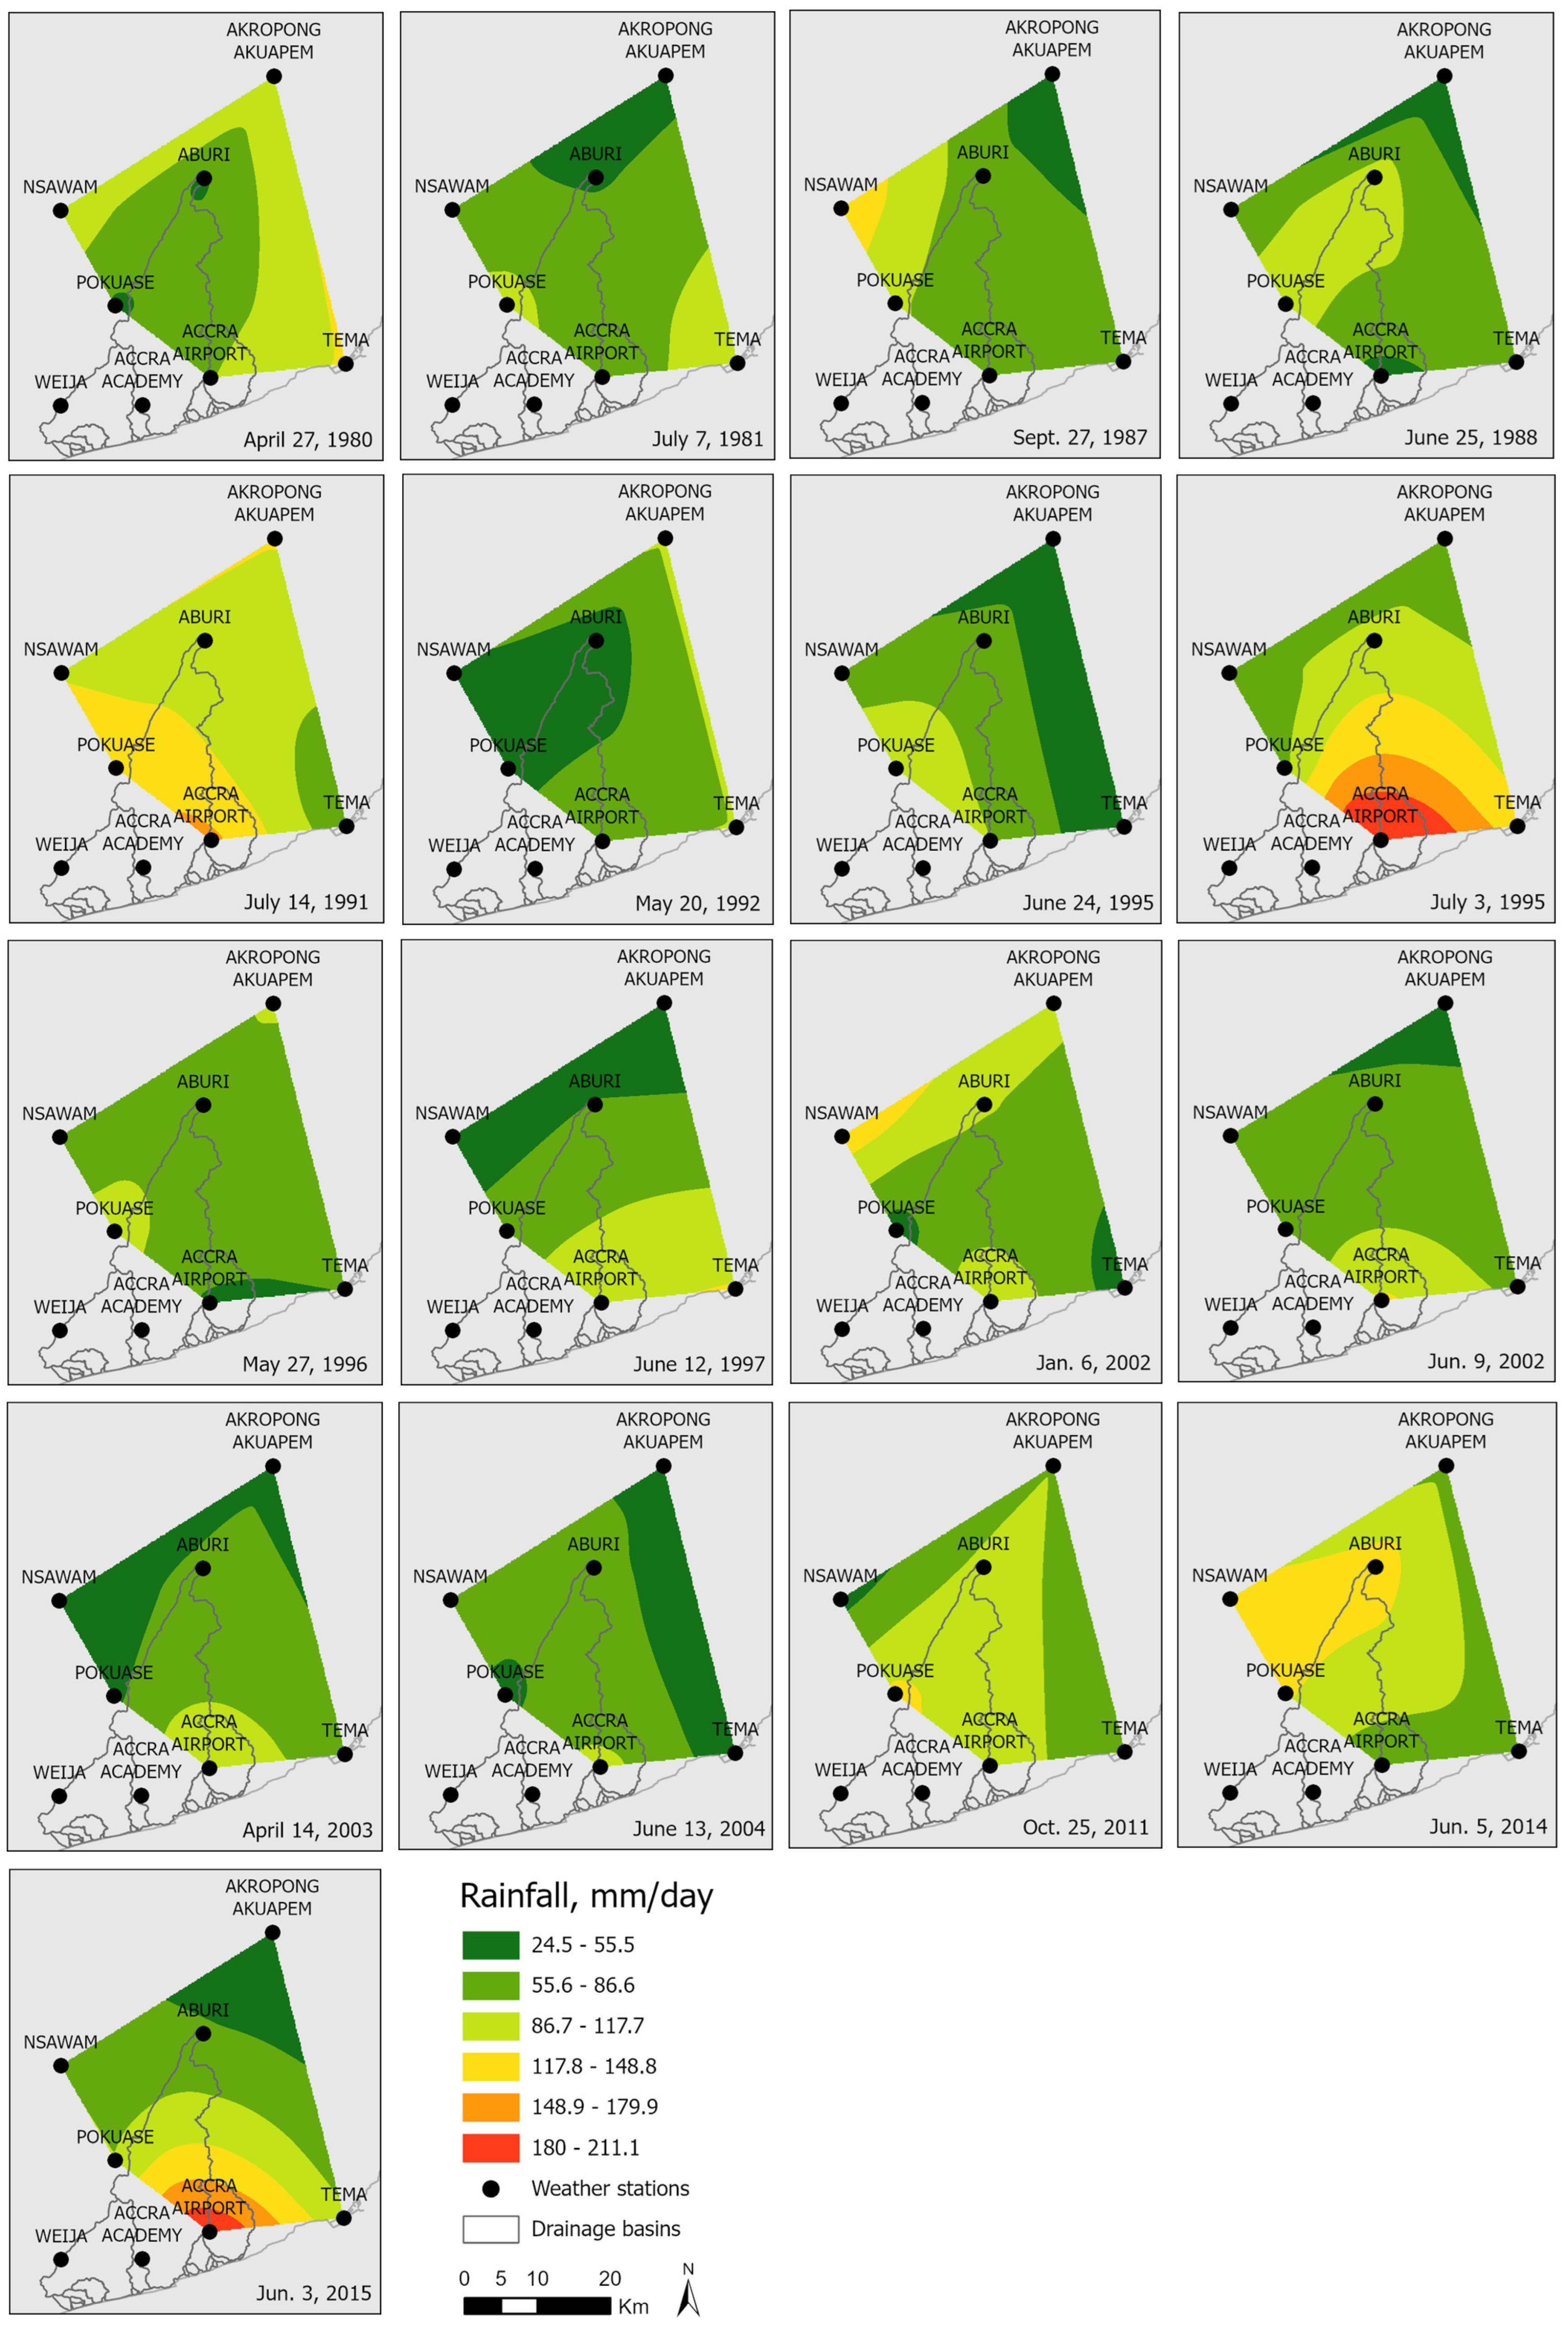
The lack of data covering the southwestern parts of the GAMA is crucial when attempting to model the hydrologic consequences of stormwater events for the individual drainage basins. As can be seen from the standard deviations and ranges (max. precipitation value minus min. value) for the various events in Table 1, the ranges are typically close to the average rainfall values. This is reflected in the spatial distribution presented in Figure 5 where very large observed local precipitation differences disqualify the extrapolation of precipitation outside the convex hull demarcated by the rain stations. The interpolated daily rain values were derived by the deterministic Natural Neighbor method in ArcGIS Pro ver. 3.2.1 [27] using the closest subset of input samples for an unknown location and applying weights to them based on a proportionate area method.

3.2. Land Use/Land Cover Map, Soils, and Soil Infiltration Rates

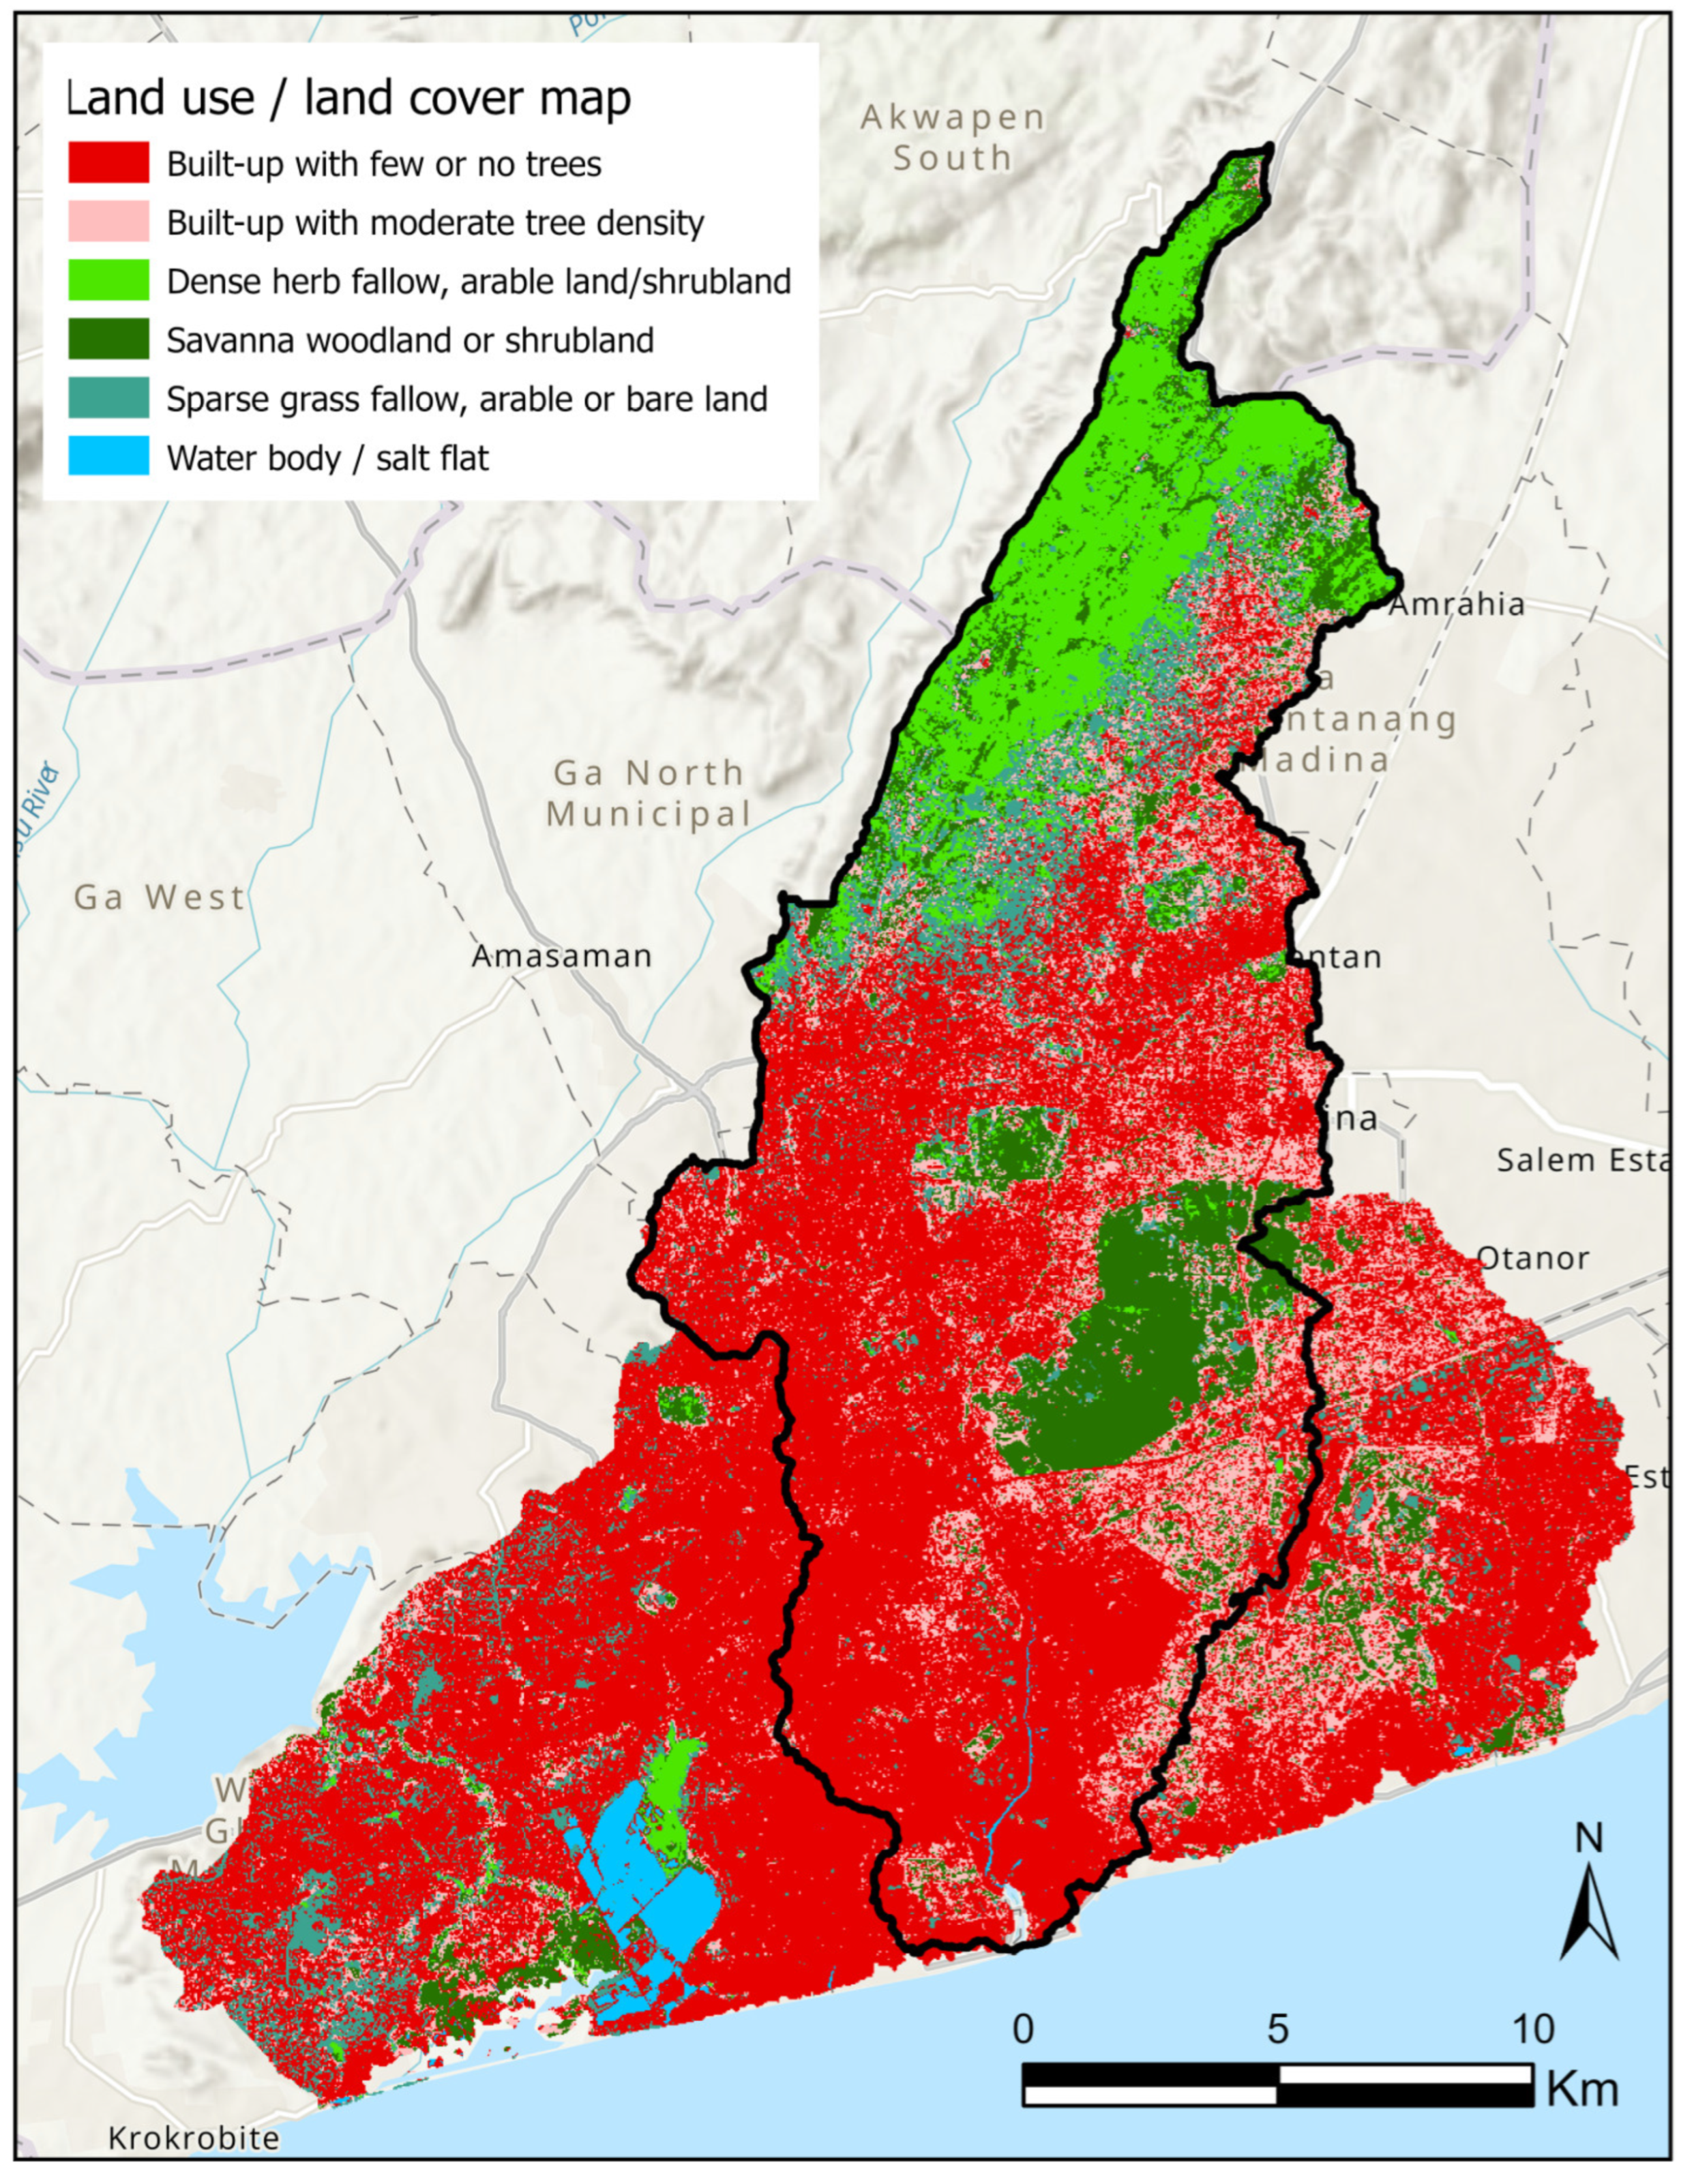
To include the contribution of various land use/land cover types and soil infiltration rates in the stormwater screening, a land cover map for the study area was generated from Landsat 2020 imagery downloaded from [28]. Using ground-truth locations, a supervised maximum likelihood classification algorithm was deployed to classify the drainage basins into 6 land use/land cover types: (1) built-up (settlement) with little or no trees (vegetative cover); (2) built-up with a moderate density of trees; (3) dense herb fallow and arable crop cover/shrubland with scattered farms; (4) savanna woodland or shrubland; (5) sparse grass fallow and arable crop cover/bare surfaces; and (6) waterbody/salt flat, as shown in Figure 6. Through field inspections of this map, an assessment of the local surface imperviousness (solid surface percentage) resulted in the following definitions: 95% for class 1, 80% for class 2, and 0% for the remaining classes.
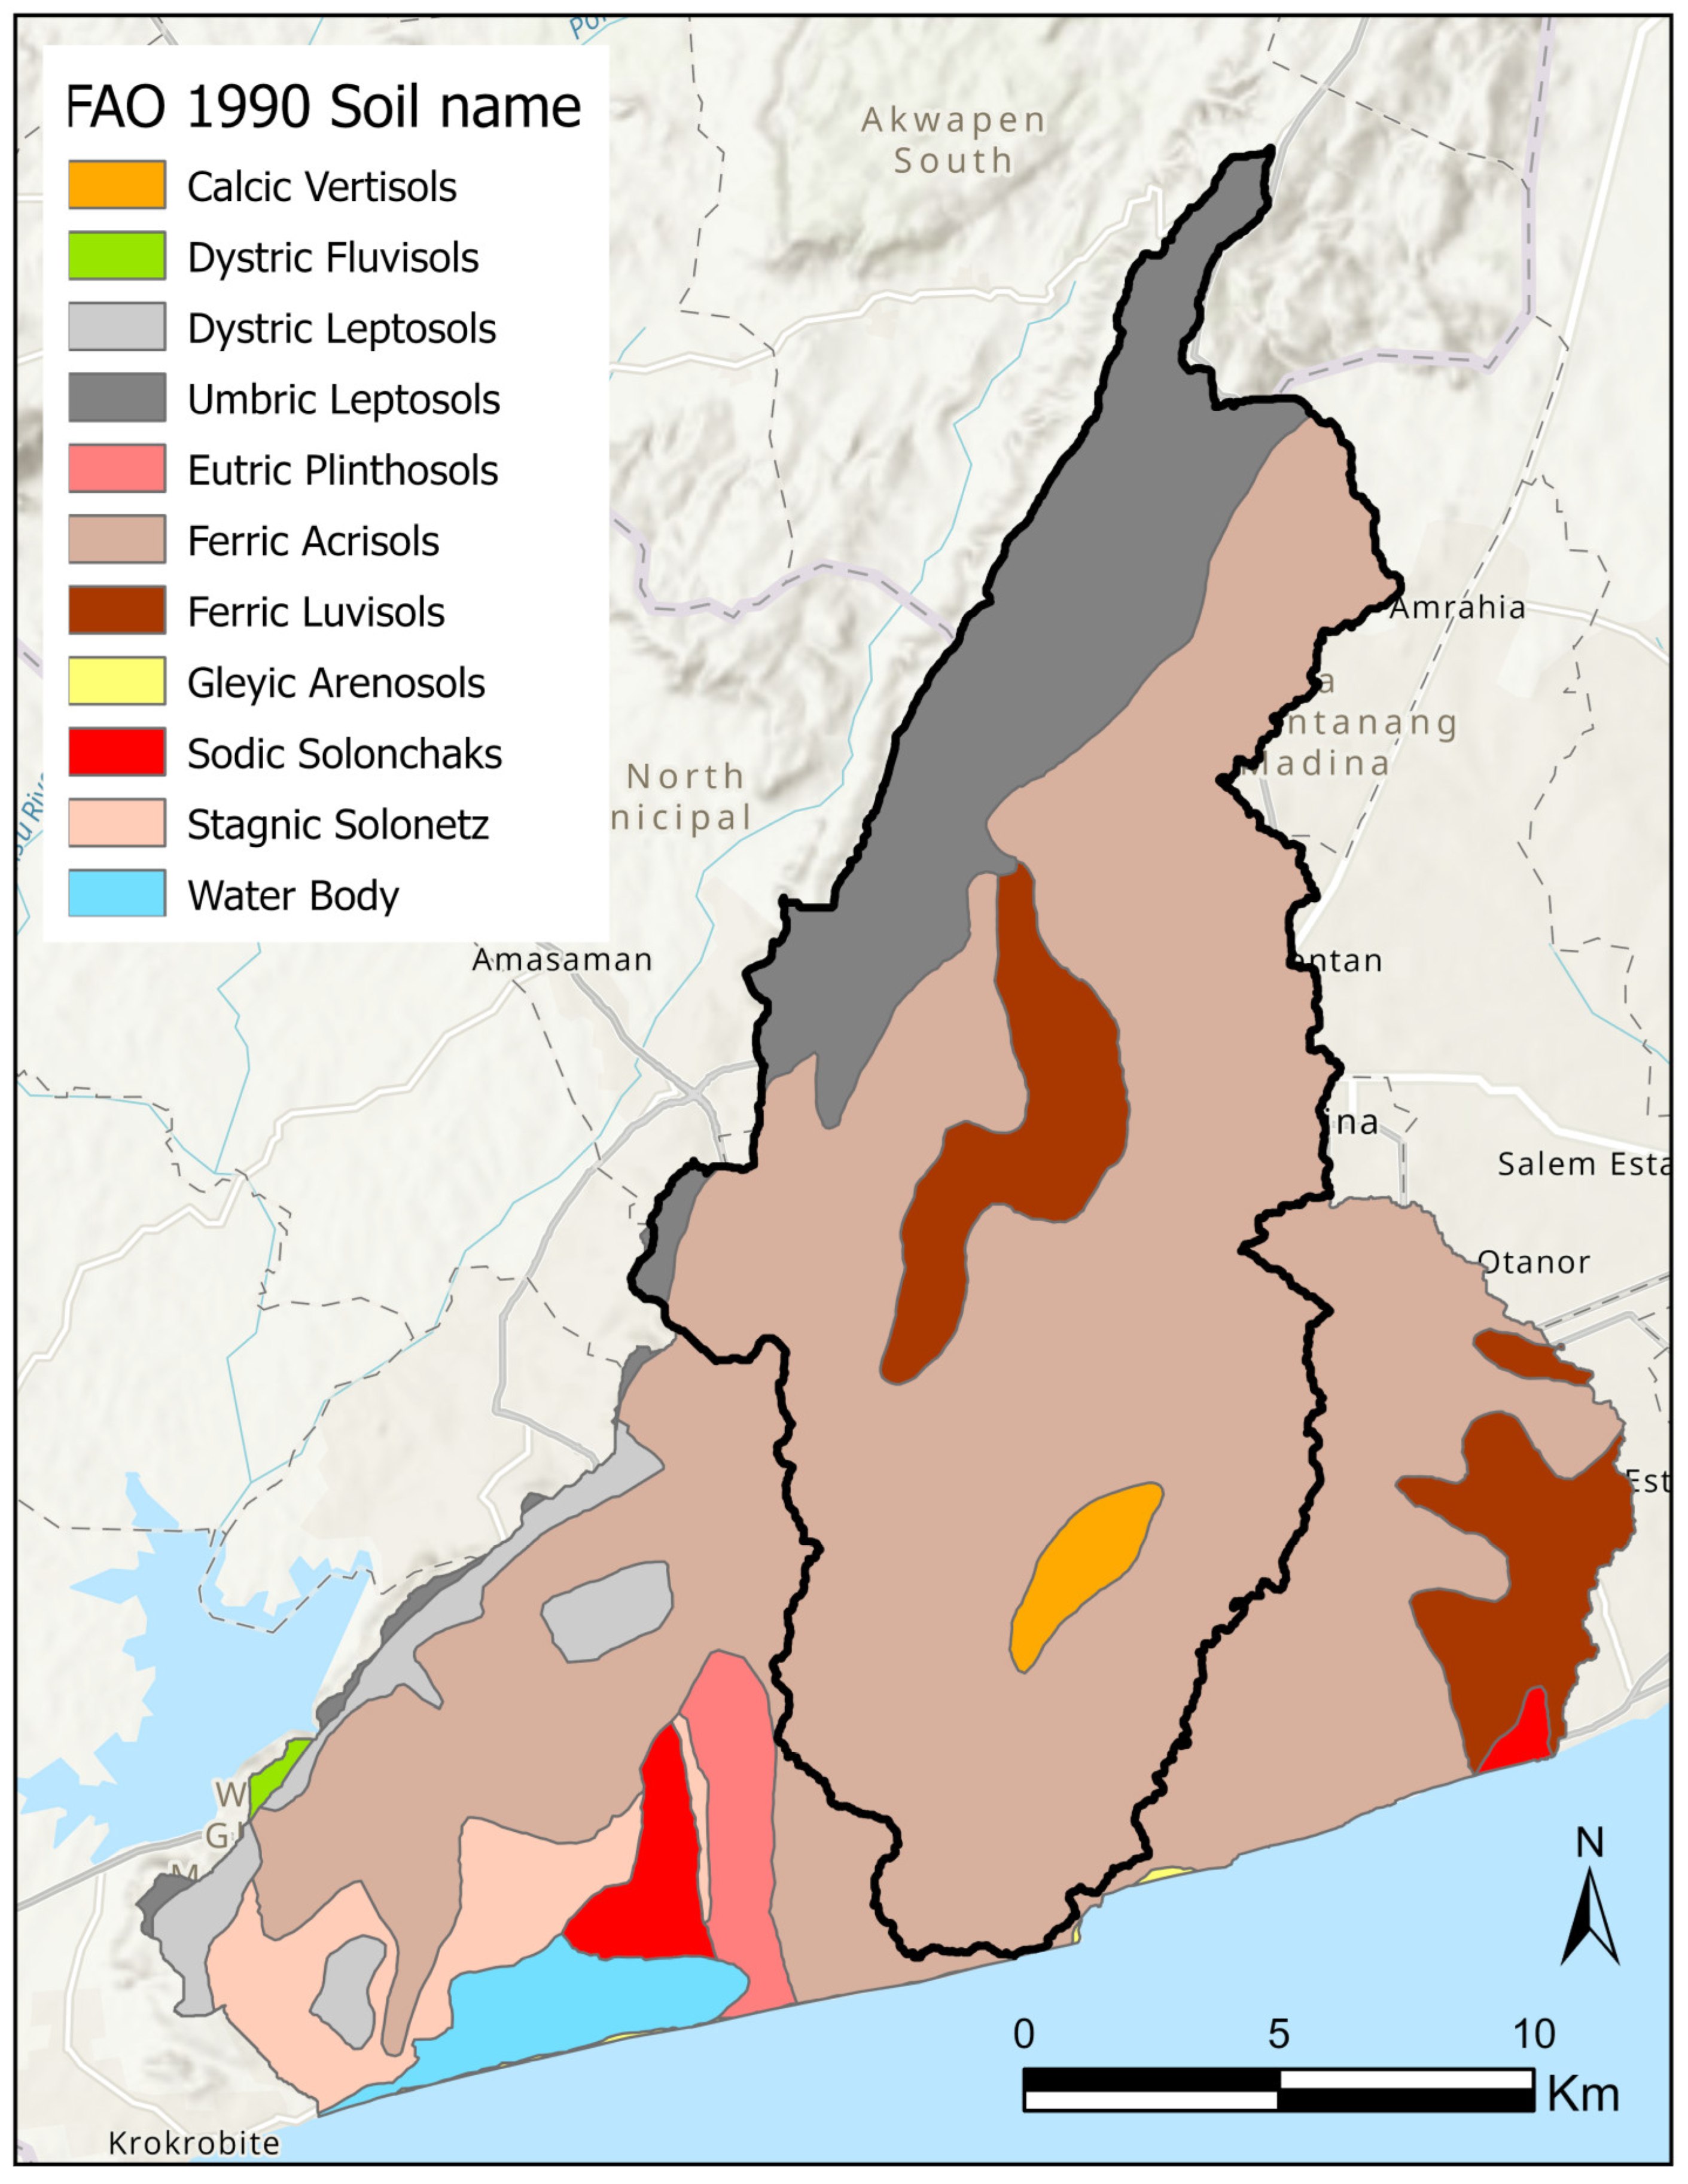
Four major soil groups are found within the Odaw River and adjacent basins according to [24]: Acrisol, Luvisol, Leptosol, and Vertisol, see Figure 7. Leptosol is the dominant soil group in the northern Akwapim Hills with thin topsoils overlying bedrock and having very low infiltration rates. Thus, these soils have poor agricultural potential and are susceptible to heavy erosion on sloping faces. Acrisol is the dominating soil group on the Accra Plains with high amounts of clay in sub-horizons leached from the top layers. Meanwhile, this soil has acidic, depleted, and infertile conditions in the topmost layers although the water retention condition is good. Luvisol dominates at the foot of the Akwapim Hills and near the major streams and has a similar profile development to Acrisol but is richer in cations, making it more fertile. Due to Luvisol’s and Acrisol’s high clay content in the sub-layer, infiltration rates are low to moderate. Vertisol occurs in a small pocket next to the Odaw River, only. It is characterized by high clay content that swells when wet and shrinks when dry. So, although this soil is nutritious, it has its limitations in agricultural production, but has moderate infiltration rates.
The validity of the infiltration data presented in this study is supported by a wide-ranging analysis of soil types, land use systems, and the soils of Ghana’s coastal savannah agroecological zone. While local infiltration data at the sub-dominant soil series level are available and reliable for the GAMA, these detailed soil types are not adequately mapped, especially considering their different disturbance states due to urbanization. This lack of mapping at the sub-dominant series level presents a challenge when integrating soil infiltration estimates with the 10 m resolution DTM. Therefore, as precise infiltration characteristics of the sub-dominant soil series are not captured, approximated soil infiltration rates rely on broader-scale soil group data from a transfer of field observations by [31] from northern Ghana for 4 soil types and from studies by [23,32] to the FAO soil map at a scale of 1:250,000 [29] presented in Figure 7. From measurements of unsaturated and saturated infiltration rates, the total rain infiltration rates (mm/min.), see Table 2, for 1 and 2 h rain events were estimated assuming that all soils had dry moisture conditions when the rain event was initiated.
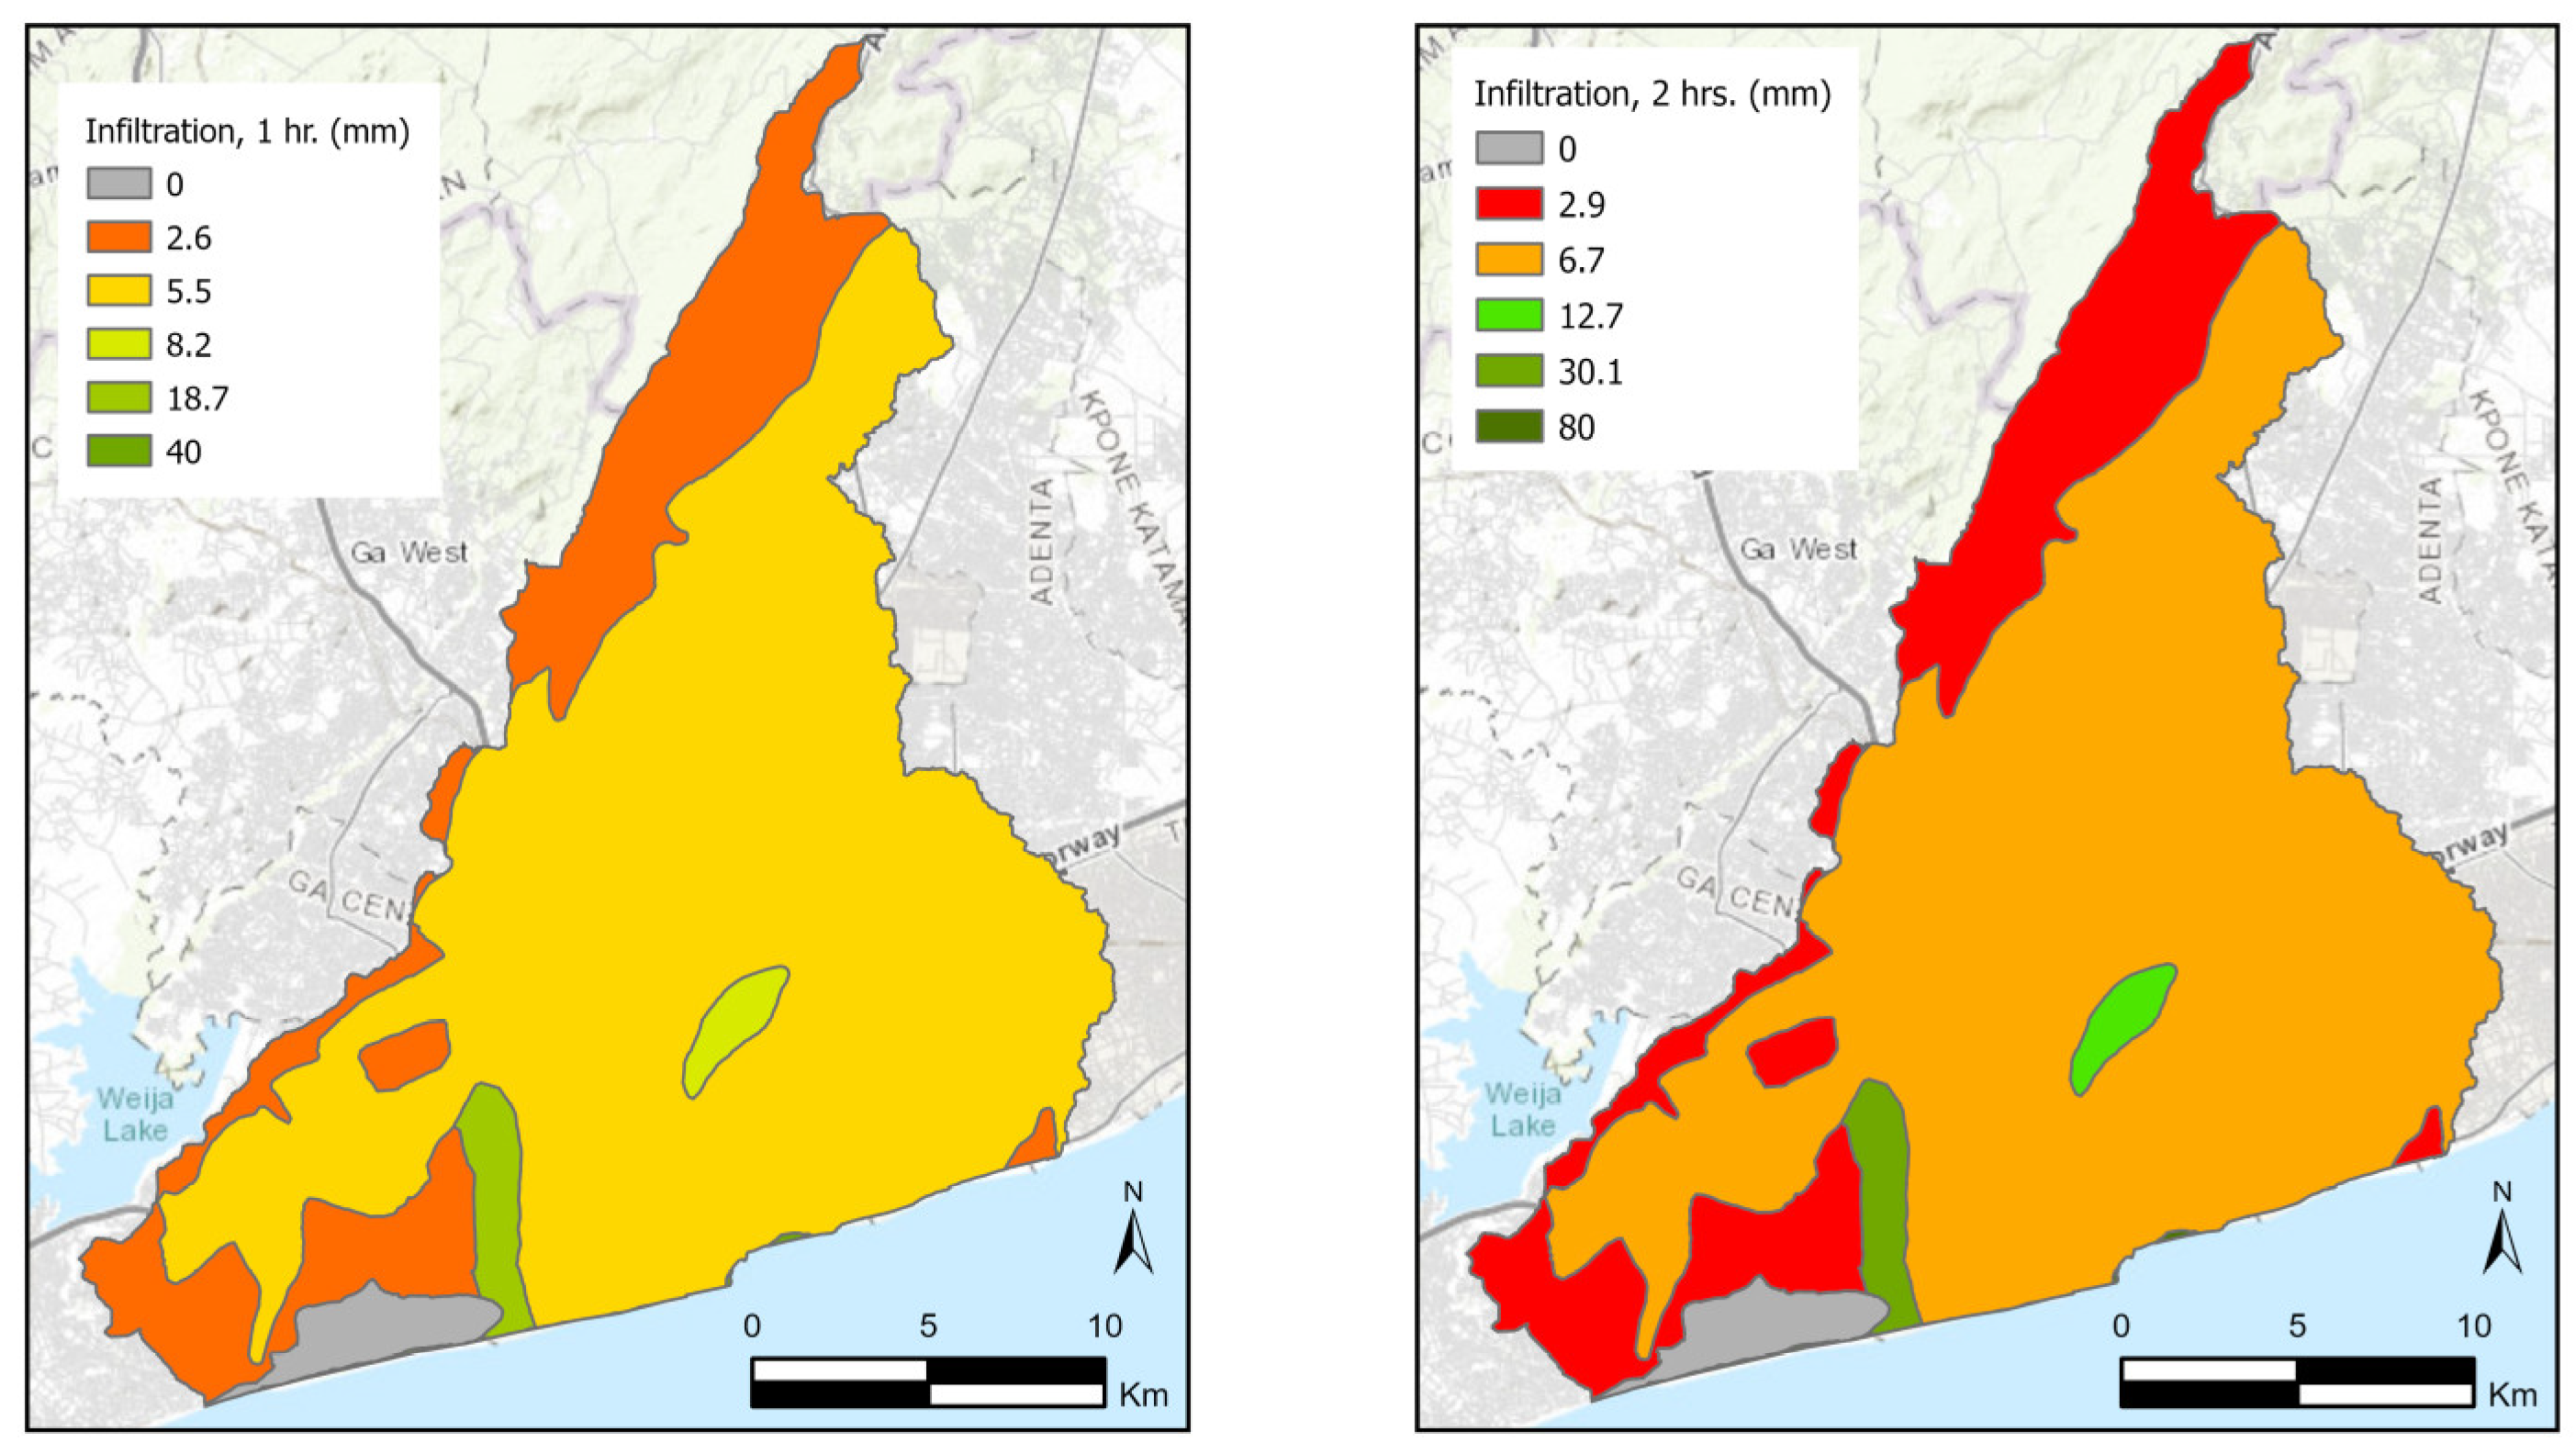
For the modelling of stormwater scenarios, soil infiltration rates corrected for imperviousness were subtracted from each uniform rain event at a local watershed basis to better represent the runoff rain volumes on the ground. Figure 8 shows a map of soil infiltration rates for rainstorms lasting for 1 and 2 h.

3.3. Digital Terrain Model and Added Hydro-Conditioning

A digital terrain model (DTM) covering 538 km2 of the GAMA region was procured from AirbusTM. The model is a composite from several TerraSAR-X stereo pairs of images obtained between 8 March and 1 April 2018. The product, Elevation10, has a spatial resolution of 10 m. The DTM was produced from the removal of vegetation and buildings from a digital surface model (DSM). Unfortunately, to remove artefacts caused by this step, the vendors applied a local mean filter to the elevation data where necessary to produce the DTM causing a slight smoothing of the true ground levels. Thus, local underestimations of the extent and true depths of landscape depressions (bluespots) may occur. Meanwhile, this DTM is a suitable, medium-resolution DTM for hydrologic assessments in countries like Ghana. If more high-resolution data are required, they should be acquired either from LiDAR-based surveys with instruments mounted onboard a small aeroplane or a UAV. Unfortunately, from an economic perspective, this was not feasible for the current project. Meanwhile, a local UAV survey at Santa Matia, Okponglo, and Legon Hall (where the University of Accra resides) in the GAMA [33] covering close to 1 km2 with data in a 0.3 m resolution was carried out by the CLIMACCESS project. The analysis of that dataset demonstrated how the many extra elevation details lead to much improved hydrologic assessments that can be achieved when future high-resolution products become available.
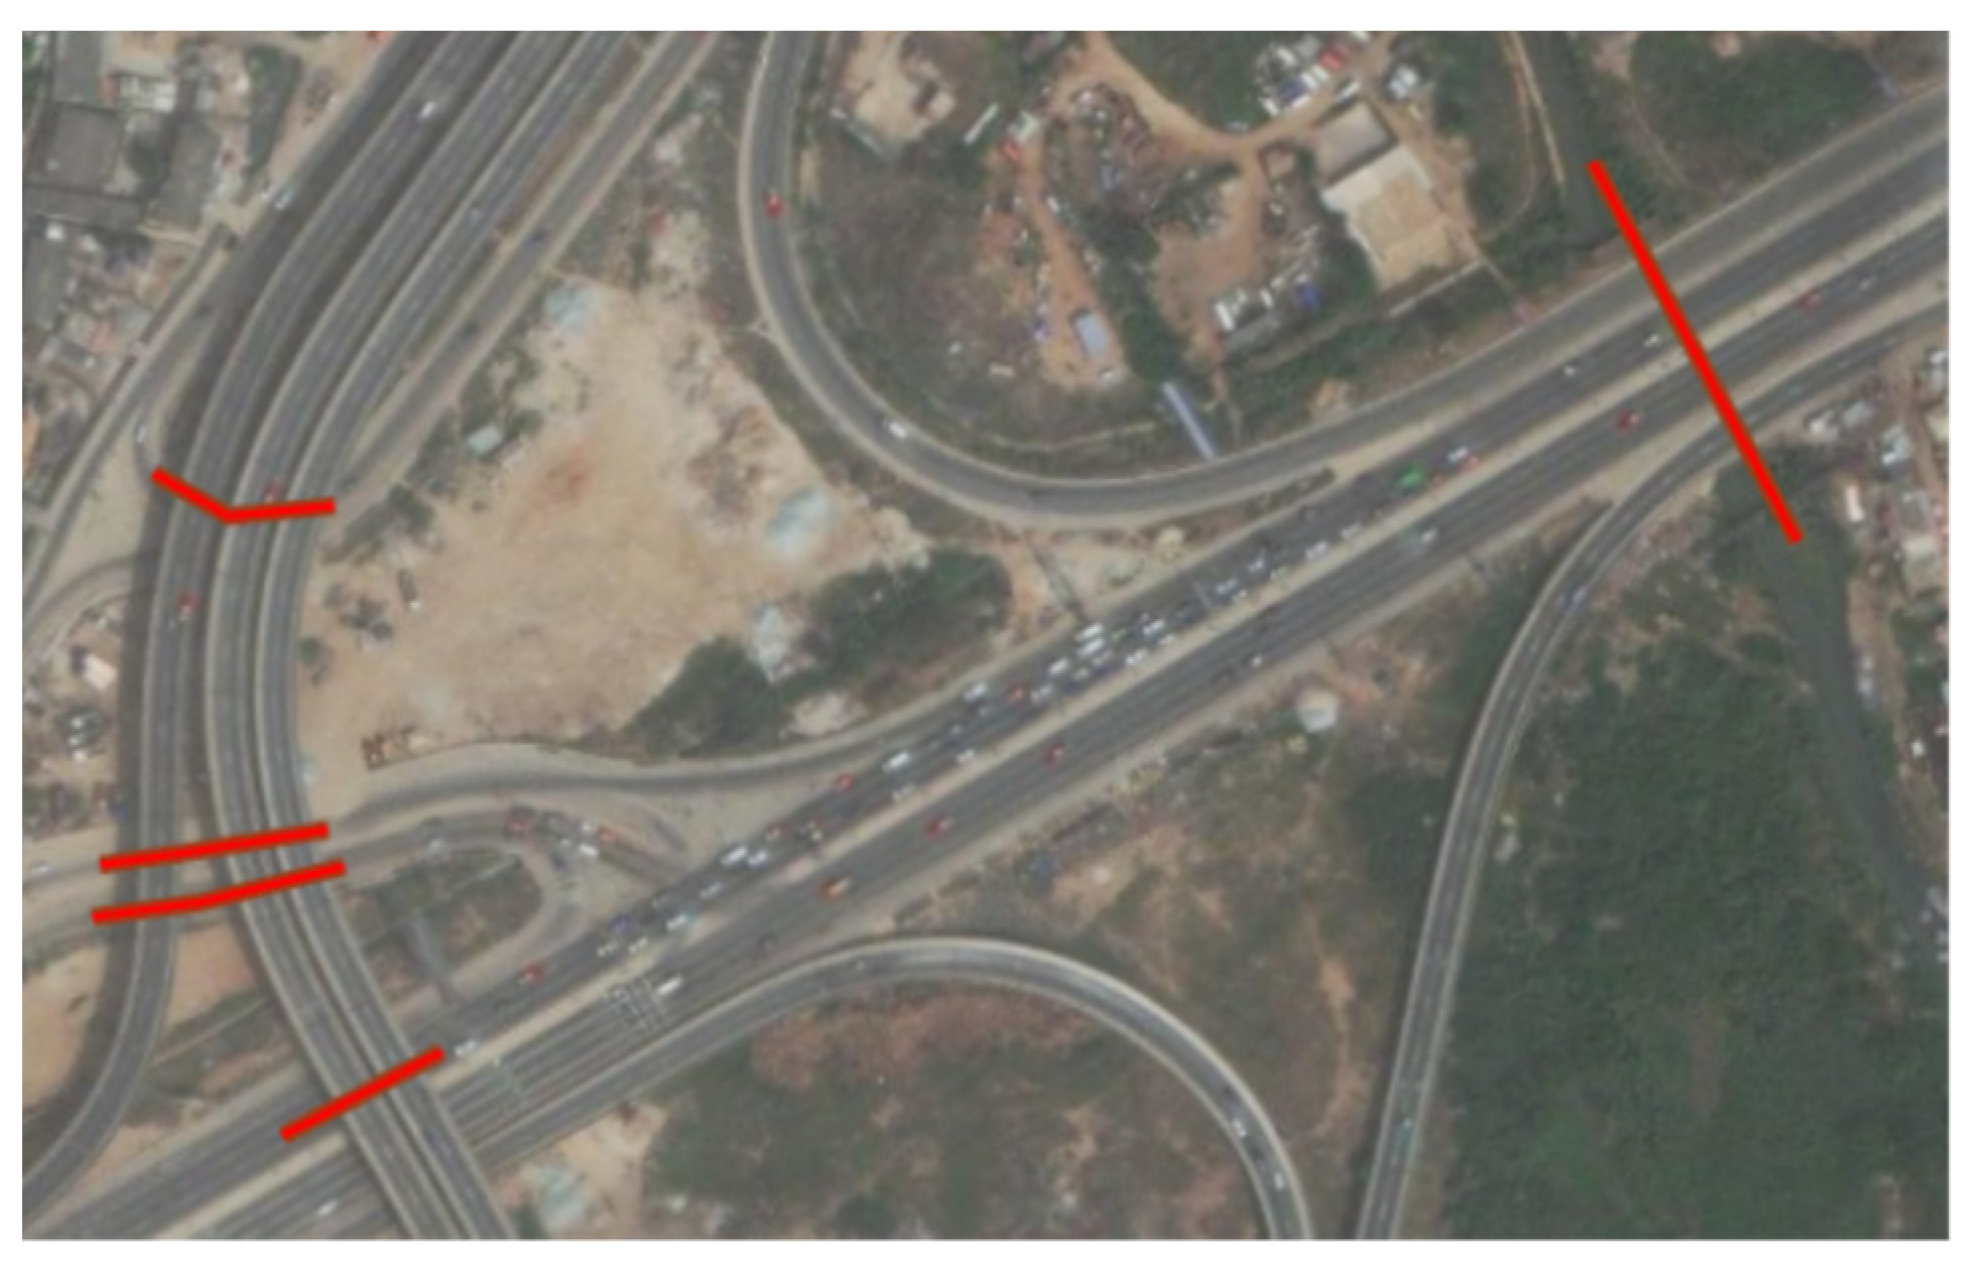
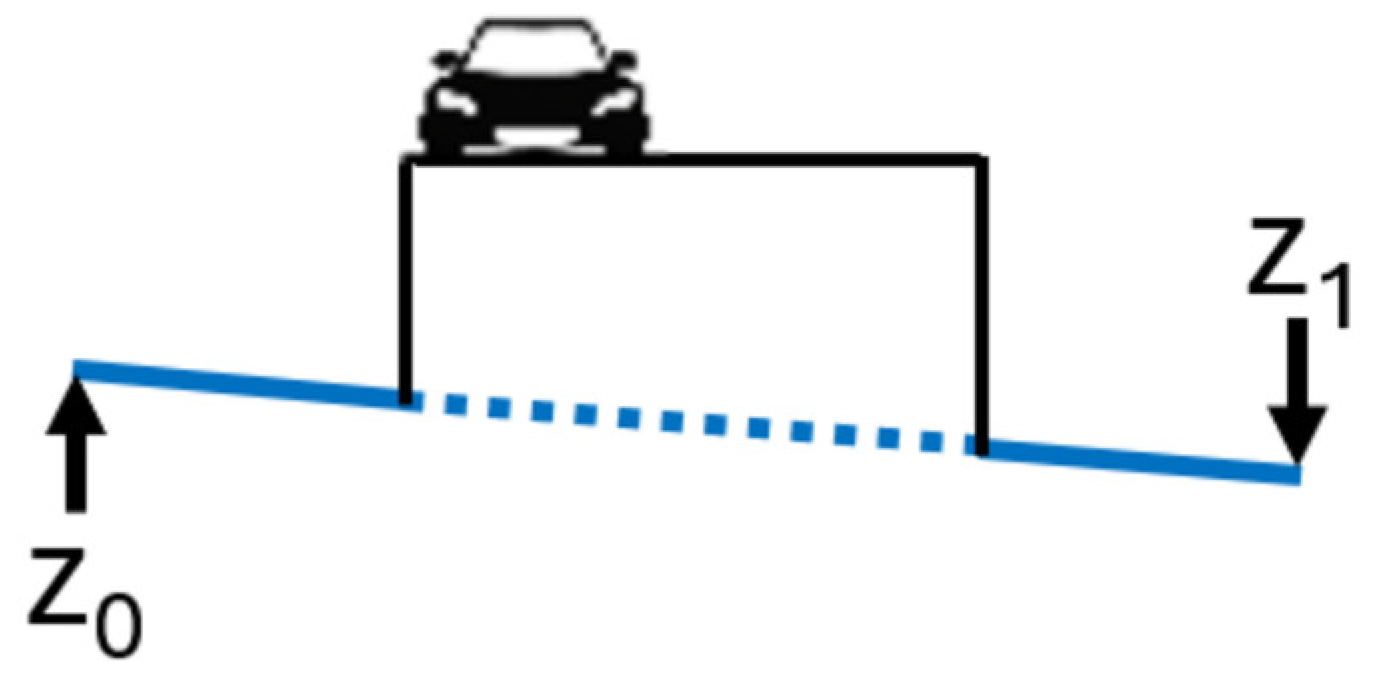
When a DTM is captured, all-terrain levels are registered on top of infrastructures. Therefore, adjustments to the levels for under-passing water, are required. Otherwise, water will stow on the upstream side of the obstacles when water flow is derived from the DTM. To detect such situations, 363 lines were digitized from local visual inspections of Esri’s Basemaps, and an example is shown in Figure 9. The correction principle is illustrated in Figure 10 where adjusted terrain levels are calculated by linear interpolation of levels identified at the endpoints for the hydro-conditioning features assigned to a correction raster. Subsequently, the original DTM cell values are substituted with the values in the correction raster [34].
Furthermore, corrections to elevation levels were added along downstream parts of the Odaw River from approx. 11 km upstream of the river’s outlet into the Gulf of Guinea. The necessity of this hydro-conditioning is presumably, due to inaccurate water and/or base levels recorded for the DTM at the time of data acquisition, where immense trash volumes (see Figure 2 and Figure 3) mixed with the dislocation of eroded side walls (Figure 1) and sediment accumulate along the river. In Figure 11, the elevation levels are depicted in a length profile. Ahead, the hydro-conditioned DTM is named DHyM.

3.4. Hydrologic Screening Method

The incomplete rainfall coverage data combined with the absence of the time component hinders the use of hydrodynamic modelling software to predict the stormwater flood consequences accurately. This modelling requires detailed information on soil infiltration rates, groundwater levels, discharge volumes, and peak flows at specific time intervals. Currently, real-time flood warnings are not issued to citizens in the GAMA beyond what is communicated through radio and TV. However, with the advance notice of rainstorms through weather forecasts, most adults anticipate the potential impact on their property or transportation based on past experiences. Of course, it would be best to know the timing of peak flows that would enable authorities to alert citizens before the onset of heavy rainfall leading to a more precise identification of flooded areas. However, in this scenario, the primary focus was on determining the location and depth of flooded areas in bluespots.
The Arc-Malstrøm hydrologic screening software ver. 2.1 [17] provides initial estimates of cumulative stormwater-induced runoff volumes downstream based on spillovers from local landscape sinks when they reach full capacity. Earlier studies have shown that Arc-Malstrøm, when compared to DHI-Groups hydrodynamic models, accurately predicts flooded extents without the need for time intervals [35,36]. Consequently, this software was used to evaluate the flooded areas (bluespots) that intersect critical infrastructure.
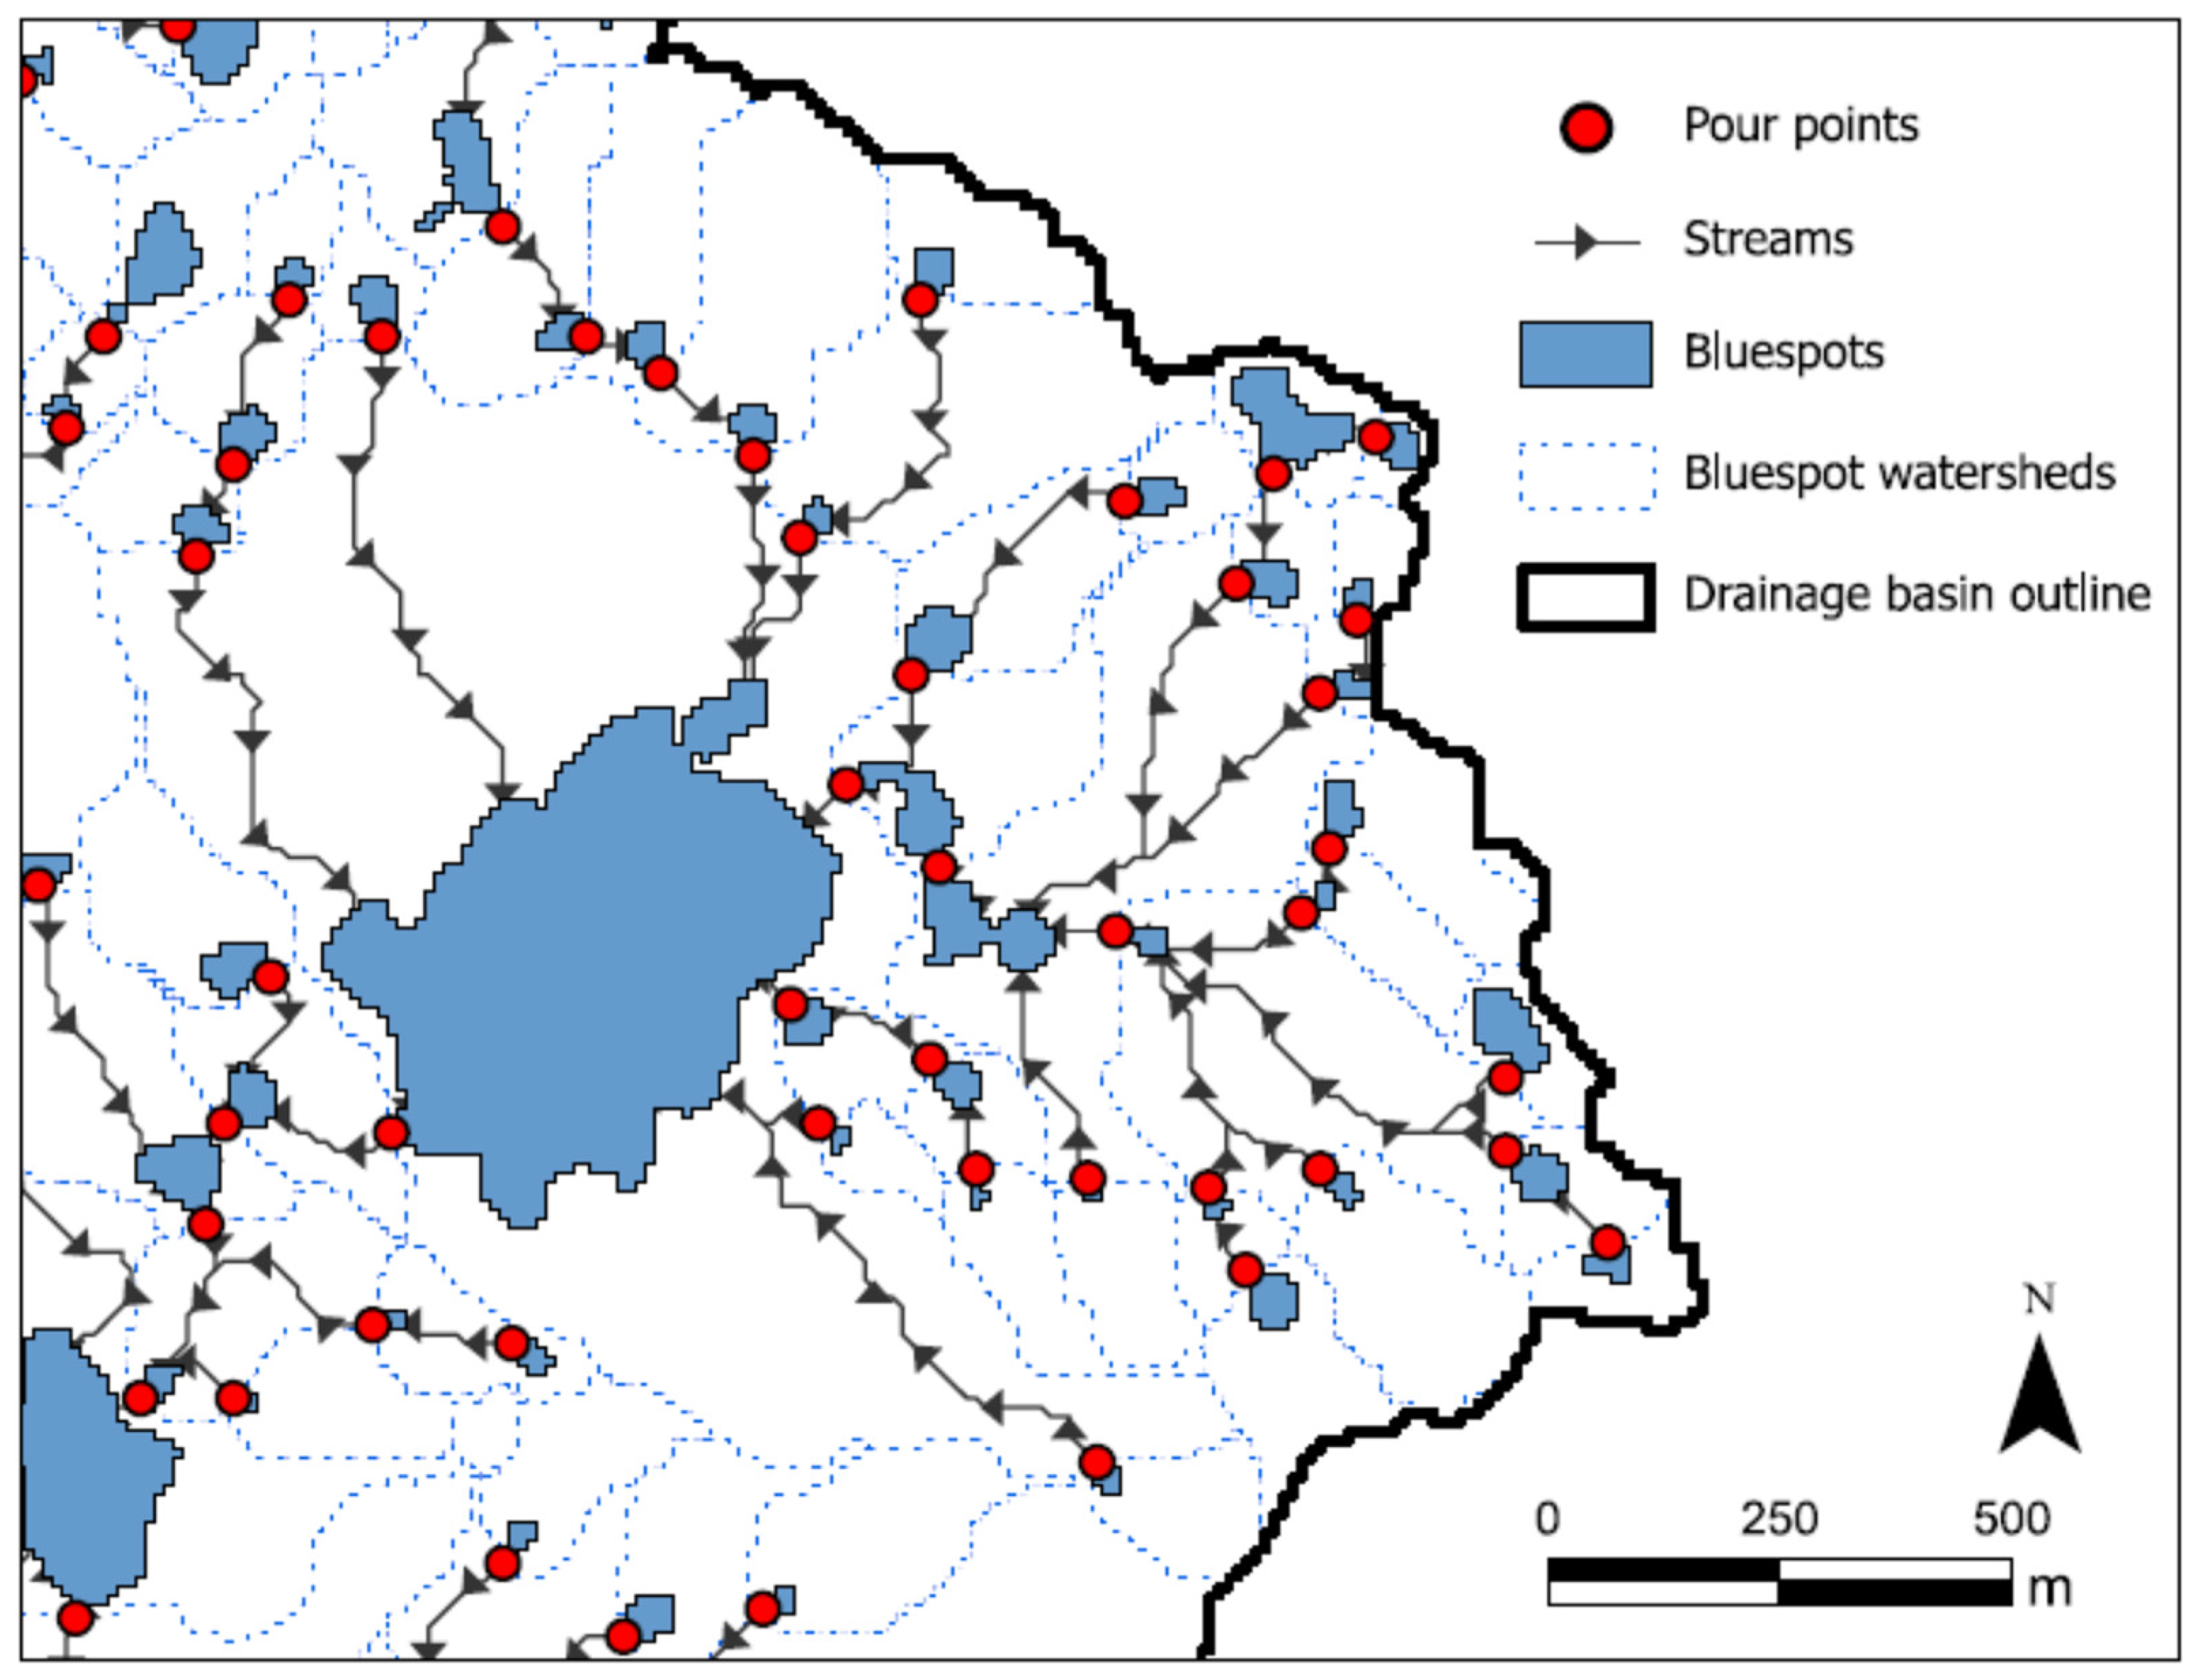
First, the DHyM is investigated to identify the major drainage basins as shown in Figure 4. Next, the screening process detects all landscape sinks (bluespots), their corresponding local watersheds, the bluespots’ pour points, and the stream paths carrying the downstream spillover as illustrated in Figure 12 and Figure 13. Meanwhile, to reduce computing time, only significant bluespots with maximum depths ≥ 0.1 m and volumes ≥ 5 m3 are retained.
From the pour points and the stream paths, the hydrologic network is established, enabling the determination of each bluespot’s water balance defined by its location within the hierarchical network for each major drainage basin (see Figure 13 and Figure 14). Thus, the DHyM, rain scenarios, and soil infiltration rates are the only data inputs used to produce the output features presented in Figure 13. This preparation for setting up the hydrologic network and deriving the water balance for each bluespot (described later in this section) did not involve any calibrations in the computations.
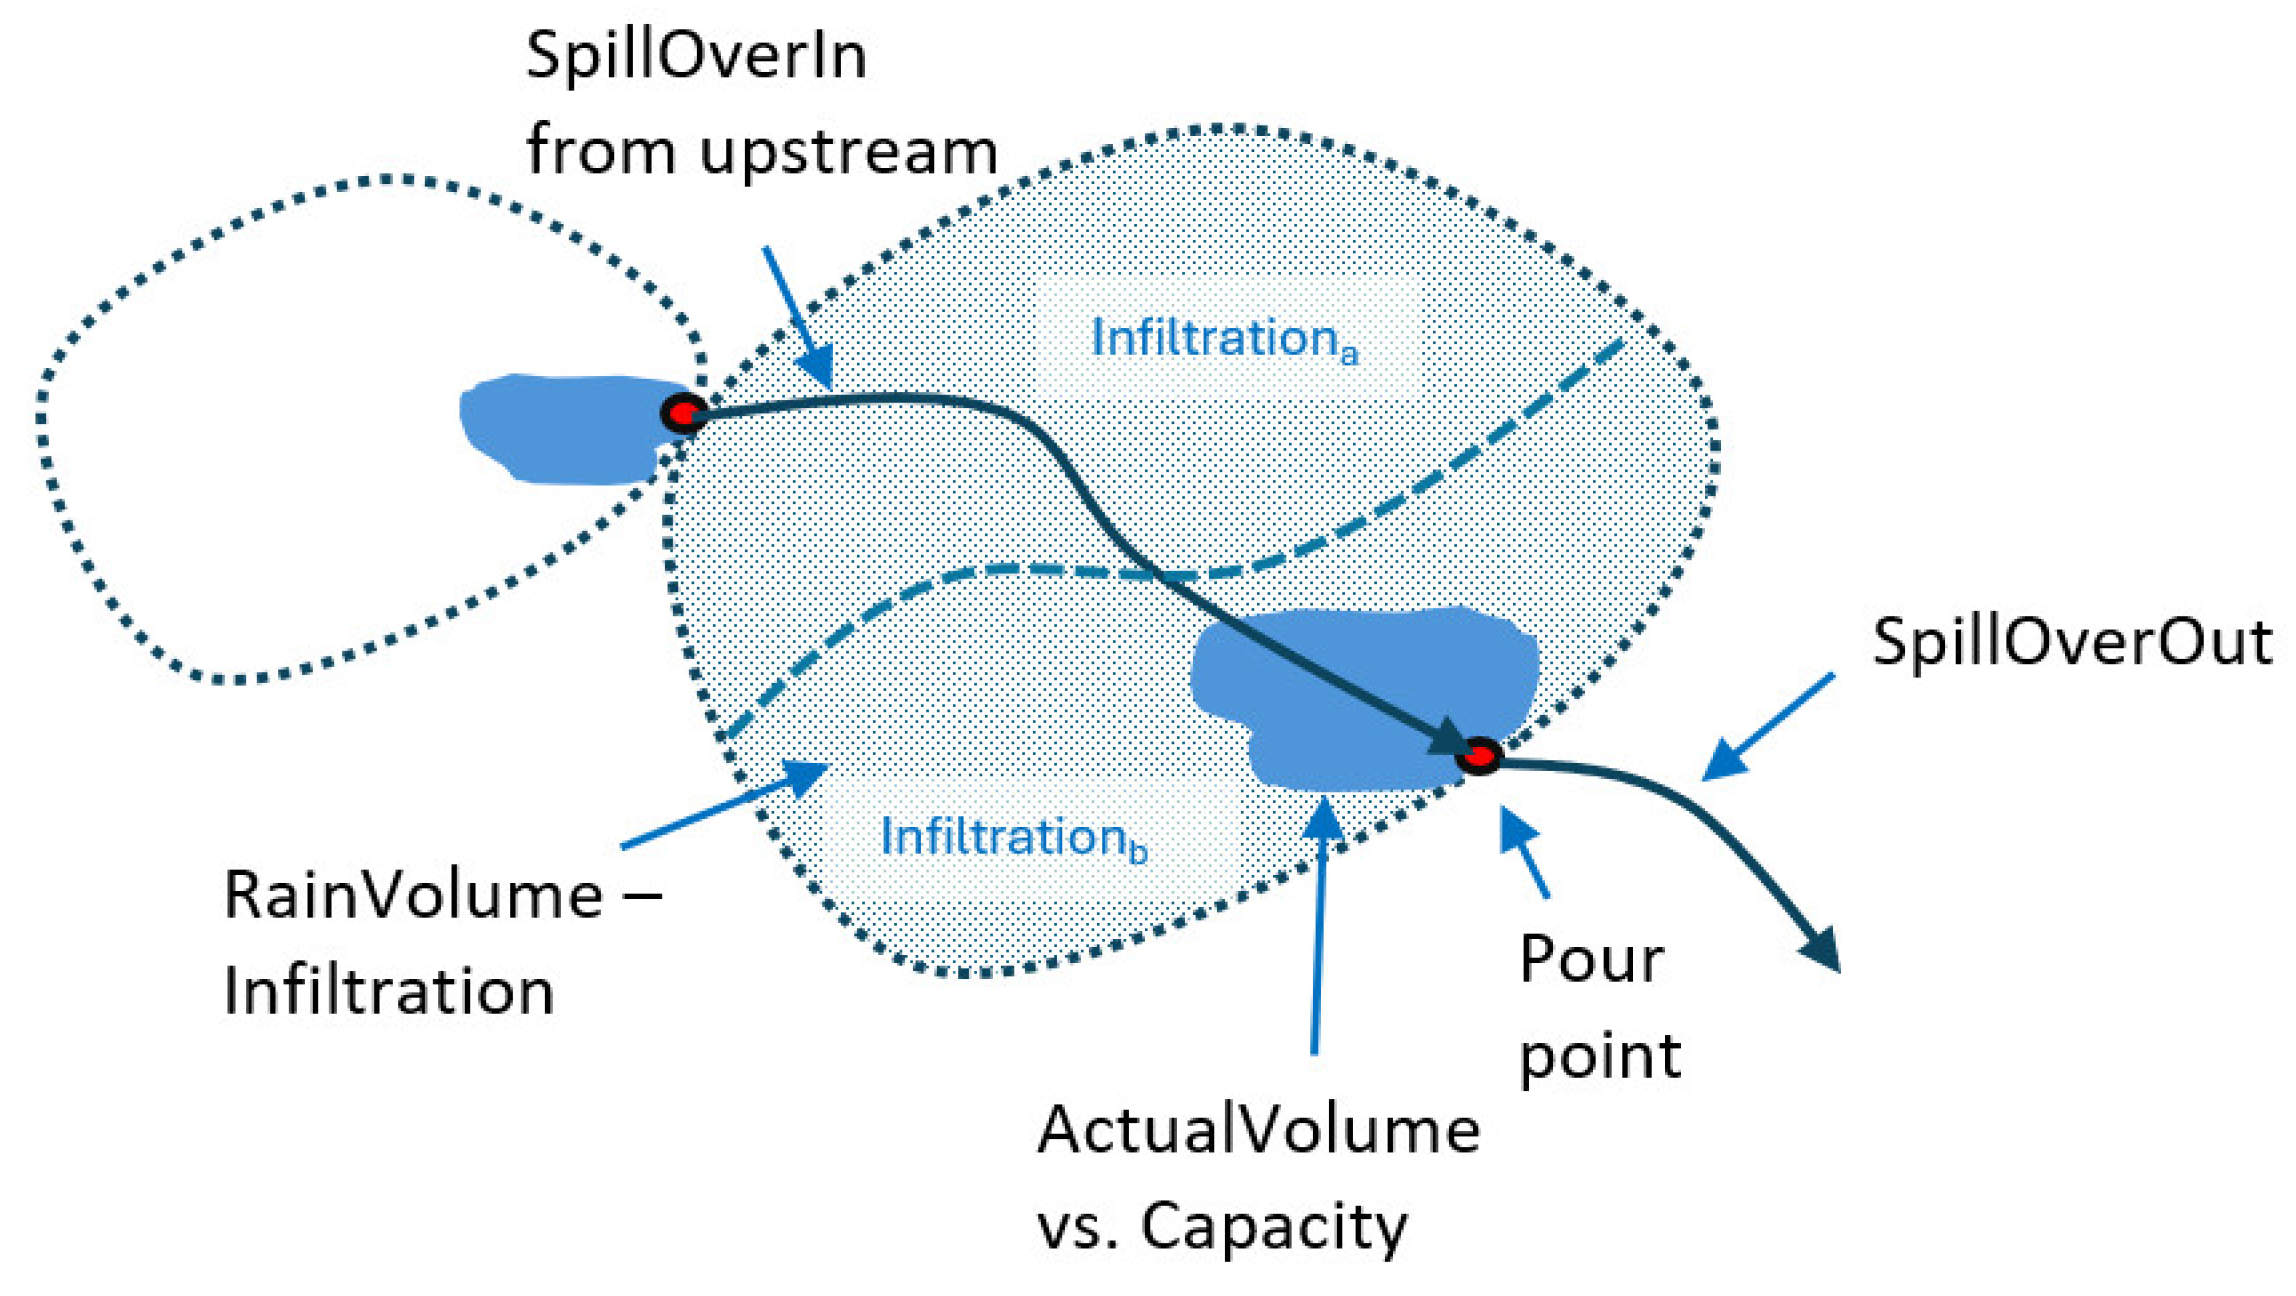
Presuming that the evaporation rate and the interception caught by the vegetation are negligible compared to the rain volume during a rainstorm lasting for 1–2 h, it can be stated that the entire rain volume falling upon a bluespot’s local watershed either infiltrates or turns into runoff. Therefore, if the precipitation is evenly distributed across a bluespot’s watershed, a bluespot’s water balance can be calculated using the following formula:
SOOut = RV − Inf + SOIn − (Cap − AV)
where
SOOut is the volume (m3) leaving a bluespot at its pour point as downstream spillover,
RV is the rain volume added to its local watershed calculated from a bluespot’s watershed area (m2) × the summarized rain event (mm)/1000 (if the screening included a distributed rain event, the sum of the area-wise rain volume contributions to a bluespot’s watershed should have been summarized),
Inf is the summarized soil infiltration (m3) within a bluespot’s watershed for the duration of the rain event,
SOIn is the incoming spillover (m3) from upstream bluespots,
Cap is a bluespot’s capacity (m3), and
AV is the existing (actual) rain volume (m3) already present for a bluespot.
If the infiltration rates vary within a bluespot’s watershed, the sum of the area-wise infiltration rates is summarized (Infiltrationa + Infiltrationb).
The excess spillover SOOut from a bluespot’s pour point goes downstream entering the next bluespot’s watershed as SOIn.
Technically, the individual bluespot’s location in the hydrological hierarchy within a major drainage basin is determined through a topological investigation of the hydrologic network constructed from nodes (representing the bluespots’ characteristics) and edges (downstream lines connecting one pour point to the next). Once defined, the network can be traversed for each rainfall scenario, and the water balance can be saved for each bluespot during any rain event. Therefore, the nodes table contains one row for each bluespot. If multiple rain events are simulated, the information in the nodes table expands with new columns representing the water balance for each rain event. If the modelling includes 13 uniform rain scenarios in the range of 30–150 mm in 10 mm increments, a final traversal of the spillovers for each bluespot reveals the rain event at which a bluespot reaches full capacity and begins to spill over (the filled event). This outcome, along with visual representations of spillover values from each bluespot indicating the water volumes carried downstream from its pour point, constitutes the screening’s primary findings. Furthermore, if bluespots contain such large volumes that they are never filled to their pour point levels in any of the investigated rain events, a post-processing application adjusts the bluespots’ extents and revises their partially filled depths for the rain events under examination. The post-processing principle can be explored in [37].
Finally, a Trace Upstream tool is available in Arc-Malstrøm to derive upstream features in the hydrologic network, leading to further selections of contributing bluespot watersheds. This tool is useful in identifying upstream regions from a specific flood-prone location where retention or detention basins should be considered to mitigate the problems. Additionally, a Trace Downstream tool is useful when deriving the shortest downstream flow path for any selected stream in the hydrologic network towards the outlet into the Gulf of Guinea.

3.5. Road Data

To investigate intersections of roads with identified bluespots and their depths, road network data for the GAMA were obtained from OpenStreetMap (OSM) [38].

4. Results

4.1. Rainfall Data

Over 38 years (1979–2016), 14 rain events have mean summed daily precipitations ranging from 60 to 100 mm for six weather stations, and three stations have events from 100 to 115 mm. Remarkably, in [4], 10 severe floods are reported for Accra, of which only three incidents on 5 July 1995, 6 June 2014, and 3 June 2015 match the records found in Table 1. Two of these incidents are among the three extreme events mentioned earlier with mean rainfall values of 114.8, 100.7, and 93.6 mm. This indicates that while some individual weather stations report very high precipitation values, their adjacent stations do not show similar patterns. For instance, on 3 June 2015, the station at Accra Academy reported 169 mm, and Accra Airport reported 212 mm, but on the same day, Aburi only received 59 mm as shown in Figure 5. Therefore, there is a significant spatial variation from north to south on that day. Unfortunately, it is challenging to identify any patterns in a west–east direction for the same date, as there are no reports available for the rain station at Weija and Accra Academy in the western part of the GAMA from 2013 to 2017. However, this suggests that stormwater events in GAMA are linked to convection rain that occurs randomly, locally, and with varying local magnitude. This is a tendency also reported in [7] for the nearby Densu River basin.

4.2. Soil Infiltration Rates

The results in Figure 15 show the calculated soil infiltration rates for a 60 mm stormwater event with durations of 1 and 2 h.

4.3. Stormwater Screening

From the analysis of rainfall distributions and due to the lack of rainfall data for the Weija and Accra Academy, it was decided not to move forward with investigating distributed rain events. Instead, uniform events were added to all drainage basins in the range of 30–150 mm. Each scenario was modelled including infiltration rates for rain events lasting 1 and 2 h separately, incorporating infiltration rates derived from combinations of soil types and land cover classes presented in Section 4.1. Such screenings provide unbiased overviews of worst-case flood scenarios from the DHyM presented in Section 3.3.
The GIS used for the stormwater screening was ArcGIS Pro ver. 3.1.2 [27]. As a measure of processing time, the identification of all output features (such as the local bluespots and their associated local watersheds, the bluespots’ pour points, and the stream paths for the downstream spillover) and the establishment of the hydrologic network took approximately 9 min. on a 2.8 GHz, 6 core, 12 logical processors computer with 128 Gb of RAM. Once the hydrologic network was initialized, each rain scenario, including soil infiltration, was processed in less than two seconds.
Figure 16 shows the distribution of 5018 discovered bluespots with volumes ≥ 5 m3 and maximum depths ≥ 0.1 m. This filtering criterion was applied because the DHyM is expected to have a vertical accuracy of 10 cm [19]. Prior to implementing these criteria, 8913 bluespots were discovered.
When combining the locations and depths of bluespots in Figure 16 with the road dataset from OSM, 163 roadblocks are identified where bluespots are deeper than 30 cm at a 60 mm rain event intersecting highways (trunk roads and trunk links), and primary and secondary roads. Remarkably, a cluster of 16 roadblocks is identified in a region within a 1 km radius of the National Theatre in downtown Accra at Korle Dudor. In addition to this number, one more potential roadblock is identified along the Odaw River where runoff volumes were > 1 Mio. m3 at road intersections. That location is where the river underpasses Graphic Road in the Industrial Area, and the difference in elevation from the river’s normal level to the overpassing road is only 2.1 m, but the river’s runoff at a 60 mm rain event is a stunning 8.0 Mio. m3.
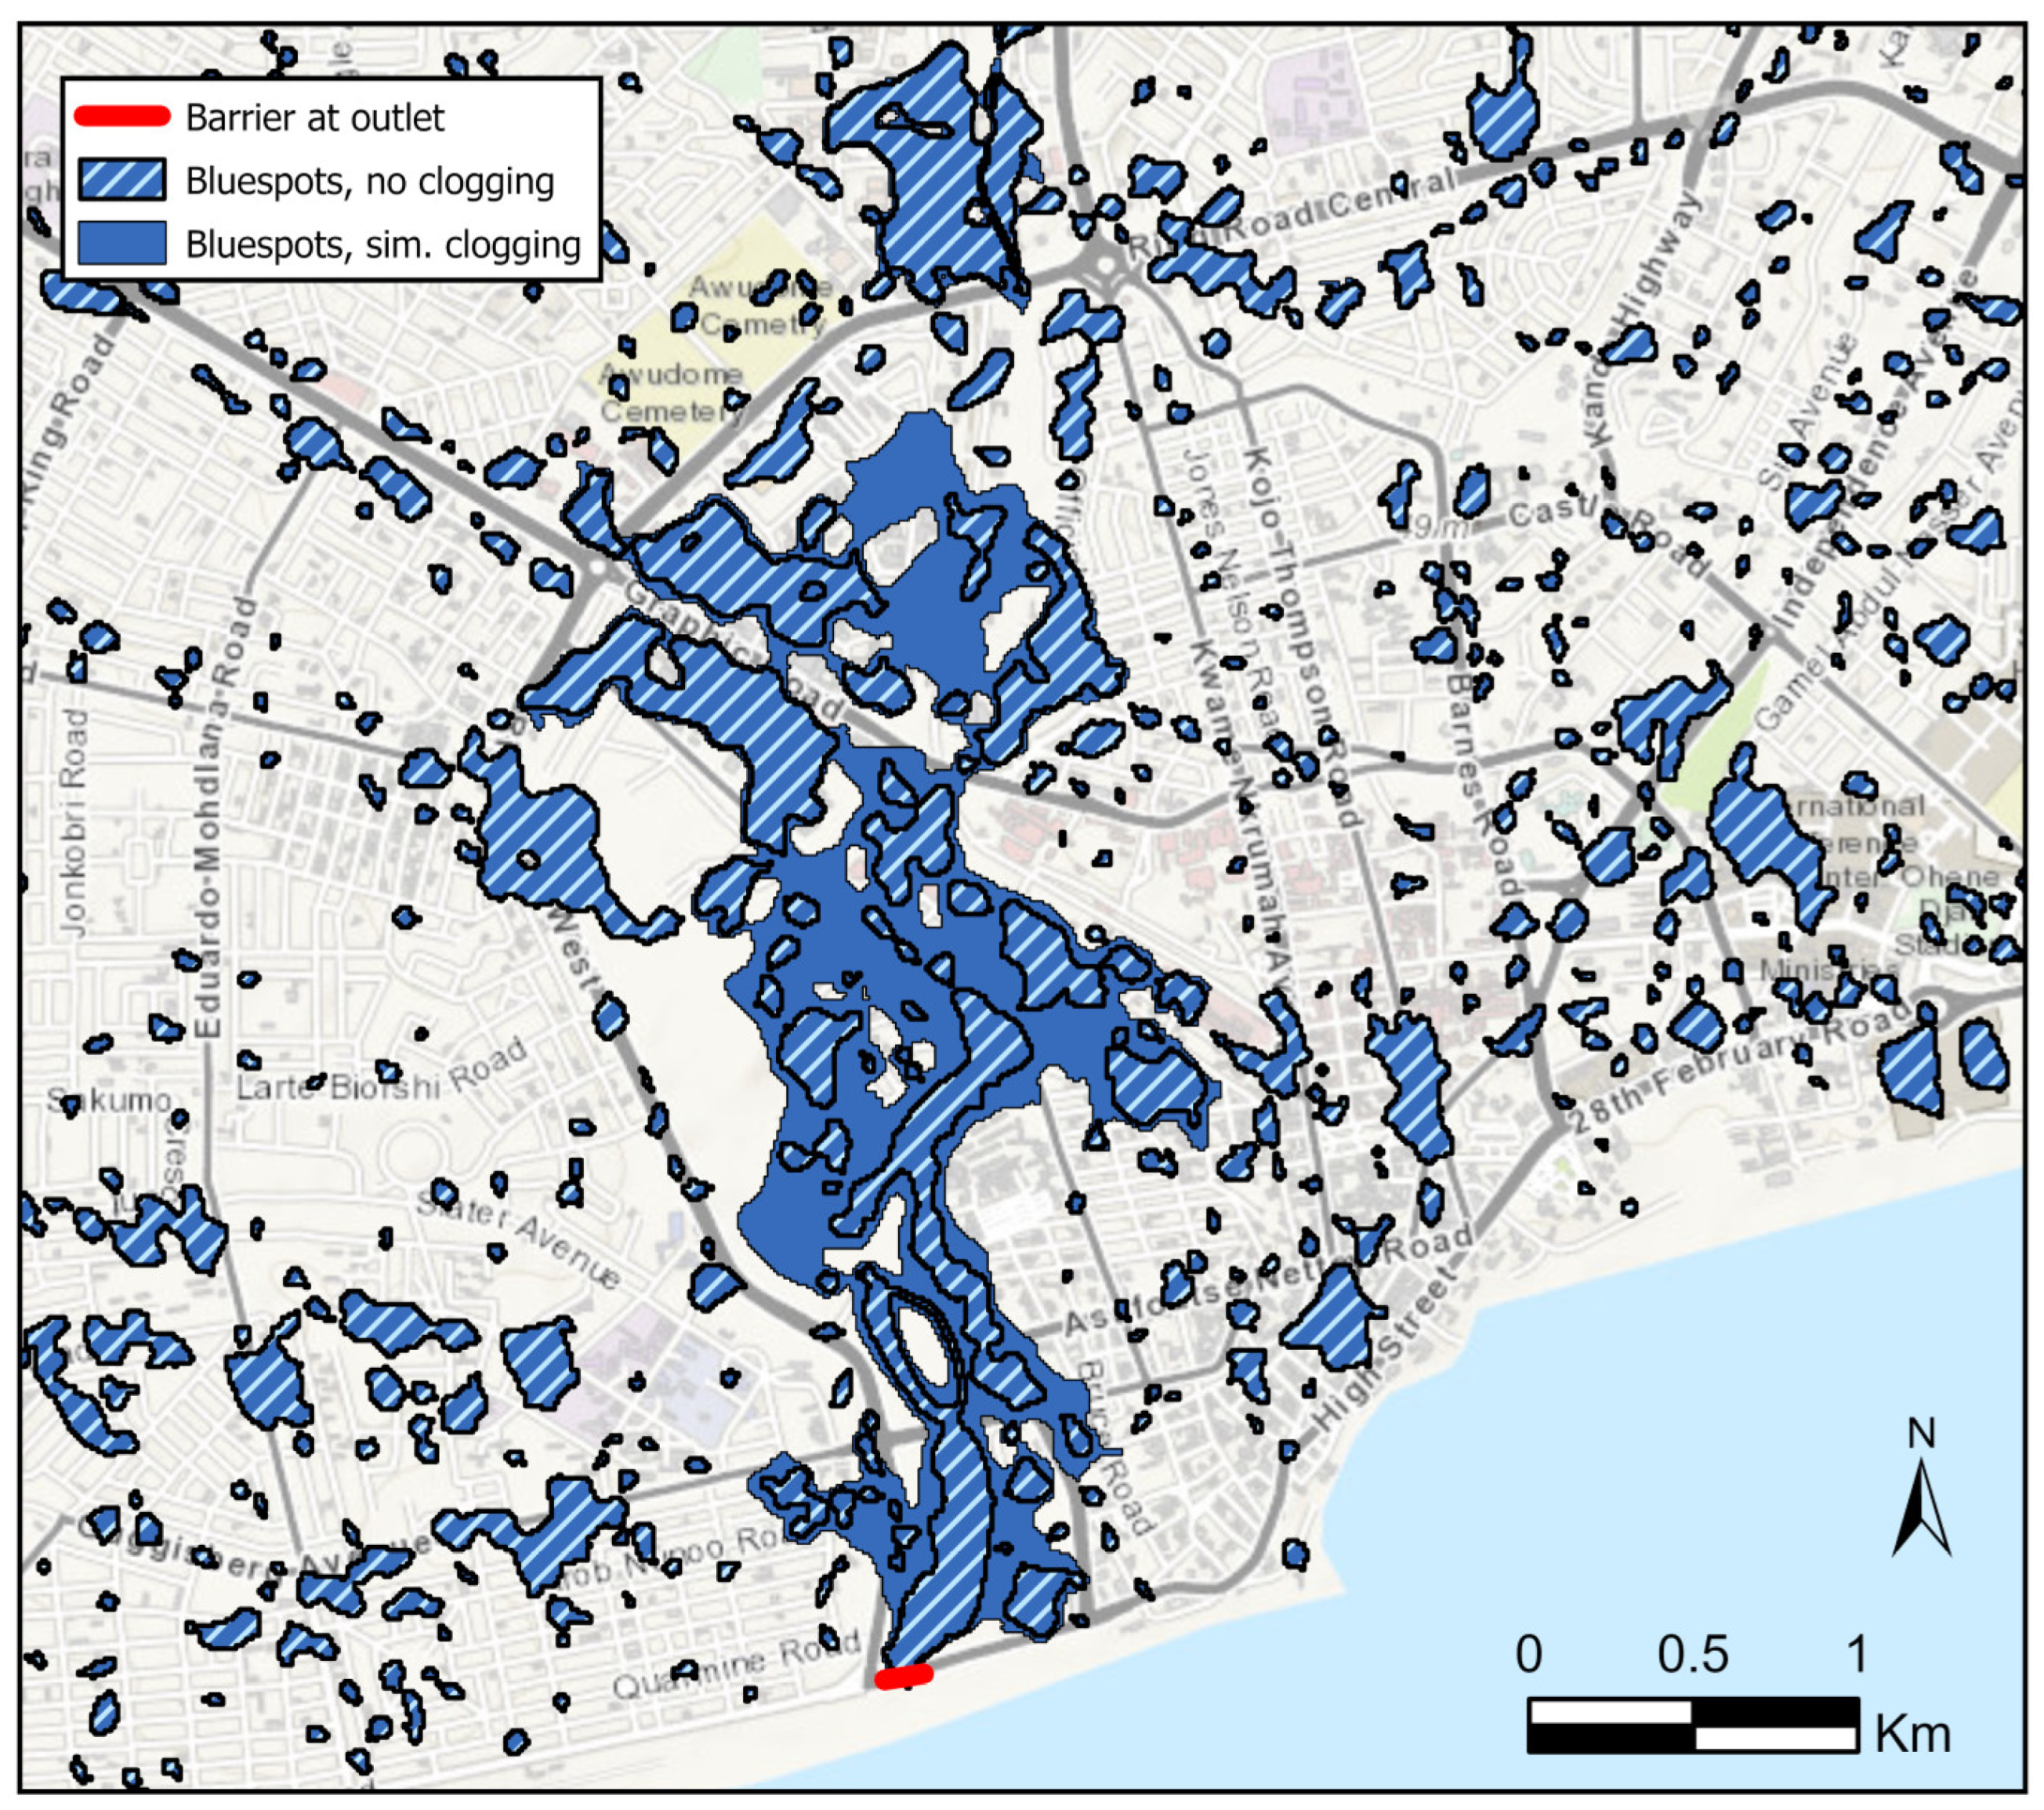
The flood overview map presented in [16] shows high and very high flood-prone areas along the major and minor river systems also captured by the current screening. The authors mention the clogging effect of trash carried along the Odaw River, but they do not focus on where it may occur. Meanwhile, as the flood-induced waste deposition is noticeable from aerial photos all around the Korle Lagoon’s extent, a barrier raised to a likely level of 3.2 m is added to the DHyM to study the possible effects of clogging. The barrier is added at the outlet into the Gulf of Guinea having a level matching the road’s surface where Cleland Road overpasses the river. When re-executing the bluespot workflow for rain events ranging from 30 to 150 mm including 1 h of soil infiltration for the Odaw River basin, an area of 2.9 km2 is flooded to a pour point level of 3.2 m at a 40 mm rain event, retaining a water volume of 3.2 Mio. m3 with flooded depths up to 4.9 m and a mean depth of 1.1 m (SD = ±0.9 m), see Figure 17.

5. Discussion

It is noteworthy that only a minor fraction of the precipitation turns into soil infiltration within the study area. Only the sandy Arenosol soil group found in a narrow band along the coastline dunes has infiltration rates of 43% vs. 86% with a duration of 1 h vs. 2 h for a 60 mm rain event, see Figure 15. Leptosols, Acrisols, and Luvisols on undeveloped land in the central and northernmost regions show infiltration rates of 4.2–8.9% for a 60 mm rainfall over 1 h and 4.4–10.8% over 2 h. However, infiltration rates below 1.2% prevail in the GAMA’s built-up land area due to combinations of slowly impermeable Acrisols and a prevalence of impervious surfaces.
At a 60 mm rain event, only 47% of the total 1 h precipitation minus the infiltration within the major drainage basin is captured in bluespots. However, if the precipitation is doubled to 120 mm in 1 h, only 29% of the rain volume is captured. This means that huge runoff volumes of approx. 8.6 and 23.1 Mio. m3 shall pass the major drainage basin’s ‘bottlenecks’ along the Odaw River’s southernmost course before the water masses are released into the Gulf of Guinea. Therefore, if trash blocks the passage somewhere along this southern stretch, the flooded extent is massive, as documented in Figure 17.
For the major drainage basin, only a few large bluespots with very high capacities are found in the northernmost region at the Akwapim Mountains. However, runoff entering Abokobi is mainly generated along the downstream mountainsides. Around 2.3 km south of Abokobi, a major river branch collects runoff from the entire north-northeastern part of the Odaw River basin at Aburi, Amrahia, Adentan, Madina, and Western Legon. The spillover volumes are moderate until Haatso near Western Legon as much runoff is retained in bluespots along the river corridor. Meanwhile, another runoff branch enters from Tantra Hills. When the two river systems merge at Achimota, West Legon, the runoff significantly increases. This is documented in [16], and locations southward from there along the river face immense flood risks, not least because the runoff from the surroundings increases significantly where the river system enters the densely built-up areas in the GAMA causing a drastic reduction in soil infiltration rates compared to precipitation.
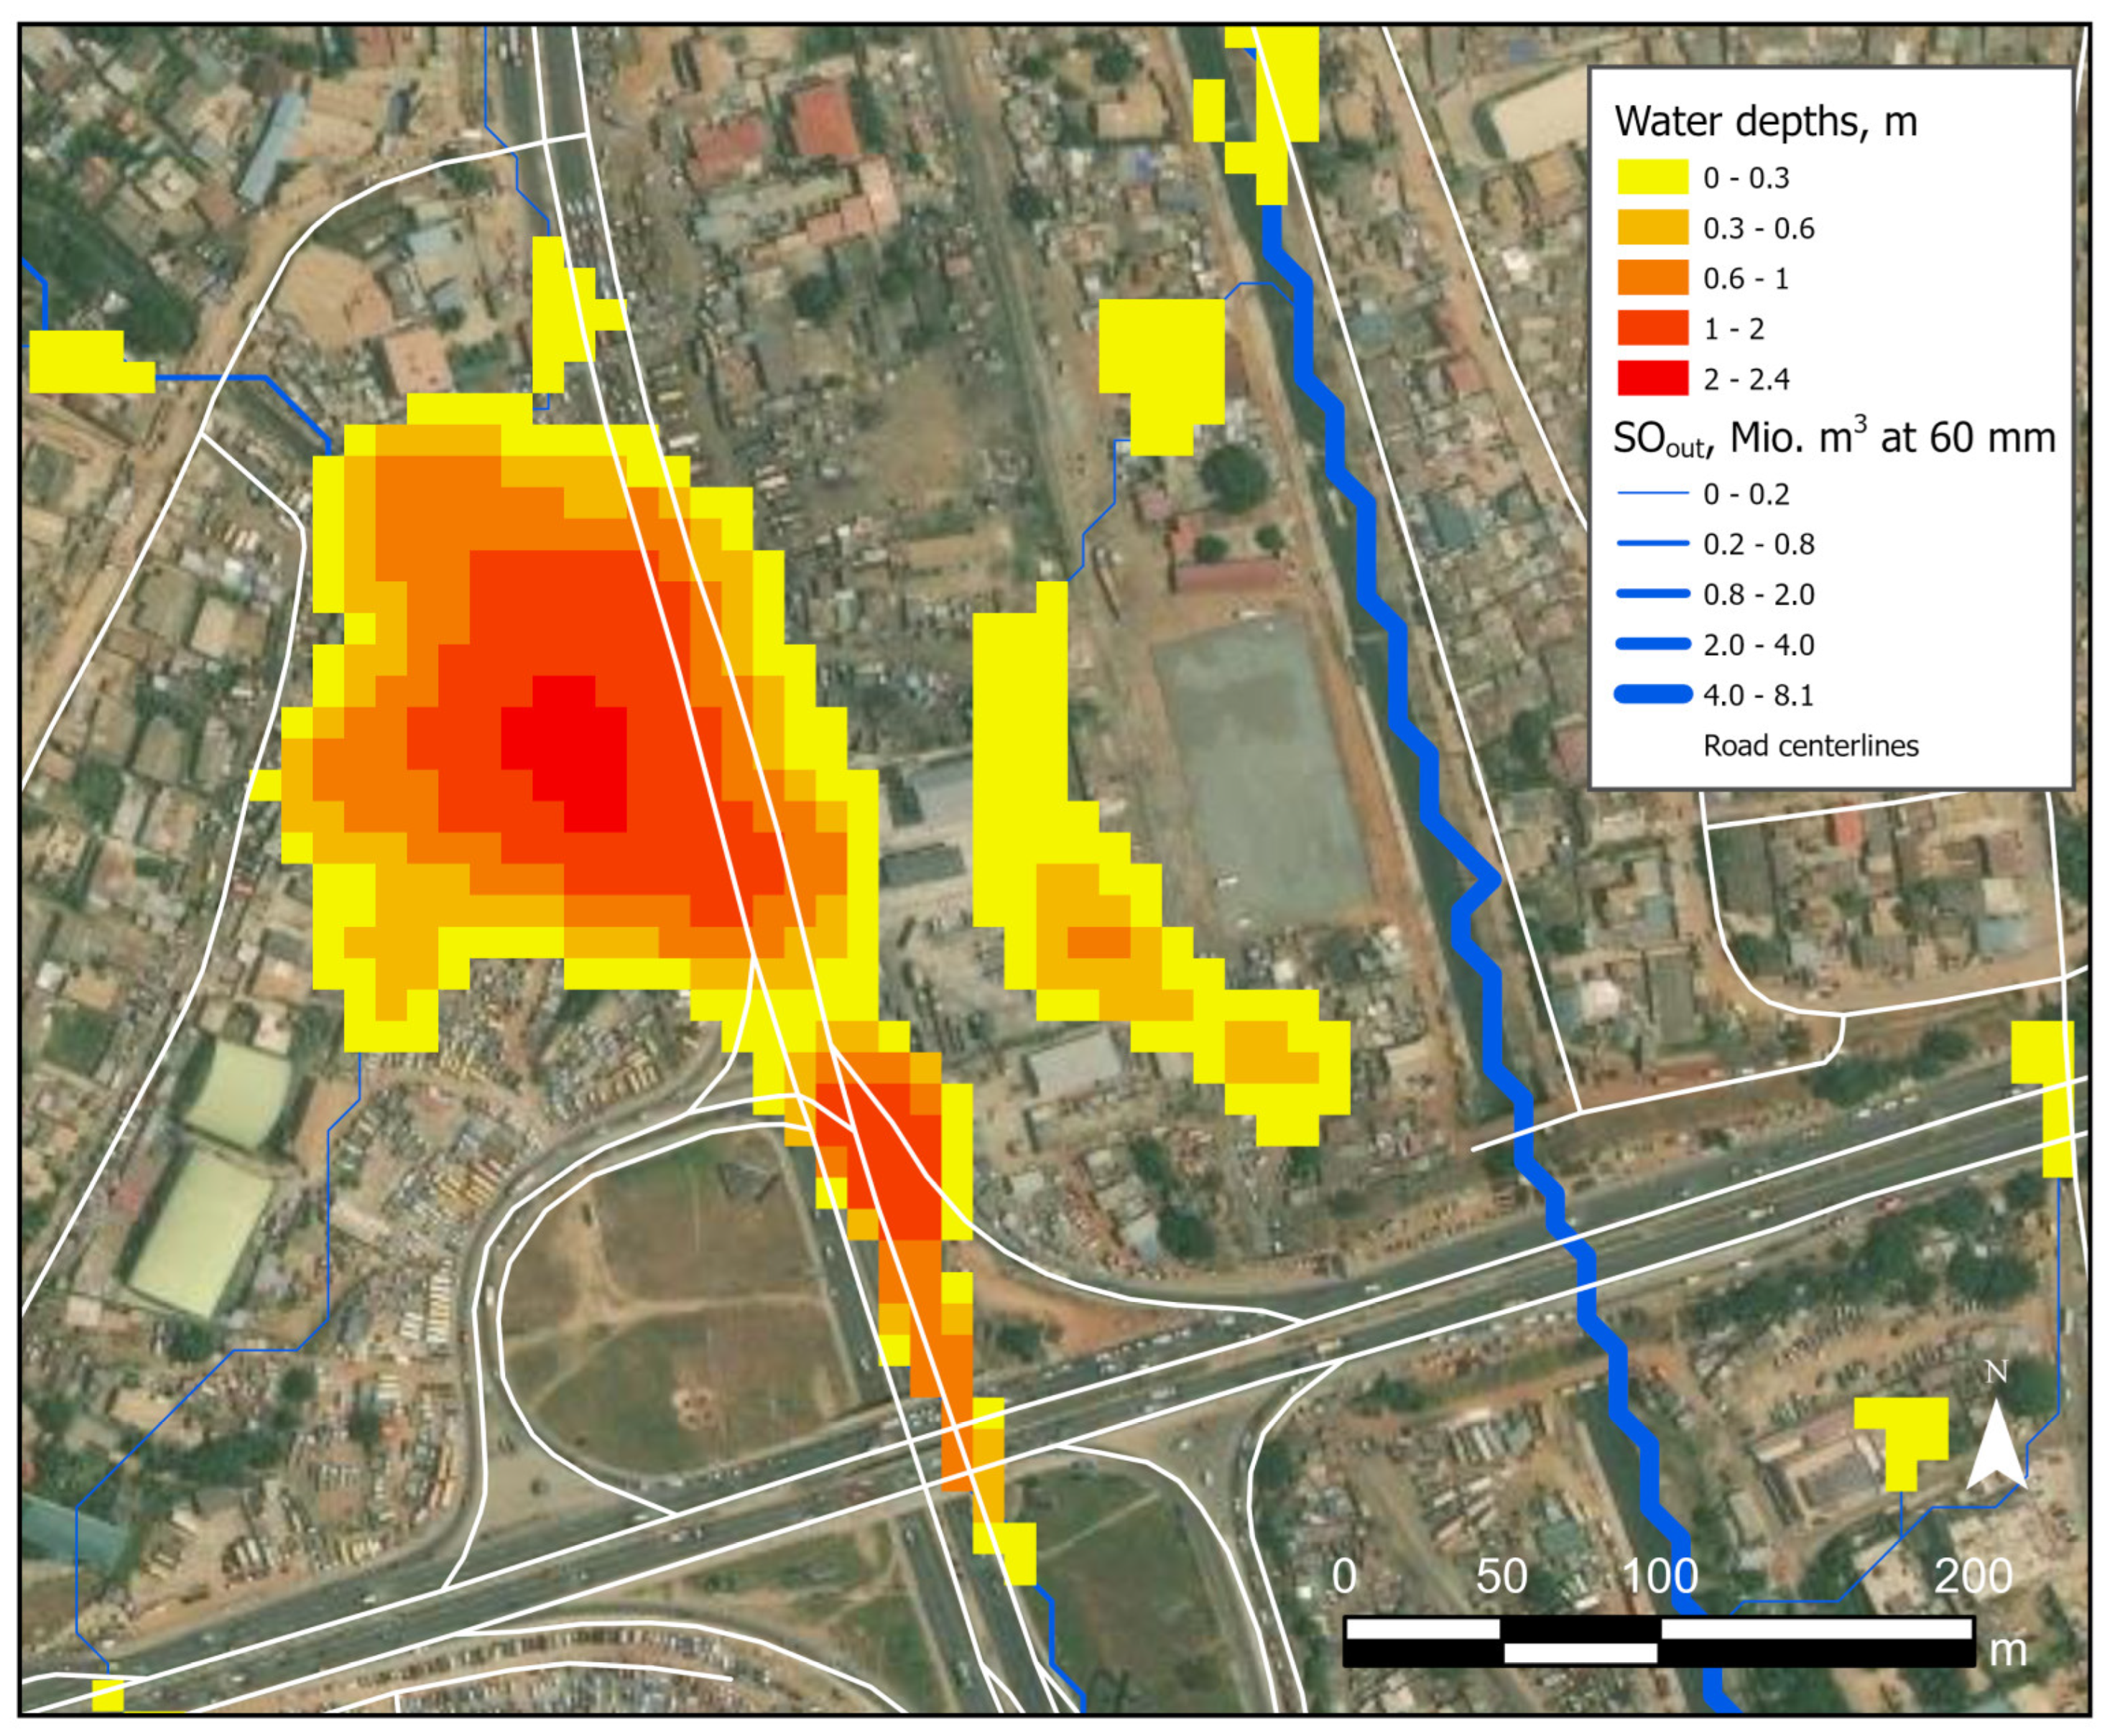
Although most high-risk flood locations are found along the main river system south of Achimota, many villages in the entire drainage basin suffer during extreme rainfalls. Infrastructure also suffers when located along river corridors, as well as where roads are constructed without considering their location in the hydrologic setting, blocking traffic. For instance, a well-known local bluespot along a major road artery is located at Achimota as shown in Figure 18. Upon examining the outcomes of this scenario, a trouble bluespot, when filled to its maximum capacity at just a 30 mm rain event, reaches a depth of 50–160 cm in both driving directions along a 150 m long highway segment. Once filled, it becomes a complete roadblock as typical vehicles cannot navigate water depths exceeding 30 cm, preventing most cars from passing through before water enters the cabin [39]. Consequently, this roadblock significantly impacts the daily commute of individuals, the transportation of goods, and more. Based on rainfall data for Accra Airport from 2010 to 2018, rain events equal to or greater than 30 mm per day occurred an average of seven times a year. Even smaller rain events lead to roadblocks (at least for southbound traffic) when the lowest-lying sections of the bluespot intersecting the highway become inundated.
As mentioned in the Introduction Section, this is probably the first delineation of flooded areas and their depths published based on a 10 m resolution DHyM. Previous flood studies for GAMA have used a DEM from NASA’s SRTM mission in 1999, including both ground surface and any vegetation structures and no added hydro-conditioning. No field validations were provided for the current project during recent rainstorms, but the flooded extents were compared with results in [16] presenting a low-resolution map of flooded extents and peak flow estimations based on a hydrodynamic model (HEC-RAS) calibrated from river gauge measurements at two separate events at two different occasions (Alajo in 1991 and Kwabenya 1995). Ten road names were mentioned and supplied with photos along George Bush Motorway, Kwame Nkrumah Motorway, Tetteh Quarshie Interchange, Obetsebi Lamptey Circle, Graphic Road, Black Meteors Lane, Ring Road Central, Afram Road, Guggisberg Avenue, and Hall Street in central Accra where flood depths are reported to be greater than 30 cm. When comparing those locations with the bluespot map, in Figure 16, a match is found along all roads mentioned. Eight additional place names at Achimota, Asofaa, Ashongman, Akokone, Adenkrebi, Kweman, Kokomlemle, Alajo, and Tesano are reported as having road service areas affected, and there is a full match with those locations as well. Hereto can be added highly flood-prone areas at Oyarifa, Abomang, West Dentan, Kpehe, the North Industrial Area, and Korle Bu.
If the DTM’s spatial resolution is improved even more, a study by [33] demonstrates for Santa Maria, Adentan, and Legon in the GAMA how much a stormwater screening may gain from using DTMs derived from local UAV-based LiDAR surveys with cell resolutions of 0.3 m. This means a spatial resolution 333 times better than the DTM procured from AirbusTM and a factor of 10,000 times better than data from NASA’s SRTM missions still used, although captured in 1999. When such high-resolution data become available from new satellite topographic missions, it will add exceptional improvements in the production of flood resilience maps.
In discussions on how to mitigate the GAMA’s recurring floods, the establishment of retention or detention ponds along the Odaw River is, of course, a potential solution. According to [14], two basins located at Atomic Energy West and Atomic Energy East at Haatso, 2 km NW of West Legon, will reduce the flooding risk for downtown Accra considerably. They found that a 76 mm rain event for Aburi, located in the northernmost corner of the Odaw River basin, matches a 1-year return period for the region. Based on their estimations, a volume of approx. 0.2 Mio. m3 for a 1-year event can be retained there, equivalent to a water volume from the upstream area covering 115 km2 of only 4.0%.
From an inspection of the runoff for a similar uniform 76 mm rain event upstream of Haatso based on the current bluespot screening, the total runoff there is approx. 4.8 Mio. m3 which is 24.3% less than discovered by [14]. This difference is most likely due to errors related to underestimations of bluespot volumes based on a 30 m DTM, but also differences in soil infiltration rates deduced from curve numbers versus this method’s infiltration estimates.
This calls for exploration of placing not just a few major retention basins in the centre of drainage basins to mitigate problems further downstream, but also considering numerous minor retention basins as far upstream as possible before runoff volumes accumulate drastically. In this case, the runoff volumes derived 8.2 km upstream from Haatso at Abokobi are 1.6 Mio. m3 at a 76 mm rain event, which necessitates the establishment of retention basins even further upstream.

6. Conclusions

The results from the hydrologic screening analysis show that Arc-Malstrøm meets this research’s first objective by providing an efficient, fast, and simple alternative to using advanced hydrodynamic software for identifying flood-prone locations. Such investigations are particularly challenging in countries like Ghana, where data on topography, land use/land cover, soil types, and rainfall patterns are sparse and of varying quality. Therefore, predictions of flood-prone areas must be subject to critical examination. However, the results indicate that it is possible to produce more accurate assessments when using a hydro-conditioned DTM of a 10 m resolution compared to a non-adapted DEM of a 30 m resolution. In addition to more precise delineations of flooded infrastructure, trustworthy depth maps are generated to highlight where different vehicle types can navigate flooded road segments. Through field studies and comparisons with other sources, local authorities, as well as regional and national agencies can greatly benefit from such analysis in their initial assessments of sustainable flood management initiatives.
Due to a lack of sufficient meteorological data, it is hard to conclude whether more frequent occurrences of severe convection-induced stormwater events increase the incidence of more floods. The primary reason for the recurring floods is the transformation of former farmland with natural retention basins, which used to host many plantations and groves, into impervious or semi-impervious regions due to the uncontrolled urbanization of the GAMA. This transformation results in a continuous rise in runoff volumes across the entire region.
It is crucial to acquire detailed data from the Ghana Meteorological Agency, including intensities down to an hourly basis, to model the stormwater consequences either using screening software like Arc-Malstrøm or any hydro-dynamic models. Rain events aggregated to daily reported values are not sufficient in assessments of rain intensity levels or soil infiltration volumes. Therefore, it is recommended that more detailed rainfall data become available for GAMA, for example, provided from nearby airports’ weather radars. Subsequently, real-time flood maps showing impassable road segments can be integrated into transportation models, as presented by [18], to offer information shared online with citizens regarding re-direction advice. Implementing early warning systems to alert citizens about impending floods would also have a significant protective impact on everyone involved.
The second objective was to demonstrate the upstream flood consequences caused by a simulated trash barrier at the Odaw River’s outlet into the Gulf of Guinea. The immediate conclusion from this study is that it is possible to map the areas affected by such a barrier. However, this output raises a discussion about the consequences of irresponsible waste handling by city dwellers coupled with insufficient waste management practices. The co-occurrence of high runoff volumes and trash-induced clogging adds a new dimension to discussions of the stochastic occurrences and impacts of future floodings. Beyond the flood consequences, waste problems pose major threats to epidemics such as cholera [40], agricultural production [41], the marine environmental ecosystem [10], and tourism. Especially, the incalculable environmental and health contamination consequences from flooding significant parts of one of the world’s largest industrial dump sites for electronic waste at Agbogbloshie next to the Odaw River’s outlet into the Gulf of Guinea cannot be ignored [42]. Therefore, the disposal of solid and soft waste as well as faecal matter, into the river channels and drains due to inadequate sanitary facilities, is unacceptable and should be a top governmental priority. Significant investment in waste management infrastructure, including the construction and enhancement of waste disposal and recycling facilities, is paramount as recognized by the National Solid Waste Management Strategy for Ghana [43]. Collaborating with private sector companies specializing in waste management could also provide expertise, innovative solutions, and additional resources [44]. Once such initiatives are implemented, they should be accompanied by increased public awareness and education about the importance of proper waste disposal and its impact on flooding [45] and other societal consequences. This can be achieved through community outreach programs, educational campaigns, and partnerships with local schools and institutions [46]. Implementing incentive-based programs that reward communities for effective waste management practices could also be advantageous [47]. Lastly, there should be strict enforcement of waste management laws, with severe penalties for non-compliance to discourage improper waste disposal [48].
The third objective presents the significance of hydro-conditioning the 10 m resolution DTM to replicate unimpeded runoff. It can be suggested that future commercial DTM products come with more possibilities until a new high-resolution publicly available DTM replacing NASA’s worldwide 30 m DEM from 1999 opens for even more detailed delineation and depth estimations of flooded areas like those described in [33]. As of right now, AirbusTM only offers two different kinds of elevation models: (a) digital surface models (DSMs) or (b) DTMs that have had their elevation values locally smoothed to remove artefacts following the removal of vegetation and building footprints. As a result, some bluespots’ capacities are underestimated, adding uncertainty to the results; yet, generally, the results are deemed reliable in overall quantifications of stormwater consequences. However, to eliminate such uncertainties, it would be beneficial to add a third elevation product, DTMb, which could preserve all buildings in a DTM and allow for more precise runoff calculations in built-up areas. Additionally, a DTMb would eliminate the volumes that the foundation of any building occupies when placed in a bluespot. A DHyMb, a hydro-conditioned DTMb version prepared for hydrologic analysis, ought to be the fourth product made available. As an alternative, a national agency should be urged to offer up-to-date digitized hydro-conditioning features as freely accessible data ready for adaptation.
The fourth objective was to show that the Arc-Malstrøm screening may adopt various soil infiltration rates to obtain more accurate predictions of runoff and flooding. Meanwhile, in the absence of discharge measurements, a definite conclusion cannot be drawn. It is evitable, nevertheless, that incorporating measurements of soil infiltration into hydrologic screenings will increase the accuracy of runoff estimations. However, the infiltration rates were only calculated from rough generalizations of soil types. Improved soil infiltration rates can be achieved when more detailed soil maps become available.
The fifth objective focused on the demands for retention and detention basins along the Odaw River. The conclusion is that other options for the creation of several sizable basins as discussed by [14] need to be considered. Ideally, each landowner should be motivated to retain or detain as much rainfall as possible on their property. If everyone uses such methods, even small amounts of rainwater collected from rooftops in tanks for domestic consumption or garden irrigation will make a difference. Of course, another important method in reducing runoff is the effect of ditch retention along infrastructures. Other precautions were observed throughout the research at the Santa Maria, Adentan, and Legon sites, where several spots showed the construction of local flood defences [33]. Of course, each citizen benefits from taking such safeguards but it is important to keep in mind, though, that these kinds of actions merely transfer and exacerbate the flood issue to the next vulnerable downstream landowner, facility, or infrastructure.

Supplementary Materials

The following supporting information can be downloaded at: https://www.mdpi.com/article/10.3390/geohazards5030038/s1, Video S1: Trash littered in a river when dry is carried away by stormwater and dumped into the Gulf of Guinea. The video was captured in October 2023 at a location where a big drain from a residential area leads into the Odaw River at Kwame Nkrumah Circle.

Author Contributions

Conceptualization: T.B. and B.H. Formal analysis: T.B. Data collection: T.B., A.N.M.A., and P.M.G. Writing—original draft: T.B. Writing—review and editing, T.B., B.H., A.N.M.A., and P.M.G. All authors have read and agreed to the published version of the manuscript.

Funding

This research was funded by a grant awarded by the Danish Ministry of Foreign Affairs (Danida).

Informed Consent Statement

All participants provided informed consent.

Data Availability Statement

No new data were created or analyzed in this study. Date sharing is not applicable to this article.

Conflicts of Interest

The authors declare no conflicts of interest.

References

  1. Amoako, C. Emerging issues in urban flooding in African cities-The Case of Accra, Ghana. 35th AFSAAP Annual Conference Proceedings, 2012. (PDF) Emerging Issues in Urban Flooding in African Cities -The Case of Accra, Ghana Clifford Amoako Monash University|Clifford Amoako. Available online: https://www.academia.edu/ (accessed on 18 February 2024).
  2. Møller-Jensen, L.; Agergaard, J.; Andreasen, M.H.; Kofie, R.Y.; Yiran, G.A.B.; Oteng-Ababio, M. Probing political paradox: Urban expansion, floods risk vulnerability and social justice in urban Africa. J. Urban Aff. 2022, 45, 505–521. [Google Scholar] [CrossRef]
  3. Rain, D.; Engstrom, R.; Ludlow, C.; Antos, S. Accra Ghana: A City Vulnerable to Flooding and Drought-Induced Migration. Case Study Prepared for Cities and Climate Change: Global Report on Human Settlements, 2011, 1-21. (25) (PDF) Accra Ghana: A City Vulnerable to Flooding and Drought-Induced Migration. Available online: https://www.researchgate.net/ (accessed on 1 December 2023).
  4. Asumado-Sarkodie, S.A.; Owusu, P.A.; Rufangura, P. Impact analysis of flood in Accra, Ghana. Adv. Appl. Sci. Res. 2015, 6, 53–78. [Google Scholar] [CrossRef]
  5. Andreasen, M.H.; Agergaard, J.; Møller-Jensen, L.; Oteng-Ababio, M.; Yiran, G.A.B. Mobility Disruptions in Accra: Recurrent Flooding, Fragile Infrastructure and Climate Change. Sustainability 2022, 14, 13790. [Google Scholar] [CrossRef]
  6. Trepekli, K.; Friborg, T.; Allotey, A.N.M.; Møller-Jensen, L. Influence Of Climate Change On The Future Precipitation Pattern In The Region Of Ghana. Technical Note, CLIMACCESS Project 2019. Available online: https://www.dropbox.com/s/14pas0rjno3dgw9/Katerina2019a.pdf?dl=0 (accessed on 15 June 2023).
  7. Alfa, B.; Hasholt, B.; Jørgensen, N.O.; Banoeng-Yakubo, B. Rainfall and Water Resources of a Coastal Basin of Ghana. J. Hydrol. Eng. 2011, 16, 316–323. [Google Scholar] [CrossRef]
  8. Karley, N.K. Flooding and physical planning in urban areas in West Africa: Situational analysis of Accra, Ghana. Theor. Empir. Res. Urban Manag. 2009, 4, 25–41. [Google Scholar]
  9. Amoako, C.; Boamah, F.E. The three-dimensional causes of flooding in Accra, Ghana. Int. J. Urban Sustain. Dev. 2015, 7, 109–129. [Google Scholar] [CrossRef]
  10. Pinto, R.; Tom Barendse, T.; van Emmerik, T.; Annor, F.; Duah, K.; Udo, J.; Lugt, D.; Uijlenhoet, R. Macroplastic emissions from the Odaw River, Ghana, into the ocean. In Proceedings of the EGU General Assembly 2022, Vienna, Austria, 23–27 May 2022. [Google Scholar] [CrossRef]
  11. Boadi, K.O.; Kuitunen, M. Urban waste pollution of the Korle Lagoon, Accra, Ghana. Environmentalist 2002, 22, 301–309. [Google Scholar] [CrossRef]
  12. CLIMACCESS Project Home Page, 2024. CLIMACCESS–University of Copenhagen. Available online: https://ign.ku.dk/english/climaccess (accessed on 20 March 2024).
  13. Ghana Meteorological Agency. Available online: https://www.meteo.gov.gh/gmet/welcome-to-the-ghana-meteorological-agency/ (accessed on 27 November 2023).
  14. Acheampong, J.N.; Gyamfi, C.; Arthur, E. Impacts of retention basins on downstream flood peak attenuation in the Odaw river basin. Ghana. J. Hydrol. Reg. Stud. 2023, 47, 101364. [Google Scholar] [CrossRef]
  15. Forson, E.D.; Amponsah, P.O.; Hagan, G.B.; Sapah, M.S. Frequency ratio-based flood vulnerability modelling over the Greater Accra Region of Ghana. Model. Earth Syst. Environ. 2023, 9, 2081–2100. [Google Scholar] [CrossRef]
  16. Osei, J.D.; Anyemedu, F.O.K.; Osei, D.K. Integrating 2D hydrodynamic, SWAT, GIS, and satellite remote sensing models in open channel design to control flooding within road service areas in the Odaw river basin of Accra, Ghana. Model. Earth Syst. Environ. 2023, 9, 4183–4221. [Google Scholar] [CrossRef]
  17. Balstrøm, T.; Crawford, D. Arc-Malstrøm: A 1D hydrologic screening method for stormwater assessments based on geometric networks. Comput. Geosci. 2018, 116, 64–73. [Google Scholar] [CrossRef]
  18. Møller-Jensen, L.; Allotey, A.N.M.; Kofie, R.Y.; Yiran, G.A.B. How Does Flooding Influence Intra-Urban Mobility? The Case of Accra. Sustainability 2023, 15, 14997. [Google Scholar] [CrossRef]
  19. Airbus. Elevation 10. Technical Product Specification, ver. 2.3; Airbu Defence and Space GmbH|Intelligence: Friedrichshafen, Germany, 2017.
  20. Forkuor, G.; Maathuis, B. Comparison of SRTM and ASTER Derived Digital Elevation Models over Two Regions in Ghana-Implications for Hydrological and Environmental Modelling. 2012, 219-240. London, UK: INTECH Open Access Publisher. Available online: https://www.intechopen.com/chapters/32991 (accessed on 18 February 2024).
  21. Ofori-Sarpong, E.; Annor, J. Rainfall over Accra, 1901–1990. Weather 2021, 56, 55–62. [Google Scholar]
  22. Geological Survey of Ghana. Geological map of Ghana; Compiled by and under the direction of the Director; Geological Survey: Accra, Ghana, 1965. [Google Scholar]
  23. Jones, A.; Breuning-Madsen, H.; Brossard, M.; Dampha, A.; Deckers, J.; Dewitte, O.; Gallali, T.; Hallett, S.; Jones, R.; Kilasara, M. (Eds.) Soil Atlas of Africa; European Commission: Luxembourg, 2013. [Google Scholar] [CrossRef]
  24. Eze, P.N. Spatial variability and classification of soils on a Legon hill catena in the Accra Plains, Ghana. J. Soil Sci. Env. Man. 2015, 6, 204–214. [Google Scholar] [CrossRef]
  25. Møller-Jensen, L.; Allotey, A.N.; Kofie, R.Y.; Yankson, P.W. A Comparison of Satellite-Based Estimates of Urban Agglomeration Size for the Accra Area. ISPRS Int. J. Geo-Inf. 2020, 9, 79. [Google Scholar] [CrossRef]
  26. Gyekye, P.M. Impacts of Floods on Soil Erosion and Urban Land Use and Soil Quality in the Greater Accra Metropolitan Area. Unpubl. Ph.D. Thesis, Department of Soil Science, School of Agriculture, University of Ghana, Accra, Ghana, 2023. [Google Scholar]
  27. ArcGIS Pro, Environmental Systems Research Institute, Inc.: Redlands, CA, USA, 2024.
  28. United States Geological Survey. GloVis. Available online: https://www.usgs.gov/ (accessed on 17 March 2024).
  29. Brammer, H. Soils of the Accra Plains: Memoir No. 3; Soil Research Institute. Ghana Academy of Sciences: Accra, Ghana, 1967. [Google Scholar]
  30. Erdelyi, M. The hydrogeology of Ghana. Int. Assoc. Sci. Hydrol. Bull. 1965, 10, 44–52. [Google Scholar] [CrossRef]
  31. Folly, A. Soil Surface Roughness and Infiltration in the Savannah Ecosystem and its Impact on Erosion. Dan. J. Geogr. 1996, 32, 32–39. [Google Scholar] [CrossRef]
  32. Effiom, E.O.; Kwabena, O.A.; Precious, K.B. Role of Soil Properties and Precipitation Concentration in Enhancing Floods in Northern Ghana. Eur. J. Sustain. Dev. 2015, 4, 339. [Google Scholar] [CrossRef]
  33. Trepekli, K.; Balstrøm, T.; Friborg, T.; Fog, B.; Allotey, A.N.; Kofie, R.Y.; Møller-Jensen, L. UAV-borne, LiDAR-based elevation modelling: A method for improving local-scale urban flood risk assessment. Nat. Hazards 2022, 113, 423–451. [Google Scholar] [CrossRef]
  34. Balstrøm, T.; Kirby, J. A GIS-based Screening Workflow for Coastal Storm Surge Impact Assessments and Mitigation Action Consideration. J. Coast. Res. 2022, 38, 712–724. [Google Scholar] [CrossRef]
  35. Zhao, G.; Balstrøm, T.; Mark, O.; Jensen, M.B. Multi-Scale Target-Specified Sub-Model Approach for Fast Large-Scale High-Resolution 2D Urban Flood Modelling. Water 2021, 13, 259. [Google Scholar] [CrossRef]
  36. Zhao, G.; Mark, O.; Balstrøm, T.; Jensen, M.B. A Sink Screening Approach for 1D Surface Network Simplification in Urban Flood Modelling. Water 2022, 14, 963. [Google Scholar] [CrossRef]
  37. Thrysøe, C.; Balstrøm, T.; Borup, M.; Löwe, R.; Jamali, B.; Arnbjerg-Nielsen, K. FloodStroem: A fast dynamic GIS-based urban flood and damage model. J. Hydrol. 2021, 600, 126521. [Google Scholar] [CrossRef]
  38. Boeing, G. OSMnx: New Methods for Acquiring, Constructing, Analyzing, and Visualizing Complex Street Networks. Comput. Environ. Urban Syst. 2017, 65, 126–139. [Google Scholar] [CrossRef]
  39. Fogarty, S. Car Experiment Shows Extent of Flood Danger. ABC News. Car Experiment Shows Extent of Flood Danger-ABC News. Available online: https://www.abc.net.au/news/2016-06-18/research-shows-cars-deadly-in-floodwaters/7522798 (accessed on 17 March 2024).
  40. Lissah, S.Y.; Ayanore, M.A.; Krugu, J.K.; Aberese-Ako, M.; Ruiter, R.A.C. Managing urban solid waste in Ghana: Perspectives and experiences of municipal waste company managers and supervisors in an urban municipality. PLoS ONE 2021, 16, e0248392. [Google Scholar] [CrossRef] [PubMed]
  41. Adomako, E.E.A.; Dellor, D. A Preliminary Assessment of the Effect of Urban Waste Pollution in the Korle Lagoon Area of Accra, Ghana, on Nutrition and Growth of Maize (Zea mays L.). Agric. Sci. 2023, 14, 843–854. [Google Scholar] [CrossRef]
  42. Oteng-Ababio, M.; Grant, R. E-waste recycling slum in the heart of Accra, Ghana: The dirty secrets. In Handbook of Electronic Waste Management, Butterworth-Heinemann; Prasad, M.N.V., Vithanage, M., Borthakur, A., Eds.; Butterworth-Heinemann: Oxford, UK, 2020; pp. 355–376. ISBN 9780128170304. [Google Scholar] [CrossRef]
  43. Ministry of Sanitation and Water Resources. National Solid Waste Management Strategy for Ghana. 2020. Available online: https://ghanawasteplatform.org/wp-content/uploads/2021/11/National-Solid-Waste-Management-2020.pdf (accessed on 18 May 2024).
  44. Aning-Agyei, M.A.; Aning-Agyei, P.G.; Osei-Kufuor, P.; Kendie, S.B. Satisfaction with public-private partnership in solid waste management in Ghana. Sustain. Environ. 2024, 10, 2345432. [Google Scholar] [CrossRef]
  45. Mudu, P.; Akua Nartey, B.; Kanhai, G.; Spadaro, J.V.; Fobil, J.; World Health Organization. Solid Waste Management and Health in Accra, Ghana; World Health Organization: Geneva, Switzerland, 2021. [Google Scholar]
  46. Kanhai, G.; Agyei-Mensah, S.; Mudu, P. Population awareness and attitudes toward waste-related health risks in Accra, Ghana. Int. J. Environ. Health Res. 2021, 31, 670–686. [Google Scholar] [CrossRef] [PubMed]
  47. Djaba, S.; Djaba, P.A.; Arthur, E. GIS Based Application, a Tool for Waste Management in Accra Metropolitan Area of Ghana. FIG Working Week 2020. Smart Surveyors for Land and Water Management. Amsterdam, 10–14 May, 2020. Available online: https://api.semanticscholar.org/CorpusID:231813761 (accessed on 18 February 2024).
  48. Oteng-Ababio, M.; Nikoi, E. ‘Westernizing’ solid waste management practices in Accra, Ghana-a case of ‘negotiated waste collection. Ghana Soc. Sci. J. 2020, 17, 73–92. [Google Scholar]
Figure 1. Collapsed concrete walls identified at the yellow arrows along the Odaw River at Achimota, 5°37′13.0 N, 0°13′44.5 W. Date: 6 September 2023. Source: Google Earth Pro.
Geohazards 05 00038 g001
Figure 2. Trash dumping in a side stream to Odaw River not far from Odaw Train Station. Source: Google, 2020.
Geohazards 05 00038 g002
Figure 3. The trash piled up (yellow arrow) in the river south of the Industrial Area, Old Fadama, a little north of the Korle Lagoon, Accra, 5°32′30.6 N, 0°13′20.7 W. Date: 6 September 2023. Source: Google Earth Pro. The distance between the riverbanks is approx. 35 m. Source: Esri Basemap, 2024.
Geohazards 05 00038 g003
Figure 4. The Greater Accra Metropolitan (GAMA) study area with locations (red dots) and names for weather stations. The Odaw River basin has a solid black outline with major streams added. Other nearby minor drainage basins investigated have thin black outlines. GAMA has a dashed black outline. The background map is © Esri, HERE, and Garmin.
Geohazards 05 00038 g004
Figure 5. Interpolated precipitation values for 17 selected stormwater episodes based on reported daily observations for 6 weather stations if just one of them recorded a rainfall ≥ 60 mm at either Akropong Akuapim, Aburi, Nsawam, Pokuase, Accra Airport, or Tema. The drainage basins that need further investigation have thin black outlines; the Odaw River basin, which spans a significant portion of the GAMA, is particularly noteworthy. The background map is © Esri, HERE, Garmin, and USGS.
Geohazards 05 00038 g005
Figure 6. A land use/land cover map. The Odaw River basin has a solid black outline. The back-ground map is © Esri, HERE, Garmin, and USGS.
Geohazards 05 00038 g006
Figure 7. Soil types in the GAMA according to a soil map by [29] classified according to [30] at a scale of 1:250,000 when digitized by Ghana’s Soil Research Institute in 1999. The Odaw River basin has a black outline. The background map is © Esri, HERE, Garmin, and USGS.
Geohazards 05 00038 g007
Figure 8. Approximated soil infiltration rates for 1 and 2 h rain events based on Table 2.
Geohazards 05 00038 g008
Figure 9. Red lines show four digitized hydro-conditioning features (left) where infrastructures are elevated above ground levels and one (right) where a stream underpasses the infrastructure.
Geohazards 05 00038 g009
Figure 10. At the endpoints for the hydro-conditioning features, the elevation levels z0 and z1 are used to interpolate new levels along the dotted line matching the actual water level. This is to detect correct flow paths from the DTM.
Geohazards 05 00038 g010
Figure 11. River length profile for the Odaw River from its outlet into the Gulf of Guinea and 11 km upstream. The many irregular elevation levels are caused by bridges, piled-up trash, dislocated river concrete walls, and sediment. The even levels from 0 to 1.2 km upstream from the river’s outlet were adjusted by the provider of the DTM (AirbusTM).
Geohazards 05 00038 g011
Figure 12. A section through a local bluespot and its local contributing watershed. When the water level exceeds the pour point’s elevation level, the excess spillover (SpillOverOut) is transported downstream to the next bluespot’s watershed as incoming spillover (SpillOverIn from upstream, Figure 14).
Geohazards 05 00038 g012
Figure 13. An example of Arc-Malstrøm outputs for a region west of Frafraha, 0°10′26″ W, 5°43′22″ N: local bluespots; their associated local watersheds; the identified bluespots’ pour points; and stream paths for the downstream spillover when bluespots have reached capacity. Take note of where each bluespot is in the upstream and downstream hierarchy. Numerous bluespots are regarded as first-order bluespots since they are situated close to the main drainage basin’s outline not affected by contributions from upstream sources. The further downstream a bluespot is positioned in the hierarchy, the more it becomes affected by spillover from upstream bluespots, see Figure 14.
Geohazards 05 00038 g013
Figure 14. An Arc-Malstrøm modelling concept using the same symbols for the various elements as presented in Figure 13. If the soil infiltration rates vary within a bluespot’s watershed, the sum of the area-wise infiltration rates is summarized (Infiltrationa + Infiltrationb). The same method may be applied to the rain volume added to a bluespot’s watershed if a distributed rain event is considered.
Geohazards 05 00038 g014
Figure 15. Infiltration rates during 1 and 2 h vs. rain volumes for a 60 mm rain event in % visualized for the bluespot watersheds. In most cases, the differences are hardly distinguishable. The background map is © Esri, HERE, Garmin, and USGS.
Geohazards 05 00038 g015
Figure 16. Bluespots and their filled events in mm for a rainfall of 1 h duration including soil infiltration. Additionally, streams carrying the downstream spillovers in m3 for a 60 mm rain event are visualized and sliced into equal intervals. The streams’ widths do not represent any flooded areas but only symbolize the event’s accumulated runoff volumes. The background map is © Esri, HERE, Garmin, and USGS.
Geohazards 05 00038 g016
Figure 17. Bluespot extents before (hatched) and after (blue) an impassable barrier (red) was raised to a level of 3.2 m simulating a clogging from trash at the Odaw River’s outlet into the Gulf of Guinea south of Korle Lagoon. The background map is © Esri, HERE, Garmin, and USGS.
Geohazards 05 00038 g017
Figure 18. Bluespot depths when filled to their pour point levels close to a critical major road intersection at George Bush Motorway and Nsawam Road, Achimota (0°13′41″ W, 5°36′49″ N). The major bluespot is filled at a rain event of 30 mm. The smaller central bluespot is not filled until a 60 mm rain event. Notice the blue streamline under-passing the roads in the lower right part of the map’s extent. The total volume passing is approx. 5.8 Mio. m3 during a 1 h rain event. According to the DHyM used, the two road lanes there are located approx. 13.1 m above sea level, and the river’s level before flooding is 10.7 m, i.e., an elevation difference of 2.4 m. The background orthophoto is © Esri.
Geohazards 05 00038 g018
Table 1. Selected stormwater events where the average precipitation values reported daily for 6 weather stations at Akropong Akuapim, Aburi, Nsawam, Pokuase, Accra Airport, and Tema were more than 60 mm. Max. values for the events are highlighted in yellow. Their deviations from the mean values and the value ranges indicate that the events are caused by convection rain appearing randomly, locally, and of varying magnitude.
Station/Date27 April 19807 July 198127 September 198725 June 198814 July 199120 May 199224 June 19953 July 199527 May 1996
ABURI51.351.868.1102.197.534.570.4102.177.5
AKROPONG AK.113.045.532.329.0120.191.431.260.788.9
ACCRA AIRP.85.360.867.444.5157.279.387.2243.950.8
TEMA121.9114.278.878.562.688.327.2129.455.9
POKUASE50.810090.5105.8135.744.811081.9102.3
NSAWAM114.861.2142.267.3115.648.072.971.162.3
Mean89.572.279.971.2114.864.466.5114.873.0
Min50.845.532.329.062.634.527.260.750.8
Max121.9114.2142.2105.8157.291.4110243.9102.3
SD32.328.036.230.732.524.832.167.820.2
Range71.168.7109.976.894.656.982.8183.251.5
Station/Date12 June 19976 January 20029 June 200214 April 200313 June 200425 October 20115 June 20143 June 2015
ABURI57.488.660.068.462.496.0133.559.8
AKROPONG AK.26.294.048.849.348.186.078.624.1
ACCRA AIRPORT113.7112.5123.3119.897.697.767.9212.8
TEMA119.739.778.461.637.071.773.191.4
POKUASE68.339.355.149.246.6125.7121.487.2
NSAWAM36.9136.36120.479.245.5129.686.2
Mean70.485.171.161.561.887.1100.793.6
Min26.239.348.820.437.045.567.924.1
Max119.7136.3123.3119.897.6125.7133.5212.8
SD38.939.027.433.022.927.030.563.7
Range93.597.074.599.460.680.265.6188.7
Table 2. Soil infiltration rates, mm/hr, for 1 and 2 h rain events.
Soil Group NameInf. 1 h (mm)Inf. 2 h (mm)
Calcic Vertisols8.212.7
Dystric Fluvisols2.62.9
Dystric Leptosols2.62.9
Eutric Plinthosols18.730.1
Ferric Acrisols5.56.7
Ferric Luvisols5.56.7
Gleyic Arenosols40.080.0
Sodic Solonchaks2.62.9
Stagnic Solonetz2.62.9
Umbric Leptosols2.62.9
Disclaimer/Publisher’s Note: The statements, opinions and data contained in all publications are solely those of the individual author(s) and contributor(s) and not of MDPI and/or the editor(s). MDPI and/or the editor(s) disclaim responsibility for any injury to people or property resulting from any ideas, methods, instructions or products referred to in the content.