1. Introduction
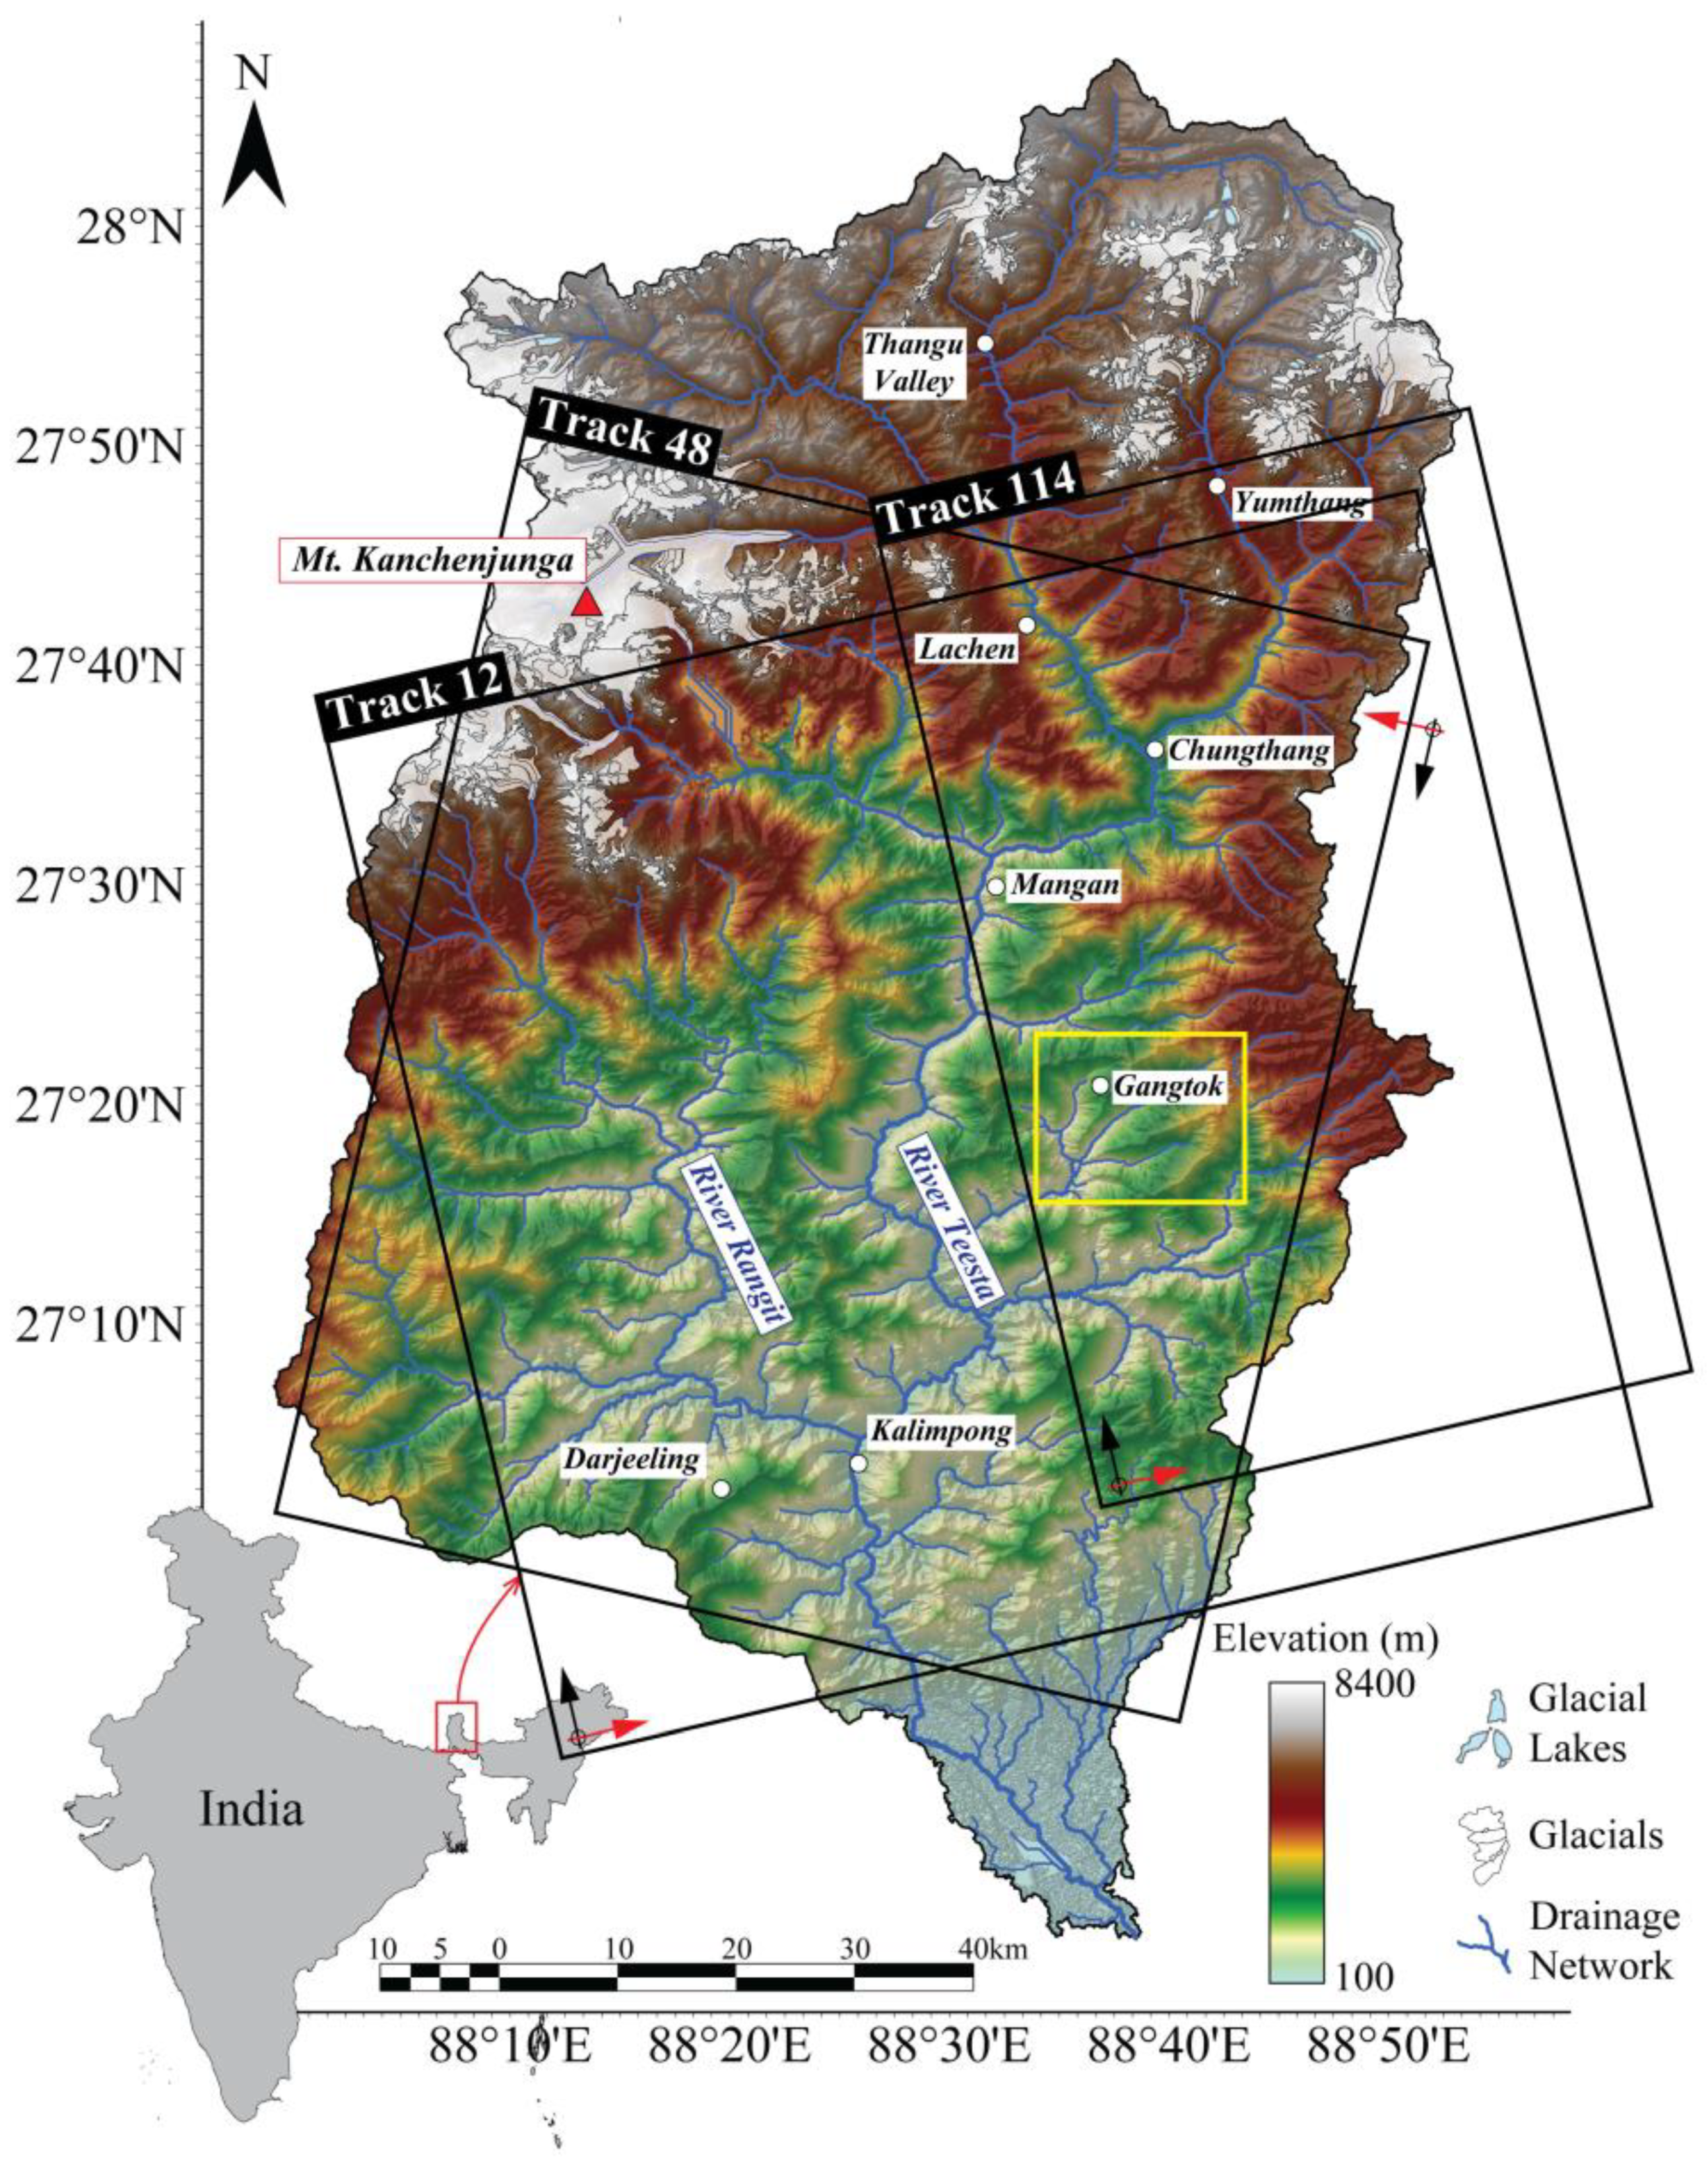
Sikkim, a small mountainous Indian state bordered by Bhutan in the east, Nepal in the west and Tibet in the north, is home to Mount Kanchenjunga, the world’s third-highest peak at 8586 m (
Figure 1). The mountainous topography of the entire state of Sikkim ranges from 300 m at the outflow of the drainage network in the south to an elevation of 8586 m in the northern peaks near Nepal (Mt. Kanchenjunga) [
1]. The occurrence of landslides is a common phenomenon in Sikkim Himalaya, and the magnitude of damage caused yearly in various parts of the state is quite large [
2].
It is one of India’s most vulnerable regions due to its location in the very high-risk seismic and landslide hazard zone [
3]. Consequently, earthquake-induced and rainfall-triggered landslides are common in the area. In September 2011, over 1000 landslides were triggered by the 6.9 Mw earthquake in Sikkim, causing devastating damage to lives and properties in the region. These landslides were then mapped using remote sensing techniques and verified on the ground [
4]. Due to their proximity to the centre of the earthquake, it was found that the regions of Mangan and Chungthang in North Sikkim were badly damaged by landslides. Before this, the region was struck by a major earthquake (Mw 5.7) on February 14, 2006, which also caused numerous landslides that left two Indian army soldiers dead [
5]. This region had experienced relatively moderate and frequent seismicity, with 18 earthquakes of magnitude 5.0 or greater occurring over the last 35 years within 100 km of the epicentre of the September 2011 event. During the decade after the 2011 Sikkim earthquake, Gangtok and other parts of the state of Sikkim have been reconstructed; however, the majority of newly constructed and old refurbished structures are established on steep slopes without considering the geotechnical features of the underlying soil and unstable areas [
6].
Every year during the monsoon period, rainfall-induced landslides are known to create havoc in the region. During the monsoon of 2019, Sikkim was cut off from the rest of India due to multiple landslides on the national highway (NH31) that serves Gangtok, the capital of Sikkim. The alarming number of catastrophic landslides in Sikkim has prompted the Indian Ministry of Earth Sciences and the Norwegian Research Council to initiate technical research on studying the behaviour of landslides triggered by seismicity and meteorological conditions in the region.
When analysing a landslide, it is important to determine what factors control the formation of the rupture surface and the movement on that surface. This requires an engineering analysis of the stability of the landslide mass and an analysis of the changes in geologic and meteorological conditions that are correlated with landslide activity.
The application of satellite-based interferometric synthetic aperture radar (InSAR) for detecting and monitoring slope movements has been well-documented for various landslide typologies in the last decade [
7,
8,
9]. Landslides can be identified [
10], studied in detail [
11], and monitored over time [
12]. The conventional differential InSAR method has been employed for monitoring slow-moving landslides on the order of dm/yr [
13,
14], whereas multi-temporal InSAR methodologies based on SAR data stack analysis have allowed a significant improvement in monitoring and identifying slow-moving landslides on the order of mm/yr [
15,
16,
17]. Until recently, the largest hindrance to regional InSAR studies was the availability of suitable time series of input images. Some historic missions, such as ERS and ENVISAT, provided data with consistent acquisition geometry but at most one image per month and with limited geographic coverage. Other missions only provided data when specifically tasked to do so. This has changed with the advent of the European Copernicus Program, with its Sentinel-1 satellites. The Sentinel-1A and -1B radar satellites, launched in 2014 and 2016, acquire global images every six or 12 days, depending on the location.
The first observation of ground deformation dominated by rainfall over the unstable slopes in the study area has been documented using persistent scatterer interferometry (PSI) analysis of Sentinel-1 InSAR datasets acquired between 2015 and 2018 [
18]. A more recent study related the ground deformation with the structural discontinuities in Gangtok and the surrounding area using the same processing technique on the Sentinel 1 dataset acquired between 2017 and 2020 [
19]. In this study, the rate of movement in critical areas in Gangtok is quantified by InSAR, utilising all available sets of Sentinel-1A/B images and engineering geological investigations performed on the ground related to InSAR observations.
Figure 1.
Study area and SAR data coverage. Sentinel 1-A/B SAR data coverage is overlain on the 30 m shaded topography (SRTM-1) with the drainage system. Rectangles labelled with track numbers indicate the coverage of the IW SAR images. Red and black arrows indicate the satellite’s LOS look and flight directions, respectively. The study area outlined by the yellow rectangle is the main area of interest of this study. The glaciers of the Sikkim region were obtained from the GLIMS (Global Land Ice Measurement from Space) database ([
20] based on [
21]).
2. Geology of Sikkim
Sikkim is a relatively small state of the Indian Union in Eastern Himalaya. Due to the tectonic complexity and several phases of metamorphism, the geological setting and stratigraphic positions of the various rock units in Sikkim Himalaya continue to be academically debated and evaluated. Precambrian rocks span a large area of the Sikkim Himalaya and are represented by four major geological formations, which, listed from youngest to oldest, are [
22]: the Everest Pelitic Formation, the Sikkim Group, the Chungthang Formation, and the Kanchenjunga Gneiss Group.
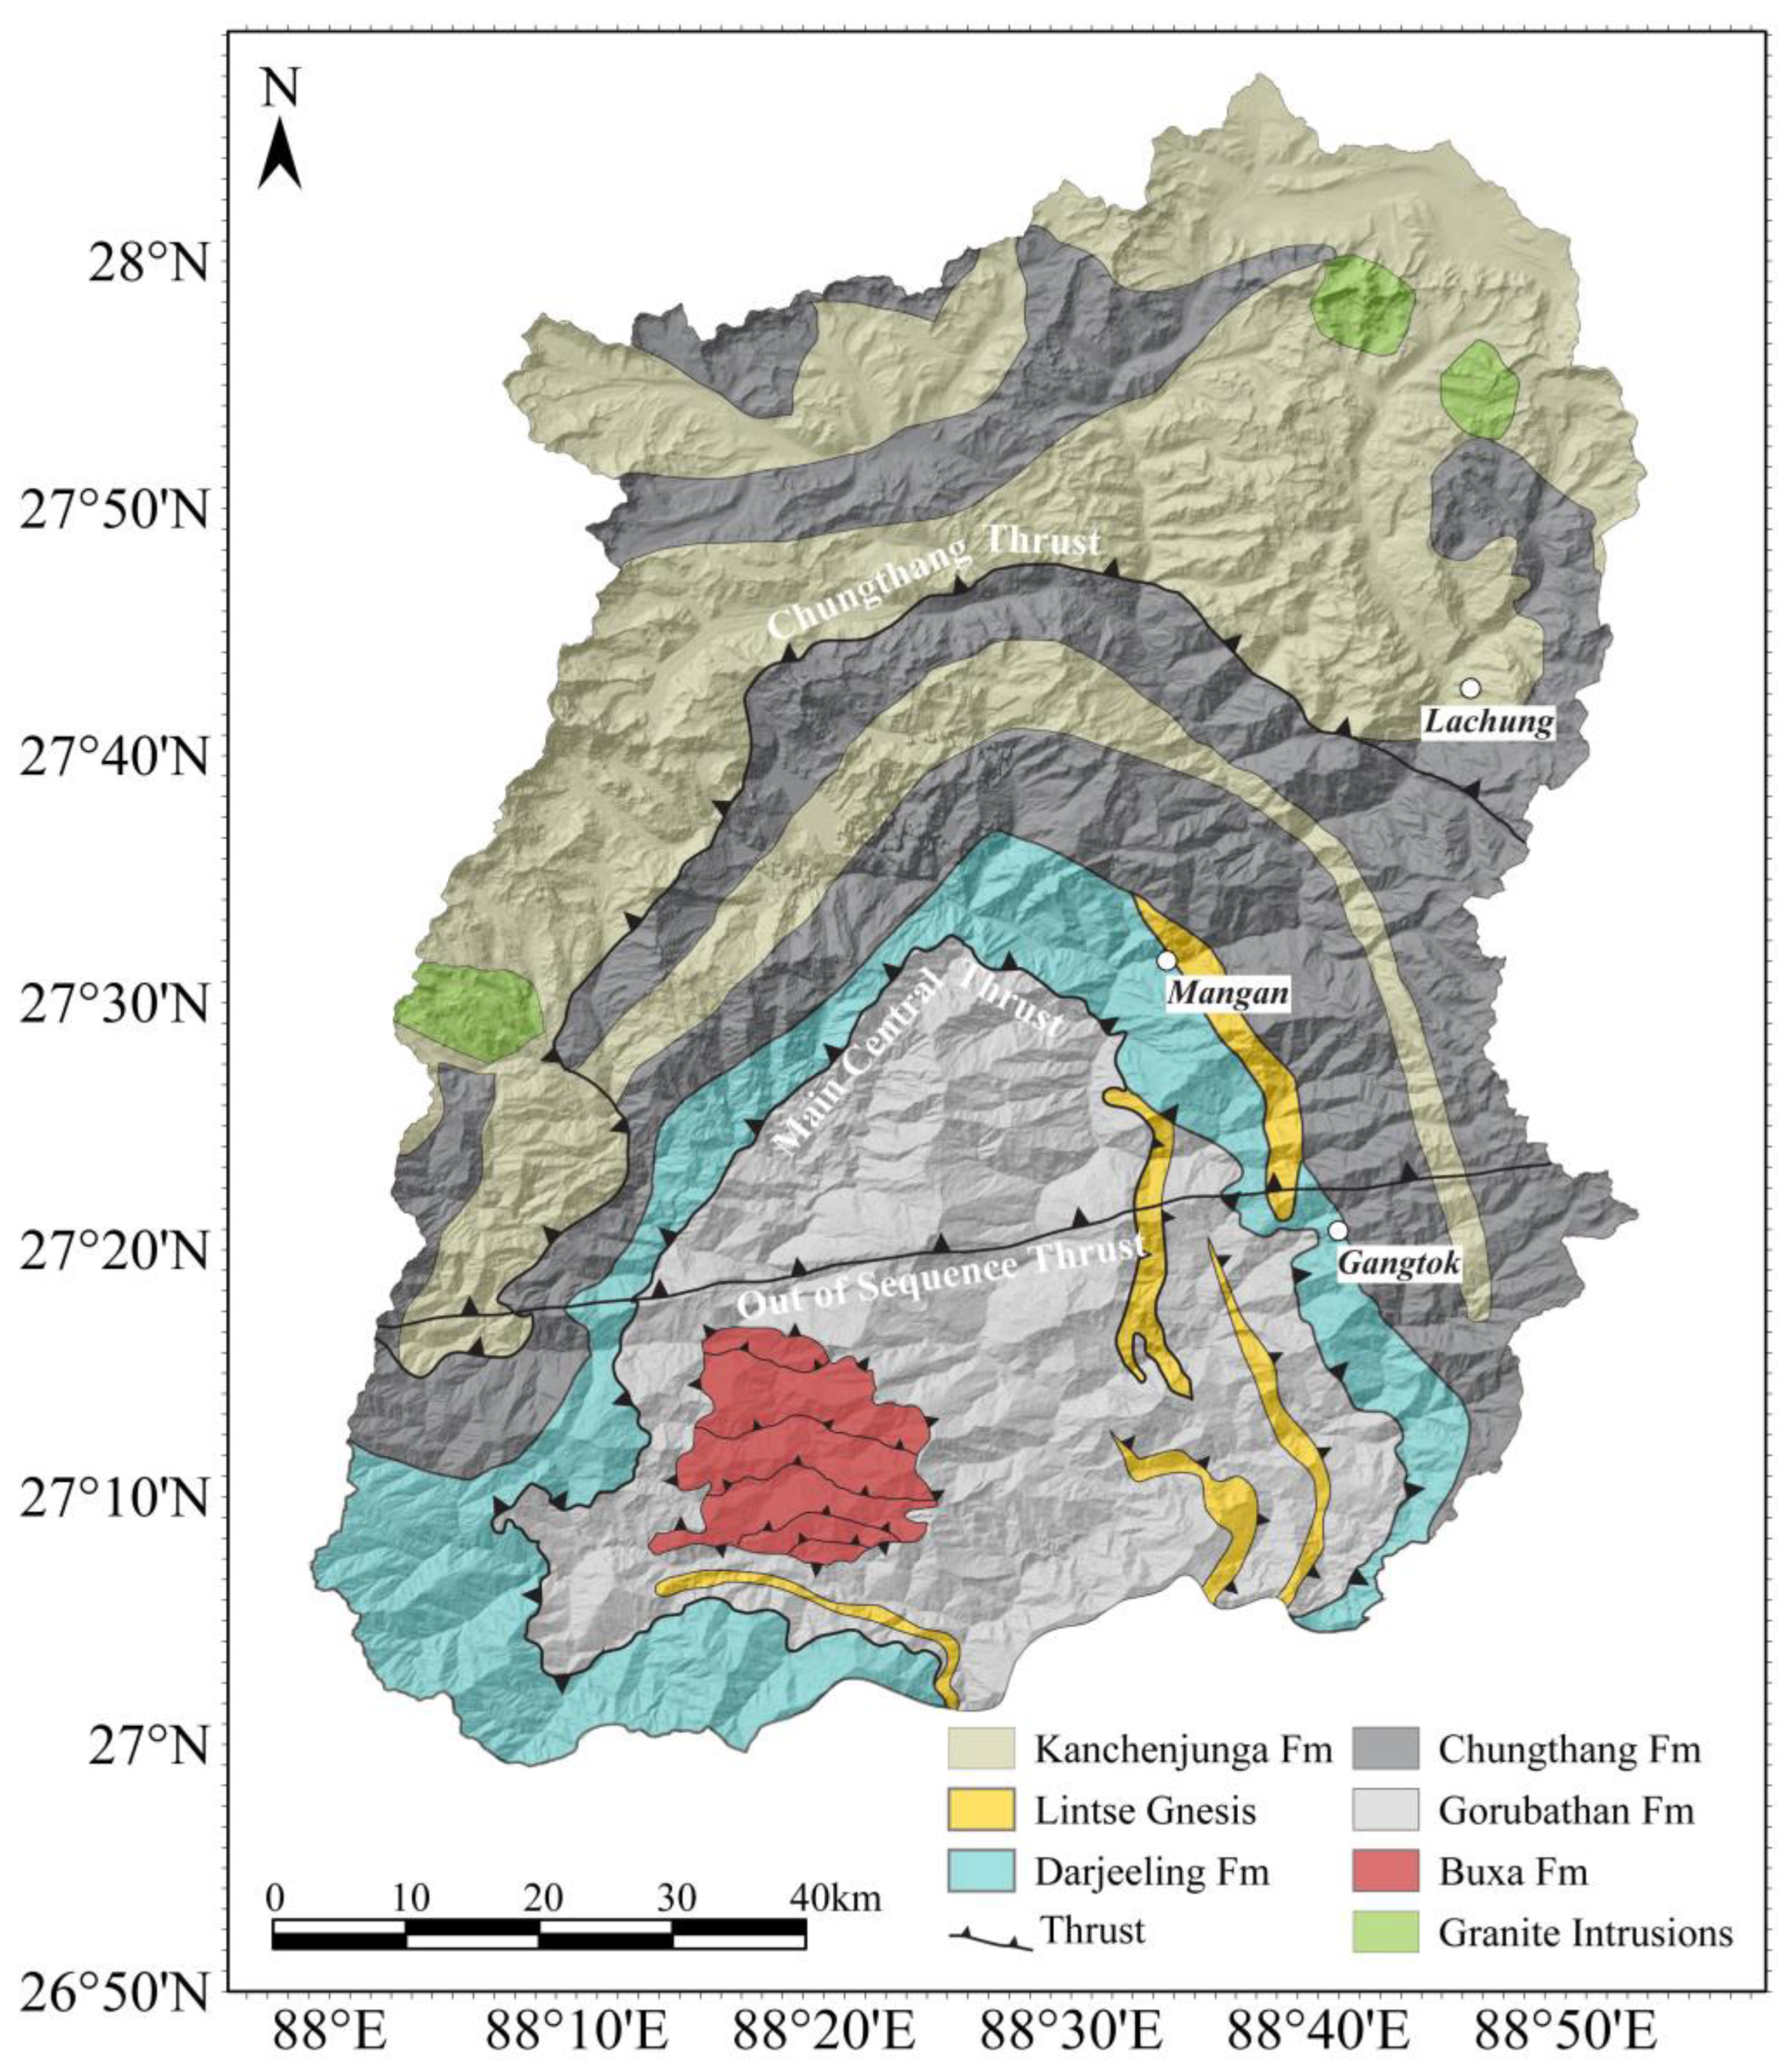
Gangtok lies in the eastern region of Sikkim and is dominated by the Sikkim group of rocks comprising schists and gneisses. The gneiss formation is commonly referred to as Darjeeling Gneiss (
Figure 2). East Sikkim is mainly dominated by rocks of the lower metamorphic grades, mainly chlorite schist, sericite schist, and quartz schist. These rocks have a phyllitic appearance. The East Sikkim Himalaya is traversed by two thrusts called the Chungthang Thrust and the Main Central Thrust (MCT), both trending in a NW—SE direction. The MCT is a well-known tectonic boundary between sedimentary and crystalline rocks, separating the Lesser and Greater Himalayas (
Figure 2). It is characterised by crushed rock and fracture zones. The Chungthang Thrust involves gneissic rocks of the Chungthang Formation and schistose rocks of the Sikkim Group. These schistose rocks are present in the Gangtok region.
3. Precipitation Regime and Seismicity
Sikkim Himalaya is exposed to high variations of precipitation throughout the year. The periods of intense rainfall in the region not only contribute to rapid erosion and weathering of the rock mass but also increase the groundwater level, leading to a reduction in the stability of natural slopes [
2]. Sikkim is also a seismically active area where earthquakes and landslides are frequent [
24].
Sikkim is located on the south-facing slopes of the Himalayan mountain range, and the yearly precipitation in Gangtok is relatively high, with an annual average of over 3500 mm [
25]. The monsoon period extends from April to September, while a dry season exists in mid-winter. In Gangtok, temperature variation is significant, but freezing seldom occurs. Precipitation of more than 100 mm in a 24-h period is a frequent phenomenon, happening almost every year in the region. During such periods, roads are blocked due to landslides triggered by intense rainfall. A massive rockslide known as the “Dzongu landslide” occurred in 2016 near the town of Mangan and was associated with excessive rainfall and seismicity. The failure of the Dzongu landslide was preceded by ten years of slope deformation, as crack development was evident on satellite images since 2006 along the eastern flank of the failure [
26]. Over the years, due to the percolation of water in the tension crack and in the existing joints, the shear strength of the discontinuities reduced, causing slope failure [
2].
Concerning seismicity, historical data show that Sikkim and its adjoining area lie in a region prone to moderate to great earthquakes. The entire area of Sikkim lies in Zone IV of the seismic zonation map of India [
27]. Sikkim and its adjoining region are part of the seismically active region of the Alpine-Himalayan seismic belt, where four of the greatest earthquakes in the world have occurred (magnitude 8.0 and above). Earthquakes in this region are broadly associated with strain accumulation related to the northward tectonic movement of the Indian Plate and its subsequent abrupt release. The strain is generally released by activity along Himalayan faults and thrusts of regional dimensions, of which Main Boundary Thrust (MBT) and Main Central Thrust (MCT) are particularly important (
Figure 2) [
28].
4. Methodology
The Sentinel-1 satellites’ terrain observation by progressive scan (TOPS) mode demonstrates a notable superiority in comparison to other sensor modes due to its capability to offer broad coverage and a rapid revisit period of up to six days in Europe and 12 days globally. For the study area, we used all available sets of images with a total of 455 images acquired on three overlapping tracks in ascending (tracks 12 and 114) and descending (track 48) orbit (See
Figure 1 and
Table 1). Data span the period from October 2014 until 2021. The region examined has a high vegetation cover urbanised with a mountainous topography, which limits the observation quality of InSAR. However, phase-stable targets such as rooftops, large rock outcrops and motorways over the study area provide favourable phase coherency for interferometric SAR processing. The reference date for all tracks was chosen as the first image in Nov 2018, which was chosen to be far away from monsoon season.
InSAR processing was carried out using the GSAR-GTSI processing system developed by NORCE and used by the Norwegian ground motion service [
29]. The processing system follows the general principles of persistent scatterer interferometry [
7], optimised for wide-area processing (WAP). Image coregistration is performed using a version of the enhanced spectral diversity algorithm [
30]. We used the Shuttle Radar Topography Mission (SRTM) 3-arcsecond digital elevation model to adjust the topographic contribution to the radar phase. All interferograms were computed based on a single master network for PSI analysis. The choice of the master images minimised the spatial and temporal baselines. Atmospheric phase screen (APS) is estimated over multiple bursts. All pixels are analysed and tested as potential measurement points, excluding spatially significant water bodies, layover, shadow, and very low mean amplitude. The final measurement point (persistent scatter, PS) selection is based on thresholding the achieved RMS deviation from a fitted third-order polynomial + seasonal model, followed by redundancy reduction. As a selection criterion, points with RMSE less than or equal to 5.0 were included in the analysis. Such a low-order polynomial model is more realistic than a linear model without the risk of overfitting. The obtained InSAR velocity values are relative to the median velocity of the whole image.
The InSAR technique measures projections of ground displacement only along the line-of-sight (LOS) look angle. This limitation can be overcome when multiple datasets acquired with different viewing directions over the same area are available. We can retrieve the vertical and horizontal components of real deformation by combining LOS velocities obtained from ascending and descending viewing geometries [
31,
32,
33]. For satellite-based InSAR, the various LOS still lie within a single plane, limiting the ability to resolve the true movement direction. Thus, some a priori knowledge about the displacement needs to be introduced to constrain the reconstruction [
34]. For this study, the common approach of assuming no northwards component is unrealistic, given the local topography. Instead, we have chosen to assume that all movement is in the downslope compass direction but with no constraint on the dip angle (i.e., no lateral movement). This allows us to estimate how steep the movement direction is, as well as the true velocity.
The maps in the following section show the estimated velocities, along with the assumed movement direction, which is based on a local elevation model. The estimated dip and velocity of these points are shown on accompanying vertical cross-sections. Wherever possible, all three input geometries were used for the 3D decomposition.
5. Results
5.1. Landslide Investigations around Gangtok
Landslides in Gangtok occur along one or more discrete surfaces and involve soil or rock debris, but sometimes both the rock and its cover move. When analysing a landslide, it is important to determine what factors have controlled the formation of the rupture surface and the movement on that surface. In recent years, unauthorised development activities and the construction of new homes and buildings without proper drainage and sewerage systems have made the fragile hill slopes of Gangtok vulnerable to failure. Therefore, the preventive and corrective measures to be adopted at various landslides in the Gangtok area must be based on detailed geotechnical investigations and the monitoring of ground movements. These investigations and movements are described in the paper.
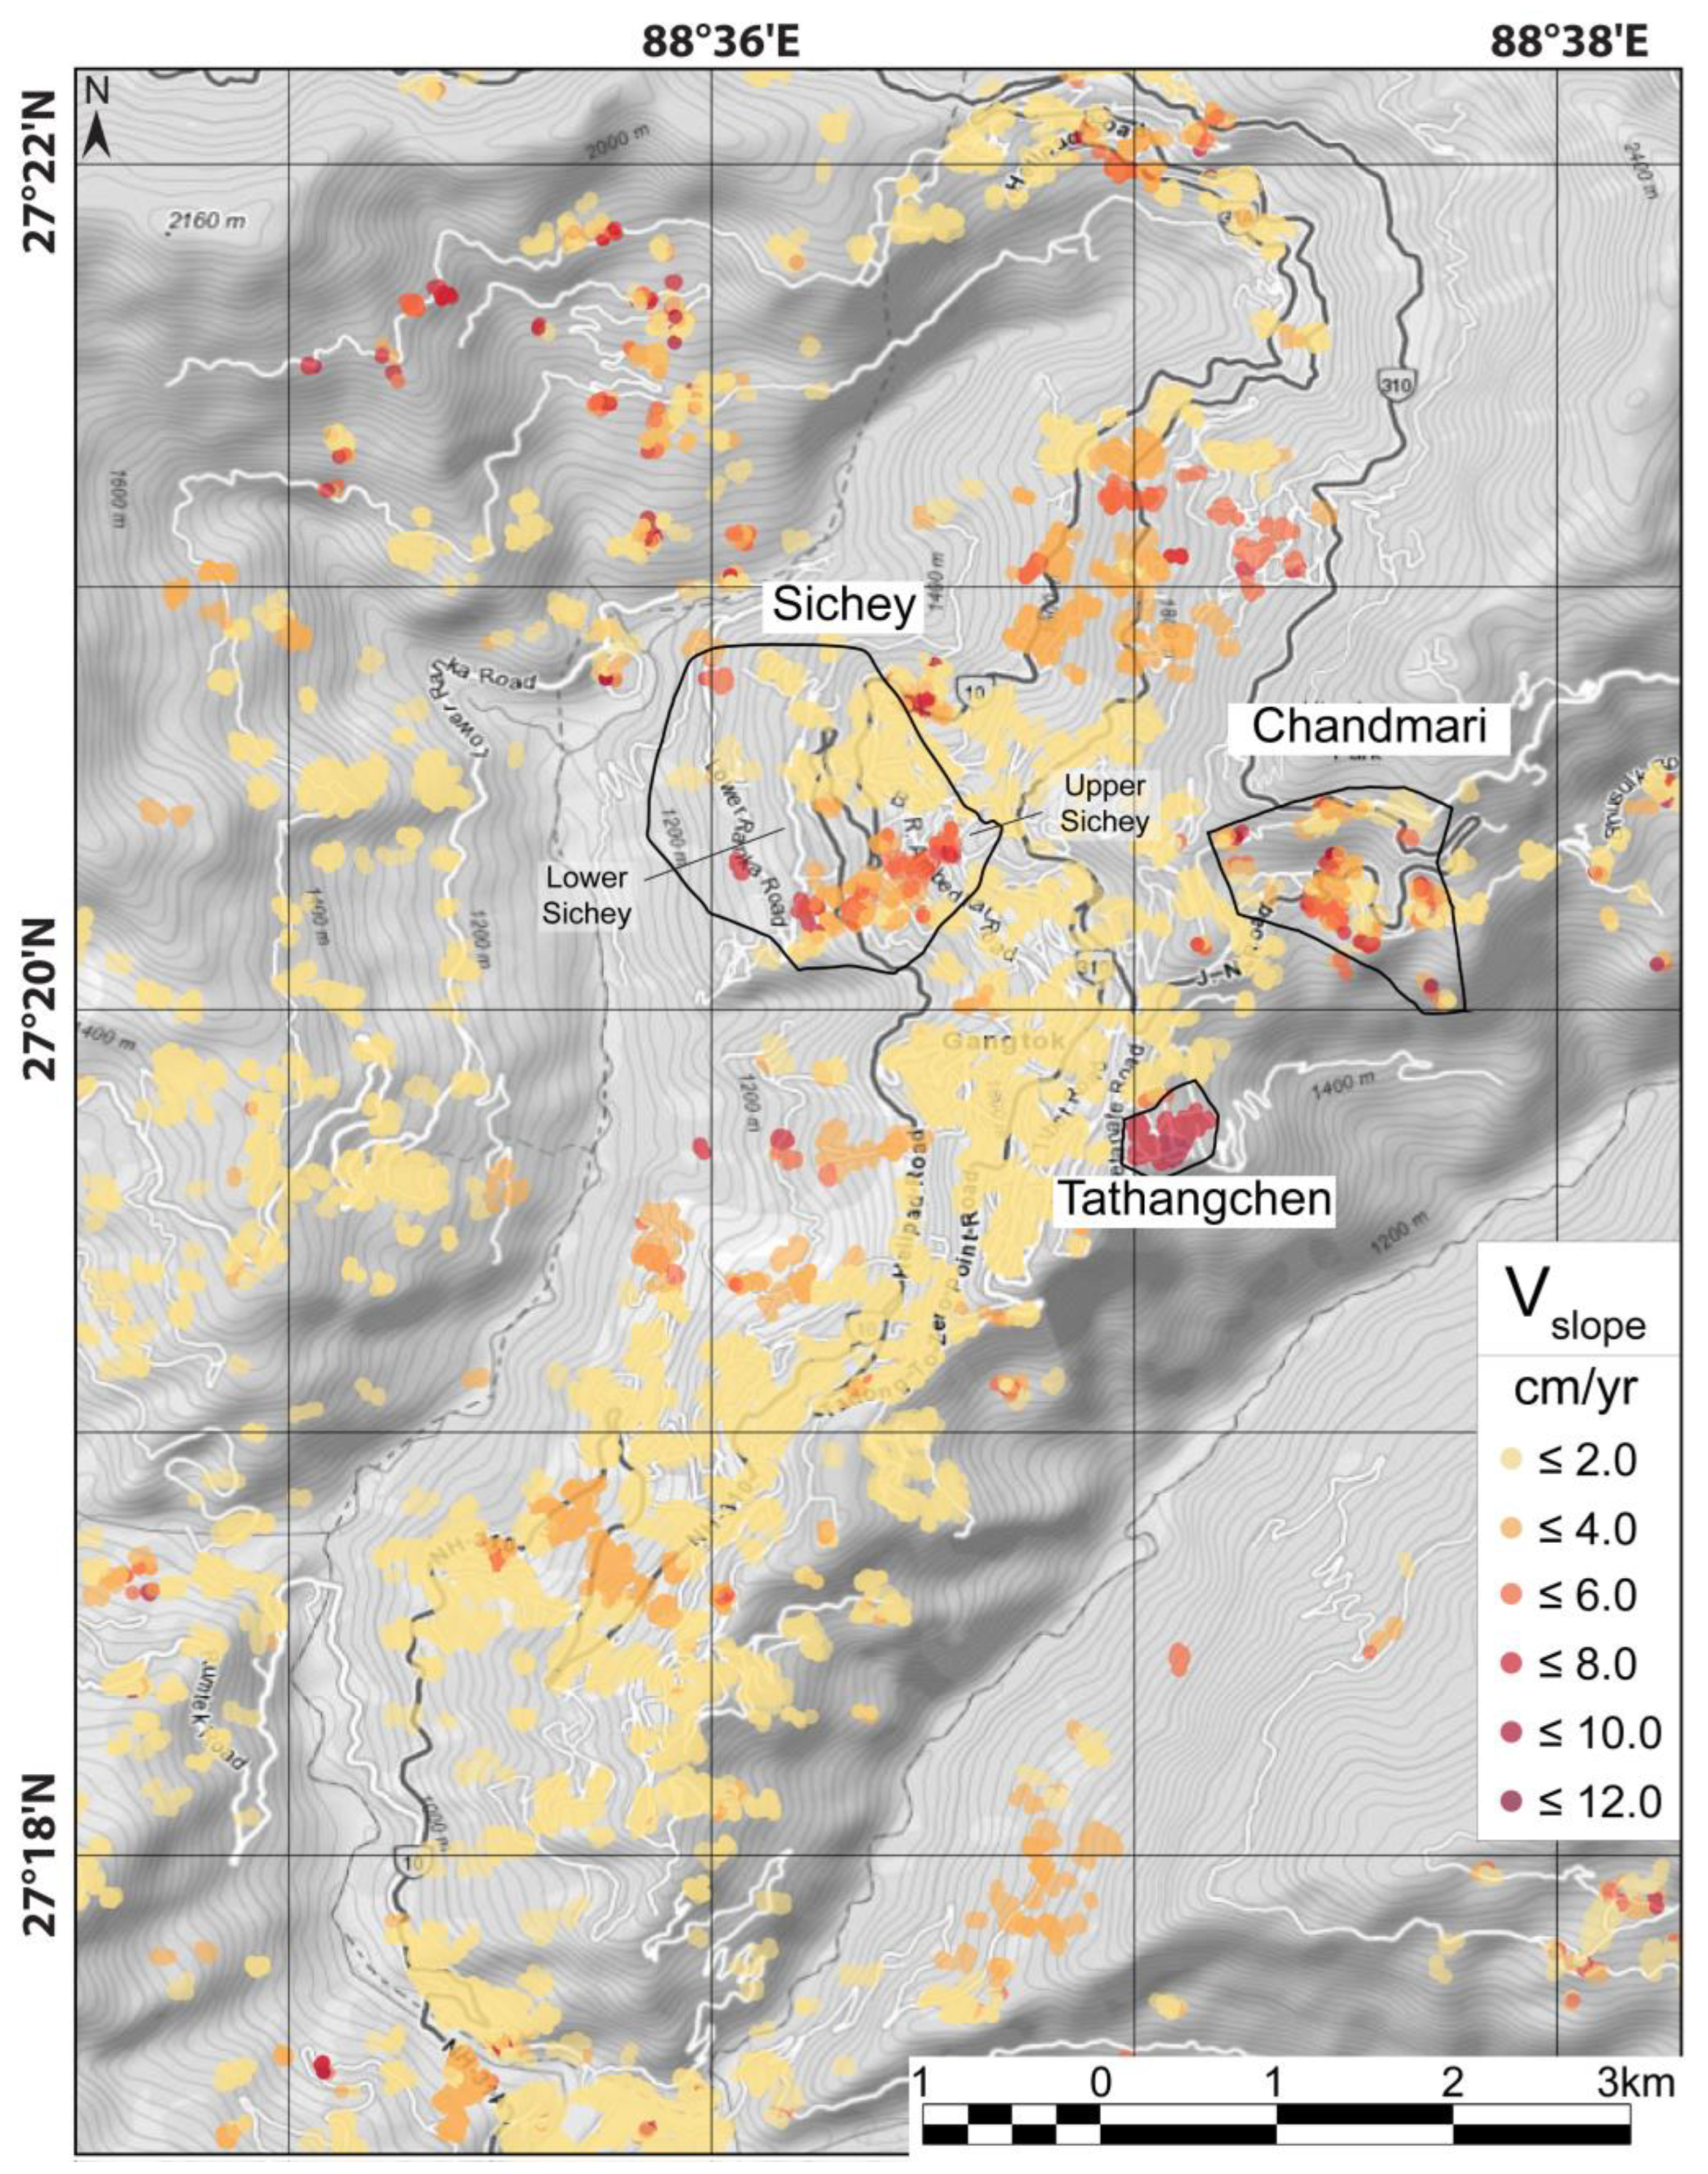
Many areas of Gangtok currently experience ground motion (
Figure 3). Discretely bounded areas are moving at rates sometimes exceeding 12 cm/year with ~4 mm/year maximum root mean square error (RMSE) in the LOS direction over the active areas. In this study, we concentrate our analysis on Tathangchen landslide, Chandmari landslide, and Upper and Lower Sichey area landslides.
5.2. Tathanghen Landslide
The Tathangchen landslide is on the east-facing slope in Gangtok, starting at an elevation of about 1850 m.
Figure 4a shows the slope, which is moving at an approximate rate of about 8–10 cm/year. The lower part of the slope contains phyllitic rock, while the upper portion contains micaceous schists. Both of these rocks have been observed to be highly weathered and weak in strength. A thin cover of soil from the weathered rock is prevalent throughout the area. Some of the exposed phyllitic rock is highly weathered and foliated, as shown in
Figure 4b. Most of the joints in phyllitic rocks have smooth surfaces where sliding can easily occur, indicating the low shear strength of the rock joints in accordance with the well-established shear strength criteria [
35]. They are observed to be steeply dipping foliation surfaces that parallel the east-facing slope of Haenchen. With the help of a profilometer, the joint roughness coefficient (JRC) in the field was estimated to be between 2–8, indicating smooth, planar to rough, slightly weathered joints. In gneissic muscovite micaceous rocks (as in this case), the JRC value was back-calculated to about six [
35], which is in the range of that measured in the field through a profilometer. The exposed phyllitic rock is quite weak in nature, which could, in some cases, be easily plucked out by hand and disintegrated with a geological hammer. In this case, the joint wall compressive strength (JCS) was estimated to be less than 20 MPa, which is the uniaxial compressive strength of the rock. It is likely that these foliation surfaces become saturated and lose their shear strength during intense infiltration of water during the rainstorm. Pore pressures reduce the available shear resistance along these discontinuities, and the weight of the water adds to the active forces that tend to induce rocks to slide when acting behind subvertical discontinuities [
35]. The original form of the non-linear «JRC—JCS» criterion for predicting the shear strength of rock joints [
35] is written as:
When shear tests are performed with saturated joints, then the index values of JCS and (ϕb) (basic friction angle), from which (ϕr) is calculated, will usually be lower by 5–20%.
In an advanced rate of weathering, a more uniformly reduced value of rock compressive strength drops to the same level of JCS, in which case the rock mass is permeable throughout. The Schmidt hammer is useful for measuring JCS values to about 20 MPa. Due to weathering, the JCS value can be up to 1/4 of the compressive strength of the rock mass.
It is believed that the movement of the slope at Tathangchen is initiated due to the low friction along the bedding planes where trees have been observed to be tilted, indicating creep of the ground surface. This has caused cracks in many of the houses in the area.
Figure 4c shows a photo of an abandoned house that has suffered differential foundation movement due to the ground settlements that have been confirmed through InSAR monitoring of the area, as shown in
Figure 4a.
5.3. Chandmari Landslide
The Chandmari area, in the eastern part of Gangtok, has been prone to landslides since the 1960s [
2]. In June 1997, during the monsoon period following a heavy rain of about 200 mm in 5 h, a major landslide occurred in the area. The landslide material included soil and rock debris that were released from about 2100 masl to 1900 masl, killing eight people [
2]. Geotechnical investigations carried out on the ground revealed that much of the topsoil in the area consisted of medium-grained sandy soil mixed with boulders and weathered mica gneiss. Boreholes drilled in the area indicated that the depth of the bedrock was about 20 m deep and contained quartz mica schist that was highly weathered on the top and fresh at the bottom. In July 2007, during which 662 mm of rainfall occurred, another landslide occurred in the area, in which one house was damaged and 25 others were evacuated with no loss of life reported.
The gathered data from InSAR show that in some areas of Chandmari, the rate of typical movements ranges from about 3–6 cm/year, with a maximum displacement at some points of about 10 cm/year in the slope direction over five years from 2015–2021 (
Figure 5a). The Chandmari area is sliding towards the southeast parallel to the slope. The displacements along the profile line drawn at Chandmari show both the magnitude and the direction of movements on the ground surface (
Figure 5b). The predominant direction of movement is assumed to be parallel to the slope, towards the southwest, where there is an abrupt change in the profile of the slope at a distance of 225 m (see
Figure 5b). The movement is parallel to the ground surface.
These results can be better understood by evaluating the geotechnical properties of the soil which were investigated. It was revealed that the tested soil samples did not possess abnormally low shear strengths. Total shear-strength values of cohesion (c) and angle of shearing resistance (φ) varied from 6 to 31 kPa and from 15.5° to 31.5°, respectively. The effective-stress cohesion varied from 0 to 23 kPa, and the values of effective-stress of shearing resistance varied from 27.3° to 34.4°. However, in the field, in addition to soil saturation, there always exists the possibility of subsurface flow that may tend to concentrate at shallow depths, especially after intense rainfall. Shallow sub-surface flows are known to cause local slope failures. Having stated this, one cannot rule out the possibility of deep subsurface flow because a large area around Chandmari is undergoing downslope creep, as evident from the InSAR data. Recent field investigations revealed that though the area is densely populated, a plantation program was carried out in an attempt to remove large amounts of water from the soil in order to stabilise the slope. It is not yet clear how useful this will be in light of the fact that there is still no proper drainage of water from various households. Therefore, future monitoring of the slope through InSAR will be important, which the authors plan to continue in the foreseeable future.
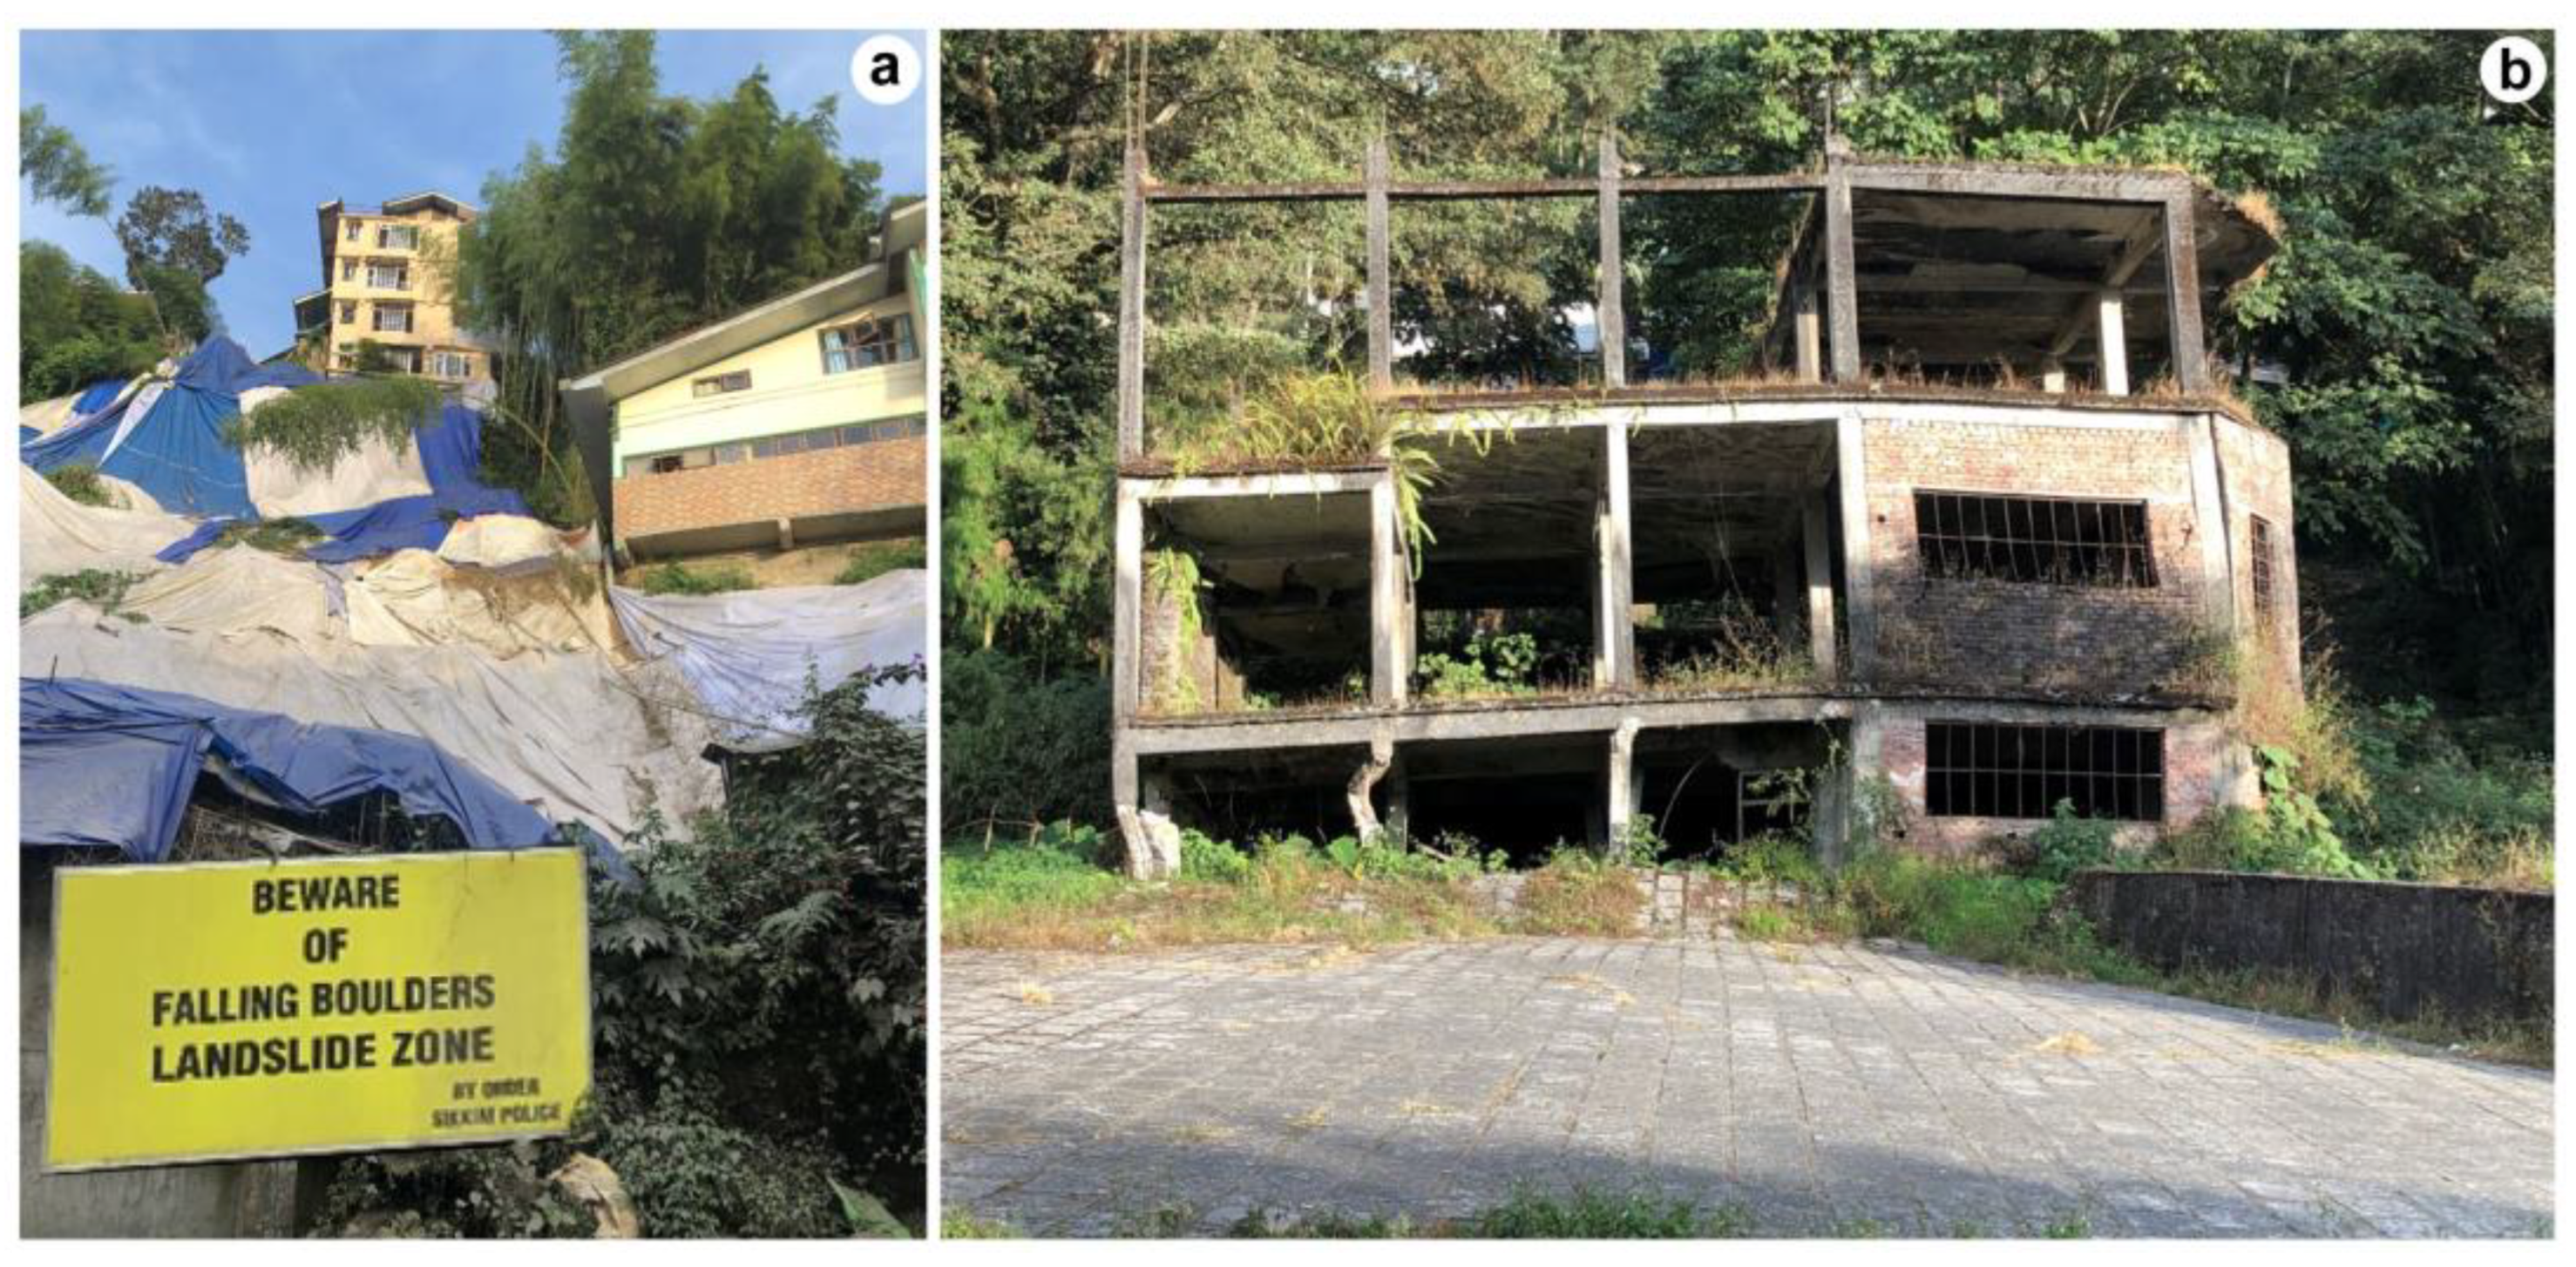
5.4. Upper and Lower Sichey Landslides
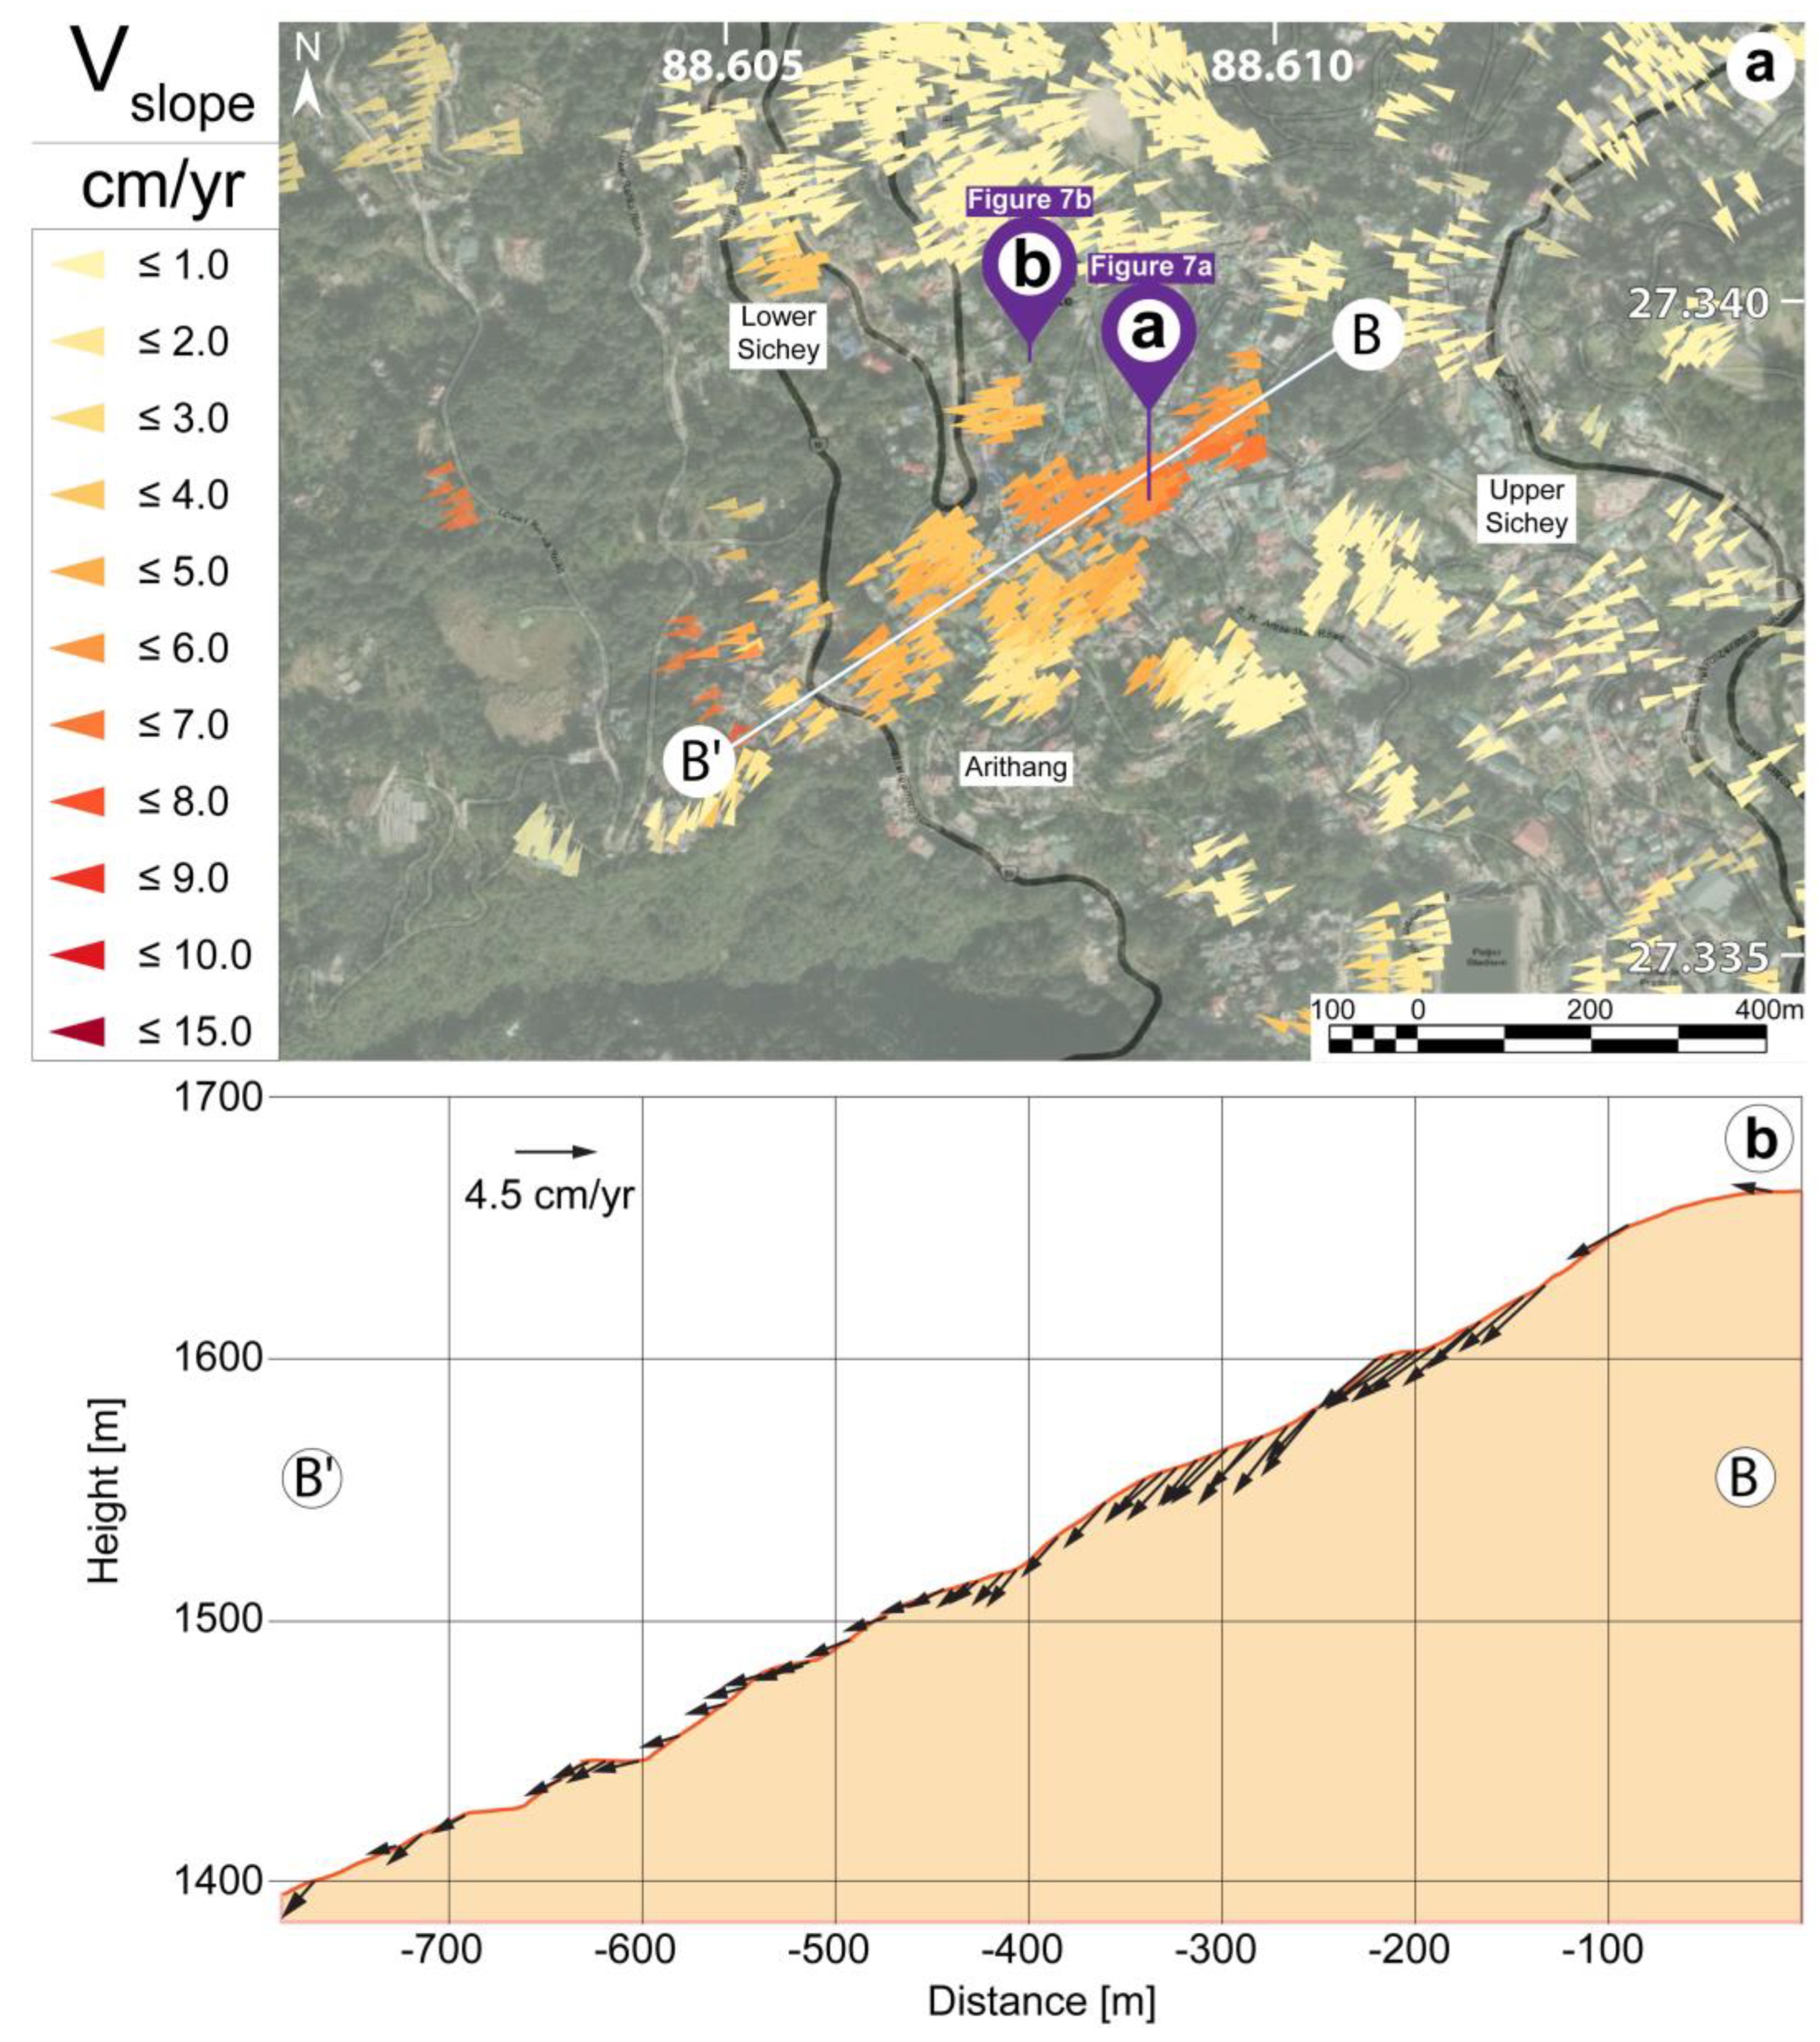
The neighbourhoods of Upper and Lower Sichey are located on the southwest-facing slope in Gangtok (see
Figure 3 for location). The gathered data from InSAR show that the rate of movement in the area is about 5–7 cm/year (
Figure 6a). During field investigations, it was observed that the rock consisted of mica schist that was highly weathered in the exposed ground surface. Several unstable areas where residential and commercial buildings were constructed could be identified on the ground.
Figure 7a shows an area that has suffered significant movement where a residential building had collapsed, and the area was covered with plastic sheets to hinder further erosion and penetration of water into the ground. Schmidt hammer testing on the rocks has indicated that the rocks possess a strength of less than 20 MPa, indicating weak rock conditions. It is highly likely that this strength decreases significantly with the increase in water content. A previous study [
36] performed mechanical characterisation of weathered schists. It showed that both the unconfined compressive strength and the shear strength of the discontinuities decrease significantly as the samples are wetted. Their test results showed that the mechanical strength of the rock reduces to less than 50%, while the shear strength reduces by about 25% when the samples are completely wetted. This presumably explains the low bearing capacity of the ground, especially during the monsoon season when the ground is saturated, causing instabilities in the structures. In addition, if the fractures/discontinuities in weathered schists are unfavourably exposed on the ground surface, then a tendency to slide exists along road cuts and excavation works. The interpreted displacements along the topographic line drawn in
Figure 6a towards the southwest are shown in
Figure 6b, which indicate displacements in the range of about 4–6 cm/year. It may be seen from this figure that the predominant movement direction (displacement vectors) is parallel to the surface of the ground.
Another area that has suffered extensive damage due to relative displacements is Lower Sichey, where the construction of a Tibetan school was abandoned. The differential settlements and the buckling of the foundation pillars of the school can be easily seen in
Figure 7b. During the site visit, the area encompassing the foundation pillars was found to be completely saturated. It seems that water had found its way to the surface here from Upper Sichey. This may presumably have reduced the bearing capacity of the ground, as discussed earlier. Although several causal explanations have been suggested for the extensive damage, including upheaving of the foundation due to the presence of swelling clay, it is believed that this southwest-facing slope is continuously creeping at a rate of up to 7 cm/yr, as indicated by the InSAR measurements in
Figure 6a.
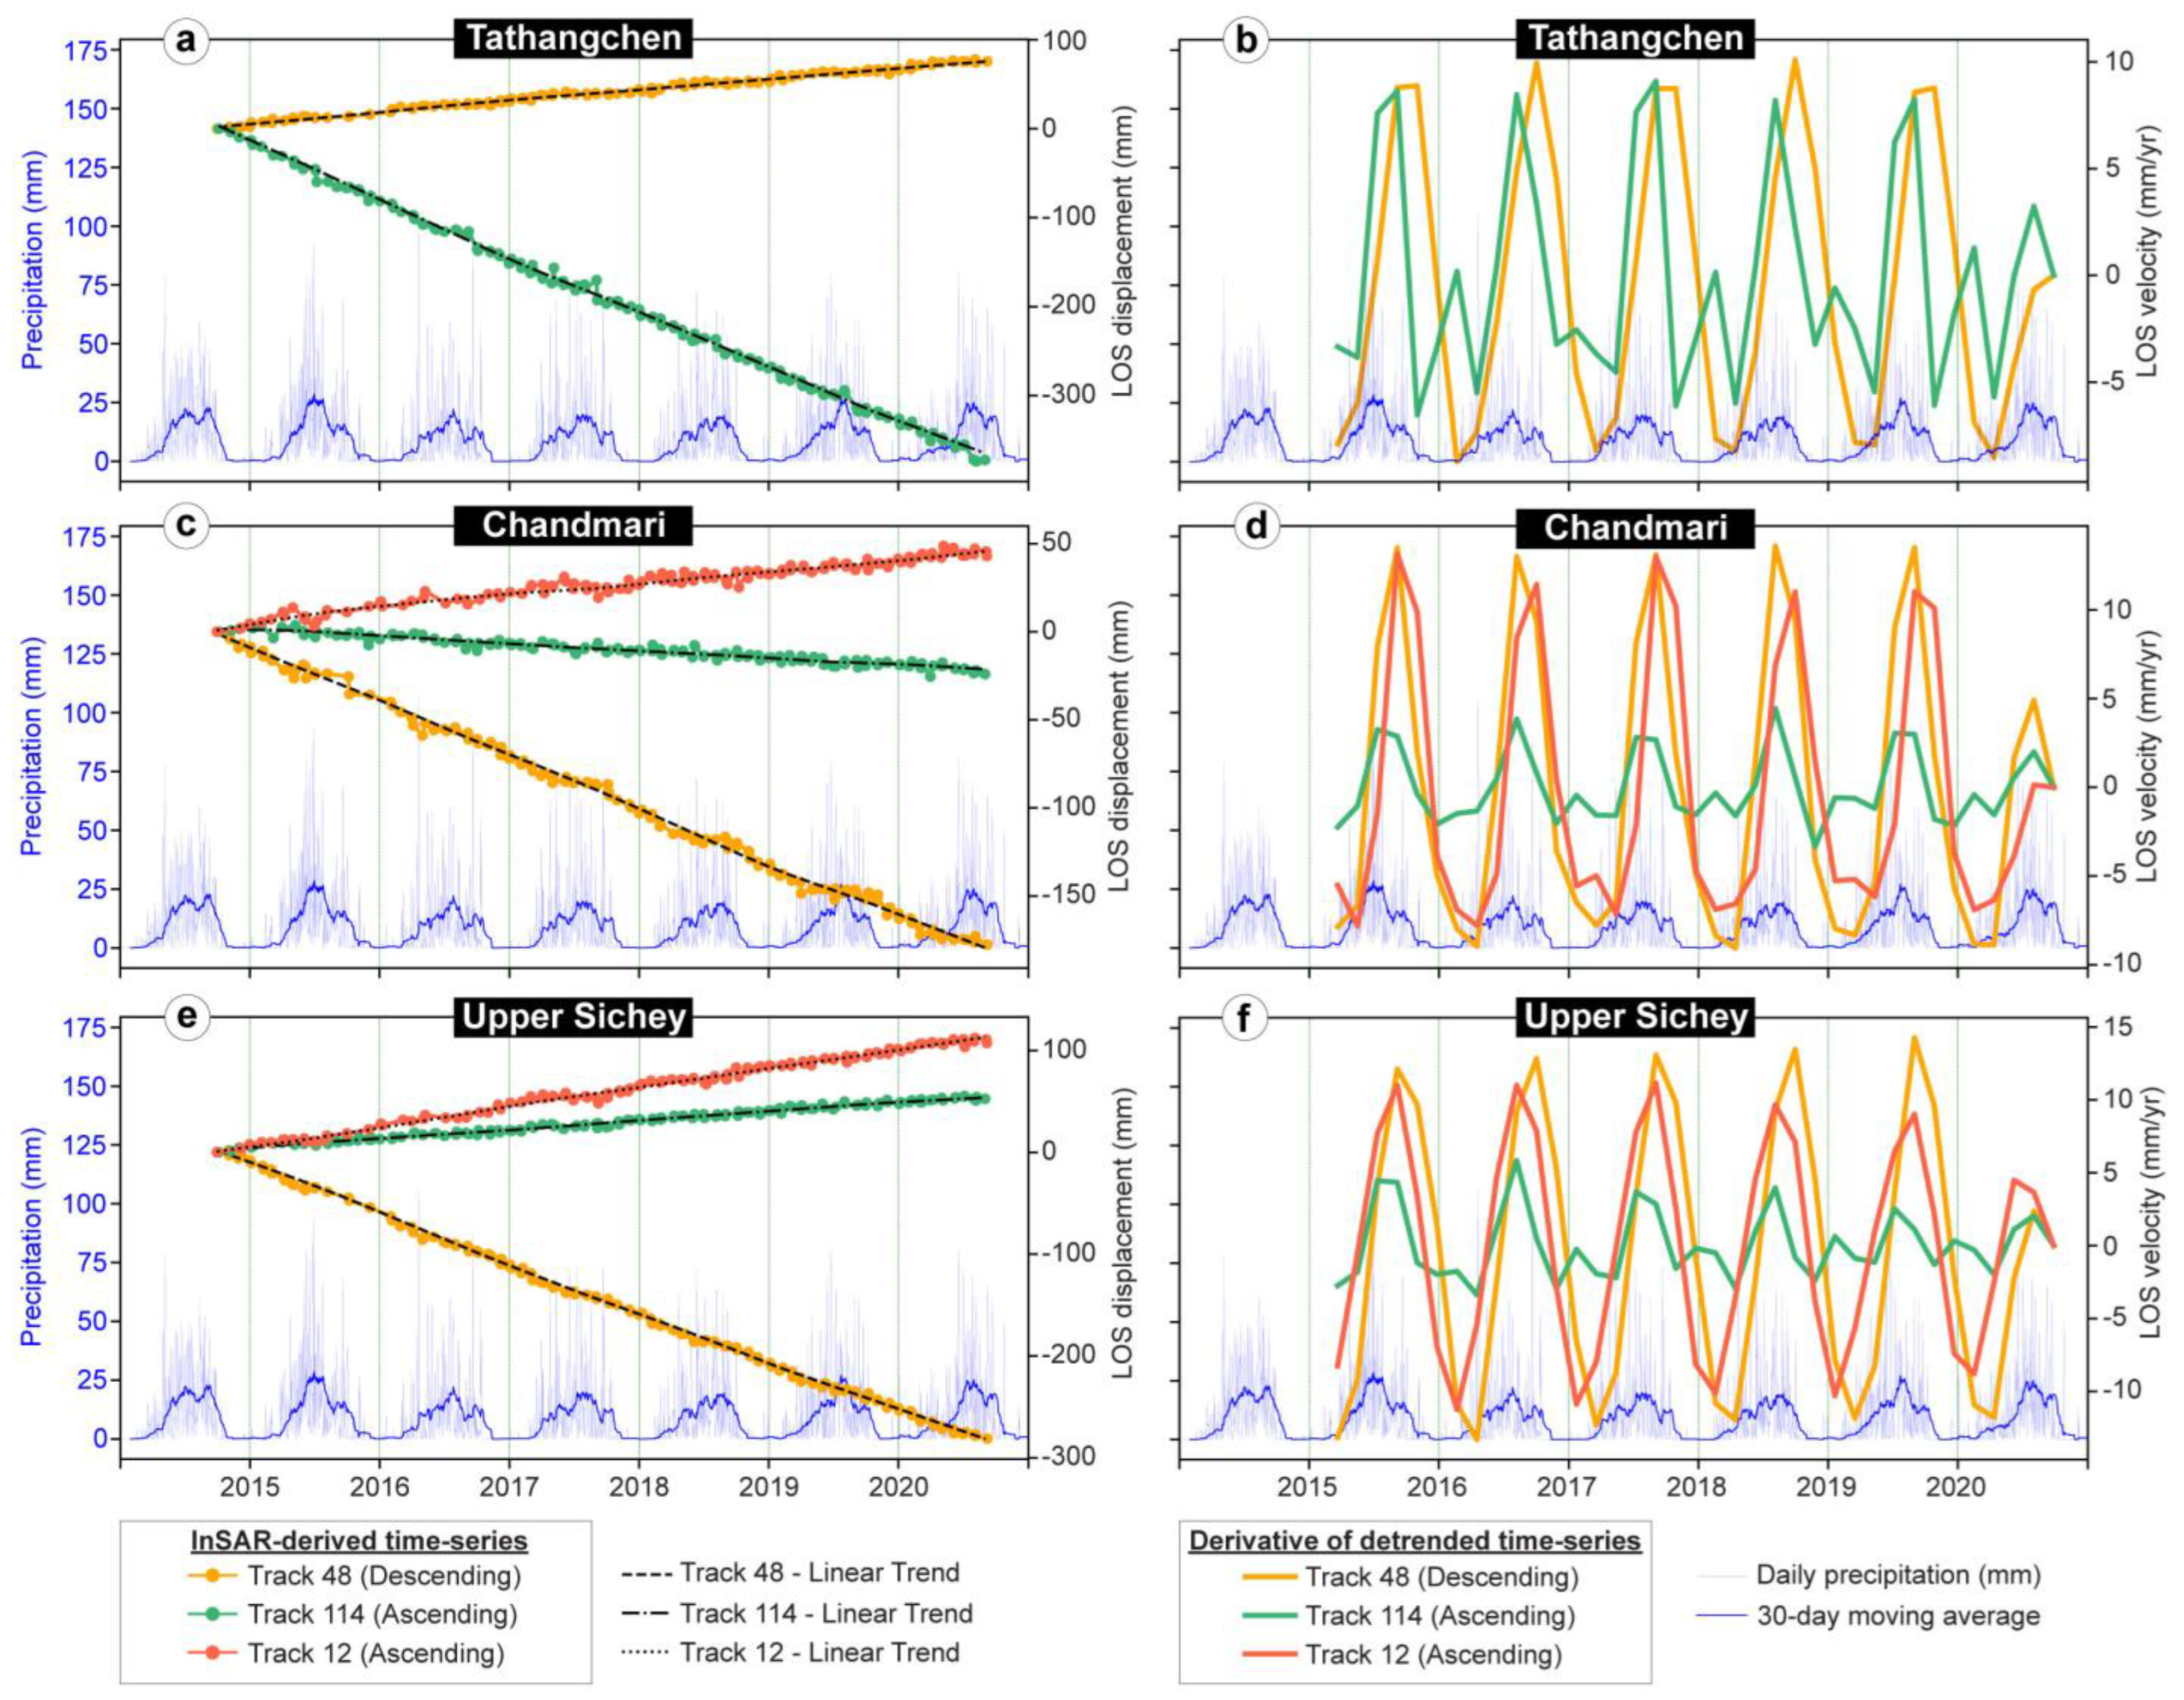
6. Correlation of Seasonal Precipitation and Landslide Motion
The triggering of rainfall-induced landslides is associated with the rainfall infiltration process into the fractured and swelling soil mantle that contributes to the weakening of the soil strength as a result of pore pressure buildup [
37,
38,
39]. The rainfall intensity, duration, and frequency of occurrence, as well as various precipitation conditions in the previous years, can affect the magnitude and timing of seasonal landslide movement [
40].
To identify the underlying forces driving landslide motion and the potential impact of the precipitation, we investigate the correlation between the temporal variation of deformation and rainfall. The nearest rainfall monitoring gauge in Gangtok records total rainfall daily. The data were obtained from the Indian Meteorological Department. We first derived the temporal evolution of the average LOS displacement component for a group of 25 measurement points obtained from time series analysis from both ascending and descending geometries for Tathangchen, Chandmari, and Upper Sichey landslides. Displacement time series show an overall linear downslope displacement with little seasonal variation (See
Figure 8a,c,e). We then removed the linear component (detrended) from the time series. The LOS velocity was then calculated from the first derivative of the smoothed seasonal component. The average seasonal displacement rates are cyclic with a period of one year. The maximum displacement rates occur in August and September, when the precipitation rate reaches its maximum seasonal level. This suggests that the landslide motion is sensitive to rainfall pattern as rainfall modulates pore pressure that drives accelerated motion.
7. Discussion and Conclusions
It is evident that the Himalayan State of Sikkim is prone to both earthquakes and rainfall-triggered landslides. The capital city of Gangtok is especially vulnerable as its unstable slopes are densely populated. The region has experienced more than 18 earthquakes of magnitude 5.0 or greater in the past 35 years, causing devastating damage to lives and properties. Earthquakes in this region are broadly associated with strain accumulation associated with the northward tectonic movement of the Indian Plate and its subsequent abrupt release. This abrupt release of energy is known to cause ruptures in the ground surface, where movements can continue over a period of time due to the percolation of water, as observed in the Dzongu landslide that occurred in 2016. Four great earthquakes of magnitude 8.0 and above have occurred in Sikkim. In addition, during the monsoon period, rainfall-induced landslides are known to cause havoc in the region.
The Sikkim group of rocks, comprising mainly schists and phyllites in the capital Gangtok, are generally weathered and foliated with low unconfined compressive strength. When the foliation surfaces become saturated, the shear strength along the discontinuities decreases. This causes the rock mass to lose its strength and display movements in the form of sliding and creep over a period of time.
In this paper, the rates of movement in some critical areas of Gangtok have been quantified by InSAR. Field investigations on the ground confirm the ongoing displacements observed through InSAR. In some areas, numerous buildings have been damaged and some abandoned due to the differential displacements in the ground. Displacement velocity is clearly influenced by precipitation. The key mitigation strategy in the highly populated areas would be to divert and drain the surface water, inhibiting the percolation of water below the ground. Further developmental activities comprising residential and commercial constructions should be limited on the unstable slopes where ground movements have been observed through InSAR. In addition, planting trees, including species such as eucalyptus, which can extract large quantities of water from the soil, can also assist in stabilising slopes.
Utilising the PSI technique to identify unstable regions in large areas was found to be a cost-effective method, as long as there were enough PS present. The lack of PS points in areas with unfavourable slope angles is likely due to the inability of the satellite sensor to measure deformation in these areas due to shadow and layover effects, as well as coherence loss due to intense vegetation cover surrounding the study area. However, the lack of PS points within the active landslide zone may be due to the acceleration of the landslide, leading to a lack of coherence
Along the major highway connecting the capital city of Gangtok to the lower mainland, landslides frequently disrupt the transport communication route, especially during the monsoon period. Special mitigation strategies, including realignment of the route and proper channelling of water, are required along some of the road stretches to avoid landslides and settlements in the ground.
In future research on the connections between landslide kinematics and precipitation patterns in Gangtok, combining X-band SAR data with ground-based SAR interferometry to generate high-resolution spatial and temporal deformation fields of slope movement and comparing them with the groundwater level changes would be beneficial. The outcomes of this study can be utilised to examine the mechanisms of motion more accurately and further clarify potential geohazards and environmental interactions.
Author Contributions
Conceptualisation, R.B., G.A. and J.D.; formal analysis, R.B., G.A. and J.D.; investigation, R.B., G.A. and J.D.; data curation, R.B., G.A. and J.D.; writing—original draft preparation, R.B., G.A. and J.D.; writing—review and editing, R.B., G.A. and J.D.; visualisation, G.A.; supervision, R.B. and J.D.; project administration, R.B. and J.D. All authors have read and agreed to the published version of the manuscript.
Funding
This research was funded by the Norwegian Research Council and the Indian Ministry of Earth Sciences (NFR no. 248774). The APC was funded by NGU.
Data Availability Statement
Not applicable.
Acknowledgments
The authors are grateful to the Norwegian Research Council and the Indian Ministry of Earth Sciences for sponsoring this project for studying landslides in Sikkim. The Indo-Norwegian investigation team, including Vikram Gupta, Reginald Hermanns, Aniruddha Sengupta, Odd Andre Morken, and Ivanna Penna, are thanked for their support and cooperation.
Conflicts of Interest
The authors declare no conflict of interest.
References
- Basnett, S.; Kulkarni, A.V.; Bolch, T. The influence of debris covers and glacial lakes on the recession of glaciers in Sikkim Himalaya, India. J. Glaciol. 2013, 59, 1035–1046. [Google Scholar] [CrossRef]
- Bhasin, R.; Grimstad, E.; Larsen, J.O.; Dhawan, A.K.; Singh, R.; Verma, S.K.; Venkatachalam, K. Landslide hazards and mitigation measures at Gangtok, Sikkim Himalaya. Eng. Geol. 2002, 64, 351–368. [Google Scholar] [CrossRef]
- SSDMA. Multi-Hazard Risk Vulnerability Assessment. Gangtok: SSDMA. 2012. Available online: https://ndmindia.mha.gov.in/images/pdf/MultiHazardRiskVulnerabilityAssessment.pdf (accessed on 12 June 2022).
- Martha, T.R.; Govindharaj, K.B.; Kumar, K.V. Damage and geological assessment of the September 18 2011 Mw 6.9 earthquake in Sikkim, India using very high-resolution satellite data. Geosci. Front. 2015, 6, 793–805. [Google Scholar] [CrossRef]
- Kaushik, H.B.; Dasgupta, K.; Sahoo, S.R.; Kharel, G. Reconnaissance Report Sikkim Earthquake of February 14 2006; National Information Center of Earthquake Engineering, Indian Institute of Technology: Kanpur, India, 2006. [Google Scholar]
- Joshi, M. Co-seismic landslides in the Sikkim Himalaya during the 2011 Sikkim Earthquake: Lesson learned from the past and inference for the future. Geol. J. 2022, 57, 5039–5060. [Google Scholar] [CrossRef]
- Crosetto, M.; Monserrat, O.; Cuevas-González, M.; Devanthéry, N.; Crippa, B. Persistent scatterer interferometry: A review. ISPRS J. Photogramm. Remote Sens. 2016, 115, 78–89. [Google Scholar] [CrossRef]
- Lacroix, P.; Handwerger, A.L.; Bièvre, G. Life and death of slow-moving landslides. Nat. Rev. Earth Environ. 2020, 1, 404–419. [Google Scholar] [CrossRef]
- Aslan, G.; De Michele, M.; Raucoules, D.; Bernardie, S.; Cakir, Z. Transient motion of the largest landslide on Earth, modulated by hydrological forces. Sci. Rep. 2021, 11, 10407. [Google Scholar] [CrossRef] [PubMed]
- Bekaert, D.P.; Handwerger, A.L.; Agram, P.; Kirschbaum, D.B. InSAR-based detection method for mapping and monitoring slow-moving landslides in remote regions with steep and mountainous terrain: An application to Nepal. Remote Sens. Environ. 2020, 249, 111983. [Google Scholar] [CrossRef]
- Eriksen, H.Ø.; Bergh, S.G.; Larsen, Y.; Skrede, I.; Kristensen, L.; Lauknes, T.R. Relating 3D surface displacement from satellite-and ground-based InSAR to structures and geomorphology of the Jettan rockslide, northern Norway. Nor. J. Geol. 2017, 97, 283–303. [Google Scholar] [CrossRef]
- Dehls, J.F.; Lauknes, T.R.; Larsen, Y.; Hermanns, R.L. Operational Use of InSAR Corner Reflectors (CR) for Landslide Hazard and Risk Assessment in Norway Using Sentinel-1 and Radarsat-2. In Proceedings of the AGU Fall Meeting Abstracts, Washinton, DC, USA, 10–14 December 2018; Volume 2018, p. NH13A–07. [Google Scholar]
- Catani, F.; Farina, P.; Moretti, S.; Nico, G.; Strozzi, T. On the application of SAR interferometry to geomorphological studies: Estimation of landform attributes and mass movements. Geomorphology 2005, 66, 119–131. [Google Scholar] [CrossRef]
- Raucoules, D.; de Michele, M.; Aunay, B. Landslide displacement mapping based on ALOS-2/PALSAR-2 data using image correlation techniques and SAR interferometry: Application to the Hell-Bourg landslide (Salazie circle, La Réunion Island). Geocarto Int. 2020, 35, 113–127. [Google Scholar] [CrossRef]
- Herrera, G.; Notti, D.; García-Davalillo, J.C.; Mora, O.; Cooksley, G.; Sánchez, M.; Crosetto, M. Analysis with C-and X-band satellite SAR data of the Portalet landslide area. Landslides 2011, 8, 195–206. [Google Scholar] [CrossRef]
- Aslan, G.; Foumelis, M.; Raucoules, D.; De Michele, M.; Bernardie, S.; Cakir, Z. Landslide Mapping and Monitoring Using Persistent Scatterer Interferometry (PSI) Technique in the French Alps. Remote Sens. 2020, 12, 1305. [Google Scholar] [CrossRef]
- Vick, L.M.; Böhme, M.; Rouyet, L.; Bergh, S.G.; Corner, G.D.; Lauknes, T.R. Structurally controlled rock slope deformation in northern Norway. Landslides 2020, 17, 1745–1776. [Google Scholar] [CrossRef]
- Tessari, G.; Kashyap, D.; Holecz, F. Landslide Monitoring in the Main Municipalities of Sikkim Himalaya, India, Through Sentinel-1 SAR Data. In Understanding and Reducing Landslide Disaster Risk. WLF 2020. ICL Contribution to Landslide Disaster Risk Reduction; Casagli, N., Tofani, V., Sassa, K., Bobrowsky, P.T., Takara, K., Eds.; Springer: Cham, Switzerland, 2020. [Google Scholar] [CrossRef]
- Singh, S.; Raju, A.; Banerjee, S. Detecting slow-moving landslides in parts of Darjeeling–Sikkim Himalaya, NE India: Quantitative constraints from PSInSAR and its relation to the structural discontinuities. Landslides 2022, 19, 2347–2365. [Google Scholar] [CrossRef]
- Raup, B.; Racoviteanu, A.; Khalsa, S.J.S.; Helm, C.; Armstrong, R.; Arnaud, Y. The GLIMS geospatial glacier database: A new tool for studying glacier change. Glob. Planet. Chang. 2007, 56, 101–110. [Google Scholar] [CrossRef]
- Kaul, M.K. Inventory of the Himalayan Glaciers; Special Publication of the Geological Survey of India: Kolkata, India, 1999. [Google Scholar]
- Raina, V.K.; Srivastava, B.S. Tectonic evolution of the Sikkim-Himalaya. In Contemporary Geoscientific Research in Himalaya; Bishen Singh Mahendra Pal Singh: Dehradun, India, 1981; pp. 109–115. [Google Scholar]
- Catlos, E.J.; Dubey, C.S.; Etzel, T.M. Imbrication and Erosional Tectonics Recorded by Garnets in the Sikkim Himalayas. Geosciences 2022, 12, 146. [Google Scholar] [CrossRef]
- Ghosh, S.; Chakraborty, I.; Bhattacharya, D.; Bora, A.; Kumar, A. Generating field-based inventory of earthquake-induced landslides in the Himalayas-an aftermath of the September 18 2011 Sikkim Earthquake. Indian J. Geosci. 2012, 66, 27–38. [Google Scholar]
- Kumar, P.; Sharma, M.C.; Saini, R.; Singh, G.K. Climatic variability at Gangtok and Tadong weather observatories in Sikkim, India, during 1961–2017. Sci. Rep. 2020, 10, 15177. [Google Scholar] [CrossRef]
- Morken, O.A.; Hermanns, R.L.; Penna, I.; Dehls, J.F.; Bhasin, R. The Dzongu landslide dam: High sedimentation rate contributing to dam stability. In Proceedings of the ISRM International Symposium-EUROCK 2020, Trondheim, Norway, 14–19 June 2020. [Google Scholar]
- IS 1893; Indian Standard Criteria for Earthquake Resistant Design of Structures, Part 1: General Provisions and Buildings. Bureau of Indian Standards: New Delhi, India, 2002.
- Sharma, M.L.; Maheshwari, B.K.; Singh, Y.; Sinvhal, A. Damage pattern during Sikkim, India earthquake of September 18, 2011. In Proceedings of the 15th World Conference on Earthquake Engineering, Lisbon, Portugal, 24–28 September 2012; Volume 28. [Google Scholar]
- Dehls, J.F.; Larsen, Y.; Marinkovic, P.; Lauknes, T.R.; Stødle, D.; Moldestad, D.A. InSAR.no: A national InSAR deformation mapping/monitoring service in Norway—From concept to operations. In Proceedings of the IGARSS 2019-2019 IEEE International Geoscience and Remote Sensing Symposium, Yokohama, Japan, 28 July–2 August 2019; pp. 5461–5464. [Google Scholar] [CrossRef]
- Prats-Iraola, P.; Scheiber, R.; Marotti, L.; Wollstadt, S.; Reigber, A. TOPS interferometry with TerraSAR-X. IEEE Trans. Geosci. Remote Sens. 2012, 50, 3179–3188. [Google Scholar] [CrossRef]
- Hu, J.; Li, Z.W.; Ding, X.L.; Zhu, J.J.; Zhang, L.; Sun, Q. Resolving three-dimensional surface displacements from InSAR measurements: A review. Earth Sci. Rev. 2014, 133, 1–17. [Google Scholar] [CrossRef]
- Eriksen, H.Ø.; Lauknes, T.R.; Larsen, Y.; Corner, G.D.; Bergh, S.G.; Dehls, J.F. Visualizing and interpreting surface displacement patterns on unstable slopes using multi-geometry satellite SAR interferometry (2D InSAR). Remote Sens. Environ. 2017, 191, 297–312. [Google Scholar] [CrossRef]
- Lauknes, T.R.; Rouyet, L.; Larsen, Y.; Grahn, J.; Böhme, M.; Dehls, J. Multi-Geometry Sentinel-1 InSAR for Characterising Ground Deformation in Norway. In Proceedings of the AGU Fall Meeting Abstracts, San Francisco, CA, USA, 9–13 December 2019; p. 23A-07. [Google Scholar]
- Grahn, J.; Lauknes, T.R.; Larsen, Y.; Rouyet, L.; Dehls, J.F.; Böhme, M.; Kristensen, L. Rockslide motion in 3 dimensions from Sentinel-1: How to deal with the blind dimension? In Proceedings of the ESA Fringe 2021, Online, 31 May–4 June 2021. [Google Scholar]
- Barton, N.; Choubey, V. The shear strength of rock joints in theory and practice. Rock Mech. 1977, 10, 1–54. [Google Scholar] [CrossRef]
- Le Cor, T.; Rangeard, D.; Merrien-Soukatchoff, V.; Jérôme, S. Mechanical Characterization of Weathered Schists. In Proceedings of the IAEG XII, Engineering Geology for Society and Territory, Torino, Italy, 15–19 September 2014; pp. 809–812. [Google Scholar]
- Iverson, R.M. Landslide triggering by rain infiltration. Water Resour. Res. 2000, 36, 1897–1910. [Google Scholar] [CrossRef]
- Lehmann, P.; Or, D. Hydromechanical triggering of landslides: From progressive local failures to mass release. Water Resour. Res. 2012, 48, 3535–3558. [Google Scholar] [CrossRef]
- Bogaard, T.A.; Greco, R. Landslide hydrology: From hydrology to pore pressure. Wiley Interdisciplinary Reviews. Water 2015, 3, 439–459. [Google Scholar] [CrossRef]
- Hu, X.; Bürgmann, R.; Lu, Z.; Handwerger, A.L.; Wang, T.; Miao, R. Mobility, thickness, and hydraulic diffusivity of the slow-moving Monroe landslide in California revealed by L-band satellite radar interferometry. J. Geophys. Res. Solid Earth 2019, 124, 7504–7518. [Google Scholar] [CrossRef]
| Disclaimer/Publisher’s Note: The statements, opinions and data contained in all publications are solely those of the individual author(s) and contributor(s) and not of MDPI and/or the editor(s). MDPI and/or the editor(s) disclaim responsibility for any injury to people or property resulting from any ideas, methods, instructions or products referred to in the content. |
© 2023 by the authors. Licensee MDPI, Basel, Switzerland. This article is an open access article distributed under the terms and conditions of the Creative Commons Attribution (CC BY) license (https://creativecommons.org/licenses/by/4.0/).


