Article

Revisiting Atmospheric Oxidation Kinetics of Nitrogen Oxides: The Use of Low-Cost Electrochemical Sensors to Measure Reaction Kinetics

1
Illawarra Coatings, 19 Technology Drive, Appin, NSW 2560, Australia
2
Faculty of Science and Engineering, Southern Cross University, 1 Military Road, Lismore, NSW 2480, Australia
*
Author to whom correspondence should be addressed.
Reactions 2024, 5(4), 789-799; https://doi.org/10.3390/reactions5040040
Submission received: 4 September 2024 / Revised: 2 October 2024 / Accepted: 9 October 2024 / Published: 15 October 2024

Abstract

:
The high cost of equipment is a significant entry barrier to research for smaller organisations in developing solutions to air pollution problems. Low-cost electrochemical sensors have shown sensitivity at parts-per-billion by volume (ppbV) mixing ratios but are subject to variations due to changing environmental conditions, particularly temperature. We have previously demonstrated that under isothermal/isohume conditions such as those found in kinetic studies, very stable electrochemical responses occur. In this paper, we demonstrate the utility of a low-cost IoT-based sensor system that employs four-electrode electrochemical sensors under isothermal/isohume conditions for studying the kinetics of the atmospheric oxidation of nitrogen oxides. The results suggest that reproducible results for NO and NO2 kinetics can be achieved. The method produced oxidation rates of 7.95 × 10³ L2 mol−2 s−1 (±1.3%), for NO and 7.99 × 10⁻⁴ s−1 (±2.1%) for NO2. This study suggests that the oxidation kinetics of nitrogen oxides can be assessed with low-cost sensors, which can support a wide range of industrial applications, such as designing biocatalytic coatings for air pollution remediation.

1. Introduction

The thermal oxidation of nitric oxide was first described in 1918 by Bodenstein and Wackenheim [1]. Rate constants for this reaction measured by some 22 authors under “static and nominally water-free systems” have previously been summarised by Tsukahara et al. [2], but these systems are not representative of conditions found in an ambient atmospheric environment where, amongst other species, water vapour is present. The Tsukahara summary reported a reaction rate constant in the range of 1.6 × 10³–7.2 × 10³ L2 mol−2 s−1. Nitric oxide concentration varied in those studies from 1.0 × 10⁻² mol L−1 (343,000 ppmV) down to 8.2 × 10⁻⁸ mol L−1 (2 ppmV). Several of the authors mentioned by Tsukahara also examined the influence of humidity on the reaction rate, with most authors finding no influence on the reaction rate under conditions of up to 90% relative humidity [1,3,4,5]. Treacy and Daniels [6], however, reported an increase in the reaction rate in the presence of water vapour.
England [7] examined the kinetics of the nitric oxide oxidation reaction at atmospheric pressure in the presence of water vapour, with the initial water vapour concentration being varied from 1.24 × 10⁻⁴ to 4.96 × 10⁻⁴ mol L−1 at 25 °C, equating to 9.7% to 38.8% relative humidity respectively. A rate constant of 7.3 × 10³ L2 mol−2 s−1 was determined under dry conditions, and the presence of water vapour had no specific catalytic effect in the gas phase. The NO concentrations examined by England were in the range 2.217 × 10⁻⁶ to 8.508 × 10⁻⁶ mol L−1 (50.3–150.9 ppmV). Under these conditions the concentration of water vapour is some two orders of magnitude greater than that of nitric oxide. This disparity in reactant concentrations is more significant when compared to ambient atmospheric concentrations of nitric oxide generated through both natural and anthropogenic processes. In all of these studies, the concentration of nitrogen oxides and/or water vapour does not represent ambient conditions.
Peak daily concentrations of NO and NO2 from an industrial city over a four-year period (Wollongong: 34.4248° S, 150.8931° E) [8]. Figure 1 is in the vicinity of 225 ppbV (9.2 × 10⁻⁹ mol L−1) for NO, whilst those of NO2 are typically lower in the vicinity of 40 ppbV (1.64 × 10⁻⁹ mol L−1). Atmospheric relative humidity varies due to climatic conditions, but at a temperature of 25 °C and relative humidity of 50%, such as that specified for reference conditions in a paint/coatings test laboratory [9], water vapour concentration equates to 6.4 × 10⁻⁴ mol L−1. Under these specific conditions, water vapour concentration is now four orders of magnitude greater than atmospheric NO or NO2 concentrations.
Since the initial investigations by Bodenstein and Wackenheim [1], various analytical methods have been employed with present-day air quality monitoring stations employing chemiluminescence techniques, which are considered the standard for the measurement of nitrogen oxides for air quality monitoring [10,11,12,13]. Chemiluminescence detectors represent a significant capital investment not only in the actual equipment but also in the supply of ozone for oxidation, maintenance, and suitably trained personnel.
In recent years, the sensitivity of low-cost electrochemical sensors (LCESs) has improved to a point where accuracy at parts per billion by volume (ppbV) levels in the presence of other components of polluted atmospheric air have been achieved [14,15,16], making them suitable for air quality monitoring applications. For example, Meyerhoff et al. [17] found good agreement between a commercially available LCESs and a chemiluminescence detector.
It is well known that electrode responses, particularly those of nitric oxide LCESs, are susceptible to transients due to variations in ambient environmental conditions, in particular, temperature and relative humidity, with significant effort being applied to develop methods to overcome these deficiencies that range from simple post-data corrections to machine learning algorithms [14,15,16,18,19,20,21]. Studies where LCESs have been exposed to highly controlled environmental conditions, i.e., isothermal/isohume conditions within a sealed environmental (reaction) chamber, such as those found in kinetic studies, are beginning to appear in the literature [22,23,24]. We have previously demonstrated that under such isothermal/isohume conditions, very stable electrochemical responses occur. In this study, we assess the use of LCESs under isothermal/isohume conditions to measure the kinetics of the atmospheric oxidation for each nitrogen oxide individually and in isolation to support our work in designing biocatalytic coatings for air pollution remediation related to nitrogen oxides similar to the biocatalytic coatings reported by Estrada et al. for biodegradation of atmospheric VOC’s.

2. Materials and Methods

Instrument-grade air from BOC Gases (Minto, New South Wales, Australia) was used as a source of zero air for purging of the reaction chamber between experiments (Table 1).
NO at a mixing ratio of 60 ppm ± 2% in nitrogen and NO2 at a mixing ratio of 15 ppm ± 2% in nitrogen was obtained from CAC Gas and Instrumentation (Arndell Park, New South Wales, Australia).
The experimental setup using zero air, and NO gas was the same as previously described [24] with the following modification. Four-electrode electrochemical sensors operate in a continuous analysis mode, i.e., they constantly oxidise or reduce the target gas depending on the sensor’s electrochemistry. Were the sensor system to be placed inside the reaction chamber, the continued oxidation or reduction of the target gas by the sensors would deplete the gas concentration at a significantly faster rate than would occur under ambient conditions, thus making the setup unsuitable for kinetic type experiments. To overcome the issue described above, a Teflon hood typically used for sensor calibration is attached to the electrochemical sensors to isolate the LCESs from the chamber environment (Figure 2). The volume of the calibration hood was determined to be 0.011 L, representing 0.14% of chamber volume. At predetermined times, chamber air is pumped through the Teflon hood using a micropump. The outlet of the Teflon hood contains a 2-Position 3-Way Electric Control Solenoid Valve that, when closed, isolates the electrochemical sensors from the bulk chamber environment.
Using this modified system, we first conducted a series of experiments to determine appropriate measurement cycle durations to ensure the gas sample being analysed was representative of the chamber air. Following this, we were then able to measure the reaction kinetics of both NO and NO2 under varying atmospheric conditions, comparing our results to those previously published.

3. Results and Discussion

3.1. Determination of Appropriate Measurement Cycle Durations

Chamber gas can be drawn through the sensor measurement cell at predetermined times for analysis without affecting the bulk chamber composition. Once gas ceases to flow through the measurement cell and across the sensors, oxidation or reduction of the sample within the measurement cell continues until the target gas is depleted.
Figure 3 displays a situation where varying starting concentrations of NO gas were added to the reaction chamber, and then the chamber gas was continually pumped through the measurement cell across the LCES and analysed, demonstrating the ongoing depletion. It was typically found that a minimum of 3 min purging of the measurement cell with chamber gas using the above method was required to ensure that the sample being analysed was representative of the chamber composition. Following purging, we also determined that averaging a 60 s measurement time with a 1 s frequency provided reproducible results. Once gas flow ceased, we found that NO gas was depleted in approximately 10 min, irrespective of the initial concentration.

3.2. Measurement of Reaction Kinetics Using LCESs

Most recently, Skalska et al. [25] conducted kinetic measurements under anhydrous conditions (Figure 4a), which demonstrated that NO2 concentration increases in tandem with NO consumption. In their study, the concentration of NO was in the range 6.611 × 10⁻⁶ to 2.988 × 10⁻⁵ mol L−1 (150–530 ppmV), once again significantly higher than ambient. During our preliminary experiments in a humid environment where NO concentration approximated normal ambient levels, we were unable to detect any appreciable NO2 under the measurement conditions employed (Figure 4b).
Subsequent experiments using the same purge time and measurement intervals as these preliminary experiments, where a stepwise addition of target gas was introduced to the chamber, demonstrated a faster decline in NO2 concentration compared to that of NO under the same conditions (Figure 5). These stepwise addition experiments confirmed that the NO2 sensor was able to detect its target gas at the concentrations and chamber conditions employed (Figure 4) and suggests that any NO2 formed via NO oxidation in our duplication of the Skalska experiment under humid conditions was being consumed by a subsequent reaction at a rate faster than the detection ability of the NO2 sensor under the measurement conditions.
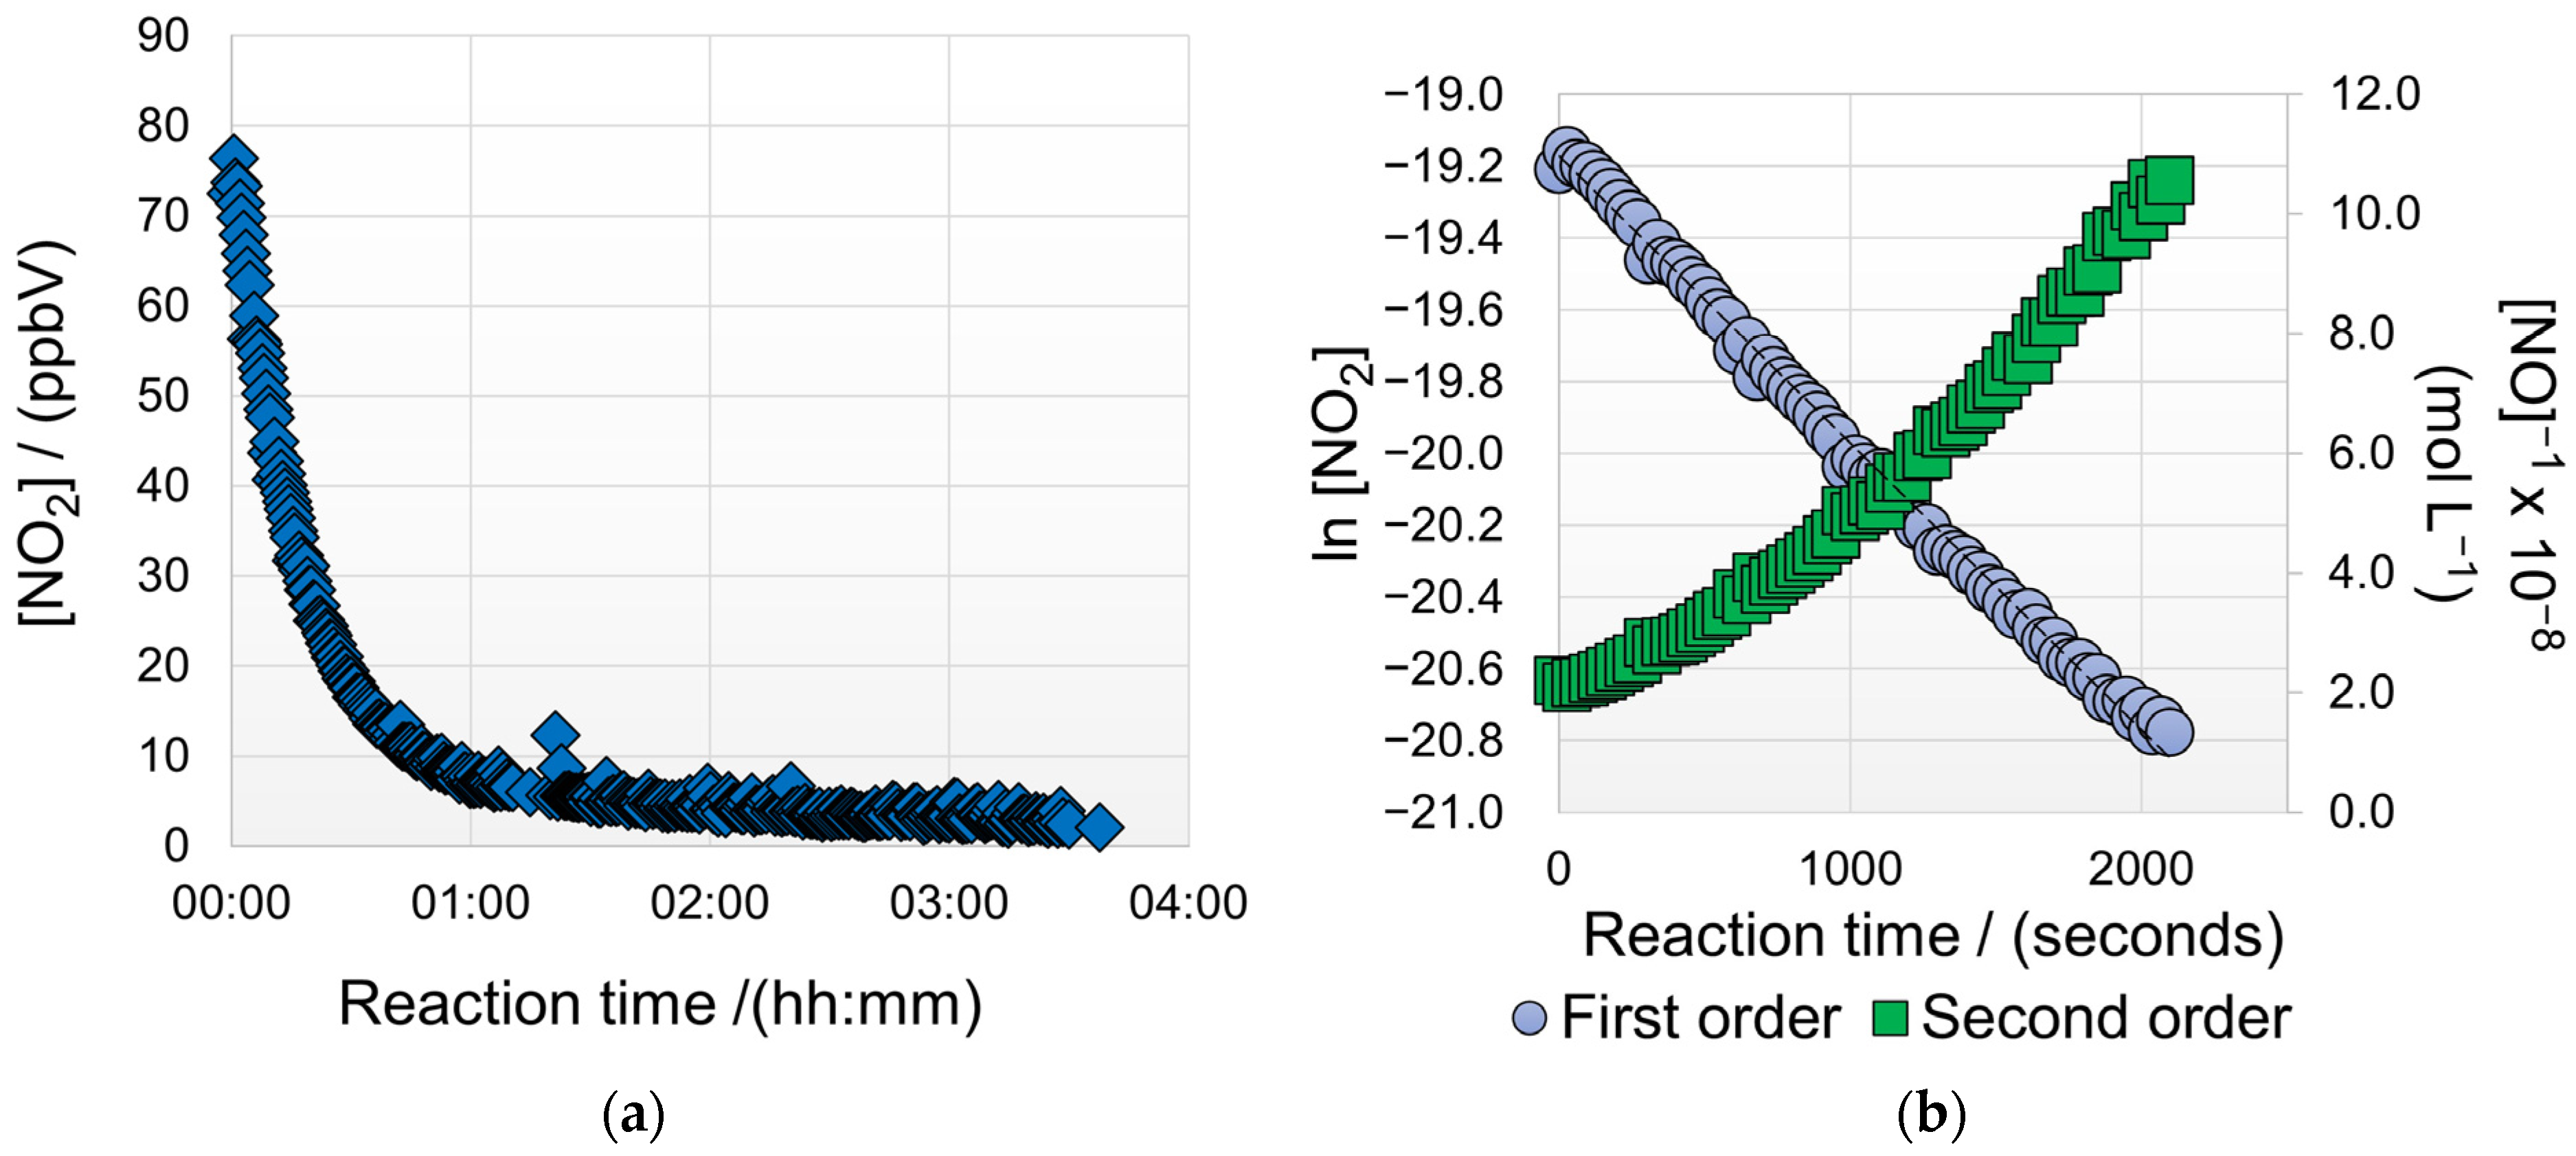
By following the depletion of NO2 at the conclusion of the stepwise experiment displayed in Figure 5, we were able to confirm that the NO2 depletion follows first-order kinetics, confirming previous results published by England et al. [26] (Figure 6a,b). Interpolation of these data allowed a rate constant of 7.99 × 10⁻⁴ s−1 and a half-life of 866 s (14.4 min) to be determined. The half-life of this reaction is significantly faster than that of NO oxidation, explaining the lack of detection of NO2 in the NO oxidation experiments. England proposed that under the conditions studied, three principal reactions were believed to occur, with Equation (3) occurring at low rates. A rate constant of 1.5 × 10⁵ L2 mol−2 s−1 was determined by England for Equation (2), representing a 20-fold increase compared to Equation (1).
2 N O ( g ) + O 2 ( g ) 2 N O 2 ( g )
N O ( g ) + N O 2 ( g ) + H 2 O ( g ) 2 H N O 2 ( g )
3 N O 2 ( g ) + H 2 O ( g ) N O ( g ) + 2 H N O 3 ( g )
The short half-life of the reaction of the NO2 when pulse sampled through the measurement cell could potentially lead to inaccurate results due to the combination of “natural” reactions and sensor-induced depletion. To overcome these potential inaccuracies, a series of experiments where the NO2 LCES was directly exposed to the chamber environment was undertaken to evaluate the efficacy of the NO2 sensor. In these depletion experiments, NO2 concentrations in the range 50–250 ppbV (3.13 × 10⁻⁹ to 1.57 × 10⁻⁸ mol L−1) were employed, at a fixed temperature and relative humidity of 25 °C (298 K) and 50% (6.4 × 10⁻⁴ mol L−1 water vapour) respectively (Figure 7). These values more closely approximate ambient conditions.
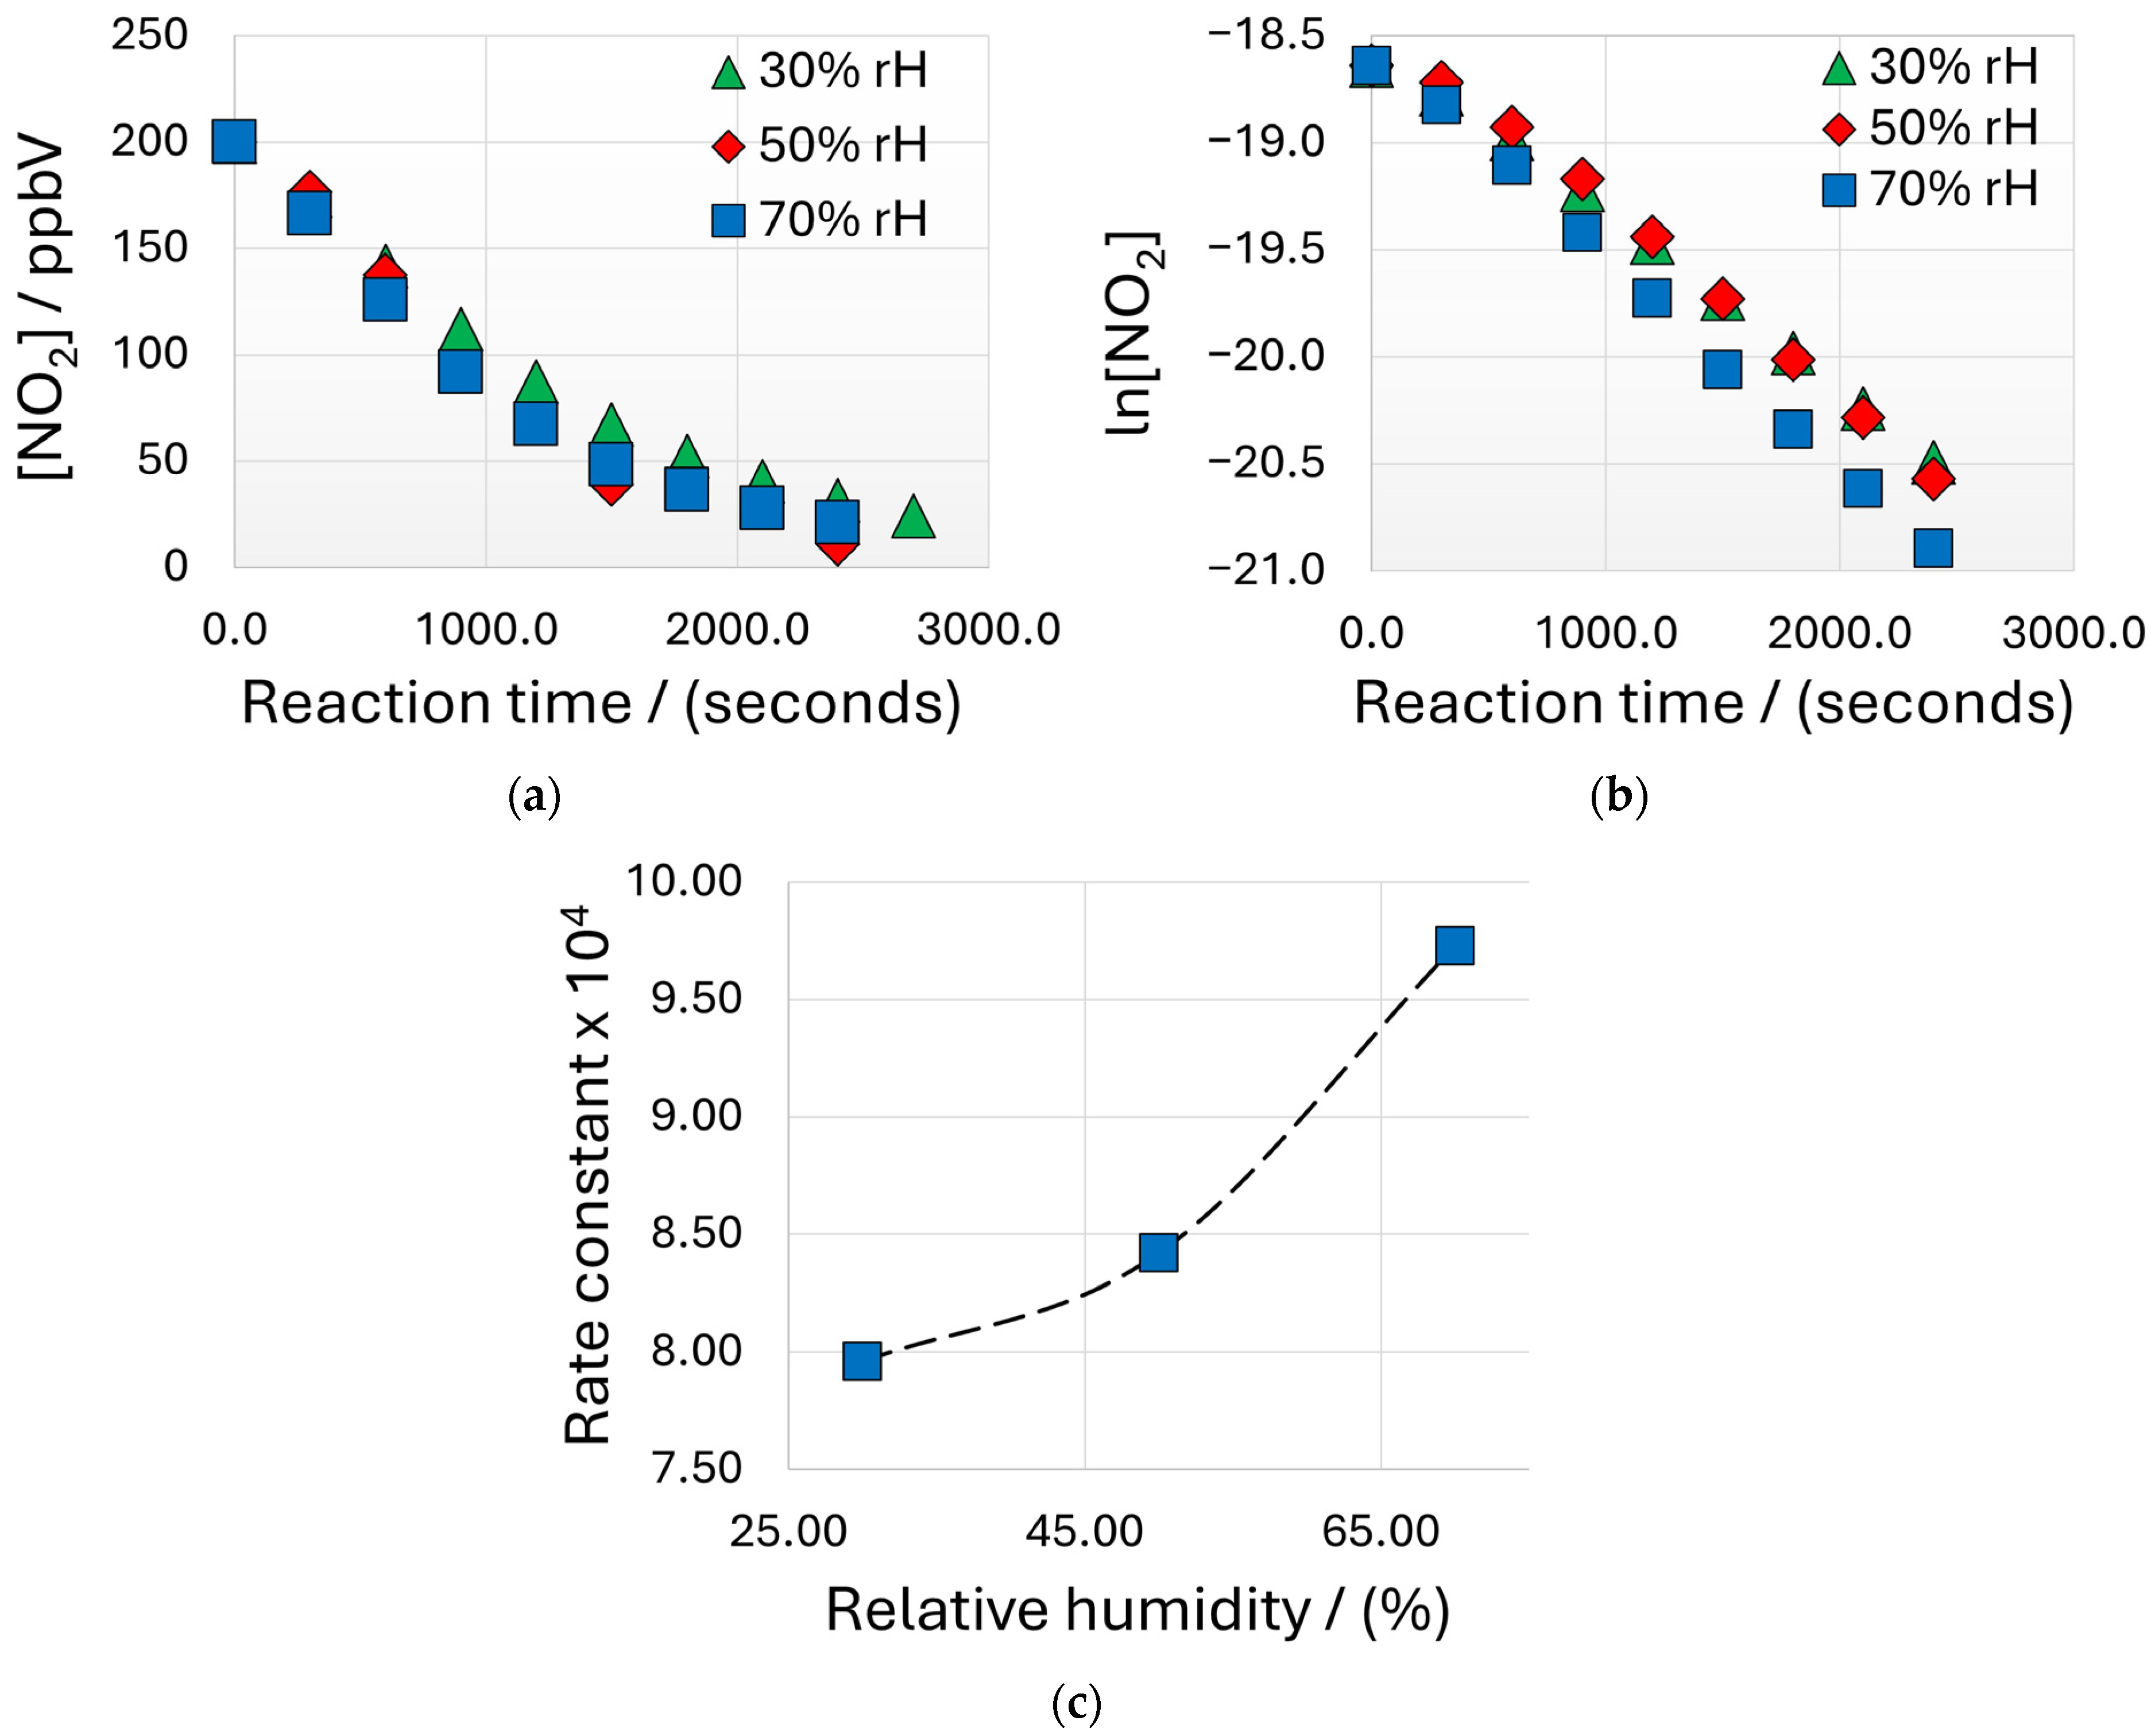
In addition, three experiments depicted in Figure 8 were conducted at 25 °C (298 K) and a fixed NO2 concentration of 200 ppbV (1.25 × 10⁻⁸ mol L−1) with relative humidity varying from 30% to 70% (3.84 × 10⁻⁴ to 8.96 × 10⁻⁴ mol L−1 water vapour). The results of these two sets of experiments indicate that firstly, the rate constant decreases with increasing starting NO2 concentration (Figure 7c) and increases slightly as relative humidity increases given constant starting NO2 concentrations (Figure 8c).

3.3. Nitric Oxide Kinetics

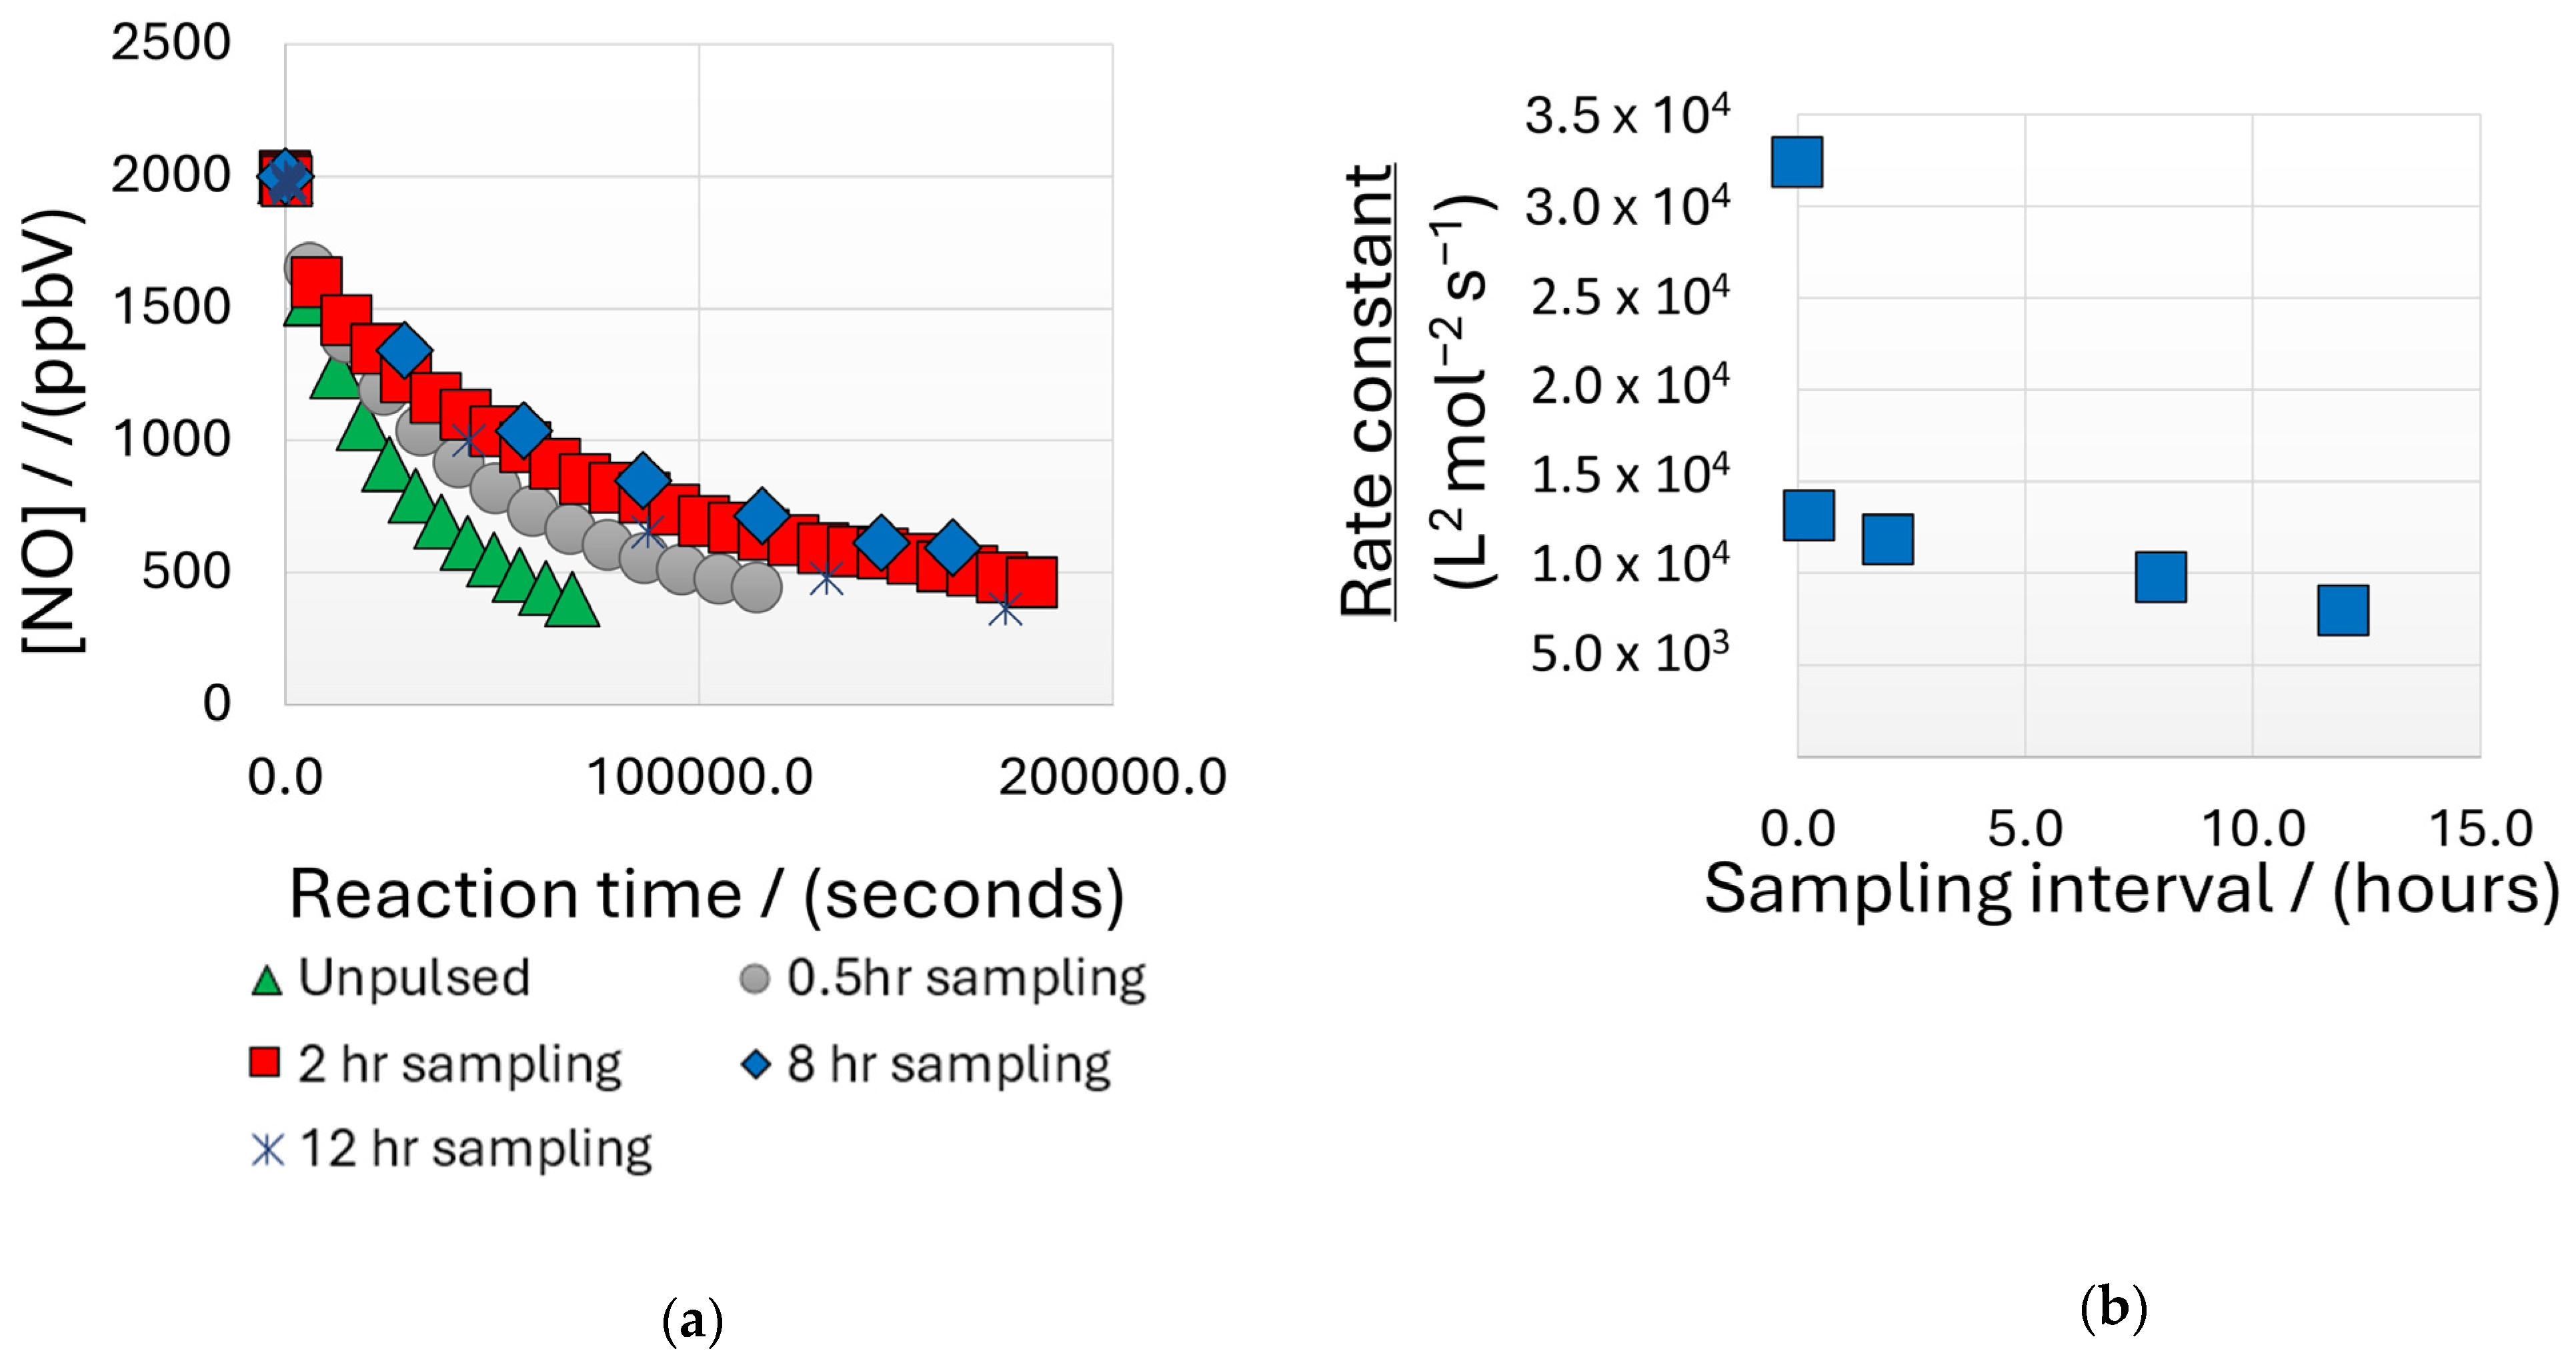
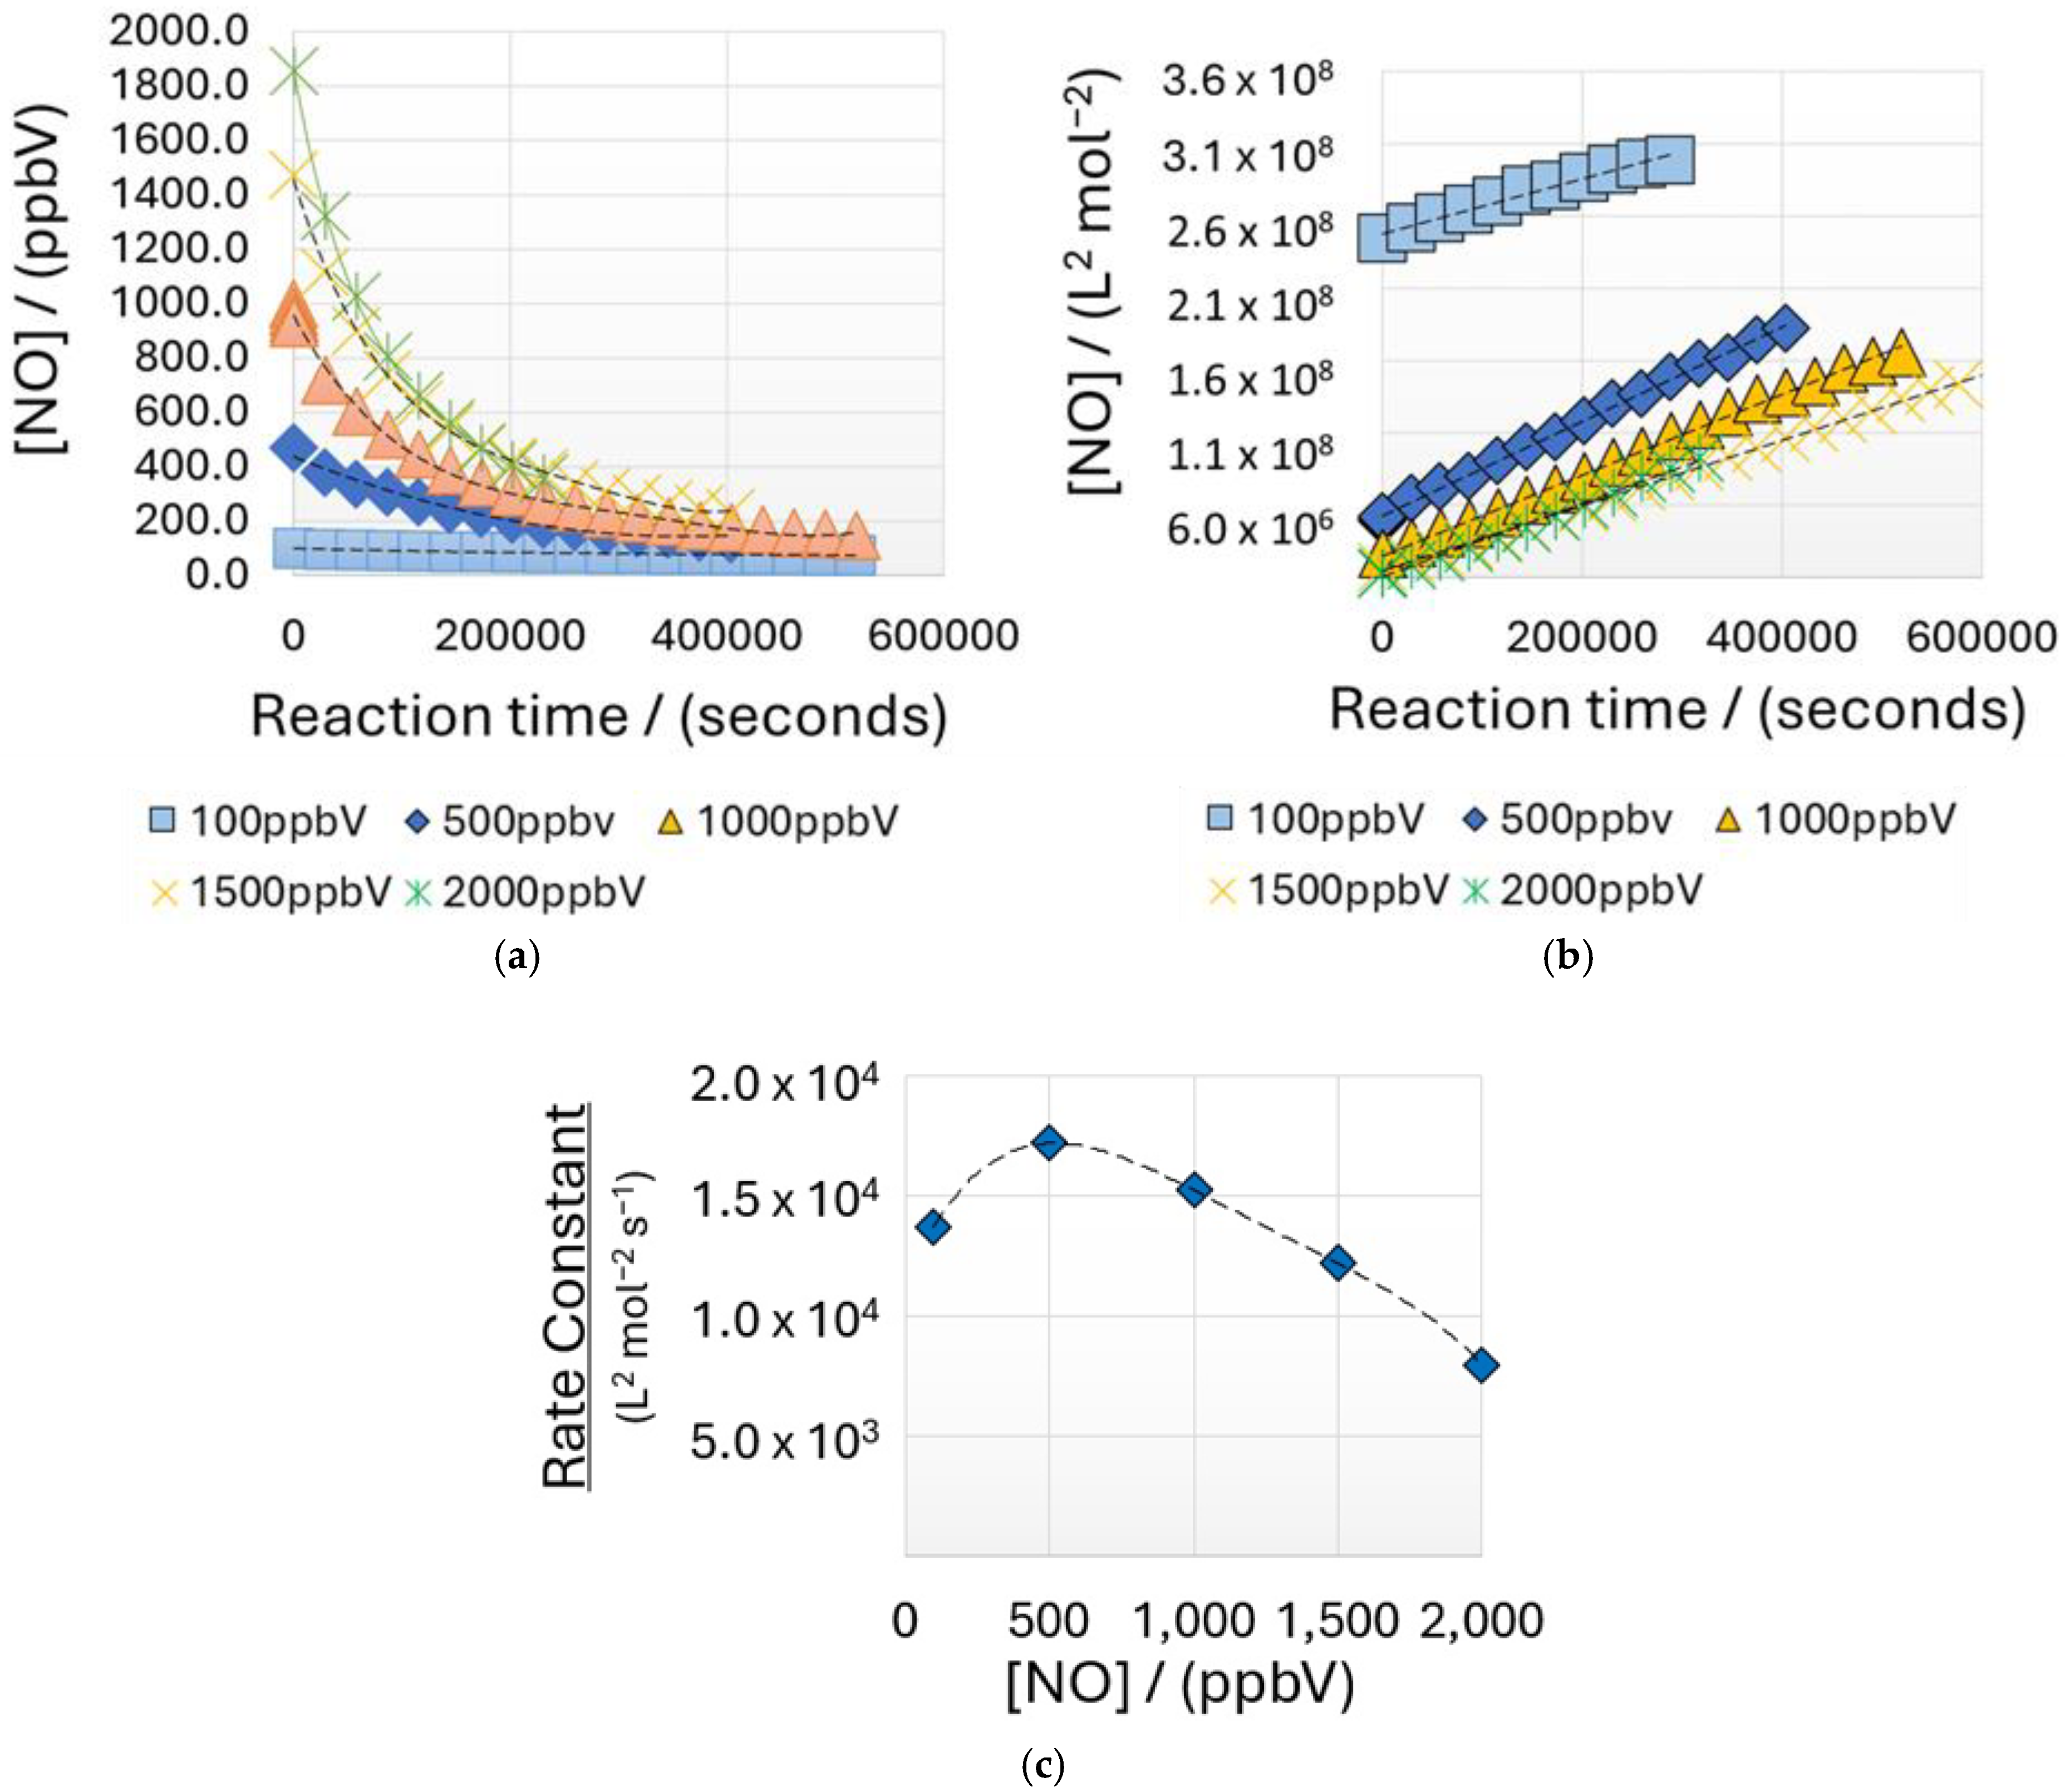
Nitric oxide oxidation rates are notably slower than those of NO2, and therefore, pulsed sampling techniques are required. Figure 9a details the change in the measured rate constant with varying sampling intervals and concludes that a sampling interval between 8–12 h is required before stabilisation of the rate constant is achieved (Figure 9b). Having determined the appropriate sampling time for pulsed experiments, we next conducted kinetic experiments for NO depletion at a range of concentrations between 100–2000 ppbV (4.09 × 10⁻⁹ to 8.18 × 10⁻⁸ mol L−1), at fixed temperature and relative humidities of 25 °C (298 K) and 50% (6.4 × 10⁻⁴ mol L−1 water vapour), respectively (Figure 10, Table 2).
Our measured rate constant at 2000 ppbV (8.18 × 10⁻⁸ mol L−1) using a 12-h sampling time of 7.95 × 10³ L2 mol−2 s−1 is slightly outside the range reported by Tsukahara (7.7 × 10³ L2 mol−2 s−1) but is explainable in terms of either the presence of high concentrations of water vapour in our experiments or more likely, surface area to volume ratios (S/V) of the reaction chamber. This is supported by England [26], who reported a 21% increase in the formation of nitrogen dioxide during humid nitric oxide oxidation when the S/V ratio of their reactor was changed from 0.335 to 1.2 cm−1 following the addition of glass beads.
The rate constant increased with decreasing initial NO concentration, reaching a peak at approximately 500 ppbV before again decreasing. The reason for this decrease at concentrations below 500 ppbV was not apparent and requires further investigation (Figure 10c). Unlike with the NO2, we detected negligible change in rate constant when relative humidity was varied from 30% to 70% (3.84 × 10⁻⁴ to 8.96 × 10⁻⁴ mol L−1 water vapour).

4. Conclusions

Previous investigations into the oxidation of nitric oxide have been undertaken under conditions that do not represent ambient atmospheric conditions. Using the LCES approach described herein, good agreement with published rate constants was found for NO oxidation rates when concentrations approaching 2 ppmV, as used in those previous studies, were employed. When lower NO and higher water vapour concentrations, such as those found under ambient atmospheric conditions, are considered in experimental conditions, reaction rates that differ from established values were found. The presence of high concentrations of water vapour contributed to side reactions that removed NO2 formed from the oxidation of NO from the system; however, the LCES device was still able to generate reproducible results given the correct sampling method.
From a cost perspective, the use of LCESs provides a significant advantage over chemiluminescence detectors and their associated costs, allowing smaller research facilities, such as small to medium enterprises in the private sector, to participate in research designed to mitigate atmospheric nitrogen oxide pollutants.
In this study, we have demonstrated that LCESs, when used under isothermal/isohume conditions, are a viable alternative to chemiluminescence detectors to measure the kinetics of atmospheric NO and NO2 oxidation. Pulse sampling is required for NO gas as spurious results would be obtained as the natural rate of atmospheric oxidation is significantly longer than oxidation resulting from the LCES. In contrast, rapid, non-pulsed sampling is required for NO2 as the natural reaction rate under humid conditions exceeds that of the gas consumption by the LCES.
We believe that this is the first time that such a system has been used to study the oxidation kinetics of nitrogen oxides and was specifically developed to support our work in designing biocatalytic coatings for nitrogen oxides related air pollution remediation.

Author Contributions

Conceptualization, S.M.O.; Formal analysis, S.M.O., L.H.Y. and D.T.M.; Investigation, S.M.O.; Methodology, S.M.O., L.H.Y. and D.T.M.; Project administration, L.H.Y. and D.T.M.; Software, S.M.O.; Supervision, D.T.M.; Visualization, L.H.Y.; Writing—original draft, S.M.O.; Writing—review and editing, L.H.Y. and D.T.M. The manuscript was written through the contributions of all authors. All authors have read and agreed to the published version of the manuscript.

Funding

Funding for equipment and consumables for this project was provided by Illawarra Coatings Pty. Ltd.

Data Availability Statement

The data presented in this study are available on request from the corresponding author. These data are not publicly available due to the data collection format and authentication requirements of the current cloud storage location.

Acknowledgments

L.H. Yee would like to acknowledge the teaching relief contribution from ARC project LP150100602 that facilitated the preliminary discussions addressed in this study.

Conflicts of Interest

Owen is a director of Illawarra Coatings. Yee and Maher are supervisors of Owen in a PhD candidature at Southern Cross University.

References

  1. Bodenstein, M.; Wachenheim, L. Die Geschwindigkeit der Reaktion zwischen Stickoxyd und Sauerstoff. Z. Elektrochem. 1918, 24, 183–201. [Google Scholar]
  2. Tsukahara, H.; Ishida, T.; Mayumi, M. Gas-Phase Oxidation of Nitric Oxide: Chemical Kinetics and Rate Constant. Nitric Oxide 1999, 3, 191–198. [Google Scholar] [CrossRef] [PubMed]
  3. Aida, A.; Miyamoto, K.; Saito, S.; Nakano, T.; Nishimura, M.; Kawakami, Y.; Omori, Y.; Ando, S.; Ichida, T.; Ishibe, Y. Effects of temperature and humidity on the stability of nitric oxide, and efficacy of soda lime as a selective absorber of nitrogen dioxide. Jpn. J. Thorac. Dis. 1995, 33, 306–311. [Google Scholar]
  4. Greig, J.D.; Hall, P.G. Infra-red spectrophotometric study of the oxidation of nitric oxide. Trans. Faraday Soc. 1966, 62, 652–658. [Google Scholar] [CrossRef]
  5. Stedman, D.H.; Niki, H. Kinetics and mechanism for the photolysis of nitrogen dioxide in air. J. Phys. Chem. 1973, 77, 2604–2609. [Google Scholar] [CrossRef]
  6. Treacy, J.C.; Daniels, F. Kinetic study of the oxidation of nitric oxide with oxygen in the pressure range 1 to 20 mm. J. Am. Chem. Soc 1955, 77, 2033–2036. [Google Scholar] [CrossRef]
  7. England, C. The Rate and Mechanism of the Air Oxidation of Parts-per-Million Concentrations of Nitric Oxide in the Presence of Water Vapour. Ph.D. Thesis, California Institute of Technology, Pasadena, CA, USA, 1970. [Google Scholar]
  8. Government, N. Air Quality Data Services: Data Download Facility. 2024. Available online: https://www.airquality.nsw.gov.au/air-quality-data-services/data-download-facility (accessed on 3 February 2024).
  9. AS/NZS 1580.101.1:1999; Paints and Related Materials—Methods of Test Conditions of Test—Temperature, Humidity and Airflow Control. Standards Australia: Sydney, Australia, 1999.
  10. AS/NZS 3580.5.1-2011; Methods for Sampling and Analysis of Ambient Air Determination of Oxides of Nitrogen—Direct-reading Instrumental Method. SAI Global: Sydney, Australia, 2011.
  11. BS EN 14211:2012; Ambient Air. Standard Method for the Measurement of the Concentration of Nitrogen Dioxide and Nitrogen Monoxide by Chemiluminescence. British Standards Institute: London, UK, 2012.
  12. Department of Climate Change, Energy, the Environment and Water. National Environmental Protection (Ambient Air Quality) Measure. Available online: https://www.nepc.gov.au/nepms/ambient-air-quality (accessed on 3 February 2022).
  13. Department of Planning Industry and Environment. NSW Compliance Report 2020. National Environment Protection (Ambient Air Quality) Measure 2021. Available online: https://www.environment.nsw.gov.au/research-and-publications/publications-search/new-south-wales-annual-compliance-report-2020 (accessed on 3 February 2024).
  14. Mead, M.I.; Popoola, O.A.M.; Stewart, G.B.; Landshoff, P.; Calleja, M.; Hayes, M.; Baldovi, J.J.; McLeod, M.W.; Hodgson, T.F.; Dicks, J.; et al. The use of electrochemical sensors for monitoring urban air quality in low-cost, high-density networks. Atmos. Environ. 2013, 70, 186–203. [Google Scholar] [CrossRef]
  15. Popoola, O.A.M.; Stewart, G.B.; Mead, M.I.; Jones, R.L. Development of a baseline-temperature correction methodology for electrochemical sensors and its implications for long-term stability. Atmos. Environ. 2016, 147, 330–343. [Google Scholar] [CrossRef]
  16. Lewis, A.C.; Lee, J.D.; Edwards, P.M.; Shaw, M.D.; Evans, M.J.; Moller, S.J.; Smith, K.R.; Buckley, J.W.; Ellis, M.; Gillot, S.R.; et al. Evaluating the performance of low cost chemical sensors for air pollution research. Faraday Discuss. 2016, 189, 85–103. [Google Scholar] [CrossRef] [PubMed]
  17. Gill, A.; Zajda, J.; Meyerhoff, M.E. Comparison of electrochemical nitric oxide detection methods with chemiluminescence for measuring nitrite concentration in food samples. Anal. Chim. Acta 2019, 1077, 167–173. [Google Scholar] [CrossRef] [PubMed]
  18. Cross, E.S.; Williams, L.R.; Lewis, D.K.; Magoon, G.R.; Onasch, T.B.; Kaminsky, M.L.; Worsnop, D.R.; Jayne, J.T. Use of electrochemical sensors for measurement of air pollution: Correcting interference response and validating measurements. Atmos. Meas. Tech. 2017, 10, 3575–3588. [Google Scholar] [CrossRef]
  19. Kamionka, M.; Breuil, P.; Pijolat, C. Calibration of a multivariate gas sensing device for atmospheric pollution measurement. Sens. Actuators B Chem. 2006, 118, 323–327. [Google Scholar] [CrossRef]
  20. Malings, C.; Tanzer, R.; Hauryliuk, A.; Kumar, S.P.N.; Zimmerman, N.; Kara, L.B.; Presto, A.A.; Subramanian, R. Development of a general calibration model and long-term performance evaluation of low-cost sensors for air pollutant gas monitoring. Atmos. Meas. Tech. 2019, 12, 903–920. [Google Scholar] [CrossRef]
  21. Zimmerman, N.; Presto, A.A.; Kumar, S.P.N.; Gu, J.; Hauryliuk, A.; Robinson, E.S.; Robinson, A.L.; Subramanian, R. A machine learning calibration model using random forests to improve sensor performance for lower-cost air quality monitoring. Atmos. Meas. Tech. 2018, 11, 291–313. [Google Scholar] [CrossRef]
  22. Wei, P.; Ning, Z.; Ye, S.; Sun, L.; Yang, F.; Wong, K.C.; Westerdahl, D.; Louie, P. Impact Analysis of Temperature and Humidity Conditions on Electrochemical Sensor Response in Ambient Air Quality Monitoring. Sensors 2018, 18, 59. [Google Scholar] [CrossRef] [PubMed]
  23. Rogulski, M.; Badyda, A.; Gayer, A.; Reis, J. Improving the Quality of Measurements Made by Alphasense NO2 Non-Reference Sensors Using the Mathematical Methods. Sensors 2022, 22, 3619. [Google Scholar] [CrossRef] [PubMed]
  24. Owen, S.; Yee, L.H.; Maher, D.T. Low-Cost Nitric Oxide Sensors: Assessment of Temperature and Humidity Effects. Sensors 2022, 22, 9013. [Google Scholar] [CrossRef] [PubMed]
  25. Skalska, K.; Miller, J.; Ledakowicz, S. Kinetics of nitric oxide oxidation. Chem. Pap. 2010, 64, 269–272. [Google Scholar] [CrossRef]
  26. England, C.; Corcoran, W.H. The Rate and Mechanism of the Air Oxidation of Parts-per-Million Concentrations of Nitric Oxide in the Presence of Water Vapor. Ind. Eng. Chem. Fundam. 1975, 14, 55–63. [Google Scholar] [CrossRef]
Figure 1. Concentration of nitrogen oxides near a medium-sized semi-industrial city (Wollongong: 34.4248° S, 150.8931° E).
Reactions 05 00040 g001
Figure 2. LCES based on the design by Owen et al. [24] with modifications to isolate the electrochemical sensors from the bulk chamber environment.
Reactions 05 00040 g002
Figure 3. Depletion of target NO gas in measurement cell following shutdown of micropump (chamber conditions 25 °C/50% rH).
Reactions 05 00040 g003
Figure 4. (a) NO2 formation from an initial nitric oxide concentration of 132 ppmV under anhydrous conditions (adapted from Skalska) [25]. (b) NO2 undetected under the given measurement conditions for a humid environment (50% rH).
Reactions 05 00040 g004
Figure 5. Stepwise addition of target gases in a humid environment. Measurements were undertaken without an isolation hood.
Reactions 05 00040 g005
Figure 6. (a) Depletion of NO2 in calibration hood following de-energising micropump. (b) Kinetics of NO2 depletion following the de-energising micropump.
Reactions 05 00040 g006
Figure 7. (a) NO2 depletion at varying starting concentrations with chamber conditions maintained at 25 °C/50% rH. (b) Reaction kinetics confirmed as the first order. (c) Rate constant measurements indicate a slight decrease with increasing NO2 starting concentration.
Reactions 05 00040 g007
Figure 8. (a) Nitrogen dioxide depletion at varying relative humidities. (b) Reaction kinetics confirmed as the first order. (c) Rate constant measurements indicate a slight increase with increasing relative humidity.
Reactions 05 00040 g008
Figure 9. (a) NO kinetics for varying sampling times. (b) Rate constant for NO kinetics for varying sampling times.
Reactions 05 00040 g009
Figure 10. Kinetic study of nitric oxide oxidation under humid conditions (chamber conditions 25 °C/50%rH). (a) Depletion of nitric oxide at varying starting concentrations. (b) Confirmed as second-order reaction kinetics at varying starting concentrations. (c) Rate constant as a function of initial nitric oxide concentration.
Reactions 05 00040 g010
Table 1. Composition of ‘zero air’ used for purging the environmental chamber.
ComponentComposition (mol/mole)
Nitrogen78.1%
Oxygen20.9%
Argon0.9%
Water<25 ppm
Table 2. Rate constants for NO oxidation in a humid environment (data from Figure 10c).
[NO]/ppbV[NO]/(mol L−1)Rate Constant/(L2 mol−2 s−1)
100
500
1000
1500
2000
4.09 × 10⁻⁹
2.04 × 10⁻⁸
4.09 × 10⁻⁸
6.13 × 10⁻⁸
8.18 × 10⁻⁸
1.37 × 10⁴
1.72 × 10⁴
1.52 × 10⁴
1.22 × 10⁴
7.95 × 10³
Disclaimer/Publisher’s Note: The statements, opinions and data contained in all publications are solely those of the individual author(s) and contributor(s) and not of MDPI and/or the editor(s). MDPI and/or the editor(s) disclaim responsibility for any injury to people or property resulting from any ideas, methods, instructions or products referred to in the content.