Article

Modeling of the Anaerobic Digestion of Biomass Produced by Agricultural Residues in Greece

by
Efstathios Papachristopoulos
1,
George N. Prodromidis
1,
Dennis E. Mytakis
1,
Vagelis G. Papadakis
2 and
Frank A. Coutelieris
1,*
1
Department of Sustainable Agriculture, University of Patras, 30100 Agrinio, Greece
2
Department of Civil Engineering, University of Patras, 26504 Patras, Greece
*
Author to whom correspondence should be addressed.
Reactions 2024, 5(2), 338-349; https://doi.org/10.3390/reactions5020017
Submission received: 27 March 2024 / Revised: 9 May 2024 / Accepted: 20 May 2024 / Published: 22 May 2024

Abstract

:
This study combines theoretical modeling and experimental validation to explore anaerobic digestion comprehensively. Developing a computational model is crucial for accurately simulating a digester’s performance, considering various feedstocks and operational parameters. The main objective was to adapt the anaerobic digestion model 1 (ADM1) simulation code to align with the laboratory-scale anaerobic digestion reactor’s specifications, especially regarding the liquid–gas transfer process. Within this computational framework, users may define model parameters and elucidate processes occurring in compartments reflecting the physical design. The model accurately predicts total concentrations of chemical oxygen demand (COD) as well as the produced biogas, with an average difference of less than 10% between experimental and simulated data. This consistency underscores the reliability and effectiveness of the adapted model in capturing anaerobic digestion nuances under specified conditions.

1. Introduction

Biomass residue encompasses the organic fraction found in agricultural and livestock residues derived from photosynthesis, and can serve as either energy or a material resource [1]. Precisely, residual biomass originates from the agricultural sector in various forms, including crop residues, animal wastes, and agro-industrial by-products. In Greece, biomass residues are relatively plentiful and thus play a significant role in the energy sector, with initiatives such as anaerobic digestion projects aimed at utilizing agricultural waste for energy production. Furthermore, Greece’s rich agricultural landscape provides ample opportunities for the sustainable management and utilization of biomass residues.
Energy derived from bioprocesses is a significant renewable resource, boasting cost-effective advantages and the potential to treat high chemical oxygen demand (COD) wastes. Anaerobic conversions, initially employed in food and beverage production, have evolved significantly over humanity’s history. Recent decades have witnessed substantial advancements, particularly in high-rate treatment processes for industrial wastewater. The key advantage of anaerobic processes lies in their capacity for energy production, either directly (converting chemical energy to electricity) or indirectly (producing biofuels). This favors a decrease in greenhouse gas emissions, thus contributing to the wide acceptance of anaerobic digestion for waste treatment and a cleaner environment [2].
Anaerobic digestion (AD) is a controlled procedure yielding a gas mixture, known as biogas, comprising methane and carbon dioxide. The ratio between these components depends on raw materials and external impurities. When biogas quality and quantity are sufficient, it can be oxidized in a fuel cell unit for electricity generation or used directly in gas burners to produce thermal energy for domestic use. Governments recognize the importance of anaerobic digestion, offering financial incentives to farmers for installing anaerobic units. This is due to the renewable energy produced with minimal environmental pollution worsening and the reduction in greenhouse gas emissions through controlled waste management.
In anaerobic digestion, bacteria degrade organic wastes in an oxygen-deprived environment, resulting in the production of a gas mixture predominantly composed of methane [3]. Anaerobic co-digestion of various waste materials enhances biogas production, increasing methane richness compared to individual materials [4]. AD involves four complex biochemical stages, along with mechanical or chemical pretreatment to optimize macronutrient utilization. These stages are categorized into extracellular (pretreatment and hydrolysis) and intracellular (acidogenesis, acetogenesis, and methanogenesis) to ensure successful feedstock metabolism into biogas [5].
To develop a robust model for this process, the presented procedures must be implemented, allowing the prediction of biogas production under different conditions. Over the years, models have evolved from simple single-equation models to more complex multi-step dynamic models. These complex models consider microbial growth dynamics, feedstock evolution, and biogas production, incorporating time-dependent processes [6].
AQUASIM is a modeling and simulation program developed for water treatment in various reactor types [7]. Based on the finite element method, it is a strong and viable tool for efficient workflow, from preprocessing to final problem solution. This program allows users to define model parameters and processes occurring in compartments representing the physical design. The anaerobic digestion model 1 (ADM1), a popular multi-step time-dependent model, was implemented and presented by Batstone et al. [8] and has been included as standard in AQUASIM. While ADM1 incorporates dynamics and various state variables, its complexity poses numerical challenges for real-time implementation [9]. Despite a clear understanding of the biochemical mechanisms in the AD process, the specific pathway of biogas formation remains uncertain. To address these uncertainties, deriving biogas amounts directly from substrate theoretical yields, combined with measured parameters, is a practical approach for estimating biogas production. However, estimating and measuring parameters can be challenging, time-consuming, laborious, and expensive [9,10]. The present work aims to adapt the ADM1 simulation code, previously implemented in the software platform AQUASIM, to a laboratory-level AD reactor, as described by Aravani et al. [11] and Aravani et al. [12].

2. Materials and Methods

2.1. Theoretical Background and Improvements in ADM1

As just stated, the ADM1 tool is a comprehensive model encompassing both physico-chemical and biochemical processes. Physico-chemical processes involve the modeling of acid–base reactions and liquid–gas transfer reactions, while biochemical processes include disintegration and hydrolysis, mixed product acidogenesis, syntropic hydrogen-producing acidogenesis, hydrogen-utilizing methanogenesis, acetolactic methanogenesis, and inhibition and toxicity [8].
While a detailed description of the original ADM1 model is available elsewhere [13], it is pertinent to outline the improvements and modifications made for the purposes of this project. Specifically, with respect to the physico-chemical processes, the original ADM1 model incorporates both liquid–liquid and liquid–gas processes. However, the model utilized in this project diverges from the original ADM1 in the treatment of the liquid–gas transfer process.
As known, H2, CH4, and CO2 constitute the primary gas components significantly influencing liquid–gas transfer. In the original ADM1 model, an identical value for the overall mass transfer coefficient multiplied by the specific transfer area (kLa) is recommended for all gases, given their similar diffusivities. However, considering operational conditions such as gas pressure, stirring, temperature, and substrate properties, the coefficient is adjusted as follows:
k L a = 1 1 k y + m i k x P
where k y and k x are the gas-phase mass transfer coefficient and the liquid-phase mass transfer coefficient, respectively (kmol/m−2 s−1), P is the gas pressure (kPa), mi is the solubility coefficient of each gas, while i represents each of the three main gas components, H2, CH4, and CO2. Also, the additional parameters in Equation (1) are as follows:
m i = E i P
k y = D g R   T   δ g P P b m
k x = D l δ l C m C b m
where E i is Henry’s constant (kPa), R is the gas constant 8.31 (kJ kmol−1 K−1), T is the temperature (K), Dg and Dl are the diffusion coefficients of the gas and the liquid phase, respectively (m2 s−1), while δg and δl represent the theoretical liquid film thickness (m) derived from the two-film theory [3]. Finally, Cm is the concentration (kmol m−3), Cbm is the logarithmic average of the concentrations of both sides of the stationary fluid layer, and Pbm is the logarithmic average pressure on both sides of the stationary gas layer.
In this respect, the mass transfer rate of each i_chemical element from liquid to gas phase (Equation (5)) and vice versa (Equation (6)) is represented by the following expressions:
r i = ( k L a ) i ( X i E i P i )
r i = ( k L a ) i ( E i P i X i )
where Pi and Ei are the partial pressure in the gas phase (Pa) and Henry’s constant (kmol m−3 Pa−1) of the i_element respectively, while Xi is the molar concentration of the i_element in liquid phase (kmol m−3).
As for the syngas biomethanation, the reactions that take place are as follows:
CO + H2O → CO2 + H2  ΔG0 = 20 kJ mol−1
4CO + 2H2O → CH3COOH + 2CO2  ΔG0 = 176 kJ mol−1
2CO + 2H2 → CH3COOH  ΔG0 = 67 kJ mol−1
CH3COOH → CO2 + CH4  ΔG0 = 31 kJ mol−1
4H2 + CO2 → CH4 + 2H2O  ΔG0 = 130.7 kJ mol−1
Continuing from the aforementioned processes, carbon monoxide (CO) undergoes distinct transformations within the anaerobic digestion system, described by Equations (7)–(9). These reactions illustrate the diverse pathways in which carbon monoxide can be transformed, involving the production of hydrogen, acetate, and other intermediate compounds. Furthermore, Equations (10) and (11) elucidate the acetolactic and hydrogenotrophic methanogenesis processes, respectively. These equations describe the conversion of acetate and hydrogen, respectively, into methane—a crucial component in the biogas produced during anaerobic digestion. Understanding these reactions is essential for comprehending the complex biochemical transformations occurring within the system.
Regarding the biochemical processes, the modifications primarily focus on addressing syngas inhibition. It is crucial to acknowledge that highly pressurized carbon monoxide (CO) can be toxic to various microorganisms. Simultaneously, hydrogen (H2) may inhibit acetogenesis, but it is also consumed during methanogenesis to maintain a low partial pressure—an essential factor for the acetogenesis process. Therefore, both CO toxicity and H2 inhibition need to be taken into consideration, since highly pressurized carbon monoxide can be toxic to various microorganisms [14]. The inhibition factors representing the deleterious effects of hydrogen can be expressed as follows:
I H 2 , j = 1 1 + S H 2 K I , H 2 , j
where S H 2 is the concentration of dissolved H2 in the liquid phase and K I , H 2 , j is the inhibition constant of H2 during the biochemical j_process (uptake of butyrate or propionate). Inhibition of CO can be analytically embodied in the modified ADM1 code to accurately model the acetogenesis and methanogenesis process and can be presented through the following model:
I C O , j = 1 1 + S C O K I , C O , j
where S C O is the concentration of dissolved CO in the liquid phase and K I , C O , j is the inhibition constant of CO during the biochemical j_process (uptake of H2 or acetate).

2.2. Experimental

The experimentally estimated/calculated values as well as the experiments validated here through simulations have been carried out elsewhere [12]. Also, the experimental setup is presented in detail there. Conversely, constant variables have values obtained from the literature [15]. Briefly speaking, the AD experiments were conducted in a mesophilic stirred tank reactor (CSTR) with a controlled temperature of 37 ± 0.5 °C and an operating volume of 750 mL. Temperature regulation was achieved through a thermocouple system and hot water circulation, ensuring constant conditions throughout the process. The cylindrical reactor, constructed of double-walled stainless steel, featured a geared motor drive at the top for continuous agitation. Feedstock, stored refrigerated, was manually introduced to the methanogenic reactor every 6 h four times daily using a precise plastic gas syringe with a volume of 50 mL. Biogas production was monitored automatically using a custom device comprising an engine oil-filled U-tube, an electron valve, and a counter-mechanism. This setup allowed for the measurement of biogas production by tracking the displacement of a constant volume of oil displaced by the generated biogas [11,12].

2.3. Simulations

To simulate a realistic scenario of the AD process using the ADM1 model, it is crucial to clearly define and categorize the parameters in the code. Each parameter should be appropriately labeled, either as a real list variable or as a constant variable. Notably, parameters labeled as “real list variable” dynamically change throughout the AD process, and their values must be experimentally determined.
Table 1 presents the most critical parameters, their categories, and the specified ranges of values for representing the mixture fed into the reactor [11]. This comprehensive categorization ensures clarity and accuracy in modeling the dynamic processes of anaerobic digestion. These parameters play a pivotal role in accurately modeling the dynamic processes of anaerobic digestion. By categorizing and specifying the range of values for each parameter, this comprehensive approach ensures clarity and precision in representing the complex interactions within the system. This meticulous categorization not only enhances the understanding of the anaerobic digestion process but also facilitates effective modeling and analysis, ultimately contributing to advancements in biogas production and waste management strategies.
Besides the biomass concentration described above, it is also necessary to estimate as input parameters the gas flows as well as the inorganic carbon and nitrogen in the reactor.
The volumetric flow rate of the reactor’s feed is a crucial dynamic variable used as input for the ADM1 code. Regarding the southern Greece spring–summer reactor, for the initial 117 days, its value remains constant at 37.5 mL per day, manually applied in the simulation tool. The volumetric flow rate values for the other two reactors were applied similarly. Precise consideration of the feed is essential, as it directly impacts nutrient balance in the reactor and consequently total biogas production. It is important to note that the biomass used here was derived from agricultural residues found in Greece. As described in [11], these residues in Greece are as follows: durum wheat = 6.2%, maize = 10.7%, other wheat for crop = 6.7%, edible legumes = 0.2%, other industrial plants = 3.5%, cotton = 8.3%, potatoes = 1.1%, vegetables = 3.7%, olive trees = 31.7%, citrus trees = 19.2, and other trees = 8.6%.
COD as a measure of water quality plays a vital role in determining biologically active substances. Accurate determination of COD values is essential for realistic simulations of biochemical processes in AD and the resultant biogas production. Figure 1 compares the experimental and simulated total COD concentrations for the southern Greece spring–summer reactor. Notably, empirical and simulated data exhibit a similar trend. Quantitively speaking, the correlation between experimental and simulated results is defined by the averaged relative error, where 10% is the threshold for acceptable agreement. Moreover, for over 60% of the entire period, the differences between simulated and experimentally obtained COD values were consistently below 9.1%, indicating acceptable validation for the simulations. This validation is especially noteworthy, given the complexity of the ADM1 code and potential experimental errors for technical reasons [10].
The results produced by simulations indicate smooth behavior, while the experimental measurements show significant fluctuations. Experimental results obtained from real-world observations are subject to various sources of variability and uncertainty. Factors such as fluctuations in environmental conditions, measurement errors, and inherent biological variability can lead to significant fluctuations in experimental data, especially when observed over the same time period. Additionally, experimental setups may introduce discontinuities or disturbances that are not accounted for in simulations, further contributing to the observed fluctuations. These behaviors for both simulated and experimental results are consistently encountered in all the following figures.
Figure 2 displays the simulated and measured biogas volumetric flow rate over 120 days of operation for the southern Greece spring–summer reactor. The simulated biogas curve closely mirrors the experimental trends, since the observed differences are sufficiently low to conclude that the model can satisfactorily predict methane production. As mentioned earlier, these discrepancies can be attributed to experimental inaccuracies for technical reasons [10,16] in conjunction with the complexity of the ADM1 code, which encapsulates estimators and model-based controllers to predict real-time AD evolution [16].
At this point, it is essential to identify the produced CH4 and CO2 in the reactor, which are the main components of the final produced biogas. This calculation reveals the purification of the biogas in CH4 and can be shown by the partial pressure of each element (p_element_adjust), which is calculated as a percentage of the total pressure of headspace (p_headspace). Initially, the ADM1 code calculates the pressures of each element through the expressions:
p_C H 4 = S_C H 4 64 R T
p_C O 2 = S_C O 2 R T
where S_CH4 is the quantity of methane in kg COD/m3, S_CO2 is the quantity of carbon dioxide in M (kmol/m3), R (=0.08314 bar M−1 K−1) is the constant of ideal gases, and T (K) is the temperature of the reactor.
The graphs for the partial pressures of the southern Greece spring–summer reactor are presented in Figure 3, and their values were calculated through the ADM1 code using the following equations:
p_C H 4 _a d j u s t = p_C H 4 p_ h e a d s p a c e 100
p_C O 2 _a d j u s t = p_C O 2 p_ h e a d s p a c e 100
Consistent with expectations, the gas pressures for methane and carbon dioxide maintain an almost constant difference throughout the entire experimental period, with the sum of these two values approximating 100%. This pattern was observed in the southern Greece reactor for both the spring and summer periods as well as the fall and winter ones.

3. Results and Discussion

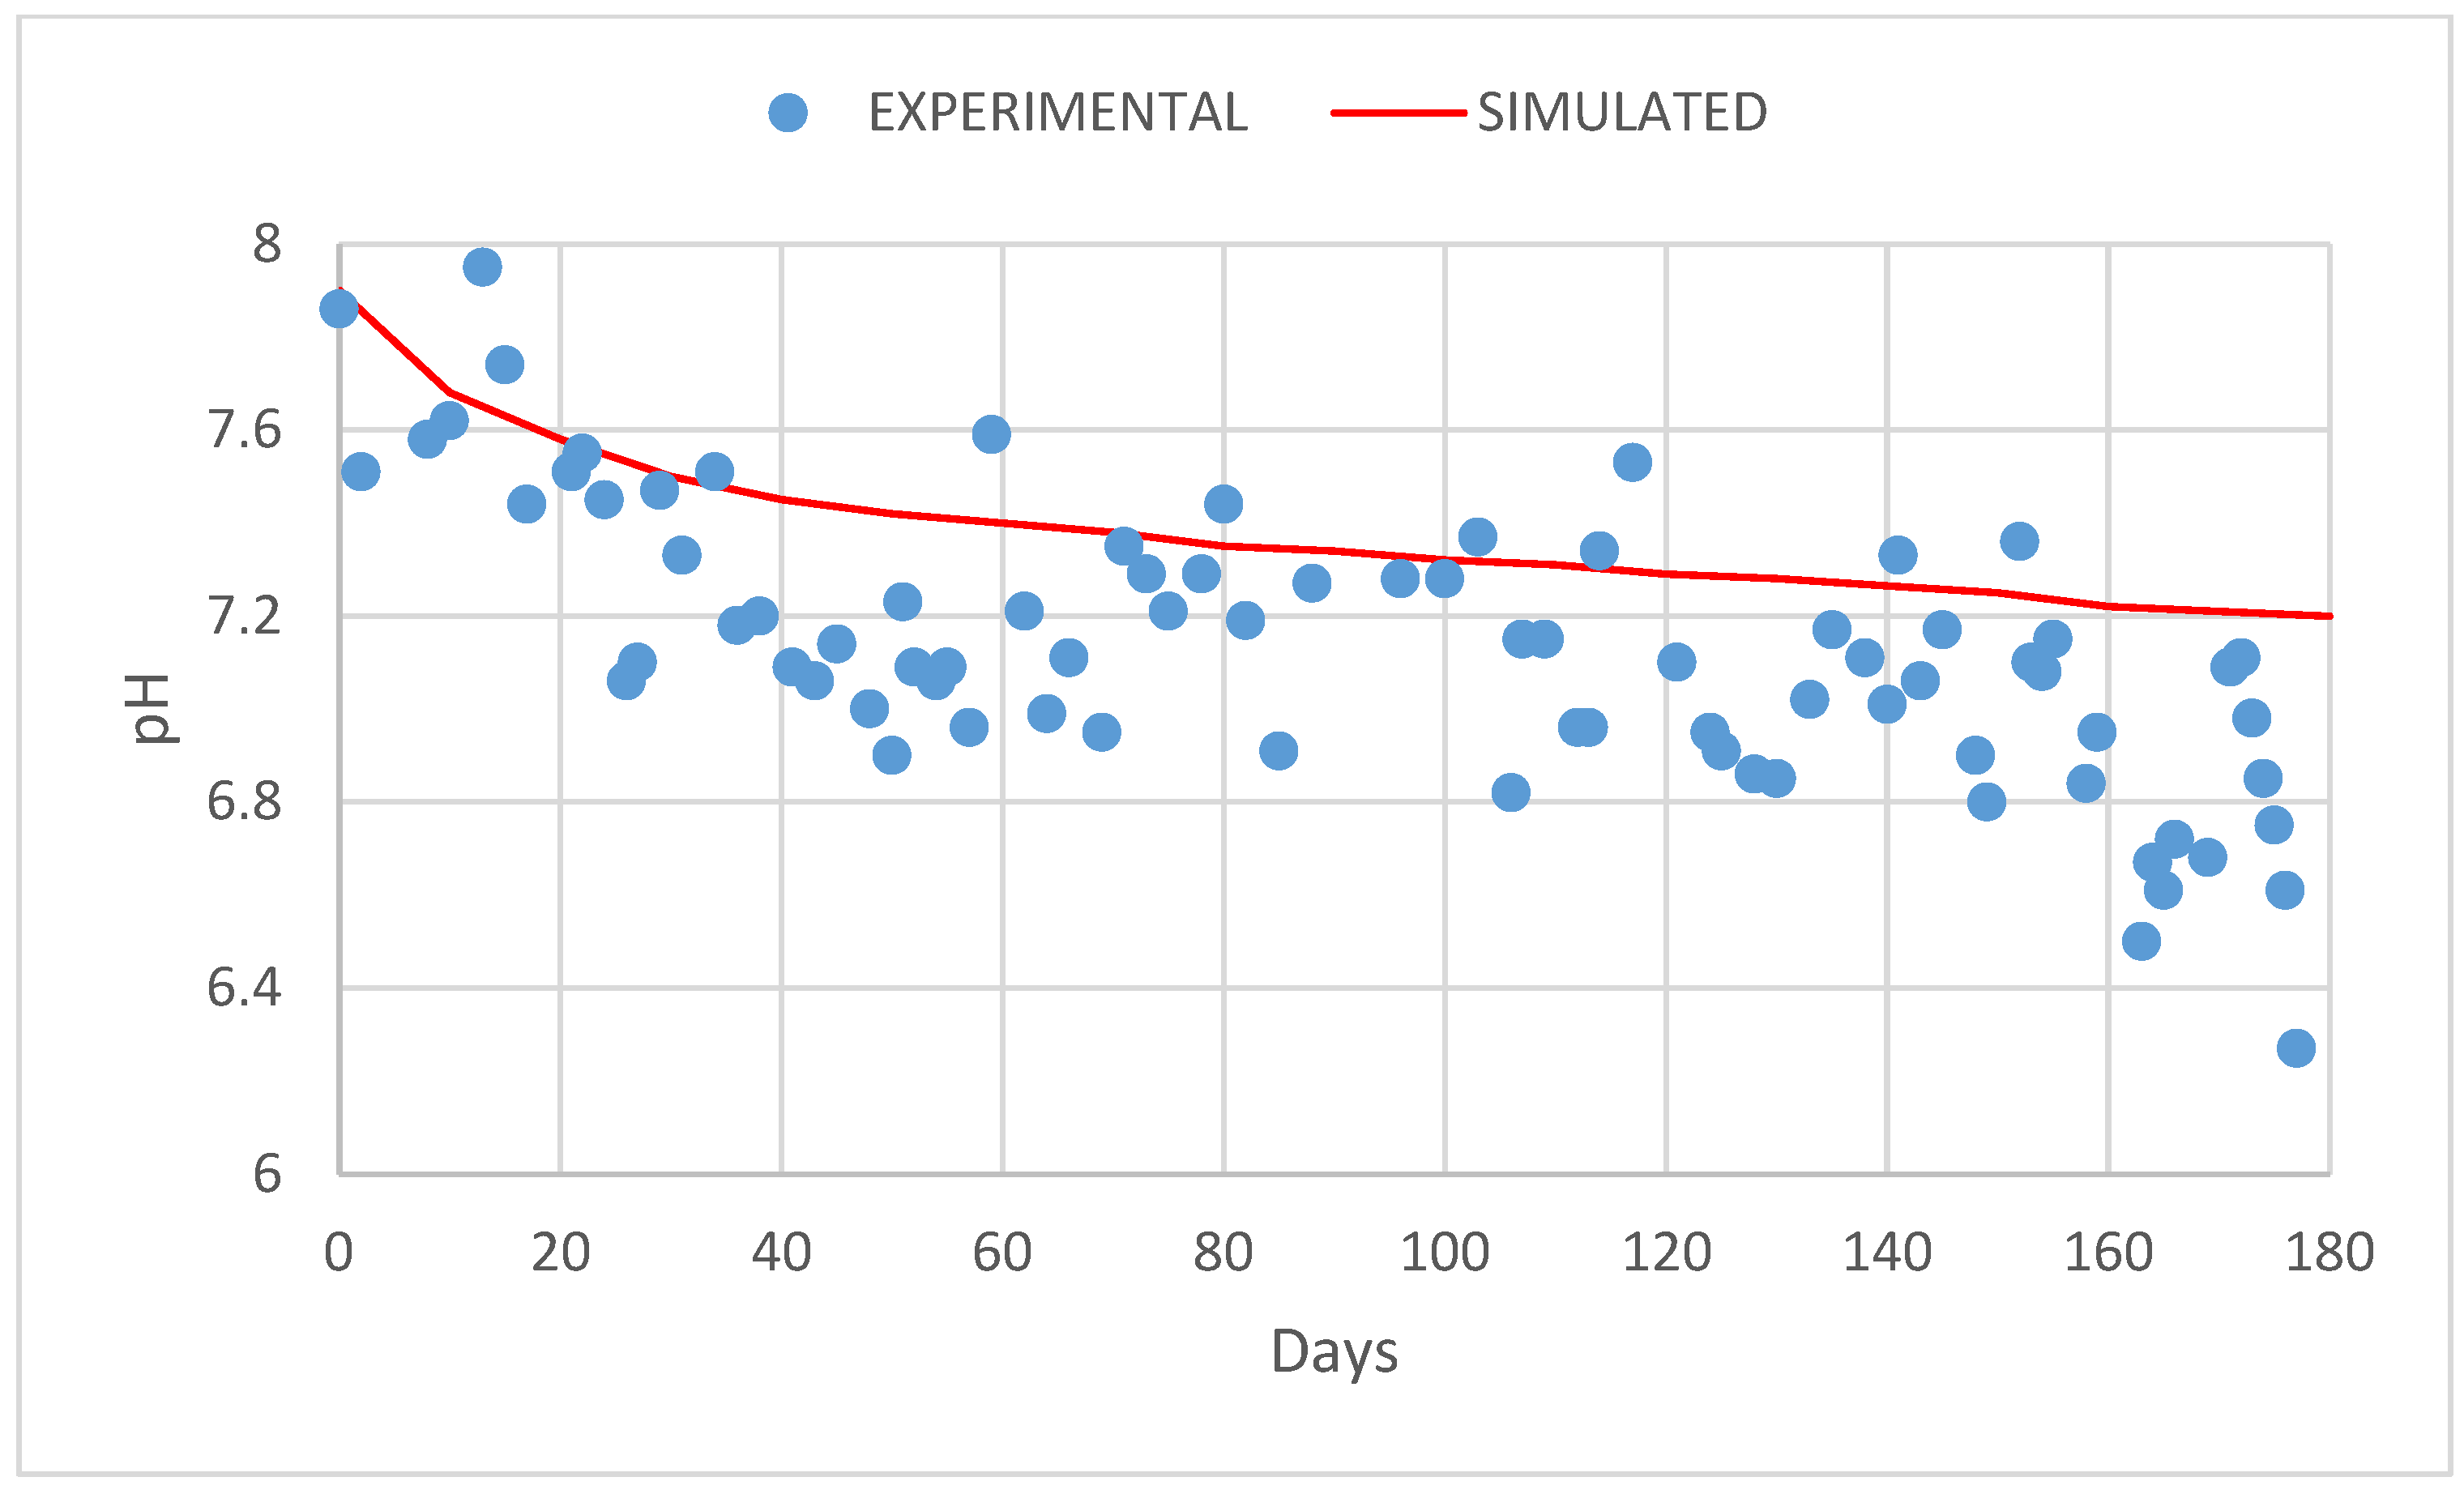
Figure 4 displays the simulated and observed pH levels in the southern Greece spring–summer reactor. The anaerobic digestion process is highly sensitive to variations in pH, emphasizing the critical role of modeling pH values. Although pH sometimes is not considered as an independent value, the ADM1 code models pH in the reactor by relying on the reaction producing carbonic acid from CO2 and H2O. Although this method does not precisely replicate experimental pH values, the simulated pH trends closely align with the observed patterns. The ADM1 model strikes a pragmatic balance between complexity and practical applicability in simulating anaerobic digestion processes, particularly in its treatment of pH.
Consequently, although the simulated pH in the reactor may not precisely align with the experimental values, both curves generally exhibit a similar trend.
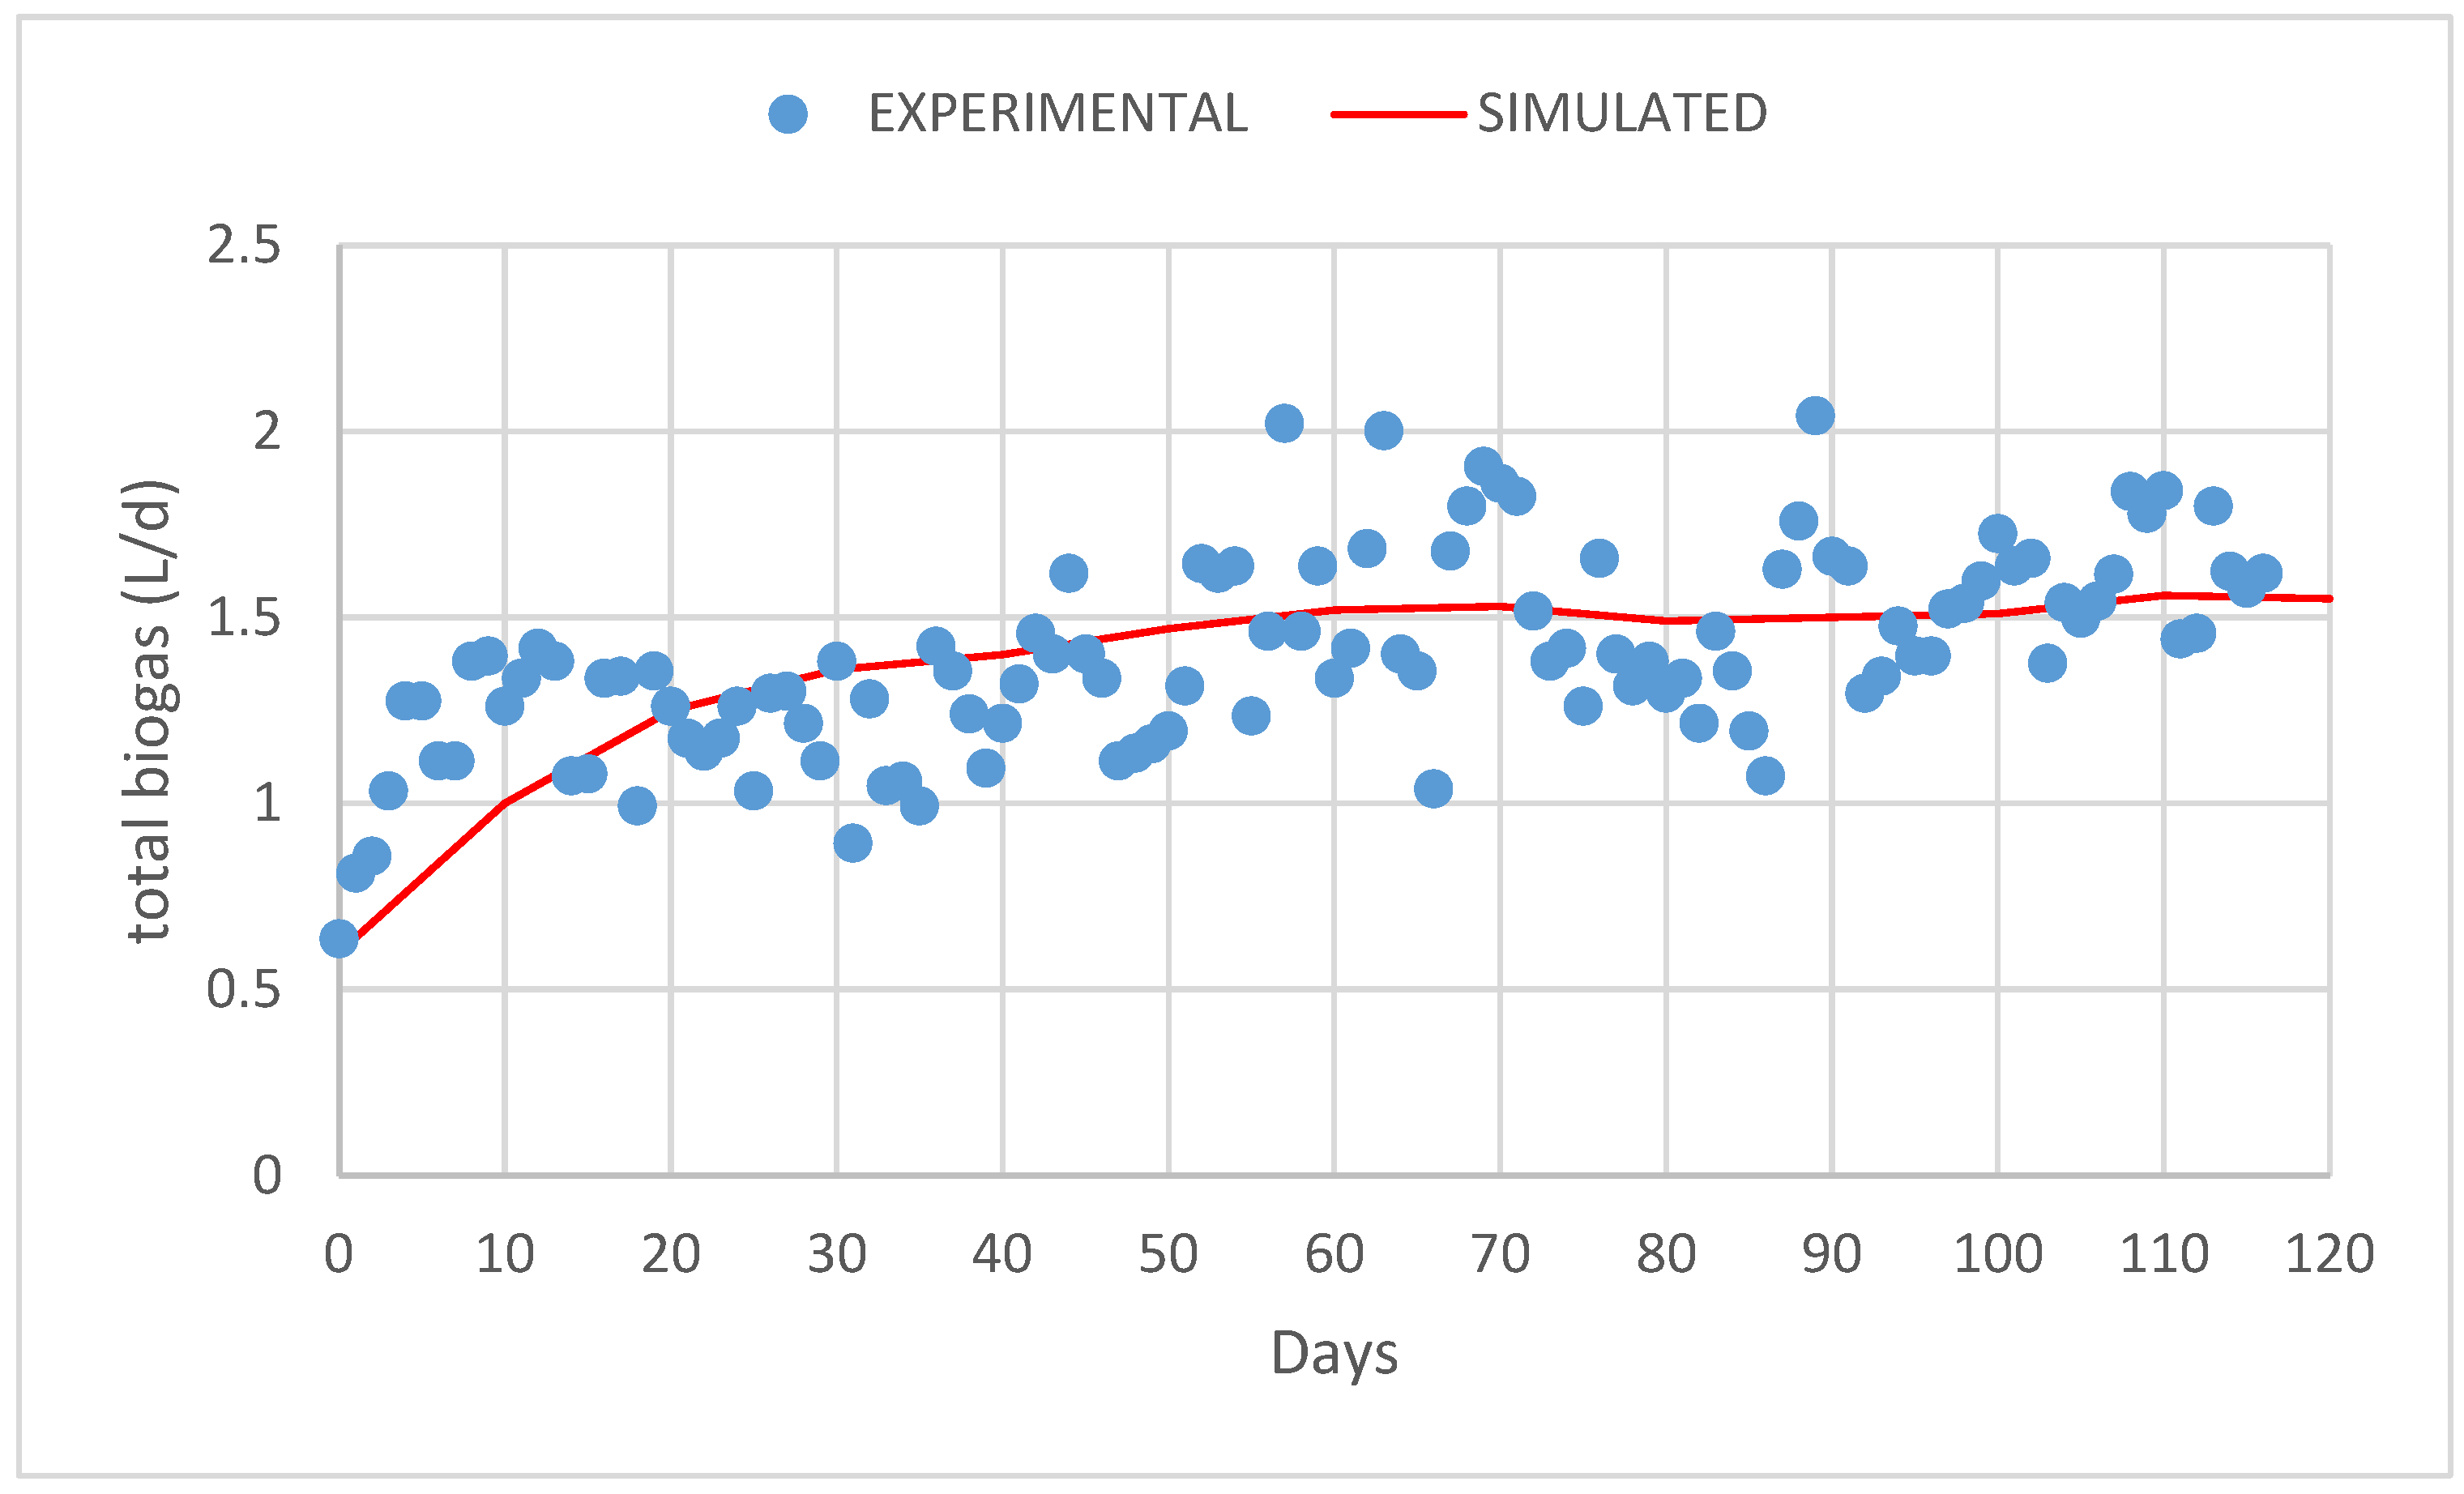
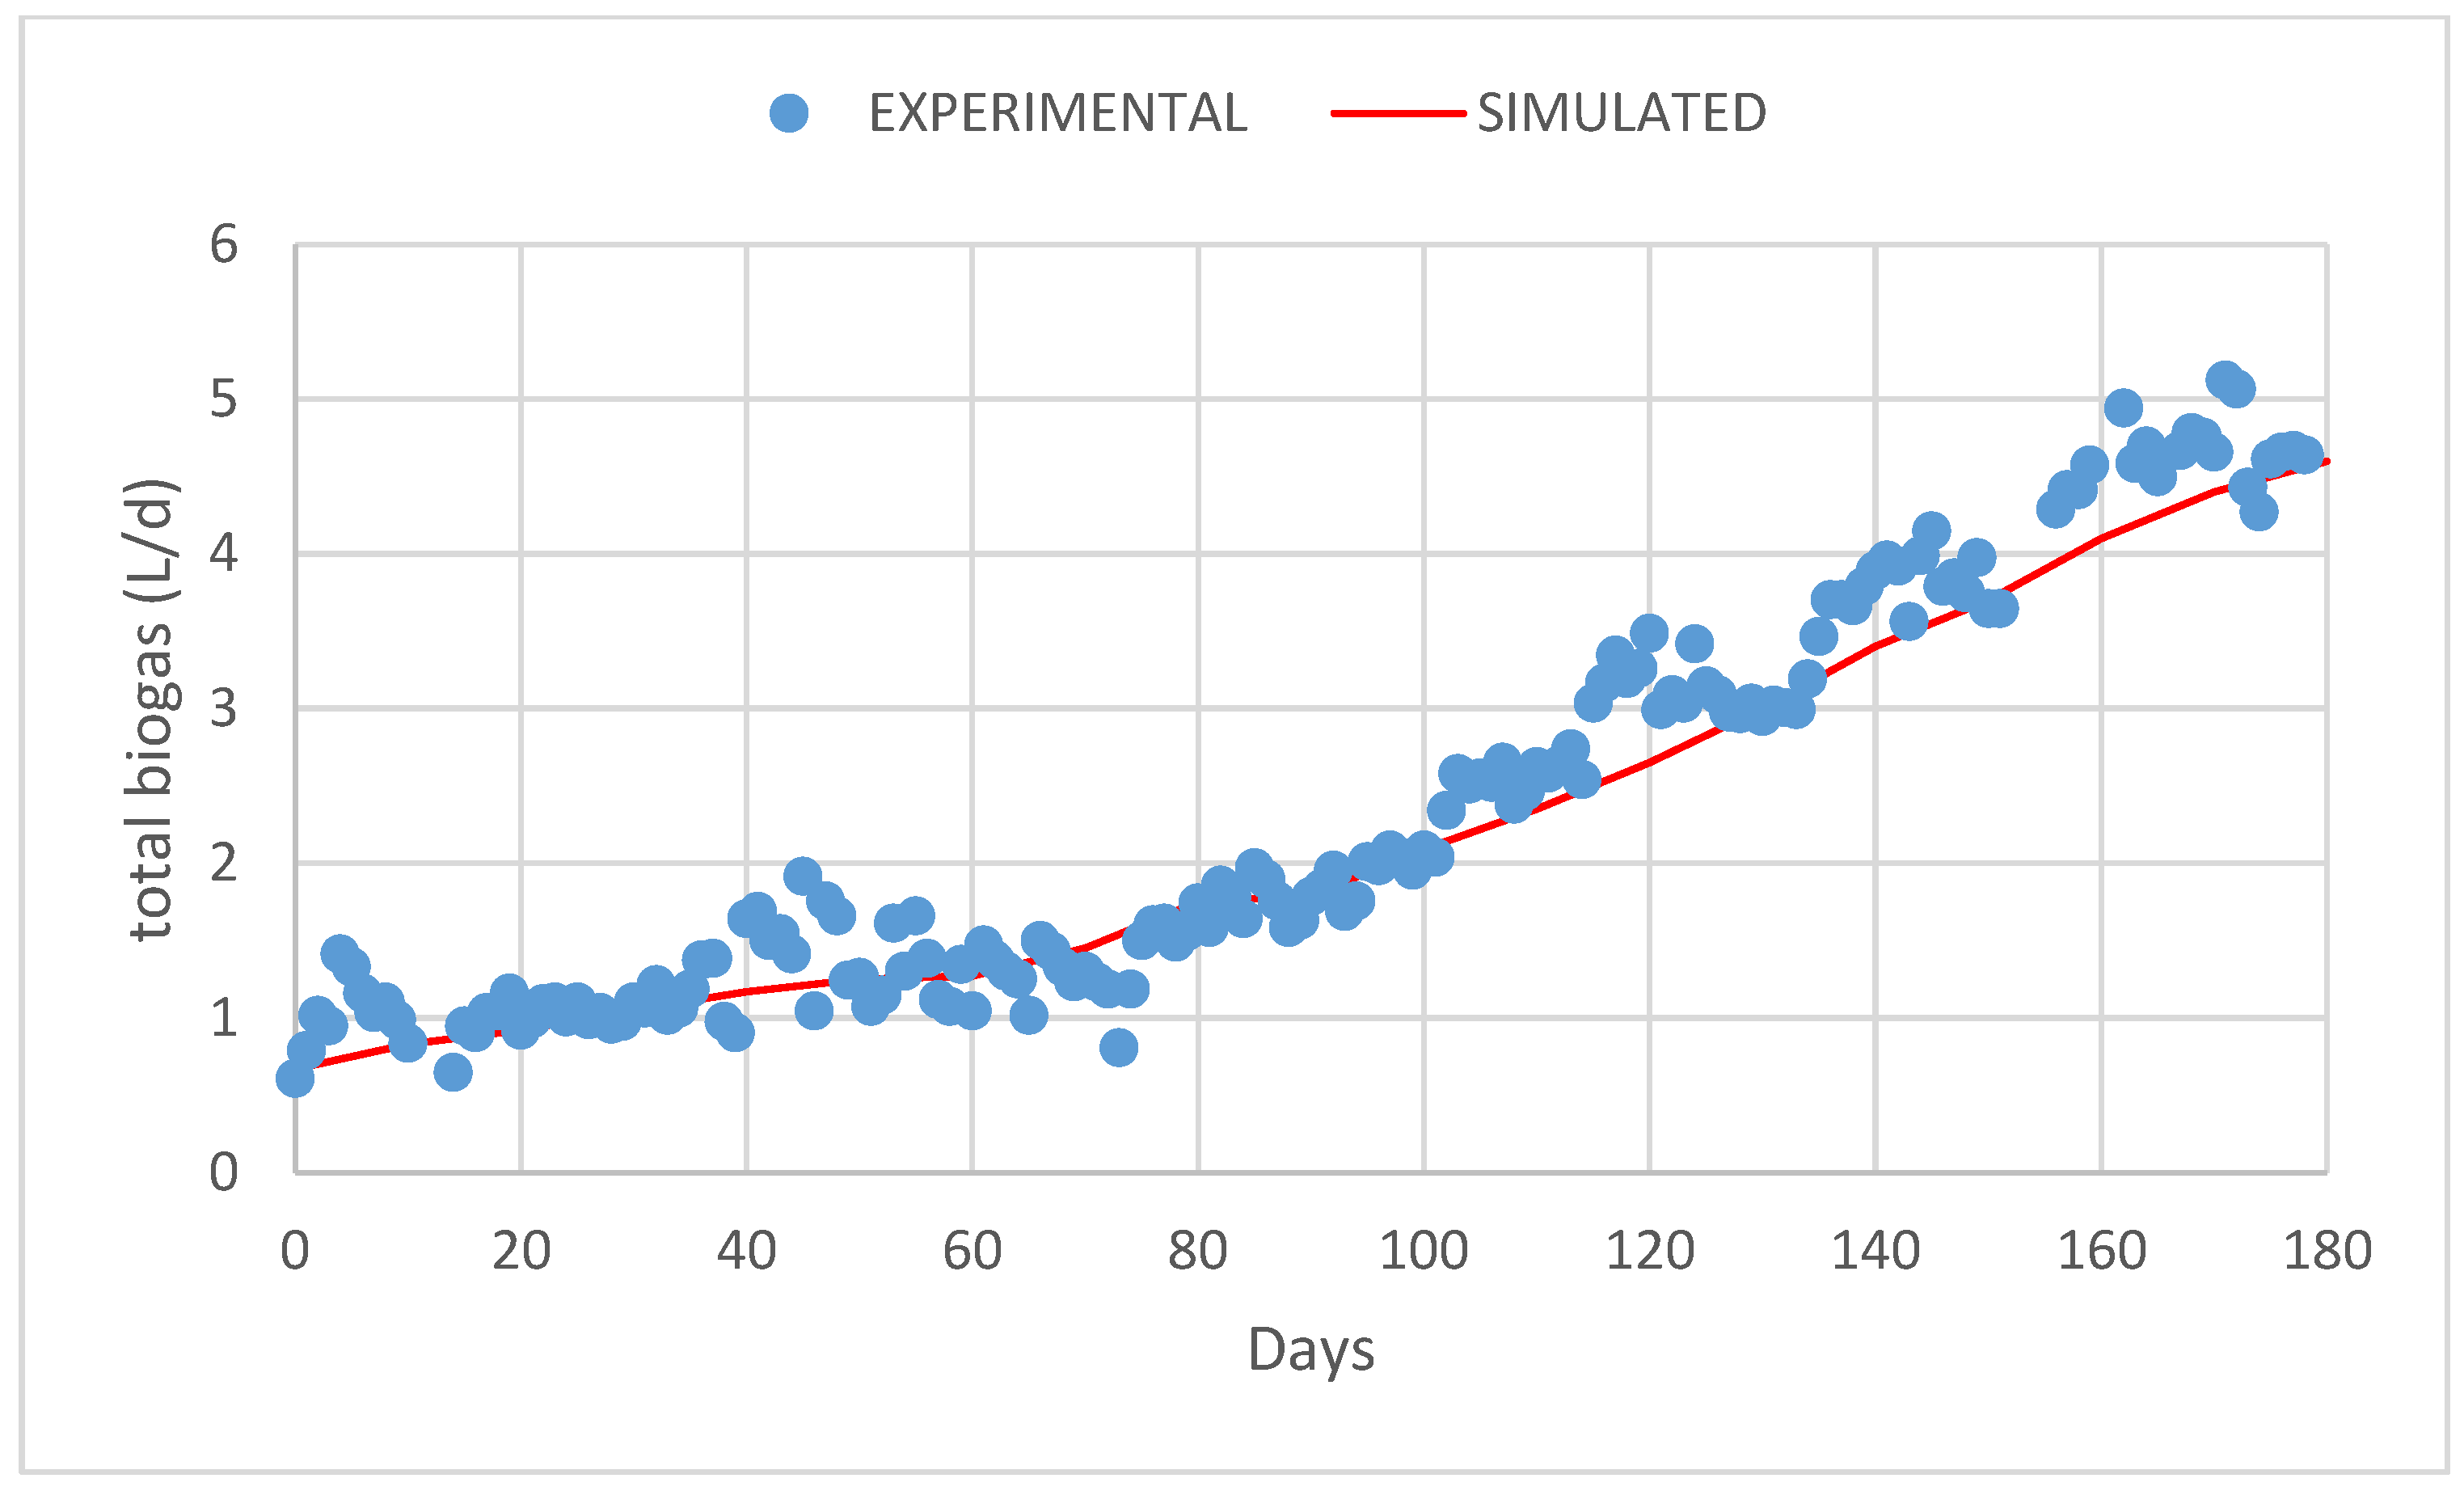
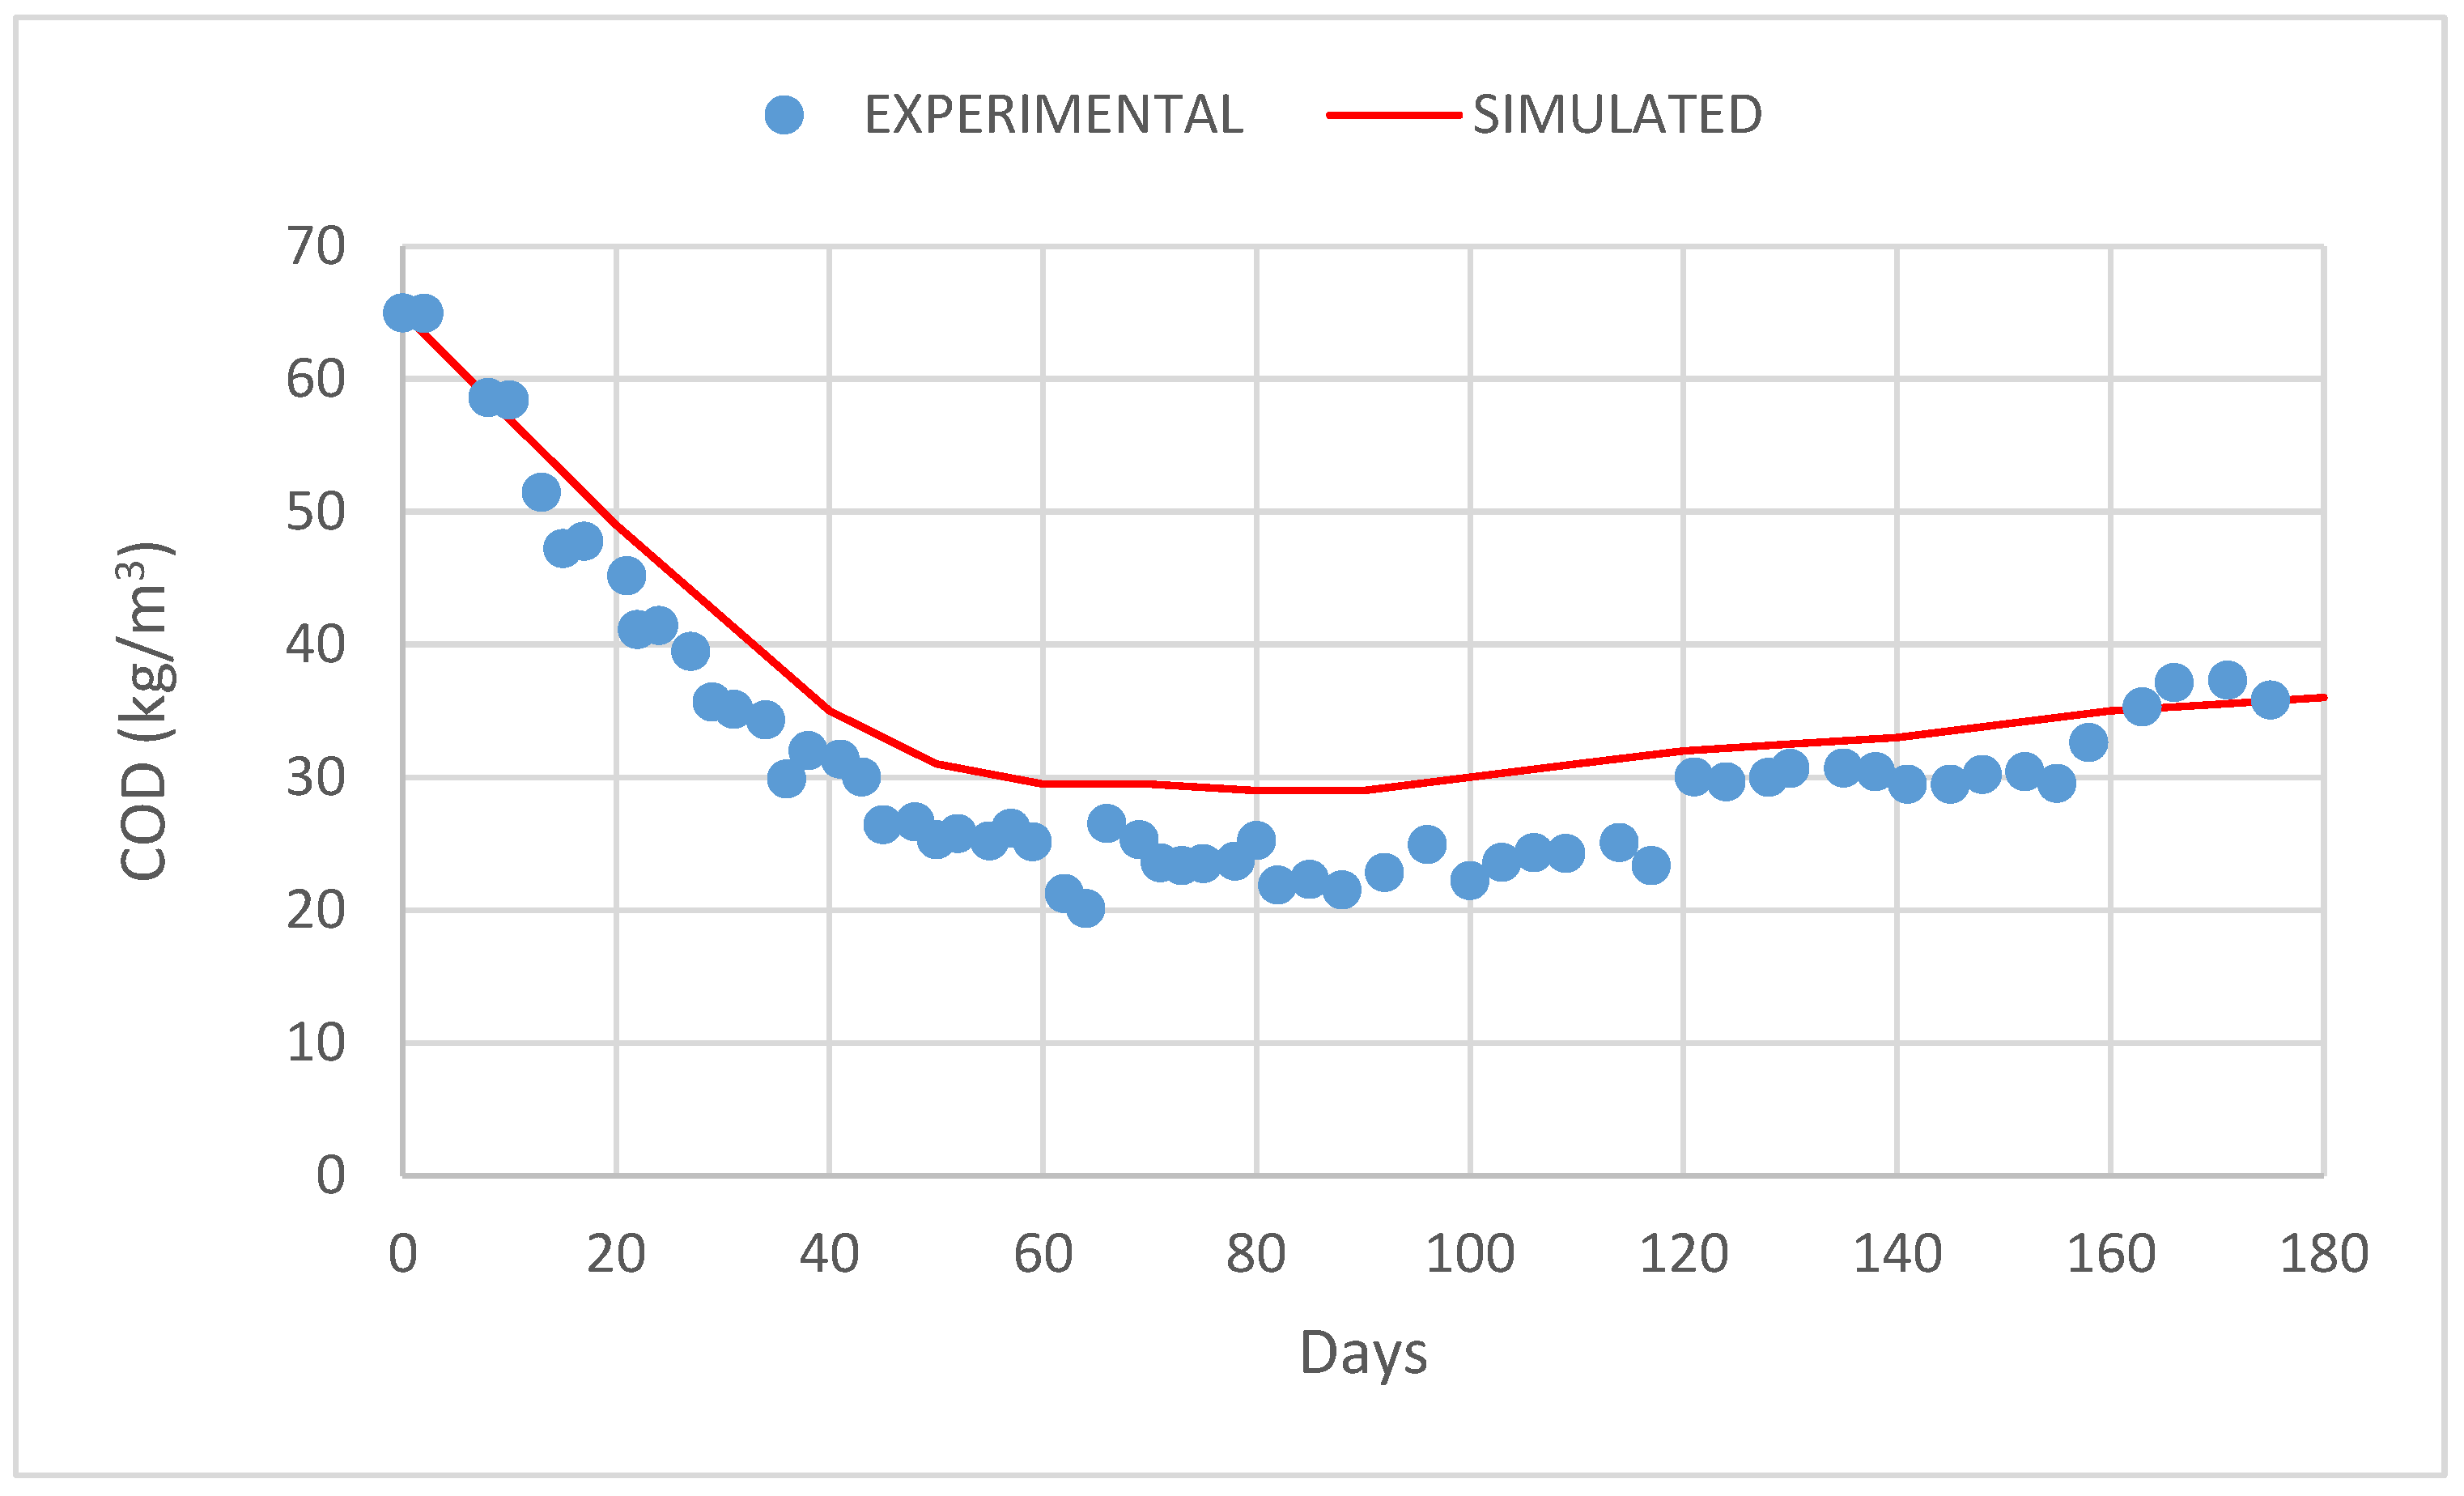
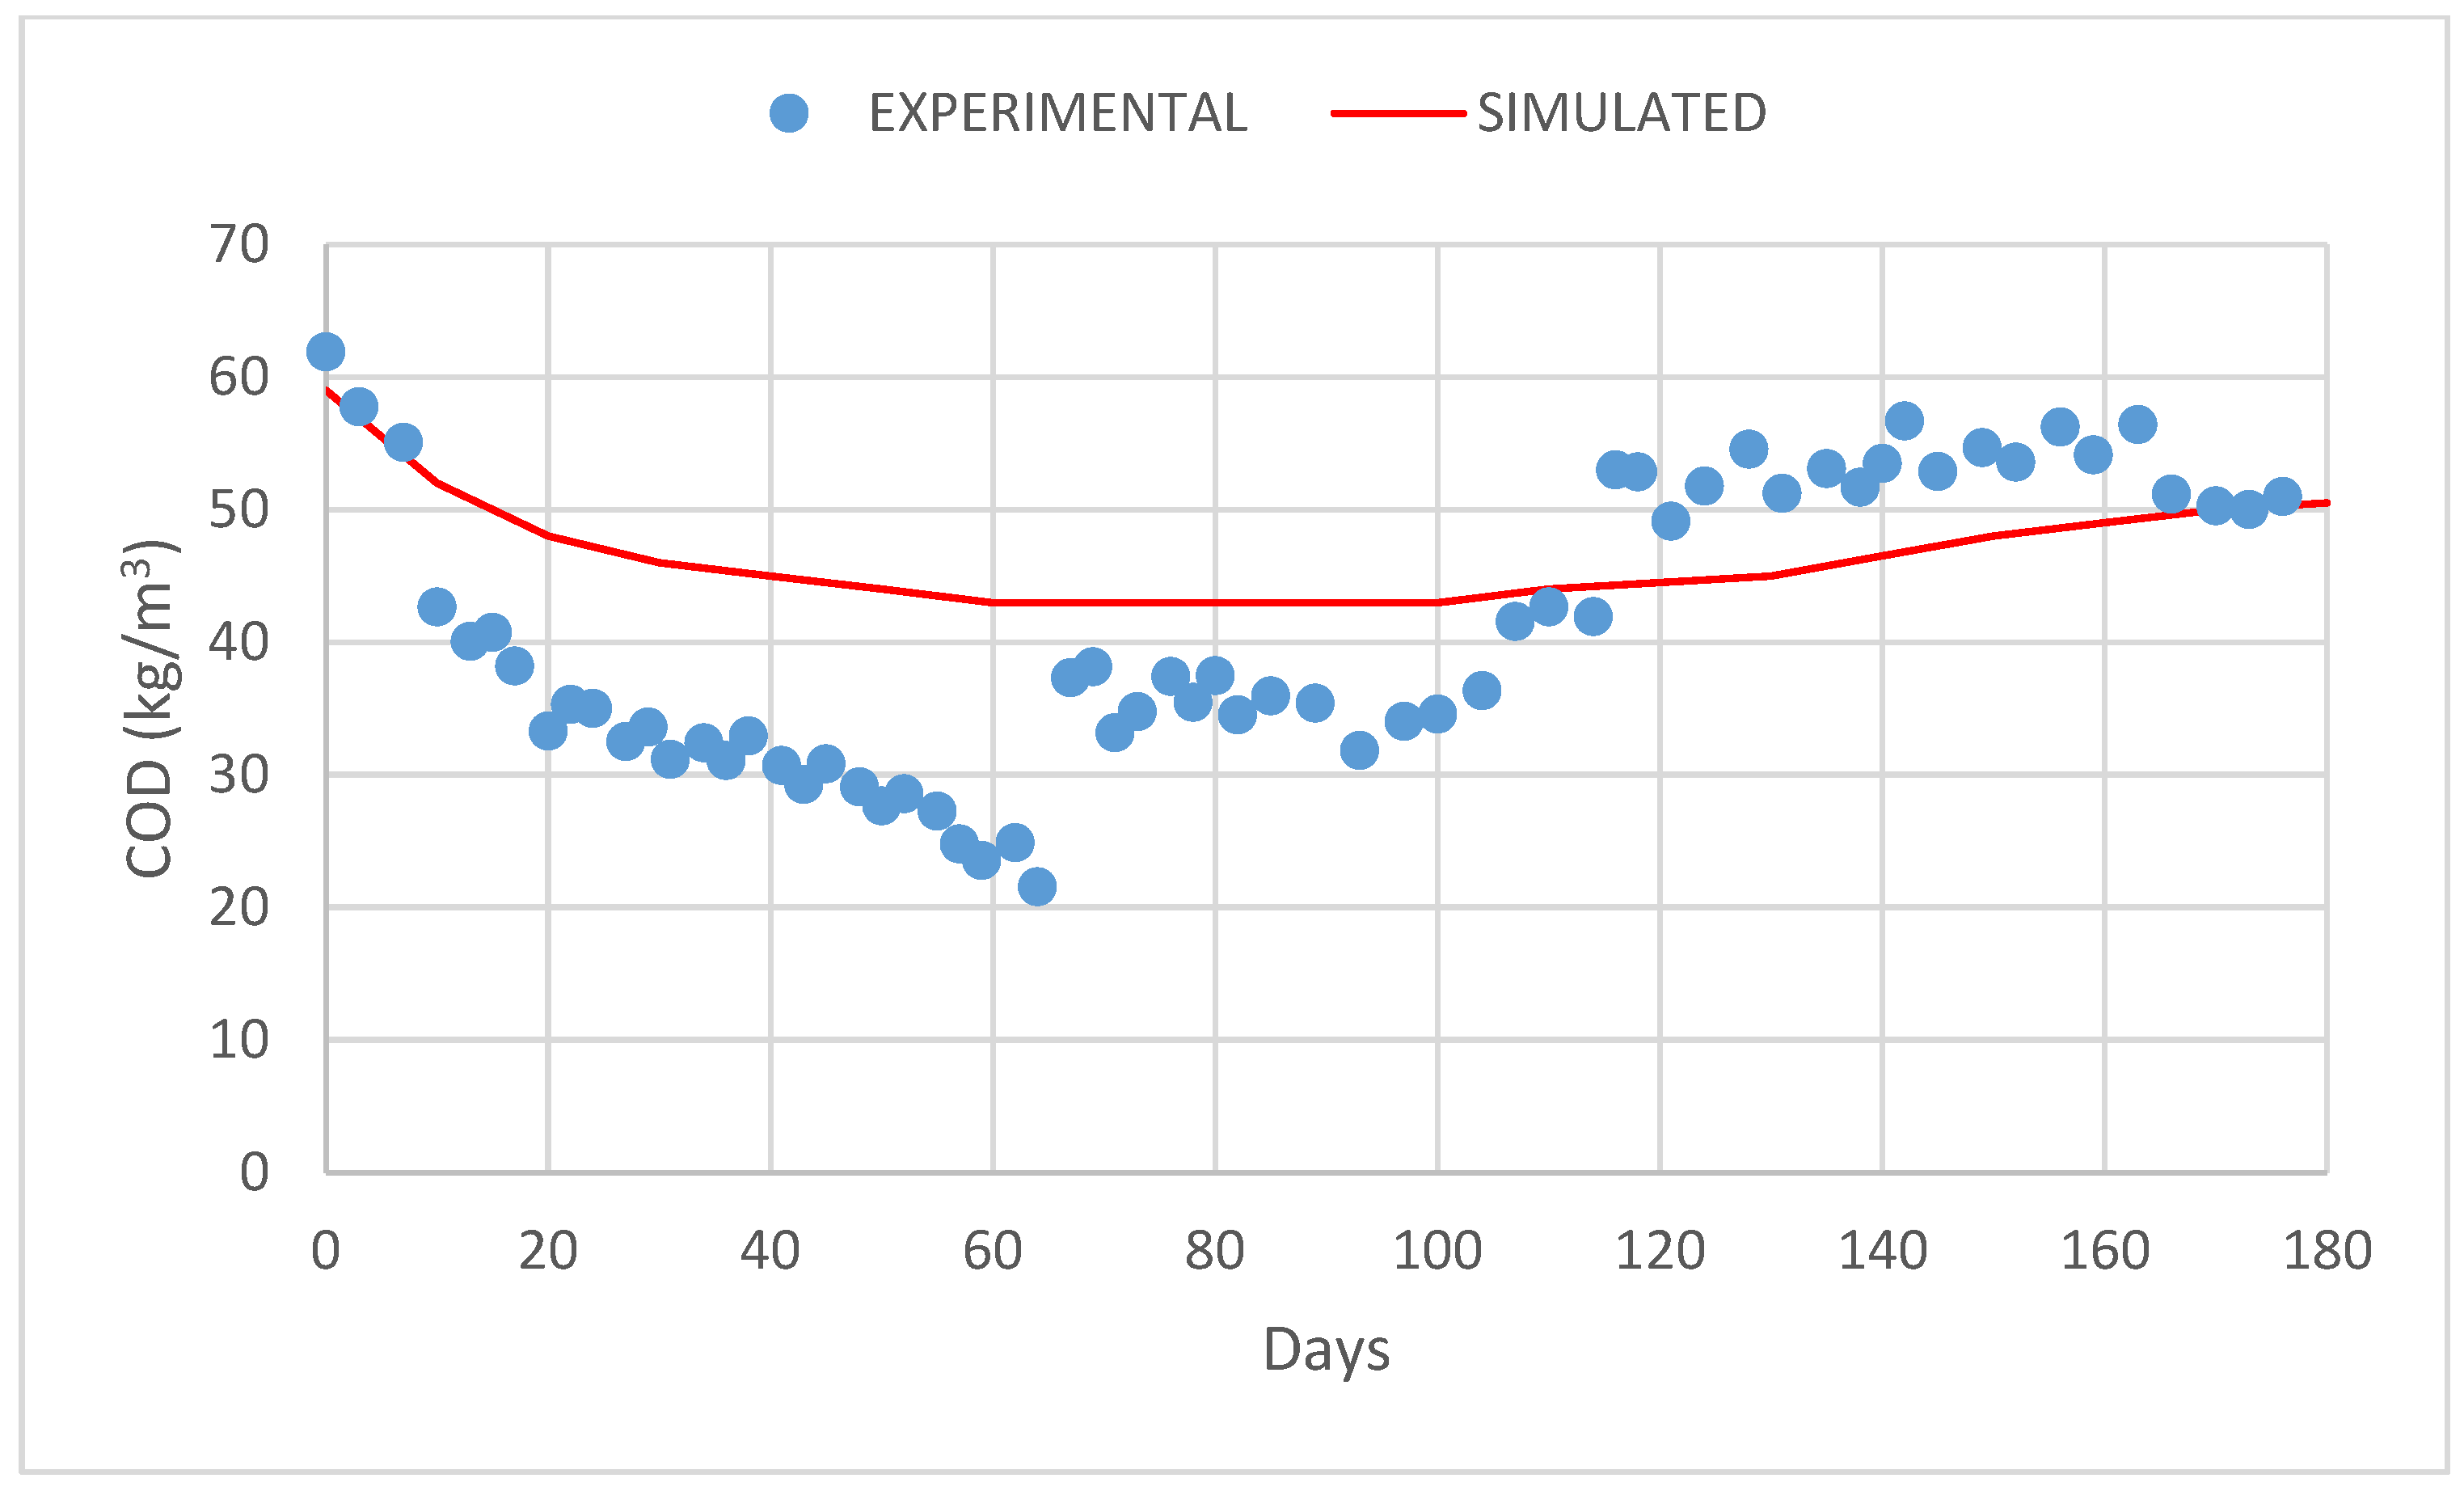
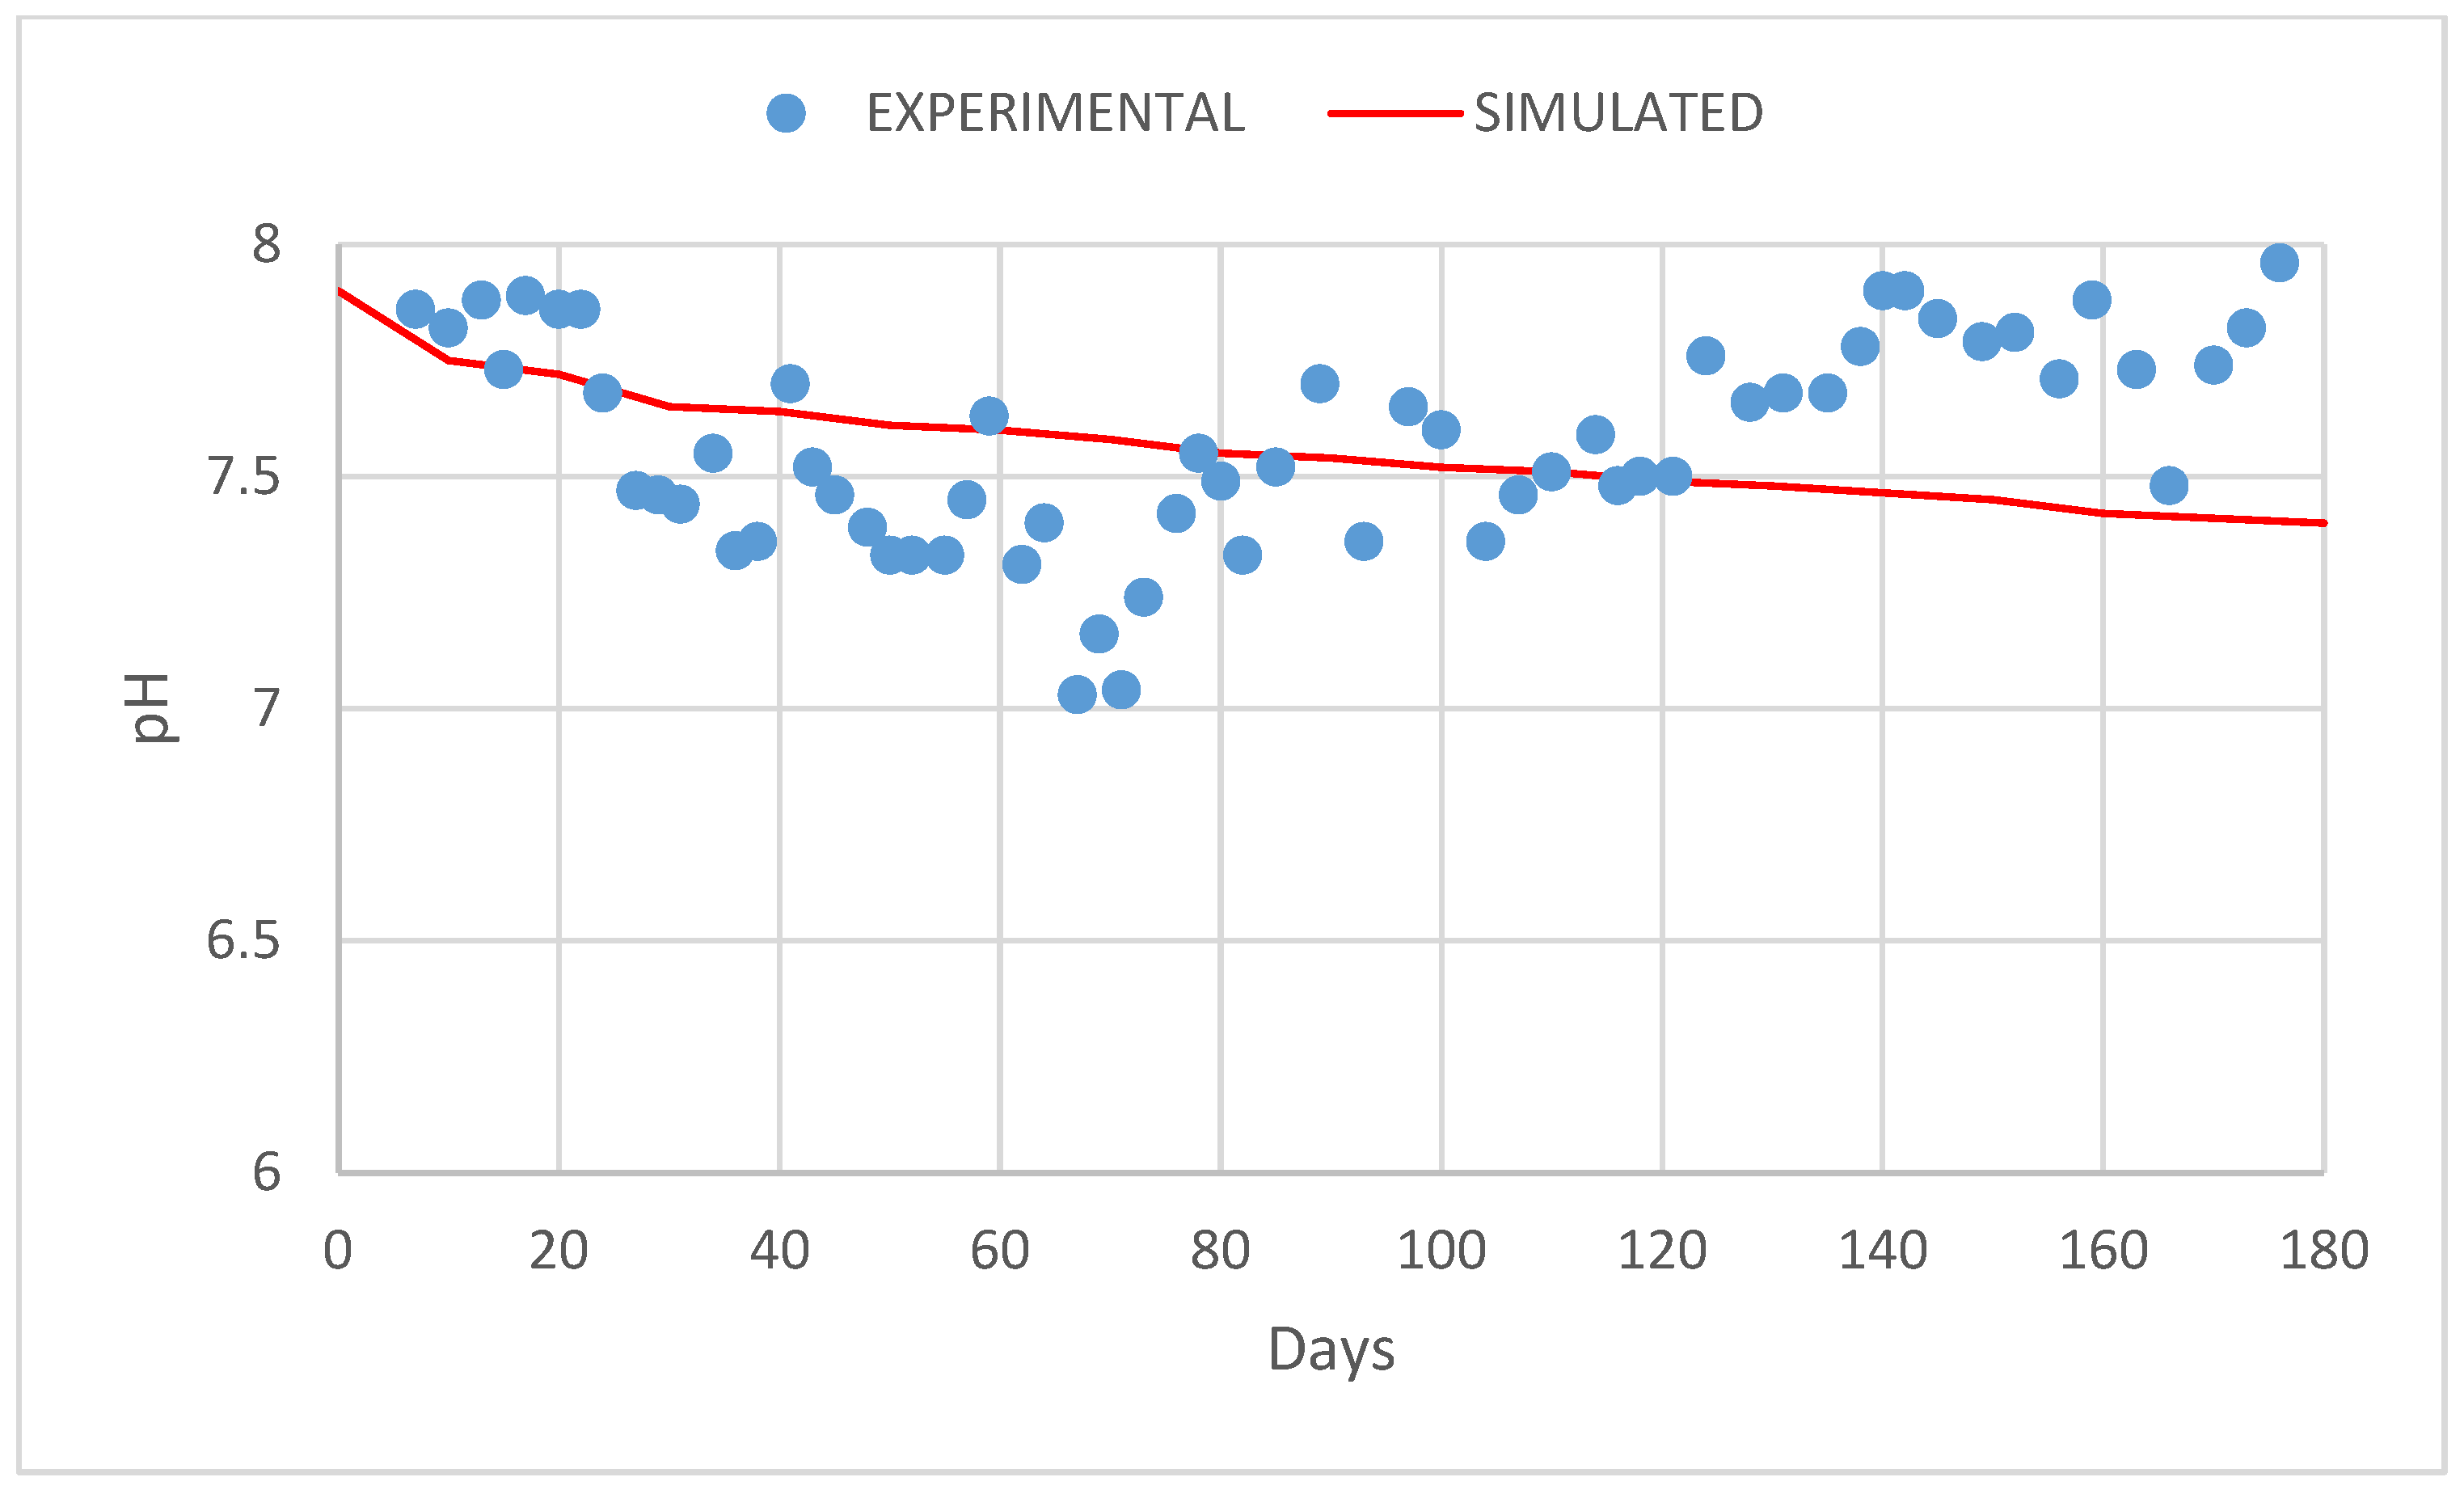
For a comprehensive model validation, numerous additional simulations were conducted for the reactors established for both southern and northern Greece. The comparison between theoretical and experimental results encompassed biogas production (Figure 5 and Figure 6), COD evolution (Figure 7 and Figure 8), and pH levels in the reactors (Figure 9 and Figure 10). This extensive comparison further strengthens the validation process, offering a holistic assessment of the model’s predictive capabilities across different reactors and operational conditions.
The comparison depicted in Figure 5 and Figure 6 demonstrates good qualitative agreement, underscoring the prowess of ADM1 as a robust simulation tool for predicting alternative fuel production through digestion processes. However, the agreement slightly diminishes when scrutinizing COD results due to the intricate relationship between the parameters involved and COD itself, leading to errors of high order. Nonetheless, the agreement in pH measurements remains very good, affirming the model’s accuracy in predicting pH variations within the reactors. This comprehensive evaluation provides a nuanced understanding of the model’s performance across different output parameters, enhancing its reliability for predicting anaerobic digestion outcomes.

4. Conclusions

The ADM1 model, as applied and appropriately modified in this project, stands out as the most comprehensive model for simulating the anaerobic digestion process, providing a robust foundation for the future development of intricate kinetic models. Despite the inherent complexity of ADM1 and the multitude of input parameters required, this study demonstrates its efficacy in simulating laboratory-scale anaerobic reactors.
The model exhibits a high degree of accuracy in predicting total COD concentrations in the reactors, with a minimal difference of less than 9.1% between experimental and simulated data. Additionally, methane production was satisfactorily forecast by the ADM1 code, yielding values within the same order of magnitude as experimental data. The simulation of pH levels, acknowledged as a challenging aspect, attains a high level of agreement with experimental observations. Throughout the experiment, the difference between experimental and simulated pH values remains generally below 5%, signifying a high level of accuracy and acceptability. This attests to the ADM1 model’s capability to successfully predict and simulate key parameters in anaerobic digestion processes.
The adaptable modified ADM1 model holds potential for extending its application beyond agriculture residues to various industrial and municipal waste streams. For successful application, it is necessary firstly to carry out a specific number of experiments to estimate some of the necessary parameters involved (biomass composition, flowrate). Then, by applying the crucial values of certain parameters to the modified algorithm, it could be rather easy to obtain simulated results regarding biogas properties.

Author Contributions

All authors contributed to the study’s conception and design. Material preparation, data collection, and analysis were performed by E.P., G.N.P. and D.E.M. The first draft of the manuscript was written by V.G.P. and F.A.C., and all authors commented on previous versions of the manuscript. All authors have read and agreed to the published version of the manuscript.

Funding

The authors declare that no funds, grants, or other support were received during the preparation of this manuscript.

Data Availability Statement

Data is contained within the article in the Figures themselves. Further inquiries can be directed to the corresponding author to make data available on request.

Conflicts of Interest

The authors have no relevant financial or non-financial interests to disclose.

References

  1. Moustakas, K.; Parmaxidou, P.; Vakalis, S. Anaerobic digestion for energy production from agricultural biomass waste in Greece: Capacity assessment for the region of Thessaly. Energy 2020, 191, 116556. [Google Scholar] [CrossRef]
  2. Kumar, D.J.P.; Mishra, R.P.; Chinnam, S.; Binnal, P.; Dwivedi, N. A comprehensive study on anaerobic digestion of organic solid waste: A review on configurations, operating parameters, techno-economic analysis and current trends. Biotechnol. Notes 2024, 5, 33–49. [Google Scholar] [CrossRef]
  3. Bong, C.P.C.; Lim, L.Y.; Lee, C.T.; Klemes, J.J.; Ho, C.S.; Ho, W.S. The characterization and treatment of food waste for improvement of biogas production during anaerobic digestion—A review. J. Clean. Prod. 2018, 172, 1545–1558. [Google Scholar] [CrossRef]
  4. González, R.; Carrillo Peña, D.; Gómez, X. Anaerobic Co-Digestion of Wastes: Reviewing Current Status and Approaches for Enhancing Biogas Production. Appl. Sci. 2022, 12, 8884. [Google Scholar] [CrossRef]
  5. Vasiliadou, I.A.; Gioulounta, K.; Stamatelatou, K. Production of biogas via anaerobic digestion. In Handbook of Biofuels Production, 3rd ed.; Woodhead Publishing: Sawston, UK, 2023; pp. 253–311. [Google Scholar]
  6. Weinrich, S.; Nelles, M. Systematic simplification of the anaerobic digestion model No. 1 (ADM1)—Model development and stoichiometric analysis. Bioresour. Technol. 2021, 333, 125124. [Google Scholar] [CrossRef] [PubMed]
  7. Reichert, P. AQUASIM—A tool for simulation and data analysis of aquatic systems. Water Sci. Technol. 1994, 30, 21–30. [Google Scholar] [CrossRef]
  8. Batstone, D.J.; Keller, J.; Angelidaki, I.; Kalyuzhnyi, S.V.; Pavlostathis, S.G.; Rozzi, A.; Sanders, W.T.; Siegrist, H.; Vavilin, V.A. The IWA Anaerobic Digestion Model No 1 (ADM1). Water Sci. Technol. 2002, 45, 65–73. [Google Scholar] [CrossRef] [PubMed]
  9. Liu, X.; Coutu, A.; Mottelet, S.; Pauss, A.; Ribeiro, T. Overview of Numerical Simulation of Solid-State Anaerobic Digestion Considering Hydrodynamic Behaviors, Phenomena of Transfer, Biochemical Kinetics and Statistical Approaches. Energies 2023, 16, 1108. [Google Scholar] [CrossRef]
  10. Emebu, S.; Pecha, J.; Janacova, D. Review on anaerobic digestion models: Model classification & elaboration of process phenomena. Renew. Sustain. Energy Rev. 2022, 160, 112288. [Google Scholar]
  11. Aravani, V.; Tsigkou, K.; Papadakis, V.G.; Kornaros, M. Biochemical Μethane Potential of Most Promising Agricultural Residues in Northern and Southern Greece. Chemosphere 2022, 296, 133985. [Google Scholar] [CrossRef] [PubMed]
  12. Aravani, V.; Tsigkou, K.; Papadakis, V.G.; Wang, W.; Kornaros, M. Anaerobic Co-Digestion of Agricultural Residues Produced in Southern and Northern Greece. Fermentation 2023, 9, 131. [Google Scholar] [CrossRef]
  13. Parker, W.J. Application of the ADM1 model to advanced anaerobic digestion. Bioresour. Technol. 2005, 96, 1832–1842. [Google Scholar] [CrossRef] [PubMed]
  14. Fukuyama, Y.; Inoue, M.; Omae, K.; Yoshida, T.; Sako, Y. Chapter Three—Anaerobic and hydrogenogenic carbon monoxide-oxidizing prokaryotes: Versatile microbial conversion of a toxic gas into an available energy. In Advances in Applied Microbiology; Gadd, G.M., Sariaslani, S., Eds.; Academic Press: Cambridge, MA, USA, 2020; Volume 110, pp. 99–148. [Google Scholar]
  15. Waszkielis, K.; Białobrzewski, I.; Bułkowska, K. Application of anaerobic digestion model No. 1 for simulating fermentation of maize silage, pig manure, cattle manure and digestate in the full-scale biogas plant. Fuel 2022, 317, 123491. [Google Scholar] [CrossRef]
  16. Haugen, F.; Bakke, R.; Lie, B. Adapting dynamic mathematical models to a pilot anaerobic digestion reactor. Model. Identif. Control. 2013, 34, 35–54. [Google Scholar] [CrossRef]
Figure 1. Experimentally measured and simulated COD values in the southern Greece spring–summer reactor.
Reactions 05 00017 g001
Figure 2. Biogas volumetric flow rate in the southern Greece spring–summer reactor.
Reactions 05 00017 g002
Figure 3. The simulated adjusted gas pressures of the southern Greece spring–summer reactor.
Reactions 05 00017 g003
Figure 4. pH in the southern Greece spring–summer reactor.
Reactions 05 00017 g004
Figure 5. Biogas production for the southern Greece fall–winter reactor.
Reactions 05 00017 g005
Figure 6. Biogas methane production for the northern Greece reactor.
Reactions 05 00017 g006
Figure 7. COD per day for data from the southern Greece fall/winter reactor.
Reactions 05 00017 g007
Figure 8. COD per day for data from the northern Greece reactor.
Reactions 05 00017 g008
Figure 9. pH data from the southern Greece fall–winter reactor.
Reactions 05 00017 g009
Figure 10. pH data from the northern Greece reactor.
Reactions 05 00017 g010
Table 1. Definition of the feed used in ADM1.
TypeSymbolValueUnits
Soluble
Degradable COD *Real list variableInput_S_COD~18–33kg COD/m3
Sugars *Real list variableInput_S_su_in~8–20kg COD/m3
Inorganic carbon **Constant variableInput_S_IC_in0.005kmol/m3
Inorganic nitrogen **Constant variableInput_S_IN_in0.065kmol/m3
Particulate
Degradable COD *Real list variableInput_X_COD~8–33kg COD/m3
Carbohydrates *Real list variableInput_X_ch_in~11–41kg COD/m3
Degradable pCOD *Through equationInput_X_I_in=Input_×_COD-Input_×_ch_inkg COD/m3
* Based on reactor’s mixture of nutrients during the experiment. ** Default values.
Disclaimer/Publisher’s Note: The statements, opinions and data contained in all publications are solely those of the individual author(s) and contributor(s) and not of MDPI and/or the editor(s). MDPI and/or the editor(s) disclaim responsibility for any injury to people or property resulting from any ideas, methods, instructions or products referred to in the content.