Abstract
Continuous flow calorimeters are a promising tool in process development and safety engineering, particularly for flow chemistry applications. An isoperibolic flow calorimeter is presented for the characterization of exothermic reactions. The calorimeter is adapted to commercially available plate microreactors made of glass and uses Seebeck elements to quantify the heat of reaction. For automation of calibration procedures and calorimetric measurements, the device is connected to a lab automation system. Reaction enthalpy of exothermic reactions is determined via an energy balance of the entire calorimeter. Characterization of reaction kinetics is carried out via a local balancing of the individual Seebeck elements without changing the experimental setup, while using the previous measurements and additional ones at higher flow rates. The calorimeter and the associated measurement procedures were tested with the oxidation of sodium thiosulfate using hydrogen peroxide. Reaction enthalpy was determined to be 594.3 ± 0.7 kJ mol−1, which is within the range of literature values.
1. Introduction
Flow calorimetry with a software-guided workflow is a promising tool for fast and reliable characterization of strongly exothermic reactions with respect to their thermodynamic and kinetic parameters. Traditionally, these parameters are determined by a series of experiments in batch reactors. Batch experiments are not advantageous for both safety and economic considerations, as comparatively large reactor volumes are involved. This creates an urgent need for methods to assess thermokinetic data based on microscale experiments. Isoperibolic reaction calorimetry is characterized by the fact that it is the simplest mode of operation in terms of process control and the equipment required [1]. Another advantage of this operation mode is the possibility to easily record simultaneous processes with regard to their hazard potential for an operational process [2]. Temperature-dependent mechanistic changes are also usually easy to recognize in the course of the reaction, which occur more frequently in heterogeneous processes [2]. For isoperibolic microcalorimeters based on Seebeck elements, the measurement of the heat flux is carried out by determining the temperature difference between the reaction and the cooling medium. The exception here is that a defined part of the heat flux that leaves the reactor via the wall is measured directly with the Seebeck elements. Hence, the heat flux is not determined via the “workaround” of a temperature difference measurement and subsequent calculation with the mostly unknown heat transfer coefficient [3].
Moore and Jensen [4] presented transient flow experiments using residence time or temperature ramps to accelerate the determination of kinetic data [5]. The steady state no longer needs to be waited for, saving both long and material-intensive experimentation. However, these experiments are performed with process analytical technology tools to the microreactor to determine conversion. The method has been applied with various analytical procedures such as Raman measurements [6,7], HPLC analysis [8,9,10], and FTIR measurements [11,12]. Continuous flow calorimetry is also a promising tool to estimate reaction conversion from the heat released [13]. In particular, spatially resolved reaction calorimetry, as developed by several groups [14,15,16,17,18,19,20,21,22], allows one to follow the reaction progress along the channel and enables thermokinetic characterization of chemical processes. Despite the recording of spatially resolved heat flux profiles, the calorimetric measurement data were often only used for an energy balance of the system to determine the enthalpy of reaction [12,17,18,19,20]. Schneider and Stoessel [23] presented a calorimetric method to determine global kinetics of exothermal reactions and their activation energy. The conversion at the reactor outlet was estimated by setting the measured heat flux in relation to the heat flux at complete conversion.
In this work, an automated microfluidic reaction calorimeter based on thermoelectric elements for spatial heat flux resolution is used for reaction characterization. Two different measurement techniques are applied to characterize an exothermic test reaction. In the first, a total energy balance is performed around the system to determine the enthalpy of reaction in steady state operation. In this method, experiments with complete conversion are estimated based on the heat flux profile and the heat flux distribution. In the second, kinetic data is determined exclusively using a fully calorimetric approach using a compartment modelling approach. The thermoelectric elements are energy balanced individually, whereby respective reactor compartments are assumed as isothermal reactors despite overall isoperibolic operation. This combines the advantages of the isoperibolic operation mode with the possibility to determine kinetic data in isothermal mode. In this manuscript, the calorimeter’s setup, automation, and calorimetric methods, and its application are presented on the oxidation of sodium thiosulfate (NaTS) using hydrogen peroxide (HP) as a test reaction.
2. Materials and Methods
2.1. Calorimeter and Experimental Setup
The microcalorimeter’s basic design is a modified version from previous work by Reichmann et al. and Frede et al. [17,19]. The setup of the microcalorimeter used in this work is shown in Figure 1a in an exploded view.
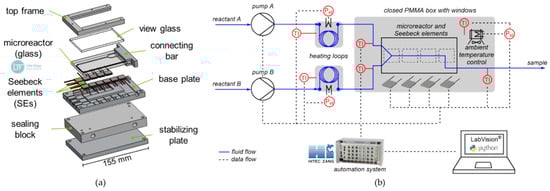
Figure 1.
(a) Exploded view of the microcalorimeter; (b) Experimental setup used for calorimetric measurements.
The microcalorimeter itself consists of a commercially available plate microreactor, twelve Seebeck elements (SEs), a temperature-controlled base plate, a sealing block, a view glass, a top frame, and a stabilizing plate at the bottom. In this work, the base plate is adapted to microreactors of the MR-Lab series from Little Things Factory, Elsoff, Germany. The adapted design is shown in Figure 1a, with the microreactor used (LTF-MS, MR-Lab series, Little Things Factory, Elsoff, Germany). Compared to previous work, the reactor volume is 1.6 times as large, as it features a residence time section after the mixing section. This allows slower reactions to be investigated compared to instantaneous neutralization reactions. In total, twelve SEs are positioned along the reaction channel to obtain locally resolved heat flux profiles. The elements are numbered, with SE1 being closest to the inlet and SE12 closest to the outlet. The base plate provides a reference temperature for the SEs at one side, which is required for accurate measurements. Therefore, a meander-shaped cooling channel is milled into the bottom side through which water is guided as a cooling medium. The base plate is made of aluminum to ensure high thermal conductivity to the SEs. The sealing block seals the cooling channel from below and contains the connections for the cooling medium. Besides the microcalorimeter, additional equipment is needed to perform automated calorimetric measurements. Optical accessibility of the reactor is ensured by the poly(methyl methacrylate) (PMMA) view glass, which also insulates the microreactor from above. The microreactor and the view glass are fixed by the top frame and pressed onto the SEs with seven screws. The complete experimental setup for calorimetric measurements is shown schematically in Figure 1b. First, the fluid flows, which are shown as blue lines in Figure 1b, are described. Syringe pumps (VIT-FIT, Lambda Instruments, Baar, Switzerland) are used to feed the reactants from storage flasks into the microreactor. To control the inlet temperature of the reactants, two preheating loops are used. Therefore, the fluorinated ethylene propylene (FEP) tubing is wrapped around an aluminum cylinder, which is heated by a heating cartridge ( = 6 mm, = 20 mm, = 40 W, Keycoon, Frankfurt am Main, Germany). This allows for higher inlet temperatures even at low volume flows than with conventional temperature control using a thermostatic bath. In addition, the individual feed streams can be preheated individually to different temperature levels, if necessary. The electrical power is provided by a laboratory power supply unit (320-KA3305P, RND Lab, Nänikon, Switzerland). Right before the reactants enter the reactor, the temperature in the stream is measured with temperature sensors ( = 1 mm, Pt100, Rössel Messtechnik, Werne, Germany) integrated into T-junctions. The heat of reaction along the reaction channel is measured with a total of twelve Seebeck elements (QC-31-1.0-3.0M, Quick-Ohm Küpper & Co., Wuppertal, Germany). The use of SEs as heat flux sensors in microfluidic reaction calorimeters is well described in the literature [12,17,20]. The SEs are calibrated by an automated procedure using electrical heating prior to the measurements. The calibration procedure is analogous to previous work [19]. The outlet temperature of the flowing fluid is also measured within the stream to close the energy balance. A thermostat (Ministat 125, Peter Huber Kältemaschinenbau, Offenburg, Germany) is used to set the temperature of the base plate, which ensures a constant reference temperature of the SEs on the underside. The microcalorimeter is placed into a closed box to minimize environmental influences, which is indicated in the figure as a gray box. The closed box consists of an aluminum profile (300 × 300 × 300 mm3) with PMMA walls.
Furthermore, a heating module is used within the box to ensure a constant ambient temperature. The heating module consists of heating foils ( = 90 mm, = 15 W, Thermo Tech, Denver, CO, USA) glued onto cooling fins (SK 72, Fischer Elektronik, Lüdenscheid, Germany), and their heat is distributed by two fans (Xi XF032, Xilence, Hildesheim, Germany). The variable power of the heating foils is set via a laboratory power supply unit (320-KA3005D, RND Lab).
All sensors and actuators are connected to a lab automation system (LabManager, HiTec Zang, Herzogenrath, Germany) to enable automated calorimetric measurements.
2.2. Automation Strategy
The entire setup is controlled with the LabManager. This means, for example, that the volume flow of the pumps can be set, or the thermoelectric voltage can be read out. The modular visualization and automation software LabVision (HiTec Zang) is used to automate the experimental processes and to generate a graphical user interface for the operator. A software-guided workflow is established to realize automated experimental planning, execution, and evaluation. The workflow starts with the experimental design, which distinguishes between a mode for calibration of the SEs, hot water runs for the thermal characterization of the system, and investigation of chemical processes. Subsequently, the experimental parameters to be investigated, such as volume flow of the pumps and inlet temperature of the feed streams, must be specified for the planned measurements. This is done in a comma separated values (CSV) file with a predefined structure. The data is imported by the lab automation system with associated software. The experiments are carried out in the specified order and with the specified parameters. The graphical user interface visualizes current measured values for the operator and thus enables manual intervention in case of undesired process conditions. Finally, the automated evaluation takes place after the measurement based on the mode selected at the beginning. For the calibration of the SEs and the thermal characterization, the data is saved directly in a CSV file, as it is required for the evaluation of chemical processes. In the latter, diagrams are provided to the the operator to illustrate the main insights of the experiments. For example, the calculated reaction enthalpy is plotted over the volume flow and, if available, compared with a literature value.
2.3. Assessment of Kinetics in Flow
The measurement of enthalpy of reaction is the first step for the determination of reaction kinetics. Its determination by flow calorimetry has been demonstrated in a very similar setup in previous works [17,18,19,24] and by other research groups [12,20,21,22,25]. For the determination of kinetic data, a new methodology is now being applied to determine kinetics in flow, which is derived from the approach of Moore and Jensen [4]. Typically, kinetic studies are carried out under nearly isothermal conditions. This mode features the advantage that kinetics depends only on the concentrations as the temperature is constant [26]. Therefore, the heat produced has to be removed from the reactor to maintain the desired temperature level. However, it is very challenging to realize quasi-isothermal conditions for the presented setup. Hence, an approach is developed to obtain kinetic data under isoperibolic conditions. To approximate isothermal operation, a change is performed from a global energy balance of the system to a local balance of each individual SE, as shown in Figure 2.
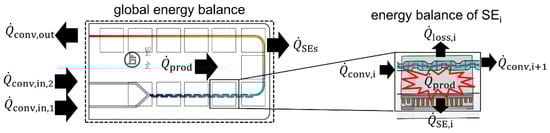
Figure 2.
Shift from global to local energy balance of the system.
Using local heat balances, the individual conversions inside twelve reactor elements are obtained. The energy balance of a respective SE is stated in Equation (1), where is the change of energy over the time in the system under consideration.
In Equation (1), and represent the in- and outgoing convective heat fluxes brought into the system by the flowing fluid. The heat flux measured by the respective SE is given by . The energy brought into the system by the chemical reaction is described by . The heat loss over the top of the reactor is represented by .
Since steady state experiments are performed, Equation (1) can be solved for the heat of reaction resulting in Equation (2).
The measured heat flux of the Seebeck elements is corrected by prior calibration. In addition, the thermal resistances are determined beforehand, which allows for the estimation of heat loss . Here, thermal resistances are not determined experimentally. Instead, Nusselt number is used, which features a constant value of 3.66 for fully developed laminar and single-phase flow with constant wall temperature in cylindrical channels. This approach is valid for flow rates less than 750 µL min−1 for the microreactor used in this study [27]. With this information and the heat flow profile along the reactor, the temperature inside the reactor element can be estimated. The conversion above the corresponding SE can be calculated using Equation (3), as long as the reaction enthalpy is known. In addition, the volumetric flow rate and the concentration of the limiting component are used in Equation (3), which represent experimental settings chosen by the operator.
The concentration within the respective reactor element is determined by balancing the previous element and its conversion. Reactor elements, in which full conversion is estimated, are not taken into consideration. For the determination of kinetic parameters based on the conversion rate, it is assumed that the temperature inside each reactor element is constant. Since the reactor is operated isoperibolically, this does not reflect reality. However, the assumption is permissible due to the small volume of each element, the resulting short residence time inside, and the overall small amount of heat released due to low flow rates. The equations to calculate the kinetic constant are given for reactions of first- and second order in Equations (4) and (5).
Here, is the time since the start of reaction, the conversion, and and are the initial concentrations of components A and B. The frequency factor and the activation energy are subsequently obtained by linearization of the Arrhenius equation.
2.4. Oxidation of Sodium Thiosulfate
The oxidation of NaTS with HP was chosen as a test reaction to study the assessment of kinetics in flow using micro calorimetry because of its ease of use and high exothermicity. Moreover, the chemicals are commonly available and neither the reactants nor the products are toxic. Although several research groups investigated this reaction, thermokinetics and reaction mechanisms are not yet fully investigated [28,29,30,31]. The most likely mechanism is stated in Equation (6). An overview of the investigations and reaction mechanisms established can be found in the work of Gelhausen et al. [32].
Cohen and Spencer [33] discovered that the maximum temperature rise occurred at a molar ration of HP to NaTS of 2:1. Therefore, this ratio is used to provide a maximal signal and increase accuracy for measurements. Assuming a first order kinetic regarding NaTS and HP, several research groups determined the kinetics listed in Table 1.

Table 1.
Thermokinetic parameter of the oxidation of NaTS with HP, determined by calorimetric investigations under the assumption of a constant pH value during the reaction.
2.5. Experimental Procedure
Before starting an experiment, the temperature of the base plate and the enclosure are set to the desired temperature level. At first, the baseline signals of the SE are collected. Therefore, the pumps for the reactants are set to the desired flow rates and the temperature of the preheating loops is set to the desired temperature. Water is used as a medium for the recording of the baseline signals, as aqueous solutions are used for the subsequent calorimetric measurement. After this, the system waits for a steady state, which is reached when each SE voltage does not change more than 0.5% in a time span of 10 s. Once steady state is reached, all sensor data is recorded separately for 180 s. Every measurement point is recorded in triplets.
For the determination of reaction enthalpy and kinetic data, the reactants are prepared according to the reaction system. For the oxidation of sodium thiosulfate, one feed contains NaTS with a concentration of = 1.0 M (made from Na2S2O3, 99%, Merck KGaA, Darmstadt, Germany) and the other feed contains hydrogen peroxide with a concentration of 2.2 M HP (made from 30% H2O2 solution, Merck KGaA, Darmstadt, Germany). In this work, these concentrations were used in all experiments. The reaction is investigated at the desired volumetric flow rates and temperature levels. The procedure for each measurement point is the same as for the baseline signal collection. Here, the measurements are taken in steady state, too. The stationary criterion is also a deviation of each SE voltage below 0.5% within a time span of 10 s. In steady state, the measurement is continued for 180 s to perform a steady state average. The measurements are carried out in triplicate. After the measurements are completed, the entire system is cleaned by flushing it with water.
3. Results and Discussion
3.1. Determination of the Reaction Enthalpy
The base plate, ambient, and inlet temperature were set or controlled to 25 °C, respectively. For calorimetric measurements, total volumetric flow rates were set to 31, 61, 89, and 178 µL min−1 using concentrations of = 1.0 M and = 2.2 M. A flow rate ratio of HP solution to NaTS solution of 1:1 was used. The heat flux profile of these experiments is shown in Figure 3a.
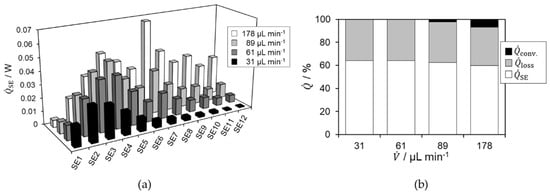
Figure 3.
(a) Spatially resolved heat flux profile for sodium thiosulfate oxidation using hydrogen peroxide in LTF-MS obtained in steady state; (b) Heat flux distribution for total obtained heat fluxes.
In general, an initially increasing and subsequently decreasing heat flux profile is observed. An exception is the measurement at 178 µL min−1. There, a further increase can be seen above SE7, followed by a decreasing but fluctuating drop in the profile towards the reactor outlet. In addition, higher amplitudes of heat fluxes are observed for higher volumetric flow rates. As the volumetric flow rate increases, the maximum possible released heat of reaction also increases according to Equation (3). Consequently, the individual signals of the Seebeck elements also increase. The increase above SE7 is due to a larger projection area and the bend in the reaction channel, which is located above SE7. The centrifugal forces inside the bend lead to a sudden enhancement in mixing [37]. This leads to a peak in conversion and heat release. With increasing heat release, the reaction rate also increases again, which is why the measured signals are comparatively high [38]. The fluctuations beyond SE7 can be explained by an insufficient steady state during the of measurement. For 178 µL min−1, a strong peak and higher heat generation can be observed in the residence time section of the reactor, indicating incomplete conversion.
For flow rates less than or equal to 89 µL min−1, the heat spot is close to the reactor inlet moving further to the outlet with higher flow rates. This is due to the decreasing residence time and thus the decreasing reaction progress with increasing flow rate, since flow behavior is almost identical. This is indicated by the Reynolds number, which is smaller than 5 for all flow rates. Therefore, stratified flow regime is present in which straight stream lines are evident and mixing occurs solely through diffusive mass transfer [39]. Based on the continuously decreasing heat flux profile, complete conversion is assumed within the microreactor for flow rates less than or equal to 89 µL min−1. This assumption is supported by the heat flux distribution of the individual measurement series, shown in Figure 3b. There, it is visible that the proportions of the heat fluxes are almost constant over the first three volume flows. Since no convective heat is recorded, or only 2.3% for 89 µL min−1, it can be assumed that the reaction is completed within the microreactor, since no more heat is released. For 178 µL min−1, the percentage of convective heat is 7.0%, indicating an ongoing heat release and thus, an incomplete reaction within the reactor.
The reaction enthalpy was calculated based on the respective calorimetric measurement and calculated heat fluxes, shown in Figure 4.
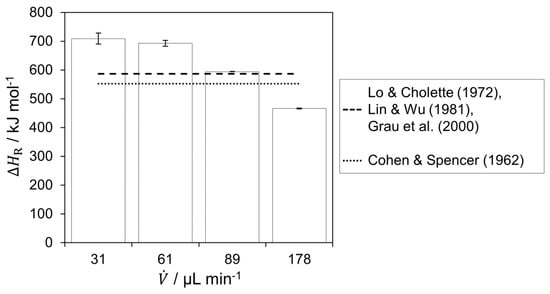
Figure 4.
Determined reaction enthalpy from the experiments for the respective flow rates and comparison with literature [33,34,35,36].
A decrease in the determined reaction enthalpy with increasing flow rate is observed. For a flow rate of 89 µL min−1, the determined value is closest to the literature values [34,35,36]. On the one hand, full conversion is assumed based on the heat flux profile and the heat flux distribution. On the other hand, there is a comparatively moderate in- and decreasing heat flux profile, which is favorable for calorimetric measurements. This results in more accurate absolute measurement of the heat fluxes through the SE and estimation of the heat losses, since in- and decreasing temperature profiles overlap less above an element. Thus, the reaction enthalpy was determined to be 594.3 0.7 kJ mol−1. The value obtained is in agreement with enthalpies reported in literature, which range between −552.3 and −586.2 kJ mol−1. The reaction enthalpy is assumed to be constant, which can be confirmed by comparing the results of different research groups over broad temperature and concentration ranges [33,34,36].
3.2. Determination of Kinetic Parameters
For the kinetic experiments, we investigated total volumetric flow rates of 178, 226, 335, 444, and 532 µL min−1. Volumetric flow rates higher than 89 µL min−1 were selected, since conversion is not expected there based on the previously shown results. This generates as many data points as possible for the compartment modelling approach and the subsequent Arrhenius plot. The flow rate levels result from the stepper motor used in the syringe pumps. Discrete steps are performed, which result in corresponding volumetric flow rates depending on the syringe employed. Hence, the volumetric flow rate is not freely selectable. The previously determined reaction enthalpy was used to estimate the conversion and temperature profile along the reactor, shown in Figure 5.
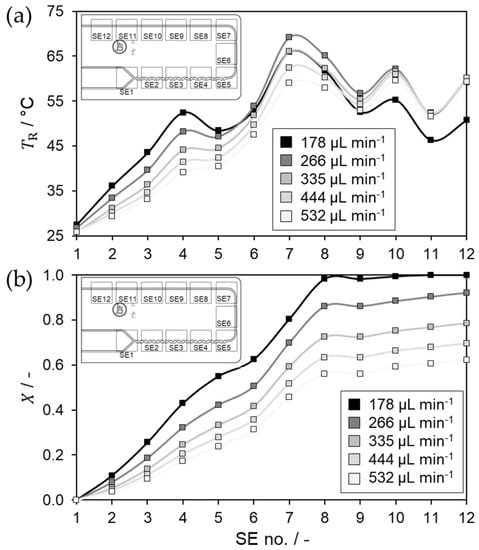
Figure 5.
(a) Modelled temperature profile for sodium thiosulfate oxidation using hydrogen peroxide in LTF-MS obtained in steady state; (b) Corresponding modelled conversion profile.
In general, it can be seen that the temperature profile does not differ considerably between the different volume flow rates. This is probably due to the mixing behavior, which is identical for all investigated flow rates, as stratified flow regime is observed [39]. However, balancing of the individual SEs leads to irregularities within the temperature profile. These can be observed at SE5 shortly after the mixing section and in the residence channel section from SE8 to SE12 towards the reactor outlet. The downward deviation at SE5 is probably due to two points. Firstly, the thermal resistances are estimated for the respective heat transfer direction. Among other things, constant thermal conductivities are assumed at 25 °C for glass, PMMA, and the SE. Since the local reactor temperature is in some cases above 65 °C and locally possibly even higher, this can lead to deviations. Secondly, the averaging of the reactor temperature above one SE itself can also lead to considerable deviations. The assumption of a constant reactor temperature, which is determined by averaging reactor in- and outlet temperature above the respective SE, therefore influences the determination of the kinetic constant and thus the reliability of the kinetic data. However, precise measurement of local reactor temperature in any number of locations is not possible in the microreactor system, or is associated with very high costs. The precision of the reactor temperature estimation can be increased by higher flow rates, which reduces the residence time above a compartment minimizing the error of temperature averaging. In addition, the concentration can be reduced to decrease the possible heat release and consequently the temperature differences within a compartment. Overall, a compromise must be made between residence time, the resulting conversion, and the amplitude of the measurement signals of the SEs, which decreases for low conversions. The increase from SE11 to SE12 is due to a set condition that the outlet temperature above SE12 must correspond to the measured outlet temperature measured within the stream.
Based on the conversion profiles, it can be seen that the reaction progress continuously increases significantly up to SE8 and then hardly increases at all thereafter, which is due to poor mixing in a straight channel. The small peak above SE8 is due to improved mixing directly after the deflection. Using the conversion above each SE, the kinetic constant is calculated. Therefore, a second order reaction is assumed with first order regarding each component HP and NaTS. The corresponding Arrhenius plot is shown in Figure 6.
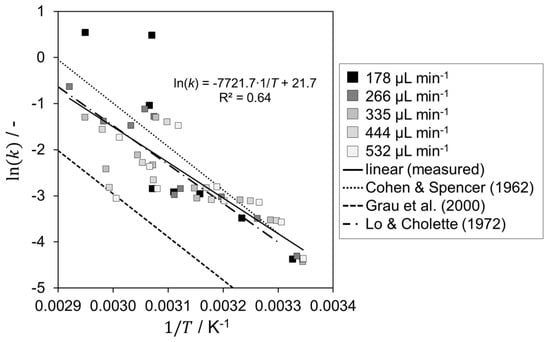
Figure 6.
Arrhenius plot for sodium thiosulfate oxidation using hydrogen peroxide in LTF-MS in comparison with literature [33,34,36].
Using the compartment modelling approach, five automated runs resulted in 48 data points for the Arrhenius plot. The activation energy was determined to be 62.2 kJ mol−1 and the frequency factor to be 2.6 × 10⁹ L mol−1 s−1. The deviation of the activation energy from the literature values is −6.3% [34,35] and 16.3% [33,36], respectively. In general, the calculated kinetic parameters are in the range of the literature values. The only exceptions are the two outliers at a flow rate of 178 µL min−1 and at high temperatures. The deviations here are probably due to the determination using the thermal conversion. When determining the enthalpy of reaction, it was assumed that there was no complete conversion for this volume flow rate. However, the compartment modelling approach shows here that complete conversion is achieved after SE7. Thus, it is reasonable to assume that the reaction rate is overestimated. A possible explanation could be side reactions with high heat release. However, the kinetic parameters determined agree quite well with those of Cohen & Spencer [33] and Lo & Cholette [34].
With the compartment modelling approach, kinetic data of the oxidation of sodium thiosulfate can be determined from an actually isoperibolic calorimeter. The determination in flow enables a fast and safe investigation of different reaction conditions for a highly exothermic reaction in a short time, which is, above all, the advantage compared to conventional calorimeters. The precision of the measurement and the reliability of the data is sufficient to provide an estimate of kinetic data, considering the modelling approach and the low additional effort besides the determination of reaction enthalpy. In addition, only a limited experimental design space was covered with the set experimental parameters. The estimation of the kinetic data thus provides a good basis on which additional measurements, ideally in an isothermal calorimeter, can be carried out to confirm them or increase their accuracy.
4. Conclusions and Outlook
In this study, a microscale flow calorimeter was used to determine the reaction enthalpy and kinetic parameters of a highly exothermic reaction. The exothermic test reaction of sodium thiosulfate with hydrogen peroxide was investigated, for which the kinetic parameters from different research groups show high differences. Here, the reaction enthalpy was evaluated in steady state isoperibolic experiments using microcalorimetry. Based on the heat flux profiles, experiments with full conversion in the reactor have been identified without the use of additional analytics. The reaction enthalpy was calculated to 594.29 0.7 kJ mol−1 using the most promising experiment, which is in good agreement with the literature. This demonstrated the applicability of isoperibolic flow calorimetry for the rapid and safe determination of the reaction enthalpy of a highly exothermic reaction. With the same and additional experiments, the conversion above each Seebeck element was determined using a compartment modelling approach. This enabled the calculation of the kinetic constants at the respective averaged temperature in each compartment. An activation energy of 62.2 kJ mol−1 and a frequency factor of 2.9 × 10⁹ L mol−1 s−1 were determined using a limited experimental design space and a fully calorimetric approach, which fits literature data with some deviation. Consequently, a first estimation of kinetic data can be performed with this approach. This can be used for further kinetic investigations, but already provides the operator a quick and good insight into the reaction system. All in all, the isoperibolic flow calorimetry in microreactors is a powerful tool for the rapid characterization of exothermic reactions. In future work, we will test the compartment modelling approach for further reactions such as hydrolysis of acetic anhydride, which is well documented in the literature. Additionally, computational fluid dynamic simulations will complete the method to suggest corresponding experimental settings in advance.
Author Contributions
Conceptualization: T.A.F. and N.K.; methodology: T.A.F., M.G. and N.K.; software: M.G. and T.A.F.; investigation: M.G. and T.A.F.; data curation: T.A.F.; writing—original draft preparation: T.A.F.; writing—review and editing: N.K.; visualization: T.A.F.; supervision: T.A.F. and N.K.; project administration: N.K.; funding acquisition: N.K. All authors have read and agreed to the published version of the manuscript.
Funding
This research of the Forschungsvereinigung Forschungs-Gesellschaft Verfahrens-Technik e.V. was funded by the German Federal Ministry of Economic Affairs and Climate Action via the AiF within the framework of the program for the promotion of the Industrielle Gemeinschaftsforschung (IGF), grant number IGF no. 20819 N.
Data Availability Statement
Not applicable.
Acknowledgments
Special thanks are given to the faculty’s mechanical and electrical workshop, which did an excellent job in manufacturing components of the calorimeter and its additional equipment. T.A.F. thanks the networking program ‘Sustainable Chemical Synthesis 2.0’ (SusChemSys 2.0) for the support and fruitful discussions across disciplines.
Conflicts of Interest
The authors declare no conflict of interest.
Abbreviations
| concentration, mol L−1 | |
| CSV | comma separated values |
| starting concentration of A, mol L−1 | |
| starting concentration of B, mol L−1 | |
| diameter, m | |
| energy, J | |
| activation energy, J mol−1 | |
| FTIR | Fourier–transform infrared spectroscopy |
| HP | hydrogen peroxide |
| HPLC | high-performance liquid chromatography |
| reaction enthalpy, J mol−1 | |
| frequency factor, m3 mol−1 s−1 | |
| kinetic constant first-order, s−1 | |
| kinetic constant second-order, m3 mol−1 s−1 | |
| length, m | |
| NaTS | sodium thiosulfate |
| Nusselt number, - | |
| PMMA | poly(methyl methacrylate) |
| heat amount, J | |
| heat flux, W | |
| convective heat flux, W | |
| heat flux to the environment, W | |
| heat of reaction, W | |
| reaction heat, W | |
| transferred heat flux, W | |
| SE | Seebeck element |
| time, s | |
| temperature, K | |
| reactor temperature, K | |
| volumetric flow rate, m3 s−1 | |
| conversion based on heat flux, - |
References
- Winkler, S.; Lade, M.; Vogel, H. Isoperibole Kalorimetrie in Der Sicherheitstechnischen Praxis. Chemie Ing. Tech. 2006, 78, 1116–1120. [Google Scholar] [CrossRef]
- Steinbach, J. Chemische Sicherheitstechnik; VCH-Verlagsgesellschaft: Weinheim, Germany, 1995; ISBN 9783527287109. [Google Scholar]
- Antes, J.; Schifferdecker, D.; Löbbecke, S. Thermoelektrische Module Als Universelle Messsysteme Zum Abbilden Chemischer Und Physikalischer Vorgänge. Chemie Ing. Tech. 2005, 77, 994–996. [Google Scholar] [CrossRef]
- Moore, J.S.; Jensen, K.F. Batch Kinetics in Flow: Online IR Analysis and Continuous Control. Angew. Chemie Int. Ed. 2014, 53, 470–473. [Google Scholar] [CrossRef]
- Moore, J.S.; Smith, C.D.; Jensen, K.F. Kinetics Analysis and Automated Online Screening of Aminocarbonylation of Aryl Halides in Flow. React. Chem. Eng. 2016, 1, 272–279. [Google Scholar] [CrossRef]
- Schwolow, S.; Braun, F.; Rädle, M.; Kockmann, N.; Röder, T. Fast nd Efficient Acquisition of Kinetic Data in Microreactors Using In-Line Raman Analysis. Org. Process Res. Dev. 2015, 19, 1286–1292. [Google Scholar] [CrossRef]
- Mozharov, S.; Nordon, A.; Littlejohn, D.; Wiles, C.; Watts, P.; Dallin, P.; Girkin, J.M. Improved Method for Kinetic Studies in Microreactors Using Flow Manipulation and Noninvasive Raman Spectrometry. J. Am. Chem. Soc. 2011, 133, 3601–3608. [Google Scholar] [CrossRef]
- Hone, C.A.; Holmes, N.; Akien, G.R.; Bourne, R.A.; Muller, F.L. Rapid Multistep Kinetic Model Generation from Transient Flow Data. React. Chem. Eng. 2017, 2, 103–108. [Google Scholar] [CrossRef]
- Haas, C.P.; Biesenroth, S.; Buckenmaier, S.; Van De Goor, T.; Tallarek, U. Automated Generation of Photochemical Reaction Data by Transient Flow Experiments Coupled with Online HPLC Analysis. React. Chem. Eng. 2020, 5, 912–920. [Google Scholar] [CrossRef]
- Waldron, C.; Pankajakshan, A.; Quaglio, M.; Cao, E.; Galvanin, F.; Gavriilidis, A. Model-Based Design of Transient Flow Experiments for the Identification of Kinetic Parameters. React. Chem. Eng. 2020, 5, 112–123. [Google Scholar] [CrossRef]
- Fath, V.; Lau, P.; Greve, C.; Kockmann, N.; Röder, T. Efficient Kinetic Data Acquisition and Model Prediction: Continuous Flow Microreactors, Inline Fourier Transform Infrared Spectroscopy, and Self-Modeling Curve Resolution. Org. Process Res. Dev. 2020, 24, 1955–1968. [Google Scholar] [CrossRef]
- Ładosz, A.; Kuhnle, C.; Jensen, K.F. Characterization of Reaction Enthalpy and Kinetics in a Microscale Flow Platform. React. Chem. Eng. 2020, 5, 2115–2122. [Google Scholar] [CrossRef]
- Frede, T.A.; Maier, M.C.; Kockmann, N.; Gruber-Woelfler, H. Advances in Continuous Flow Calorimetry. Org. Process Res. Dev. 2022, 26, 267–277. [Google Scholar] [CrossRef]
- Antes, J.; Krause, H.; Löbbecke, S.; Schifferdecker, D. Method and Device for Measuring the Heat Developed by Chemical or Physical Reactions. Patent EP1533610A2, 26 August 2012. [Google Scholar]
- Antes, J.; Schifferdecker, D.; Krause, H.; Loebbecke, S. Ein Neues Mikro-Kalorimeter Zur Isothermen Bestimmung von Thermodynamischen Und Kinetischen Kenngrößen Stark Exothermer Reaktionen. Chem. Ing. Tech. 2004, 76, 1332–1333. [Google Scholar] [CrossRef]
- Antes, J.; Gegenheimer, M.; Krause, H.; Löbbecke, S.; Wirker, R.; Knorr, A. Ortsaufgelöste Reaktionskalorimetrie in Mikrostrukturierten Reaktoren. Chem. Ing. Tech. 2008, 80, 1270. [Google Scholar] [CrossRef]
- Reichmann, F.; Millhoff, S.; Jirmann, Y.; Kockmann, N. Reaction Calorimetry for Exothermic Reactions in Plate-Type Microreactors Using Seebeck Elements. Chem. Eng. Technol. 2017, 40, 2144–2154. [Google Scholar] [CrossRef]
- Reichmann, F.; Vennemann, K.; Frede, T.A.; Kockmann, N. Mixing Time Scale Determination in Microchannels Using Reaction Calorimetry. Chem. Ing. Tech. 2019, 91, 622–631. [Google Scholar] [CrossRef]
- Frede, T.A.; Burke, I.; Kockmann, N. Software-Guided Microfluidic Reaction Calorimeter Based on Thermoelectric Modules. Chemie Ing. Tech. 2021, 93, 802–808. [Google Scholar] [CrossRef]
- Maier, M.C.; Leitner, M.; Kappe, C.O.; Gruber-Woelfler, H. A Modular 3D Printed Isothermal Heat Flow Calorimeter for Reaction Calorimetry in Continuous Flow. React. Chem. Eng. 2020, 5, 1410–1420. [Google Scholar] [CrossRef]
- Mortzfeld, F.; Polenk, J.; Guelat, B.; Venturoni, F.; Schenkel, B.; Filipponi, P. Reaction Calorimetry in Continuous Flow Mode: A New Approach for the Thermal Characterization of High Energetic and Fast Reactions. Org. Process Res. Dev. 2020, 24, 2004–2016. [Google Scholar] [CrossRef]
- Moser, M.; Georg, A.G.; Steinemann, F.L.; Rütti, D.P.; Meier, D.M. Continuous Milli-scale Reaction Calorimeter for Direct Scale-up of Flow Chemistry. J. Flow Chem. 2021, 11, 691–699. [Google Scholar] [CrossRef]
- Schneider, M.A.; Stoessel, F. Determination of the Kinetic Parameters of Fast Exothermal Reactions Using a Novel Microreactor-Based Calorimeter. Chem. Eng. J. 2005, 115, 73–83. [Google Scholar] [CrossRef]
- Frede, T.A.; Dietz, M.; Kockmann, N. Software-Guided Microscale Flow Calorimeter for Efficient Acquisition of Thermokinetic Data. J. Flow Chem. 2021, 11, 321–332. [Google Scholar] [CrossRef]
- Antes, J.; Gegenheimer, M.; Löbbecke, S.; Krause, H. Reaction Calorimetry in Microreactors: Fast Reaction Screening and Process Design. In Proceedings of the 12th International Conference on Miniaturized Systems for Chemistry and Life Sciences, Sand Diego, CA, USA, 12–16 October 2008; pp. 1260–1262. [Google Scholar]
- Zogg, A.; Stoessel, F.; Fischer, U.; Hungerbühler, K. Isothermal Reaction Calorimetry as a Tool for Kinetic Analysis. Thermochim. Acta 2004, 419, 1–17. [Google Scholar] [CrossRef]
- Kashid, M.N.; Renken, A.; Kiwi-Minsker, L. Microstructured Devices for Chemical Processing, 1st ed.; Wiley-VCH: Weinheim, Germany, 2015; ISBN 9783527332991. [Google Scholar]
- Kurin-Csörgei, K.; Orbán, M.; Rábai, G.; Epstein, I.R. Model for the Oscillatory Reaction between Hydrogen Peroxide and Thiosulfate Catalysed by Copper(II) Ions. J. Chem. Soc. Faraday Trans. 1996, 92, 2851–2855. [Google Scholar] [CrossRef]
- Voslař, M.; Matějka, P.; Schreiber, I. Oscillatory Reactions Involving Hydrogen Peroxide and Thiosulfate—Kinetics of the Oxidation of Tetrathionate by Hydrogen Peroxide. Inorg. Chem. 2006, 45, 2824–2834. [Google Scholar] [CrossRef]
- Varga, D.; Horváth, A.K. Kinetics and Mechanism of the Decomposition of Tetrathionate Ion in Alkaline Medium. Inorg. Chem. 2007, 46, 7654–7661. [Google Scholar] [CrossRef]
- Lu, Y.; Gao, Q.; Xu, L.; Zhao, Y.; Epstein, I.R. Oxygen-Sulfur Species Distribution and Kinetic Analysis in the Hydrogen Peroxide-Thiosulfate System. Inorg. Chem. 2010, 49, 6026–6034. [Google Scholar] [CrossRef]
- Gelhausen, M.G.; Kurt, S.K.; Kockmann, N. Parametrische Empfindlichkeit Einer Stark Exothermen Reaktion Im Kapillarwendelreaktor. Chemie Ing. Tech. 2015, 87, 781–790. [Google Scholar] [CrossRef]
- Cohen, W.C.; Spencer, J.L. Determination of Chemical Kinetics by Calorimetry. Chem. Eng. Prog. 1962, 58, 40–41. [Google Scholar]
- Lo, S.N.; Cholette, A. Experimental Study on the Optimum Performance of an Adiabatic MT Reactor. Can. J. Chem. Eng. 1972, 50, 71–80. [Google Scholar] [CrossRef]
- Lin, K.F.; Wu, L.L. Performance of an Adiabatic Controlled Cycled Stirred Tank Reactor. Chem. Eng. Sci. 1981, 36, 435–444. [Google Scholar] [CrossRef]
- Grau, M.D.; Nougués, J.M.; Puigjaner, L. Batch and Semibatch Reactor Performance for an Exothermic Reaction. Chem. Eng. Process. 2000, 39, 141–148. [Google Scholar] [CrossRef]
- Dean, W.R. Fluid Motion in a Curved Channel. Proc. R. Soc. Lond. A 1928, 121, 402–420. [Google Scholar] [CrossRef]
- Binnewies, M.; Willner, H.; Jäckel, M.; Rayner-Canham, G.; Finze, M.; Schmidt, P. Allgemeine und Anorganische Chemie, 3rd ed.; Springer Spektrum: Berlin, Germany, 2016; Volume 58, ISBN 9783662450666. [Google Scholar]
- Khaydarov, V.; Borovinskaya, E.S.; Reschetilowski, W. Numerical and Experimental Investigations of a Micromixer with Chicane Mixing Geometry. Appl. Sci. 2018, 8, 2458. [Google Scholar] [CrossRef]
Publisher’s Note: MDPI stays neutral with regard to jurisdictional claims in published maps and institutional affiliations. |
© 2022 by the authors. Licensee MDPI, Basel, Switzerland. This article is an open access article distributed under the terms and conditions of the Creative Commons Attribution (CC BY) license (https://creativecommons.org/licenses/by/4.0/).