1. Introduction
Globally, agriculture is the largest consumer of freshwater, accounting for nearly 70% of the total amount extracted [
1]. Within this global context, limited water availability and recurrent droughts are among the leading causes of reduced yields in crop production [
2]. Chili peppers (
Capsicum spp.) are no exception; in fact,
Capsicum annuum varieties can experience yield losses of 30% to 70% under drought-induced water stress, depending on the severity of the deficit [
3]. Chili and sweet peppers are widely cultivated worldwide, covering approximately 1.9 million hectares (including both fresh and dried varieties) and producing more than 30 million tons annually [
4]. In this global scenario, Mexico stands out as one of the leading producers, with approximately 158,000 hectares dedicated to green chili production in 2022 [
5], within which the jalapeño pepper holds a significant position due to its economic and cultural importance. However, factors such as climate change, aquifer overexploitation, and inefficiencies associated with traditional irrigation practices threaten the long-term sustainability of this crop.
Given these challenges, it is crucial to rely on accurate methods to measure and detect water stress in plants at early stages, enabling irrigation optimization and resource conservation in water-limited regions [
6]. Among image-based alternatives, the Crop Water Stress Index (CWSI) has emerged as a well-validated thermal indicator, with correlations of up to R
2 = 0.91 against stomatal conductance in field-grown
Capsicum annuum under four irrigation regimes [
7]. Similarly, spectral indices such as the Normalized Difference Vegetation Index (NDVI) have shown only moderate correlations with stomatal conductance (R
2 = 0.39 in cotton, versus 0.66 for CWSI in the same study) [
8], and their sensitivity to acute stress remains limited by saturation effects in dense canopies. Invasive methods are undesirable because they interfere physically or chemically with the analyte. Non-invasive methods (mostly related with optical systems) present as an option to avoid the disadvantages of invasive methods. In recent years, non-invasive strategies based on sensors and imaging technologies have been developed to monitor plant stress. Among the most established non-invasive methods is CWSI, which uses canopy temperature measured by infrared thermometry and compares it with the ambient temperature and relative humidity to infer water stress levels [
9]. This thermographic approach has been validated across multiple crops and environments, including applications in pepper plants (
Capsicum spp.); it uses infrared cameras for irrigation scheduling and stress detection [
10]. In general, infrared thermography has become an effective tool for indirectly detecting water stress, as anomalous increases in leaf temperature often indicate stomatal closure and reduced transpiration under water deficit [
9,
11].
Additionally, multispectral and hyperspectral imaging in the visible and near-infrared (Vis–NIR) ranges has shown strong potential for identifying stress before visible symptoms appear [
12]. Subtle changes in the optical properties of leaves—for example, in near-infrared reflectance—can reveal reductions in water content or structural alterations caused by drought. The near-infrared (NIR) region (~730–900 nm) typically exhibits high reflectance in healthy leaves due to internal scattering in hydrated tissues; under water stress, characteristic deviations in this pattern emerge as foliage loses water [
12,
13,
14]. These principles have been successfully applied in horticultural crops such as potato [
15] and tomato [
16], using machine learning models to interpret hyperspectral and multispectral images. Such techniques have also been validated in controlled agricultural environments using drone-mounted thermal sensors to assess plant water status [
17]. Recent studies have further confirmed the robustness of plant-based thermal indices, such as the CWSI, for irrigation management in pepper crops. For instance, Boyacı et al. demonstrated that CWSI-derived thresholds can reliably discriminate irrigation regimes in green pepper cultivation, enabling improved water-use efficiency without compromising yield under controlled conditions [
18]. These findings reinforce the importance of developing image-based indicators capable of capturing early physiological responses to water deficit in
Capsicum species.
In the specific case of jalapeño pepper (
Capsicum annuum), research efforts aimed at water-stress phenotyping through imaging techniques have begun to emerge. Recent studies have demonstrated that different levels of water stress in pepper plants can be detected using thermal imaging and CWSI calculations, establishing thresholds for irrigation scheduling [
10,
18,
19]. Likewise, research employing infrared thermography and foliar pressure sensors has identified differential watering responses in pepper plants, underscoring the potential of non-invasive visual techniques for these crops [
7]. Studies using spectral indices derived from reflectance imaging have also mapped water stress in greenhouse-grown peppers, accurately distinguishing critical management zones [
20].
Notably, hyperspectral imaging in the short-wave infrared (SWIR ~1400–3000 nm) region has shown promise for
Capsicum species. A study on red peppers identified 1449 nm—corresponding to a water absorption band—as a critical wavelength capable of discriminating three stress levels with statistical significance (
p < 0.05), demonstrating that spectral features directly linked to tissue hydration can effectively characterize water deficit in pepper [
21].
Quantitative, sensor-based characterization of this cultivar has also begun to emerge: a 2024 study modelled the photosynthetic response of jalapeño pepper (
Capsicum annuum L.) under controlled conditions using a fuzzy mathematical approach [
22]. Together with the multimodal imaging results reviewed above, these efforts support the need to explore additional morphological indicators—such as the structural integrity of the foliar vascular network—as complementary measures for robust, non-invasive water-stress monitoring.
From a physiological standpoint, drought-induced damage is closely associated with the failure of the leaf vascular system. Recent evidence has shown that xylem network disruption under water deficit precedes visible tissue death and irreversible loss of leaf functionality, establishing vascular integrity as a key morphological marker of plant water status [
23]. This perspective is further supported by quantitative studies linking vascular architecture to drought tolerance. Scoffoni et al. [
24] showed, across 10 species, that leaf hydraulic vulnerability (Ψleaf at 50% and 80% loss of Kleaf) decreased with higher major vein density and smaller leaf size (|r| = 0.85–0.90,
p < 0.01). In rice, Tabassum et al. [
25] reported that major vein thickness decreased by up to 32.8% under severe water stress (15% PEG), depending on cultivar, while total vein density remained relatively stable—suggesting that proportion-based vascular indices are more sensitive to acute stress than structural density alone. Despite these advances, most studies have focused on surface temperature or global spectral indices without exploring the structural response of the foliar vascular network in detail. Image-based approaches to vascular structure have begun to emerge—for example, Liao and Zhang [
26] quantified vein density and continuity from multispectral and high-resolution 3D imagery, validating the resulting segmentation against an independent structural reference—but they remain uncommon. This represents a significant gap given that vascular metrics have proven highly predictive of drought tolerance in other plant systems: Blackman et al. [
27] found that leaf hydraulic vulnerability (P50) was strongly correlated with the cubed ratio of conduit wall thickness to lumen breadth in minor veins across a diverse set of woody angiosperms.
The
Rv index addresses several methodological limitations identified in the literature for existing non-invasive approaches. First, unlike CWSI, which requires wet and dry reference surfaces and environmental corrections,
Rv is computed solely from morphological features extracted from VIS-NIR images, without reference surfaces or ancillary environmental measurements. The index nonetheless remains dependent on acquisition and processing conditions—particularly illumination and modality-specific conditions—as addressed in
Section 4. Second, while spectral indices such as NDVI exhibit saturation effects and function as indirect proxies for water status,
directly quantifies the visible integrity of the vascular network—the anatomical structure responsible for water transport— providing a mechanistic link to hydraulic function consistent with that of Scoffoni et al. [
24]. Third, in contrast to deep learning classifiers that achieve high accuracy but lack interpretability,
has clear physiological meaning tied to xylem network deterioration [
23]. Fourth, whereas previous vascular studies required destructive sampling and microscopy, the present method enables non-invasive, automated extraction of vascular proportion from intact leaves. Finally, the leaf-level approach offers higher spatial resolution than canopy-scale methods, enabling detection of within-plant stress heterogeneity, and captures cumulative structural damage rather than transient stomatal responses that may reverse upon rewatering.
From a spectral perspective, the two imaging modalities used in this study rely on different physical mechanisms. The VIS-NIR range (350–850 nm) records radiation reflected by the leaf, whereas the LWIR range (7500–13,000 nm) records radiation emitted from the leaf surface; the term thermal imaging is therefore used here to refer exclusively to the LWIR modality. Espinosa-Calderón et al. [
28] characterized optical absorption in leaves of several crop species, including
Capsicum annuum, and reported pigment-related absorption peaks around 400 and 750 nm, with water-related absorption features located at 1500–3000 nm, outside the range of the camera used here. The strong contrast between pigment absorption in the visible region and the low absorption of the near-infrared plateau motivates the use of VIS-NIR imaging for the extraction of morphological descriptors; however, acquisition in the present study was performed without spectral filtering, and the origin of the observed vascular contrast is addressed in
Section 4.
The present study addresses the gap identified above—the limited use of foliar vascular structure as a water-stress descriptor—by proposing a vascular proportion index (Rv) for Capsicum annuum. This study proposes a non-invasive methodology to evaluate water stress in jalapeño pepper based on the segmentation and analysis of the foliar vascular network from VIS-NIR and thermal images. Plants were grown under three irrigation levels (100%, 50%, and 0% of daily water loss) under controlled conditions to determine whether the progressive deterioration of the vascular network—quantified via image-processing techniques—can discriminate stress stages according to water supply. The results aim to contribute to the development of accessible, image-based monitoring tools for assessing water status in horticultural systems, thereby supporting more efficient and sustainable irrigation decision-making.
2. Materials and Methods
2.1. Growing Conditions
The experiment was conducted under controlled environmental conditions in an experimental chamber, with the aim of minimizing external environmental variability and maintaining homogeneous conditions throughout the entire evaluation period. The average chamber temperature was maintained at 26 ± 2 °C, with a mean relative humidity of 60 ± 5%. Natural light was completely avoided to minimize light noise. Light was supplemented with diffuse artificial lighting when necessary, ensuring a photoperiod of approximately 14 h per day without inducing light-related stress conditions.
Seedlings of jalapeño chili pepper (Capsicum annuum L. var. Huichol), provided by the State Committee of Plant Health of Guanajuato A.C. (CESAVEG, Mexico), were used. Jalapeño seeds were germinated in plastic trays under standard conditions and transplanted to 15 L plastic pots containing a standardized substrate mixture composed of peat, perlite, and vermiculite at a 2:1:1 (v/v/v) ratio. This substrate was selected for its favorable water-holding capacity and aeration properties, allowing for optimal root development and more precise control of the irrigation regime. For image analysis, plant leaves at the stage of development of 6 true leaves were used to minimize variability in the results.
The experimental design consisted of three differentiated irrigation treatments:
- (a)
Full irrigation (100% WL): A daily water supply equivalent to the estimated daily water loss, calculated based on substrate weight loss and daily environmental conditions.
- (b)
Deficit irrigation (50% WL): A daily water supply equivalent to 50% of the volume applied in the full irrigation treatment.
- (c)
No irrigation (0% WL): To ensure seedling establishment, plants in this treatment received a single 100% irrigation application at the start of the experiment, after which irrigation was suspended for the remainder of the study.
Plants 1–3 were assigned to the 0% WL treatment, plants 4–6 to 50% WL, and plants 7–9 to 100% WL. All nine plants were at equivalent hydration levels at the start of the experiment (day zero); the assigned irrigation regimes were applied from that point onward.
These three levels follow established practice in deficit irrigation research [
29], in which full irrigation, moderate deficit and complete withholding are used to bracket the range of physiological response under controlled conditions. The 0% WL treatment was included as a stress-induction control rather than as an agronomically realistic irrigation scenario.
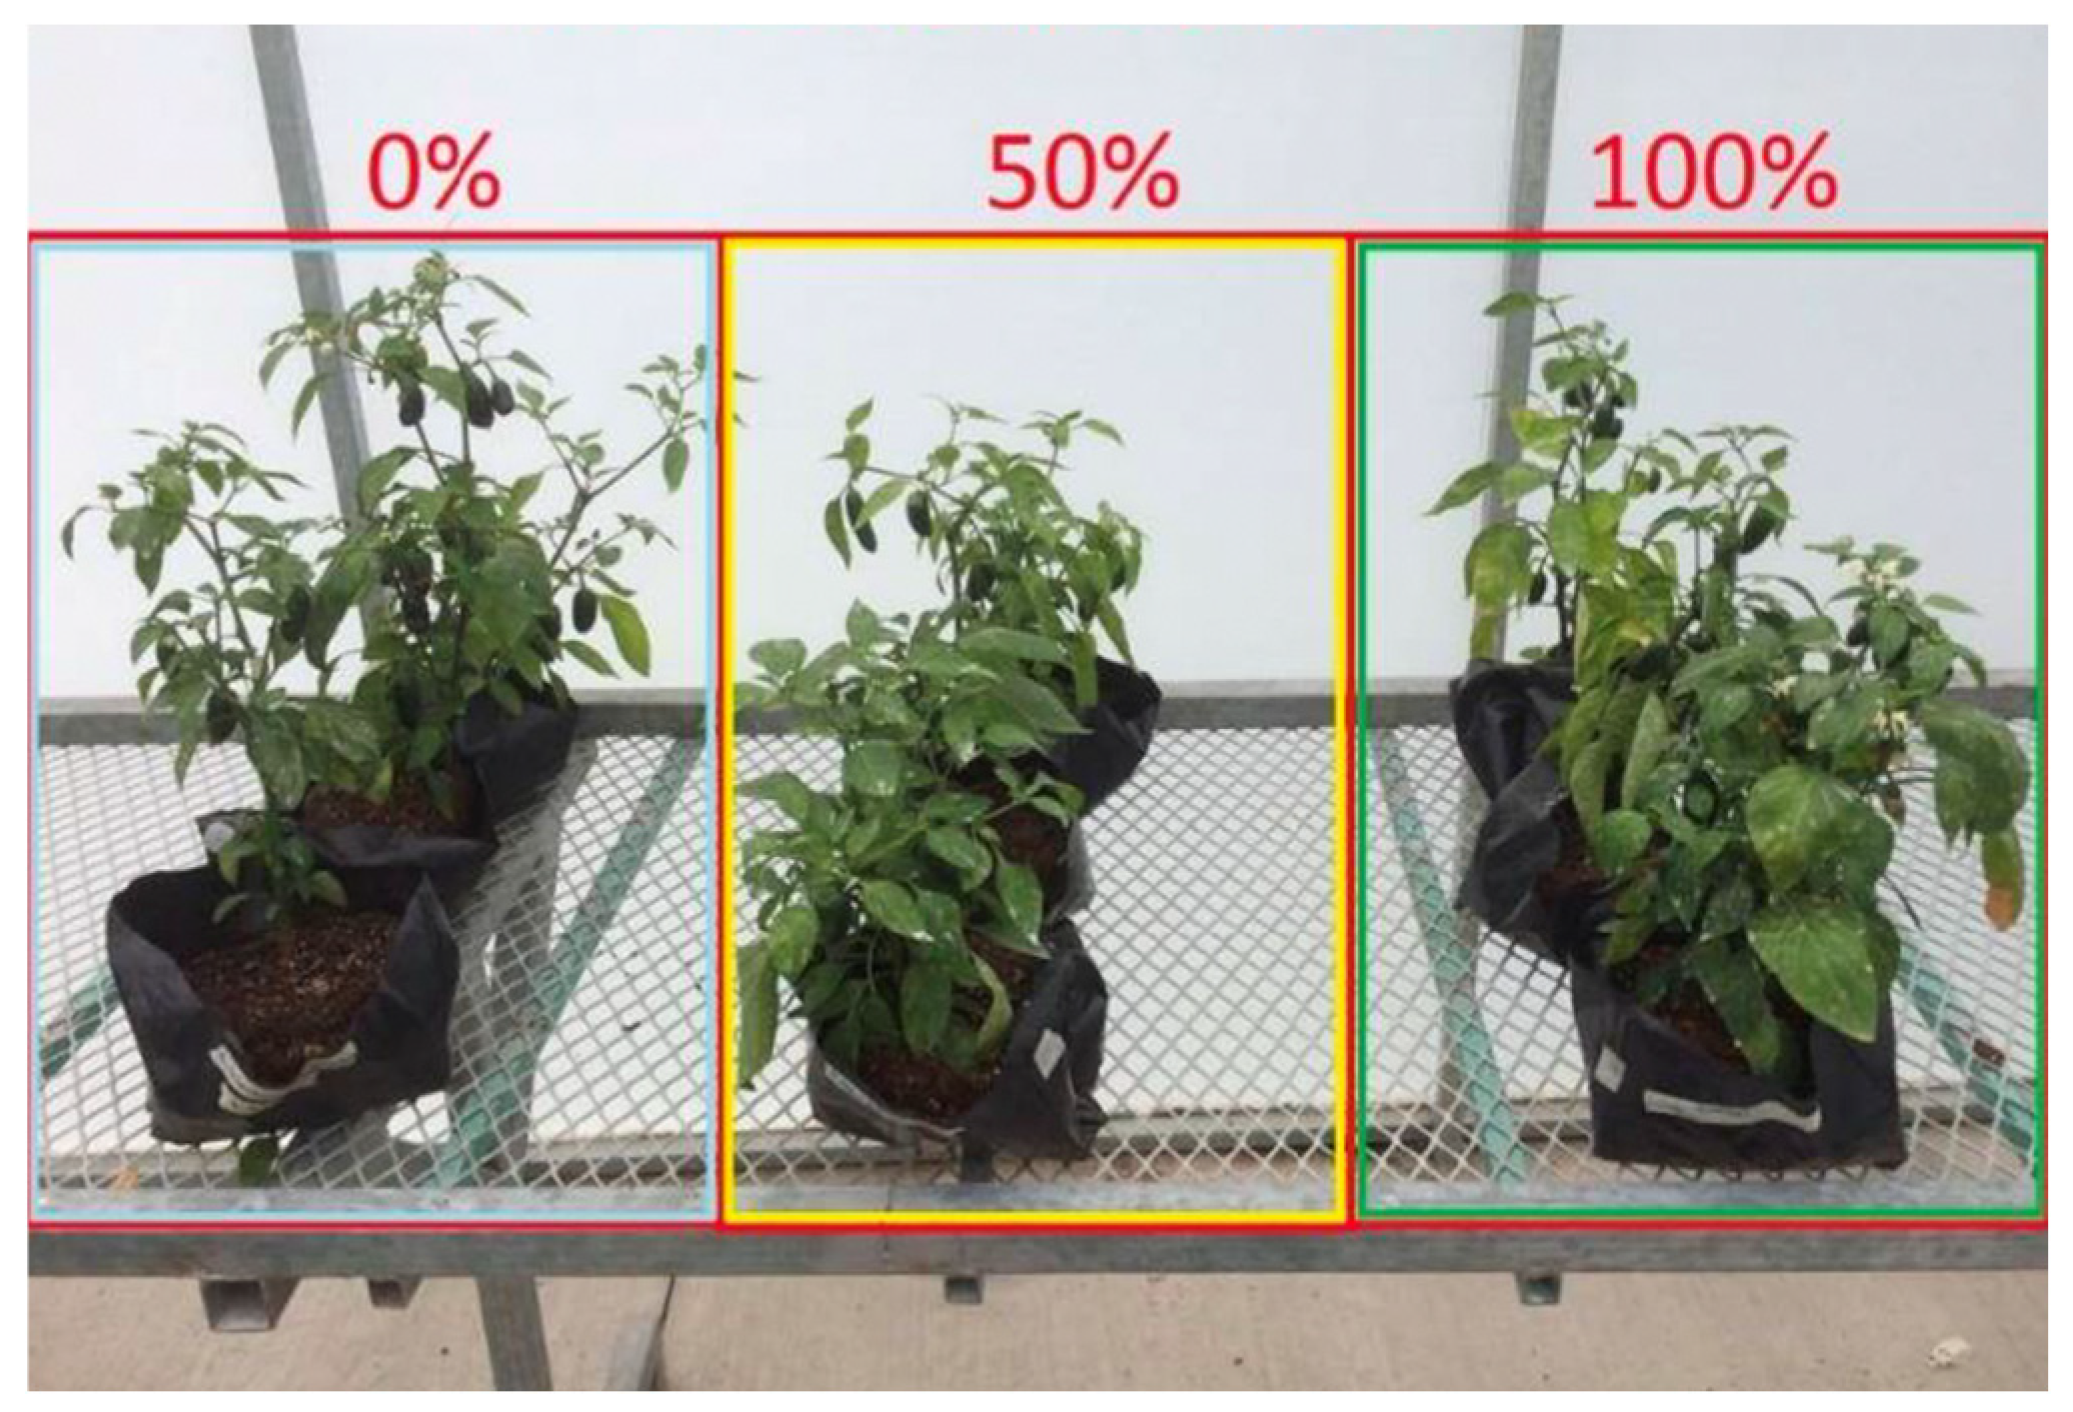
Representative plants from each treatment at the start of the experiment are shown in
Figure 1.
Each treatment included three biological replicates (n = 3), randomly selected from a homogeneous batch, resulting in a total of nine experimental plants. Over a period of 13 days, systematic image acquisition was performed every 24 h, starting on the first day without irrigation. For each plant, four mature and physiologically active leaves located in the middle third of the stem were selected; in six of the nine plants (plants 2, 3, 5, 6, 7 and 9), a fifth leaf was additionally imaged, resulting in an unbalanced sampling design.
All plants were kept free of pests and diseases through regular visual monitoring and preventive measures. No foliar fertilizers were applied during the imaging period to avoid interference with the physiological response to the induced water stress.
2.2. Image Acquisition
Thermal long-wave infrared (LWIR) and visible–near-infrared (NIR) images of
Capsicum annuum L. var. Huichol (jalapeño pepper) leaves were acquired using a handheld LWIR (thermal) imaging camera FLIR ThermaCAM E45 (FLIR Systems, Inc., Wilsonville, OR, USA) [
30] and an industrial silicon-sensor camera Bigeye P-132 NIR (Allied Vision Technologies GmbH, Stadtroda, Germany; supplied by Stemmer Imaging) [
31], respectively.
The LWIR camera operates within the 7500–13,000 nm spectral range and provides non-contact measurements of leaf surface temperature, which is directly influenced by transpiration rate, stomatal conductance, and plant water status. Thermal images were therefore used to capture spatial temperature distributions across the leaf surface, enabling the assessment of physiological responses associated with water stress without physical contact.
The Bigeye P-132 NIR camera is a high-sensitivity imaging device designed to operate in the 350–850 nm spectral range. This range spans the near-ultraviolet edge, the full visible region (400–700 nm), and the lower near-infrared region (700–850 nm); the visible portion accounts for approximately 72% of the range. No long-pass filter was used during acquisition. Accordingly, this modality is referred to throughout as VIS-NIR rather than NIR, and vascular contrast in this band should be interpreted as arising from a combined visible and near-infrared response. The sensor provides a high-resolution output of 1280 × 1024 pixels, captures images at 12.5 frames per second, requires a 12 VDC power supply, and communicates with the acquisition computer via an Ethernet interface, ensuring stable data transmission during image capture.
All images from both modalities were subsequently processed using custom routines developed in Python (version 3.14.4), as described in
Section 2.3. Each leaf was imaged under two controlled illumination conditions:
- (a)
Light: Plants were exposed to approximately 2762 lux for 5 min prior to acquisition in order to induce photosynthetic activity. Illumination was provided by a linear strobe LED unit (ODL300 Series, rated maximum output: 31,500 lux) positioned 13 cm away from the plant.
- (b)
Darkness: Plants were allowed to rest for 30 min in complete darkness before they were imaged in the dark.
While external illumination directly affects reflectance-based VIS-NIR measurements, LWIR images were acquired under the same illumination conditions to maintain experimental consistency. LWIR measurements are based on emitted thermal radiation and are not governed by reflectance mechanisms.
This dual-condition acquisition protocol enabled a comparative analysis of vascular, structural, and thermal features under contrasting environments, improving the robustness of subsequent segmentation and texture-analysis algorithms. For each selected leaf, three independent images were acquired using both the VIS-NIR and LWIR cameras under each illumination condition, resulting in repeated measurements per modality and condition for each leaf per day. The camera-to-leaf distance was fixed at 30 cm for all acquisitions, using a repeatable positioning arrangement.
The camera-to-leaf distance was fixed at 30 cm for all acquisitions. For the LWIR camera, the native detector resolution of 160 × 120 elements and a field of view of 19° × 14° correspond to a field of view of 100.4 × 73.7 mm and a native spatial resolution of 0.628 mm per pixel at this distance; stored images were software-interpolated to 320 × 240 pixels. For the VIS-NIR camera (6.45 µm pixel pitch, 1280 × 1024 array), the focal length of the lens was not recorded. The spatial resolution was therefore estimated by cross-calibration against the LWIR modality, comparing segmented leaf areas for 824 image pairs acquired from the same leaf at the same distance. This yielded an estimated resolution of approximately 136 µm per pixel (empirical range 99–175 µm per pixel), consistent with a lens focal length of 12–16 mm.
Images were stored as 8-bit grayscale JPEG (quality ≈ 75) and labeled using a structured alphanumeric convention encoding the experimental day, plant identifier, leaf number, illumination condition, imaging modality (LWIR or VIS-NIR), and repetition index, facilitating systematic data organization and automated batch processing during subsequent analysis.
2.3. Image Preprocessing
The acquired images were processed through a systematic image analysis workflow designed to extract two key components: the leaf contour and the internal vascular network. All image processing was carried out in Python 3.14.4 using OpenCV (opencv-python 4.13.0) for contrast enhancement (CLAHE) and morphological operations, and scikit-image 0.26.0 for Otsu thresholding, with NumPy 2.4.4 for array operations. The images were converted to grayscale for analysis.
2.3.1. Leaf Contour Segmentation
To obtain a reliable representation of the complete leaf area, the segmentation procedure was based on the intrinsic intensity contrast between the leaf and the background. Since the background consistently exhibited near-zero intensity values, the leaf region was isolated by applying a low global threshold to the original image:
where
denotes the grayscale image,
is a fixed low threshold, and
is the initial binary mask representing candidate leaf pixels.
To refine this mask, morphological closing and opening were applied using a circular structuring element:
where the closing operation connects fragmented regions and fills small holes, while the opening operation removes isolated artifacts and smooths object boundaries.
Because small noise regions may remain after refinement, the final leaf mask was defined as the largest connected component:
where each
represents a connected region within the mask and
indicates its size in pixels.
The total leaf area was quantified as the number of active pixels in the final mask:
This strategy provides a stable estimate of the leaf area and is well suited for the low-contrast nature of imagery, avoiding inconsistencies introduced by contour-based methods.
2.3.2. Vascular Network Segmentation
The extraction of the vascular network requires enhancing subtle structural variations within the leaf. To improve local contrast, Contrast Limited Adaptive Histogram Equalization (
CLAHE) was applied to the leaf-masked image:
where
enhances local contrast while preventing noise over-amplification, and
suppresses background intensities before enhancement.
Fine structural details were further emphasized by applying top-hat and bottom-hat morphological transformations:
where
consists of an erosion followed by a dilation, and
consists of a dilation followed by an erosion.
A combined enhancement image was generated as:
To obtain a binary candidate vascular map, Otsu’s threshold was computed only within the leaf region, avoiding background bias:
where
is an automatic global thresholding technique that selects the threshold value that maximizes the separation between two intensity classes in an image.
The vascular network was then restricted strictly to the leaf area:
Finally, minor artifacts were removed by applying a morphological opening:
The vascular area and perimeter were computed from the refined mask:
This approach constrains the vascular mask within the leaf region, preventing overestimation of vascular area and eliminating artifacts resulting from low-intensity backgrounds. Recent advances in plant phenotyping have demonstrated that leaf vein segmentation provides meaningful structural information related to plant physiological status. Multispectral and high-resolution imaging approaches have been successfully employed to segment and quantify leaf venation non-destructively [
26]. These developments support the use of vascular segmentation as a candidate morpho-visual descriptor for assessing plant water status, although in the present study, the segmentation was not verified against an independent structural reference.
2.4. Variable of Interest: Foliar Vascular Network Proportion
The central variable of the study was the proportion of the segmented structure relative to the total leaf area, referred to in this work as
. This proportion was evaluated as a candidate morphological descriptor of the foliar vascular network. From a physiological perspective, the leaf vascular network plays a fundamental role in the transport of water, nutrients, and photosynthetic products. Under severe water stress conditions, previous studies have documented a reduction in the visual expression of the vascular network, associated with cellular collapse, loss of turgor, reduced vein thickness, and progressive structural damage [
23,
24,
25]. Such deterioration manifests in images as a loss of contrast and continuity in foliar veins, which can be captured through computational segmentation techniques.
In this study, the area occupied by the segmented structure (
) and the total leaf area (
) were quantified, both measured as the number of active pixels. The vascular proportion was calculated using the expression:
where
is a sum of active pixels in the final mask of the extracted vascular network.
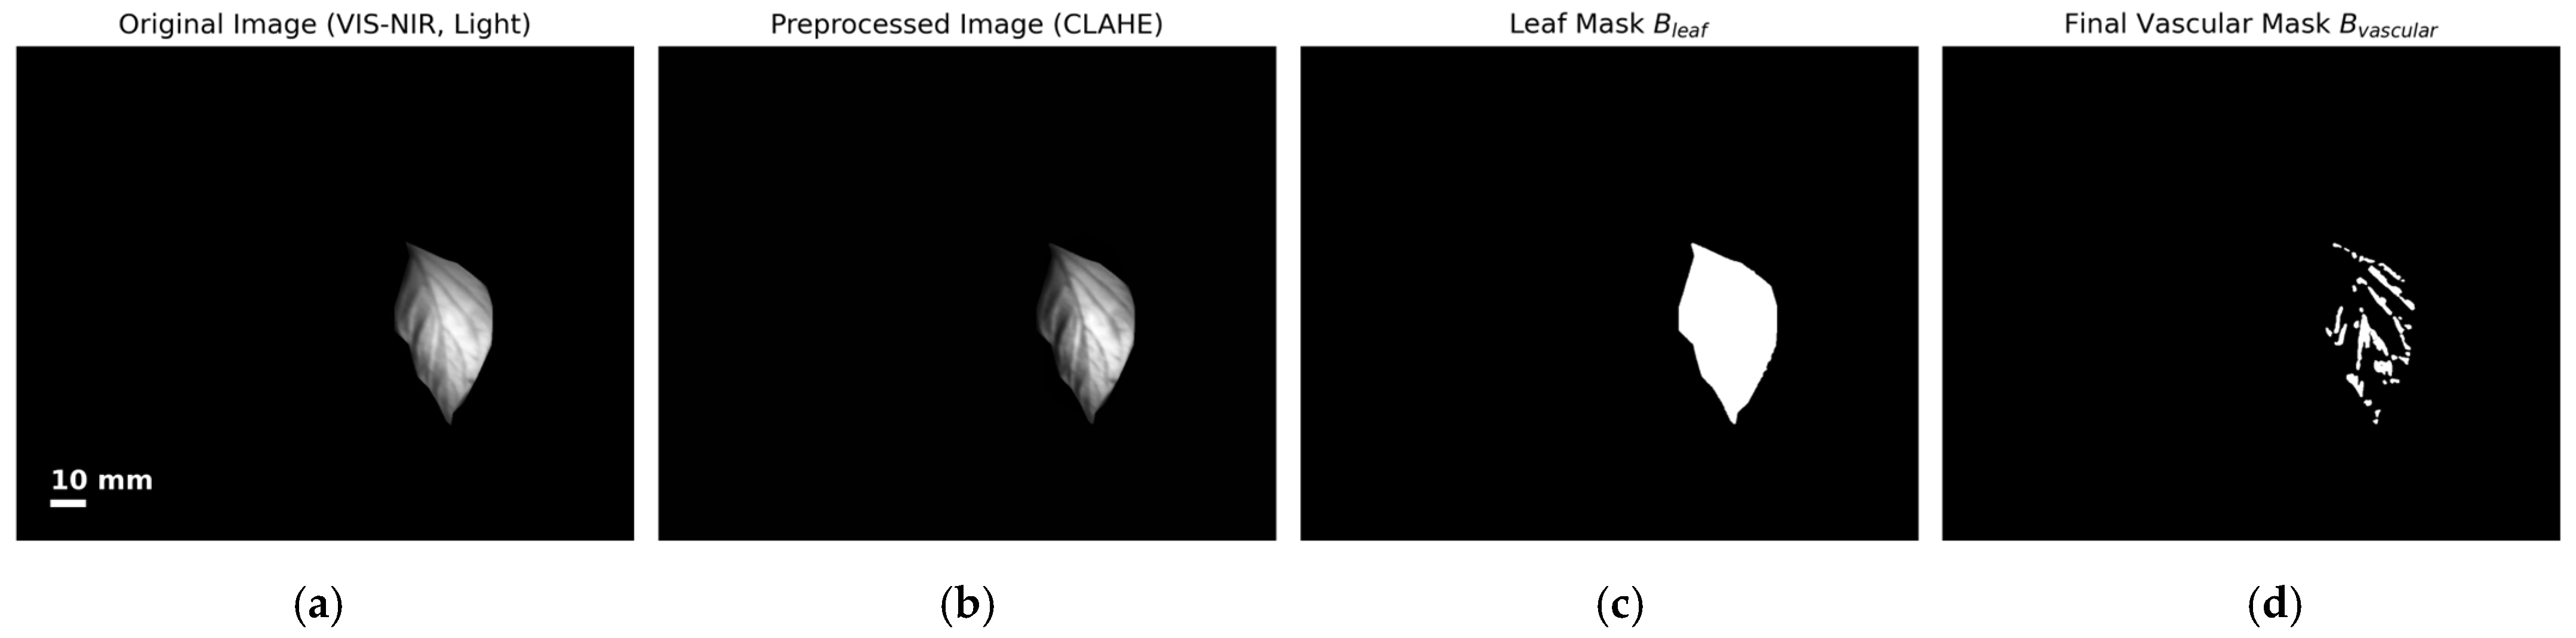
is a sum of active pixels in the binary mask of the complete leaf region. The complete segmentation workflow is illustrated in
Figure 2, which shows the progression from the original image to the final vascular network mask.
This variable was selected because it satisfies three key characteristics. First, it is non-invasive, as it is derived exclusively from image data and does not require destructive sampling of plant tissue. Second, it is comparative across treatments, allowing for the evaluation of the relative effects of water deficit without relying on absolute temperature scales. Third, it is suitable for statistical analysis; as a continuous variable with an approximately normal distribution in most groups, it is appropriate for parametric tests such as ANOVA and regression analyses. Additionally, the index was analyzed independently under illuminated and non-illuminated conditions, since the level of vascular contrast may depend on surface reflectance and acquisition parameters. This approach made it possible to assess whether illumination influences the method’s sensitivity to water stress.
2.5. Statistical Analysis
The statistical analysis was designed to determine whether the foliar vascular network proportion () can differentiate among levels of water stress induced by the different irrigation treatments. Exploratory and confirmatory tests were applied both to the complete dataset and separately for the two illumination conditions (“light” and “darkness”), given their potential influence on the visibility of vascular structures.
All statistical analyses were performed in Python 3.14.4. Data handling used pandas 3.0.2 and NumPy 2.4.4. The factorial ANOVA (Type II sums of squares) was fitted with statsmodels 0.14.6 (ols/anova_lm), and post hoc Tukey HSD comparisons were computed with statsmodels’ pairwise tukeyhsd.
2.5.1. Descriptive Statistics
For each combination of irrigation treatment (100%, 50%, and 0%) and illumination condition, descriptive statistics of were computed: arithmetic mean, standard deviation, median, interquartile range (IQR), and minimum and maximum values. This allowed for the visualization of general trends and assessment of data dispersion within each group.
2.5.2. Normality Assessment
Before applying parametric tests, the distribution of the
variable was evaluated using the Shapiro–Wilk normality test for each of the twelve experimental groups defined by the factorial design (irrigation treatment × illumination × spectral modality). Eleven of the twelve groups rejected normality at α = 0.05; however, the Shapiro–Wilk statistic remained high across all groups (W = 0.945–0.994), and absolute skewness was low to moderate (≤0.68), with no group showing severe departure. These results indicate that the rejections reflect the high sensitivity of the test at large sample sizes (
n ≈ 300–470 per group) rather than substantive departures from normality. Departures from normality were more pronounced in the LWIR groups, which showed lower Shapiro–Wilk statistics (W = 0.945–0.985 versus 0.978–0.994 for VIS-NIR), higher absolute skewness (up to 0.68 versus 0.33) and, most consistently, positive excess kurtosis (0.79 to 4.69), whereas all VIS-NIR groups showed negative excess kurtosis (−0.44 to −0.14). The heaviest tails occurred in the LWIR groups under both illumination conditions. The distinction is one of degree rather than of kind: the lowest Shapiro–Wilk statistic among the VIS-NIR groups (W = 0.978, 0% WL under darkness) is below that of two LWIR groups, and no group other than 50% WL under darkness in the VIS-NIR modality met the criterion for normality at α = 0.05. The full results are reported in
Supplementary Table S1. This verification was complemented with histograms and Q–Q plots (
Supplementary Figures S1 and S2).
2.5.3. Analysis of Variance
Two complementary analyses of variance were performed. First, a one-way ANOVA was performed separately for each illumination condition, using irrigation level as the independent factor and
as the dependent variable. The purpose of this analysis was to determine whether the proportion of the foliar vascular network differed significantly among the three irrigation treatments. The model used was:
where
represents the overall mean;
denotes the effect of irrigation treatment; and
is the random error term.
Second, a three-way factorial ANOVA was fitted to evaluate the combined effects of irrigation treatment, illumination condition and spectral modality, including all interaction terms:
where
denotes the effect of the
i-th irrigation treatment (100%, 50%, 0% WL),
is the effect of the
j-th illumination condition (light, darkness),
is the effect of the
k-th spectral modality (VIS-NIR, LWIR), and the remaining terms are the corresponding two-way and three-way interactions. The model was fitted by ordinary least squares and evaluated using Type II sums of squares. Partial eta-squared (
η2p) was computed as a measure of effect size for each term.
It should be noted that the observations are hierarchically structured: multiple images were acquired per leaf, multiple leaves per plant, and irrigation treatment was applied at the plant level, with three plants per treatment. The models described above treat individual images as the unit of analysis. The implications of this structure for the interpretation of the treatment effect are addressed in
Section 4.
Model assumptions were evaluated as follows. Normality of residuals was assessed using the Shapiro–Wilk test and complemented with the D’Agostino–Pearson and Anderson–Darling tests; homogeneity of variances was assessed using Levene’s test (Brown–Forsythe variant, centered on the median). Model residuals departed formally from normality (Shapiro–Wilk W = 0.987,
p < 0.001; D’Agostino–Pearson K
2 = 98.9,
p < 0.001; Anderson–Darling A
2 = 18.0, rejected at α = 0.05), although the magnitude of the departure was small (skewness = −0.115; excess kurtosis = 0.93). Levene’s test also rejected homogeneity of variances across the three irrigation treatments (W = 18.0,
p < 0.001) and across the twelve factorial groups (W = 79.2,
p < 0.001); however, the ratio of the largest to smallest group standard deviation was 1.20 across irrigation treatments, a magnitude at which analysis of variance is considered robust. The larger ratio observed across the twelve factorial groups (2.20) was driven by differences between spectral modalities rather than by irrigation treatment. Residual plots were also inspected (
Supplementary Figure S3). Given the large and approximately balanced group sizes, the factorial ANOVA was considered robust to the observed departures from normality and homoscedasticity; these are reported in full in
Supplementary Table S1 rather than treated as satisfied assumptions.
When the ANOVA indicated a significant treatment effect, post hoc pairwise comparisons were performed to identify which irrigation levels differed from each other. A significance threshold of α = 0.05 was adopted for all statistical tests.
2.5.4. Post Hoc Tests
When the ANOVA results were significant, Tukey’s Honestly Significant Difference (HSD) test was applied to identify which pairs of irrigation treatments differed significantly from one another. This procedure controls for Type I error inflation associated with multiple pairwise comparisons and provides confidence intervals for the differences between group means, enabling a more detailed interpretation of treatment effects.
2.5.5. Correlation with Time
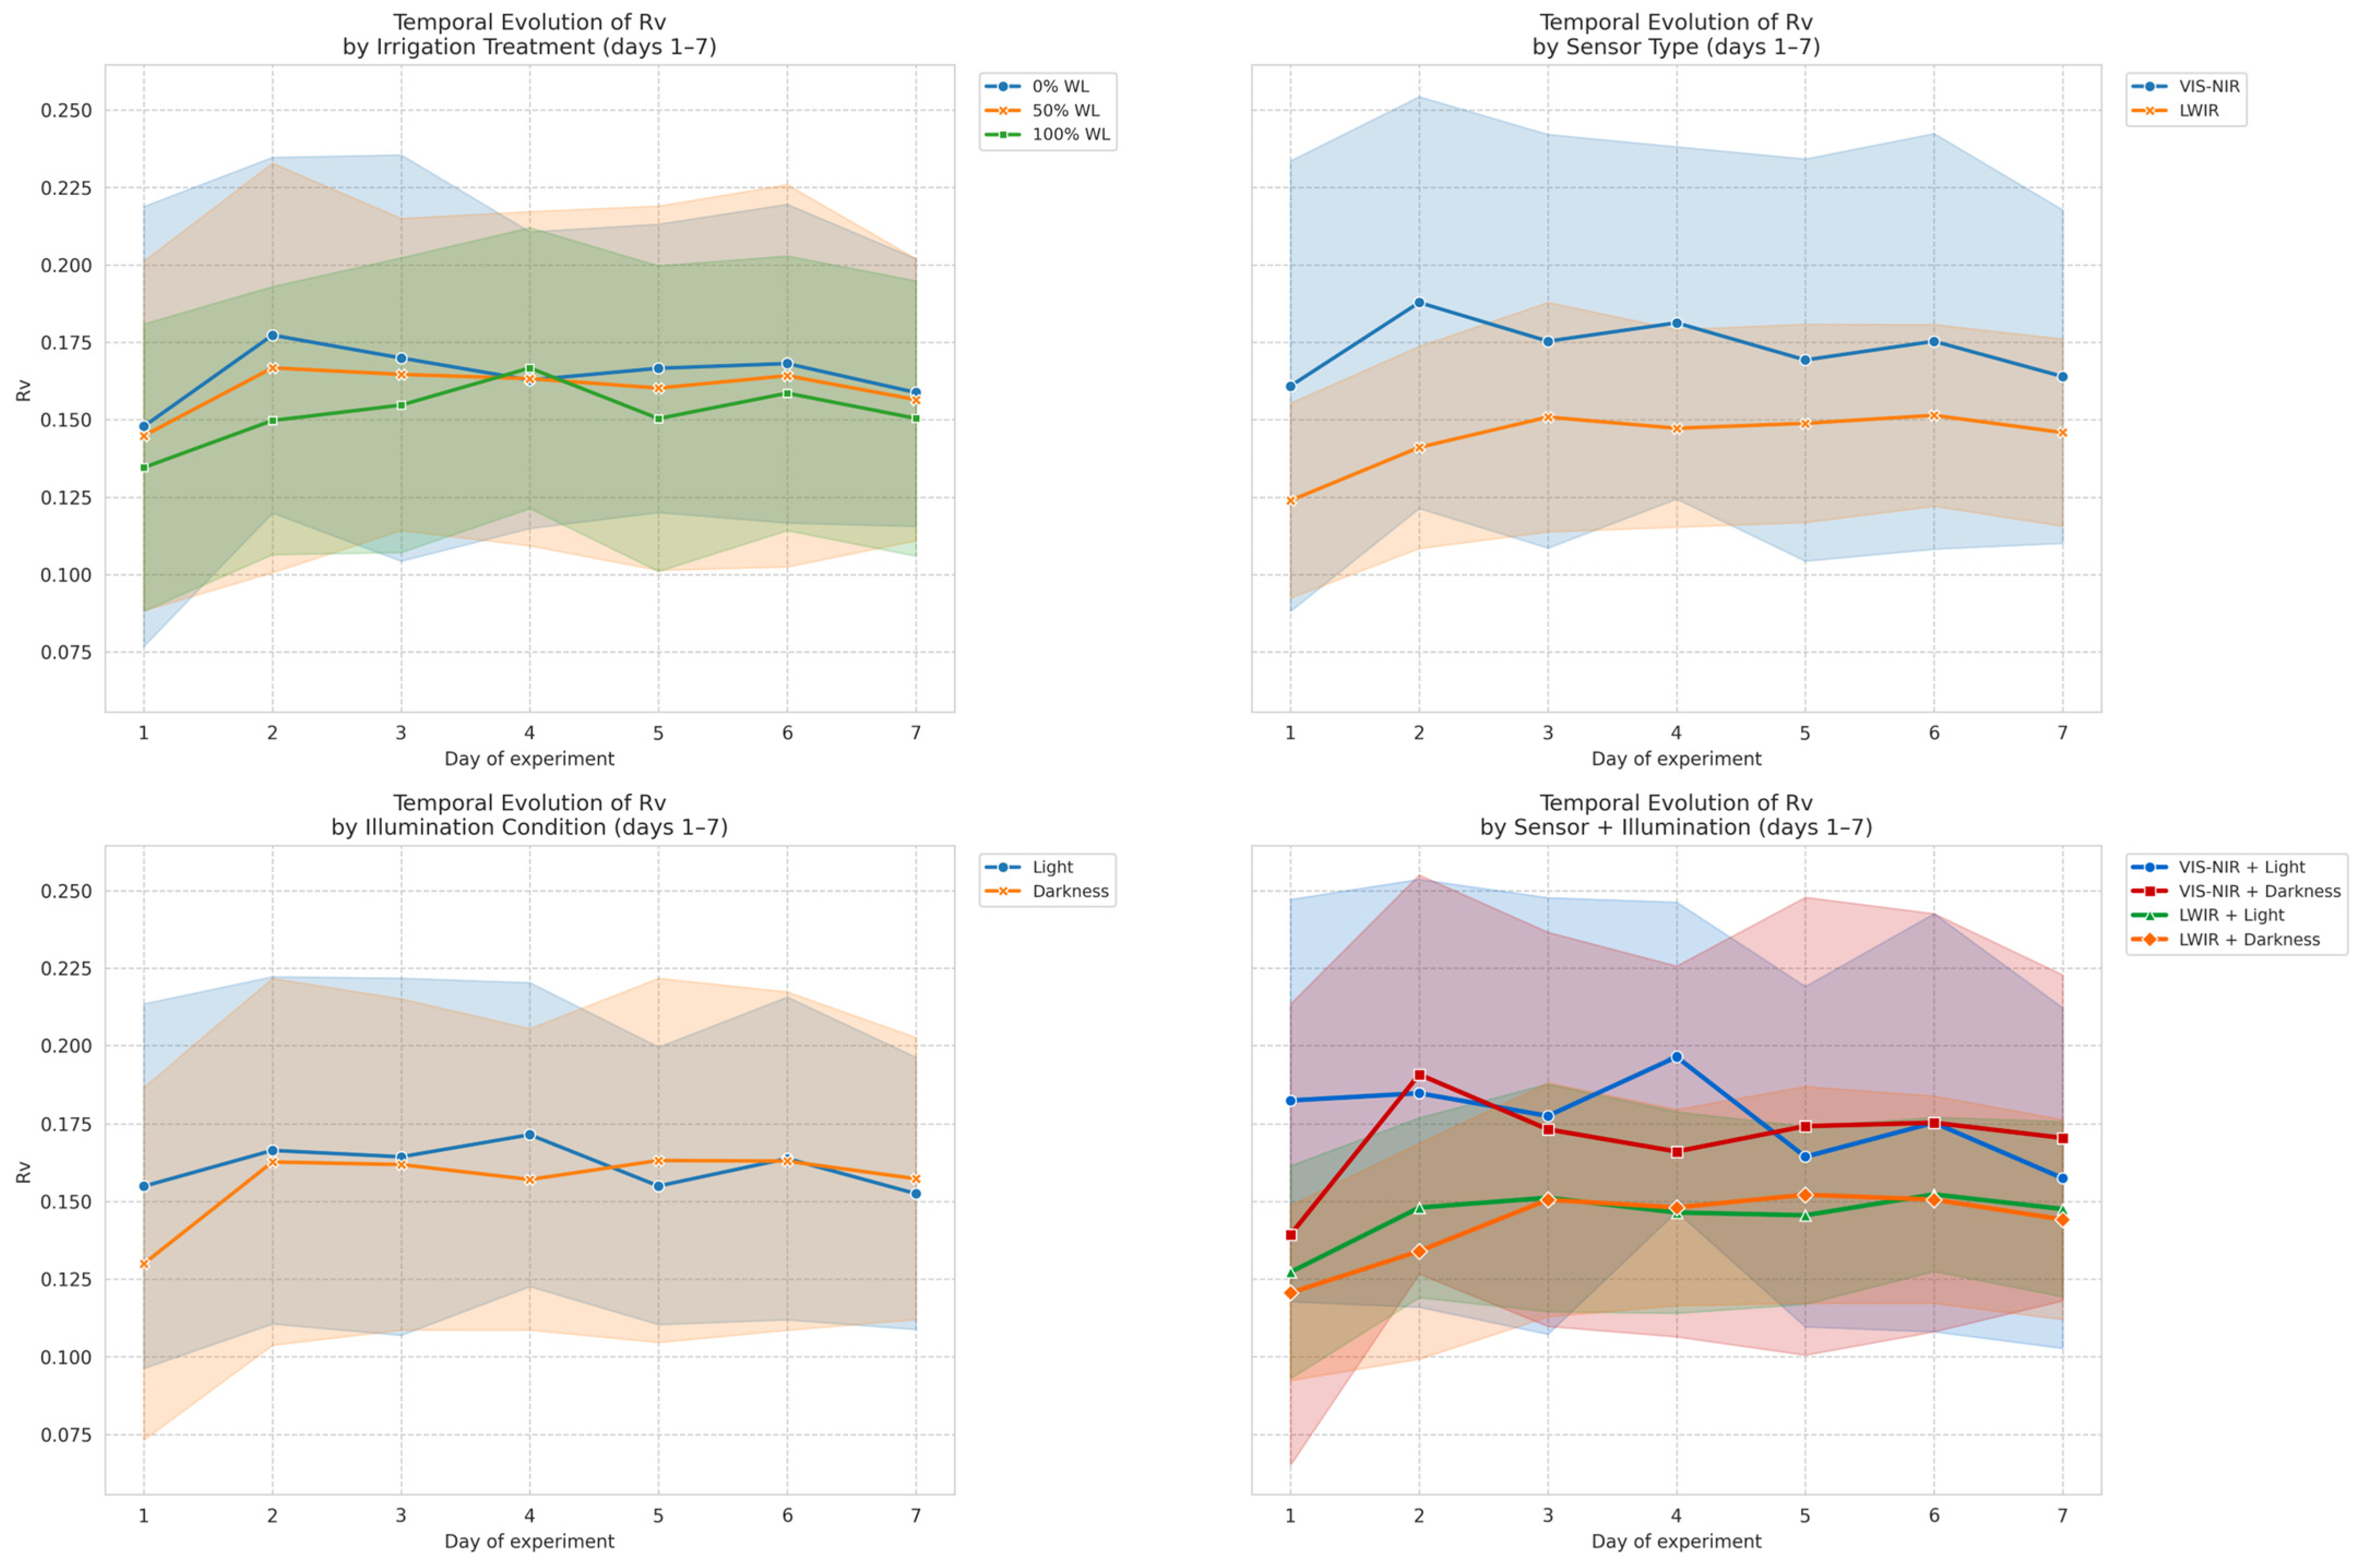
To analyze the temporal progression of water stress, Pearson’s correlation coefficient between the experimental day and was computed separately for each irrigation level and illumination condition. This analysis assessed whether a linear trend—either increasing or decreasing—was present in the vascularization ratio over the duration of the experiment, thereby indicating potential progressive physiological deterioration associated with water deficit.
4. Discussion
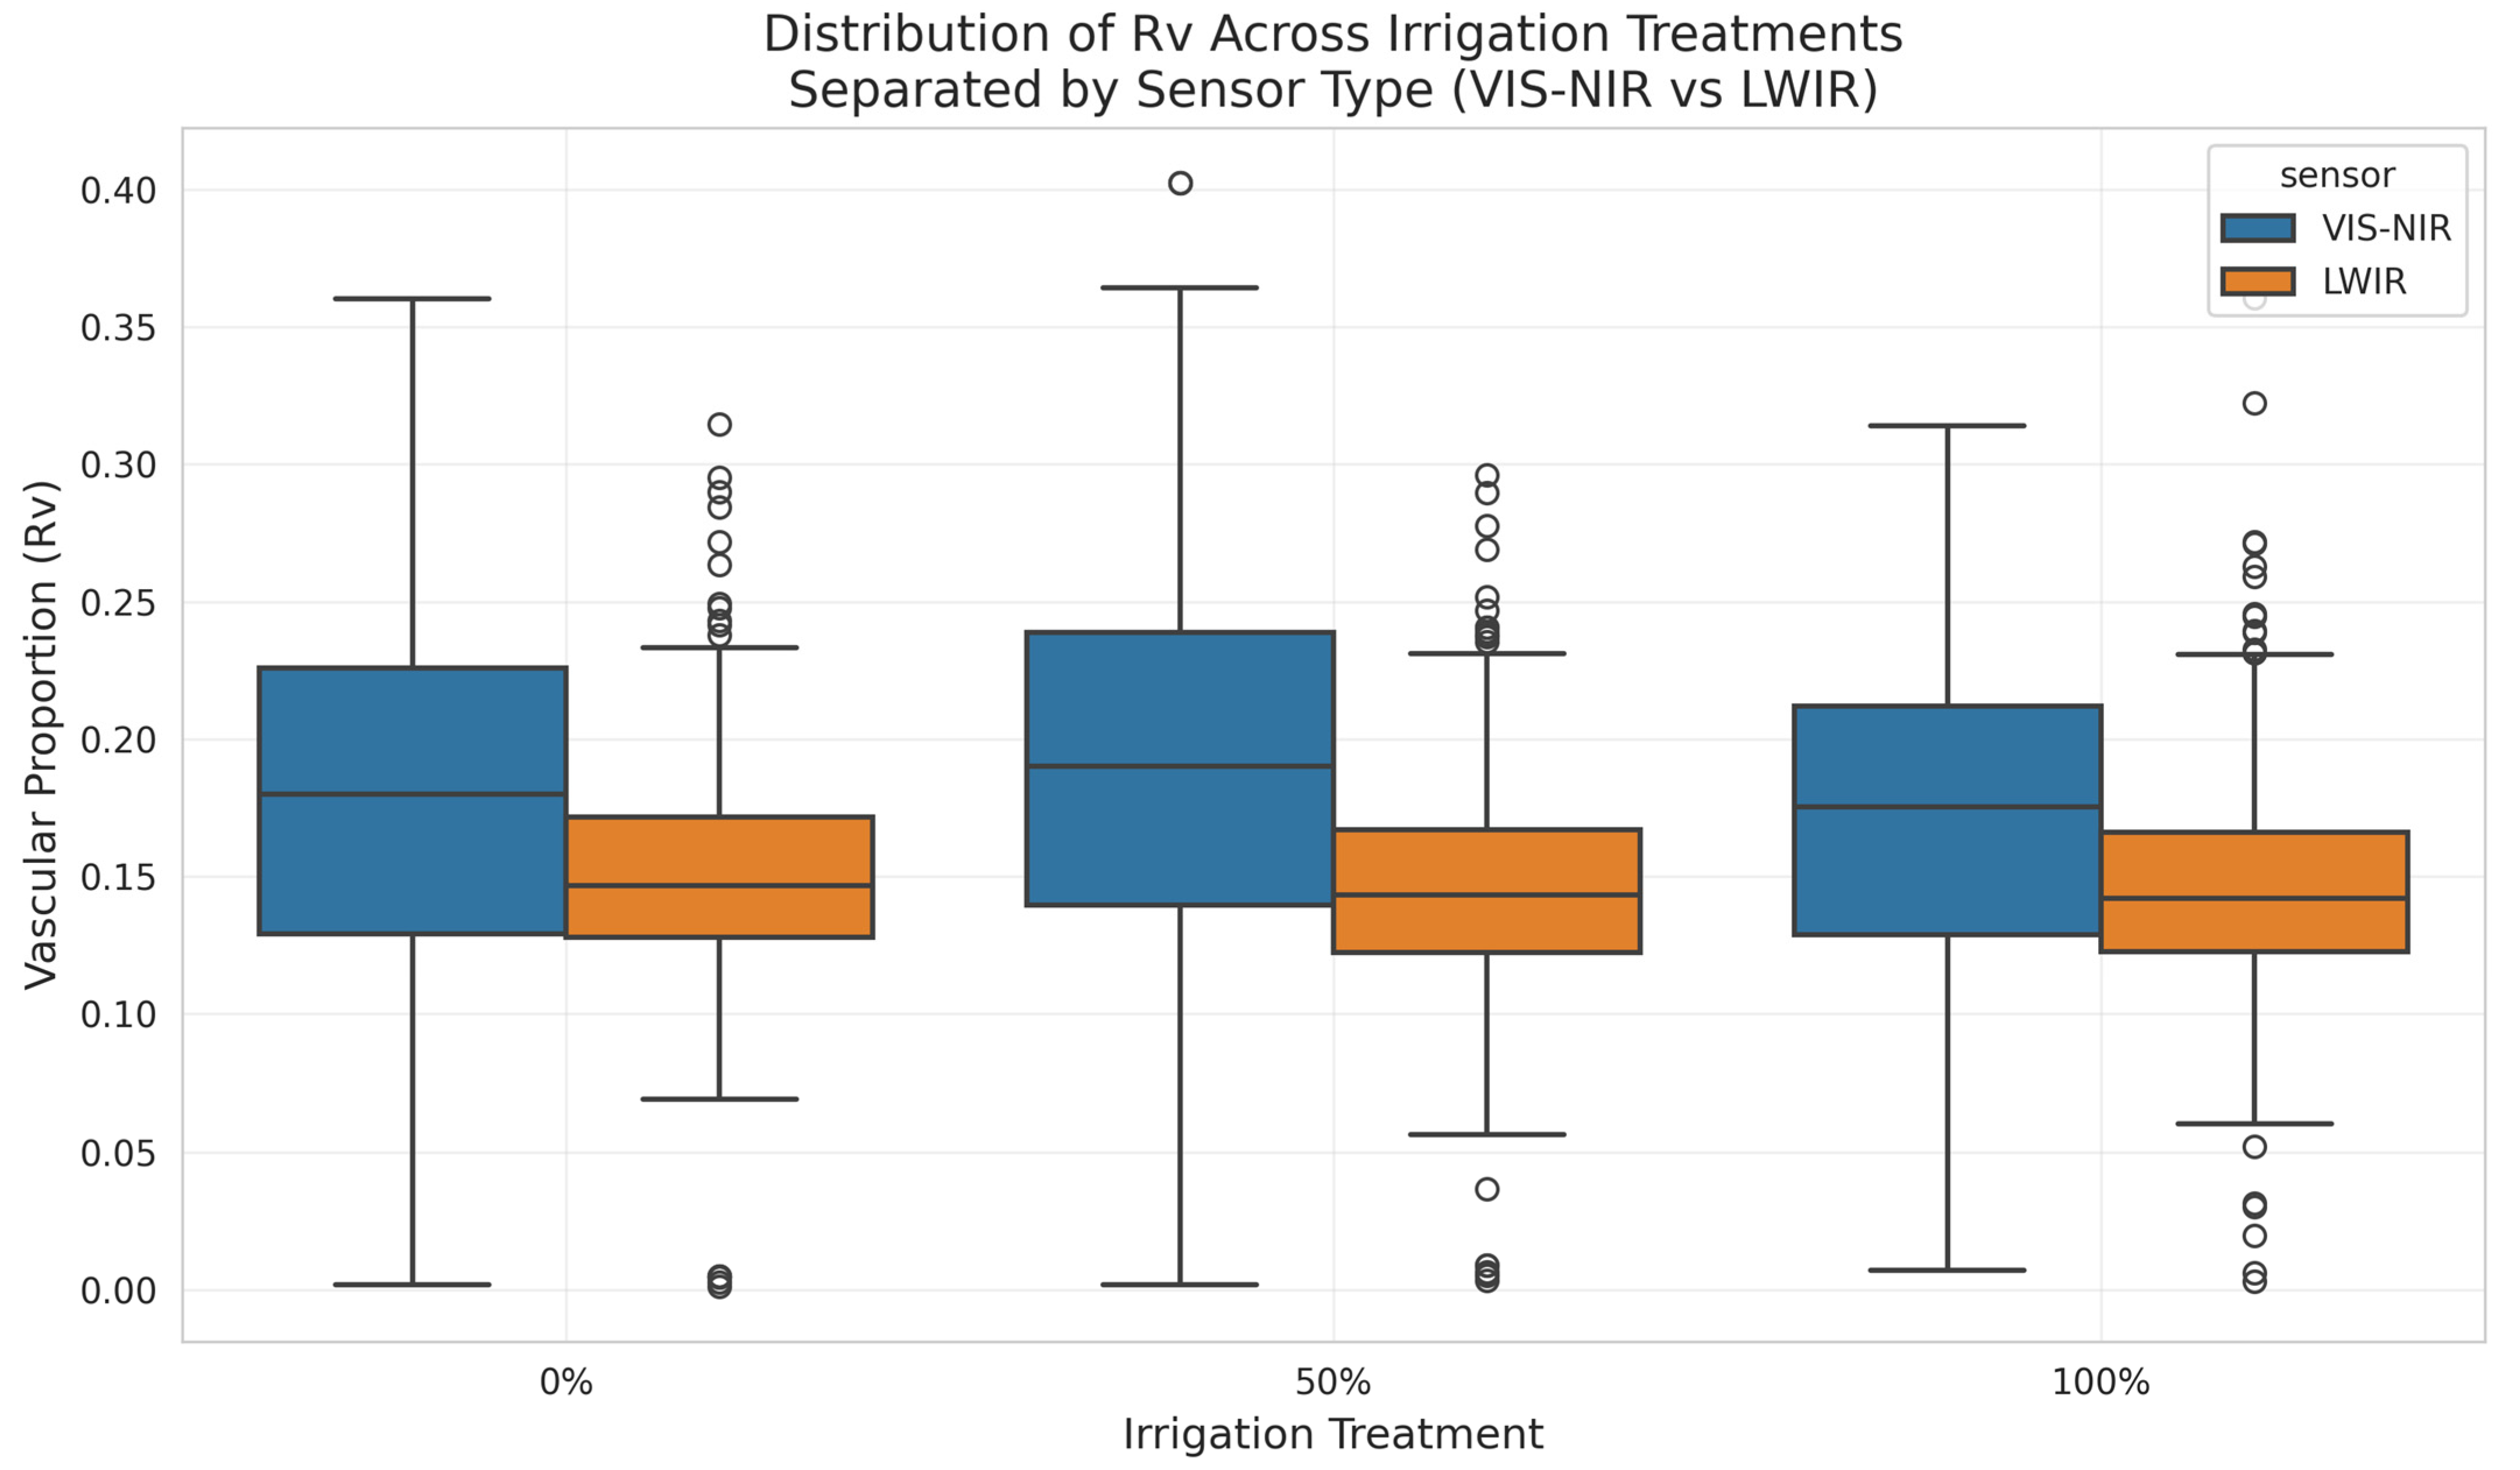
The factorial ANOVA revealed significant main effects for irrigation treatment (F = 11.01, p < 0.001, = 0.004), illumination condition (F = 13.01, p < 0.001, = 0.003), and spectral modality (F = 422.77, p < 0.001, = 0.079), with spectral band emerging as the dominant factor influencing the variability of . This strong dependence on the imaging modality indicates that the contrast available for segmentation differs substantially between the two bands, which constrains the comparability of values across modalities.
These findings align with established research on vascular metrics as drought indicators. Scoffoni et al. [
24] showed that higher major vein density was associated with lower leaf hydraulic vulnerability (|r| = 0.85–0.90,
p < 0.01), which motivates the evaluation of proportion-based vascular indices such as the
proposed here. Similarly, Blackman et al. [
27] found that leaf P50 was strongly correlated with the cubed conduit wall-thickness-to-lumen ratio in minor veins across a diverse set of woody angiosperms, reinforcing the relevance of structural vascular features for stress detection.
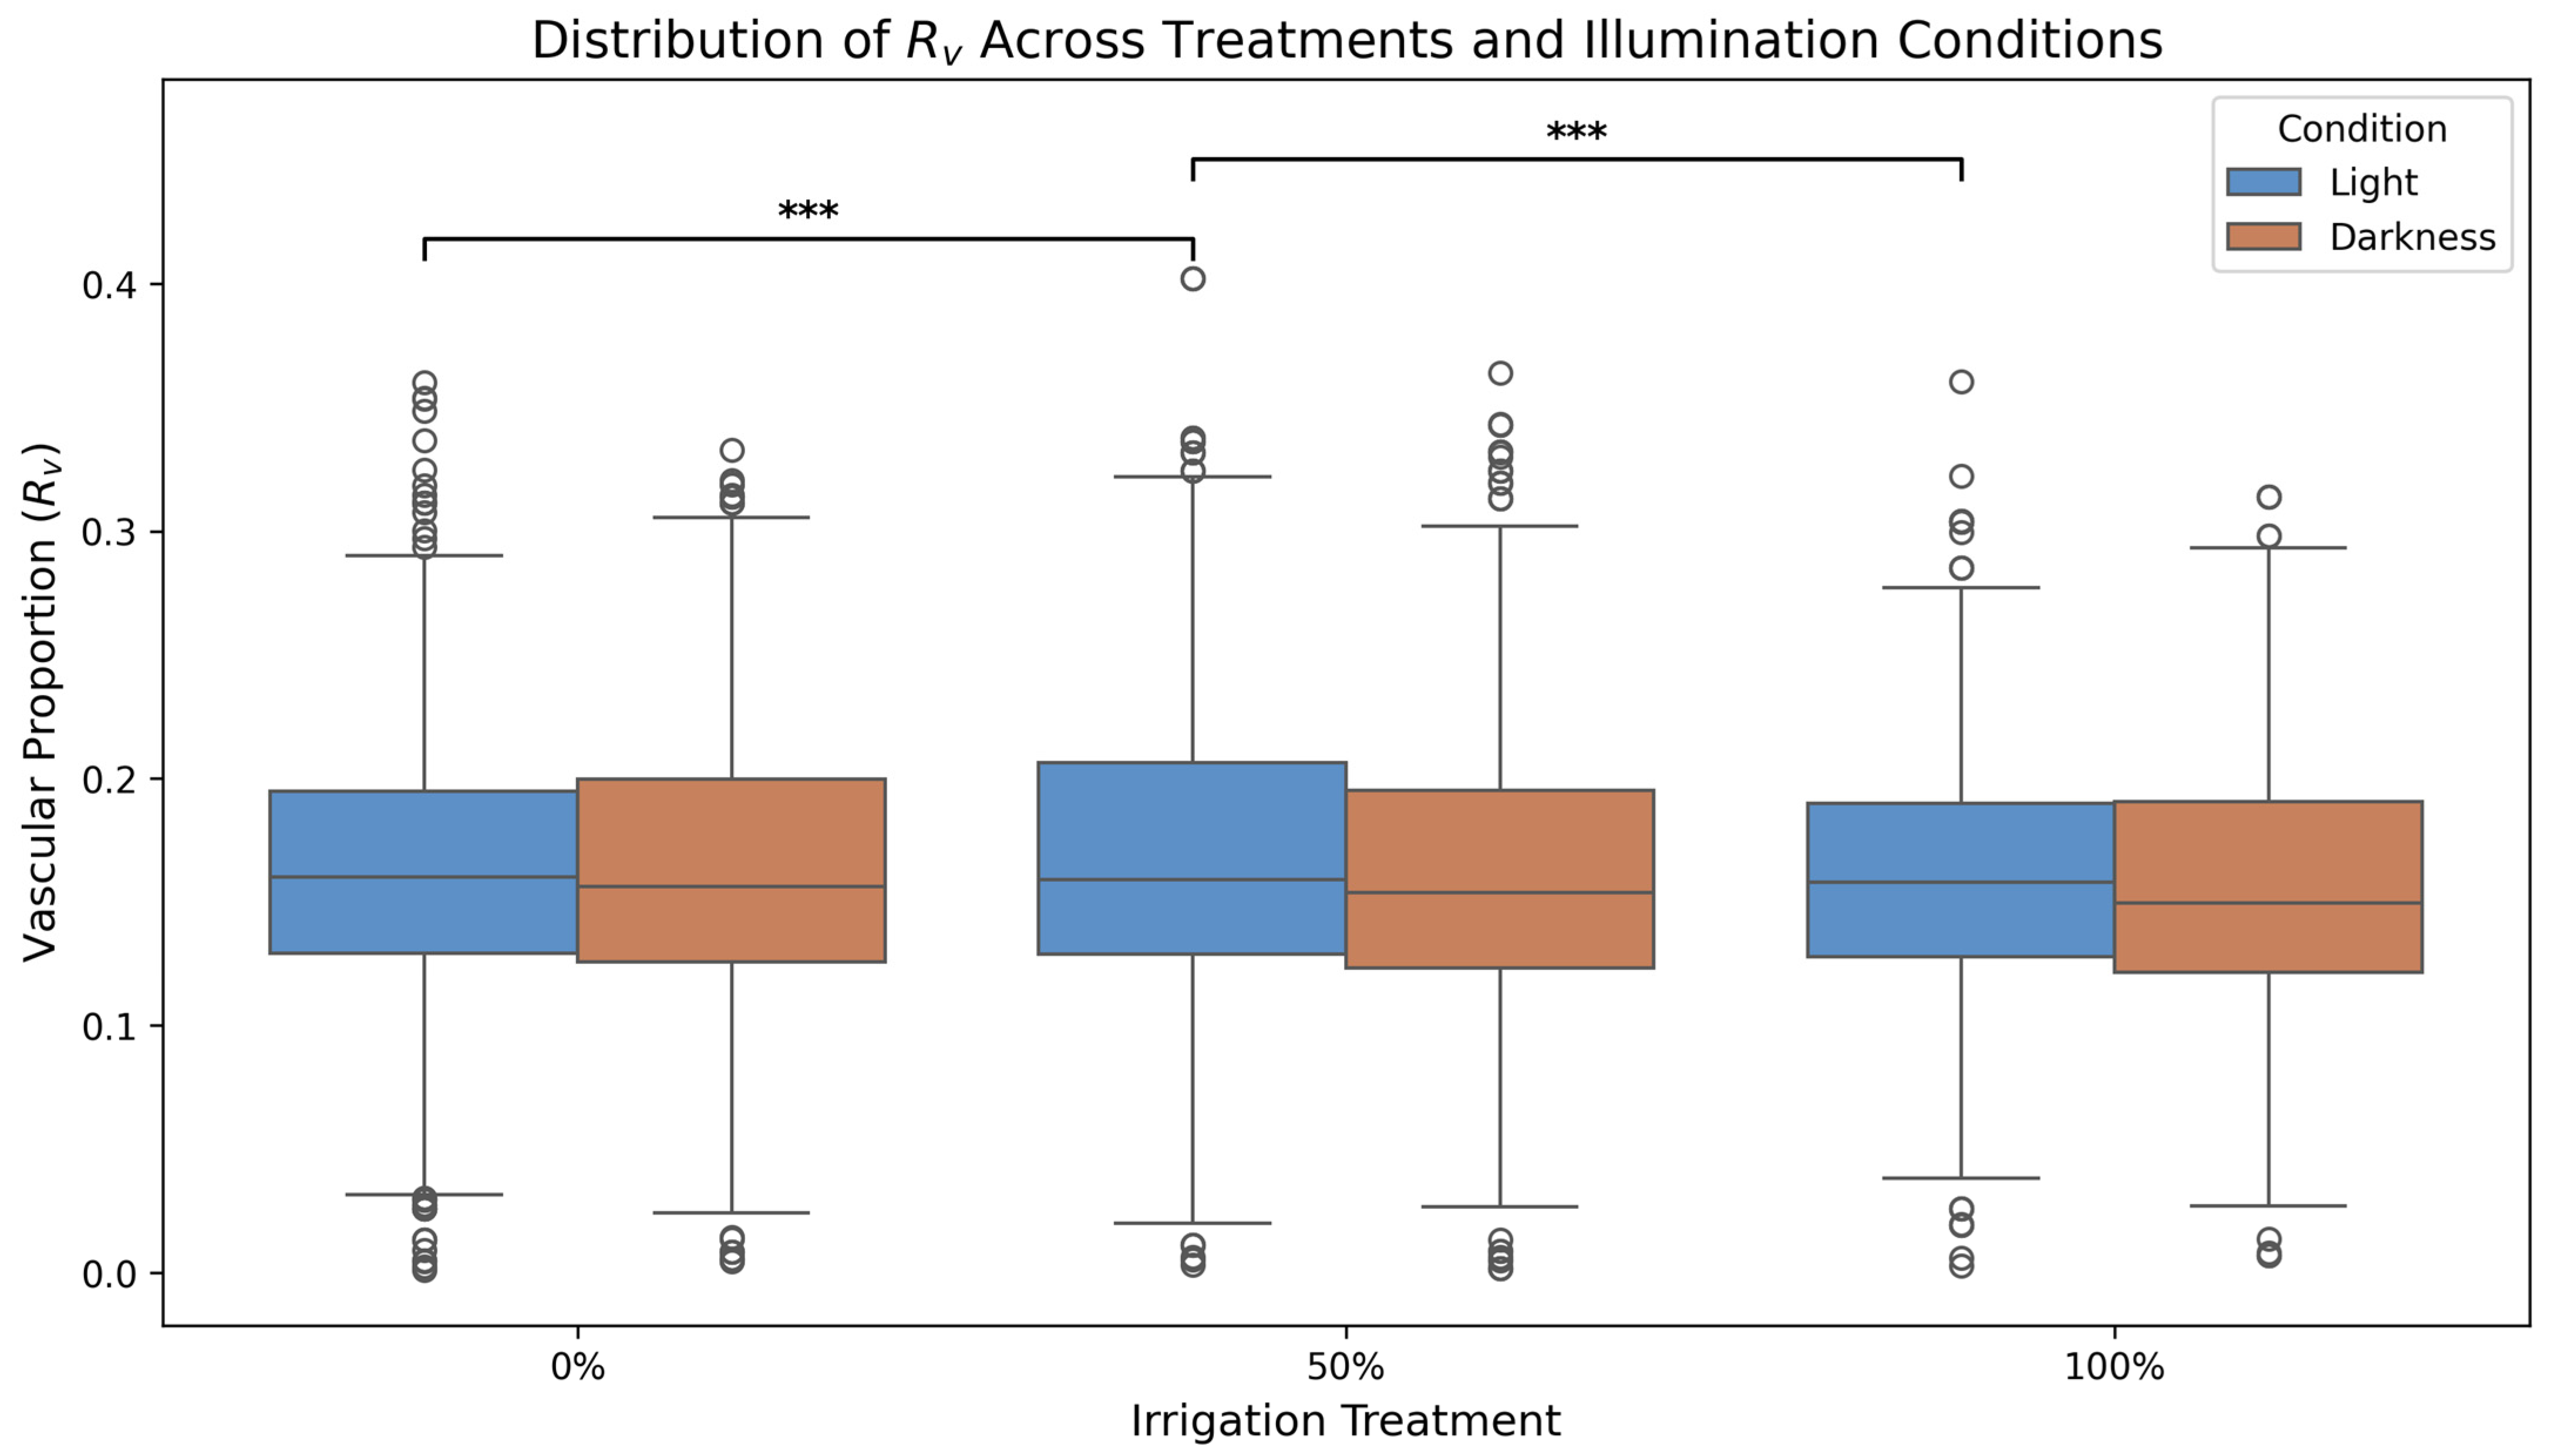
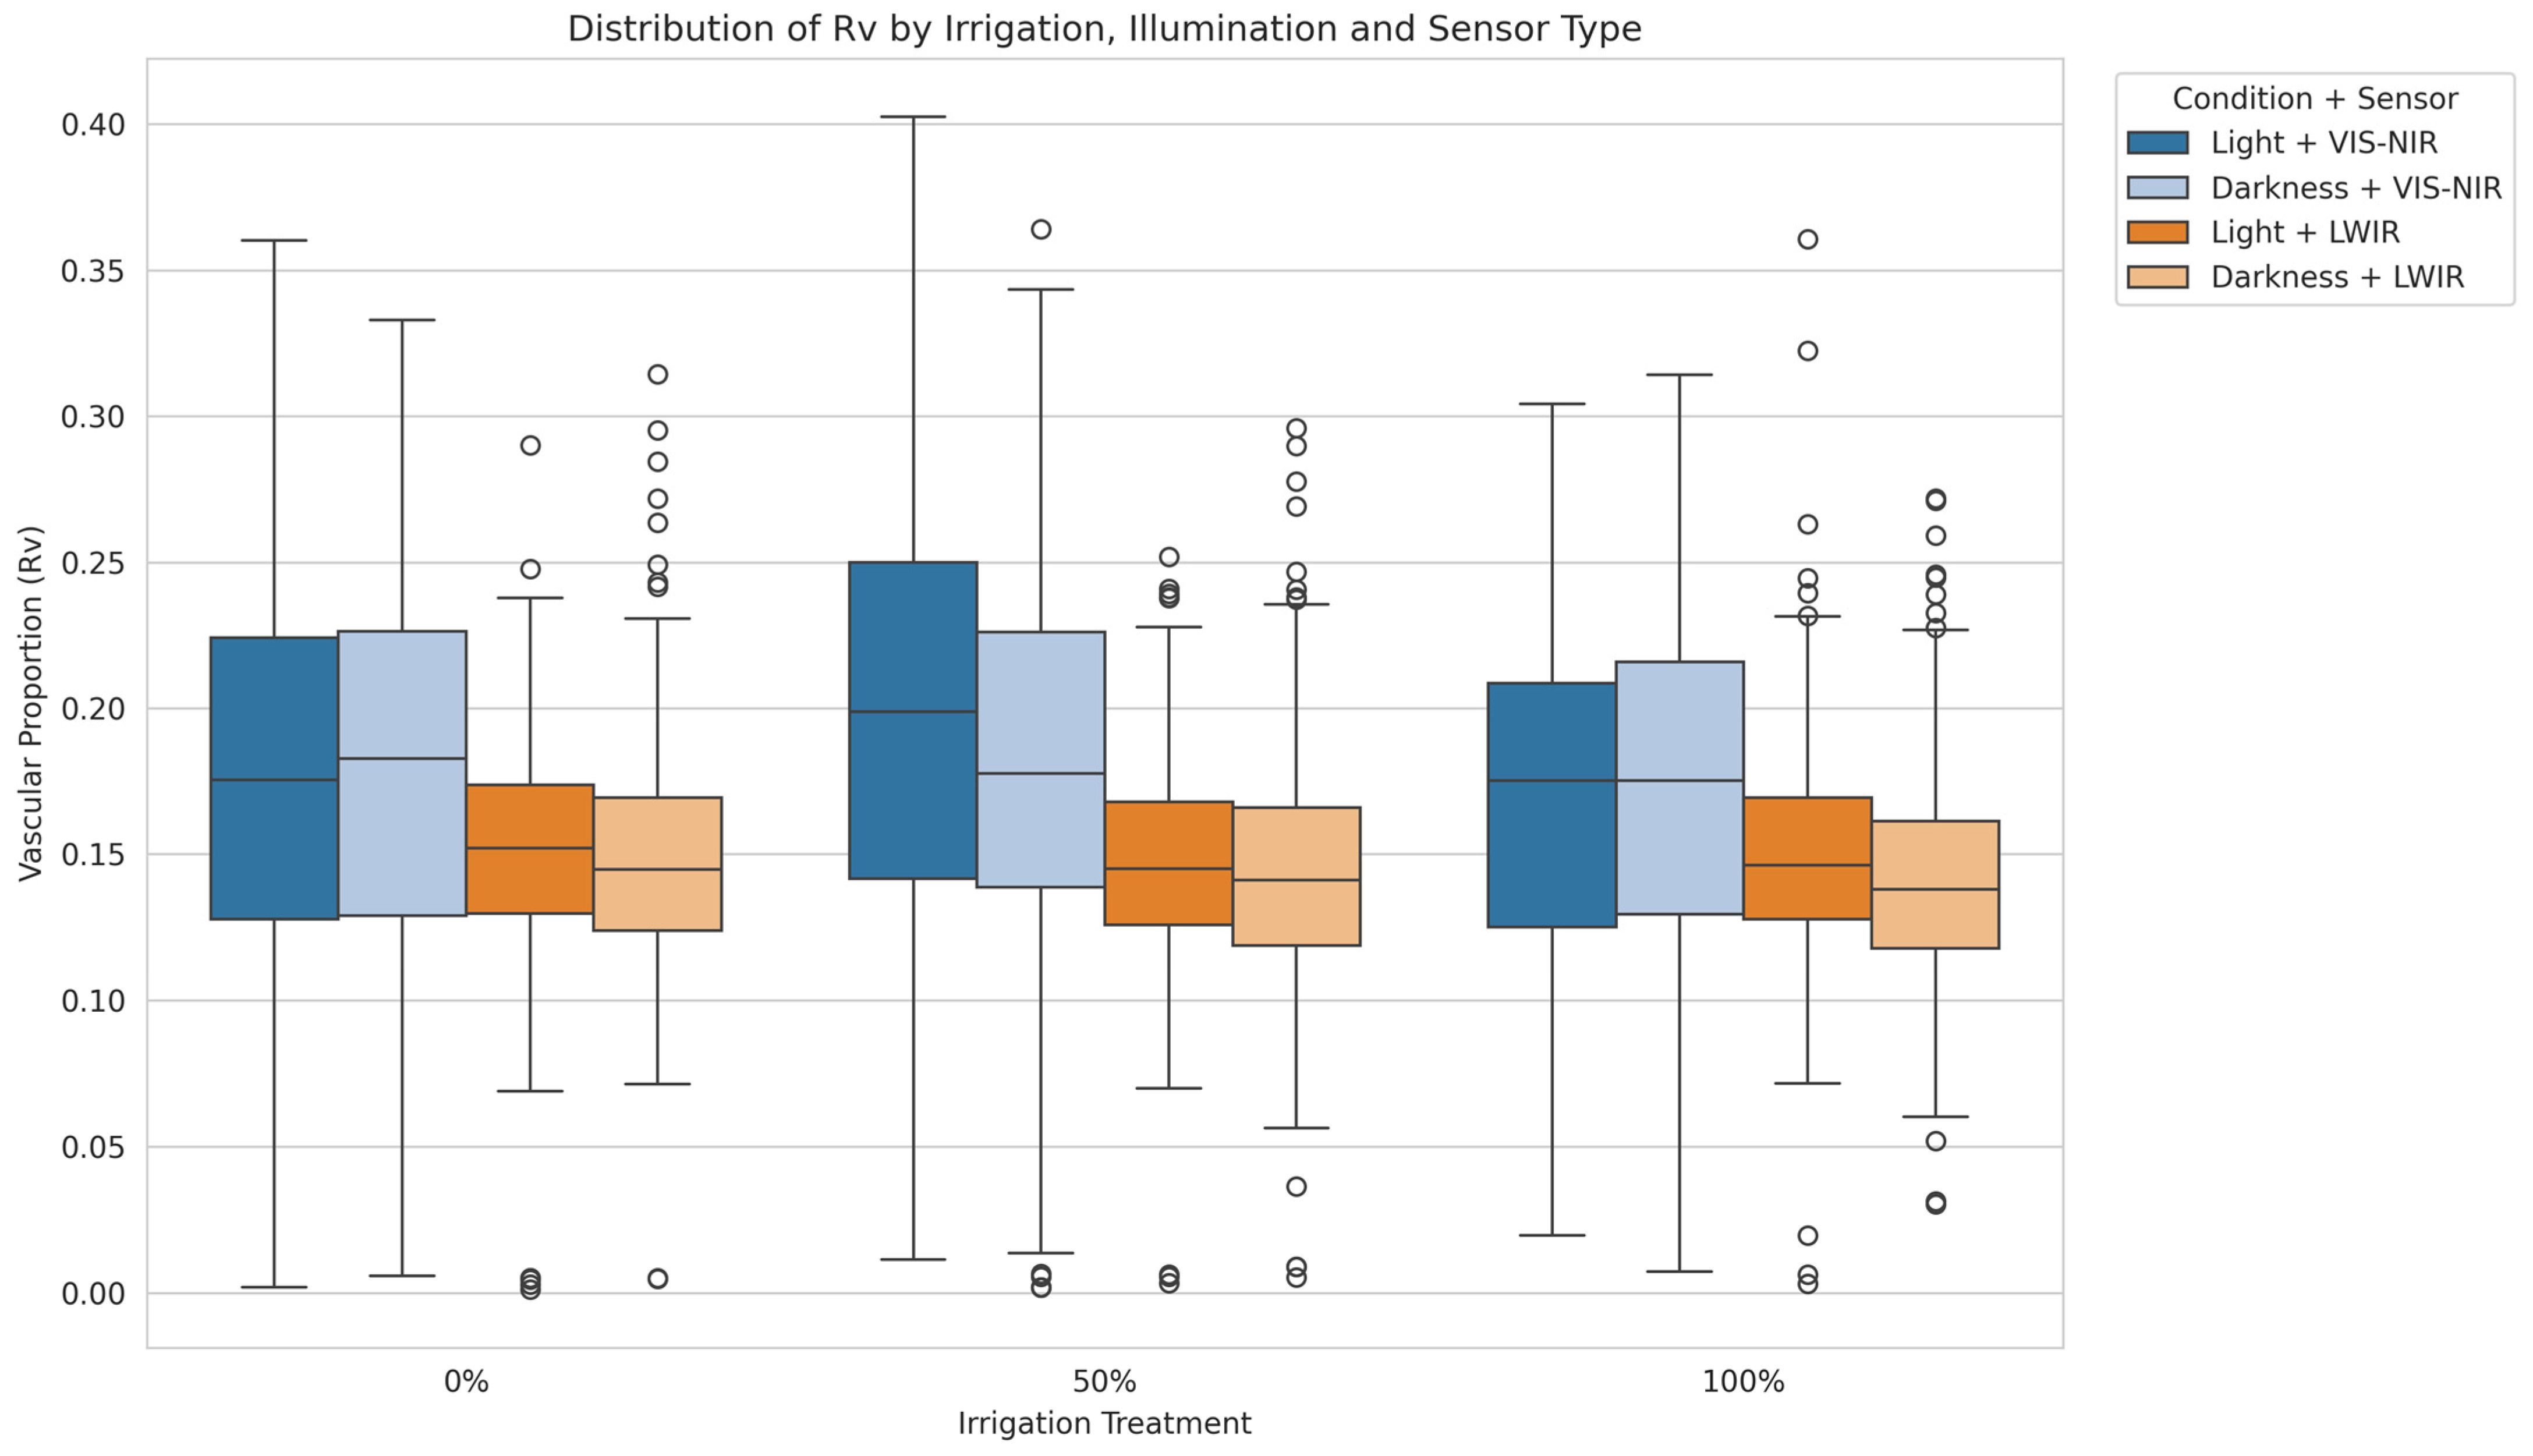
The boxplot of
distribution across combinations (
Figure 6) illustrates how sensor modality and illumination jointly affect treatment separability. Under Light + VIS-NIR conditions, the differences among the 0%, 50%, and 100% WL treatments were pronounced (100% vs. 50%: MD = 0.025,
p < 0.0001; 0% vs. 50%: MD = 0.020,
p = 0.0001), consistent with both the ANOVA main effects and Tukey’s HSD post hoc comparisons. This configuration produced the clearest discrimination, with significant pairwise differences between moderate water deficit (50% WL) and both irrigation extremes. In contrast, the absence of illumination markedly reduced
separability (VIS-NIR × Darkness: all
p > 0.09; LWIR × Light: all
p > 0.29), particularly under LWIR imaging. Only the extreme comparison (0% vs. 100% WL) reached statistical significance in the Darkness + LWIR configuration (MD = 0.007,
p = 0.026), indicating that thermal contrast alone is insufficient to resolve intermediate physiological states.
These findings align with documented physiological mechanisms of drought-induced vascular deterioration. Tabassum et al. [
25] reported that major vein thickness in rice decreased by up to 32.8% under severe water stress (15% PEG), depending on cultivar, while total vein density remained relatively stable, indicating that proportion-based metrics are more sensitive to acute stress than absolute density measurements. Furthermore, Brodribb et al. [
23] established that xylem network disruption precedes visible tissue death and irreversible loss of leaf functionality, positioning vascular integrity as a key morphological marker. This degradation is more readily captured by VIS-NIR reflectance imaging, which is sensitive to internal leaf structure and hydration levels. Thermal LWIR imaging, in contrast, is influenced by multiple environmental and surface factors, which may obscure subtle morphological changes associated with moderate stress. Complementary studies have also highlighted the feasibility of combining infrared sensing with image-based vegetation indices to detect water stress using low-cost hardware.
Leme de Paulo et al. [
32] reported that thermal information coupled with visible-band image processing can effectively estimate water stress levels in controlled environments. A distinct category of studies assesses irrigation effects through yield: Sezen et al. [
33] evaluated drip irrigation regimes on field-grown bell peppers under Mediterranean conditions, reporting yields between 21,390 and 35,920 kg ha
−1 depending on treatment. Such yield-based metrics are inherently retrospective, quantifying stress impact only after harvest, when corrective intervention is no longer possible.
Among plant-based approaches, Camoglu et al. [
7] validated CWSI in
Capsicum annuum cv. “California Wonder” under four irrigation treatments (100%, 75%, 50% and 25% WL), obtaining an
R2 = 0.91 between CWSI and stomatal conductance. That benchmark was established against an independently measured physiological reference; no equivalent reference was available in the present study so the discriminative capacity of
cannot be compared with it directly. The two approaches differ in their requirements: CWSI relies on canopy-level thermal measurements together with wet and dry reference surfaces, whereas
is extracted from single-leaf VIS-NIR images without reference surfaces or environmental correction. A study on red peppers using hyperspectral SWIR imaging identified 1449 nm as a critical wavelength for discriminating stress levels (
p < 0.05), directly targeting a water absorption band [
21]. That band lies well outside the 350–850 nm range of the camera used here, so the present study cannot exploit that hydration-specific spectral feature.
The statistical models applied in this study treat individual images as the unit of analysis. However, images were nested within leaves and leaves within plants, and irrigation treatment was applied at the plant level with three plants per treatment. The number of statistically independent units available for the treatment comparison is therefore substantially smaller than the number of images analyzed. This should be considered when interpreting the significance levels reported for the irrigation treatment effect and constitutes a limitation of the present analysis.
The three irrigation regimes evaluated bracket the physiological response range but do not represent the continuum of conditions encountered in commercial production, where intermediate regimes of approximately 75–85% water loss replacement are more common. Consequently, it is not possible to establish a dose–response relationship between water availability and the vascular proportion index. Characterizing such a relationship would require evaluating intermediate irrigation regimes together with a larger number of biological replicates per treatment.
The correspondence between the segmented mask and actual foliar venation was not verified against an independent anatomical reference. Establishing this correspondence, for example, by chemical clearing of leaf tissue to expose the venation skeleton, would be required before the index can be regarded as a validated measurement of vascular structure.
The two imaging modalities do not resolve comparable anatomical structures. At the 30 cm working distance, the LWIR modality has a native spatial resolution of 0.628 mm per pixel, which is coarser than the width of secondary and minor venation; vascular indices derived from this modality therefore cannot be interpreted as measurements of the venation network. The VIS-NIR modality, at approximately 136 µm per pixel, resolves primary and secondary veins but remains marginal for minor venation.
Images were acquired and stored in JPEG format with lossy compression (quality ≈ 75). Because the segmentation stage relies on local contrast enhancement (CLAHE) and morphological filtering, compression artifacts may contribute to the extracted vascular masks. The sensitivity of to compression level was not evaluated in the present study.
A further methodological limitation is the absence of direct soil water content measurements. Irrigation was applied as fixed volumes every third day rather than as replacement of measured water loss, and substrate moisture was not monitored, so the actual water status of the plants during the experiment was not documented. It should be noted that structural vascular metrics operate on developmental rather than instantaneous timescales: leaf venation architecture is fixed during expansion and records cumulative stress history rather than current soil conditions [
34], which is why foundational studies of vascular anatomy [
24,
25,
27] were validated against plant hydraulic metrics rather than soil moisture. Future validation studies should incorporate soil moisture sensors to enable direct correlation between
dynamics and substrate water availability during the developmental period in which vascular architecture is established.
Table 3 summarizes how
relates to the principal approaches reported for image-based water stress assessment. The comparison is presented as a methodological positioning rather than as a performance ranking, since the approaches differ in what they measure, in the reference against which they have been validated, and in their acquisition requirements.
Three characteristics distinguish
within this set. It is non-destructive, in contrast to venation metrics, which are obtained from microscopy of cleared leaves [
25,
26,
28] and to leaf turgor pressure probes [
7]. It requires no wet and dry reference surfaces or environmental correction, in contrast to CWSI-based methods [
7,
10,
18,
19]. And, it is computed from a single grayscale image using an explicit geometric definition, in contrast to hyperspectral [
21] and deep-learning [
16,
35] approaches, whose outputs are not directly interpretable in anatomical terms.
These characteristics concern the acquisition and computation of the index rather than its discriminative performance. The benchmarks reported for the established methods—
R2 = 0.91 between CWSI and stomatal conductance in
Capsicum annuum [
7], or |r| = 0.85–0.90 between major vein density and leaf hydraulic vulnerability [
24]—were obtained against independently measured physiological references. No such reference was available in the present study, and the discriminative performance of
could therefore not be established.
is accordingly presented here as a candidate morphological descriptor whose validation remains to be carried out, not as a method demonstrated to match or outperform existing approaches.
5. Conclusions
This study demonstrates that the foliar vascular proportion index (), derived from VIS-NIR and thermal imagery, is an effective and non-invasive indicator of water stress in Capsicum annuum L. var. Huichol. The factorial ANOVA confirmed significant effects for irrigation treatment (p < 0.001), illumination (p < 0.001), and spectral modality (p < 0.001), with spectral band explaining the largest proportion of variance ( = 0.079).
The results show that the discriminative capacity of depends strongly on the imaging configuration. Among all conditions evaluated, the Light × VIS–NIR configuration consistently provided the clearest separation among irrigation treatments, with significant pairwise differences between 50% WL and both 100% WL (MD = 0.025, p < 0.0001) and 0% WL (MD = 0.020, p = 0.0001). In contrast, both LWIR imaging and the absence of illumination substantially reduced the ability to distinguish stress levels (Darkness × VIS–NIR: all p > 0.09; Light × LWIR: all p > 0.29), particularly in intermediate physiological states.
Unlike canopy-level thermal approaches [
10,
18,
19], the proposed method operates at the individual leaf scale. This offers practical advantages: it does not require canopy-scale thermal instrumentation or reference surfaces and can be implemented both in situ (greenhouse conditions) and in vitro (laboratory settings), enabling accessible and scalable water stress monitoring in controlled horticultural production systems.
The
index targets a gap identified in the literature: while most image-based stress detection methods focus on surface temperature or global spectral indices, few have exploited the structural response of the foliar vascular network [
27]. The correlation reported for vascular ratios in other species (|r| = 0.85–0.90 for major vein density [
24]) was obtained against measured leaf hydraulic vulnerability and provides a reference against which
would need to be validated. Such validation was not possible in the present study.
The camera’s sensitivity range (350–850 nm) covers the pigment-related absorption peaks around 400 and 750 nm reported by Espinosa-Calderón et al. [
28] across multiple crop species (bean, radish, chilli, maize, and prickly pear), whereas the water-related absorption features reported in the same work (1500–3000 nm) lie outside it. Since acquisition was performed without spectral filtering, the recorded signal integrates the visible and near-infrared response. The vascular contrast captured by
is therefore more plausibly attributable to structural and pigment-related differences between veins and lamina than to hydration-related optical properties, which was not established in the present study.
A methodological limitation of the present study is the absence of direct soil water content measurements. While the WL -based irrigation protocol follows established standards for controlled water stress experiments, future validation studies should incorporate soil moisture sensors to enable direct correlation between dynamics and substrate water availability during the critical developmental period when vascular architecture is established.
Future work should first address the design limitations identified above: evaluating a wider range of irrigation regimes, including the intermediate levels used in commercial practice, with a larger number of biological replicates per treatment, and incorporating direct soil moisture monitoring. Beyond this, the methodology could be extended to greenhouse and open-field environments, incorporating temporal modeling to capture stress progression and evaluating the scalability of the approach using automated or drone-based imaging platforms.




 ,
,