1. Introduction
Agriculture is a major source of income for nearly 70% of India’s population, and farm returns are strongly dependent on crop yield. However, weed infestation, diseases, and insect damage pose significant challenges, leading to substantial yield losses and reduced produce quality. Without crop protection, potential losses can range from 43 to 50% in food crops and 53–68% in cash crops [
1]. Consequently, agrochemicals applied in the form of sprays have become an essential component of modern agricultural practices. Globally, agrochemical consumption is approximately 2 million tonnes per year [
2], and India ranks third in pesticide consumption of approximately 0.29 to 0.31 kg ha
−1 among Asian countries [
3], indicating a continued rise in usage to achieve higher productivity.
Agrochemicals—including insecticides, fungicides, herbicides, and nutrients-are typically applied as fine droplets using conventional agricultural sprayers. Among the commonly practiced spraying methods (broadcasting, band application, and spot application), most farmers rely on broadcasting using backpack, self-propelled, tractor-operated, and air-assisted sprayers. In this method, the entire field is sprayed uniformly at a constant discharge rate, irrespective of plant presence, size, or canopy characteristics. As a result, over-application, spray drift, and excessive off-target losses occur, primarily due to variations in plant spacing and canopy structure combined with a constant spray delivery rate [
4]. Such non-target-based spraying can lead to off-target losses as high as 60–70% [
5,
6], increasing the risk of crop damage [
7] and environmental contamination [
8,
9]. Moreover, exposure to sprayed chemicals poses serious health risks to workers and nearby populations, while chemical residues contaminate soil and the food chain. Therefore, reducing agrochemical usage and dependence on conventional spraying techniques, without compromising crop productivity, has become a critical requirement.
The resistance of plants to agrochemicals, particularly herbicides, has been increasing and poses a serious threat to crop production in many countries [
10,
11]. These challenges associated with conventional spraying methods have motivated researchers to develop advanced spray technologies and application strategies aimed at reducing agrochemical consumption [
12]. Among alternative approaches, band application—where pesticides are applied in parallel strips—offers improved efficiency over uniform spraying, while spot application involves plant- and target-specific spraying using variable-rate sprayers to control weeds, diseases, and insect infestations more effectively. Reduced pesticide usage contributes to safer and healthier food products for consumers. The integration of electronics [
13], artificial intelligence (AI) [
14,
15], and automation [
16,
17] into sprayer systems has significantly improved operational efficiency and operator safety. These advanced techniques require early and accurate detection of the spatial distribution of pests, diseases, and weeds. Accordingly, precision spraying systems rely on three key components: (i) sensors for plant data acquisition, (ii) processing algorithms to estimate chemical requirements, and (iii) flow-control mechanisms to regulate spray delivery, supported by specialized equipment and machinery. However, for widespread adoption in regions dominated by small and medium-sized farms, such as India, precision spraying technologies should also be affordable, robust, and easy to operate with minimal technical expertise. Therefore, simple sensor-based systems that can be readily integrated into conventional sprayers remain highly relevant for improving input-use efficiency under practical farming conditions.
Air-blast and electrostatic spraying techniques have been introduced to apply agrochemicals using fan-assisted methods. Electrostatic sprayers operate on the principle of attraction between oppositely charged particles to reduce the wastage of spraying chemicals. A variety of sensing techniques, including machine vision, spectral image analysis, remote sensing, and machine learning (ML) were applied in sprayers [
18,
19,
20,
21]. Ultrasonic sensors have been used for automated orchard sprayers to detect the presence of trees and control the volume of spray application [
22]. Other sensors such as LiDAR, laser and X-ray sensors can also be used for plant detection purposes. Wei and Salyani [
23] used a laser scanning system to quantify foliage density of citrus trees and compared it to visual assessments. It showed a strong correlation (R
2 = 0.96; RMSE = 6.1%) and less than 3% coefficient of variation. Oberti et al. [
24,
25] developed a robot capable of detecting and spraying on 85% to 100% of the diseased area and reducing pesticide use from 65% to 85%. According to Brown et al. [
26], the target-based spraying technique can reduce 41% ground deposition and 44% pesticide concentration in surface water runoff compared to conventional spraying. Studies show that precision spraying technologies can reduce agrochemical usage in the range of 9.90% to 51.22% [
27]. As shown in
Table 1, the selection of sensing technology depends on the intended application and operational requirements. While machine vision systems are well suited for crop health assessment and intelligent target recognition, ultrasonic and LiDAR sensors are primarily employed for canopy detection and spray control. Since the objective of the present study was rapid canopy detection for real-time nozzle actuation rather than crop health diagnosis, LiDAR provided a suitable sensing solution because of its rapid response and accurate distance measurement.
The present study aims to develop and experimentally evaluate a plant detection-based nozzle actuation system for precision spraying applications. The system is designed to enable real-time spray control based on canopy presence, thereby reducing off-target losses and improving input-use efficiency. While earlier studies primarily focused on canopy characterization, robotic spot spraying, or variable-rate pesticide application, the present study emphasizes sensor–actuator synchronization for accurate spray delivery. Particular emphasis is placed on systematically evaluating the influence of sensor–nozzle distance, sensor–canopy distance, and forward speed on spray deposition performance under controlled laboratory conditions. The performance of the system is assessed by analyzing the effects of these operational parameters on spray deposition characteristics, with the objective of identifying optimal operating conditions that ensure effective target coverage while minimizing chemical wastage.
The novelty of the present study lies in the following key contributions: (i) the development of a compact and cost-effective LiDAR-based plant detection and nozzle actuation system; (ii) a systematic investigation of sensor–actuator synchronization through controlled variation sensor–nozzle distance, sensor–canopy distance, and forward speed; (iii) the application of response surface methodology (RSM) to optimize operating parameters for maximizing canopy deposition while minimizing off-target losses; and (iv) experimental validation of a single-nozzle precision spraying system using a conveyor-based laboratory setup simulating field conditions.
2. Materials and Methods
2.1. Development of a Plant Detection-Based Nozzle Actuation System
The primary objective of the nozzle actuation system was to enable real-time detection of plant canopy and to control the ON/OFF operation of individual spray nozzles accordingly. This approach was intended to minimize agrochemical consumption and to reduce environmental contamination by avoiding unnecessary spraying in off-target areas. The canopy detection and nozzle actuation system was designed to operate accurately under outdoor field conditions and to respond rapidly enough to match the forward speed of the vehicle.
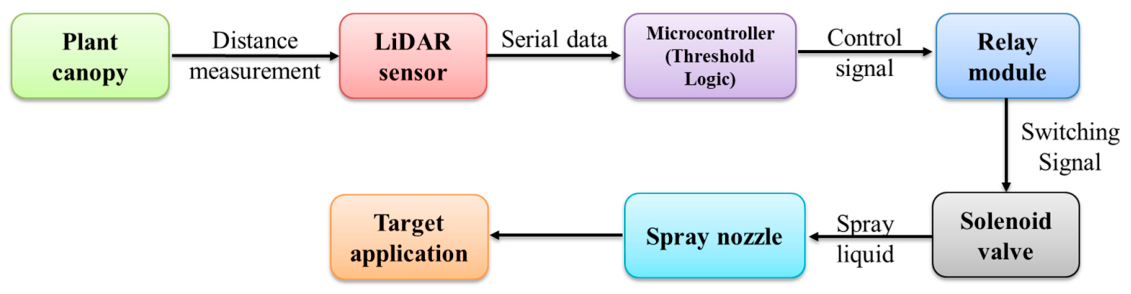
Figure 1 presents the overall architecture of the developed plant detection-based nozzle actuation system. The system integrates sensing, processing and control, actuation, and power supply subsystems to enable real-time canopy-based spray control. Distance information acquired by the LiDAR sensor is processed by the microcontroller to actuate the spray nozzle through a relay–solenoid valve mechanism. The architecture illustrates the overall flow of information and control signals within the system, while the individual components and their selection criteria are described in the following sections.
The plant detection-based nozzle actuation system consisted of two major units: (i) the plant/canopy detection unit and (ii) the spray nozzle actuation control unit. The major electronic components required for these units included a plant/canopy detection sensor to detect the presence or absence of plant canopy within the desired range in real time, and a microcontroller that served as the logical processing unit, receiving sensor data and generating electrical signals to control the ON/OFF operation of the spray nozzle.
In the control mechanism, an electromechanical relay module was used as an interface between the microcontroller and the electromechanical valve (solenoid valve), which regulated the flow of liquid from the spray pump to the nozzle. Additionally, a DC–DC step-down buck converter was used to convert the input supply voltage into the operating voltage required by the electronic components. The selection of these components is described in the following sections.
2.1.1. Plant/Canopy Detection Sensor
An object detection sensor was required to identify the presence or absence of plant canopy within its sensing range. Depending on its sensing principle, a sensor emits a physical signal such as light, sound, electromagnetic field, or radar waves and receives the reflected or altered signal when an object enters the detection zone. Variations in signal intensity, time delay, or frequency are processed to determine the presence of an object, and the resulting electrical output is used for actuation control.
Various sensing options were available commercially. Ultrasonic sensors were commonly used in agricultural applications because they are inexpensive and perform reliably under outdoor conditions [
18,
21,
28,
29]. However, their relatively wide sensing angle often leads to cross-talk and false detections when multiple sensors are mounted on a spray boom [
29,
30]. A sensor with a narrow field of view is more appropriate for row-wise canopy detection on a boom. Therefore, a Light Detection and Ranging (LiDAR) sensor was selected due to its narrow field of view (FOV) and strong resistance to ambient light interference [
31,
32]. LiDAR operates by emitting laser pulses and measuring their time of flight to determine object distance. A compact mini-LiDAR module (TF-LUNA Micro, Benewake Co., Ltd., Beijing, China) with an 8 m sensing range and 2° FOV was chosen for canopy detection. The sensor was configured to operate at a sampling frequency of 100 Hz, providing sufficiently rapid distance measurements for real-time canopy detection and nozzle actuation.
Although RGB camera-based systems can provide additional information related to plant morphology, growth stage, disease symptoms, and crop stress, they generally require high-resolution image acquisition, computationally intensive image-processing algorithms, and relatively powerful embedded computing platforms for real-time operation. In addition, camera-based systems often require periodic calibration and software updates to maintain reliable performance under varying field conditions. Since the objective of the present study was limited to rapid canopy presence detection for nozzle actuation, a LiDAR sensor was preferred because it provides direct distance measurements, operates reliably under varying illumination conditions, and requires minimal computational resources. Furthermore, the proposed system was intentionally designed as a simple and user-friendly solution that can be readily adopted in small and medium-scale farming systems, where ease of operation, affordability, and low maintenance are important considerations. This facilitates rapid sensor–actuator synchronization and enables operation at practical field speeds without compromising field capacity.
2.1.2. Microcontroller Unit
The microcontroller was required to have adequate processing capability to manage the operation of various system components, including the LiDAR sensor, relay module, and electromechanical (solenoid) valve. It should have sufficient input–output (I/O) pins and memory, low power consumption, robustness for field conditions, and low cost. Considering these requirements, an ESP32 development board (ESP32 DevKit V1; Espressif Systems, Shanghai, China) was selected as the main controller for the system. This microcontroller offered dual-core processing capability, a high clock speed, low energy consumption, and compatibility with multiple programming and development environments. Moreover, its capability to interface efficiently with sensors and actuators, while supporting real-time control operations, made it suitable for implementing canopy-based nozzle actuation logic in precision spraying systems.
2.1.3. Electromechanical Relay Module
An electromechanical relay module was used to interface the low-power microcontroller with the high-power spray control component (solenoid valve). The ESP32 operates at a low voltage level (3.3–5 V) and is not capable of directly controlling high-current loads. Therefore, the relay served as an electrical switching device that allowed the control signal from the microcontroller to safely operate the solenoid valve. When the LiDAR sensor detected a plant canopy, the microcontroller activated the relay, which in turn energized the solenoid valve and allowed spray discharge. In the absence of a plant canopy, the relay disconnected the power supply to the valve, ensuring that the nozzle remained OFF, thereby conserving spray chemicals.
For this purpose, a 5 V Single-Pole Double-Throw (SPDT) (SRD-05VDC-SL-C; SONGLE Relay Co., Ltd., Wenzhou, Zhejiang, China) high-level trigger relay module was selected. The module can be directly driven by the microcontroller and is capable of switching loads up to 10 A at 30 V DC, ensuring reliable and safe control of the solenoid valve operation. The relay module consists of power input and signal pins on one side, while the output side includes common (COM), normally open (NO), and normally closed (NC) terminals, which facilitate flexible connection with external devices.
2.1.4. High-Pressure Solenoid Valve
A solenoid valve was used as the final control element in the plant detection-based nozzle actuation system. It functioned as an electromechanical valve for regulating liquid flow in the spray nozzle and enabled precise ON/OFF control of the nozzle based on the signal received from the detection sensor and microcontroller. The solenoid valve selected for the system was required to withstand a pump pressure of approximately 15 kg cm−2 and to operate as a normally closed (NC) type, opening only when its coil was energized. Considering these requirements and incorporating an adequate safety margin, a commercially available 24 V high-pressure solenoid valve (Techno 5404-04D; Techno Pneumatics, Ahmedabad, Gujarat, India) having a maximum operating pressure of 45 kg cm−2 was selected for the system. The selected valve was of the direct-acting type, which did not require a pressure difference between the inlet and outlet for operation and could function effectively even at zero pressure instantly. Moreover, its design did not rely on very small internal orifices (< 1 mm), making it relatively tolerant to minor particulate contamination in the liquid, which is advantageous for agricultural spraying applications.
2.1.5. DC-DC Buck Step-Down Power Converter
The solenoid valve used in the system required a 24 V power supply, whereas the other selected electronic components involved in the nozzle actuation system—namely the LiDAR sensor, ESP32 development board, and relay module, operated at 5 V. Therefore, a step-down power converter was required to step down the input supply voltage from 24 V to 5 V to ensure safe and reliable operation of these components.
To meet this requirement, a DC–DC buck step-down converter module (LM2596S) was selected. This module is capable of delivering an output current of up to 3 A, which was sufficient to meet the combined peak current requirement of approximately 0.54 A for the LiDAR sensor, microcontroller, and relay module. The converter efficiently reduced the input voltage while maintaining a stable output voltage, thereby ensuring reliable operation of the low-voltage electronic components in the system.
2.1.6. Spray Nozzle Assembly and Nozzle Control Hardware
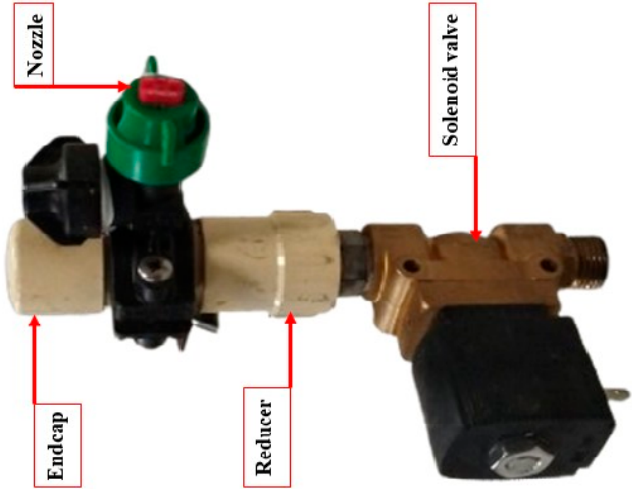
A spray nozzle assembly (
Figure 2) was fabricated by incorporating an anti-drip nozzle body (Quick TeeJet QJ17560A; Spraying Systems Co., Wheaton, IL, USA) mounted on a 50 mm diameter PVC pipe, sealed with an end cap on one side and fitted with a 25.4 to 12.5 mm reducer on the other side for attachment of the solenoid valve. The anti-drip nozzle body included a diaphragm-type check valve with a minimum opening pressure of 70 kPa, ensuring instantaneous cut-off of liquid flow and preventing post-shutoff dripping. The solenoid valve was connected in series with the nozzle assembly to regulate spray discharge. The valve’s inlet was connected to the spray pump outlet, while its outlet port was connected to the nozzle assembly to enable precise actuation. The power supply of the solenoid valve was controlled by the relay module based on the control signal received from the plant detection unit.
Flat-fan nozzles are commonly used in agricultural spraying due to their ability to produce a uniform, sheet-like spray pattern, especially when multiple nozzles overlap correctly [
33]. For this study, the TeeJet XR11004-VP extended range flat-fan nozzle was selected. This nozzle provided a 110° spray angle, had an orifice size of approximately 1.6 mm, and can deliver a maximum flow rate of 1.85 L min
−1 at 400 kPa, making it suitable for broadcast spraying applications required in the experiments.
2.2. Development of the Electronic Control Circuit
The electronic control circuit was developed to enable precise ON/OFF actuation of a spray nozzle based on real-time canopy detection. Using Fritzing (version 1.6.9)—an open-source electronics design platform—the electronic circuit layout was systematically developed to convert the conceptual design into a stable, field-deployable configuration.
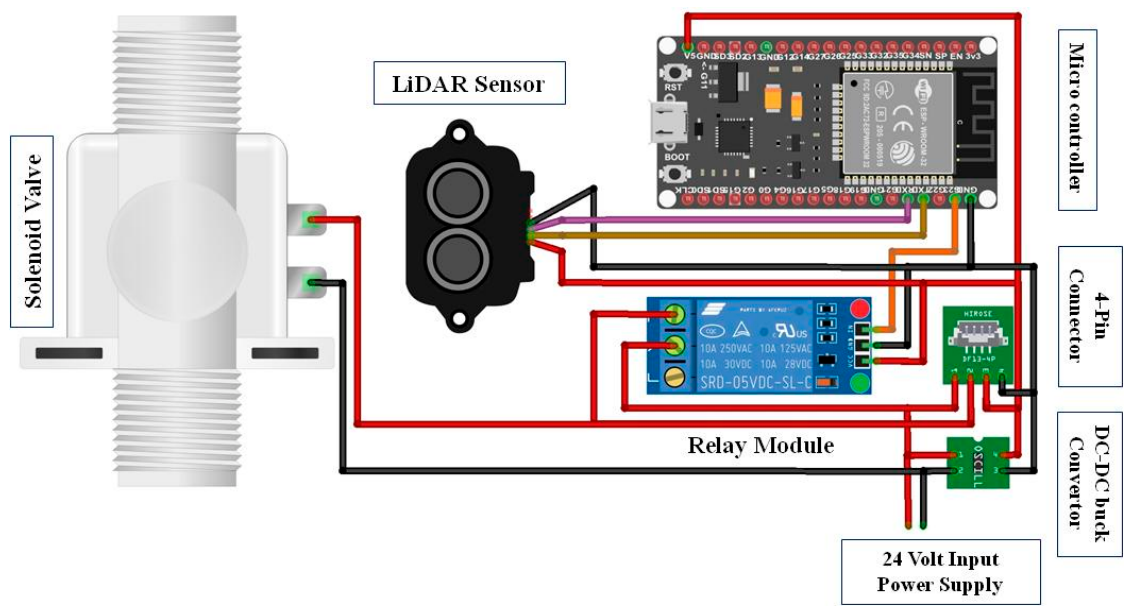
The system required a 24 V DC supply for the solenoid valve, whereas the ESP32 development board, LiDAR sensor, and relay module operated at 5 V DC. To meet these requirements, the 24 V input was stepped down using a DC–DC buck converter, which provided a regulated 5 V supply to all low-voltage components. Serial communication between the ESP32 and the LiDAR sensor was established by interfacing the RX2 (GPIO 16) and TX2 (GPIO 17) pins of the microcontroller with the sensor’s Tx and Rx terminals. The relay module input was interfaced with GPIO 23, enabling the ESP32 to send digital HIGH/LOW commands for switching the relay module. The solenoid valve was wired such that one terminal received the 24 V DC supply directly, while the other was connected through the Normally Open (NO) terminal of the relay module. When the relay was energized, the circuit completed, allowing current to pass through the solenoid valve and initiate spray discharge. A detailed schematic of the electrical connections of the plant detection unit is presented in
Figure 3.
2.3. Microcontroller Programming for Automated Nozzle Actuation
The microcontroller (ESP32) was programmed using the Arduino Integrated Development Environment (IDE) (version 2.1.1), which is widely used in automation and precision agriculture due to its versatility and compatibility with various sensors, actuators, and communication modules [
34,
35]. In this study, the Arduino IDE was employed to interface the ESP32 with the LiDAR sensor and to control the solenoid valve, enabling real-time canopy-based nozzle actuation. The program continuously received distance measurements from the LiDAR sensor, processed the data, and generated actuation signals accordingly. A threshold distance (1.50 m) corresponding to the presence of plant canopy was predefined in the program. It was determined considering crop geometry and sensor positioning. When the measured distance fell within this threshold, the microcontroller interpreted the signal as canopy presence and generated a digital output to activate the relay module. This, in turn, energized the solenoid valve and initiated spray discharge through the nozzle. Conversely, when the measured distance exceeded the threshold, indicating the absence of canopy, the relay signal was deactivated, and the solenoid valve remained closed. The program, written in C/C++, integrated all logic and control functions required for automated and precise nozzle actuation based on canopy presence.
The TF-Luna LiDAR sensor was operated at a sampling frequency of 100 Hz to ensure rapid canopy detection and timely nozzle actuation. A single-threshold control strategy was adopted in the present study. Although stable operation was observed under laboratory conditions, future work may incorporate hysteresis-based control using separate activation and deactivation thresholds to further improve robustness against measurement fluctuations and sensor noise during field operation.
2.4. Assembly and Operational Workflow of the Detection Unit
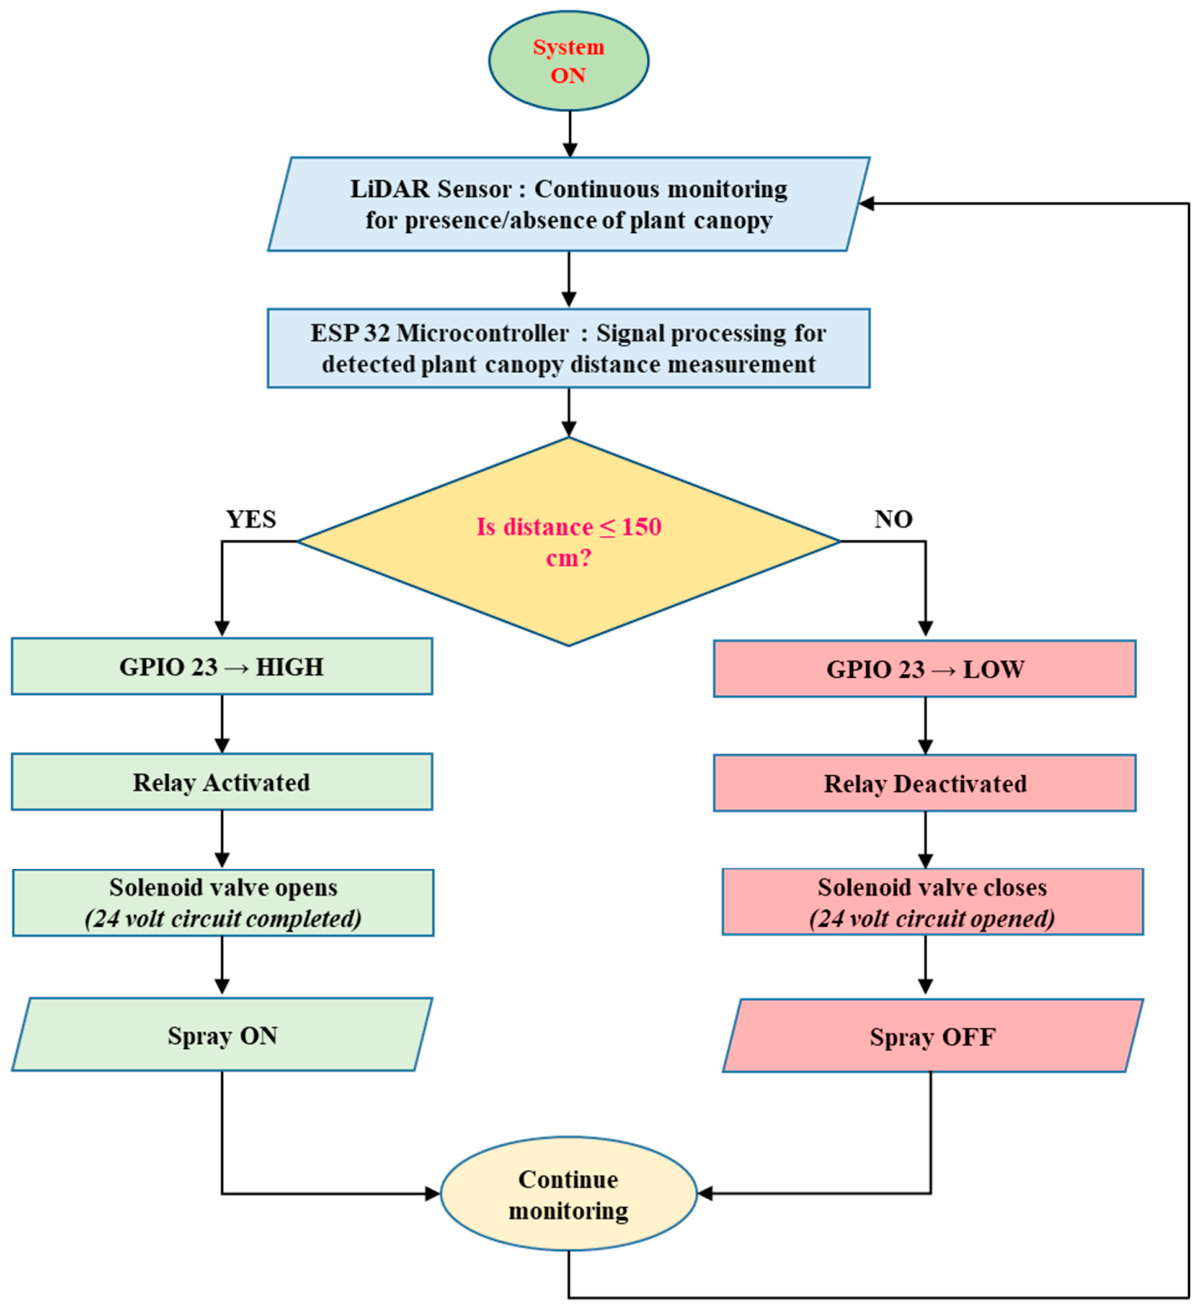
The overall operational workflow of the plant detection unit, from canopy sensing to actuation signal generation, is illustrated in
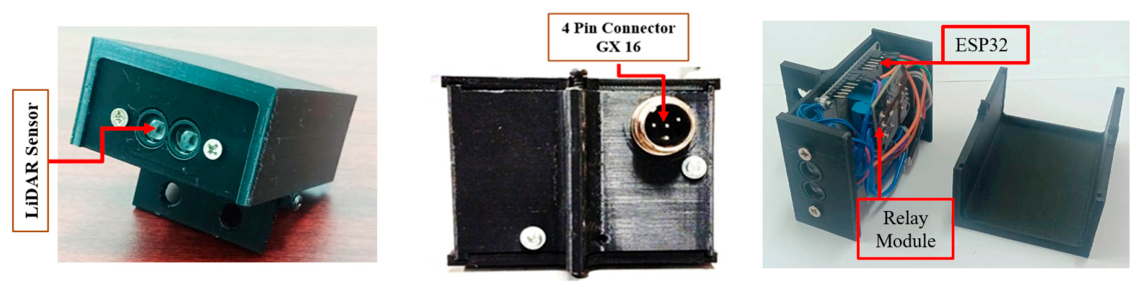
Figure 4. All electronic components, including the LiDAR sensor, microcontroller, and relay module, were securely housed within a 3D-printed control enclosure to ensure their protection (
Figure 5). A 4-pin GX16 connector was provided at the bottom of the enclosure to allow quick connection and disconnection of the power supply and control signals. The DC–DC power converter was mounted in a separate casing outside the main enclosure and received the 24 V input from the power source.
During operation, the LiDAR sensor continuously monitored the presence or absence of plant canopy within its predefined sensing range (1.50 m). The sensing range of 1.50 m was selected to ensure accurate detection of plant canopy presence within the target spraying row while minimizing interference from adjacent rows and background objects. The sensor signals were processed by the ESP32 microcontroller to measure the distance, which decides whether the spray nozzle needs to be activated or not. Upon detection of a plant canopy, the microcontroller generated a control signal that energized the relay module. The relay, acting as an interface between low-voltage control electronics and the high-power solenoid valve, completed the 24 V circuit, thereby opening the valve and allowing liquid to discharge through the nozzle. When no canopy was detected, the relay signal was deactivated, cutting power to the solenoid valve and stopping the spray discharge instantly. This integrated sensing–processing–actuation sequence enabled instantaneous opening or closing of the spray nozzle in synchronization with canopy detection, thereby ensuring on-demand spray application, minimizing chemical wastage, and reducing off-target losses.
2.5. Laboratory Evaluation and Experimental Methodology of the Developed Nozzle Actuation System
The laboratory evaluation was conducted to validate the functional performance of the developed plant-detection-based nozzle actuation system under controlled conditions. The evaluation focused on assessing spray timing accuracy, sensor placement, and operating parameters influencing target spray deposition and off-target losses.
2.5.1. Description of the Laboratory Test Setup
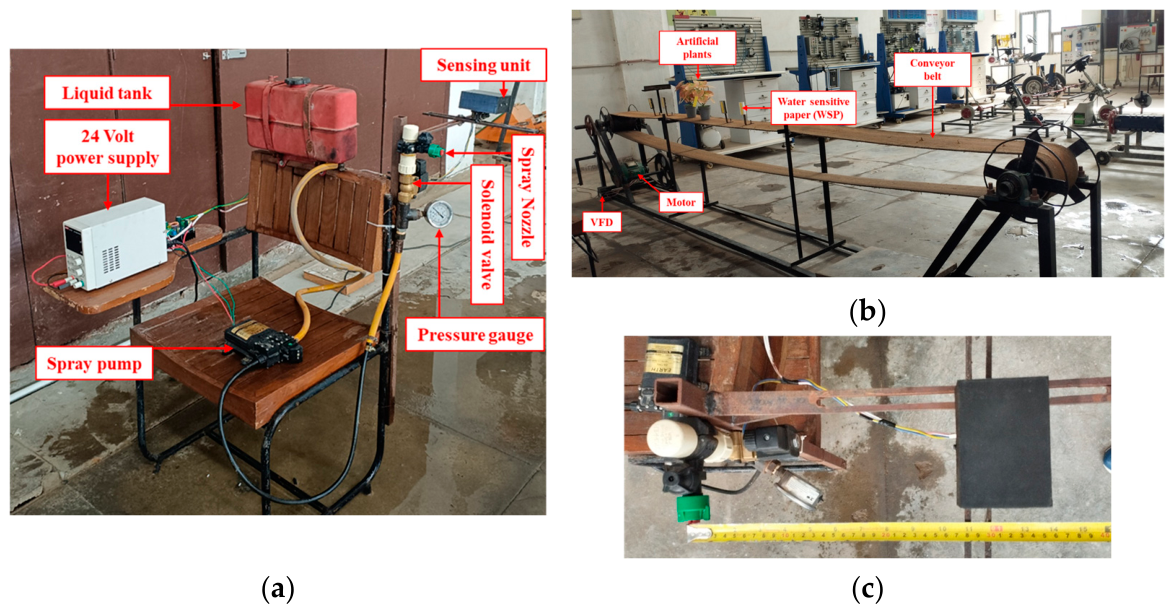
The laboratory test setup consisted of a spray pump, the developed sensor-based nozzle actuation unit (single-nozzle), a liquid spray tank, a pressure gauge, spray hose pipes, a DC regulated power supply, artificial plants, and a motorized conveyor belt mechanism. The plant canopy detection unit was positioned to continuously sense presence or absence of the plant canopy and transmit an electrical signal to the solenoid-operated nozzle assembly, enabling precise ON–OFF control of spray discharge. As the solenoid valve required the highest operating voltage (24 V) among all electronic components, a regulated DC power supply was used as the primary input source during laboratory testing.
The spray tank served as the main reservoir for storing the spray liquid, ensuring a continuous supply to the pump–nozzle assembly. A 15-litre capacity tank was selected for laboratory testing to provide sufficient volume for sustained operation under controlled conditions. The liquid from the tank was drawn by the pump, pressurized, and delivered to the nozzle assembly through the solenoid valve for precise spray application. Water was used as the spray medium throughout the laboratory experiments. The use of water ensured consistent hydraulic conditions and facilitated reliable assessment of spray deposition using water-sensitive papers.
To supply the required pressure and discharge, a heavy-duty double-diaphragm agricultural spray pump (Earth, Model ZQ7002; India) equipped with an automatic pressure cut-off system was used. The pump operated on a 12 V DC power source and provided an open flow rate of 7–9 L min−1 with a maximum pressure of 10.3 kg cm−2 (150 psi). The alternating movement of its dual diaphragms ensured stable discharge with minimal pulsation. A Bourdon-type pressure gauge (Make: Baumer) with a measuring range of 0–70 kg cm−2 was integrated into the system to continuously monitor the system operating pressure. Spray hose pipes were used to interconnect the hydraulic components, ensuring safe, leak-proof, and reliable operation throughout testing.
Artificial plants were used to simulate crop canopy under laboratory conditions. Their uniformity ensured repeatability and minimized variability typically associated with live plants. By serving as consistent targets, the artificial plants facilitated precise calibration of the sensor–nozzle system and enabled accurate evaluation of detection sensitivity, nozzle actuation response, and spray deposition performance.
To replicate field spraying conditions, a motorized conveyor belt mechanism was employed to simulate the forward movement of the sensor–nozzle assembly mounted on the vehicle relative to stationary plants. The mechanism consisted of a 10 m long endless belt mounted on pulleys at both ends of the frame and driven by a three-phase, 0.75 kW induction motor powered by a 230 V AC supply. Motion was transmitted through a V-belt and pulley arrangement. A variable frequency drive (VFD) was installed between the power supply and the motor to regulate the belt speed. The VFD converted the single-phase input into a three-phase output and controlled the motor speed and torque by varying the supply frequency and voltage, thereby enabling accurate simulation of field-equivalent forward speeds.
Figure 6 presents the motorized belt conveyor used for laboratory testing. Based on the developed laboratory setup, the geometric configuration between the sensor, spray nozzle, and plant canopy was analyzed to understand its influence on spray timing and deposition.
2.5.2. Sensor–Nozzle–Canopy Configuration and Spray Timing Concept
The primary objective of the laboratory evaluation of the plant detection-based nozzle actuation system was to assess its functional performance and to determine the optimum placement of the sensor with respect to both the spray nozzle and the plant canopy. The study aimed to maximize spray deposition on the plant canopy while minimizing unnecessary deposition on non-target areas. Additionally, the evaluation was conducted to identify the most suitable forward speed to ensure effective operation of the developed system under controlled laboratory conditions.
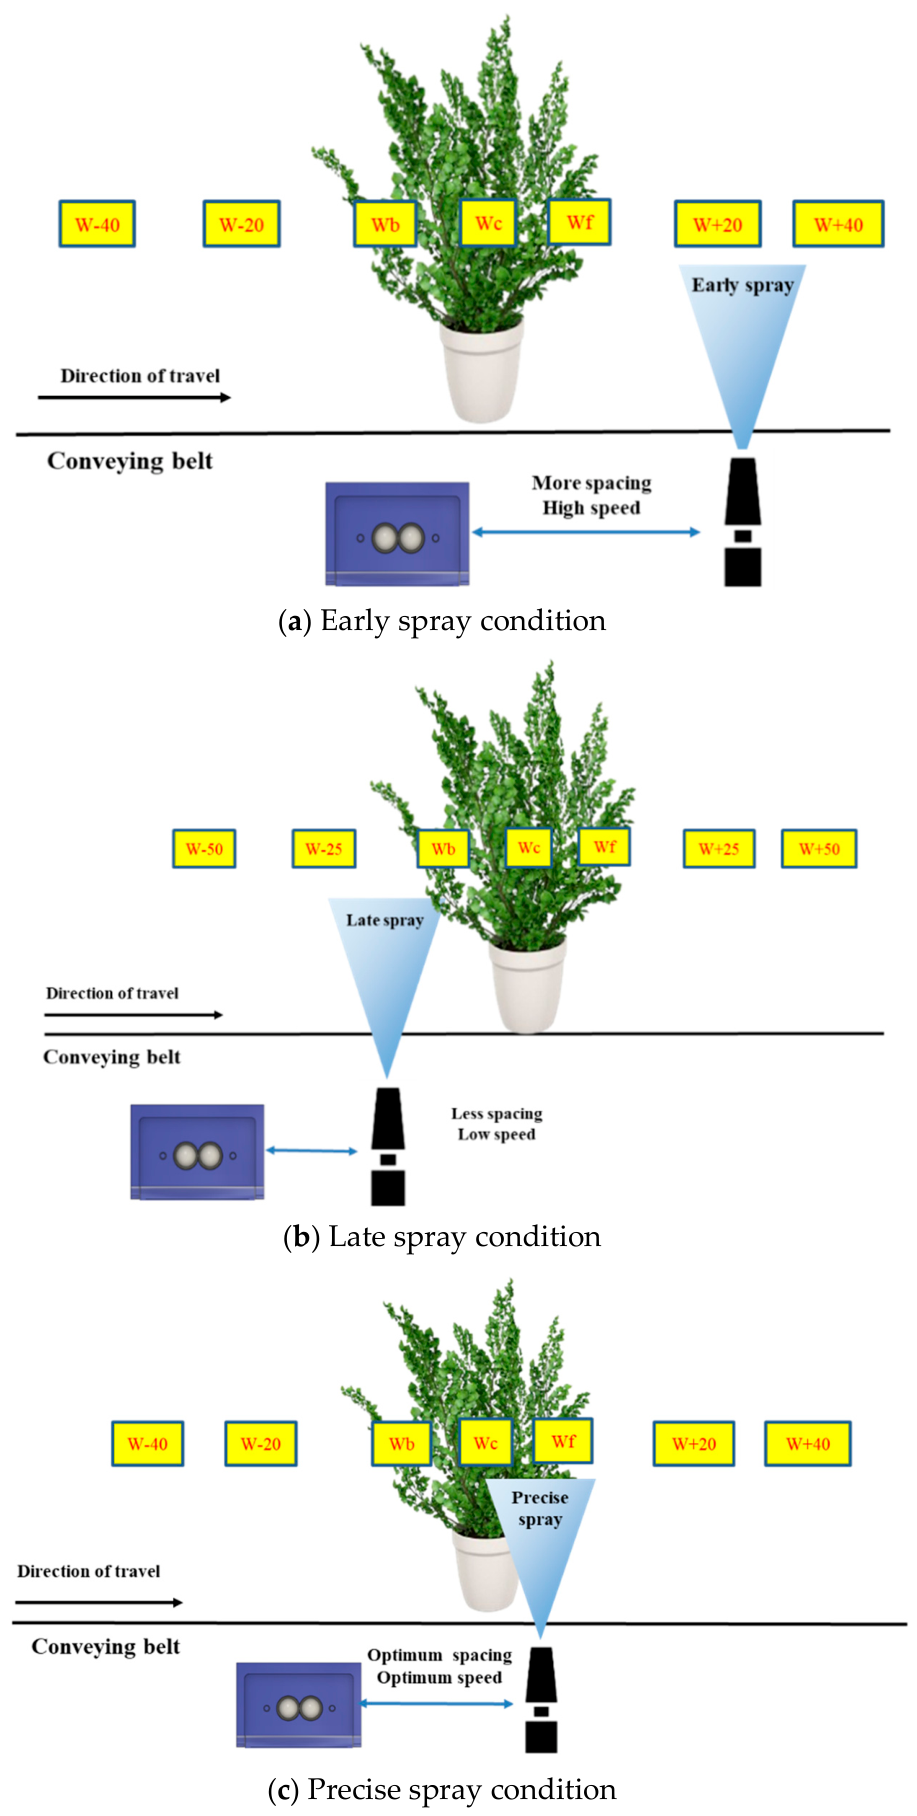
The sensor placement relative to the spray nozzle directly affects the timing and accuracy of nozzle actuation, which is critical for achieving precise and efficient spray application. This relationship is illustrated in
Figure 7. To analyze spray deposition under different triggering conditions, seven reference positions were considered: two before the canopy (W
+40 and W
+20), three on the canopy (W
f, W
c, and W
b), and two after the canopy (W
−20 and W
−40).
Figure 7a illustrates the early spray condition, wherein the nozzle was actuated before the plant canopy reached the spray zone. In this case, positions W
+40 and W
+20 received undesired spray deposition, resulting in off-target spray losses, while the premature cut-off of the spray nozzle led to inadequate deposition on the plant canopy. In the late spray condition (
Figure 7b), the nozzle was activated after the canopy had crossed the spray line. As a result, positions W
−20 and W
−40 received undesired spray deposition, indicating off-target losses, while the delayed initiation of spraying resulted in insufficient coverage on the plant canopy.
Figure 7c depicts the precise spray condition, wherein the spraying starts at the correct timing, coinciding with the canopy’s presence directly in front of the spray nozzle.
Under this condition, positions Wf, Wc and Wb received higher spray deposition, thereby ensuring effective and targeted coverage of the plant canopy. These spray timing conditions collectively represent the range of actuation timing scenarios and their influence on spray deposition.
The complete laboratory setup developed for evaluation of the nozzle actuation system simulated the forward motion of an agricultural sprayer while maintaining the plant-detection-based spraying unit in a stationary position. The speed of the conveyor belt was regulated through the VFD, and the corresponding motor frequencies required to attain specific belt speeds were determined using tachometer readings from the conveyor belt drive shaft, enabling accurate simulation of field-equivalent operating conditions. These spray timing concepts formed the basis for defining the operating parameters and experimental plan adopted for laboratory evaluation of the developed system.
2.5.3. Experimental Plan for Laboratory Evaluation of the Developed System
The timing of spray activation is influenced by the forward travel speed, the distance between the sensor and the spray nozzle, and the distance of the sensor from the plant canopy. Therefore, these parameters were systematically investigated during the laboratory trials. Four forward speeds of 2.5, 3.0, 3.5, and 4.0 km h
−1 were selected based on the recommended operational range of 2–6 km h
−1 for tractor mounted sprayers [
36]. Sensor-to-nozzle distances of 25, 30, 35, and 40 cm, and sensor-to-canopy distances of 60, 70, and 80 cm were selected for lab evaluation.
The distance between the spray nozzle and the plant canopy was selected in accordance with the standard practice commonly adopted in field spraying. This spacing facilitates improved droplet trajectories and enhances spray penetration within dense canopies, as reported by Refs. [
37,
38]. For comparative analysis, the spraying system was additionally operated in conventional continuous spraying mode, without the plant detection sensor, and assessed under the same forward travel speeds. This facilitated assessment of the efficiency and responsiveness of the developed sensor-based spraying system. The complete experimental plan for the laboratory evaluation is outlined in
Table 2.
A total of 52 treatment combinations were tested, each replicated three times, resulting in a total of 156 experimental runs. The key performance indicator measured during the laboratory evaluation was the percent area coverage of Water Sensitive Papers (WSPs) placed at different locations with respect to the plant canopy, which basically represent leaf area coverage (LAC). It was considered an important parameter because higher droplet coverage on the target surface improves spray deposition on leaf surfaces and thereby enhances the effectiveness of pest and disease control [
39,
40]. The spray pressure at the nozzle during laboratory evaluation was kept constant as 10 kg cm
−2. The primary objective of the experimental plan was to identify the optimal sensor positioning and the most suitable forward speed that maximize spray deposition at canopy locations (W
f, W
c, and W
b) while minimizing deposition at non-target positions (W
+40, W
+20, W
−20, and W
−40).
2.5.4. Measurement and Analysis of Spray Deposition and Operating Parameters
The LAC represents the proportion of the total leaf surface area or WSPs effectively covered by spray droplets, expressed as a percentage [
36,
41]. The covered area was determined by analyzing the size and distribution of droplets, wherein the diameter of individual droplets was multiplied by their respective numbers within a defined region of interest (ROI) on the WSP. This parameter was generally estimated through image analysis techniques applied either to WSPs or directly to leaf samples. The LAC in the present study was computed using Equations (1) and (2).
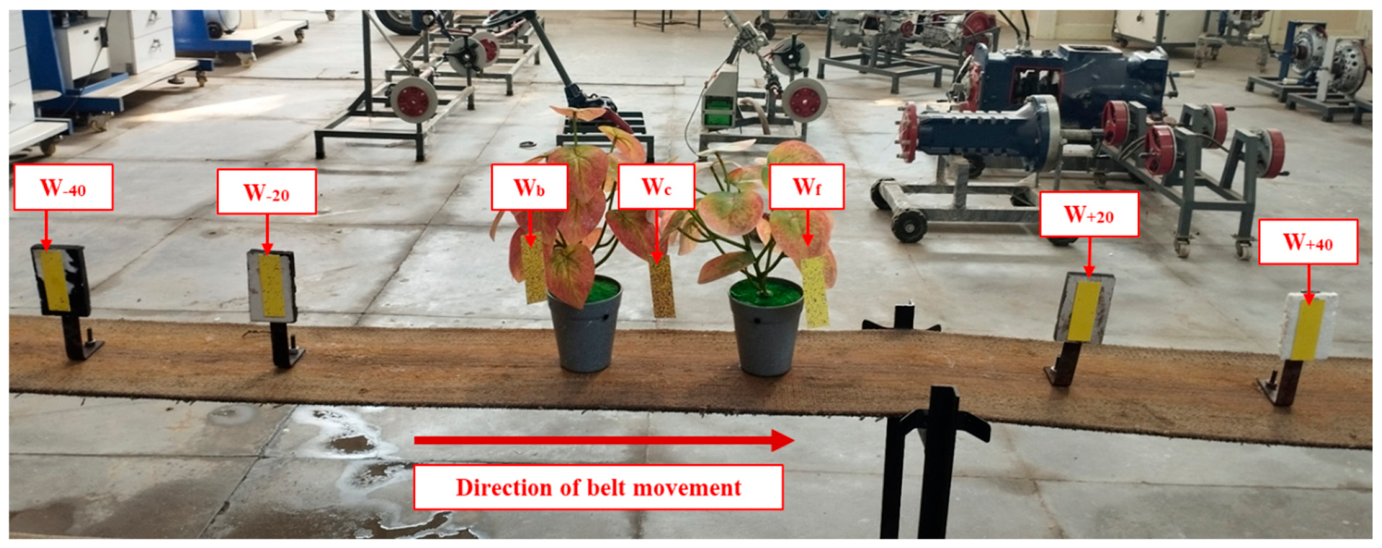
For laboratory evaluation of the developed sensor-based nozzle actuation system, four permanent supporting pads and an artificial plant were mounted on the conveyor belt. To assess spray distribution over the canopy, three WSPs were positioned at the front edge (W
f), centre (W
c), and rear edge (W
b) of the artificial plant canopy. In addition, two supporting pads were installed before the canopy, at distances of 20 cm (W
+20) and 40 cm (W
+40), and two pads were placed after the canopy, at distances of 20 cm (W
−20) and 40 cm (W
−40). WSPs were affixed to each of these pads to record spray deposition at different positions relative to the canopy. The overall arrangement of WSPs for spray deposition measurement is illustrated in
Figure 8.
The WSPs pinned on the respective pads and over the canopy of the artificial plant were carefully removed after the completion of each trial combination. For every treatment combination, three replications were conducted, and the collected WSPs were systematically labelled with appropriate codes for subsequent analysis. The quantitative analysis of the collected WSPs was carried out using the ImageJ software (version 1.4i), which applies image processing techniques for objective evaluation of spray deposition patterns. ImageJ provides reliable tools for measuring droplet size, droplet density, spray deposition, and percentage area coverage, making it highly suitable for spray analysis studies.
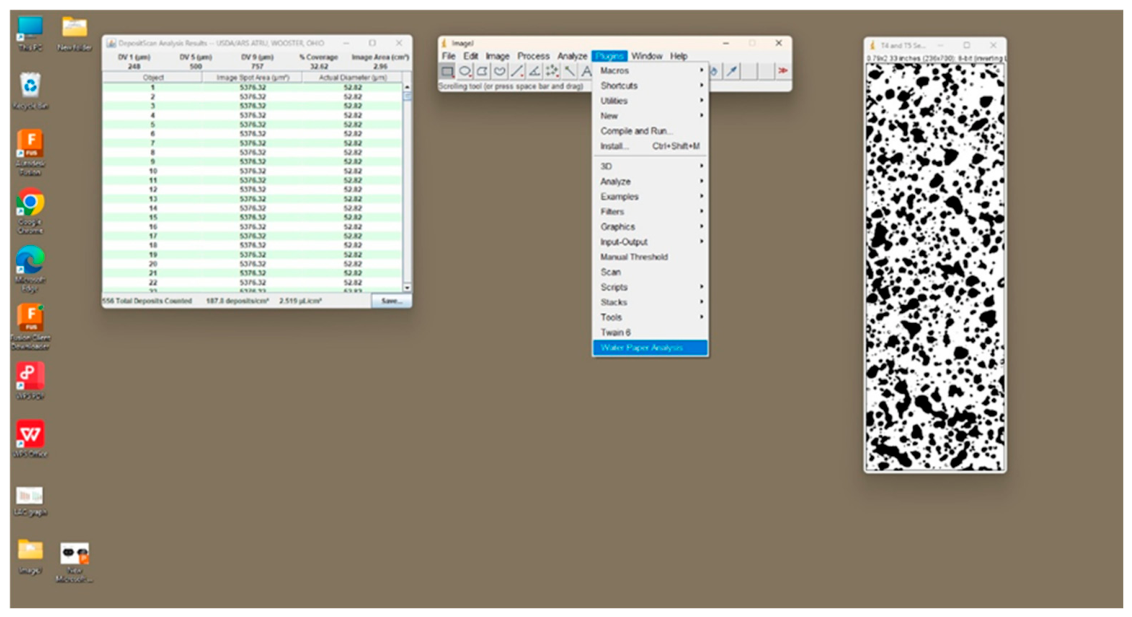
For analysis, the WSPs were first scanned at a resolution of 600 dpi to ensure high-quality images. These scanned images were then imported into the ImageJ environment, where calibration was performed by assigning a known scale in millimetres for accurate measurements. After calibration, the images underwent pre-processing, which included conversion to grayscale and application of thresholding to clearly differentiate spray droplets from the background. Subsequently, the region of interest was selected, and the processed images were analyzed using the “Water Papers Analysis” function in ImageJ. This tool automatically extracted key parameters such as droplet size distribution, droplet density, and percent area coverage. Finally, the analyzed data were exported in Excel sheets (Microsoft Excel 2016) for further statistical evaluation. The analysis of WSP in ImageJ is illustrated in
Figure 9.
2.6. Statistical Analysis and Optimization of Study Variables
The experimental data obtained from laboratory trials were subjected to statistical analysis to examine the influence of independent variables on the selected dependent variable. An analysis of variance (ANOVA) was performed using the SPSS software package (IBM SPSS Statistics 22.0) to assess the statistical significance of study parameters. Differences among different treatment combination means were tested using Least Significant Difference (LSD) test at a 5% level of significance (α = 0.05).
Optimization of the system performance was carried out using Response Surface Methodology (RSM) in the Design-Expert software (Version DX13), to identify the most suitable combination of independent variables for achieving the optimal system performance. RSM is a collection of mathematical and statistical techniques used for modelling, analysis, and optimization of processes in which a response variable is influenced by several independent variables. In this approach, the experimental data were fitted into a second-order polynomial regression model, which represents the response surface. This model allows visualization of the response through three-dimensional surface plots and contour plots, providing insight into the main effects, interaction effects, and quadratic effects of the independent variables. The general form of the RSM model was formulated as:
where Y = response variable;
= intercept term;
= coefficients for linear effects;
= coefficients for quadratic effects;
= coefficients for interaction effects;
and
= independent variables; and
= error term.
In the laboratory trials, the maximum percent area coverage of WSPs placed at the artificial plant canopy positions (Wf, Wc, and Wb) and the minimum spray coverage at off-target positions (W+40, W+20, W−20, and W−40) were identified as primary output quality characteristics of the system. The independent variables considered for optimization were the linear belt speed (BS), the sensor-nozzle distance (SN), and the sensor-canopy distance (SC). These factors were chosen because of their critical role in ensuring proper synchronization between sensor detection and nozzle actuation, thereby directly influencing spray deposition efficiency.
The overall system response delay is governed primarily by the intrinsic characteristics of the selected hardware components, including the LiDAR sensing frequency, ESP32 processing time, relay switching time, and solenoid valve actuation time. Since these characteristics remained unchanged throughout the experiments, response delay was not treated as an independent optimization variable. Instead, its engineering consequence was evaluated through the leaf area coverage measured at the target and off-target locations. Since the spatial displacement caused by the response delay is proportional to the forward speed and the response time, the measured leaf area coverage at the seven WSP positions provided a practical assessment of the influence of system latency on spray timing and deposition.
Furthermore, the developed sensing and control unit exhibited a measured instantaneous electrical power consumption of approximately 15 W (24 V and 0.625 A) under laboratory operating conditions with the solenoid valve energized (spray ON condition), representing the maximum electrical load of the system. This value represents the electrical power required by the sensing and control hardware and should not be interpreted as energy consumption per unit area or field-scale energy requirement. Because the same hardware configuration and operating condition were maintained throughout all experimental treatments, the measured electrical power remained essentially constant and was therefore not included as an optimization response.
3. Results
3.1. Laboratory Evaluation of the Developed Plant Detection-Based Nozzle Actuation System
3.1.1. Leaf Area Coverage (LAC) Distribution Under Continuous Spraying
The LAC distribution under continuous spraying was analyzed using WSPs placed at seven positions: W
+40, W
+20, W
f, W
c, W
b, W
−20, and W
−40, along the direction of travel. For performance evaluation, the LAC values recorded at W
f, W
c, and W
b were considered indicators of effective spray deposition on the target canopy, whereas the LAC values measured at W
+40, W
+20, W
−20, and W
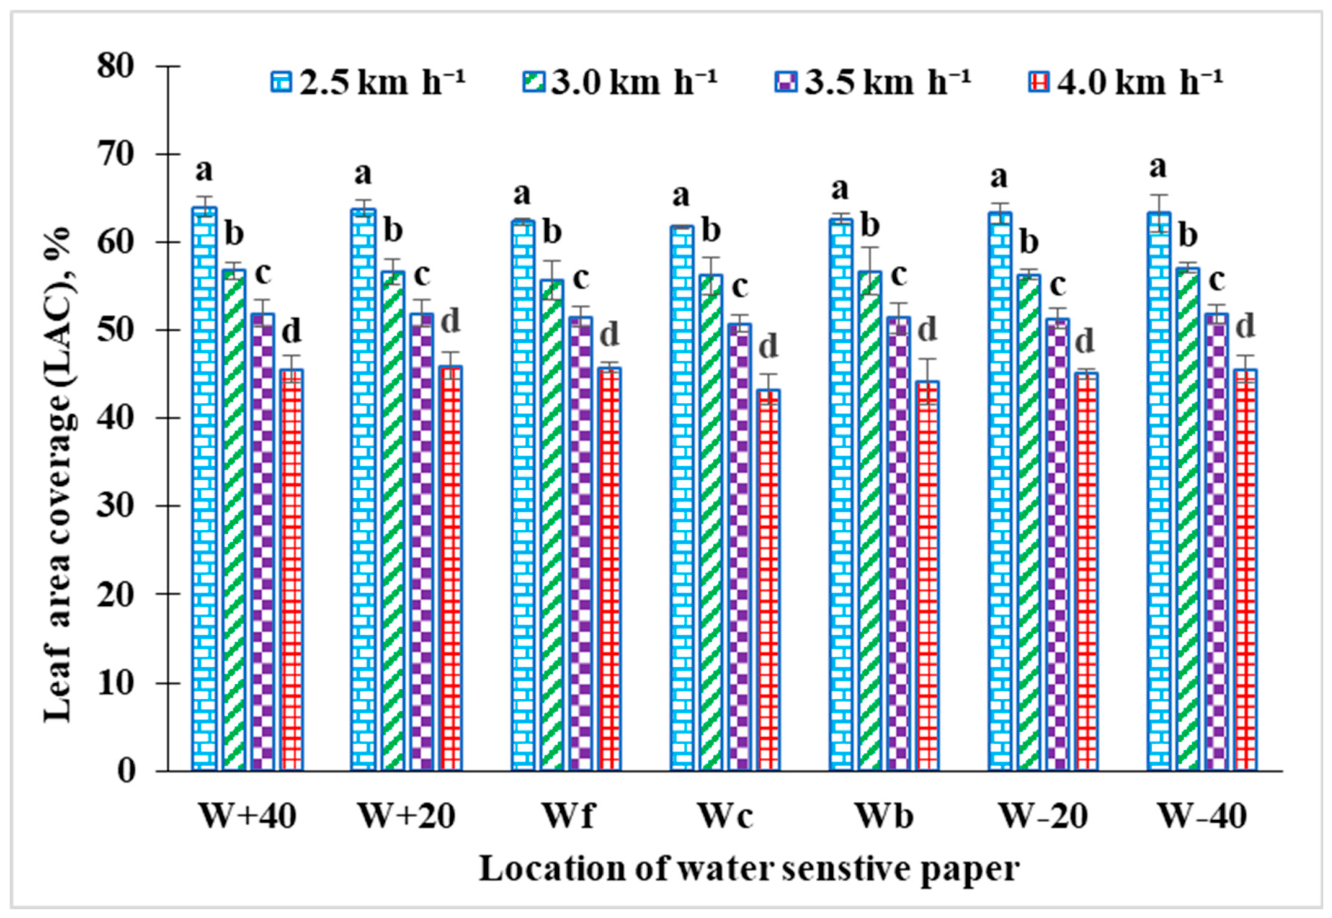
−40 were considered indicators of off-target spray deposition (spray loss). The mean LAC values at different WSP locations under their respective linear belt speeds are illustrated in
Figure 10. The LAC recorded on the WSPs ranged from 61.71 to 63.95% at a linear belt speed of 2.5 km h
−1, 55.72 to 57.08% at 3.0 km h
−1, 50.72 to 51.91% at 3.5 km h
−1, and 43.25 to 45.90% at 4.0 km h
−1. A decreasing trend in LAC was observed with increasing linear belt speed, indicating a reduction in spray deposition efficiency at higher operational speeds.
Table 3 summarizes the ANOVA results for the effects of linear belt speed and WSP location on LAC under continuous spraying mode. The results revealed that linear belt speed had a highly significant effect on LAC (
p < 0.001), indicating that variations in forward speed markedly influenced spray deposition. In contrast, the effect of WSP location was not statistically significant (
p = 0.10), suggesting a relatively uniform spray distribution across the different positions along the direction of travel. Likewise, the interaction effect between belt speed and WSP location was found to be non-significant (
p = 0.99), indicating that the influence of belt speed on LAC was consistent across all WSP locations.
Further, the LSD test, as depicted in
Figure 10, indicated no significant differences in LAC among the WSP positions at their respective linear belt speeds (
p > 0.05), thereby confirming the uniformity of spray distribution along the direction of travel.
3.1.2. LAC Under Plant Detection-Based Spraying
The LAC obtained under plant detection-based spraying was evaluated at four linear belt speeds of 2.5, 3.0, 3.5, and 4.0 km h−1, four sensor-nozzle distances of 25, 30, 35, and 40 cm, and three sensor-canopy distances of 60, 70, and 80 cm. In plant detection-based spraying, the objective was to achieve higher LAC over the plant canopy (Wf, Wc, and Wb) while maintaining minimal spray deposition at positions before and after the canopy (W+40, W+20, W−20, and W−40).
The observed LAC exhibited considerable variation depending on the treatment combination and the position of the WSPs, indicating variations in spray deposition under different operating conditions. The general trend observed under plant detection-based spraying showed that higher LAC values were observed at positions over the plant canopy (Wf, Wc, and Wb), whereas comparatively lower coverage was observed at positions before and after the canopy (W+40, W+20, W−20, and W−40), although a few treatment combinations showed slight deviations from this trend. The difference in LAC between canopy and non-canopy positions was consistently observed across most treatment combinations. This spatial variation in LAC reflects the distribution pattern achieved under different operating conditions of the developed system.
The ANOVA results for the effects of linear belt speed, sensor–nozzle distance, and sensor–canopy distance on LAC at different positions are presented in
Table 3. The results showed that LAC at different WSP locations was significantly affected (
p ≤ 0.05) by sensor–nozzle distance and linear belt speed, while sensor–canopy distance showed no significant effect on LAC.
LAC at Different Positions Relative to the Plant Canopy Under Varying Linear Belt Speed
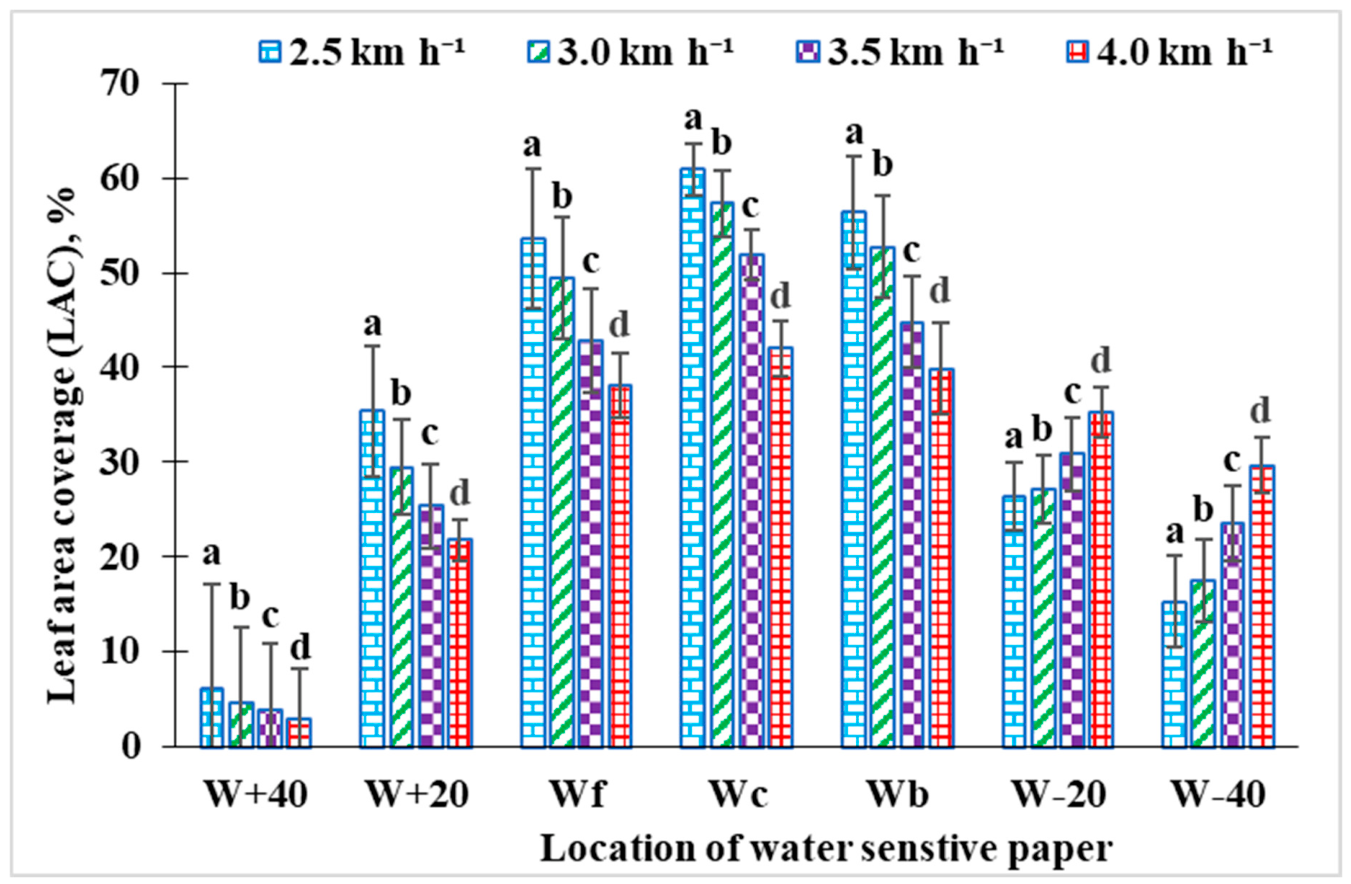
The LAC at different locations relative to the plant canopy under varying linear belt speeds is presented in
Figure 11. The LAC varied depending on the position relative to the plant canopy as well as with changes in linear belt speed. The ANOVA results indicated that linear belt speed had a statistically significant effect on LAC at the 5% level of significance (
p ≤ 0.05) at all WSP locations.
The experimental results showed that higher LAC was observed at the lower linear belt speed of 2.5 km h
−1 at the locations W
+40, W
+20, W
f, W
c, and W
b, whereas comparatively lower coverage was recorded at W
−20 and W
−40. As the linear belt speed increased from 2.5 to 4.0 km h
−1, a gradual decrease in LAC was observed at WSPs positioned before the plant canopy (W
+40 and W
+20) and over the plant canopy (W
f, W
c, and W
b). In contrast, the LAC at WSPs placed after the plant canopy (W
−20 and W
−40) increased with increasing linear belt speed. The LSD test (
Figure 11) indicated that the LAC values corresponding to the linear belt speeds of 2.5, 3.0, 3.5, and 4.0 km h
−1 differed significantly (
p ≤ 0.05).
LAC at Different Positions Relative to the Plant Canopy Under Varying Sensor–Nozzle Distance
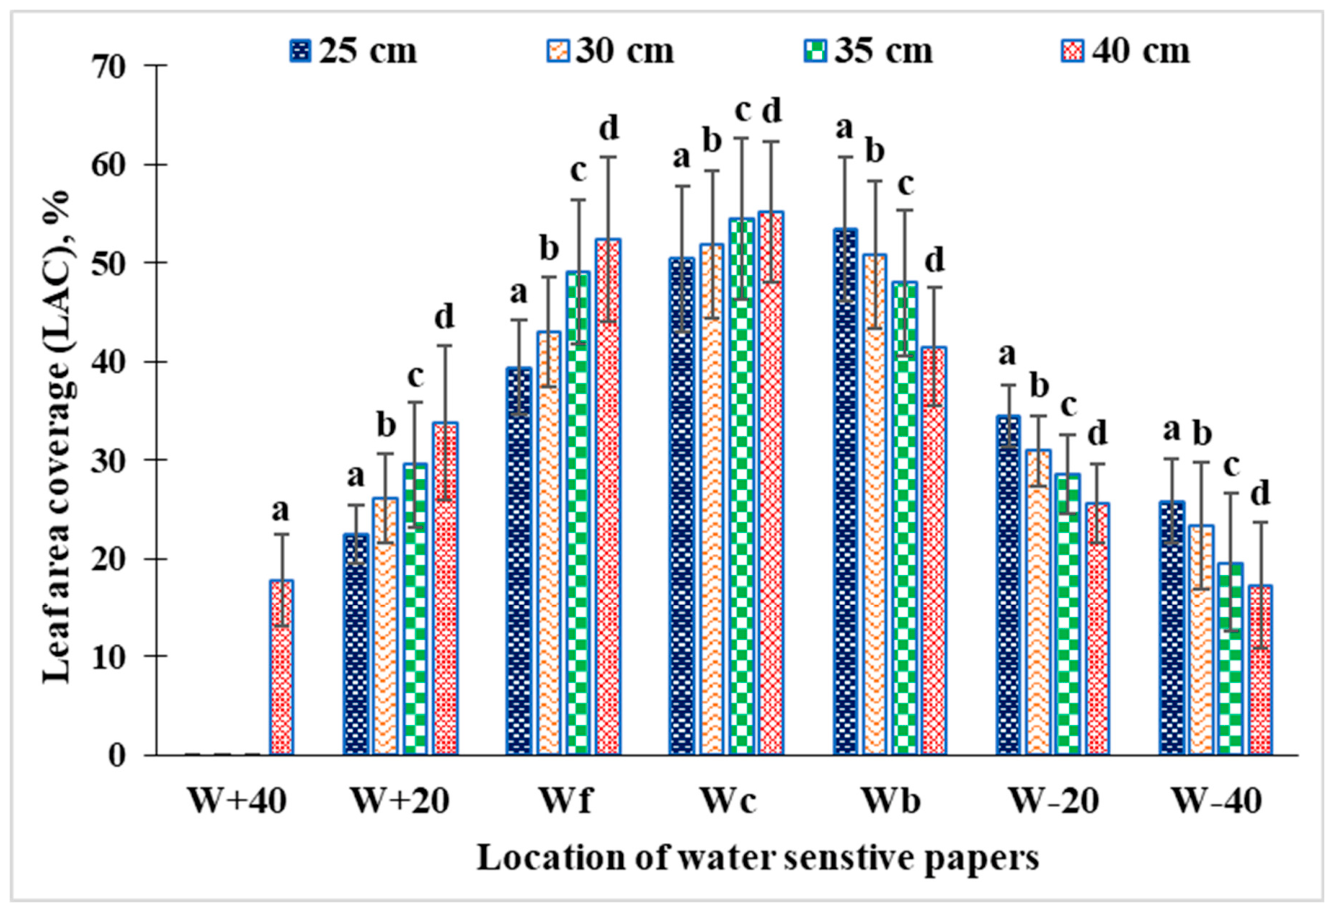
The LAC at different locations relative to the plant canopy under varying sensor–nozzle distances of 25, 30, 35, and 40 cm is presented in
Figure 12.
The ANOVA results presented in
Table 4 indicate that the sensor–nozzle distance had a statistically significant effect on LAC at the 5% level of significance (
p ≤ 0.05) at all WSP locations. As the sensor–nozzle distance increased from 25 to 40 cm, a consistent increase in LAC was observed at WSP locations W
+40 (0–17.74%), W
+20 (22.55–33.74%), W
f (39.43–52.39%), and W
c (50.45–55.18%), whereas a gradual decrease in coverage was recorded at W
b (53.40–41.46%), W
−20 (34.54–25.59%), and W
−40 (25.86–17.27%). The LSD test (
Figure 12) indicated that the LAC corresponding to the sensor–nozzle distances of 25, 30, 35, and 40 cm differed significantly (
p ≤ 0.05) for each specific location of WSP.
At sensor–nozzle distances of 25, 30, and 35 cm, no spray deposition was recorded at the WSP location W+40. At a sensor–nozzle distance of 25 cm, the LAC at off-target locations (W+40, W+20, W−20, W−40) ranged from 0 to 34.54%, whereas at plant canopy locations (Wf, Wc, Wb), it varied between 39.43% and 53.40%. At sensor–nozzle distances of 30, 35, and 40 cm, the corresponding LAC values were 0–30.99% and 42.99–51.95%, 0–29.55% and 47.99–54.49%, and 17.27–33.74% and 41.46–55.18%, respectively.
LAC at Different Positions Relative to the Plant Canopy Under Varying Sensor–Canopy Distance
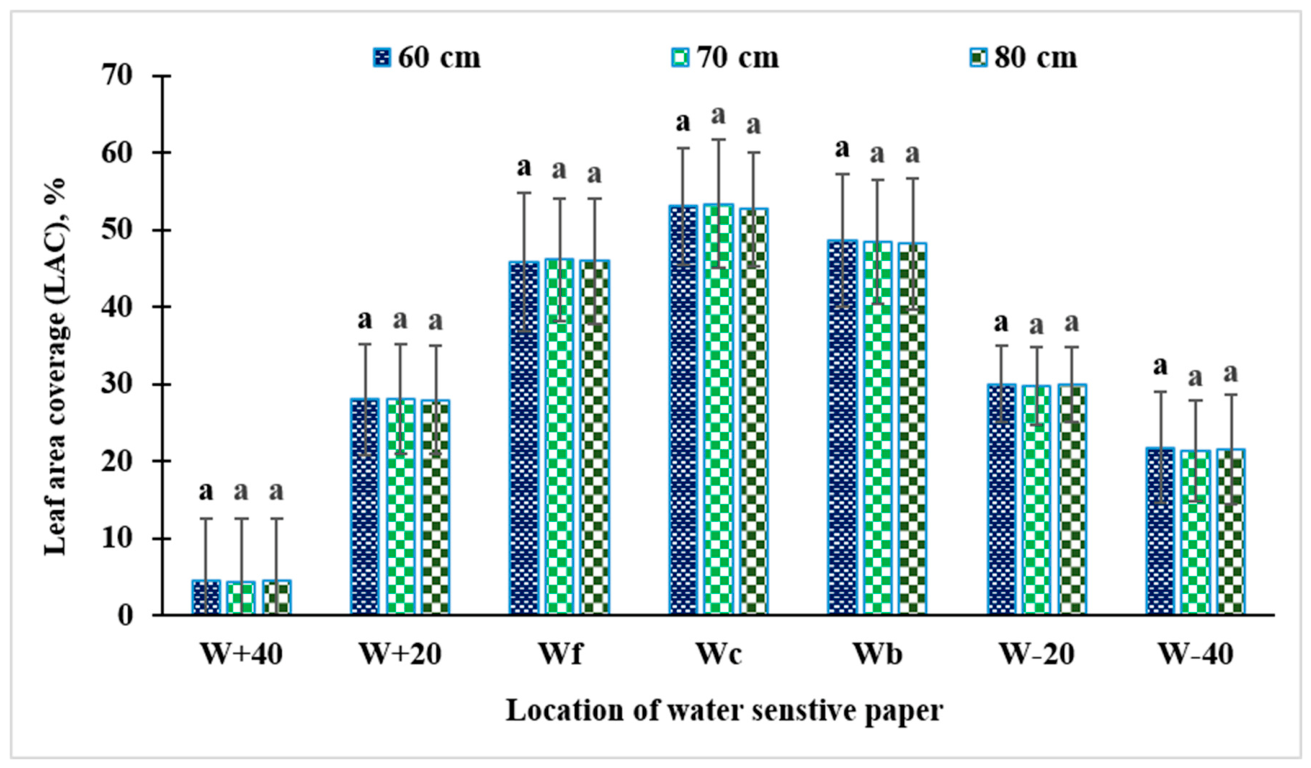
The LAC at different locations relative to the plant canopy under sensor–canopy distances of 60, 70, and 80 cm is presented in
Figure 13. The coverage of WSPs varied with their position relative to the plant canopy; however, no noticeable change in coverage was observed with variations in sensor–canopy distance. The ANOVA results (
Table 4) indicate that the sensor–canopy distance did not have a statistically significant effect on LAC at any WSP location at the 5% level of significance (
p > 0.05). The LAC at locations W
+40, W
+20, W
f, W
c, W
b, W
−20, and W
−40 ranged from 4.42 to 4.44%, 27.97–28.03%, 45.84–45.94%, 52.65–53.32%, 48.17–48.64%, 29.71–30.01%, and 21.32–21.74%, respectively, as the sensor–canopy distance varied from 60 to 80 cm. The LSD test further confirmed that increasing the sensor–canopy distance from 60 to 80 cm did not result in any significant difference in LAC at any WSP location (
p > 0.05).
The observed differences in spray deposition before and after the target canopy can be explained by the cumulative response characteristics of the sensing and actuation system. Although the LiDAR sensor acquires distance information at a high sampling frequency, a finite response time exists between canopy detection, signal processing by the ESP32, relay switching, solenoid valve actuation, and stabilization of the spray jet. Consequently, if nozzle actuation occurs slightly earlier or later than the optimal instant, spray deposition increases at the off-target locations (W+40, W+20, W−20, and W−40), indicating spray loss. Optimizing the sensor–nozzle distance compensates for these cumulative delays, thereby improving synchronization between canopy detection and spray discharge, resulting in higher deposition on the target canopy (Wf, Wc, and Wb) while minimizing off-target deposition.
3.2. Optimized Operating Variables for the Developed Nozzle Actuation System
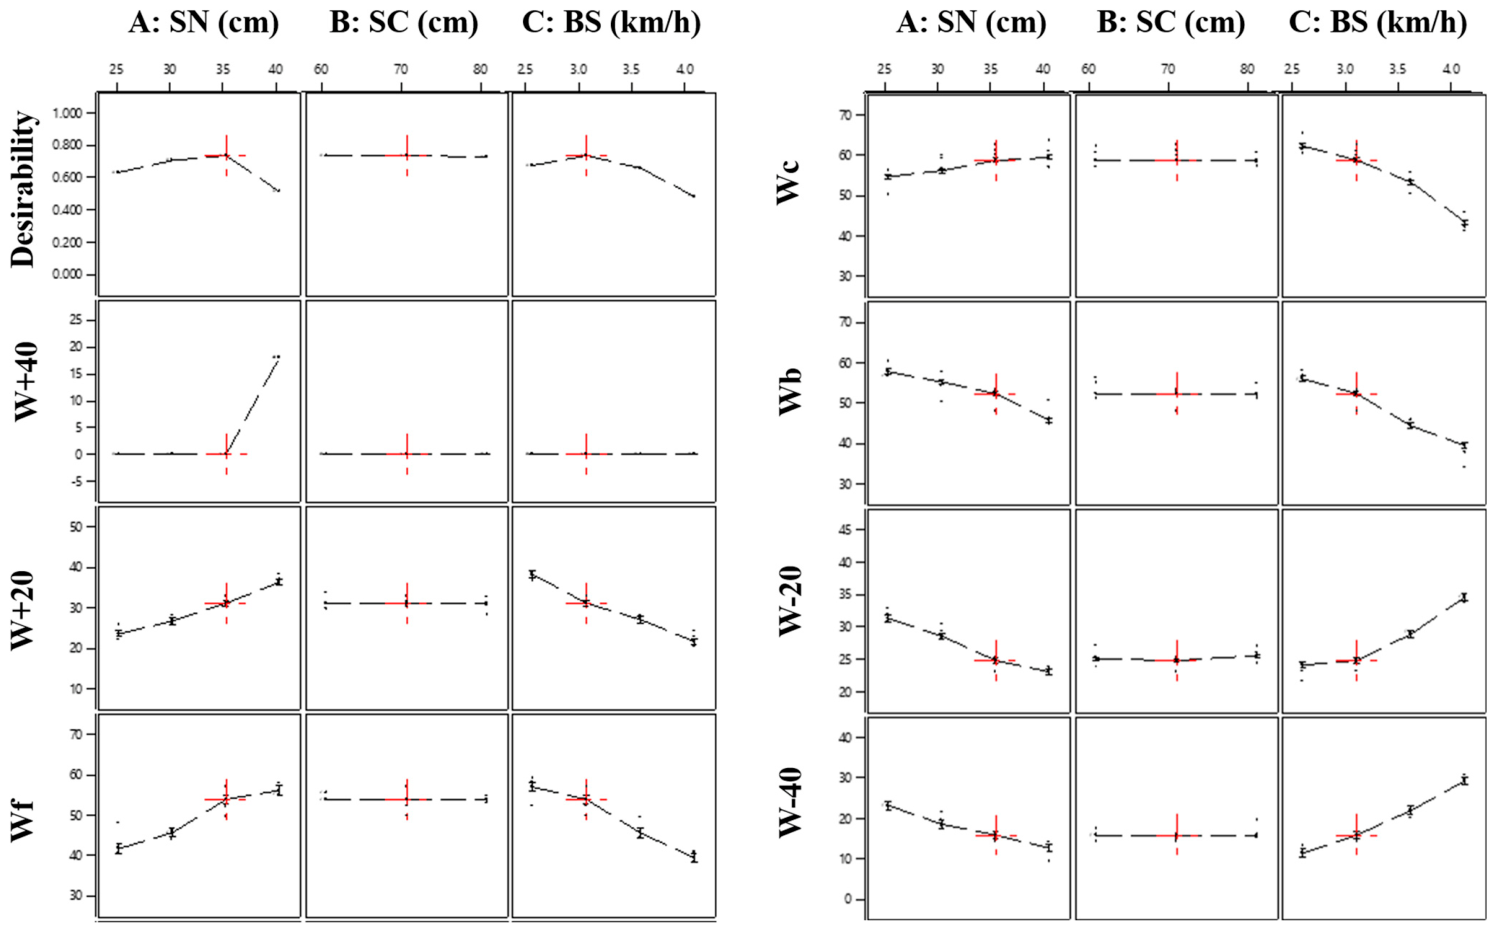
The optimization of operating variables, namely linear belt speed (BS), sensor–nozzle distance (SN), and sensor–canopy distance (SC), was carried out using the RSM technique with a desirability function (DF) in Design-Expert software (version 25.0). In the present laboratory experiment, the LAC obtained at the WSPs was considered as the response variable representing the quality characteristics of spray deposition. For optimization, the goal for WSPs positioned over the plant canopy (W
f, W
c, and W
b) was set to maximize LAC, whereas the goals for WSPs positioned before (W
+40 and W
+20) and after the plant canopy (W
−20 and W
−40) were set to minimize LAC in order to reduce off-target spraying. Appropriate importance levels were assigned to the responses and operating variables. The desirability goals and importance levels assigned to the operating variables and responses are presented in
Table 5. Higher desirability importance (5) was assigned to the off-target responses (W
+40, W
+20, W
−20, and W
−40) because minimizing off-target spray deposition was the primary objective of the developed system. A lower importance (3) was assigned to the target responses (W
f, W
c, and W
b), as adequate canopy coverage was achieved over a relatively broad range of operating conditions.
The optimum combination of operating variables was identified based on the highest composite desirability value, which ranges between 0 and 1.
Figure 14 presents the optimization ramps generated during the numerical optimization procedure in Design-Expert software. The ramps graphically illustrate the optimized combination of belt speed, sensor–nozzle distance, and sensor–canopy distance that simultaneously satisfies the selected optimization criteria. The corresponding predicted responses and overall desirability indicate the suitability of the identified operating conditions for maximizing canopy deposition while minimizing off-target spray deposition.
The optimized values of the operating parameters were found to be 35 cm sensor–nozzle distance, 70 cm sensor–canopy distance, and 3.0 km h−1 linear belt speed. Under these optimized conditions, the predicted LAC of WSPs positioned at W+40, W+20, Wf, Wc, Wb, W−20, and W−40 was 0%, 31.14%, 53.95%, 58.77%, 52.25%, 25.31%, and 15.79%, respectively, with an overall composite desirability of 0.72, which represents the weighted geometric mean of the individual desirability values for the responses. The optimized value of 70 cm represents a practical intermediate operating level selected by the desirability function, as the predicted responses were nearly insensitive to SC within the investigated range and several SC values yielded comparable desirability.
After determining the optimized operating conditions, the developed nozzle actuation system was tested under the optimized parameters. The observed LAC values of WSPs positioned at W+40, W+20, Wf, Wc, Wb, W−20, and W−40 were 0%, 32.36%, 52.91%, 54.75%, 53.64%, 28.74%, and 17.24%, respectively, showing an absolute relative error ranging from 0 to 11.92% compared to the predicted values. The optimized parameter combination ensured accurate detection of plant canopies, timely actuation of spray nozzles, and effective spray deposition over the canopy region while minimizing off-target spraying. The optimized parameter values were therefore adopted for the development and integration of the sprayer prototype of the plant detection-based precision spraying system.
3.3. Comparative LAC Under Plant Detection-Based Spraying (At Optimized Setting) and Continuous Spraying
The comparative LAC at different WSP locations under continuous spraying and plant detection-based spraying modes is presented in
Table 6, highlighting the differences in spray distribution patterns between the two spraying modes. The comparison was performed using paired
t-tests at optimized settings, i.e., a linear belt speed of 3.0 km h
−1, with the sensor–nozzle distance set at 35 cm and the sensor–canopy distance set at 70 cm.
The results indicate that under continuous spraying, the LAC remained relatively uniform across all positions, with mean values ranging from 55.72 to 57.08%, accompanied by low standard deviation values, reflecting consistent spray deposition along the direction of travel, indicating higher off-target spray losses. In contrast, the sensing-based spraying mode resulted in spray deposition primarily at canopy locations (Wf, Wc, and Wb), where the mean LAC values (53.96, 55.77, and 52.26%, respectively) were comparable to those observed under continuous spraying. However, spray deposition was substantially reduced at positions before and after the plant canopy (W+40, W+20, W−20, and W−40), where LAC decreased significantly to as low as 0.00, 31.14, 25.31, and 15.79%, respectively. This clearly demonstrates the selective nature of the developed spraying system.
4. Discussion
4.1. Developed Plant Detection-Based Nozzle Actuation System
The developed plant detection-based nozzle actuation system successfully demonstrated the feasibility of LiDAR-based sensing for real-time spraying applications. The TF-Luna Micro LiDAR sensor enabled reliable detection of plant canopy through precise distance measurement, ensuring timely identification of target zones for spray actuation. Similar LiDAR-based detection approaches have been reported by Liu et al. [
42] for tree canopy detection, Ilari et al. [
43] for grapevine detection, and Qiao et al. [
44] for maize canopy detection, indicating that such sensors offer adequate spatial resolution and rapid response for precision spraying applications.
The ESP32-WROOM-32 microcontroller effectively facilitated real-time data acquisition, signal processing, and control of the actuation system. The applicability of embedded control platforms in smart agricultural machinery has also been highlighted by Refs. [
45,
46,
47], supporting the selection of the controller used in the present system. Its processing capability and low latency ensured synchronization between plant detection and nozzle actuation, which is critical for accurate spray targeting.
The relay module (SRD-05VDC-SL-C) functioned as a reliable switching interface between the low-power (5 V DC) control circuitry and the high-power (24 V DC) solenoid valve, ensuring safe and effective signal transmission. The solenoid valve (Techno 5404) regulated the spray discharge by opening and closing in response to control signals, thereby enabling precise on/off spraying.
The integration of sensing, control, and actuation components resulted in an automated canopy detection-based spraying system capable of responding dynamically to crop presence or absence in real time. This integration ensured synchronization between detection and actuation, which is essential for minimizing spray delay and improving targeting accuracy. Furthermore, the developed system aligns with the principles of site-specific crop management by enabling selective spraying. Such targeted application strategies have been reported to reduce chemical usage, improve input-use efficiency, and minimize environmental contamination. Therefore, the developed system demonstrates strong potential for adoption in precision agriculture applications, particularly in orchards and widely spaced crops.
4.2. Laboratory Evaluation of the Developed Plant Detection-Based Nozzle Actuation System
4.2.1. Effect of Linear Belt Speed on LAC Under Continuous Mode of Spraying
The LAC under continuous spraying mode decreased progressively with an increase in linear belt speed. The LAC ranged from 61.71 to 63.95% at 2.5 km h
−1, 55.72 to 57.08% at 3.0 km h
−1, 50.72 to 51.91% at 3.5 km h
−1, and 43.25 to 45.90% at 4.0 km h
−1. This significantly decreasing trend with increasing linear belt speed (
p ≤ 0.05) can be attributed primarily to the reduced residence time of the spray plume over the target surface, which limits droplet impingement and retention on the canopy and WSPs. Furthermore, an increase in linear belt speed alters the local airflow dynamics around the spray nozzle, resulting in greater droplet dispersion and drift losses, thereby reducing effective deposition on the target surface. The combined effect of reduced exposure time and increased aerodynamic disturbances leads to a decline in LAC at higher operating speeds. These findings are consistent with those reported by Refs. [
38,
48,
49], who also observed a significant reduction in spray deposition with increasing forward speed under continuous spraying conditions.
At a given linear belt speed, the LAC at different WSP locations did not differ significantly (p > 0.05), indicating that spray deposition remained spatially uniform along the direction of travel.
4.2.2. Effect of Linear Belt Speed on LAC Under Plant Detection-Based Nozzle Actuation Spraying
The LAC under plant detection-based nozzle actuation spraying varied significantly with linear belt speed as well as with the position of WSPs relative to the plant canopy. The variation in LAC across different locations clearly reflects the influence of sensor–actuator coordination and system response dynamics on spray deposition. The LAC of WSPs positioned before the plant canopy decreased from 6.21 to 3.01% at W
+40 and from 35.42 to 21.78% at W
+20 with an increase in linear belt speed from 2.5 to 4.0 km/h. This trend can be attributed to the configuration of the sensing system, wherein the sensor was positioned ahead of the spray nozzle. Similar observations regarding the influence of sensor–nozzle offset and system response time on spray distribution have been reported by Refs. [
50,
51,
52,
53]. At lower linear belt speeds, the time interval between canopy detection and the required nozzle actuation was relatively longer, resulting in earlier spray initiation and increased unintended deposition ahead of the plant canopy. As the linear belt speed increased, this interval decreased, improving synchronization between canopy detection and nozzle actuation and thereby reducing off-target spray deposition prior to the canopy.
A similar decreasing trend in LAC with increasing linear belt speed was observed for WSPs placed over the plant canopy. The LAC declined from 53.55 to 38.04% at W
f, 60.88 to 42.02% at W
c, and 56.36 to 39.89% at W
b. This reduction can be attributed to the shorter interaction time between the spray plume and the target surface at higher operating speeds, which limits droplet impingement and retention. Comparable observations regarding the adverse effect of increased forward speed on spray coverage have been reported by Refs. [
54,
55].
In contrast, an increasing trend in LAC with increasing linear belt speed was observed for WSPs positioned after the plant canopy (W
−20 and W
−40), where values increased from 26.34 to 35.25% and from 15.26 to 29.67%, respectively. This behaviour can be explained by the forward placement of the sensor relative to the spray nozzle and the inherent delay associated with nozzle shut-off. At higher linear belt speeds, the time available for synchronization between canopy exit detection and spray termination is reduced. Additionally, the response time of the solenoid valve, coupled with residual pressure in the nozzle line, results in continued spray discharge beyond the target canopy. Consequently, a higher proportion of spray droplets is deposited at locations situated after the canopy. These findings are in agreement with Ref. [
56], which reported that solenoid on/off latency significantly affects spray placement accuracy at higher operating speeds. Similar observations were reported in Refs. [
57,
58], emphasizing the critical role of system response delay and control timing in determining spatial spray distribution in sensor-based spraying systems.
4.2.3. Effect of Sensor–Nozzle Distance on LAC
The results indicated that the sensor–nozzle distance significantly influenced the LAC at all WSP positions (
p ≤ 0.05). This effect can be attributed to variations in the lead time available for nozzle activation and deactivation, which govern the synchronization between target detection and spray discharge. Similar observations have been reported by Refs. [
56,
57,
58], highlighting the importance of sensor–actuator coordination in precision spraying systems. At sensor–nozzle distances of 25, 30, and 35 cm, no spray deposition was observed at W
+40, as the spray nozzle had already traversed this location before canopy detection and subsequent actuation. Luck et al. [
57] similarly reported that shorter sensor–nozzle distances can delay spray initiation, particularly at the leading edge of the target.
At a sensor–nozzle distance of 25 cm, relatively lower LAC was observed at W
+20 (22.55%), W
f (39.43%), and W
c (50.45%), indicating that limited lead time resulted in delayed spray initiation and partial misalignment between spray discharge and the target canopy zone. The effective spray footprint was consequently shifted towards the rear due to vehicle motion and droplet momentum, resulting in comparatively higher deposition at W
b and at positions beyond the canopy (W
−20 and W
−40). Such spatial displacement arising from inadequate synchronization between sensing and actuation has also been reported by Refs. [
57,
58].
As the sensor–nozzle distance increased from 25 to 40 cm, the LAC at W+20, Wf, and Wc increased progressively to 33.74%, 52.39%, and 55.18%, respectively. This improvement can be attributed to increased lead time between canopy detection and nozzle actuation, allowing earlier spray initiation and better alignment of the spray plume with the target canopy. Consequently, the spray footprint shifted forward, enhancing droplet deposition at the desired locations.
Concurrently, a reduction in LAC was observed at locations beyond the canopy, with values at W
b and W
−20 decreasing (e.g., W
−20 from 34.54% to 25.59%, and W
−40 from 25.86% to 17.27%) as the sensor–nozzle distance increased from 25 to 40 cm. This trend reflects improved spray cut-off timing, which minimizes residual spray discharge beyond the intended canopy region. Similar findings regarding the influence of actuation timing and solenoid valve latency on spray placement accuracy have been reported by Ref. [
56].
These results indicate that appropriate selection of sensor–nozzle distance, in relation to system response time, is essential for maximizing LAC within the target canopy zone (Wf, Wc, and Wb) while minimizing off-target spray deposition at positions before and after the canopy.
The effects of forward speed and sensor–nozzle distance can be explained by the temporal synchronization between canopy detection and spray discharge. As forward speed increases, the time available for canopy detection, signal processing, relay switching, solenoid valve actuation, and spray delivery decreases. Likewise, the sensor–nozzle distance determines the lead time between canopy detection and the arrival of the spray jet at the target. An excessively short or long sensor–nozzle distance results in premature or delayed nozzle actuation, leading to increased off-target deposition before or after the canopy. Therefore, proper coordination of forward speed and sensor–nozzle distance is essential to maximize spray deposition on the target canopy while minimizing spray losses.
4.2.4. Effect of Sensor–Canopy Distance on LAC
The LAC at all WSP locations exhibited only minor variation when the sensor–canopy distance was varied from 60 to 80 cm. Statistical analysis also indicated that the effect of sensor–canopy distance on LAC was not significant (
p > 0.05), suggesting that variations in this parameter did not influence spray deposition under the tested conditions. This consistent spray coverage indicates that the selected distance-based LiDAR sensor, operating within its effective detection range (0.2–8 m), was able to reliably detect the plant canopy and generate timely actuation signals without measurable delay or loss of detection accuracy. The stable performance across the tested sensor–canopy distances demonstrates that the sensing system maintained adequate detection resolution and response time within this operational window. Similar findings have been reported by Ref. [
59], who demonstrated reliable canopy detection and structural characterization using LiDAR at moderate sensing distances. Refs. [
42,
60] also reported that LiDAR systems provide consistent distance measurements and accurate canopy profiling within calibrated operating ranges.
These results indicate that, within the tested range, sensor–canopy distance did not significantly influence spray deposition performance, provided that the sensor operated within its specified detection limits. Furthermore, the results suggest that system performance was more strongly influenced by parameters such as sensor–nozzle distance and linear belt speed, which directly affect actuation timing and spray synchronization.
4.3. Optimized Operating Variables for the Developed Nozzle Actuation System
The multi-response optimization performed using RSM provided a systematic framework to simultaneously maximize LAC within the target canopy zone while minimizing off-target spray deposition. The optimized configuration provided sufficient lead time for canopy detection and timely nozzle actuation, while the selected linear belt speed ensured proper synchronization between spray discharge and canopy position under the spray plume.
The optimized combination of operating variables was found to be 35 cm sensor–nozzle distance, 70 cm sensor–canopy distance, and 3.0 km h−1 linear belt speed, corresponding to a composite desirability value of 0.72. This desirability value indicates a satisfactory compromise balanced optimization trade-off among competing responses. Under these optimized conditions, the LAC values obtained were 53.95%, 58.77%, and 52.25% at Wf, Wc, and Wb positions, respectively, demonstrating effective spray deposition over the canopy region. At the same time, off-target deposition was minimized to 0% and 31.14% at positions before the canopy (W+40 and W+20), and to 25.31% and 15.79% at positions beyond the canopy (W−20 and W−40), respectively. These results highlight the ability of the developed system to achieve spatially selective spray application.
At higher linear belt speeds (e.g., 4.0 km h−1), lower desirability values were observed, indicating that increased speed adversely affects spray precision due to reduced interaction time and increased system response constraints. Similarly, shorter sensor–nozzle distances (e.g., 25 cm) resulted in relatively higher LAC at initial canopy positions but reduced overall desirability, primarily due to increased off-target deposition at positions preceding the canopy.
Validation experiments conducted under optimized conditions showed absolute relative deviations ranging from 0 to 11.92% between predicted and observed values. The close agreement between predicted and experimental values indicates that the used RSM model adequately captured system behaviour and demonstrates the reliability of the optimization process.
4.4. Comparison of LAC Under Continuous and Plant Detection-Based Spraying Modes
The comparison of LAC under continuous spraying and plant detection-based intermittent spraying modes at optimized operational settings revealed distinctly different spray deposition patterns. Under the plant detection-based intermittent spraying mode, LAC values of approximately 52–55% were maintained at canopy positions (Wf, Wc, and Wb), which were comparable to those obtained under the continuous spraying mode (55–57%). indicating that selective nozzle actuation did not compromise effective spray deposition over the target canopy. This indicates that selective nozzle actuation did not compromise effective spray deposition over the target canopy.
In contrast, a substantial reduction in off-target spray deposition was observed under the intermittent spraying mode. Under continuous spraying mode, high LAC values were recorded at positions before and after the canopy (e.g., ~100% at W
+40, ~42.83% at W
+20, ~48.92% at W
−20, and ~69.80% at W
−40), indicating significant spray losses. However, under intermittent spraying mode, LAC at these positions was considerably reduced, demonstrating improved spray precision and reduced chemical wastage. These findings are consistent with those reported by Refs. [
56,
57], who reported that sensor-based spraying systems can achieve canopy deposition comparable to conventional continuous spraying while significantly reducing off-target application.
The results further indicate that precise synchronization between sensing, actuation, and system kinematics is critical for achieving optimal spray deposition and minimizing off-target losses in plant detection-based precision spraying systems.
4.5. Limitations and Field Applicability
The present study was conducted under controlled laboratory conditions using a conveyor system, a single-nozzle configuration, artificial plants, and water as the spray medium, which ensured high repeatability and precise evaluation of system performance. For real-field applications, certain factors such as ambient sunlight, mechanical vibrations, and natural variability in crop canopy structure may influence sensor response and spray deposition behaviour. However, the selected LiDAR sensor and system configuration are inherently suited for outdoor conditions, and the insights obtained from this study provide a strong basis for field implementation. Future work will focus on validating the system under actual field conditions using commercially available pesticide formulations and extending it to multi-nozzle boom configurations to further enhance its practical applicability. In addition, future research may explore the integration of RGB cameras and artificial intelligence-based image analysis techniques to enable crop health monitoring, disease detection, and site-specific application of agrochemicals, thereby expanding the system beyond canopy-based nozzle actuation toward more intelligent precision spraying applications.
Canopy characteristics such as shape, density, and the presence of gaps may influence canopy detection and nozzle actuation behaviour under field conditions. While sparse or discontinuous canopies may affect spray deposition patterns, they may also provide opportunities for additional spray savings by reducing application in canopy gaps and other non-target areas. These effects warrant further investigation under diverse crop architectures.




 ,
,