Review

Remote Sensing Applications in Sugar Beet Production: From Crop Monitoring to Precision Management


1
College of Advanced Agriculture and Ecological Environment, Heilongjiang University, Harbin 150080, China
2
Key Laboratory of Sugar Beet Genetic Breeding, Heilongjiang University, Harbin 150080, China
3
Department of Forest Management, School of Forestry, Northeast Forestry University, Harbin 150040, China
4
College of Horticulture & Forestry Sciences, Huazhong Agricultural University, Wuhan 430070, China
*
Authors to whom correspondence should be addressed.
AgriEngineering 2026, 8(7), 298; https://doi.org/10.3390/agriengineering8070298
Submission received: 22 May 2026 / Revised: 16 July 2026 / Accepted: 20 July 2026 / Published: 21 July 2026

Abstract

Remote sensing has become an important tool for crop monitoring and precision agriculture, yet its applications in sugar beet production remain fragmented across sensing platforms, target traits and modelling strategies. This review synthesises the development, current applications and future directions of remote sensing in sugar beet production, with particular attention to the transition from crop monitoring to precision management. A structured search was conducted in Scopus and the Web of Science Core Collection for publications from 2003 to 2025, and 181 relevant peer-reviewed articles were retained for thematic analysis. The literature shows a clear increase in sugar beet remote sensing studies, particularly after 2015, coinciding with the availability of Sentinel-2 imagery and, from 2016 onwards, the growing use of unmanned aerial vehicle-based sensing. It also indicates a gradual shift from crop mapping and canopy monitoring towards disease detection, weed mapping, yield prediction and management-oriented applications. Current studies demonstrate the value of satellite, unmanned aerial vehicle and proximal sensing for retrieving canopy traits, assessing biotic stresses, estimating root yield and supporting field-scale management. However, sugar beet presents specific challenges because its economic value depends not only on canopy development or root biomass, but also on sucrose concentration, recoverable sugar yield, and processing quality. These quality-related traits remain less studied and are difficult to infer directly from canopy observations. Modelling approaches have evolved from vegetation-index-based empirical models towards machine learning, deep learning, multi-temporal analysis, data fusion and crop model assimilation, but issues of model transferability, ground-truth availability and operational decision support remain unresolved. Future research should strengthen multi-source observations, external validation, quality-oriented prediction and decision-support workflows to promote robust, scalable and economically meaningful remote sensing applications in sugar beet production.

1. Introduction

Sugar beet (Beta vulgaris L.) is one of the most important industrial crops in temperate agricultural systems and represents the second major source of sugar worldwide after sugarcane [1,2,3]. Owing to its broad ecological adaptability, sugar beet can be cultivated under diverse climatic and soil conditions, including regions affected by salinity, alkalinity and other environmental constraints [4,5,6,7]. In addition to sugar production, sugar beet contributes to circular and sustainable agricultural systems through the utilisation of by-products such as beet pulp for animal feed, bioenergy production and organic fertiliser generation [8,9]. These agronomic and industrial functions make sugar beet a strategically important crop for food security, bio-based economies and sustainable land management.
Unlike many grain crops, the economic value of sugar beet is not determined solely by above-ground growth or root yield, but by the combined effects of root biomass, sucrose concentration, recoverable sugar yield and processing quality [10]. These production outcomes are strongly influenced by genotype, environment and management interactions, including nitrogen supply, water availability, disease pressure, weed competition and harvest timing [11,12]. Excessive vegetative growth does not necessarily translate into higher sugar yield, and canopy vigour may become partially decoupled from below-ground root development and sugar accumulation during later growth stages [13]. Therefore, effective sugar beet management requires monitoring systems that can capture both crop growth status and management-relevant indicators associated with yield formation, stress development and sugar accumulation.
Conventional field scouting, destructive sampling and laboratory measurements provide valuable information on crop status and quality, but they are labour-intensive, spatially limited and often unable to capture within-field heterogeneity in a timely manner [14,15]. These limitations are particularly important in modern sugar beet production, where mechanisation, variable soil conditions, uneven crop emergence, disease outbreaks and site-specific nutrient and water requirements create strong spatial variability [14,16]. Non-destructive, high-frequency and spatially explicit monitoring approaches are therefore needed to support precision management decisions.
Remote sensing (RS) has become a key enabling technology for crop monitoring and precision agriculture because it provides repeated, non-contact and spatially explicit observations of crop conditions across multiple spatial and temporal scales [17,18]. In major field crops such as wheat, maize, rice and cotton, satellite, unmanned aerial vehicle (UAV) and proximal sensing technologies have been widely used to monitor canopy development, retrieve biophysical and biochemical traits, detect stress and support yield prediction and site-specific management [19,20,21,22,23]. These studies demonstrate the broader value of RS for transforming crop observation from manual, plot-based assessment into scalable and data-driven monitoring systems [24,25]. Compared with these major crops, RS applications in sugar beet remain more fragmented, but they have gained increasing attention in recent years [26]. This trend has been driven by the wider availability of open-access satellite imagery, the rapid development of UAV platforms, advances in multispectral and hyperspectral sensing, and the increasing use of machine learning (ML), deep learning (DL) and multi-source data integration [27,28,29,30]. These technologies provide new opportunities to monitor sugar beet growth, diagnose limiting factors and support production management [31].
Despite the growing interest in sugar beet and RS, the existing literature remains fragmented across sensing platforms, spatial scales, target variables and analytical methods. Considerable progress has been made in canopy growth monitoring, biophysical trait retrieval, biotic stress detection and root yield prediction. However, many studies are still based on local experiments, single-season datasets, or specific cultivars, which limits model transferability across regions, environments and management systems [32,33,34]. In addition, quality-related traits, including sugar content, recoverable sugar yield and processing-related parameters, remain less studied than canopy traits and root yield, despite their direct relevance to the economic value of sugar beet [35,36]. The operational use of RS products is also constrained by cloud cover, scale mismatch, limited ground-truth data, complex data-processing requirements and insufficient integration with decision-support systems [15,37,38,39].
Accordingly, this review examines RS applications in sugar beet production from the perspective of their transition from crop monitoring to precision management. Specifically, it aims to: (1) characterise the publication patterns and temporal evolution of RS platforms and application domains in sugar beet studies; (2) synthesise current applications in crop growth monitoring and trait retrieval, biotic stress detection, yield and quality prediction, and precision management; (3) evaluate modelling strategies, including vegetation index (VI) methods, ML, DL, multi-temporal analysis, data fusion and crop model assimilation; and (4) identify limitations and future research priorities, particularly multi-source data integration, model transferability, quality-oriented prediction and decision-support development. By linking RS technologies with agronomic management needs, this review seeks to clarify how RS can support sustainable, efficient and quality-oriented sugar beet production.
Although this review is centred on sugar beet, the challenges and methodological pathways discussed here have broader relevance for agricultural RS. The integration of multi-platform observations, data-driven modelling, crop-specific quality indicators, and decision-support frameworks may provide useful references for other crops where RS is expected to move beyond crop monitoring towards precision management.

2. Review Methodology and Literature Selection

A structured literature search was conducted to identify studies related to RS applications in sugar beet production. The search was performed in the Scopus and Web of Science Core Collection (WoSCC) databases, which were selected because of their broad coverage of peer-reviewed literature in remote sensing, agronomy, precision agriculture and crop science [40,41]. The search covered publications published between 2003 and 2025 and was conducted on 17 December 2025. Only peer-reviewed articles and reviews published in English were considered eligible for inclusion. The search terms were designed to capture studies related to sugar beet and RS, including satellite, UAV, proximal sensing and related monitoring approaches. The database-specific search queries are listed in Table 1.
We used a Preferred Reporting Items for Systematic Reviews and Meta-Analyses (PRISMA)-style flow diagram to track the process of identifying and selecting relevant papers for this study (Figure 1) [42]. The initial search yielded a total of 360 English-language publications (124 from Scopus and 236 from WoSCC), from which 100 duplicates were removed. Then we screened each publication based on title, abstract and keywords to determine whether it was relevant to RS applications in sugar beet production. We considered publications eligible when they addressed at least one of the following topics: crop growth monitoring, biophysical or biochemical trait retrieval, stress detection, disease or weed mapping, yield prediction, sugar-related quality assessment, crop classification, precision management, or sensor-based monitoring in sugar beet. A total of 181 relevant peer-reviewed articles were retained for detailed assessment and thematic synthesis.
Rather than conducting a purely bibliometric analysis, this review adopts a critical and application-oriented synthesis [43]. The retained literature was classified according to publication year, sensing platform, application domain, target variable, modelling strategy, and relevance to precision management. Particular attention was given to studies that provided direct evidence for sugar beet RS applications, methodological innovation, agronomic relevance or insights into operational feasibility. This classification formed the basis for analysing publication patterns, temporal evolution, application domains, modelling strategies and future research priorities in the following sections.
Where available, quantitative performance measures were extracted from representative studies to support the critical synthesis. For continuous-variable estimation, the principal metrics included the coefficient of determination (R2), root mean square error (RMSE), normalised root mean square error (NRMSE), relative RMSE (rRMSE) and mean absolute error (MAE). Classification performance was summarised using overall accuracy, precision, recall, F1-score, the area under the receiver operating characteristic curve (AUC) or Cohen’s kappa coefficient, whereas intersection over union (IoU), Dice coefficient and mean average precision (mAP) were considered for segmentation and object-detection tasks. Management-oriented outcomes, such as potential input savings or improvements in operational efficiency, were also recorded where reported. Because the reviewed studies differed substantially in their target variables, experimental settings, spatial units and validation procedures, the reported values were compared only within broadly comparable application categories, and no pooled meta-analysis was performed. Particular attention was given to whether performance was evaluated using internal data splitting or independent validation across years, locations or cultivars.

3. Research Progress and Evolution of RS Applications

3.1. Overall Publication Pattern: Journals and Geographic Distribution

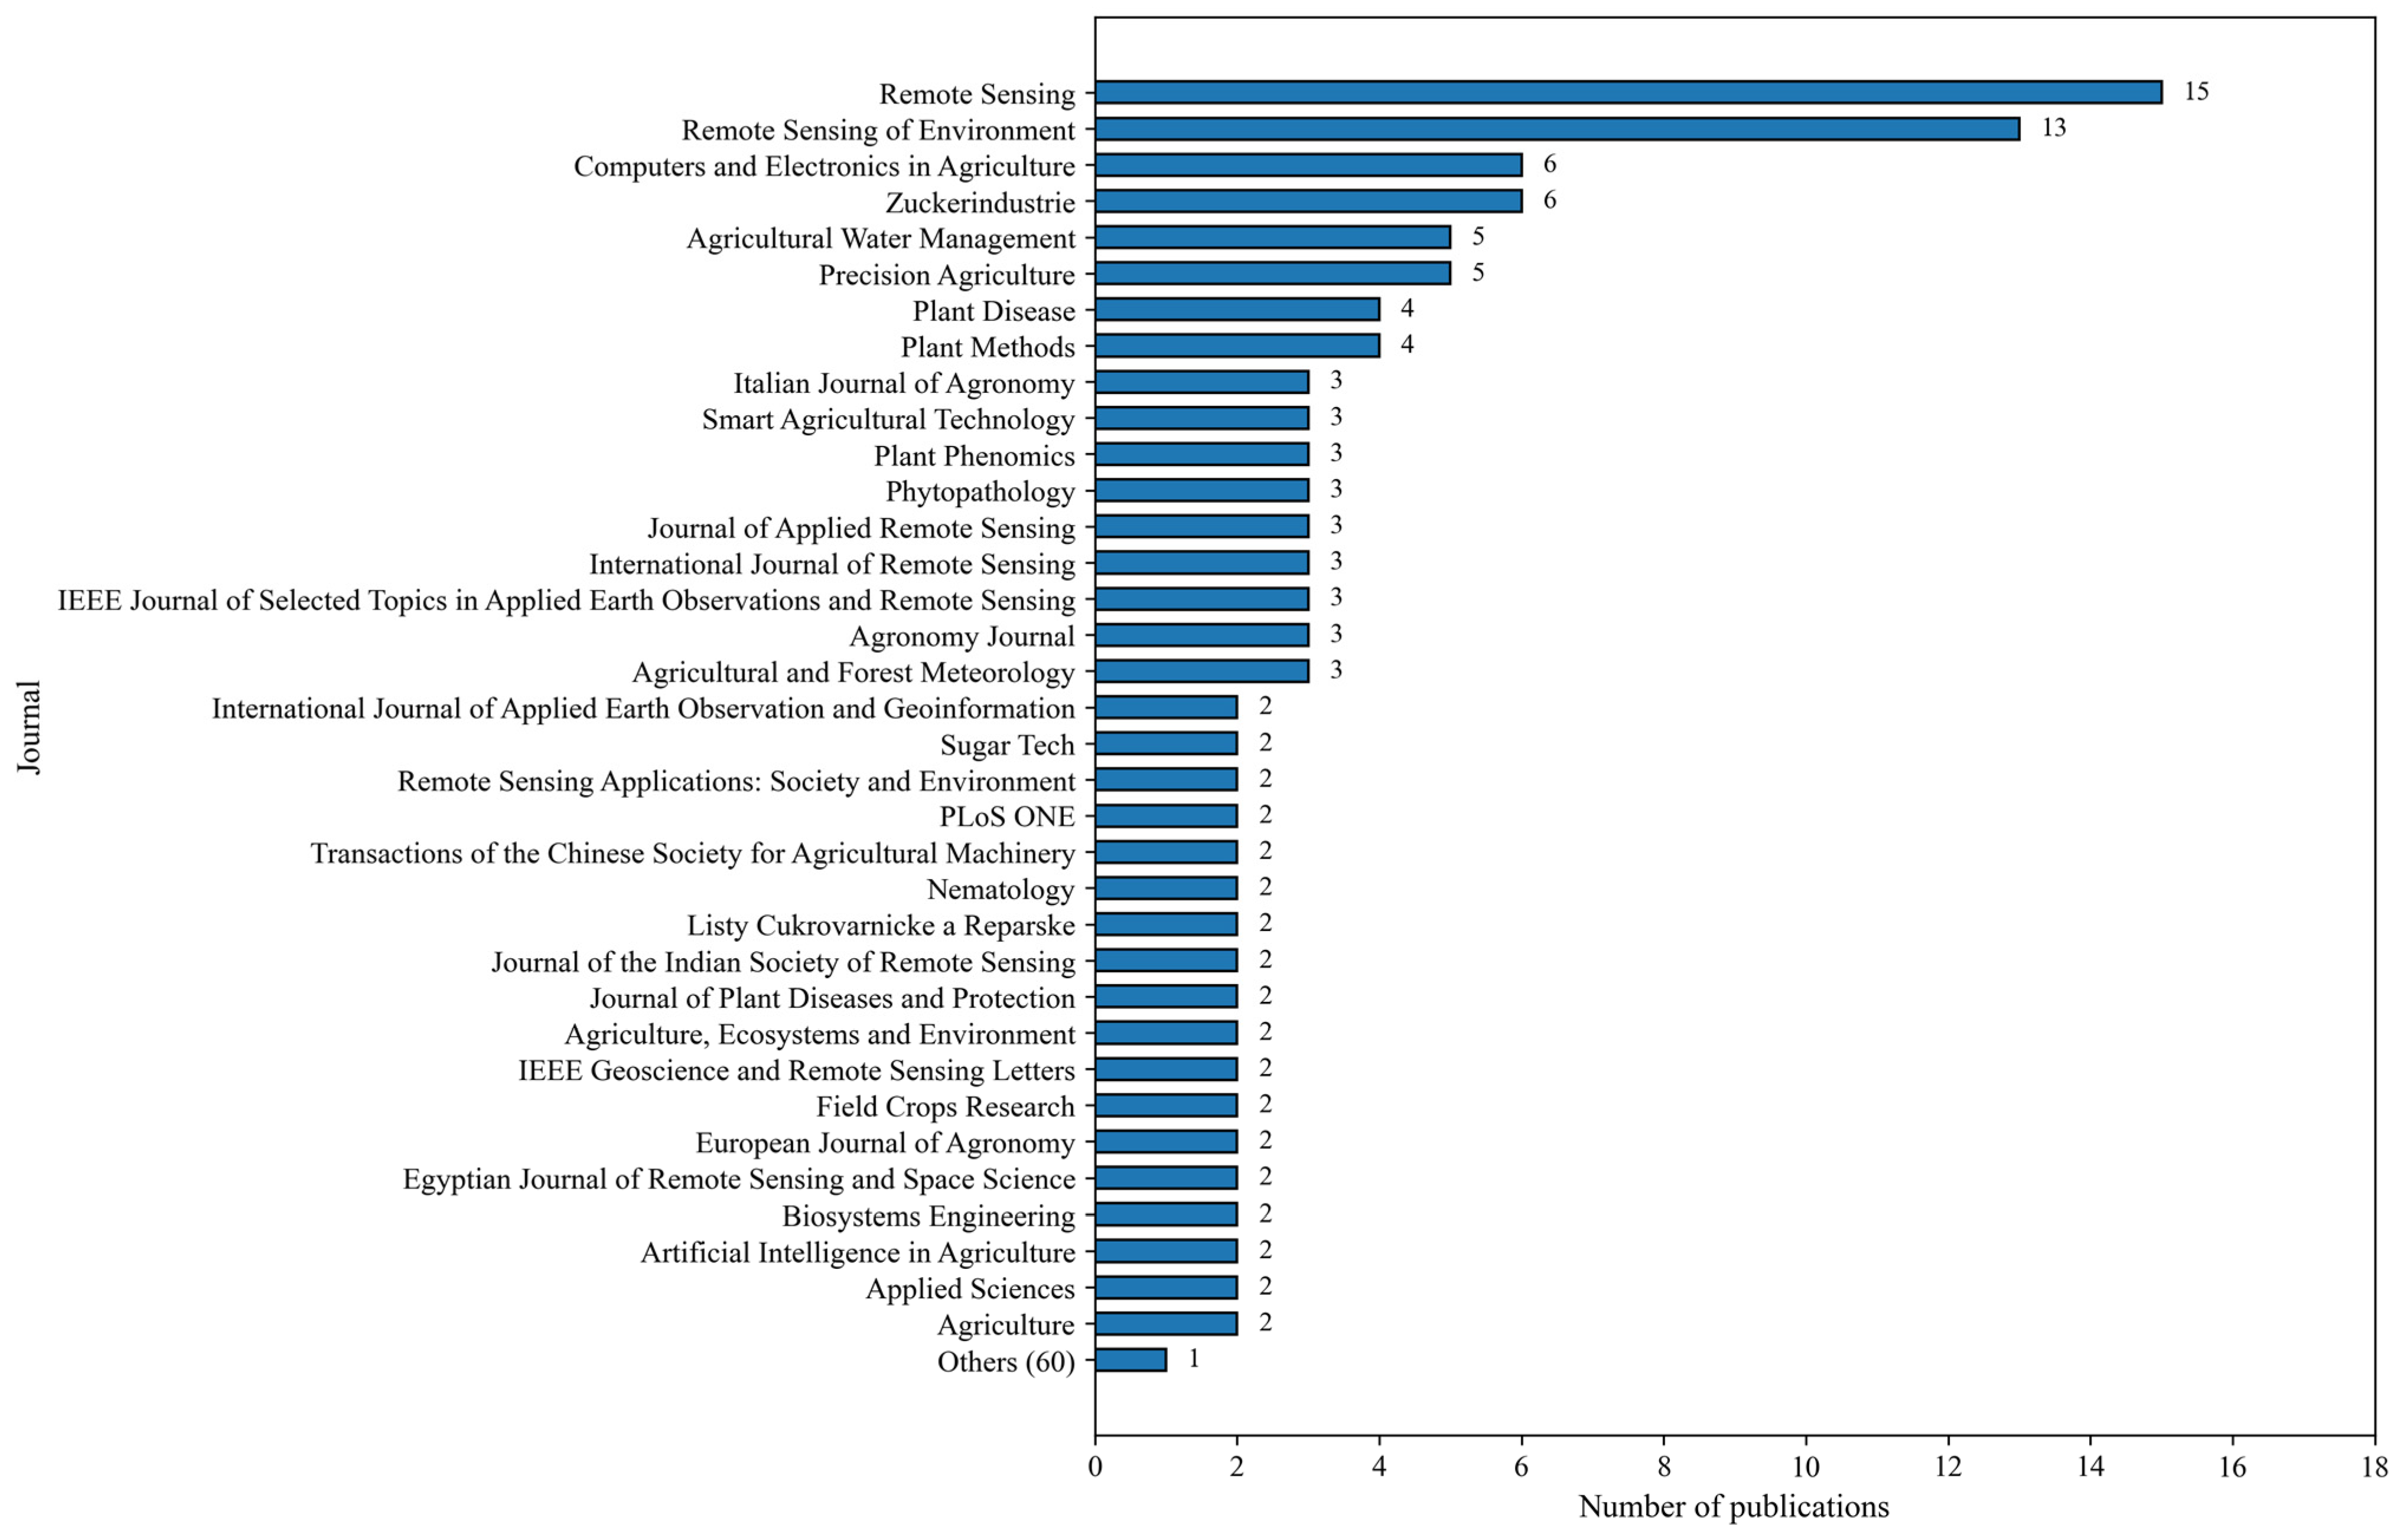
The retained literature was published across a wide range of journals, indicating that RS applications in sugar beet production have developed as an interdisciplinary research topic. As shown in Figure 2, Remote Sensing published the largest number of relevant studies (15), followed by Remote Sensing of Environment (13). Agricultural and application-oriented journals, including Computers and Electronics in Agriculture (6), Zuckerindustrie (6), Agricultural Water Management (5) and Precision Agriculture (5), also contributed substantially. This distribution suggests that sugar beet RS is shaped not only by advances in Earth observation and image analysis, but also by agronomic, plant-health and precision-management requirements [26,31,44].
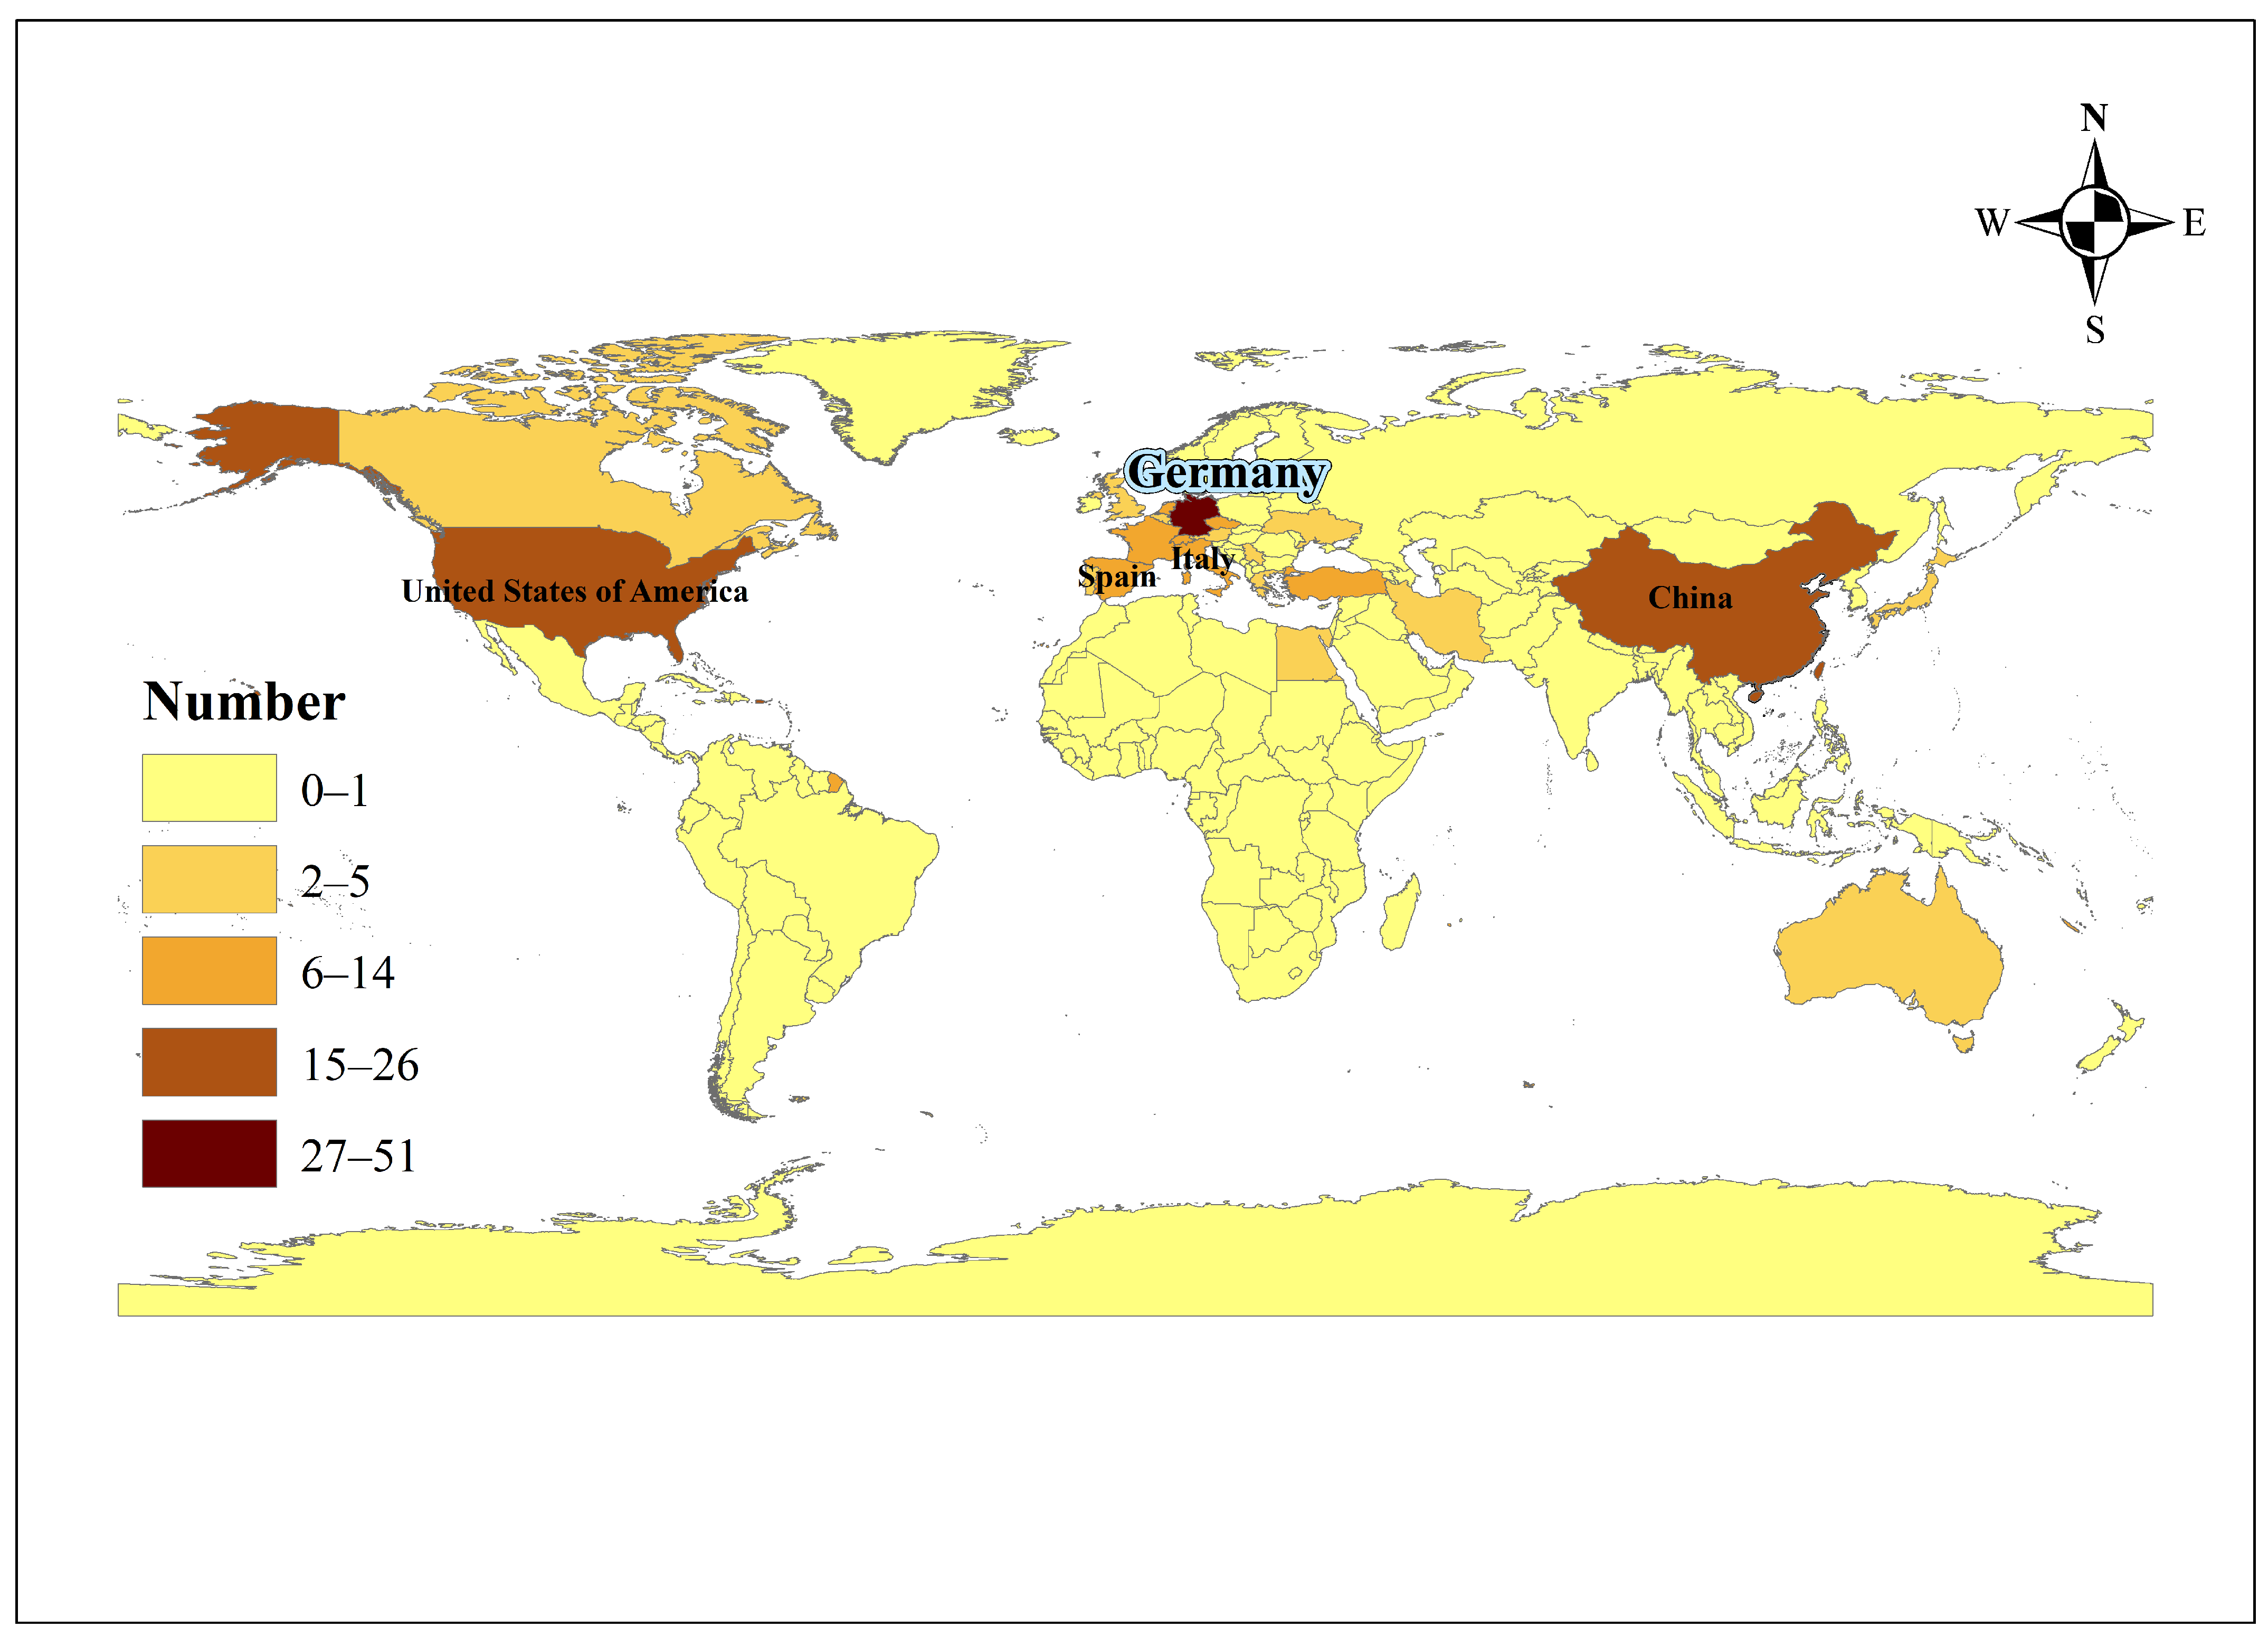
The geographic distribution of publications shows a clear concentration in major sugar beet-producing and RS research regions (Figure 3). Germany is the most prominent contributor, with 51 relevant papers published. China (23), the United States of America (21), Spain (9) and Italy (8) also account for a considerable share of the literature. Germany’s leading contribution may reflect the combination of a substantial sugar beet production base, a well-established sugar industry and long-term research capacity in sugar beet agronomy, breeding, plant protection and digital agriculture [3,45]. In particular, German research groups have made sustained contributions to spectral phenotyping, disease assessment, UAV-based monitoring and crop–weed discrimination in sugar beet [46,47,48,49,50]. These research strengths have created favourable conditions for developing and testing RS approaches under production-oriented field conditions. Nevertheless, because the country classification in Figure 3 is based on the affiliation of the first author, it represents the geographic distribution of publication output rather than the location of field experiments, the extent of national sugar beet production, or overall research capacity. The concentration of studies in a limited number of countries also suggests that many existing models and applications may be influenced by specific climatic, varietal and management conditions [51,52].
Overall, the journal and geographic distributions show that sugar beet RS has become a multidisciplinary but regionally concentrated research field. RS journals provide the main methodological foundation, whereas agricultural and crop-specific journals strengthen the connection between sensing technologies and production-management problems.

3.2. Temporal Evolution of Platforms and Applications

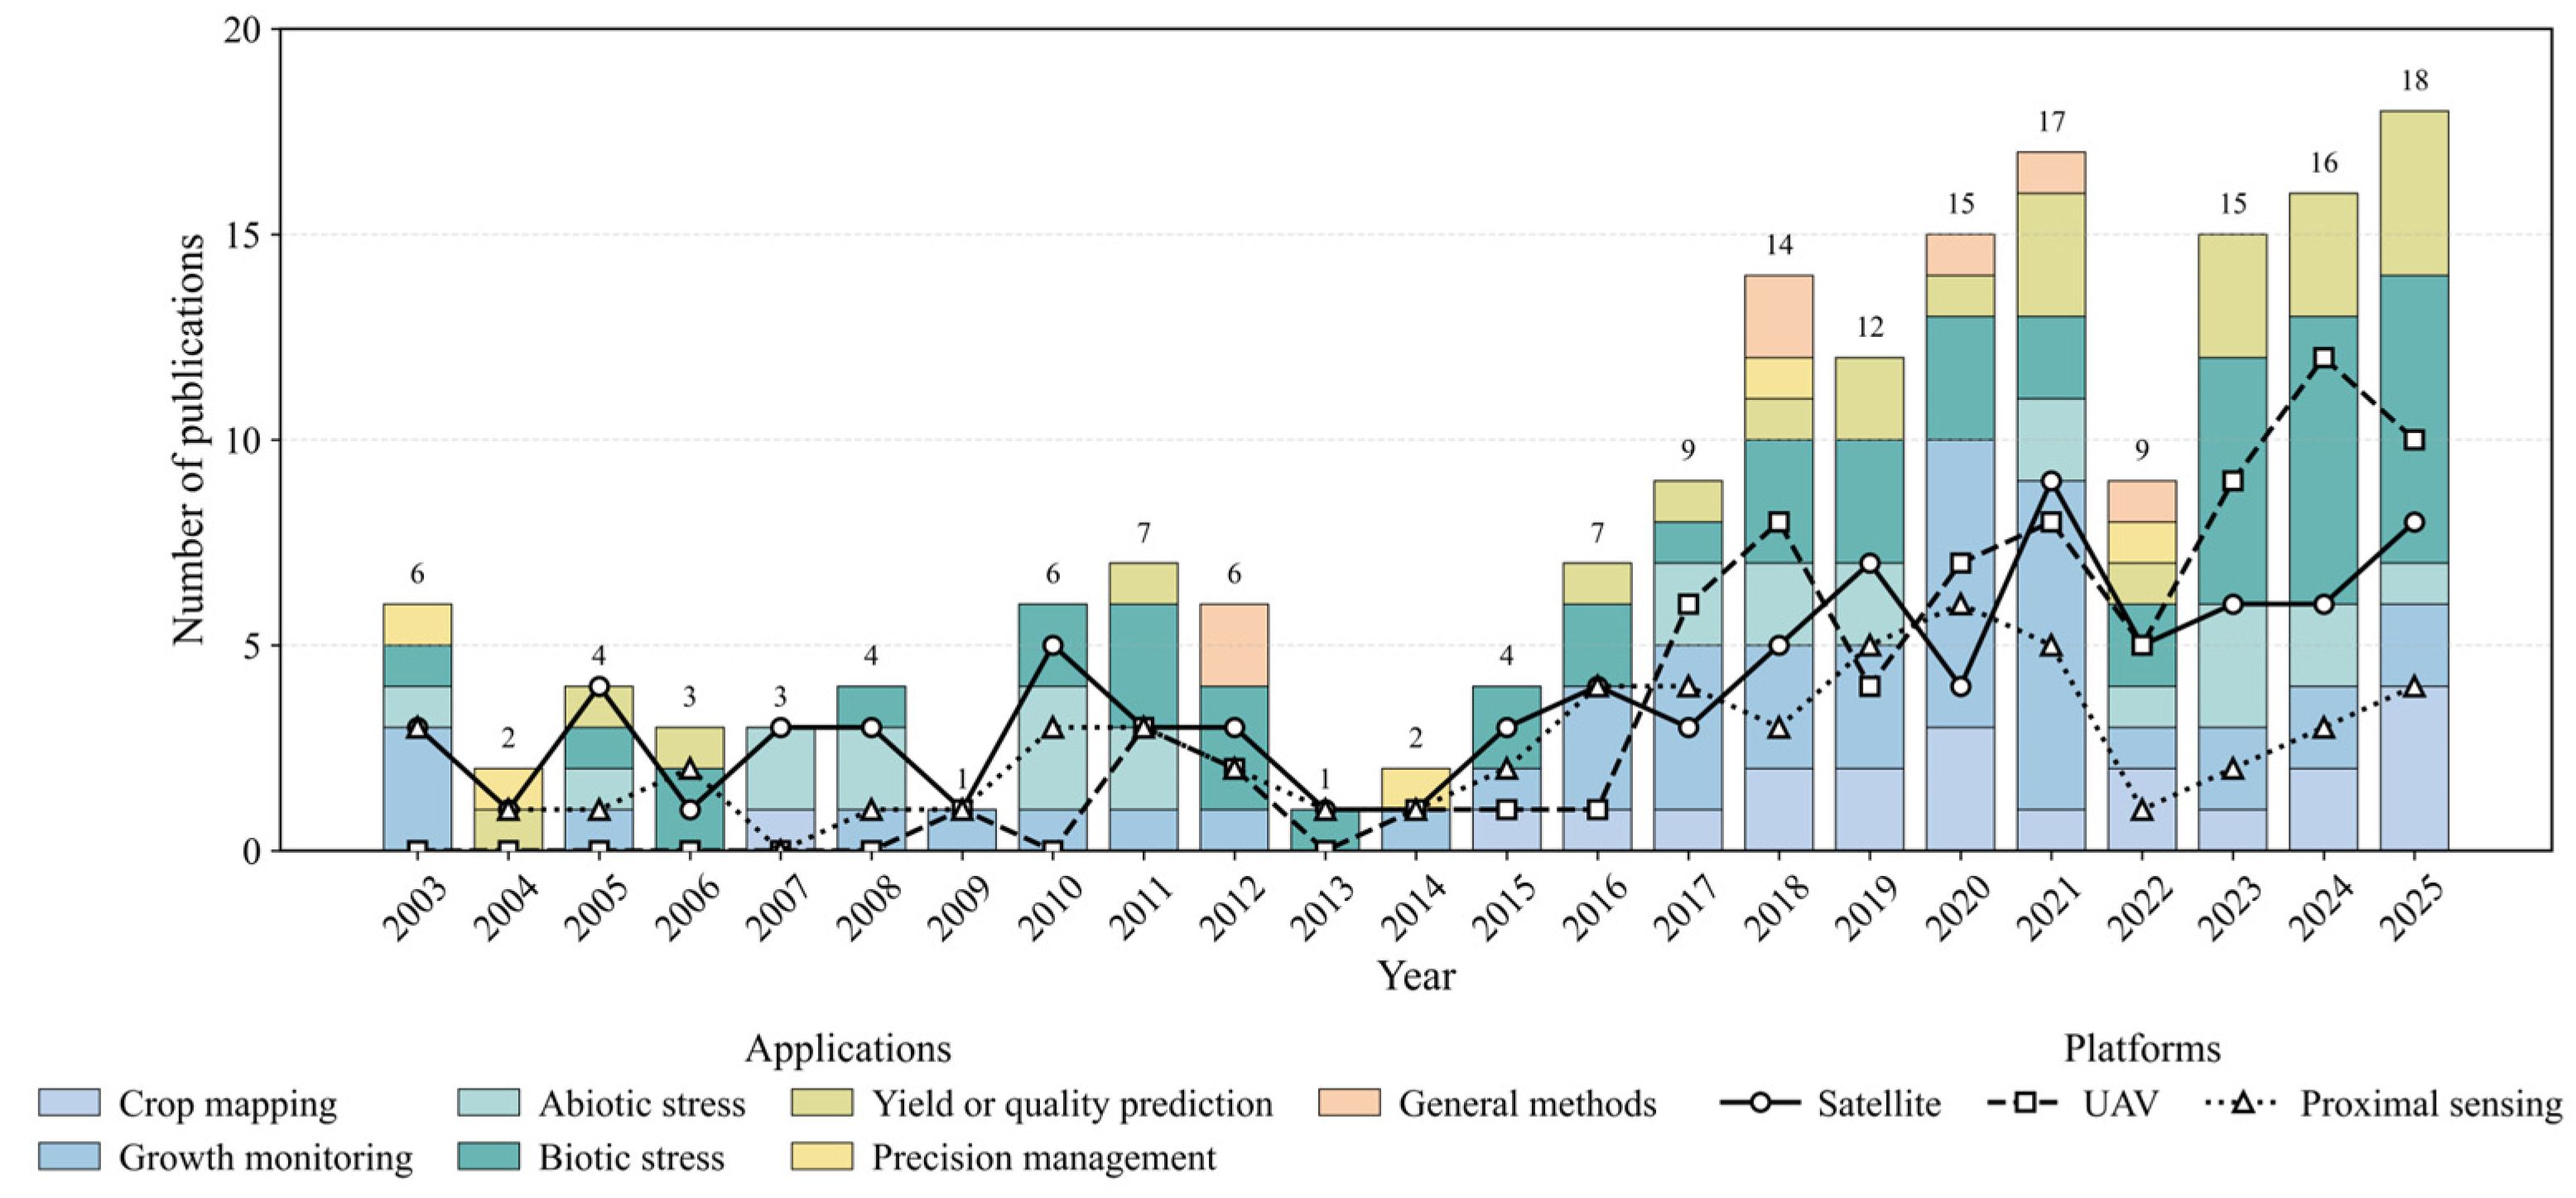
Figure 4 illustrates the annual evolution of RS studies in sugar beet production from 2003 to 2025. The publication trend shows a clear increase over time, although annual fluctuations are evident. During 2003–2014, the number of publications remained relatively low and unstable, generally ranging from one to seven papers per year. Research in this early period mainly focused on crop mapping, growth monitoring, abiotic stress assessment and general methodological exploration [53,54,55,56]. Satellite and proximal sensing were the dominant data sources, while UAV-based studies were rare [46,55].
A noticeable expansion occurred after 2015. The annual number of publications increased from 4 in 2015 to 7 in 2016, 9 in 2017 and 14 in 2018, indicating that sugar beet RS entered a more active development phase. This expansion coincided with the availability of Sentinel-2 imagery, whose spatial resolution, red-edge bands and repeat coverage strengthened the potential for crop monitoring at field to regional scales [28]. Although the publication pattern alone cannot demonstrate a causal relationship, satellite-related studies increased notably between 2015 and 2019, suggesting that Sentinel-2 contributed to the expansion of sugar beet RS research during this period. In contrast, UAV-related studies showed an initial increase from 2016 to 2018 and a more pronounced rise from 2022 onwards, rather than continuous growth throughout 2015–2019. These differing trajectories reflect the complementary roles of the platforms: satellite observations supported repeated and broader-scale monitoring, whereas UAV systems increasingly enabled high-resolution assessments of within-field variability, disease symptoms and weed patches [57].
From 2020 onwards, the literature shows a more diversified application pattern. Although annual publication numbers fluctuated, they remained at a relatively high level, reaching 15 in 2020, 17 in 2021, 15 in 2023, 16 in 2024 and 18 in 2025. During this period, studies related to biotic stress, yield or quality prediction and precision management became more visible, while crop mapping and growth monitoring remained important components of the field [44,47,58,59,60]. This pattern suggests that sugar beet RS has not moved away from crop monitoring, but has gradually expanded towards more diagnostic and management-oriented applications. At the platform level, satellite data continued to provide important information for regional monitoring and temporal assessment, whereas UAV-based studies showed a renewed and marked increase from 2022 onwards, reinforcing the role of high-resolution field-scale observation [58,60]. Proximal sensing maintained a smaller but stable role, mainly contributing to spectral measurements, physiological interpretation and model calibration [29,61].
Taken together, these temporal patterns provide a basis for distinguishing different stages in the development of sugar beet RS: an early exploratory stage before 2015; an expansion stage from 2015 to 2019 marked by increased satellite-based research following the availability of Sentinel-2 imagery and the initial uptake of UAV sensing; and a more integrated stage from 2020 to 2025, in which multi-platform observations and management-oriented applications increasingly converged.
The platform-level trends shown in Figure 4 can be further interpreted in the context of the complementary characteristics of different sensing systems. As summarised in Table 2, satellite provides the broadest spatial coverage and the strongest temporal continuity, making it particularly suitable for crop mapping, phenological monitoring, drought assessment and regional yield forecasting [16,28,62]. However, medium-resolution imagery may not resolve fine within-field variation, and the availability of optical observations remains sensitive to cloud cover [63]. UAV platforms provide centimetre-level spatial detail and flexible acquisition timing, and are therefore particularly valuable for assessing canopy heterogeneity, nutrient status, disease symptoms and weed distribution at field scale [32,44,64,65]. Proximal sensing offers the highest degree of measurement control and physiological specificity, but its limited spatial coverage and labour requirements constrain its scalability [24].
These differences indicate that the development of sugar beet RS should not be viewed as a replacement of one platform by another, but rather as the emergence of complementary multi-scale observation systems [66,67]. Satellite observations are most effective for regional surveillance and temporal continuity; UAV observations are most valuable for precision intervention at field scale; and proximal sensing provides the mechanistic support needed for reliable model development. This complementarity helps explain the temporal evolution observed in Figure 4 and provides the technical basis for the application pathway discussed in the following sections, from crop growth monitoring and biotic stress detection to yield and quality prediction and precision management.
In summary, the selection of RS platforms and sensors for sugar beet cultivation depends on the scale of application, the specific parameters to be monitored, the required spatial and temporal resolution and the resources available. Satellite platforms are well suited to regional monitoring and large-scale mapping, whereas UAVs excel at detailed field assessments and targeted data acquisition. Proximal sensing systems provide valuable high-resolution measurements and validation data under controlled conditions. Increasing attention is being given to the integration of data from multiple platforms and sensors in order to exploit the strengths of each system.

4. RS Applications in Sugar Beet Production

4.1. Sugar Beet Growth Monitoring and Trait Retrieval

Crop growth monitoring and trait retrieval provide the physiological foundation for most RS applications in sugar beet [54]. However, the reviewed literature also indicates that canopy-related variables should be interpreted as intermediate indicators rather than as direct proxies for root yield, sucrose concentration, or processing quality. Early canopy expansion is strongly associated with radiation interception, biomass accumulation and crop establishment, whereas root growth and sugar accumulation become increasingly important later in the growing season [13,68,69,70,71,72]. Consequently, the suitability of a sensing approach depends on the target trait and growth stage.
Leaf area index (LAI), canopy cover, plant density and above-ground biomass (AGB) are the most widely investigated structural variables. Early optical studies established the feasibility of retrieving LAI from spectral information and empirical regression models [54,68,73]. More recent studies indicate that UAV imagery has substantially improved the spatial characterisation of within-field canopy heterogeneity by providing centimetre-scale observations of canopy cover, crop rows and individual plants [70,74]. In particular, UAV red–green–blue (RGB) and multispectral imagery are well suited to monitoring emergence, stand establishment, canopy closure and localised growth variation [75]. Spectral indices, including the normalised difference vegetation index (NDVI) and wide dynamic range vegetation index (WDRVI), are useful for rapid crop-vigour assessment, whereas canopy height and three-dimensional descriptors derived from photogrammetry can add structural information that is not available from spectral indices alone [70,76].
Across the reviewed studies, simple spectral-index approaches appear most useful when the target variable is closely linked to canopy cover or greenness and when measurements are obtained within a relatively narrow range of growth stages [54,70,73]. Their advantages are low computational demand, straightforward interpretation and practical suitability for repeated field monitoring. However, their limitations are equally consistent across studies: exposed soil can dominate the signal during early growth, while index saturation may reduce sensitivity under dense canopies [69]. Therefore, VIs should be treated primarily as input features or indicators of crop status rather than as universally transferable prediction methods. Comparisons between VI-based methods and radiative-transfer-model inversion further suggest that physically informed approaches may improve both retrieval accuracy and the physical interpretability of canopy traits, particularly LAI, chlorophyll and nitrogen-related variables, although they require more detailed parameterisation and high-quality field measurements [72]. Jiang et al. [74] reported substantial variation among VI-threshold combinations, with performance ranging from R2 = 0.34 and NRMSE = 42.3% to R2 = 0.96 and NRMSE = 5.1%. This within-study range indicates that image-processing and threshold-selection procedures can be as influential as the sensing platform itself. Similarly, UAV models developed by Cao et al. [70] using the WDRVI achieved R2 values of 0.950–0.963 for LAI and fresh-biomass-related traits. Nevertheless, strong performance within an individual experiment does not necessarily indicate that a model will transfer reliably across years, cultivars or contrasting field-management conditions.
Chlorophyll content (CC), Soil–Plant Analysis Development (SPAD) values and nitrogen-related traits represent a second major research direction. The strongest evidence for these variables comes from multispectral, hyperspectral and proximal sensing studies that exploit visible, near-infrared and red-edge information [29,69,77,78,79]. Red-edge and narrowband hyperspectral features are generally more sensitive than broad-band greenness indices when estimating chlorophyll- and nitrogen-related traits because they are more closely associated with pigment absorption and canopy biochemical variation [80,81,82]. UAV multispectral platforms offer an operational compromise between measurement detail and field coverage, whereas proximal hyperspectral sensing remains particularly valuable for calibration, physiological interpretation and the development of reference models [19,22]. Nevertheless, the reviewed evidence does not support a single best sensor for nitrogen monitoring. Multispectral UAV data are more practical for field-scale mapping, while hyperspectral and proximal observations are more appropriate when the objective is precise biochemical characterisation or the identification of informative spectral features [77,78].
Water-status assessment has followed a similar pattern. Thermal imagery, canopy temperature, hyperspectral water-sensitive features and solar-induced chlorophyll fluorescence can reveal crop responses to water limitation [83,84,85,86,87]. Thermal approaches are particularly relevant because canopy temperature integrates transpiration-related responses and can identify spatial variation in crop water stress. However, their interpretation is highly sensitive to weather conditions, solar radiation, wind, acquisition time, soil background and canopy structure [88,89]. The reviewed studies therefore suggest that thermal imagery is more reliable for identifying relative differences in water status within a field than for providing a universal irrigation threshold without local calibration. Integrating canopy-temperature information with soil moisture, weather conditions and crop growth stage is more likely to produce agronomically meaningful irrigation guidance than using temperature-derived indicators alone [89,90].
Overall, the evidence indicates that satellite data are most useful for repeated regional-scale monitoring and seasonal context, UAV imagery is most effective for resolving field-scale canopy variability, and proximal or hyperspectral sensing provides the strongest physiological interpretation. A major limitation is that most growth-monitoring studies focus on canopy traits during early or mid-season stages and use local datasets. Future studies should test whether structural and biochemical indicators remain informative across years, cultivars, nitrogen regimes and water conditions. More importantly, canopy traits should be explicitly linked with root development, sucrose accumulation and processing quality rather than being assumed to represent final economic performance.

4.2. Biotic Stress Detection: Diseases and Weeds

Biotic stress detection is one of the most active application domains in the reviewed sugar beet RS literature. This emphasis reflects the importance of disease and weed pressure for sugar beet production, but it also reveals that the current evidence base is heavily weighted towards image-based diagnosis rather than validated management outcomes. RS can identify spatial variation in canopy colour, pigment content, texture, temperature and structure, thereby supporting earlier detection of abnormal crop conditions than conventional visual assessment alone [48,91,92]. However, the ability to distinguish a specific disease from non-specific canopy decline remains a central scientific and practical challenge.
Cercospora leaf spot (CLS) is by far the most extensively investigated disease. This concentration is understandable because CLS causes visible leaf lesions, chlorophyll degradation and reductions in photosynthetically active canopy area, all of which can be captured by optical sensing [49,50,93,94]. The reviewed studies show a clear progression from close-range spectral phenotyping to UAV-based field-scale mapping and, more recently, to deep-learning-based disease-incidence and severity assessment. Hyperspectral and close-range systems provide the strongest spectral specificity and are particularly useful for breeding trials, detailed phenotyping and pathogen-related physiological research [46,95]. In contrast, UAV RGB and multispectral imagery provide greater spatial coverage and are more suitable for mapping disease incidence or severity across commercial fields [94]. The comparison of ground-based and UAV phenotyping systems also demonstrates that higher spatial resolution is not always sufficient by itself; the appropriate platform depends on whether the objective is detailed disease scoring for breeding or operational field surveillance [47].
Recent studies using three-dimensional information, thermal imaging, vision transformers and multi-sensor approaches indicate that disease assessment is moving beyond simple canopy greenness metrics [65,96,97,98]. These developments are important because disease symptoms influence both spectral and structural crop characteristics. Reported performance depended strongly on sensing scale and validation design. Under controlled or proximal hyperspectral conditions, disease-identification accuracies and F1-scores of approximately 99–100% have been reported, together with an IoU of 0.94 for severity quantification [96]. By contrast, an independent-year UAV evaluation of virus-yellows incidence across cultivars not used for model training produced an RMSE of 11.45% [99]. These values are not directly comparable because one study addressed classification and severity quantification under relatively controlled conditions, whereas the other evaluated continuous disease incidence under an external temporal and varietal setting. The latter result is numerically less striking but provides stronger evidence of field-level generalisation. Consequently, exceptionally high within-dataset accuracy should not be interpreted as evidence of operational disease diagnosis without independent temporal, spatial and varietal validation.
The literature on other diseases and pests is more fragmented. Hyperspectral and fluorescence-based approaches have been used to investigate rhizomania, beet cyst nematode infestation, Rhizoctonia-related symptoms and other disease responses [100,101]. These studies demonstrate that canopy and leaf-level sensing can detect physiological stress responses associated with below-ground problems. Nevertheless, below-ground diseases remain intrinsically difficult to diagnose because observable canopy symptoms are indirect and may emerge only after substantial crop damage has occurred. Similar limitations apply when disease symptoms overlap with nutrient deficiency, drought stress, senescence, pest injury or varietal differences [95,102,103]. Multi-temporal observations and independent field validation are therefore essential for distinguishing disease-specific signals from general reductions in crop vigour.
Weed mapping represents a more direct route from image interpretation to management. Sugar beet is particularly sensitive to weed competition during early growth, when crop rows remain visible and incomplete canopy closure allows weeds to be spatially separated from crop plants and bare soil [57,104,105]. The reviewed studies consistently indicate that high-resolution UAV imagery is the most appropriate platform for this task. RGB imagery can support crop–weed separation under favourable illumination and crop-row conditions, whereas multispectral imagery and DL-based segmentation can provide additional spectral and contextual information where visual similarity between weeds and sugar beet seedlings is high [106,107,108]. Multi-temporal UAV mapping has already been used to produce prescription maps for site-specific weed control, making weed mapping one of the clearest examples of an RS product with immediate management relevance [57,60]. Quantitative comparisons further demonstrate the value of both spectral information and advanced segmentation methods. Multispectral information increased weed-class AUC from 0.576 to 0.782 relative to an RGB baseline [104], while a recent UAV framework achieved IoU values of 0.85 for sugar beet and 0.72 for weeds [60]. The lower performance for weeds than for sugar beet reflects the greater spectral, morphological and spatial heterogeneity of weed communities.
However, weed-detection performance remains highly dependent on growth stage, weed species composition, row spacing, soil visibility, illumination, image resolution and annotation quality. Early season acquisition is generally advantageous because individual plants and weed patches remain distinguishable, whereas later canopy closure reduces separability [106,109]. Future research should therefore move beyond single-date segmentation accuracy and assess whether weed maps improve herbicide-use efficiency, weed control efficacy, profitability and environmental outcomes under commercial field conditions.
In summary, the evidence is strongest for UAV-supported detection of visible CLS symptoms and early-season weed mapping. Hyperspectral, fluorescence and thermal sensing provide valuable physiological information but are less readily scalable. The major research gaps are the early detection of presymptomatic disease, discrimination among multiple co-occurring stresses, external validation across sites and seasons, and the conversion of disease maps into calibrated treatment thresholds and operational crop-protection decisions.

4.3. Yield, Sugar Content and Quality Prediction

Yield and quality prediction represent the most economically important but scientifically demanding applications of sugar beet RS [30,110]. Unlike many grain crops, sugar beet profitability depends on root yield, sucrose concentration, recoverable sugar yield and processing-related quality rather than canopy biomass alone [111,112]. The reviewed literature therefore demonstrates a critical distinction: RS can observe canopy development directly, but sugar-related traits are associated primarily with below-ground storage-root processes. This indirect relationship explains why root yield prediction is more mature than sugar-content and processing-quality prediction.
Satellite and ground-based optical studies initially focused on spectral indices and seasonal canopy dynamics as indicators of crop productivity [16,35,113]. These studies show that repeated satellite observations can support regional yield estimation because they capture broad differences in crop development, phenology and seasonal stress exposure. Satellite time series are therefore most appropriate for regional surveillance, yield forecasting and comparisons among large production areas. At field scale, UAV imagery provides much greater detail and can capture canopy cover, plant height, structural heterogeneity and local growth dynamics [114,115]. The evidence suggests that single-date vegetation indices can provide useful information about crop status, particularly during periods of rapid canopy development, but their relationship with final root yield is conditional on crop stage, water supply, nitrogen availability and disease pressure.
Multi-temporal observations are generally more informative than single-date imagery because they represent the trajectory of crop development rather than a temporary canopy condition. Seasonal NDVI, enhanced vegetation index (EVI), canopy-cover and canopy-height trajectories can capture emergence, canopy closure, stress development and late-season senescence, all of which are relevant to root yield formation [70,76,110]. This explains the increasing use of time-series UAV data, meteorological variables and recurrent modelling approaches for pre-harvest yield prediction [30]. However, the practical gain of increasingly complex models should be evaluated against robust baselines. In many cases, a well-calibrated multi-temporal vegetation-index model may be more interpretable and easier to implement than a complex ML or DL model trained on a limited local dataset.
Sugar-content and processing-quality prediction remain substantially less developed. Studies using active optical sensors, UAV multispectral imagery, hyperspectral data and multi-sensor fusion have shown that canopy features can be associated with sugar content and related quality variables [30,36,116]. Nevertheless, these associations should not be interpreted as direct observation of sucrose accumulation. Canopy reflectance, temperature and structure are influenced by genotype, nitrogen supply, water availability, disease severity, temperature and harvest date, all of which may affect root yield and sugar concentration in different directions [13,111,116]. For example, vigorous canopy growth may be associated with high root biomass but does not necessarily indicate high sucrose concentration or favourable processing quality.
The reviewed evidence suggests that multi-source and multi-temporal approaches are more promising than single-sensor or single-date models for sugar-related prediction. UAV-derived RGB, multispectral, hyperspectral and structural information can provide complementary descriptions of crop development, while weather, soil and management data help explain environmental controls on sugar accumulation [30,110]. Reported performance nevertheless varied considerably among prediction targets and modelling designs. Representative UAV studies reported R2 values ranging from 0.478 for sugar-yield prediction using a multi-temporal Stacked-LSTM model to more than 0.97 for reported relationships between processed vegetation indices and root yield [30,76]. Multi-source and multi-temporal UAV observations also produced an R2 of 0.95 for sugar yield estimation [110]. However, these values are not directly interchangeable because the studies differed in target definition, sample composition, temporal coverage and validation design. Notably, within the same Stacked-LSTM study, sucrose concentration was predicted more accurately (R2 = 0.761; rRMSE = 7.1%) than root yield (R2 = 0.531; rRMSE = 22.5%) or sugar yield (R2 = 0.478; rRMSE = 23.4%) [30]. This within-study contrast demonstrates that root yield, sucrose concentration and sugar yield should be evaluated as distinct prediction targets rather than grouped under a single category of ‘yield prediction’.
The main practical implication is that RS-based yield prediction is approaching operational relevance for field ranking, harvest planning and regional forecasting, whereas quality-oriented prediction should still be treated as decision support requiring laboratory measurements and agronomic records. Future work should standardise target definitions, distinguish clearly between root yield, sucrose concentration, recoverable sugar yield and processing quality, and use multi-year, multi-location datasets with independent validation. Combining RS observations with crop-growth models may be particularly valuable because process-based approaches can link canopy dynamics with biomass partitioning and sugar accumulation rather than relying solely on empirical correlations.

4.4. RS-Enabled Precision Management in Sugar Beet

RS-enabled precision management requires more than the production of accurate maps [117]. It requires a defensible workflow linking observations to agronomic interpretation, management thresholds, field operations, and post-management evaluation. The literature review indicates that this transition remains incomplete in sugar beet: only five of the 181 retained records were classified specifically as precision-management or decision-support studies (Figure 4). Many more studies have clear management implications, but relatively few evaluate whether RS-derived products improve treatment timing, input efficiency, yield, quality or profitability under real production conditions.
The strongest current management applications relate to targeted scouting, site-specific weed control, irrigation prioritisation and harvest planning. Disease-incidence and severity maps can identify field zones requiring closer inspection or crop-protection intervention [44,49,118]. Weed maps derived from high-resolution UAV imagery can be converted into prescription maps for site-specific herbicide applications and therefore provide one of the most direct examples of RS-supported management [57,60]. Similarly, canopy-temperature and water-stress indicators can help identify areas of relatively high water demand, particularly when interpreted jointly with soil moisture, weather conditions and crop stage [90]. These applications are valuable because they support prioritisation: they help growers decide where to inspect, sample or intervene first. However, only a small proportion of studies reported outcomes beyond map or model accuracy. Weed prescription maps have indicated potential herbicide savings of up to 82.88%, although this value was derived theoretically from the mapped treatment area rather than measured through replicated variable-rate field application [60]. An earlier field-oriented mapping study reported approximately 80% correct classification during the final sugar beet treatment [57], but classification accuracy alone does not demonstrate a corresponding reduction in herbicide use or an improvement in weed-control efficacy. Evidence for realised reductions in treatment cost, crop damage and environmental loading therefore remains limited. Future precision-management studies should report both diagnostic performance and intervention outcomes under operational field conditions.
Management zone delineation provides another pathway for translating repeated observations into spatially differentiated management. Multi-temporal VIs, canopy structural variables, soil properties, topography and historical yield patterns can identify stable zones of contrasting production potential or recurrent constraints [119,120,121,122]. However, the reviewed evidence suggests that a vegetation-index map alone is insufficient for prescribing fertiliser or irrigation. In sugar beet, high canopy vigour may reflect favourable growth conditions but may also be associated with excessive nitrogen supply, which can increase vegetative growth without improving sucrose concentration or processing quality [71]. Therefore, management zones should be interpreted using agronomic knowledge and complementary information, including soil fertility, crop stage, cultivar, previous management and quality objectives.
Yield and quality prediction can also contribute to harvest and supply-chain decisions. Pre-harvest estimates of root yield, sucrose concentration and recoverable sugar yield could support field ranking, harvest scheduling and sugar-factory logistics [79,110]. Yet their operational use requires explicit uncertainty information and practical decision rules. For example, a model predicting high root yield but low sugar concentration may imply a different harvest priority from a model predicting moderate root yield with high recoverable sugar yield. This distinction is particularly important for sugar beet because management should optimise economic return and processing value rather than canopy biomass alone.
The central research gap is therefore not simply the accuracy of RS models, but the absence of validated end-to-end decision workflows. Future studies should test whether RS-based recommendations lead to measurable improvements in fertiliser-use efficiency, irrigation water productivity, herbicide reduction, disease-control timing, sugar yield, processing quality or farm profitability. Such studies should include uncertainty assessment, machinery compatibility, economic analysis and comparison with conventional management. The most useful future framework would integrate satellite monitoring for seasonal context, UAV observations for field-scale diagnosis, proximal sensing and sampling for calibration, and agronomic decision rules for implementation. Only through this integration can sugar beet RS progress from descriptive monitoring to actionable, quality-oriented precision management.
To complement the qualitative discussion above, Table 3 summarises representative quantitative performance and validation contexts from selected studies covering canopy-trait retrieval, disease assessment, crop–weed mapping, yield and quality prediction, and precision management. The studies were selected to illustrate both the reported performance and the substantial differences in sensing scale, target definition, experimental design and validation strategy across the literature. Because the reported metrics and experimental settings were heterogeneous, the values should be interpreted within their respective application contexts rather than as a pooled ranking or meta-analytic benchmark.

5. Modelling Strategies and Data Fusion

The applications discussed above depend on modelling and data-integration approaches that transform RS-derived predictors into agronomically meaningful information. In sugar beet production, these approaches include empirical regression models based on spectral predictors, ML, DL, multi-temporal analysis, multi-source data fusion and crop model assimilation. This section synthesises the main modelling approaches used in sugar beet RS and evaluates their suitability for trait retrieval, stress detection, yield and quality prediction, and precision management. The major modelling strategies and their typical applications in sugar beet RS are summarised in Table 4.

5.1. Spectral Predictors and Empirical Regression Models

Spectral predictors, particularly VIs, remain widely used inputs for sugar beet RS because they condense reflectance information into variables related to canopy greenness, biomass accumulation, chlorophyll content, nitrogen status and general crop vigour [79,123]. Commonly used predictors include NDVI, EVI, WDRVI, Soil-Adjusted Vegetation Index (SAVI), red-edge indices and narrowband hyperspectral indices [69,70,77,113,124]. These spectral variables have been widely used to estimate LAI, canopy cover, AGB, SPAD values, chlorophyll-related traits and yield-related variables in sugar beet.
In most studies, spectral predictors are incorporated into empirical regression models rather than functioning as standalone modelling approaches. Linear regression, multiple regression, stepwise regression and partial least squares regression have been used to relate spectral features to field-measured crop traits [82,125,126,127]. These models are particularly suitable when the target variable is directly associated with canopy characteristics, such as canopy cover, LAI, chlorophyll content or early biomass accumulation [128]. Hyperspectral observations can further improve trait retrieval by exploiting narrowband features associated with pigment absorption, red-edge displacement and water-sensitive spectral regions [129,130].
The main advantages of empirical regression models are their simplicity, interpretability and low computational requirements [131]. They provide useful baseline models for field experiments, agronomic trials and routine crop monitoring, where rapid interpretation and clear physiological links are important [132,133]. Compared with ML or DL methods, empirical models are generally easier to calibrate, explain and deploy when the number of predictors is limited, and the relationship between spectral information and the target trait is relatively direct.
However, the reviewed studies also indicate that empirical relationships are often conditional on specific crop, sensor and environmental conditions. Soil background and row structure can dominate the spectral signal during early growth, whereas dense canopy development may reduce the sensitivity of commonly used indices, particularly NDVI [124,134]. Model performance can also vary with illumination conditions, atmospheric effects, cultivar, nitrogen supply, water status, growth stage and sensor configuration [132,133]. Consequently, strong relationships reported within individual experiments should not automatically be interpreted as evidence of transferability across years, regions or management systems.
These limitations are particularly important for sugar beet because canopy vigour does not necessarily correspond directly to final root yield, sucrose concentration or processing quality [13]. Spectral predictors and empirical regression models should therefore be regarded as transparent and valuable baseline approaches for canopy-related trait retrieval, rather than complete solutions for complex production traits. For yield and quality prediction, their performance is likely to improve when combined with multi-temporal observations, structural features, weather variables and other complementary data sources, as discussed in the following sections.

5.2. ML and DL Approaches

ML and DL approaches have increasingly been used in sugar beet RS, although they are most suitable for partly different types of data and analytical tasks [135]. In general, ML methods are well suited to prediction problems based on tabular and heterogeneous predictors, whereas DL methods are particularly advantageous when high-resolution imagery and spatially explicit labels are available. ML algorithms can integrate spectral predictors, canopy structural traits, thermal variables, weather data, soil information and management records to model complex relationships between RS observations and agronomic variables [36]. Random Forest (RF), Support Vector Machine (SVM), and K-Nearest Neighbour (KNN) have been applied to tasks such as SPAD estimation, disease detection, cultivar discrimination, and yield prediction [30,94,96,97]. Compared with empirical regression models, ML approaches can better accommodate non-linear relationships and interactions among multiple predictors. This is particularly relevant in sugar beet because crop growth, stress responses, root yield, and sugar-related traits are jointly influenced by genotype, environmental conditions, and management practices [33,36].
The main advantage of ML is therefore its ability to combine complementary information rather than relying on a single spectral indicator. For example, spectral features may describe canopy condition, structural variables may represent crop architecture, and weather or soil variables may explain environmental constraints on yield and quality formation. However, the apparent performance advantage of ML should be interpreted cautiously. Model accuracy depends strongly on the representativeness of training data, predictor selection, hyperparameter tuning and validation design [136,137]. Models trained within a single field, year or cultivar may perform well internally but may not transfer reliably to different production conditions. Therefore, independent validation across locations, seasons and cultivars is essential before ML models can be considered suitable for operational use.
DL has further expanded the capacity of sugar beet RS for image-based classification, segmentation and detection [138,139]. Convolutional neural networks, U-Net-based architectures and transformer-based models can learn spatial and contextual information directly from UAV RGB, multispectral or hyperspectral imagery [104,140]. These capabilities are particularly useful for tasks in which spatial arrangement is informative, including crop–weed discrimination, weed segmentation, disease-incidence mapping and disease-severity assessment [98,109,118,140]. In such cases, DL can outperform methods based solely on manually derived spectral features because it can use plant morphology, canopy texture and local spatial context simultaneously.
However, DL does not necessarily provide an advantage for all sugar beet applications. For continuous trait prediction based on relatively small datasets or limited numbers of tabular predictors, conventional ML or empirical regression may be more transparent, computationally efficient and easier to validate. DL models also require large, consistently labelled datasets and substantial computational resources, while their limited interpretability can hinder agronomic explanation [141,142]. In disease and weed studies, annotation quality is particularly important because inconsistent labels can directly affect segmentation and classification performance.
Overall, ML is generally more suitable for prediction problems based on tabular and heterogeneous predictors, whereas DL is particularly advantageous when high-resolution imagery and spatially explicit labels are available. The choice between these approaches should therefore be determined by the structure of the available data, the target variable and the intended management application rather than by algorithmic complexity alone. Across the reviewed studies, direct comparison of reported accuracy remains difficult because training datasets, validation strategies, spatial scales and target definitions differ substantially. Independent validation across years, locations and cultivars is consequently more informative than high within-study accuracy alone.

5.3. Multi-Temporal and Phenology-Based Modelling

Multi-temporal and phenology-based modelling is an analytical framework rather than a single modelling algorithm. It uses repeated satellite or UAV observations to characterise crop-development trajectories and can be implemented through empirical regression, ML or DL approaches. This framework is particularly relevant to sugar beet because canopy development, stress progression, root growth and sucrose accumulation are dynamic processes that cannot be fully represented by a single image acquisition [111,143]. Although single-date imagery can provide useful information on crop condition at a specific growth stage, it may not capture seasonal growth patterns, stress recovery or late-season changes associated with quality formation [144].
Satellite time-series data are particularly valuable for describing broad seasonal patterns of emergence, rapid canopy expansion, maximum canopy development and senescence. Temporal features derived from NDVI, EVI or other spectral predictors can support crop classification, growth monitoring and regional yield prediction when observations cover key phenological stages [145]. In sugar beet, the timing and duration of canopy expansion are closely related to radiation interception and biomass accumulation, whereas premature canopy decline may reflect disease pressure, water limitation or other growth constraints [13,146]. Therefore, the value of satellite time series lies not only in increasing observation frequency, but also in providing a seasonal context for interpreting individual canopy measurements.
UAV-based multi-temporal observations provide complementary information at the field scale. Repeated UAV surveys can capture within-field changes in canopy cover, canopy height, disease progression, weed development and growth recovery with substantially finer spatial detail than satellite imagery [44,57]. Such observations are particularly useful in field experiments, breeding trials and precision management because they capture both spatial heterogeneity and temporal changes in crop condition at the level of individual plots or management zones. For example, UAV-derived growth dynamics have been used to improve sugar beet yield prediction in breeding fields by capturing variation in crop development across multiple stages [59]. High-spatio-temporal UAV observations have also been used to detect the progression of CLS, illustrating the value of repeated measurements for distinguishing persistent stress patterns from temporary canopy variation [147].
Phenology-based modelling further improves the interpretation of RS-derived predictors by considering the biological meaning of different growth stages [148]. Early season features are more likely to reflect emergence, establishment and canopy closure, whereas mid-season features are generally more informative for biomass accumulation and photosynthetic capacity [59,70,148]. Late-season observations may provide additional information on senescence, disease effects and quality formation, although canopy signals remain indirect indicators of sugar accumulation in the storage root [148]. Consequently, the most useful acquisition periods may differ according to the target variable: early-stage observations may be more relevant for weed mapping and establishment assessment, whereas multi-stage observations are more appropriate for root yield and quality-related prediction.
The main methodological challenge is therefore not simply to increase the number of observations, but to identify phenologically meaningful acquisition windows and ensure temporal comparability across seasons and sites. Cloud cover, missing satellite observations, irregular UAV flights and inconsistent preprocessing can interrupt time-series analysis and reduce model robustness. Future studies should evaluate whether the temporal features used for prediction remain stable across cultivars, years and management conditions. In particular, multi-temporal approaches are likely to be more valuable than single-date models for yield and quality prediction, but their operational value will depend on adequate temporal coverage, robust validation and integration with complementary environmental or management data [30,33].

5.4. Multi-Source Data Fusion and Crop Model Assimilation

Multi-source data fusion and crop model assimilation are complementary but distinct approaches for improving the agronomic relevance of sugar beet RS. Multi-source data fusion combines information from different sensors, platforms or ancillary datasets, whereas crop model assimilation incorporates RS-derived observations into process-based crop growth models. Both approaches are particularly relevant to sugar beet because root yield, sucrose accumulation and processing quality are influenced by interacting environmental and management factors and cannot be fully characterised by canopy reflectance alone [149].
At the sensor level, different observations provide complementary information on crop condition. Multispectral and hyperspectral data are useful for describing canopy greenness, pigment status and biochemical variation, whereas thermal imagery can provide information related to transpiration and water stress [29,89]. Structural variables derived from RGB photogrammetry or Light Detection and Ranging (LiDAR) can characterise canopy height, cover and architecture, while synthetic aperture radar (SAR) can provide additional observations when optical imagery is limited by cloud cover [27,59]. Combining such data may improve the representation of crop growth and stress responses, particularly where a single sensor cannot adequately capture the relevant physiological processes.
However, the value of data fusion should not be assumed solely from the number of input datasets. Improvements are most likely when the combined variables represent genuinely complementary physiological or environmental information and are harmonised at compatible spatial and temporal scales. For example, thermal observations may provide information on water-related stress that complements spectral indicators of canopy greenness, whereas structural metrics may improve the interpretation of biomass-related variation. In contrast, combining highly correlated predictors without careful feature selection may increase model complexity without improving robustness. Data fusion therefore requires appropriate calibration, scale matching and independent validation rather than simple accumulation of data sources [150,151].
At the data-source level, RS-derived predictors can also be integrated with weather data, soil properties, topography, irrigation records, fertilisation information, disease observations and management practices [150]. Such integration is especially important for root yield and quality prediction because sugar beet performance is affected by nitrogen supply, water availability, disease pressure, temperature, radiation, and harvest timing [152]. Environmental and management data can help explain why similar canopy conditions may lead to different root yield or sugar-quality outcomes across fields or seasons. Nevertheless, the availability and quality of these ancillary datasets remain important practical constraints, particularly when observations are collected at inconsistent spatial resolutions or temporal intervals.
Crop model assimilation provides a more process-based approach to data integration. Rather than relying only on empirical relationships between predictors and target variables, it uses RS-derived variables, such as LAI, canopy cover, VIs or evapotranspiration-related estimates, to update or constrain crop growth models [153,154]. This approach can link observed canopy dynamics with physiological processes, including biomass accumulation, water use, root growth and carbon allocation. It is therefore particularly promising for sugar beet because canopy observations alone provide only indirect information about storage-root development and sucrose accumulation [155].
Despite this potential, crop model assimilation remains less developed in sugar beet than empirical regression and ML approaches. Its application requires well-calibrated crop models, reliable RS inputs and detailed field measurements for parameterisation and validation [156,157]. In addition, the physiological representation of sucrose accumulation and processing-quality formation must be sufficiently robust before assimilation approaches can provide reliable quality-oriented predictions. Future research should therefore evaluate whether combining multi-temporal RS observations with crop growth models improves the transferability of predictions across years, cultivars, and management conditions, rather than focusing solely on within-study accuracy.

5.5. Operational Processing Workflows and Scalable Implementation

Although operational processing workflows are not modelling approaches in themselves, they determine whether the modelling and data-integration methods described above can be translated into repeatable and scalable applications in sugar beet production. Advanced models may achieve high accuracy in experimental settings, but their practical value remains limited if data acquisition, preprocessing, prediction and output delivery cannot be implemented consistently across fields, seasons and production regions [158].
For satellite-based applications, cloud-computing platforms can support the efficient processing of large image archives and repeated regional monitoring. Platforms such as Google Earth Engine (GEE) enable automated image access, cloud masking, spectral-feature calculation and time-series analysis, thereby facilitating standardised workflows for crop mapping, phenology tracking, drought assessment and regional yield prediction [159,160]. Such workflows can improve reproducibility and reduce the processing burden associated with multi-year satellite observations. However, automated satellite processing does not remove the need for quality control, particularly where cloud contamination, missing observations or differences in atmospheric correction affect temporal consistency [161,162].
For UAV and proximal sensing applications, operational implementation depends on standardised protocols from field acquisition to model deployment. UAV workflows commonly include flight planning, radiometric calibration, geometric correction, orthomosaic generation, canopy segmentation, feature extraction and prediction mapping [163]. These procedures are particularly important in sugar beet because crop rows, canopy gaps, weed patches and disease symptoms may occur at fine spatial scales. Inconsistent flight altitude, illumination conditions, sensor settings or calibration procedures can reduce the comparability of imagery acquired on different dates and may limit the transferability of trained models.
Automated workflows can improve the practical use of empirical, ML and DL models by enabling the repeated generation of canopy, stress, disease, weed, yield or quality maps. However, map generation alone does not constitute precision management. Operational deployment also requires uncertainty reporting, agronomic interpretation, field verification and management thresholds that connect mapped patterns with actionable recommendations. For example, a disease map should indicate where scouting or treatment is required, whereas a weed map should be compatible with prescription generation and spraying equipment. Similarly, yield and quality predictions should be linked to harvest prioritisation or factory-logistics decisions rather than being interpreted only as statistical outputs [117].
The development of scalable workflows should therefore focus on the entire decision chain: data acquisition, preprocessing, feature extraction, model prediction, uncertainty communication, agronomic interpretation, prescription generation and post-management evaluation. Standardised metadata, independent validation and compatibility with farm machinery, geographic information systems and advisory platforms are necessary to ensure that RS-derived products are reliable and usable in commercial sugar beet production [164]. Ultimately, the operational value of sugar beet RS will depend not only on model accuracy but also on whether workflows can deliver timely, interpretable, and economically meaningful information for growers, agronomists, and sugar factories.

6. Limitations and Future Directions

6.1. Data Continuity, Scale Mismatch and Physiological Relevance

Data continuity, scale mismatch and physiological relevance remain key limitations in sugar beet RS [15,25]. Satellite, UAV and proximal sensing platforms provide complementary observations, but their practical value depends on whether data can be acquired at the right time, at an appropriate spatial scale and with sufficient relevance to the target trait [33,59]. This is particularly important for sugar beet because canopy development, disease progression, irrigation demand and harvest planning are time-sensitive, whereas root yield and sugar-related quality are partly determined below ground [165].
For satellite-based monitoring, cloud cover, atmospheric effects and revisit frequency may interrupt time-series observations during critical growth stages, reducing the reliability of phenology tracking, stress detection and yield prediction [63]. Moderate resolution imagery is useful for regional monitoring, but it may not capture early disease patches, weed emergence or fine within-field variability. UAV imagery can provide much finer spatial detail, but its scalability is constrained by field coverage, weather conditions, flight regulations and data-processing requirements [163]. These trade-offs make it difficult to apply methods developed in experimental plots directly to commercial sugar beet production.
A further challenge is that most RS systems measure canopy reflectance, structure or temperature, whereas the most important economic traits of sugar beet are related to root growth, sucrose accumulation and processing quality [166]. Canopy vigour can indicate crop condition, but it cannot fully represent below-ground storage or sugar formation, especially under variable nitrogen supply, water stress, disease pressure or cultivar differences. Future observation strategies should therefore focus on integrating satellite, UAV and proximal sensing data with soil, weather and field measurements, so that RS observations become not only timely and scalable, but also physiologically meaningful for sugar beet production [25].

6.2. Model Robustness, Transferability and Validation

Model robustness and transferability remain major barriers to the operational use of RS in sugar beet production. Many existing models are developed from specific fields, cultivars, years or management conditions, and their performance may decline when applied to new environments. This limitation is particularly important for sugar beet because spectral responses and crop traits are affected by complex interactions among genotype, soil background, canopy structure, nitrogen supply, water availability, disease pressure and growth stage [29,33,74,151].
This issue is especially evident in ML and DL applications [50,167]. Although these methods can achieve high accuracy within individual datasets, they often depend strongly on training-data quality, feature selection, annotation consistency and validation strategy [34,38]. Disease detection and weed segmentation models, for example, require reliable ground labels, but disease severity scoring and weed annotation are labour-intensive and may vary among observers. Without external validation across different years, regions, cultivars and stress conditions, high within-study accuracy may overestimate practical performance [168,169].
Future research should therefore place greater emphasis on generalisable and well-validated models rather than only improving accuracy within single experiments. Multi-year and multi-location datasets, shared benchmark datasets, standardised field measurements and independent validation are needed to evaluate model stability under diverse production conditions. Transfer learning, domain adaptation and explainable ML may also help improve robustness, especially when labelled data are limited. Ultimately, model performance should be assessed not only by statistical accuracy, but also by transferability, interpretability and usefulness for management decisions.

6.3. Quality-Oriented Prediction Remains Underdeveloped

Quality-oriented prediction remains one of the least developed but most important directions in sugar beet RS. Compared with canopy growth monitoring and root yield estimation, fewer studies have focused on sucrose concentration, recoverable sugar yield and processing-related quality traits [33,166]. This is a major limitation because the economic value of sugar beet depends not only on root biomass, but also on sugar accumulation and industrial processing quality [36,151,170].
The main difficulty is the indirect relationship between canopy observations and below-ground quality formation. Most RS systems measure canopy reflectance, structure or temperature, whereas sucrose accumulates in the storage root. Canopy vigour, biomass or greenness may indicate favourable growth conditions, but they do not necessarily correspond to higher sugar concentration or better processing quality. This relationship can be further modified by cultivar, nitrogen supply, water status, disease pressure, temperature and harvest timing.
Future research should therefore treat sugar content and processing quality as independent prediction targets rather than secondary extensions of yield estimation. Multi-temporal satellite and UAV observations should be combined with soil, weather, and management records, as well as laboratory measurements of sucrose concentration and processing-quality parameters. Process-based models that describe biomass partitioning and sugar accumulation may also help link canopy dynamics with below-ground quality formation. Strengthening this direction is essential for moving sugar beet RS from yield-oriented monitoring towards quality-oriented precision management.

6.4. From RS Outputs to Operational Decision Support

A major limitation of current sugar beet RS is the gap between image-derived products and operational decision support. Many studies can generate canopy vigour maps, disease maps, weed distribution maps or yield-prediction maps, but these outputs do not automatically lead to clear management actions [171,172]. For practical production, RS products need to be translated into decisions such as where to apply fertiliser, when to irrigate, where to scout for disease, how to prioritise harvesting and how to organise factory logistics [35,76].
This gap is partly caused by the lack of agronomic thresholds, uncertainty assessment and compatibility with field operations [164]. For example, a VI map may indicate spatial variation in crop growth, but fertiliser decisions also require information on soil fertility, growth stage, expected yield potential and sugar-quality objectives [115]. Similarly, disease or weed maps are useful only when they can be linked to scouting priorities, treatment thresholds, prescription maps or spraying equipment. Without these links, RS outputs may remain diagnostic information rather than actionable management tools [171].
Future research should therefore move beyond map generation towards complete decision-support workflows. These workflows should connect data acquisition, preprocessing, model prediction, uncertainty communication, agronomic interpretation, prescription generation and post-management evaluation. Integration with crop models, Internet of Things (IoT) sensors, farm machinery, geographic information systems and sugar factory management platforms will be important for scalable implementation. Ultimately, the operational value of RS in sugar beet production will depend on whether image-derived information can be converted into timely, reliable and economically meaningful decisions.

7. Conclusions

This review shows that remote sensing applications in sugar beet production have progressed from early crop mapping and canopy monitoring towards more diversified and management-oriented applications, including biophysical trait retrieval, disease assessment, weed mapping, root yield prediction, sugar-content estimation and precision management support. Satellite observations provide regional coverage and temporal continuity, UAV imagery enables high-resolution field-scale monitoring, and proximal sensing remains important for calibration, validation and physiological interpretation. At the methodological level, vegetation indices and empirical regression models still provide useful baseline approaches, while machine learning, deep learning, multi-temporal modelling, multi-source data fusion, and crop model assimilation are increasingly used to capture complex crop responses. Nevertheless, several key limitations remain. Many models are still based on local experiments and require stronger multi-year and multi-location validation. More importantly, quality-oriented prediction, especially for sucrose concentration, recoverable sugar yield and processing-related traits, remains underdeveloped despite its direct relevance to the economic value of sugar beet. The indirect relationship between canopy observations and below-ground sugar accumulation remains a central challenge. Future progress will depend on integrating satellite, UAV, proximal, soil, weather and management data with robust modelling frameworks and practical decision-support systems. By linking remote sensing products with agronomic interpretation, uncertainty assessment and operational management, sugar beet remote sensing can move beyond descriptive crop monitoring towards scalable, quality-oriented and economically meaningful precision management.

Author Contributions

Conceptualization, S.C. (Shuyuan Chen) and Z.W.; methodology, S.C. (Shuyuan Chen) and Z.W.; software, S.C. (Shuai Cui); validation, S.C. (Shuyuan Chen), J.L. and S.C. (Shuai Cui); formal analysis, J.L.; investigation, S.C. (Shuyuan Chen) and S.C. (Shuai Cui); resources, J.L.; data curation, J.L. and W.S.; writing—original draft preparation, S.C. (Shuyuan Chen); writing—review and editing, Z.W.; visualisation, S.C. (Shuyuan Chen) and S.C. (Shuai Cui); supervision, Z.W.; project administration, Z.W.; funding acquisition, Z.W. All authors have read and agreed to the published version of the manuscript.

Funding

This research was funded by the Special Fund for the Improvement of High-quality Sugar Beet Varieties of the National Sugar Modern Agricultural Industrial Technology System, grant number CARS-170111.

Institutional Review Board Statement

Not applicable.

Informed Consent Statement

Not applicable.

Data Availability Statement

The original contributions presented in this study are included in the article. Further inquiries can be directed to the corresponding authors.

Acknowledgments

During the preparation of this manuscript, the authors used ChatGPT-5.5 (OpenAI) solely for language editing, including grammar, wording, and readability improvement. The authors reviewed and edited all outputs and take full responsibility for the scientific content, accuracy, and integrity of this publication. We are grateful for the comments and suggestions offered by anonymous reviewers to improve our review article. We would like to thank the many authors who contributed articles related to sugar beet to the Scopus and Web of Science Core Collection databases.

Conflicts of Interest

The authors declare no conflicts of interest.

Abbreviations

The following abbreviations are used in this manuscript:
RSRemote sensing
UAVUnmanned aerial vehicle
MLMachine learning
DLDeep learning
VIVegetation index
WoSCCWeb of Science Core Collection
PRISMAPreferred Reporting Items for Systematic Reviews and Meta-Analyses
R2Coefficient of determination
RMSERoot mean square error
NRMSENormalised root mean square error
rRMSERelative root mean square error
MAEMean absolute error
AUCArea under the receiver operating characteristic curve
IoUIntersection over union
mAPMean average precision
RGBRed–Green–Blue
MODISModerate Resolution Imaging Spectroradiometer
NOAA-AVHRRNational Oceanic and Atmospheric Administration Advanced Very High-Resolution Radiometer
LAILeaf area index
AGBAbove-ground biomass
NDVINormalised difference vegetation index
WDRVIWide dynamic range vegetation index
CCChlorophyll content
SPADSoil–Plant Analysis Development
CLSCercospora leaf spot
EVIEnhanced vegetation index
ExGExcess green index
SAVISoil-Adjusted Vegetation Index
RFRandom Forest
SVMSupport Vector Machine
KNNK-Nearest Neighbour
LiDARLight Detection and Ranging
SARSynthetic aperture radar
GEEGoogle Earth Engine
IoTInternet of Things

References

  1. Hoffmann, C.M.; Kenter, C.; Bloch, D. Marc Concentration of Sugar Beet (Beta vulgaris L.) in Relation to Sucrose Storage. J. Sci. Food Agric. 2005, 85, 459–465. [Google Scholar]
  2. Dohm, J.C.; Minoche, A.E.; Holtgräwe, D.; Capella-Gutiérrez, S.; Zakrzewski, F.; Tafer, H.; Rupp, O.; Sörensen, T.R.; Stracke, R.; Reinhardt, R.; et al. The Genome of the Recently Domesticated Crop Plant Sugar Beet (Beta vulgaris). Nature 2014, 505, 546–549. [Google Scholar] [PubMed]
  3. Chen, S.; Zhang, C.; Liu, J.; Ni, H.; Wu, Z. Current Status and Prospects of the Global Sugar Beet Industry. Sugar Tech 2024, 26, 1199–1207. [Google Scholar] [CrossRef] [Scilit]
  4. Islam, M.J.; Kim, J.W.; Begum, M.K.; Sohel, M.A.T.; Lim, Y.S. Physiological and Biochemical Changes in Sugar Beet Seedlings to Confer Stress Adaptability under Drought Condition. Plants 2020, 9, 1511. [Google Scholar] [CrossRef] [Scilit] [PubMed]
  5. Alavilli, H.; Yolcu, S.; Skorupa, M.; Aciksoz, S.B.; Asif, M. Salt and Drought Stress-Mitigating Approaches in Sugar Beet (Beta vulgaris L.) to Improve Its Performance and Yield. Planta 2023, 258, 30. [Google Scholar] [CrossRef] [Scilit] [PubMed]
  6. Mosaad, I.S.M.; Serag, A.H.I.; Sheta, M.H. Promote Sugar Beet Cultivation in Saline Soil by Applying Humic Substances In-Soil and Mineral Nitrogen Fertilization. J. Plant Nutr. 2022, 45, 2447–2464. [Google Scholar] [CrossRef] [Scilit]
  7. Shabana, M.M.A.; AL-Huqail, A.A.; Alla, H.E.A.N.; Kheir, A.M.S.; El-Sharkawy, M. Enhancing Soil Resilience and Sugar Beet (Beta vulgaris L.) Yield: Mid-Term Effects of Compost and Glauconite Integration. J. Agron. Crop Sci. 2024, 210, e1247. [Google Scholar] [CrossRef] [Scilit]
  8. Rana, A.K.; Gupta, V.K.; Newbold, J.; Roberts, D.; Rees, R.M.; Krishnamurthy, S.; Thakur, V.K. Sugar Beet Pulp: Resurgence and Trailblazing Journey towards a Circular Bioeconomy. Fuel 2022, 312, 122953. [Google Scholar] [CrossRef] [Scilit]
  9. Usmani, Z.; Sharma, M.; Diwan, D.; Tripathi, M.; Whale, E.; Jayakody, L.N.; Moreau, B.; Thakur, V.K.; Tuohy, M.; Gupta, V.K. Valorization of Sugar Beet Pulp to Value-Added Products: A Review. Bioresour. Technol. 2022, 346, 126580. [Google Scholar] [CrossRef] [Scilit] [PubMed]
  10. Nap, J.P.; de Ruijter, F.J.; van Es, D.S.; van der Meer, I.M. The Case of Sugar Beet in Europe: A Review of the Challenges for a Traditional Food Crop on the Verge of Climate Change and Circular Agriculture. J. Agric. Food Res. 2025, 24, 102343. [Google Scholar] [CrossRef] [Scilit]
  11. Kockelmann, A.; Tilcher, R.; Fischer, U. Seed Production and Processing. Sugar Tech 2010, 12, 267–275. [Google Scholar] [CrossRef] [Scilit]
  12. Khozaei, M.; Kamgar Haghighi, A.A.; Zand Parsa, S.; Sepaskhah, A.R.; Razzaghi, F.; Yousefabadi, V.; Emam, Y. Evaluation of Direct Seeding and Transplanting in Sugar Beet for Water Productivity, Yield and Quality under Different Irrigation Regimes and Planting Densities. Agric. Water Manag. 2020, 238, 106230. [Google Scholar] [CrossRef] [Scilit]
  13. Hoffmann, C.M. Importance of Canopy Closure and Dry Matter Partitioning for Yield Formation of Sugar Beet Varieties. Field Crops Res. 2019, 236, 75–84. [Google Scholar] [CrossRef] [Scilit]
  14. Mahmood, S.A.; Murdoch, A.J. Within-Field Variations in Sugar Beet Yield and Quality and Their Correlation with Environmental Variables in the East of England. Eur. J. Agron. 2017, 89, 75–87. [Google Scholar] [CrossRef] [Scilit]
  15. Wu, B.; Zhang, M.; Zeng, H.; Tian, F.; Potgieter, A.B.; Qin, X.; Yan, N.; Chang, S.; Zhao, Y.; Dong, Q.; et al. Challenges and Opportunities in Remote Sensing-Based Crop Monitoring: A Review. Natl. Sci. Rev. 2023, 10, nwac290. [Google Scholar] [PubMed]
  16. Hongo, C.; Niwa, K. Yield Prediction of Sugar Beet through Combined Use of Satellite Data and Meteorological Data. J. Agric. Sci. 2012, 4, 251. [Google Scholar] [CrossRef] [Scilit]
  17. Mulla, D.J. Twenty Five Years of Remote Sensing in Precision Agriculture: Key Advances and Remaining Knowledge Gaps. Biosyst. Eng. 2013, 114, 358–371. [Google Scholar] [CrossRef] [Scilit]
  18. Sishodia, R.P.; Ray, R.L.; Singh, S.K. Applications of Remote Sensing in Precision Agriculture: A Review. Remote Sens. 2020, 12, 3136. [Google Scholar] [CrossRef] [Scilit]
  19. Feng, L.; Chen, S.; Zhang, C.; Zhang, Y.; He, Y. A Comprehensive Review on Recent Applications of Unmanned Aerial Vehicle Remote Sensing with Various Sensors for High-Throughput Plant Phenotyping. Comput. Electron. Agric. 2021, 182, 106033. [Google Scholar] [CrossRef] [Scilit]
  20. Berger, K.; Machwitz, M.; Kycko, M.; Kefauver, S.C.; Van Wittenberghe, S.; Gerhards, M.; Verrelst, J.; Atzberger, C.; van der Tol, C.; Damm, A.; et al. Multi-Sensor Spectral Synergies for Crop Stress Detection and Monitoring in the Optical Domain: A Review. Remote Sens. Environ. 2022, 280, 113198. [Google Scholar] [CrossRef] [Scilit] [PubMed]
  21. Ali, A.M.; Abouelghar, M.; Belal, A.A.; Saleh, N.; Yones, M.; Selim, A.I.; Amin, M.E.S.; Elwesemy, A.; Kucher, D.E.; Maginan, S.; et al. Crop Yield Prediction Using Multi Sensors Remote Sensing (Review Article). Egypt. J. Remote Sens. Space Sci. 2022, 25, 711–716. [Google Scholar] [CrossRef] [Scilit]
  22. Kganyago, M.; Adjorlolo, C.; Mhangara, P.; Tsoeleng, L. Optical Remote Sensing of Crop Biophysical and Biochemical Parameters: An Overview of Advances in Sensor Technologies and Machine Learning Algorithms for Precision Agriculture. Comput. Electron. Agric. 2024, 218, 108730. [Google Scholar] [CrossRef] [Scilit]
  23. Yuan, J.; Zhang, Y.; Zheng, Z.; Yao, W.; Wang, W.; Guo, L. Grain Crop Yield Prediction Using Machine Learning Based on UAV Remote Sensing: A Systematic Literature Review. Drones 2024, 8, 559. [Google Scholar] [CrossRef] [Scilit]
  24. Alexopoulos, A.; Koutras, K.; Ali, S.B.; Puccio, S.; Carella, A.; Ottaviano, R.; Kalogeras, A. Complementary Use of Ground-Based Proximal Sensing and Airborne/Spaceborne Remote Sensing Techniques in Precision Agriculture: A Systematic Review. Agronomy 2023, 13, 1942. [Google Scholar] [CrossRef] [Scilit]
  25. Karmakar, P.; Teng, S.W.; Murshed, M.; Pang, S.; Li, Y.; Lin, H. Crop Monitoring by Multimodal Remote Sensing: A Review. Remote Sens. Appl. Soc. Environ. 2024, 33, 101093. [Google Scholar] [CrossRef] [Scilit]
  26. Mahmood, S.A.; Murdoch, A.J. Adaption of Precision Agriculture to Root Crop (Sugar Beet and Potato). CABI Rev. 2018, 13, 1–12. [Google Scholar] [CrossRef] [Scilit]
  27. Jay, S.; Baret, F.; Dutartre, D.; Malatesta, G.; Héno, S.; Comar, A.; Weiss, M.; Maupas, F. Exploiting the Centimeter Resolution of UAV Multispectral Imagery to Improve Remote-Sensing Estimates of Canopy Structure and Biochemistry in Sugar Beet Crops. Remote Sens. Environ. 2019, 231, 110898. [Google Scholar] [CrossRef] [Scilit]
  28. Segarra, J.; Buchaillot, M.L.; Araus, J.L.; Kefauver, S.C. Remote Sensing for Precision Agriculture: Sentinel-2 Improved Features and Applications. Agronomy 2020, 10, 641. [Google Scholar] [CrossRef] [Scilit]
  29. Elsayed, S.; El-Hendawy, S.; Elsherbiny, O.; Okasha, A.M.; Elmetwalli, A.H.; Elwakeel, A.E.; Memon, M.S.; Ibrahim, M.E.M.; Ibrahim, H.H. Estimating Chlorophyll Content, Production, and Quality of Sugar Beet under Various Nitrogen Levels Using Machine Learning Models and Novel Spectral Indices. Agronomy 2023, 13, 2743. [Google Scholar] [CrossRef] [Scilit]
  30. Wang, Q.; Shao, K.; Cai, Z.; Che, Y.; Chen, H.; Xiao, S.; Wang, R.; Liu, Y.; Li, B.; Ma, Y. Prediction of Sugar Beet Yield and Quality Parameters Using Stacked-LSTM Model with Pre-Harvest UAV Time Series Data and Meteorological Factors. Artif. Intell. Agric. 2025, 15, 252–265. [Google Scholar] [CrossRef] [Scilit]
  31. Joalland, S.; Screpanti, C.; Varella, H.V.; Reuther, M.; Schwind, M.; Lang, C.; Walter, A.; Liebisch, F. Aerial and Ground Based Sensing of Tolerance to Beet Cyst Nematode in Sugar Beet. Remote Sens. 2018, 10, 787. [Google Scholar] [CrossRef] [Scilit]
  32. Gao, W.; Zeng, W.; Li, S.; Zhang, L.; Wang, W.; Song, J.; Wu, H. Remote Sensing Estimation of Sugar Beet SPAD Based on Un-Manned Aerial Vehicle Multispectral Imagery. PLoS ONE 2024, 19, e0300056. [Google Scholar] [CrossRef] [Scilit] [PubMed]
  33. Walsh, O.S.; Nambi, E.; Shafian, S.; Jayawardena, D.M.; Ansah, E.O.; Lamichhane, R.; McClintick-Chess, J.R. UAV-Based NDVI Estimation of Sugarbeet Yield and Quality under Varied Nitrogen and Water Rates. Agrosyst. Geosci. Environ. 2023, 6, e20337. [Google Scholar] [CrossRef] [Scilit]
  34. Hoppe, H.; Dietrich, P.; Marzahn, P.; Weiß, T.; Nitzsche, C.; Freiherr von Lukas, U.; Wengerek, T.; Borg, E. Transferability of Machine Learning Models for Crop Classification in Remote Sensing Imagery Using a New Test Methodology: A Study on Phenological, Temporal, and Spatial Influences. Remote Sens. 2024, 16, 1493. [Google Scholar] [CrossRef] [Scilit]
  35. Bu, H.; Sharma, L.K.; Denton, A.; Franzen, D.W. Sugar Beet Yield and Quality Prediction at Multiple Harvest Dates Using Active-Optical Sensors. Agron. J. 2016, 108, 273–284. [Google Scholar] [CrossRef] [Scilit]
  36. Wang, Q.; Che, Y.; Shao, K.; Zhu, J.; Wang, R.; Sui, Y.; Guo, Y.; Li, B.; Meng, L.; Ma, Y. Estimation of Sugar Content in Sugar Beet Root Based on UAV Multi-Sensor Data. Comput. Electron. Agric. 2022, 203, 107433. [Google Scholar] [CrossRef] [Scilit]
  37. Eberhardt, I.D.R.; Schultz, B.; Rizzi, R.; Sanches, I.D.; Formaggio, A.R.; Atzberger, C.; Mello, M.P.; Immitzer, M.; Trabaquini, K.; Foschiera, W.; et al. Cloud Cover Assessment for Operational Crop Monitoring Systems in Tropical Areas. Remote Sens. 2016, 8, 219. [Google Scholar] [CrossRef] [Scilit]
  38. Stiller, S.; Grahmann, K.; Ghazaryan, G.; Ryo, M. Improving Spatial Transferability of Deep Learning Models for Small-Field Crop Yield Prediction. ISPRS Open J. Photogramm. Remote Sens. 2024, 12, 100064. [Google Scholar] [CrossRef] [Scilit]
  39. Yao, X.; Xu, F.; Ye, S. Machine Learning and Remote Sensing for Precision Agriculture: Progresses and Challenges. Trans. Earth Environ. Sustain. 2025, 3, 153–166. [Google Scholar] [CrossRef] [Scilit]
  40. Wang, J.; Wang, S.; Zou, D.; Chen, H.; Zhong, R.; Li, H.; Zhou, W.; Yan, K. Social Network and Bibliometric Analysis of Unmanned Aerial Vehicle Remote Sensing Applications from 2010 to 2021. Remote Sens. 2021, 13, 2912. [Google Scholar] [CrossRef] [Scilit]
  41. Shi, Y.; Wang, Z.; Zhang, G.; Wei, X.; Ma, W.; Yu, H. Evaluating the Research Status of the Remote Sensing-Mediated Monitoring of Forest Biomass: A Bibliometric Analysis of WOS. Forests 2024, 15, 524. [Google Scholar] [CrossRef] [Scilit]
  42. Moher, D.; Liberati, A.; Tetzlaff, J.; Altman, D.G.; Prisma Group. Preferred Reporting Items for Systematic Reviews and Meta-Analyses: The PRISMA Statement. PLoS Med. 2009, 6, e1000097. [Google Scholar] [CrossRef] [Scilit] [PubMed]
  43. Vinayaka; Prasad, P.R.C. AI-Enhanced Remote Sensing Applications in Indian Sugarcane Research: A Comprehensive Review. Sugar Tech 2024, 26, 609–628. [Google Scholar] [CrossRef] [Scilit]
  44. Barreto, A.; Ispizua Yamati, F.R.; Varrelmann, M.; Paulus, S.; Mahlein, A.K. Disease Incidence and Severity of Cercospora Leaf Spot in Sugar Beet Assessed by Multispectral Unmanned Aerial Images and Machine Learning. Plant Dis. 2023, 107, 188–200. [Google Scholar] [CrossRef] [Scilit] [PubMed]
  45. Hoffmann, C.M.; Huijbregts, T.; van Swaaij, N.; Jansen, R. Impact of Different Environments in Europe on Yield and Quality of Sugar Beet Genotypes. Eur. J. Agron. 2009, 30, 17–26. [Google Scholar] [CrossRef] [Scilit]
  46. Jansen, M.; Bergsträsser, S.; Schmittgen, S.; Müller-Linow, M.; Rascher, U. Non-Invasive Spectral Phenotyping Methods Can Improve and Accelerate Cercospora Disease Scoring in Sugar Beet Breeding. Agriculture 2014, 4, 147–158. [Google Scholar] [CrossRef] [Scilit]
  47. Jay, S.; Comar, A.; Benicio, R.; Beauvois, J.; Dutartre, D.; Daubige, G.; Li, W.; Labrosse, J.; Thomas, S.; Henry, N.; et al. Scoring Cercospora Leaf Spot on Sugar Beet: Comparison of UGV and UAV Phenotyping Systems. Plant Phenomics 2020, 2020, 9452123. [Google Scholar] [CrossRef] [Scilit] [PubMed]
  48. Mahlein, A.K.; Steiner, U.; Dehne, H.W.; Oerke, E.C. Spectral Signatures of Sugar Beet Leaves for the Detection and Differentiation of Diseases. Precis. Agric. 2010, 11, 413–431. [Google Scholar] [CrossRef] [Scilit]
  49. Yamati, F.R.I.; Barreto, A.; Günder, M.; Bauckhage, C.; Mahlein, A.K. Sensing the Occurrence and Dynamics of Cercospora Leaf Spot Disease Using UAV-Supported Image Data and Deep Learning. Sugar Ind. Zuckerind. 2022, 147, 79–86. [Google Scholar] [CrossRef] [Scilit]
  50. Görlich, F.; Marks, E.; Mahlein, A.-K.; König, K.; Lottes, P.; Stachniss, C. UAV-Based Classification of Cercospora Leaf Spot Using RGB Images. Drones 2021, 5, 34. [Google Scholar] [CrossRef] [Scilit]
  51. Curcic, Z.; Ciric, M.; Nagl, N.; Taski-Ajdukovic, K. Effect of Sugar Beet Genotype, Planting and Harvesting Dates and Their Interaction on Sugar Yield. Front. Plant Sci. 2018, 9, 1041. [Google Scholar] [CrossRef] [Scilit] [PubMed]
  52. Abbasi, Z.; Bocianowski, J. Genotype by Environment Interaction for Physiological Traits in Sugar Beet (Beta vulgaris L.) Parents and Hybrids Using Additive Main Effects and Multiplicative Interaction Model. Eur. Food Res. Technol. 2021, 247, 3063–3081. [Google Scholar] [CrossRef] [Scilit]
  53. Steddom, K.; Heidel, G.; Jones, D.; Rush, C.M. Remote Detection of Rhizomania in Sugar Beets. Phytopathology 2003, 93, 720–726. [Google Scholar] [CrossRef] [Scilit] [PubMed]
  54. Hoffmann, C.M.; Blomberg, M. Estimation of Leaf Area Index of Beta vulgaris L. Based on Optical Remote Sensing Data. J. Agron. Crop Sci. 2004, 190, 197–204. [Google Scholar] [CrossRef] [Scilit]
  55. Beeri, O.; Phillips, R.; Carson, P.; Liebig, M. Alternate Satellite Models for Estimation of Sugar Beet Residue Nitrogen Credit. Agric. Ecosyst. Environ. 2005, 107, 21–35. [Google Scholar] [CrossRef] [Scilit]
  56. Mahlein, A.K.; Steiner, U.; Hillnhütter, C.; Dehne, H.W.; Oerke, E.C. Hyperspectral Imaging for Small-Scale Analysis of Symptoms Caused by Different Sugar Beet Diseases. Plant Methods 2012, 8, 3. [Google Scholar] [CrossRef] [Scilit] [PubMed]
  57. Mink, R.; Dutta, A.; Peteinatos, G.G.; Sökefeld, M.; Engels, J.J.; Hahn, M.; Gerhards, R. Multi-Temporal Site-Specific Weed Control of Cirsium arvense (L.) Scop. and Rumex crispus L. in Maize and Sugar Beet Using Unmanned Aerial Vehicle Based Mapping. Agriculture 2018, 8, 65. [Google Scholar] [CrossRef] [Scilit]
  58. Asam, S.; Gessner, U.; Almengor González, R.; Wenzl, M.; Kriese, J.; Kuenzer, C. Mapping Crop Types of Germany by Combining Temporal Statistical Metrics of Sentinel-1 and Sentinel-2 Time Series with LPIS Data. Remote Sens. 2022, 14, 2981. [Google Scholar] [CrossRef] [Scilit]
  59. Taguchi, K.; Guo, W.; Burridge, J.; Ito, A.; Njehia, N.S.; Matsuhira, H.; Usui, Y.; Hirafuji, M. High-Throughput Yield Prediction of Diallele Crossed Sugar Beet in a Breeding Field Using UAV-Derived Growth Dynamics. Plant Phenomics 2024, 6, 209. [Google Scholar] [CrossRef] [Scilit]
  60. Joy, J.; Kelvin, B.; Howatt, K.; Aderholdt, W.; Khan, M.; Peters, T.; Sun, X. Edge-Deployable Segmentation and Prescription Mapping of Post-Emergence Weeds in Sugar Beet Crops for UAV-Based Precision Spraying. J. Agric. Food Res. 2025, 24, 102422. [Google Scholar] [CrossRef] [Scilit]
  61. El-Hendawy, S.; Elsayed, S.; Al-Suhaibani, N.; Alotaibi, M.; Tahir, M.U.; Mubushar, M.; Attia, A.; Hassan, W.M. Use of Hyperspectral Reflectance Sensing for Assessing Growth and Chlorophyll Content of Spring Wheat Grown under Simulated Saline Field Conditions. Plants 2021, 10, 101. [Google Scholar] [CrossRef] [Scilit] [PubMed]
  62. Jindo, K.; Kozan, O.; Iseki, K.; Maestrini, B.; van Evert, F.K.; Wubengeda, Y.; Arai, E.; Shimabukuro, Y.E.; Sawada, Y.; Kempenaar, C. Potential Utilization of Satellite Remote Sensing for Field-Based Agricultural Studies. Chem. Biol. Technol. Agric. 2021, 8, 58. [Google Scholar] [CrossRef] [Scilit]
  63. Prudente, V.H.R.; Martins, V.S.; Vieira, D.C.; e Silva, N.R.d.F.; Adami, M.; Sanches, I.D. Limitations of Cloud Cover for Optical Remote Sensing of Agricultural Areas across South America. Remote Sens. Appl. Soc. Environ. 2020, 20, 100414. [Google Scholar] [CrossRef] [Scilit]
  64. Yang, G.; Liu, J.; Zhao, C.; Li, Z.; Huang, Y.; Yu, H.; Xu, B.; Yang, X.; Zhu, D.; Zhang, X.; et al. Unmanned Aerial Vehicle Remote Sensing for Field-Based Crop Phenotyping: Current Status and Perspectives. Front. Plant Sci. 2017, 8, 1111. [Google Scholar] [CrossRef] [Scilit] [PubMed]
  65. Xiao, S.; Chen, H.; Hou, Y.; Shao, K.; Bi, K.; Wang, R.; Sui, Y.; Zhu, J.; Guo, Y.; Li, B.; et al. Investigating the 3D Distribution of Cercospora Leaf Spot Disease in Sugar Beet through Fusion Methods. Comput. Electron. Agric. 2024, 224, 109107. [Google Scholar] [CrossRef] [Scilit]
  66. Weiss, M.; Jacob, F.; Duveiller, G. Remote Sensing for Agricultural Applications: A Meta-Review. Remote Sens. Environ. 2020, 236, 11402. [Google Scholar] [CrossRef] [Scilit]
  67. Alvarez-Vanhard, E.; Corpetti, T.; Houet, T. UAV & Satellite Synergies for Optical Remote Sensing Applications: A Literature Review. Sci. Remote Sens. 2021, 3, 100019. [Google Scholar] [CrossRef] [Scilit]
  68. Rinaldi, M.; Ruggieri, S.; Garofalo, P.; Vonella, A.V.; Satalino, G.; Soldo, P. Leaf Area Index Retrieval Using High Resolution Remote Sensing Data. Ital. J. Agron. 2010, 5, 155–166. [Google Scholar] [CrossRef] [Scilit]
  69. Jay, S.; Maupas, F.; Bendoula, R.; Gorretta, N. Retrieving LAI, Chlorophyll and Nitrogen Contents in Sugar Beet Crops from Multi-Angular Optical Remote Sensing: Comparison of Vegetation Indices and PROSAIL Inversion for Field Phenotyping. Field Crops Res. 2017, 210, 33–46. [Google Scholar] [CrossRef] [Scilit]
  70. Cao, Y.; Li, G.L.; Luo, Y.K.; Pan, Q.; Zhang, S.Y. Monitoring of Sugar Beet Growth Indicators Using Wide-Dynamic-Range Vegetation Index (WDRVI) Derived from UAV Multispectral Images. Comput. Electron. Agric. 2020, 171, 105331. [Google Scholar] [CrossRef] [Scilit]
  71. Milford, G.F.; Watson, D.J. The Effect of Nitrogen on the Growth and Sugar Content of Sugar-Beet. Ann. Bot. 1971, 35, 287–300. [Google Scholar] [CrossRef] [Scilit]
  72. Milford, G.F.J. The Growth and Development of the Storage Root of Sugar Beet. Ann. Appl. Biol. 1973, 75, 427–438. [Google Scholar] [CrossRef] [Scilit]
  73. Richter, K.; Atzberger, C.; Vuolo, F.; Weihs, P.; D’Urso, G. Experimental Assessment of the Sentinel-2 Band Setting for RTM-Based LAI Retrieval of Sugar Beet and Maize. Can. J. Remote Sens. 2009, 35, 230–247. [Google Scholar] [CrossRef] [Scilit]
  74. Jiang, J.; Li, D.; Qiu, Q.; Xiao, L. Improving Sugar Beet Canopy Mapping through UAV Image Analysis. Sci. Rep. 2025, 15, 40106. [Google Scholar] [CrossRef] [Scilit] [PubMed]
  75. Michalska-Klimczak, B.; Wyszyński, Z.; Pačuta, V.; Rašovský, M.; Brezovský, O. Within-Field Variability of Plant and Canopy Traits of Sugar Beet and Their Relation to Individual Root Mass during Harvest. Plant Soil Environ. 2020, 66, 437–445. [Google Scholar] [CrossRef] [Scilit]
  76. Ludewig-Spickermann, O.C.; Sombrowski, M.; Kim, D.Y.; Gille, S.; Deubel, A.; Aleithe, W.; Seidel, M.; Pietsch, M. Optimisation of the Correlation between Normalised Difference Vegetation Index and Sugar Beet Yield Using Multispectral Remote Sensing Data. Eur. J. Agron. 2025, 171, 127820. [Google Scholar] [CrossRef] [Scilit]
  77. Zhang, J.; Tian, H.; Wang, D.; Li, H.; Mouazen, A.M. A Novel Spectral Index for Estimation of Relative Chlorophyll Content of Sugar Beet. Comput. Electron. Agric. 2021, 184, 106088. [Google Scholar] [CrossRef] [Scilit]
  78. Fei, C.; Fan, H.; Fan, X.X.; Xu, G. Estimation of Total Nitrogen Content in Sugar Beet Leaves Based on Chlorophyll Fluorescence Parameters. Photosynthetica 2020, 58, 869–872. [Google Scholar] [CrossRef] [Scilit]
  79. Sánchez-Sastre, L.F.; Alte da Veiga, N.M.S.; Ruiz-Potosme, N.M.; Carrión-Prieto, P.; Marcos-Robles, J.L.; Navas-Gracia, L.M.; Martín-Ramos, P. Assessment of RGB Vegetation Indices to Estimate Chlorophyll Content in Sugar Beet Leaves in the Final Cultivation Stage. AgriEngineering 2020, 2, 128–149. [Google Scholar] [CrossRef] [Scilit]
  80. Schlemmer, M.; Gitelson, A.; Schepers, J.; Ferguson, R.; Peng, Y.; Shanahan, J.; Rundquist, D. Remote Estimation of Nitrogen and Chlorophyll Contents in Maize at Leaf and Canopy Levels. Int. J. Appl. Earth Obs. Geoinf. 2013, 25, 47–54. [Google Scholar] [CrossRef] [Scilit]
  81. Clevers, J.G.P.W.; Gitelson, A.A. Remote Estimation of Crop and Grass Chlorophyll and Nitrogen Content Using Red-Edge Bands on Sentinel-2 and -3. Int. J. Appl. Earth Obs. Geoinf. 2013, 23, 344–351. [Google Scholar] [CrossRef] [Scilit]
  82. Delegido, J.; Alonso, L.; González, G.; Moreno, J. Estimating Chlorophyll Content of Crops from Hyperspectral Data Using a Normalized Area over Reflectance Curve (NAOC). Int. J. Appl. Earth Obs. Geoinf. 2010, 12, 165–174. [Google Scholar] [CrossRef] [Scilit]
  83. Zhang, L.; Clarke, M.L.; Steven, M.D.; Jaggard, K.W. Spatial Patterns of Wilting in Sugar Beet as an Indicator for Precision Irrigation. Precis. Agric. 2011, 12, 296–316. [Google Scholar]
  84. Quebrajo, L.; Perez-Ruiz, M.; Pérez-Urrestarazu, L.; Martínez, G.; Egea, G. Linking Thermal Imaging and Soil Remote Sensing to Enhance Irrigation Management of Sugar Beet. Biosyst. Eng. 2018, 165, 77–87. [Google Scholar] [CrossRef] [Scilit]
  85. Irik, H.A.; Kaymaz, E.; Neslihan Samutoglu, H.; Fikret, G.O.; Unlukara, A. Effects of Different Irrigation Levels on Sugar Beet and Potential Use of Crop Water Stress Index in Irrigation Scheduling. J. Agric. Sci. Technol. 2024, 26, 1143–1159. [Google Scholar]
  86. Martínez, J.; Egea, G.; Agüera, J.; Pérez-Ruiz, M. A Cost-Effective Canopy Temperature Measurement System for Precision Agriculture: A Case Study on Sugar Beet. Precis. Agric. 2017, 18, 95–110. [Google Scholar]
  87. Wang, N.; Clevers, J.G.P.W.; Wieneke, S.; Bartholomeus, H.; Kooistra, L. Potential of UAV-Based Sun-Induced Chlorophyll Fluorescence to Detect Water Stress in Sugar Beet. Agric. For. Meteorol. 2022, 323, 109033. [Google Scholar] [CrossRef] [Scilit]
  88. Jones, H.G.; Serraj, R.; Loveys, B.R.; Xiong, L.; Wheaton, A.; Price, A.H. Thermal Infrared Imaging of Crop Canopies for the Remote Diagnosis and Quantification of Plant Responses to Water Stress in the Field. Funct. Plant Biol. 2009, 36, 978–989. [Google Scholar] [CrossRef] [Scilit] [PubMed]
  89. Gerhards, M.; Schlerf, M.; Mallick, K.; Udelhoven, T. Challenges and Future Perspectives of Multi-/Hyperspectral Thermal Infrared Remote Sensing for Crop Water-Stress Detection: A Review. Remote Sens. 2019, 11, 1240. [Google Scholar] [CrossRef] [Scilit]
  90. King, B.A.; Tarkalson, D.D.; Sharma, V.; Bjorneberg, D.L. Thermal Crop Water Stress Index Base Line Temperatures for Sugarbeet in Arid Western U.S. Agric. Water Manag. 2021, 243, 106459. [Google Scholar] [CrossRef] [Scilit]
  91. Hillnhütter, C.; Mahlein, A.K.; Sikora, R.A.; Oerke, E.C. Remote Sensing to Detect Plant Stress Induced by Heterodera schachtii and Rhizoctonia solani in Sugar Beet Fields. Field Crops Res. 2011, 122, 71–77. [Google Scholar] [CrossRef] [Scilit]
  92. Reynolds, G.J.; Windels, C.E.; MacRae, I.V.; Laguette, S. Remote Sensing for Assessing Rhizoctonia Crown and Root Rot Severity in Sugar Beet. Plant Dis. 2012, 96, 497–505. [Google Scholar] [CrossRef] [Scilit] [PubMed]
  93. Tan, W.; Li, K.; Liu, D.; Xing, W. Cercospora Leaf Spot Disease of Sugar Beet. Plant Signal. Behav. 2023, 18, 2214765. [Google Scholar] [CrossRef] [Scilit] [PubMed]
  94. Tuğrul, K.M.; Kaya, R.; Özkan, K.; Ceyhan, M.; Gürel, U.; Fidantemiz, F.Y. Early Detection of Cercospora beticola and Powdery Mildew Diseases in Sugar Beet Using Uncrewed Aerial Vehicle-Based Remote Sensing and Machine Learning. PeerJ 2025, 13, e19530. [Google Scholar] [CrossRef] [Scilit] [PubMed]
  95. Brugger, A.; Yamati, F.I.; Barreto, A.; Paulus, S.; Schramowsk, P.; Kersting, K.; Steiner, U.; Neugart, S.; Mahlein, A.K. Hyperspectral Imaging in the UV Range Allows for Differentiation of Sugar Beet Diseases Based on Changes in Secondary Plant Metabolites. Phytopathology 2023, 113, 44–54. [Google Scholar] [CrossRef] [Scilit] [PubMed]
  96. Abdalla, A.; Todd, O.E.; Pennam, S.V.P.K.; Hoopes, E.; Nguyen, N.T.; Dorn, K.M.; Dao, P.D. All-in-One Machine Learning Framework for Early Detection and Characterization of Sugar Beet Diseases Using Hyperspectral Imaging. Smart Agric. Technol. 2025, 12, 101633. [Google Scholar] [CrossRef] [Scilit]
  97. Tuğrul, K.M. Early Detection of Sugar Beet Cercospora Leaf Spot Disease Using Machine Learning-Assisted Thermal Image Processing Method. Sugar Tech 2025, 27, 954–964. [Google Scholar] [CrossRef] [Scilit]
  98. Günder, M.; Yamati, F.R.I.; Barreto, A.; Mahlein, A.K.; Sifa, R.; Bauckhage, C. SugarViT-Multi-Objective Regression of UAV Images with Vision Transformers and Deep Label Distribution Learning Demonstrated on Disease Severity Prediction in Sugar Beet. PLoS ONE 2025, 20, e0318097. [Google Scholar] [CrossRef] [Scilit] [PubMed]
  99. Okole, N.; Yamati, F.R.I.; Hossain, R.; Varrelmann, M.; Mahlein, A.K.; Heim, R.H.J. Aerial Low-Altitude Remote Sensing and Deep Learning for in-Field Disease Incidence Scoring of Virus Yellows in Sugar Beet. Plant Pathol. 2024, 73, 2310–2324. [Google Scholar] [CrossRef] [Scilit]
  100. Schmitz, A.; Tartachnyk, I.I.; Kiewnick, S.; Sikora, R.A.; Kühbauch, W. Detection of Heterodera schachtii Infestation in Sugar Beet by Means of Laser-Induced and Pulse Amplitude Modulated Chlorophyll Fluorescence. Nematology 2006, 8, 273–286. [Google Scholar] [CrossRef] [Scilit]
  101. Hillnhütter, C.; Mahlein, A.K.; Sikora, R.A.; Oerke, E.C. Use of Imaging Spectroscopy to Discriminate Symptoms Caused by Heterodera schachtii and Rhizoctonia solani on Sugar Beet. Precis. Agric. 2012, 13, 17–32. [Google Scholar]
  102. Mahlein, A.K. Plant Disease Detection by Imaging Sensors—Parallels and Specific Demands for Precision Agriculture and Plant Phenotyping. Plant Dis. 2016, 100, 241–251. [Google Scholar] [CrossRef] [Scilit] [PubMed]
  103. Siłuch, M.; Siedliska, A.; Bartmiński, P.; Kociuba, W.; Baranowski, P.; Krzyszczak, J. The Impact of Water Availability on the Discriminative Status of Nitrogen (N) in Sugar Beet and Celery Using Hyperspectral Imaging Methods. Appl. Sci. 2023, 13, 6072. [Google Scholar] [CrossRef] [Scilit]
  104. Sa, I.; Popović, M.; Khanna, R.; Chen, Z.; Lottes, P.; Liebisch, F.; Nieto, J.; Stachniss, C.; Walter, A.; Siegwart, R. WeedMap: A Large-Scale Semantic Weed Mapping Framework Using Aerial Multispectral Imaging and Deep Neural Network for Precision Farming. Remote Sens. 2018, 10, 1423. [Google Scholar] [CrossRef] [Scilit]
  105. Garcia-Ruiz, F.J.; Wulfsohn, D.; Rasmussen, J. Sugar Beet (Beta vulgaris L.) and Thistle (Cirsium arvensis L.) Discrimination Based on Field Spectral Data. Biosyst. Eng. 2015, 139, 1–15. [Google Scholar] [CrossRef] [Scilit]
  106. Khoshboresh-Masouleh, M.; Akhoondzadeh, M. Improving Weed Segmentation in Sugar Beet Fields Using Potentials of Multispectral Unmanned Aerial Vehicle Images and Lightweight Deep Learning. JARS 2021, 15, 034510. [Google Scholar] [CrossRef] [Scilit]
  107. Milioto, A.; Lottes, P.; Stachniss, C. Real-Time Blob-Wise Sugar Beets vs. Weeds Classification for Monitoring Fields Using Convolutional Neural Networks. ISPRS Ann. Photogramm. Remote Sens. Spat. Inf. Sci. 2017, IV-2-W3, 41–48. [Google Scholar] [CrossRef] [Scilit]
  108. Pflanz, M.; Nordmeyer, H.; Schirrmann, M. Weed Mapping with UAS Imagery and a Bag of Visual Words Based Image Classifier. Remote Sens. 2018, 10, 1530. [Google Scholar] [CrossRef] [Scilit]
  109. Barreto, A.; Reifenrath, L.; Vogg, R.; Sinz, F.; Mahlein, A.K. Data Augmentation for Mask-Based Leaf Segmentation of UAV-Images as a Basis to Extract Leaf-Based Phenotyping Parameters. KI—Künstl. Intell. 2023, 37, 143–156. [Google Scholar] [CrossRef] [Scilit]
  110. Wang, J.; Hu, X.; Dong, X.; Liu, S.; Li, Y. Nitrogen Monitoring and Sugar Yield Estimation Analysis of Sugar Beet Based on Multisource and Multi-Temporal Remote Sensing Data. Sugar Tech 2025, 27, 1089–1101. [Google Scholar] [CrossRef] [Scilit]
  111. Kenter, C.; Hoffmann, C.M. Seasonal Patterns of Sucrose Concentration in Relation to Other Quality Parameters of Sugar Beet (Beta vulgaris L.). J. Sci. Food Agric. 2006, 86, 62–70. [Google Scholar] [CrossRef] [Scilit]
  112. Varga, I.; Markulj Kulundžić, A.; Tkalec Kojić, M.; Antunović, M. Does the Amount of Pre-Sowing Nitrogen Fertilization Affect Sugar Beet Root Yield and Quality of Different Genotypes? Nitrogen 2024, 5, 386–408. [Google Scholar] [CrossRef] [Scilit]
  113. Bu, H.; Sharma, L.K.; Denton, A.; Franzen, D.W. Comparison of Satellite Imagery and Ground-Based Active Optical Sensors as Yield Predictors in Sugar Beet, Spring Wheat, Corn, and Sunflower. Agron. J. 2017, 109, 299–308. [Google Scholar] [CrossRef] [Scilit]
  114. Olson, D.; Chatterjee, A.; Franzen, D.W. Can We Select Sugarbeet Harvesting Dates Using Drone-Based Vegetation Indices? Agron. J. 2019, 111, 2619–2624. [Google Scholar] [CrossRef] [Scilit]
  115. Olson, D.; Chatterjee, A.; Franzen, D.W.; Day, S.S. Relationship of Drone-Based Vegetation Indices with Corn and Sugarbeet Yields. Agron. J. 2019, 111, 2545–2557. [Google Scholar] [CrossRef] [Scilit]
  116. Varga, I.; Radočaj, D.; Jurišić, M.; Markulj, K.A.; Antunović, M. Prediction of Sugar Beet Yield and Quality Parameters with Varying Nitrogen Fertilization Using Ensemble Decision Trees and Artificial Neural Networks. Comput. Electron. Agric. 2023, 212, 108076. [Google Scholar] [CrossRef] [Scilit]
  117. Zhai, Z.; Martínez, J.F.; Beltran, V.; Martínez, N.L. Decision Support Systems for Agriculture 4.0: Survey and Challenges. Comput. Electron. Agric. 2020, 170, 105256. [Google Scholar] [CrossRef] [Scilit]
  118. Misra, V.; Mall, A.K. Harnessing Image Processing for Precision Disease Diagnosis in Sugar Beet Agriculture. Crop Des. 2024, 3, 100075. [Google Scholar] [CrossRef] [Scilit]
  119. Fridgen, J.J.; Kitchen, N.R.; Sudduth, K.A.; Drummond, S.T.; Wiebold, W.J.; Fraisse, C.W. Management Zone Analyst (MZA). Agron. J. 2004, 96, 101–108. [Google Scholar] [CrossRef] [Scilit]
  120. Kitchen, N.R.; Sudduth, K.A.; Myers, D.B.; Drummond, S.T.; Hong, S.Y. Delineating Productivity Zones on Claypan Soil Fields Using Apparent Soil Electrical Conductivity. Comput. Electron. Agric. 2005, 46, 285–308. [Google Scholar] [CrossRef] [Scilit]
  121. Blasch, G.; Li, Z.; Taylor, J.A. Multi-Temporal Yield Pattern Analysis Method for Deriving Yield Zones in Crop Production Systems. Precis. Agric. 2020, 21, 1263–1290. [Google Scholar] [CrossRef] [Scilit]
  122. Ali, A.; Rondelli, V.; Martelli, R.; Falsone, G.; Lupia, F.; Barbanti, L. Management Zones Delineation through Clustering Techniques Based on Soils Traits, NDVI Data, and Multiple Year Crop Yields. Agriculture 2022, 12, 231. [Google Scholar] [CrossRef] [Scilit]
  123. Montero, D.; Aybar, C.; Mahecha, M.D.; Martinuzzi, F.; Söchting, M.; Wieneke, S. A Standardized Catalogue of Spectral Indices to Advance the Use of Remote Sensing in Earth System Research. Sci. Data 2023, 10, 197. [Google Scholar] [CrossRef] [Scilit] [PubMed]
  124. Tian, H.; Shi, S.; Wang, H.; Li, F.; Li, Z.; Alva, A.; Zhang, Z. Estimation of Sugar Beet Aboveground Biomass by Band Depth Optimization of Hyperspectral Canopy Reflectance. J. Indian Soc. Remote Sens. 2017, 45, 795–803. [Google Scholar]
  125. Mutanga, O.; Skidmore, A.K. Narrow Band Vegetation Indices Overcome the Saturation Problem in Biomass Estimation. Int. J. Remote Sens. 2004, 25, 3999–4014. [Google Scholar] [CrossRef] [Scilit]
  126. Maki, M.; Homma, K. Empirical Regression Models for Estimating Multiyear Leaf Area Index of Rice from Several Vegetation Indices at the Field Scale. Remote Sens. 2014, 6, 4764–4779. [Google Scholar] [CrossRef] [Scilit]
  127. Darvishzadeh, R.; Skidmore, A.; Schlerf, M.; Atzberger, C.; Corsi, F.; Cho, M. LAI and Chlorophyll Estimation for a Heterogeneous Grassland Using Hyperspectral Measurements. ISPRS J. Photogramm. Remote Sens. 2008, 63, 409–426. [Google Scholar] [CrossRef] [Scilit]
  128. Li, X.; Zhang, Y.; Bao, Y.; Luo, J.; Jin, X.; Xu, X.; Song, X.; Yang, G. Exploring the Best Hyperspectral Features for LAI Estimation Using Partial Least Squares Regression. Remote Sens. 2014, 6, 6221–6241. [Google Scholar] [CrossRef] [Scilit]
  129. Thenkabail, P. Evaluation of Narrowband and Broadband Vegetation Indices for Determining Optimal Hyperspectral Wavebands for Agricultural Crop Characterization. Photogramm. Eng. Remote Sens. 2002, 68, 607–622. [Google Scholar]
  130. Rubo, S.; Zinkernagel, J. Exploring Hyperspectral Reflectance Indices for the Estimation of Water and Nitrogen Status of Spinach. Biosyst. Eng. 2022, 214, 58–71. [Google Scholar] [CrossRef] [Scilit]
  131. Hatfield, J.L.; Prueger, J.H.; Sauer, T.J.; Dold, C.; O’Brien, P.; Wacha, K. Applications of Vegetative Indices from Remote Sensing to Agriculture: Past and Future. Inventions 2019, 4, 71. [Google Scholar] [CrossRef] [Scilit]
  132. Verrelst, J.; Camps-Valls, G.; Muñoz-Marí, J.; Rivera, J.P.; Veroustraete, F.; Clevers, J.G.P.W.; Moreno, J. Optical Remote Sensing and the Retrieval of Terrestrial Vegetation Bio-Geophysical Properties—A Review. ISPRS J. Photogramm. Remote Sens. 2015, 108, 273–290. [Google Scholar] [CrossRef] [Scilit]
  133. Verrelst, J.; Malenovský, Z.; Van Der Tol, C.; Camps-Valls, G.; Gastellu-Etchegorry, J.-P.; Lewis, P.; North, P.; Moreno, J. Quantifying Vegetation Biophysical Variables from Imaging Spectroscopy Data: A Review on Retrieval Methods. Surv. Geophys. 2019, 40, 589–629. [Google Scholar] [CrossRef] [Scilit] [PubMed]
  134. Huete, A.R. A Soil-Adjusted Vegetation Index (SAVI). Remote Sens. Environ. 1988, 25, 295–309. [Google Scholar] [CrossRef] [Scilit]
  135. Lee, H.; Wang, J.; Leblon, B. Using Linear Regression, Random Forests, and Support Vector Machine with Unmanned Aerial Vehicle Multispectral Images to Predict Canopy Nitrogen Weight in Corn. Remote Sens. 2020, 12, 2071. [Google Scholar] [CrossRef] [Scilit]
  136. Belgiu, M.; Drăguţ, L. Random Forest in Remote Sensing: A Review of Applications and Future Directions. ISPRS J. Photogramm. Remote Sens. 2016, 114, 24–31. [Google Scholar] [CrossRef] [Scilit]
  137. Habibi, L.N.; Matsui, T.; Tanaka, T.S.T. Critical Evaluation of the Effects of a Cross-Validation Strategy and Machine Learning Optimization on the Prediction Accuracy and Transferability of a Soybean Yield Prediction Model Using UAV-Based Remote Sensing. J. Agric. Food Res. 2024, 16, 101096. [Google Scholar] [CrossRef] [Scilit]
  138. Shahi, T.B.; Xu, C.-Y.; Neupane, A.; Guo, W. Recent Advances in Crop Disease Detection Using UAV and Deep Learning Techniques. Remote Sens. 2023, 15, 2450. [Google Scholar] [CrossRef] [Scilit]
  139. Osco, L.P.; Marcato Junior, J.; Marques Ramos, A.P.; de Castro Jorge, L.A.; Fatholahi, S.N.; de Andrade Silva, J.; Matsubara, E.T.; Pistori, H.; Gonçalves, W.N.; Li, J. A Review on Deep Learning in UAV Remote Sensing. Int. J. Appl. Earth Obs. Geoinf. 2021, 102, 102456. [Google Scholar] [CrossRef] [Scilit]
  140. Niu, B.; Feng, Q.; Chen, B.; Ou, C.; Liu, Y.; Yang, J. HSI-TransUNet: A Transformer Based Semantic Segmentation Model for Crop Mapping from UAV Hyperspectral Imagery. Comput. Electron. Agric. 2022, 201, 107297. [Google Scholar] [CrossRef] [Scilit]
  141. Ren, Q.; Wu, Y.; Zeng, Q.; Yang, N. A Review of Deep Learning Based Agricultural Remote Sensing Image Segmentation. J. Agric. Eng. 2026, 57. [Google Scholar] [CrossRef] [Scilit]
  142. Joshi, A.; Pradhan, B.; Gite, S.; Chakraborty, S. Remote-Sensing Data and Deep-Learning Techniques in Crop Mapping and Yield Prediction: A Systematic Review. Remote Sens. 2023, 15, 2014. [Google Scholar] [CrossRef] [Scilit]
  143. Varga, I.; Lončarić, Z.; Kristek, S.; Kulundžić, A.M.; Rebekić, A.; Antunović, M. Sugar Beet Root Yield and Quality with Leaf Seasonal Dynamics in Relation to Planting Densities and Nitrogen Fertilization. Agriculture 2021, 11, 407. [Google Scholar] [CrossRef] [Scilit]
  144. Bolton, D.K.; Friedl, M.A. Forecasting Crop Yield Using Remotely Sensed Vegetation Indices and Crop Phenology Metrics. Agric. For. Meteorol. 2013, 173, 74–84. [Google Scholar] [CrossRef] [Scilit]
  145. Shammi, S.A.; Meng, Q. Use Time Series NDVI and EVI to Develop Dynamic Crop Growth Metrics for Yield Modeling. Ecol. Indic. 2021, 121, 107124. [Google Scholar] [CrossRef] [Scilit]
  146. Steddom, K.; Bredehoeft, M.W.; Khan, M.; Rush, C.M. Comparison of Visual and Multispectral Radiometric Disease Evaluations of Cercospora Leaf Spot of Sugar Beet. Plant Dis. 2005, 89, 153–158. [Google Scholar] [CrossRef] [Scilit] [PubMed]
  147. Noroozi, H.; Shah-Hosseini, R. Cercospora Leaf Spot Detection in Sugar Beets Using High Spatio-Temporal Unmanned Aerial Vehicle Imagery and Unsupervised Anomaly Detection Methods. J. Appl. Remote Sens. 2024, 18, 24506. [Google Scholar] [CrossRef] [Scilit]
  148. Shirazi, S.H.M.; Razzaghi, F.; Shabani, A.; Sepaskhah, A.R.; Khozaei, M. Predicting Sugar Beet Leaf Area Index: Evaluating Performance of Double Sigmoid Functions under Different Irrigation and Plant Density Scenarios. Sci. Rep. 2025, 15, 44879. [Google Scholar] [CrossRef] [Scilit] [PubMed]
  149. Barbedo, J.G.A. Data Fusion in Agriculture: Resolving Ambiguities and Closing Data Gaps. Sensors 2022, 22, 2285. [Google Scholar] [CrossRef] [Scilit] [PubMed]
  150. Allu, A.R.; Mesapam, S. Impact of Remote Sensing Data Fusion on Agriculture Applications: A Review. Eur. J. Agron. 2025, 164, 127478. [Google Scholar] [CrossRef] [Scilit]
  151. Zhou, Y.; Ma, Y. Evaluation of Sugar Content and Yield in Sugar Beet Based on UAV Multi-Sensor. Int. J. Intell. Control Syst. 2026, 31, 72–84. [Google Scholar] [CrossRef] [Scilit]
  152. Żarski, J.; Kuśmierek-Tomaszewska, R.; Dudek, S. Impact of Irrigation and Fertigation on the Yield and Quality of Sugar Beet (Beta vulgaris L.) in a Moderate Climate. Agronomy 2020, 10, 166. [Google Scholar] [CrossRef] [Scilit]
  153. Huang, J.; Gómez-Dans, J.L.; Huang, H.; Ma, H.; Wu, Q.; Lewis, P.E.; Liang, S.; Chen, Z.; Xue, J.-H.; Wu, Y.; et al. Assimilation of Remote Sensing into Crop Growth Models: Current Status and Perspectives. Agric. For. Meteorol. 2019, 276–277, 107609. [Google Scholar] [CrossRef] [Scilit]
  154. Launay, M.; Guerif, M. Assimilating Remote Sensing Data into a Crop Model to Improve Predictive Performance for Spatial Applications. Agric. Ecosyst. Environ. 2005, 111, 321–339. [Google Scholar] [CrossRef] [Scilit]
  155. Hodrius, M.; Migdall, S.; Bach, H.; Hank, T. The Impact of Multi-Sensor Data Assimilation on Plant Parameter Retrieval and Yield Estimation for Sugar Beet. Int. Arch. Photogramm. Remote Sens. Spat. Inf. Sci. 2015, XL-7-W3, 19–25. [Google Scholar] [CrossRef] [Scilit]
  156. Anar, M.J.; Lin, Z.; Hoogenboom, G.; Shelia, V.; Batchelor, W.D.; Teboh, J.M.; Ostlie, M.; Schatz, B.G.; Khan, M. Modeling Growth, Development and Yield of Sugarbeet Using DSSAT. Agric. Syst. 2019, 169, 58–70. [Google Scholar] [CrossRef] [Scilit]
  157. Dlamini, L.; Crespo, O.; van Dam, J.; Kooistra, L. A Global Systematic Review of Improving Crop Model Estimations by Assimilating Remote Sensing Data: Implications for Small-Scale Agricultural Systems. Remote Sens. 2023, 15, 4066. [Google Scholar] [CrossRef] [Scilit]
  158. Paudel, D.; Boogaard, H.; de Wit, A.; Janssen, S.; Osinga, S.; Pylianidis, C.; Athanasiadis, I.N. Machine Learning for Large-Scale Crop Yield Forecasting. Agric. Syst. 2021, 187, 103016. [Google Scholar] [CrossRef] [Scilit]
  159. Amani, M.; Ghorbanian, A.; Ahmadi, S.A.; Kakooei, M.; Moghimi, A.; Mirmazloumi, S.M.; Moghaddam, S.H.A.; Mahdavi, S.; Ghahremanloo, M.; Parsian, S.; et al. Google Earth Engine Cloud Computing Platform for Remote Sensing Big Data Applications: A Comprehensive Review. IEEE J. Sel. Top. Appl. Earth Obs. Remote Sens. 2020, 13, 5326–5350. [Google Scholar] [CrossRef] [Scilit]
  160. Gorelick, N.; Hancher, M.; Dixon, M.; Ilyushchenko, S.; Thau, D.; Moore, R. Google Earth Engine: Planetary-Scale Geospatial Analysis for Everyone. Remote Sens. Environ. 2017, 202, 18–27. [Google Scholar] [CrossRef] [Scilit]
  161. Sazib, N.; Mladenova, I.; Bolten, J. Leveraging Google Earth Engine for Drought Assessment Using Global Soil Moisture Data. Remote Sens. 2018, 10, 1265. [Google Scholar] [CrossRef] [Scilit]
  162. Estévez, J.; Salinero-Delgado, M.; Berger, K.; Pipia, L.; Rivera-Caicedo, J.P.; Wocher, M.; Reyes-Muñoz, P.; Tagliabue, G.; Boschetti, M.; Verrelst, J. Gaussian Processes Retrieval of Crop Traits in Google Earth Engine Based on Sentinel-2 Top-of-Atmosphere Data. Remote Sens. Environ. 2022, 273, 112958. [Google Scholar] [CrossRef] [Scilit] [PubMed]
  163. Bhandari, M.; Chang, A.; Jung, J.; Ibrahim, A.M.H.; Rudd, J.C.; Baker, S.; Landivar, J.; Liu, S.; Landivar, J. Unmanned Aerial System-Based High-Throughput Phenotyping for Plant Breeding. Plant Phenome J. 2023, 6, e20058. [Google Scholar] [CrossRef] [Scilit]
  164. Mayr, S.; Kuenzer, C.; Gessner, U.; Klein, I.; Rutzinger, M. Validation of Earth Observation Time-Series: A Review for Large-Area and Temporally Dense Land Surface Products. Remote Sens. 2019, 11, 2616. [Google Scholar] [CrossRef] [Scilit]
  165. Jaggard, K.W.; Qi, A.; Ober, E.S. Capture and Use of Solar Radiation, Water, and Nitrogen by Sugar Beet (Beta vulgaris L.). J. Exp. Bot. 2009, 60, 1919–1925. [Google Scholar] [CrossRef] [Scilit] [PubMed]
  166. Hoffmann, C.M.; Kenter, C. Yield Potential of Sugar Beet—Have We Hit the Ceiling? Front. Plant Sci. 2018, 9, 289. [Google Scholar] [CrossRef] [Scilit]
  167. Ahmad, A.; Saraswat, D.; El Gamal, A. A Survey on Using Deep Learning Techniques for Plant Disease Diagnosis and Recommendations for Development of Appropriate Tools. Smart Agric. Technol. 2023, 3, 100083. [Google Scholar] [CrossRef] [Scilit]
  168. Bock, C.H.; Barbedo, J.G.A.; Del Ponte, E.M.; Bohnenkamp, D.; Mahlein, A.K. From Visual Estimates to Fully Automated Sensor-Based Measurements of Plant Disease Severity: Status and Challenges for Improving Accuracy. Phytopathol. Res. 2020, 2, 9. [Google Scholar] [CrossRef] [Scilit]
  169. Dong, J.; Lee, J.; Fuentes, A.; Xu, M.; Yoon, S.; Lee, M.H.; Park, D.S. Data-Centric Annotation Analysis for Plant Disease Detection: Strategy, Consistency, and Performance. Front. Plant Sci. 2022, 13, 1037655. [Google Scholar] [CrossRef] [Scilit] [PubMed]
  170. Stevanato, P.; Zavalloni, C.; Marchetti, R.; Bertaggia, M.; Saccomani, M.; McGrath, J.M.; Panella, L.W.; Biancardi, E. Relationship between Subsoil Nitrogen Availability and Sugarbeet Processing Quality. Agron. J. 2010, 102, 17–22. [Google Scholar] [CrossRef] [Scilit]
  171. Thorp, K.R.; Tian, L.F. A Review on Remote Sensing of Weeds in Agriculture. Precis. Agric. 2004, 5, 477–508. [Google Scholar] [CrossRef] [Scilit]
  172. Khanal, S.; Kc, K.; Fulton, J.P.; Shearer, S.; Ozkan, E. Remote Sensing in Agriculture—Accomplishments, Limitations, and Opportunities. Remote Sens. 2020, 12, 3783. [Google Scholar] [CrossRef] [Scilit]
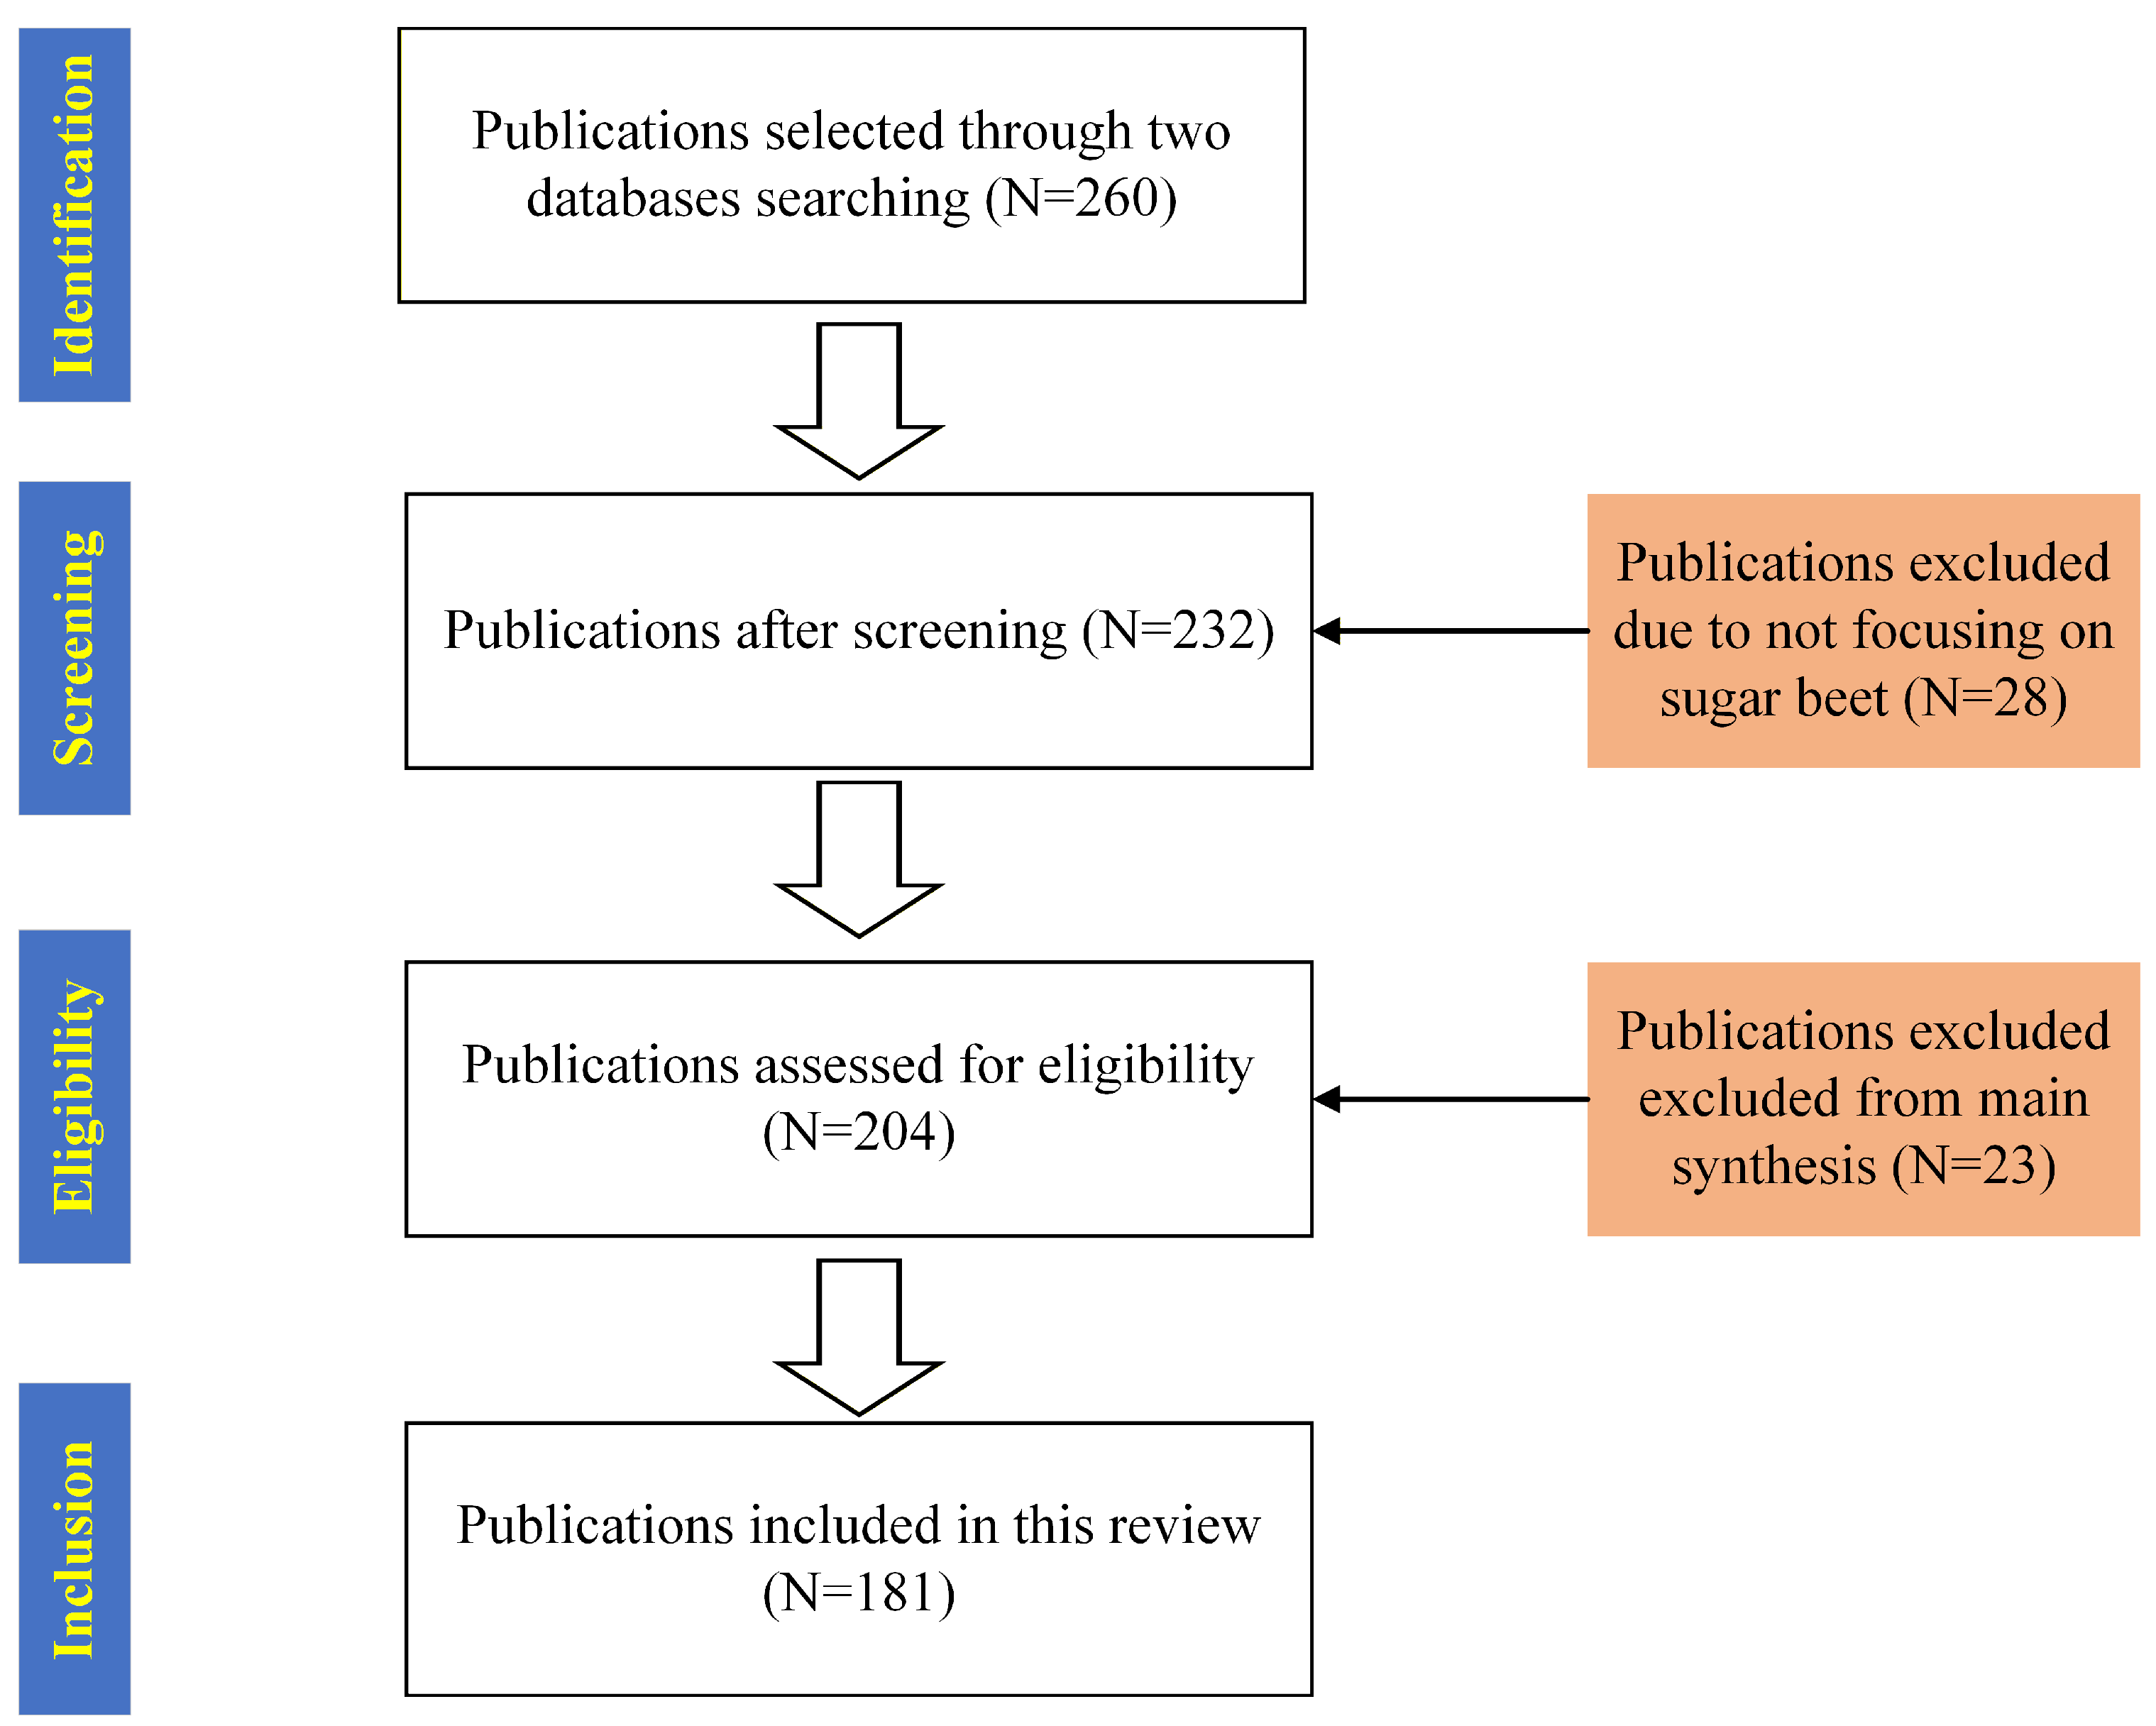
Figure 1. PRISMA-style flow diagram of literature identification, screening and inclusion. N refers to the number of publications.
Agriengineering 08 00298 g001
Figure 2. Publication distribution across different journals. The vertical axis represents journal titles, while the horizontal axis indicates the number of publications. “Others” refers to 60 journals that published only one article during the period.
Agriengineering 08 00298 g002
Figure 3. Regional distribution of the analysed publications by country, based on the affiliation of the first author.
Agriengineering 08 00298 g003
Figure 4. Annual evolution of RS studies in sugar beet production from 2003 to 2025. Stacked bars indicate the number of publications by primary application domain, while line plots indicate the number of publications using different sensing platforms. Platform categories are not mutually exclusive because one study may involve multiple sensing platforms.
Agriengineering 08 00298 g004
Table 1. Databases and queries used to define the scope of this review.
DatabaseWebsiteQuery
Scopushttps://www.scopus.com/home.uri (accessed on 17 December 2025)TITLE-ABS-KEY (“sugar beet” OR “sugarbeet” OR “sugar-beet” OR “Beta vulgaris”) AND TITLE-ABS-KEY (“remote sensing” OR “satellite imagery” OR “UAV” OR “unmanned aerial vehicle” OR “hyperspectral” OR “multispectral” OR “thermal imaging” OR “proximal sensing”) AND (LIMIT-TO (DOCTYPE, “ar”) OR LIMIT-TO (DOCTYPE, “re”))
Web of Science Core Collectionhttps://www.webofscience.com
(accessed on 17 December 2025)
TS = (“sugar beet” OR “sugarbeet” OR “sugar-beet” OR “Beta vulgaris”) AND TS = (“remote sensing” OR “satellite imagery” OR “UAV” OR “unmanned aerial vehicle” OR “hyperspectral” OR “multispectral” OR “thermal imaging” OR “proximal sensing”) AND DT = (Article OR Review)
Table 2. Evidence-based comparison matrix of satellite, UAV and proximal sensing platforms for sugar beet applications.
Comparison DimensionSatelliteUAVProximal Sensing
Representative sensorsLandsat, Sentinel-1/2, RapidEye, SPOT, MODIS, QuickBird, GeoEye, WorldView and NOAA-AVHRRRGB, multispectral, hyperspectral or thermal camerasSpectrometers, active optical sensors, fluorescence sensors and close-range imaging systems
Spatial detailMetre- to tens-of-metres spatial resolution used in sugar beet studies; sub-metre commercial imagery is also availableCentimetre-level ground sampling distancePoint-, leaf-, plant-, row- or small-plot-level measurements
Temporal detail Fixed revisit schedules and strong seasonal or long-term continuity; optical observations may be interrupted by cloud cover, whereas SAR is less affectedUser-scheduled acquisition at selected crop stages, subject to weather, flight regulations and operational availabilityOn-demand acquisition for handheld or mobile sensors; fixed systems may provide high-frequency or continuous observations
Coverage scaleField to regional, national or continental scalesExperimental plot to commercial field scaleIndividual leaf or plant to row and small-plot scale
Deployment controlLow user control over acquisition timing and viewing conditionsHigh control over flight timing, altitude, overlap and sensor configurationHigh control over measurement timing and sampling design
Cost profileLow image-acquisition cost for open-access satellite data; high-resolution commercial data may be costlyModerate to high operational cost because of equipment, trained personnel, flight planning and data processingEquipment costs vary, but labour cost per unit area is generally high because of limited coverage and repeated field sampling
Processing and operational demandModerate processing demand, including atmospheric correction, cloud screening, time-series harmonisation and mixed-pixel managementHigh data-volume and processing demand, including image calibration, mosaicking, georeferencing, reconstruction and model inferenceUsually lower image volume, but substantial calibration, sampling, quality-control and measurement-standardisation effort may be required
Main limitationsOptical cloud contamination, mixed pixels and limited ability to resolve fine within-field variation using medium-resolution imageryLimited spatial coverage, weather and regulatory constraints, short flight duration and high processing demandLabour-intensive acquisition, limited spatial representativeness and low scalability
The entries describe typical characteristics of the platform configurations most commonly represented in the reviewed sugar beet literature rather than universal specifications. Actual spatial detail, acquisition frequency, cost and operational requirements vary with sensor type, platform configuration, study area and data-processing workflow. UAV—unmanned aerial vehicle, RGB—red–green–blue, MODIS—Moderate Resolution Imaging Spectroradiometer, NOAA-AVHRR—National Oceanic and Atmospheric Administration Advanced Very High-Resolution Radiometer, SAR—synthetic aperture radar.
Table 3. Representative quantitative performance and validation contexts reported in selected sugar beet RS studies.
ApplicationReferenceTargetValidation ContextRepresentative Performance
Canopy-cover retrievalJiang et al. [74]Fractional vegetation coverOne growing season in 2022; ground-truth measurements from 30 plots across four growth stages; 18 index–threshold combinations evaluatedPerformance ranged from R2 = 0.34 and NRMSE = 42.3% to R2 = 0.96 and NRMSE = 5.1%; ExG combined with Otsu or Ridler–Calvard thresholding produced the best overall results
LAI and fresh-biomass retrievalCao et al. [70]LAI, fresh weight of leaves and total fresh weightField-based UAV experiment; WDRVI models compared with conventional NDVI-based monitoring, particularly within an LAI range of 2–6WDRVI-based R2 values were 0.957, 0.950 and 0.963 for LAI, fresh weight of leaves and total fresh weight, respectively; reported accuracy gains over NDVI-based estimates were 1.05–5.07%
Soilborne-disease identification and characterisationAbdalla et al. [96]Identification, classification and severity quantification of Fusarium oxysporum and Rhizoctonia solaniControlled inoculation experiment involving 122 plants monitored over 30 days; comparative internal evaluation of five ML classifiersKNN achieved approximately 99–100% accuracy and F1-score for disease identification, 99% accuracy for disease-type classification, and 97% accuracy with an IoU of 0.94 for severity quantification
Virus-yellows incidence scoringOkole et al. [99]Incidence of beet mild yellowing virus and beet chlorosis virusTwo variety trials: 2021 data from five cultivars used for model development and validation; 2022 data from two previously unseen cultivars used for independent testingThe best BMYV model, using RGB imagery and transformed features, achieved an RMSE of 11.45% relative to expert disease scores
Crop–weed semantic mappingSa et al. [104]Pixel-level classification of background, sugar beet and weedsWithin-dataset comparison of 20 network and input-channel configurations; direct comparison between an RGB baseline and multispectral inputsRelative to the RGB baseline, nine-channel input increased AUC from 0.607 to 0.839 for background, from 0.681 to 0.863 for crops and from 0.576 to 0.782 for weeds
Weed segmentation and prescription mappingJoy et al. [60]Sugar beet and weed segmentation, weed-patch detection and prescription-map generationExperimental sugar beet field imagery; comparative evaluation of semantic- and instance-segmentation models; herbicide savings estimated from generated prescription mapsU-Net with a ResNet-34 backbone achieved IoU values of 0.85 for sugar beet and 0.72 for weeds. YOLOv8 achieved a mAP of 0.728, compared with 0.627 for Mask R-CNN. Prescription maps indicated potential herbicide savings of up to 82.88%
Operational weed mapping and site-specific treatmentMink et al. [57]Mapping of Cirsium arvense and Rumex crispus patches and generation of herbicide application mapsField trials in maize and sugar beet in southern Germany; UAV-derived maps compared with manually mapped weed patches and used for site-specific applicationCorrect classification ranged from 96% in maize to approximately 80% in the final sugar beet treatment; computational underestimation of manually mapped weed patches ranged from 1% to 10%
Root yield relationshipLudewig-Spickermann et al. [76]Sugar beet root yieldTwo study years and repeated observations; combined analysis across the investigation period and cross-platform comparison with ultralight-aircraft imageryCombined UAV observations produced R2 > 0.97; transfer to the ultralight-aircraft sensor system produced R2 > 0.96 in both study years; July–September was identified as the most stable acquisition period
Nitrogen accumulation and sugar yield estimationWang et al. [110]Nitrogen accumulation and sugar yieldMulti-stage experimental dataset; comparison of three modelling algorithms and single-source, multi-source, single-stage and multi-temporal inputsThe best nitrogen-accumulation model achieved R2 = 0.70 and RMSE = 0.44. The multi-temporal sugar-yield model achieved R2 = 0.95 and RMSE = 0.16, representing a 21% improvement over the best single-stage result. Multi-source fusion improved nitrogen and sugar yield estimation accuracy by 55% and 28%, respectively
Yield and quality predictionWang et al. [30]Sugar content, root yield and sugar yieldPlot-level dataset covering two years, 185 sugar beet varieties and three growth stages; comparison with conventional ML methodsUsing observations from all three growth stages, the model achieved R2 = 0.761 and rRMSE = 7.1% for sugar content, R2 = 0.531 and rRMSE = 22.5% for root yield, and R2 = 0.478 and rRMSE = 23.4% for sugar yield
Values are reported as presented in the original studies and were not pooled or weighted by sample size. Performance metrics are not directly comparable across different targets, datasets and validation designs. R2—coefficient of determination, RMSE—root mean square error, NRMSE—normalised root mean square error, rRMSE—relative root mean square error, AUC—area under the receiver operating characteristic curve, IoU—intersection over union, mAP—mean average precision, LAI—leaf area index, WDRVI—wide dynamic range vegetation index, ExG—excess green index, RGB—red–green–blue, KNN—K-Nearest Neighbour.
Table 4. Main modelling approaches and data-integration frameworks used in sugar beet RS applications.
Modelling ApproachTypical Predictors/Data SourcesMain ApplicationsMain StrengthsMain Limitations
Empirical regression modelsVIs, spectral bands, field-measured traitsTrait retrieval, biomass estimation, chlorophyll assessment and yield-related predictionSimple, interpretable and computationally efficient; provides a useful baseline for trait retrieval and routine crop monitoringOften site-specific; limited transferability across cultivars, years, soils and management conditions
ML modelsSpectral predictors, structural traits, thermal variables, weather, soil and management dataSPAD estimation, nitrogen-status assessment, disease detection, cultivar discrimination, root yield and quality predictionCaptures non-linear relationships and integrates heterogeneous predictors; suitable for complex traits influenced by multiple environmental and management factors Requires representative training data, careful feature selection and robust validation
DL modelsUAV RGB, multispectral or hyperspectral imagery; pixel-level or object-level annotationsWeed segmentation, disease-incidence mapping, disease severity assessment and crop–weed discriminationLearns spatial, textural and contextual information directly from high-resolution imagery; especially suitable for image-classification and segmentation tasksRequires large labelled datasets, computational resources and external validation; limited interpretability and uncertain transferability
Multi-temporal and phenology-based modellingSatellite or UAV time-series data; seasonal VI trajectories; phenology-based featuresCrop growth monitoring, phenology tracking, stress progression, yield prediction and quality-related assessmentCaptures crop-development dynamics and growth-stage-specific signals; generally more informative than single-date observations for production-related predictionSensitive to cloud cover, missing observations, inconsistent acquisition timing and preprocessing differences; requires sufficient temporal coverage
Multi-source data fusionOptical, SAR, thermal, hyperspectral, structural, weather, soil and management dataStress diagnosis, water-status assessment, root yield prediction, sugar-content estimation and precision managementCombines complementary information; improves robustness for complex production traitsIncreases data-processing complexity; requires calibration, harmonisation and compatible spatial-temporal scales
Crop model assimilationRS-derived LAI, canopy cover, VIs and evapotranspiration estimates combined with crop growth modelsBiomass simulation, water-use assessment, root yield prediction and potential sugar-accumulation modellingLinks RS observations with physiological crop processes; provides process-based interpretationStill underdeveloped for sugar beet; requires well-calibrated crop models, reliable RS inputs and high-quality field measurement
VIs—vegetation indices, ML—machine learning, DL—deep learning, UAV—unmanned aerial vehicle, RGB—red–green–blue, SPAD—Soil–Plant Analysis Development, SAR—synthetic aperture radar, RS—remote sensing; LAI—leaf area index.
Disclaimer/Publisher’s Note: The statements, opinions and data contained in all publications are solely those of the individual author(s) and contributor(s) and not of MDPI and/or the editor(s). MDPI and/or the editor(s) disclaim responsibility for any injury to people or property resulting from any ideas, methods, instructions or products referred to in the content.