Article

An End-to-End Precision Phenotyping Framework: Rice Panicle Detection and Counting in Complex Fields via Lightweight DETR

1
Yichun Lithium New Energy Industry Research Institute, Jiangxi University of Science and Technology, No. 5 Chunhua Road, Yichun Economic Development Zone, Yuanzhou District, Yichun 336000, China
2
Jiangxi Provincial Key Laboratory of Multidimensional Intelligent Perception and Control, School of Information Engineering, Jiangxi University of Science and Technology, Ganzhou 341000, China
*
Author to whom correspondence should be addressed.
AgriEngineering 2026, 8(7), 294; https://doi.org/10.3390/agriengineering8070294
Submission received: 11 April 2026 / Revised: 8 July 2026 / Accepted: 12 July 2026 / Published: 17 July 2026

Abstract

Accurate, high-throughput quantification of rice panicles is important for yield estimation and breeding-oriented rice phenotyping. However, unmanned aerial vehicle (UAV)-based panicle detection remains challenging because flight-altitude variation produces large target-scale changes. Flooded paddy backgrounds, leaf occlusion, and illumination fluctuations further obscure small panicle targets. To address these challenges, we constructed a composite multi-altitude dataset covering UAV imagery acquired from 3 to 20 m under varying field conditions. We then propose Panicle-DETR, a lightweight detection and counting framework based on a frequency-aware Cross Stage Partial (CSP) backbone. Rather than treating the Fast Fourier Transform (FFT) as a filter by itself, the proposed FasterFD module uses frequency-domain representations with learnable frequency-response reweighting to enhance panicle-related texture cues and reduce redundant background responses. A Lossless Feature Encoder is designed to preserve fine spatial information for small targets across altitude-induced scale changes, while a composite metric loss based on Normalized Gaussian Wasserstein Distance (NWD) and Inner-IoU improves localization for adherent and overlapping panicle clusters. On the composite dataset, Panicle-DETR achieved a Precision of 90.97%, a Mean Absolute Error of 4.28, and an R 2 of 0.957 for single-frame panicle counting. With 13.78 M parameters and 53.0 GFLOPs, the framework achieved 16.9 FPS with 1.96 GB peak GPU memory in a battery-powered notebook benchmark, supporting its potential for resource-constrained field-side UAV image analysis.

1. Introduction

Rice is one of the world’s most important staple crops and supports food security, rural employment, and a broad range of domestic and industrial uses. At the field scale, panicle density and spatial distribution are key agronomic traits associated with final yield formation. Accurate, high-throughput quantification of rice panicles is therefore important for yield estimation, variety screening, and breeding-oriented phenotyping [1,2]. Compared with satellite imagery, unmanned aerial vehicle (UAV) remote sensing can provide higher spatial resolution, flexible flight-altitude control, and growth-stage-specific field observations, making it useful for panicle-level phenotyping [3,4]. Satellite platforms remain valuable for large-area and long-term monitoring, but their spatial resolution, cloud sensitivity, and revisit constraints limit direct detection of small panicle targets in dense canopies [5].
However, UAV-based phenotyping has several practical constraints. Many studies still follow a “capture-and-process” workflow in which large image files are transferred to ground workstations for offline analysis [6,7]. This workflow can delay field decisions and increase data-transfer demands. Timely phenotyping therefore requires models that can run on resource-constrained field-side hardware while preserving accuracy under open-field imaging conditions [8]. UAV platforms also introduce acquisition-level uncertainty. Flight altitude can vary because of wind, terrain, battery constraints, inspection needs, and operator control, changing the apparent panicle scale within and across missions. Low-altitude flights may provide more detail but also narrow the field of view and increase sensitivity to rotor-induced motion blur, wind-driven plant movement, and partial occlusion. In flooded paddies, leaf occlusion, water-surface reflection, and changing illumination further obscure small panicle targets [9,10]. These factors limit the direct transfer of laboratory or benchmark detectors to UAV-based rice phenotyping.
Deep learning has reduced reliance on manual feature engineering in crop phenotyping. Convolutional neural networks (CNNs) have been used for agricultural detection tasks including multi-scale weed detection [11] and crop maturity evaluation with artificial intelligence (AI) and remote sensing [12]. Early panicle-detection studies used two-stage models; for example, Zhang et al. [13] improved Faster Region-based Convolutional Neural Network (Faster R-CNN) with multi-scale feature fusion. More recent work has emphasized lightweight one-stage detectors for UAV applications. Comparative studies have evaluated You Only Look Once (YOLO) variants under constrained UAV image datasets for yield estimation [14] and have adapted these models to lighting variation and environmental noise [15]. Related architectures, including EfficientNet-based OE-YOLO [16] and DRPU-YOLO11 [17], were developed for complex in-field backgrounds. Recent detectors such as YOLOv10 aim to reduce post-processing by eliminating non-maximum suppression (NMS) [18]. Other studies address operational constraints through multi-altitude scale modeling [19], knowledge distillation for lightweight deployment [20], rotated bounding boxes for inclined panicles [21], enhanced feature fusion for counting [22], and multi-scale enhancement for complex backgrounds [23]. These developments indicate clear progress, but efficient panicle detection remains difficult in dense canopies and field robotic settings [24].
Despite these advances, CNN-based detectors remain limited by their dependence on local receptive fields. This can make it difficult to separate panicles from background vegetation during late growth stages, especially when adhesion and leaf occlusion are present [25,26]. Transformer-based detectors provide an alternative because they model longer-range dependencies. Detection Transformer (DETR) [27] reformulates object detection as a set prediction problem, and the Real-Time Detection Transformer (RT-DETR) family [28] improves inference efficiency with a hybrid encoder. However, their use in resource-constrained agricultural phenotyping remains less explored than YOLO-style detectors. Hybrid CNN-Transformer methods have shown value in agricultural segmentation and detection [29]. Their direct application to UAV panicle imagery still faces two practical issues: fine panicle textures can be weakened by background noise, and downsampling can reduce the already small pixel footprint of high-altitude targets.
To address the combined requirements of detection accuracy, multi-altitude robustness, and deployment-oriented efficiency, this paper proposes an end-to-end precision phenotyping framework: Panicle-DETR. Designed for complex field environments and multi-altitude UAV operations, the lightweight framework introduces three core engineering components:
  • FasterFD (Frequency-Aware CSP Backbone): This backbone retains the Cross Stage Partial (CSP) hierarchy of YOLO-style networks and replaces standard bottlenecks with C2f-FasterFD modules. By combining Partial Convolution (PConv) with Frequency Dynamic Convolution (FDConv), it introduces learnable frequency-response reweighting to emphasize panicle-related texture cues while controlling computational cost.
  • LFE (Lossless Feature Encoder): This encoder integrates Space-to-Depth mapping with bidirectional feature pyramids to preserve fine spatial information during cross-scale fusion, especially for small panicles captured from higher UAV altitudes.
  • Composite Metric Loss: This loss combines Normalized Gaussian Wasserstein Distance (NWD) and Inner Intersection over Union (Inner-IoU) to improve bounding box regression for dense and overlapping panicle clusters without adding inference-time computation.

2. Materials and Methods

2.1. Study Area and Data Preparation

To evaluate rice panicle detection across UAV flight altitudes, this study constructed a Composite Multi-Altitude Rice Panicle Dataset. The dataset combines a public benchmark with supplementary 3 m UAV images collected for this work, covering image patches from 3 m to 20 m flight altitudes.
The public component was derived from the Diverse Rice Panicle Detection (DRPD) dataset published by Teng et al. [30]. The DRPD images were acquired using a DJI M300 UAV (DJI, Shenzhen, China) equipped with a Zenmuse P1 imaging sensor (DJI, Shenzhen, China). Based on the label files used in this study, the DRPD subset contributed 5369 high-resolution image patches (512 × 512 pixels), covering 229 rice varieties across four growth stages from initial heading to mid-grain filling. It contains images captured at 7 m, 12 m, and 20 m flight altitudes, with ground sampling distance (GSD) ranging from approximately 0.08 to 0.25 cm/pixel. This subset provides 259,452 annotated panicle instances for evaluating detection across cultivars, growth stages, and imaging conditions.
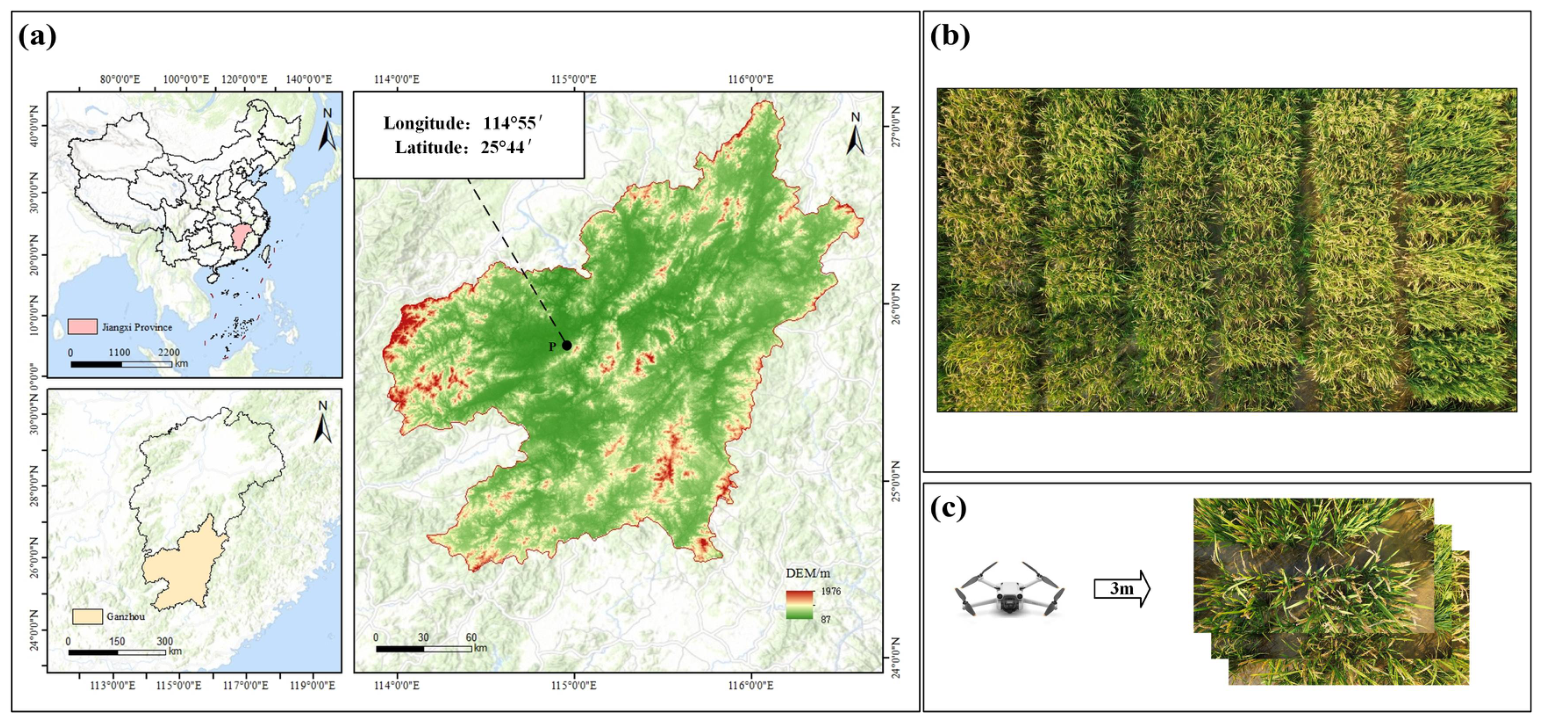
Because medium- and high-altitude images do not cover all field inspection scenarios, we added a supplementary low-altitude dataset. Image acquisition was conducted in July 2025 at the Gannan Red Seed Industry Rice Research Base (Ganzhou City, Jiangxi Province, China), as illustrated in Figure 1. The supplementary data were collected with a consumer-grade lightweight UAV (DJI Mini 3; DJI, Shenzhen, China) at a nominal altitude of approximately 3 m. This setting was used to provide lower-altitude panicle appearances and sensor conditions that differ from those in the DRPD dataset.
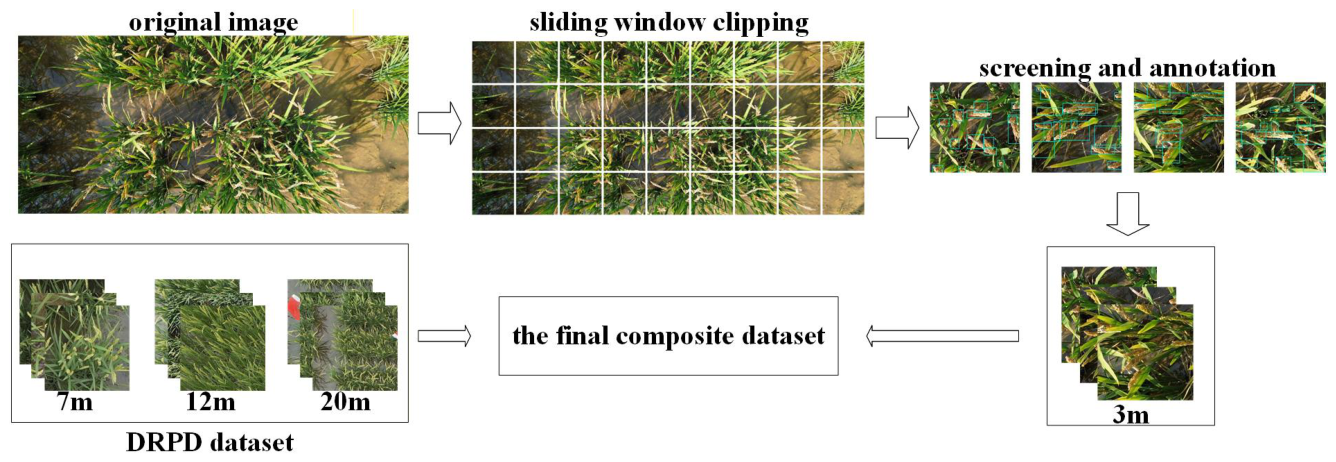
To standardize spatial dimensions and prepare raw UAV imagery for network ingestion, a systematic data processing pipeline was established, as illustrated in Figure 2. The raw ultra-low-altitude images acquired by the DJI Mini 3 were not downscaled before patch generation. Instead, fixed-size 512 × 512 pixel patches were extracted from the native-resolution images using a sliding-window strategy, ensuring dimensional consistency with the DRPD dataset while preserving the original pixel values during patch extraction. No interpolation or resampling was applied during this patch extraction step. During model training and inference, all patches were resized to 640 × 640 pixels using bilinear interpolation to match the network input size.
Subsequently, a quality filtering process was applied to discard invalid patches suffering from severe rotor-induced airflow blur or lacking panicle targets. A patch was excluded when rice panicles were visually unidentifiable because of strong motion blur, when the image contained no visible panicle target, or when the frame was dominated by non-field regions. To make this manual quality-control step auditable, two annotators independently screened the ultra-low-altitude patches and resolved disagreements by joint review. Among 682 candidate 3 m patches generated after automatic sliding-window patch extraction, 36 patches (5.3%) were excluded during quality filtering.
Following the filtering phase, 646 ultra-low-altitude image patches were retained. These patches were manually annotated with LabelImg software. To maintain cross-dataset compatibility, the annotation protocol followed the bounding box definitions used in the public dataset.
The 3 m patches were then combined with the 7 m, 12 m, and 20 m DRPD subsets. The DRPD label files contained 259,452 annotated panicle boxes, and the supplementary 3 m annotations contributed 10,435 boxes. The final Composite Multi-Altitude Dataset therefore contains 6015 image patches and 269,887 annotated panicle instances. The dataset was divided into training, validation, and test sets according to the retained DRPD label partition and the supplementary 3 m image split, resulting in 3739, 602, and 1674 images, respectively. The per-altitude image distribution and corresponding panicle-instance totals are summarized in Table 1. This design allows model evaluation under controlled altitude variation, although it does not reproduce every source of variability encountered during continuous UAV flight.
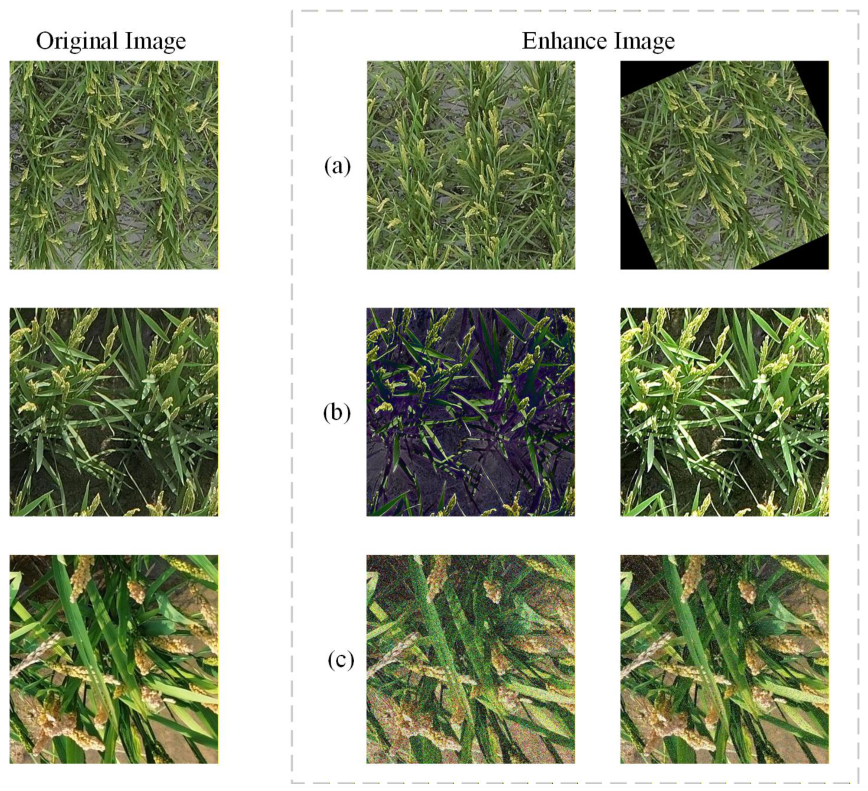
To reduce overfitting and expose the model to common appearance variation, online data augmentation was applied during training, as illustrated in Figure 3. Random horizontal and vertical flipping simulated changes in UAV flight heading. Stochastic perturbations of brightness, contrast, and saturation simulated illumination variation. Gaussian noise was added to approximate sensor noise. These augmentations were used only during training.

2.2. Panicle-DETR Network Framework

2.2.1. Overall Network Architecture

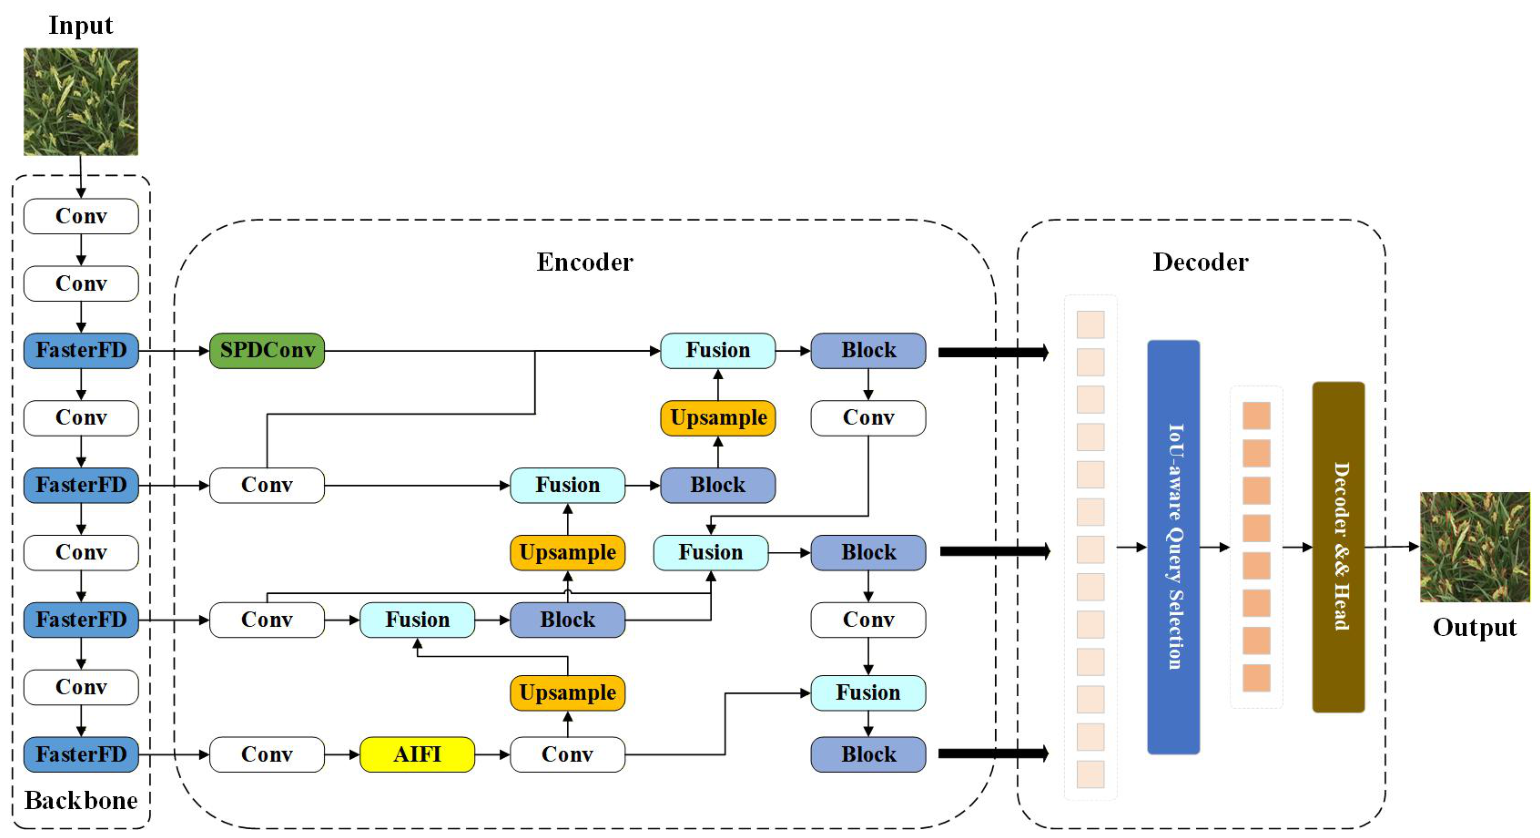
Panicle-DETR was designed for rice panicle detection under multi-altitude UAV imaging, dense occlusion, and resource-constrained field-side inference. The overall architecture is illustrated in Figure 4.
The framework uses RT-DETR-r18 as the baseline because it provides an end-to-end detection structure and avoids NMS post-processing. YOLO-family models can be efficient, but their convolutional feature extractors mainly rely on local spatial operations. In dense rice canopies, local texture alone may be insufficient to distinguish adjacent adherent panicles from leaves and background. The Transformer component in RT-DETR-r18 provides longer-range contextual modeling, which is useful for densely packed agricultural targets.
The RT-DETR-r18 baseline still has limitations for agricultural aerial imagery. It can fail to represent fine textures of small objects, and heavier backbones increase computational cost. Panicle-DETR therefore replaces the conventional backbone with a customized YOLO-style Cross Stage Partial (CSP) network. Rather than relying only on spatial convolutions, the framework routes image features through a frequency-aware backbone in which learnable frequency-domain reweighting enhances panicle-related texture responses and reduces redundant background responses. The refined features are then passed to the Lossless Feature Encoder (LFE), which propagates spatial information across scales while reducing the information loss associated with strided downsampling. The decoder and detection head then produce end-to-end panicle predictions.

2.2.2. FasterFD: Frequency-Aware CSP Feature Extraction Backbone

In complex background images captured by low-altitude UAVs, rice panicles often show fine textures and blurred edges. Standard spatial-domain convolutions may underuse this textural information. Mature rice panicles can contain high-frequency grayscale variation relative to smoother background regions such as flooded soil, water surfaces, and mature leaves.
To address this issue while considering computational efficiency, we designed the FasterFD backbone. At the macro-architectural level, FasterFD follows the Cross Stage Partial hierarchy used in YOLO-style networks. It downsamples spatial features with strided convolutions to generate a five-level multi-scale representation from P1 to P5. Standard C2f modules rely mainly on spatial convolutions, which may be inefficient when many background responses are weakly informative for panicle detection.
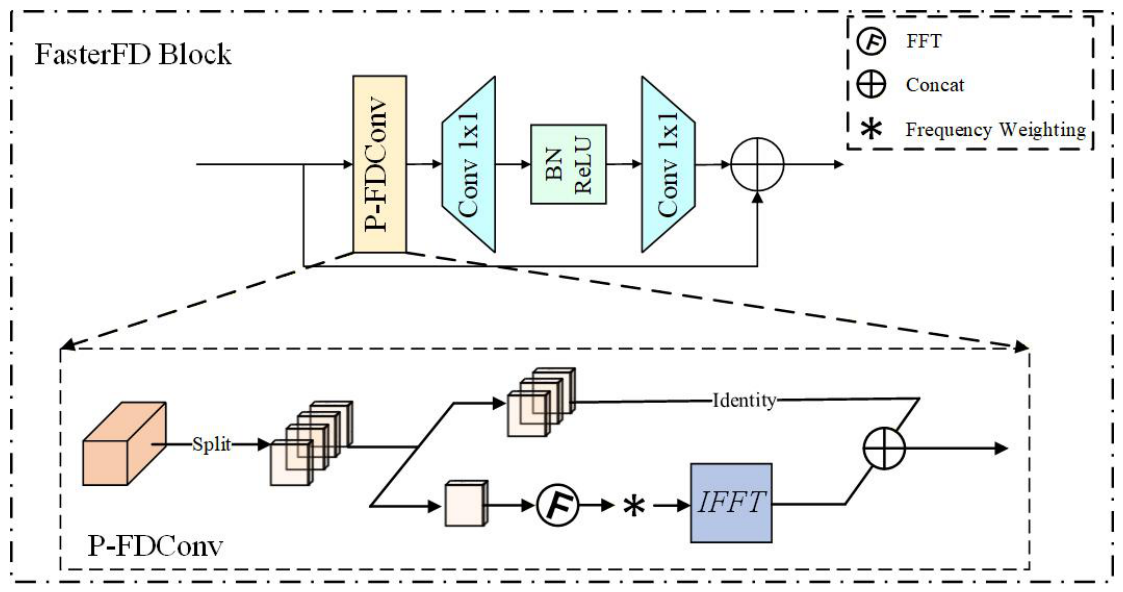
We therefore introduce a micro-architectural modification. As illustrated in Figure 5, standard C2f modules are replaced with C2f-FasterFD modules. This design combines the partial-channel computation strategy of FasterNet [31] with learnable frequency-response modulation.
The architecture of the C2f-FasterFD module follows two principles. The first is partial channel processing. Within the bottleneck structure, an input feature map X R C × H × W is partitioned along the channel dimension using a split ratio of r = 4 . This produces an active subset X active R C r × H × W and an unmodified identity subset X identity , thereby reducing the number of channels processed by the more expensive operation.
The second principle focuses on frequency-aware feature modulation. For the active channel subset, we replace the traditional 3 × 3 spatial convolution with frequency dynamic convolution [32]. The Fast Fourier Transform (FFT) itself is only a domain transformation and does not perform filtering on its own. In C2f-FasterFD, the filtering effect is instead produced by the learnable frequency-domain weight matrix, which reweights frequency components after projection and before inverse transformation. This design broadens the effective receptive field and enables the network to emphasize panicle-related texture responses while reducing redundant smooth background responses. Mathematically, the forward pass for the active channel subset is defined as:
X active = F 1 ( K F ( X active ) )
In this formulation, F ( · ) and F 1 ( · ) denote the mapping to the frequency domain and its inverse. The operator ⊙ denotes the Hadamard product in the frequency domain, modulated by K , a learnable complex-valued weight matrix. Thus, FFT exposes frequency components, whereas the adaptive weighting matrix determines which components are strengthened or suppressed. Integrating this projection into the YOLO-style hierarchy is intended to improve texture sensitivity while keeping computational cost within a resource-constrained range.

2.2.3. LFE: Lossless Feature Encoder

Multi-altitude UAV surveys from 3 m to 20 m create large changes in panicle scale. Agricultural micro-target detection is affected by a spatial-semantic trade-off: early network layers retain textural and geometric detail but provide limited context, whereas deeper layers encode stronger semantics after spatial resolution has been reduced.
Conventional feature pyramids may not fully bridge this trade-off. Standard strided downsampling operations (Stride-2 Conv) reduce the pixel footprint of high-altitude targets, which can weaken features for micro-panicles spanning only a small number of pixels.
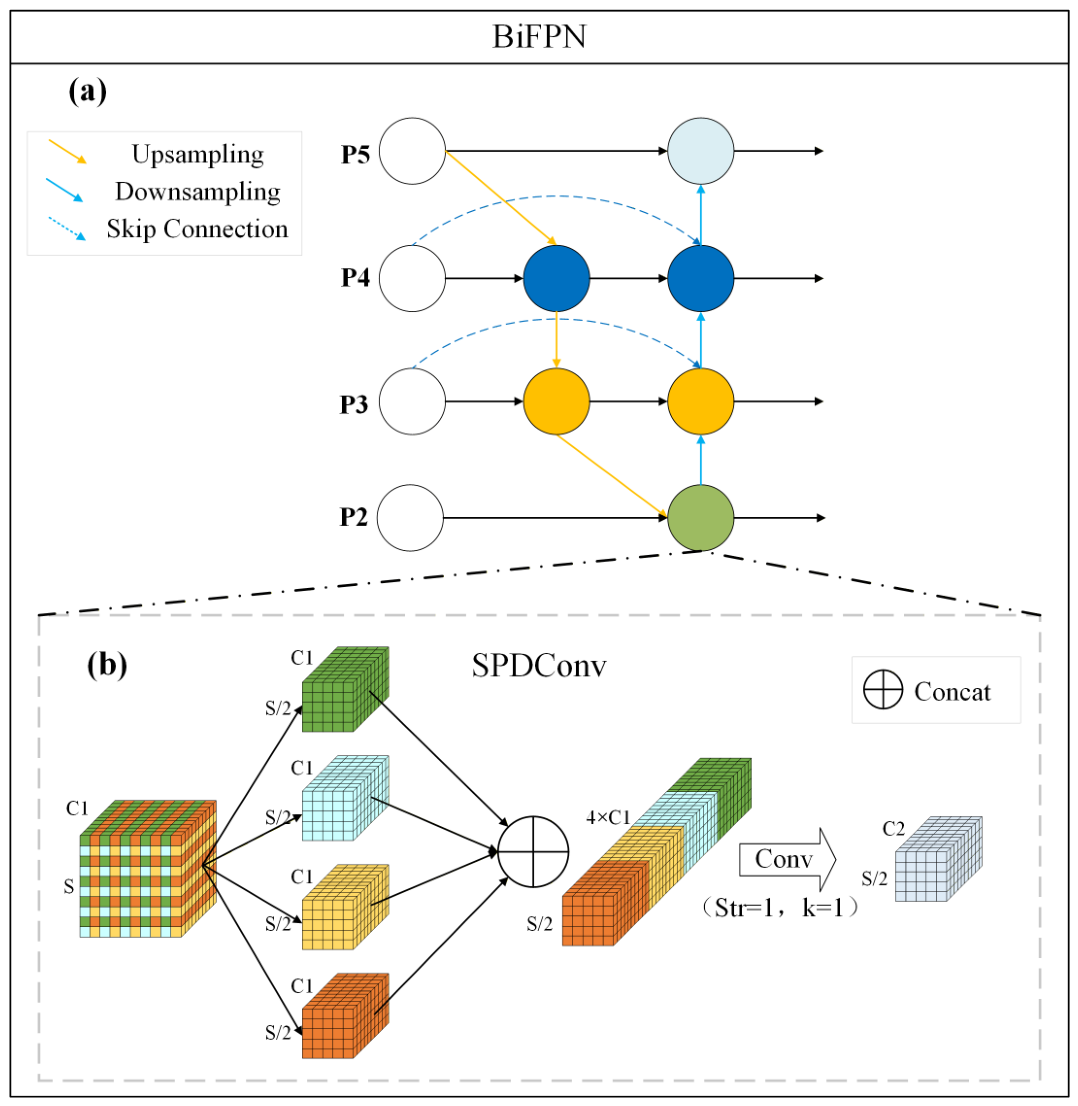
To reduce this imbalance, this study proposes the Lossless Feature Encoder (LFE). This module reconstructs the cross-scale feature flow by combining the bidirectional topology and fast normalized weighted fusion of the Bidirectional Feature Pyramid Network (BiFPN) [33] (Figure 6a). The fusion weights are adjusted according to the contribution of input features, allowing shallow texture-rich layers to contribute to multi-scale prediction.
To reduce spatial information loss during pyramid construction, we embed Space-to-Depth Convolution (SPDConv) [34] into the cross-scale downsampling paths of the LFE. As shown in Figure 6b, SPDConv rearranges spatial information into the channel dimension through a slicing operation. For an input feature map X of size S × S × C in , it is transformed into an output feature map X of size S / 2 × S / 2 × 4 C in . The mapping relationship is defined as:
X x , y = [ X 2 x , 2 y , X 2 x + 1 , 2 y , X 2 x , 2 y + 1 , X 2 x + 1 , 2 y + 1 ]
In summary, the LFE combines adaptive BiFPN fusion with spatial-preserving SPDConv downsampling. This design helps transmit fine panicle textures from high-altitude images into deeper semantic features and supports multi-scale detection under UAV altitude variation.

2.2.4. Adjustment of the Loss Function

In densely planted paddies, occlusion and morphological overlap among small panicles can weaken the optimization signal from traditional Intersection over Union (IoU) loss. First, non-overlapping bounding boxes yield a zero IoU. Second, small positional deviations in micro-targets can cause large IoU changes. We therefore used a composite regression loss that combines metric learning and auxiliary bounding boxes.
  • Normalized Wasserstein Distance Loss
First, to reduce the sensitivity of small-object regression to positional deviations, we introduce the NWD loss [35]. Unlike the traditional IoU calculation based on geometric overlap, NWD models the bounding box B = ( c x , c y , w , h ) as a 2D Gaussian distribution N ( μ , Σ ) . The mean vector μ and the covariance matrix Σ are defined as:
μ = c x c y , Σ = w 2 4 0 0 h 2 4
The NWD loss is constructed from the second-order Wasserstein distance W 2 2 between the predicted distribution N p and the ground-truth distribution N g :
L NWD = 1 exp | | μ p μ g | | 2 2 + | | Σ p 1 / 2 Σ g 1 / 2 | | F 2 C
By measuring distributional similarity, NWD reduces the gradient fluctuations caused by small positional deviations, enabling more consistent optimization when handling non-overlapping or slightly overlapping samples.
2.
Inner-IoU Loss
While NWD reduces the metric problem for non-overlapping or weakly overlapping targets, fine-grained regression remains difficult for highly overlapping samples. To improve boundary refinement, we integrated the Inner-IoU loss [36]. Traditional IoU provides uniform gradients irrespective of sample quality. By applying a spatial scale factor ratio (empirically set to 0.7), Inner-IoU generates contracted “auxiliary inner boxes” within the original anchors:
b l inner = c x w · ratio 2 , b r inner = c x + w · ratio 2 b t inner = c y h · ratio 2 , b b inner = c y + h · ratio 2
where b l inner , b r inner , b t inner , and b b inner denote the left, right, top, and bottom boundary coordinates of the auxiliary inner box, respectively. Computing the intersection ratio between these auxiliary inner boxes ( IoU inner ) increases sensitivity to boundary alignment for dense, adherent panicles.
3.
Total Loss Formulation
Panicle-DETR is optimized with a multi-task objective. The total loss formulation, L Total , integrates Varifocal Loss (VFL; L VFL ) for classification with the dual-metric bounding box regression term. The regression penalty combines NWD and Inner-IoU through an interpolation coefficient α :
L Total = λ cls L VFL + λ box α L Inner IoU + ( 1 α ) L NWD + λ L 1 L L 1
Here, λ cls , λ box , and λ L 1 regulate the contribution of each component. Coupling the distributional sensitivity of NWD with the boundary refinement of Inner-IoU is intended to improve localization robustness in dense and unstructured paddy scenes.

2.3. Experimental Protocol

2.3.1. Experimental Environment

All models were trained and initially evaluated on a server to ensure a consistent development environment and avoid server-side performance bottlenecks. The server was equipped with an Intel Core i7-14700KF processor, 64 GB of random-access memory (RAM), and an NVIDIA GeForce RTX 4080 SUPER GPU (NVIDIA Corporation, Santa Clara, CA, USA; 16 GB of video random-access memory (VRAM)). The server software environment included Ubuntu 22.04 Long-Term Support (LTS), Python 3.10, PyTorch 2.5.1, and Compute Unified Device Architecture (CUDA) 12.4. An additional battery-powered notebook equipped with an NVIDIA GeForce GTX 1650 GPU (NVIDIA Corporation, Santa Clara, CA, USA; 4 GB VRAM), 8 GB of system RAM, and an Intel Core i5-10300H central processing unit (CPU) was used only for the low-compute inference benchmark reported in Section 3.

2.3.2. Training Configuration

To compare architectural effects under a consistent protocol, all networks were trained from scratch rather than initialized with pretrained weights. Input images were standardized to a spatial resolution of 640 × 640 pixels. The detailed configuration of the unified training hyperparameters is summarized in Table 2.
As outlined in Table 2, the AdamW optimizer was used with a Cosine Annealing scheduler to reduce the risk of premature convergence to local minima. Weight decay was applied to suppress overfitting to complex background responses such as water reflections and soil. Training was capped at 300 epochs, with a 50-epoch early-stopping criterion monitored via the validation loss. Each principal model was trained under three random seeds (0, 1, and 2), and the main tables report the averaged values after rounding to two decimal places. This from-scratch protocol supports controlled comparison among architectures, although it does not claim to reproduce the best possible pretrained configuration of every baseline.

2.3.3. Evaluation Metrics

To quantify Panicle-DETR performance within unstructured agricultural settings, we used an evaluation framework covering detection capability, localization accuracy, and single-frame agronomic counting accuracy.
(1)
Fundamental Detection Metrics
Because missed panicles can compromise yield-related estimates, we prioritized Precision (P), Recall (R), and the F 1 -score. Precision quantifies the proportion of predicted detections that are correct, Recall evaluates the model’s capacity to retrieve annotated panicles, and the F 1 -score is the harmonic mean of Precision and Recall. Here, T P , F P , and F N denote true positives, false positives, and false negatives, respectively. The corresponding formulations are:
P = T P T P + F P × 100 %
R = T P T P + F N × 100 %
F 1 = 2 × P × R P + R
Here, true positives are accurately localized panicles, false positives are background artifacts incorrectly classified as targets, and false negatives are ground-truth panicles overlooked by the detector.
(2)
Comprehensive Accuracy Metrics
Following Common Objects in Context (COCO)-style evaluation protocols, mean average precision (mAP) was adopted as the primary overall metric. It aggregates average precision ( A P ) over the entire precision–recall trajectory. The definitions are expressed as:
A P = 0 1 P ( R ) d R , m A P = 1 N i = 1 N A P i
In this context, N denotes the total number of classes (with N = 1 for the single-class panicle task). We reported mAP 50 (at an Intersection over Union threshold of 0.5) to characterize general detection performance. We also reported mAP 50 95 , averaged across IoU thresholds from 0.5 to 0.95 in 0.05 increments, to examine bounding box regression under stricter boundary constraints.
(3)
Single-Frame Agronomic Counting Metrics
To assess image-level counting accuracy, single-frame panicle counts were evaluated by measuring the deviation between the model predictions ( C pred ) and the manual ground-truth annotations ( C gt ). For each image, C pred was defined as the number of valid predicted panicle boxes after confidence filtering and duplicate removal within that image, and C gt was defined as the number of manually annotated panicle instances. This image-level evaluation does not perform cross-frame target association and therefore should not be interpreted as a continuous video-tracking or video-level duplicate-count removal experiment. The evaluation used Mean Absolute Error (MAE), Root Mean Square Error (RMSE), and the Coefficient of Determination ( R 2 ):
M A E = 1 n i = 1 n | C pred , i C gt , i |
R M S E = 1 n i = 1 n ( C pred , i C gt , i ) 2
R 2 = 1 i = 1 n ( C gt , i C pred , i ) 2 i = 1 n ( C gt , i C ¯ gt ) 2
where n indicates the number of test images, and C ¯ gt is the empirical mean of the ground-truth panicle counts. Lower MAE and RMSE indicate lower counting error, whereas an R 2 value approaching unity indicates stronger agreement between predicted and ground-truth image-level counts.
(4)
Repeated-Run Variability Evaluation
To characterize training-run variability, Panicle-DETR and three representative baselines, YOLOv8m, YOLOv12m, and RT-DETR-r18, were trained under three random seeds (0, 1, and 2) using the same data split, optimization schedule, and evaluation protocol. The repeated-run results are reported as mean ± standard deviation (SD). Because only three seeds were available, these repeated runs were used as an exploratory robustness check rather than as a formal statistical significance test.

3. Results

3.1. Ablation Study of Engineered Innovations

To quantify the contribution of each architectural component, we conducted a combinatorial ablation study. The evaluated components were the FasterFD backbone, the Bidirectional Feature Pyramid Network (BiFPN), and the composite bounding box regression loss (NWD + Inner-IoU). Computational complexity is reported as giga floating-point operations (GFLOPs). As detailed in Table 3, the RT-DETR-r18 baseline was augmented with individual modules and pairwise combinations to assess their effects on localization accuracy and computational cost.
The ablation results show that FasterFD reduced computational demand relative to the RT-DETR-r18 baseline. Model 1 decreased GFLOPs by 26.5% (from 56.9 to 41.8) and increased mAP@50 from 92.45% to 92.95%. This pattern is consistent with the intended role of frequency-aware feature extraction, which reduces redundant background responses while preserving panicle-related texture information.
The LFE module improved recall and mAP@50, but increased computation when used alone. Model 2 reached 93.20% mAP@50 and 87.60% Recall, while GFLOPs increased to 64.7. This result is consistent with the role of Space-to-Depth mapping and bidirectional fusion in retaining fine spatial information. When LFE was combined with FasterFD (Model 4), GFLOPs decreased to 53.0 and mAP@50 reached 93.60%, indicating that the two modules partly offset each other’s accuracy–computation trade-offs.
The composite loss (NWD + Inner-IoU) was designed to improve boundary refinement for dense clusters without adding inference-time cost. When applied alone (Model 3), the gain was small, with mAP@50 reaching 92.55%. In the complete architecture, however, the composite loss increased Precision to 90.97% and mAP@50 to 93.94%. This indicates that distributional similarity and inner-boundary optimization are most useful when supported by more informative scale-aware features.

3.1.1. Focused Ablation of the Composite Loss

To isolate the contribution of each component in the composite regression loss, we conducted a focused ablation study using the same Panicle-DETR architecture while changing only the bounding-box regression loss. Table 4 compares NWD alone, Inner-IoU alone, and the combined NWD + Inner-IoU loss. This analysis complements the combinatorial ablation in Table 3 by testing whether the final gain depends on coupling distribution-sensitive tiny-object regression with inner-boundary refinement.
The focused comparison indicates that NWD and Inner-IoU contribute complementary effects to bounding-box regression. NWD alone reached 93.42% mAP@50, consistent with reduced sensitivity to small coordinate shifts. Inner-IoU alone achieved 72.25% mAP@75, consistent with improved boundary refinement for overlapping targets. Combining the two losses produced the strongest performance in this comparison, with 90.97% Precision, 88.33% Recall, 93.94% mAP@50, and 64.75% mAP@50–95.

3.1.2. Comparative Analysis of Backbone Architectures

To evaluate the FasterFD design, we benchmarked it against several vision backbones within the same Panicle-DETR framework, using the same BiFPN encoder and composite loss, as summarized in Table 5. The compared backbones included parameter-heavy architectures (ResNet-50 [37], HGNetv2-L [28]), lightweight networks (MobileNetV3 [38], StarNet [39]), and efficient models (FasterNet [31], EfficientNetV2 [40]). We also evaluated a C2f-FasterNet variant that replaces C2f-FasterFD with a purely spatial partial-convolution block while retaining the same macro-architecture, BiFPN encoder, and composite loss.
Compared with ResNet-50, FasterFD achieved a slightly higher mAP@50 (93.94% versus 93.71%) with lower computation (53.0 versus 108.5 GFLOPs). Lightweight networks such as StarNet and MobileNetV3 had smaller computational footprints (40.0 and 47.7 GFLOPs), but lower mAP@50 values of 91.82% and 90.50%, respectively.
Compared with the original FasterNet architecture, which relies on spatial-domain partial convolutions and used 41.5 GFLOPs, FasterFD increased mAP@50 by 1.08 percentage points. The controlled C2f-FasterNet comparison further shows that replacing C2f-FasterFD with a spatial-only partial-convolution block lowered mAP@50 from 93.94% to 93.28%, while reducing GFLOPs from 53.0 to 48.6. This result indicates that the gain is associated not only with partial-convolution efficiency, but also with the frequency-aware reweighting used in C2f-FasterFD.

3.2. Comparative Experiments on the Composite Dataset

We then compared Panicle-DETR with representative detection architectures on the composite dataset. The evaluation integrates detection metrics, single-frame counting accuracy, and qualitative visual assessment.

3.2.1. Quantitative Detection Performance and Training Dynamics

Detection performance and complexity metrics for representative baseline models are presented in Table 6, including RT-DETR-r18 as the direct baseline for Panicle-DETR. A separate comparison with the RT-DETR family is provided in Table 7 to isolate the effect of increasing RT-DETR backbone capacity.
For overall detection performance, Panicle-DETR achieved 90.97% Precision and 89.63% F 1 -score, outperforming the representative baseline models in Table 6. On mAP@50, the proposed model reached 93.94%, while using 13.78 M parameters and 53.0 GFLOPs.
Within the RT-DETR family, increasing backbone capacity from r18 to r34 and r50 improved detection metrics, but the gain came with higher computation. GFLOPs increased from 56.9 in RT-DETR-r18 to 90.6 in RT-DETR-r34 and 134.8 in RT-DETR-r50. Panicle-DETR produced the highest mAP@50, mAP@75, and mAP@50–95 values in this focused comparison while using fewer parameters and lower GFLOPs than all three RT-DETR variants.
The difference was more pronounced under stricter overlap thresholds. Panicle-DETR achieved 74.15% mAP@75 and 64.75% mAP@50–95. These results are consistent with the role of the combined NWD and Inner-IoU loss in improving bounding box regression for irregular panicle boundaries.

3.2.2. Repeated-Run Variability Analysis

Table 8 summarizes the repeated-run results across three random seeds for Panicle-DETR and the representative baselines.
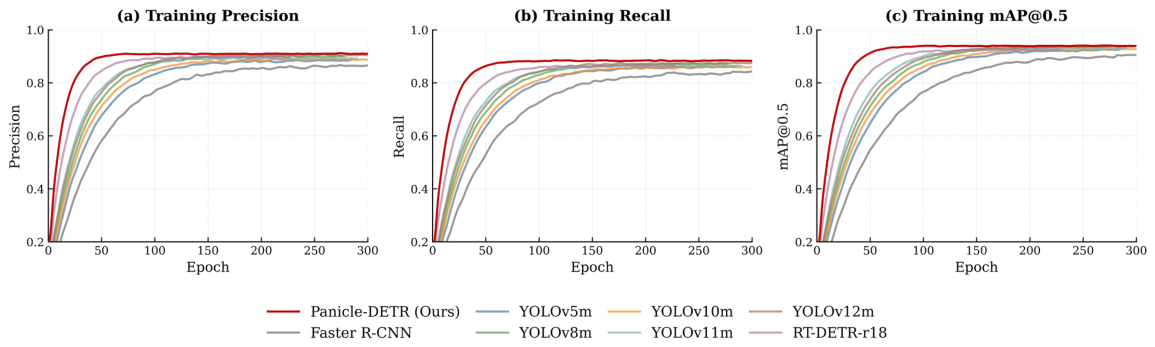
In addition to final accuracy, we examined the training trajectories of Precision, Recall, and mAP@50 in Figure 7. Most models showed rapid improvement during the early training stage and then gradually approached a plateau. Panicle-DETR reached a high-performance region earlier than the representative baselines and maintained competitive values during the later epochs.
The convergence curves indicate that Panicle-DETR achieved strong final performance while retaining a smooth overall optimization trajectory. Faster R-CNN improved more slowly and reached a lower plateau, whereas several YOLO variants converged rapidly but remained slightly below Panicle-DETR in at least one of the three metrics. RT-DETR-r18 showed competitive early optimization, but its final mAP@50 and Recall were lower than those of Panicle-DETR. This curve-level comparison is used to describe training behavior rather than to claim uniformly smaller random fluctuation than all baselines.

3.2.3. Low-Compute Notebook Inference Evaluation

To add data-backed, hardware-aware evidence about resource-constrained field-side inference without making unsupported claims about onboard deployment, a low-compute notebook benchmark was conducted on the battery-powered notebook described in Section 2.3.1. The notebook was disconnected from external power during testing to approximate a resource-constrained field-side operating condition. Unless otherwise stated, the benchmark used a batch size of 1 and the same 640 × 640 input resolution as the main desktop evaluation. All models were evaluated under the same PyTorch 32-bit floating-point (FP32) runtime without TensorRT, 8-bit integer (INT8) quantization, or hardware-specific acceleration. The inference evaluation reports single-image latency, frames per second (FPS), peak GPU memory, and peak system memory usage, thereby complementing the theoretical complexity metrics with hardware-aware evidence.
As summarized in Table 9, Panicle-DETR achieved 16.9 FPS with 59.1 ms single-image latency on the battery-powered GTX 1650 notebook under PyTorch FP32 evaluation. Although YOLOv12m was the fastest evaluated model (19.9 FPS), Panicle-DETR required the lowest peak GPU memory (1.96 GB) and was faster and more memory efficient than RT-DETR-r18 while maintaining higher detection and counting accuracy.
This low-compute benchmark distinguishes model compactness from practical inference behavior under constrained hardware. Parameter count and GFLOPs indicate theoretical efficiency, whereas latency, FPS, and memory usage determine whether the model can be used on portable field-side computers. Because no UAV-mounted computer was used in this study, the results should be interpreted as evidence of notebook-based field-side inference efficiency rather than direct validation of onboard UAV deployment.

3.2.4. Agronomic Counting Accuracy and Consistency

In high-throughput phenotypic analysis, detection confidence alone may not fully reflect the reliability of panicle counting. Panicle counting errors were therefore evaluated to assess image-level count consistency, as summarized in Table 10.
Panicle-DETR achieved a Mean Absolute Error of 4.28 and a Root Mean Square Error of 8.57. YOLOv8m [43] and YOLOv12m [45] showed strong detection performance, but their counting errors were higher, with Mean Absolute Errors of 5.05 and 4.85, respectively. This difference is consistent with the role of adaptive multi-scale fusion in preserving micro-target boundaries in dense and adherent panicles, thereby reducing false merging and missed detections.
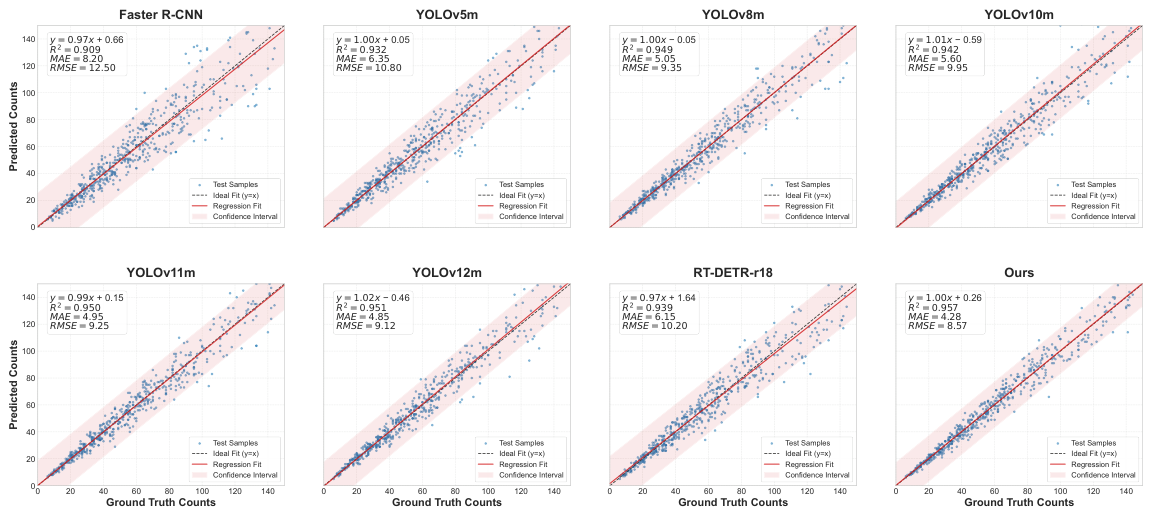
Linear regression scatter plots of predicted counts versus ground-truth counts were used to examine count consistency across density levels. In Figure 8, Faster R-CNN [41] and YOLOv5m [42] showed larger dispersion when the ground-truth count exceeded 60 panicles per image. Panicle-DETR predictions remained closer to the regression line, including in high-density images containing more than 100 panicles. With an R 2 of 0.957, the model improved agreement between predicted and ground-truth single-frame counts. This result supports image-level panicle-density assessment, although field-scale yield estimation would still require calibration against plot-level yield measurements.

3.2.5. Qualitative Visual Validation Across Altitudes

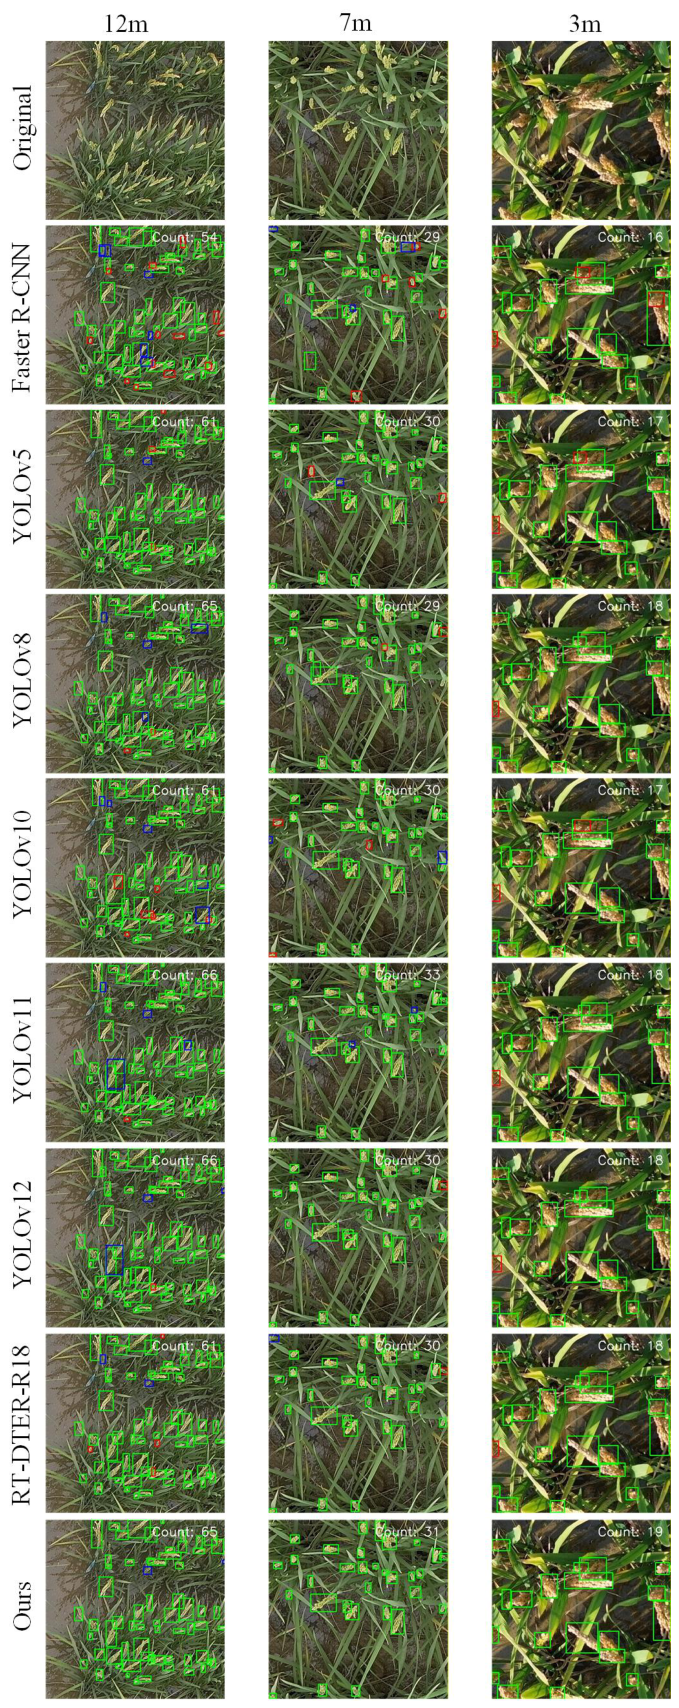
To complement the quantitative metrics, qualitative visual assessment was conducted across UAV flight altitudes. Figure 9 compares representative baseline outputs with Panicle-DETR outputs at altitudes of 12 m, 7 m, and 3 m, arranged from left to right.
Visual comparisons indicate that flight altitude strongly affects panicle appearance. At 12 m, spatial downsampling causes micro-targets to blend into the field background. Several baseline models produced more false negatives in these regions, whereas Panicle-DETR detected more of the small panicle targets. This observation is consistent with the role of the Lossless Feature Encoder in preserving high-altitude micro-panicle information.
At 7 m, dense adherent panicles increased the risk of bounding box merging and grouped false negatives. Panicle-DETR more clearly separated several adherent clusters, consistent with the use of NWD and Inner-IoU for dense target regression. At 3 m, the narrow field of view introduced truncated border targets and visually ambiguous panicles. Panicle-DETR produced more correct detections in these cases, although missed detections remained under strong occlusion and weak target contrast.

3.3. Error Analysis and Model Limitations

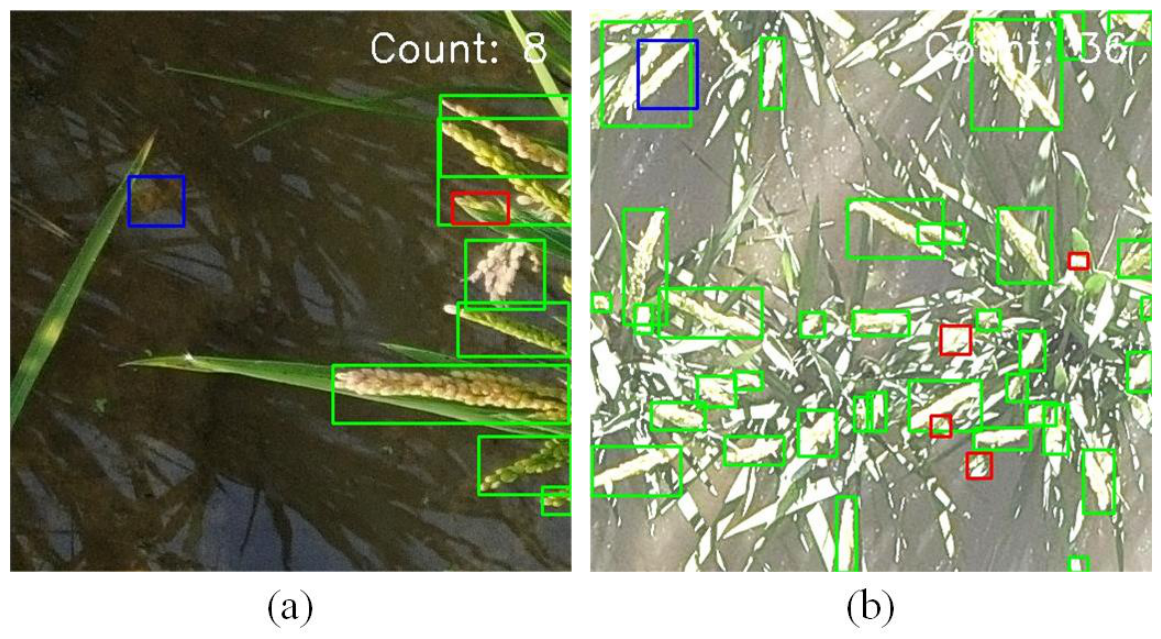
Error analysis was conducted to identify the practical limitations of Panicle-DETR in unstructured agricultural environments. Representative failure cases are shown in Figure 10.
One failure mode, shown in panel (a), involves reflections on the water surface within irrigated paddies. Specular reflections of the sky or dense foliage can resemble panicle texture under specific solar angles, occasionally triggering false positives. Severe physical occlusion is another source of error. When a panicle is almost entirely masked by broad flag leaves, its textural and geometric cues can be too weak for reliable detection, leading to false negatives.
Strong illumination saturation also caused detection failures, as observed in panel (b). Under peak solar intensity, high brightness reduced the contrast between panicles and background regions. This led to missed detections when target texture was washed out and to false positives when overexposed background elements, such as withered leaves, were assigned high objectness scores. These limitations indicate that purely RGB-based detectors remain sensitive to illumination and occlusion, motivating future work on multi-sensor fusion or illumination-invariant augmentation.

4. Discussion

Deploying deep learning models for UAV-based high-throughput phenotyping remains difficult because open-field imagery varies in altitude, illumination, occlusion, background reflection, and available computation. The results of this study suggest that Panicle-DETR can address part of this problem by combining frequency-aware feature extraction, spatial-preserving feature fusion, and dense-target regression. The evidence is strongest for the composite multi-altitude image dataset and the notebook-based inference benchmark used here.

4.1. Addressing the Spatial–Semantic Trade-Off in Multi-Altitude Phenotyping

One motivation for the architecture was the feature degradation observed under UAV altitude variation from 3 m to 20 m. As noted in recent evaluations of small-object detection in aerial imagery [46], standard strided convolutions can substantially reduce the pixel footprint of high-altitude micro-targets. In this study, architectures such as YOLOv12m achieved strong accuracy overall, but their errors were more evident in higher-altitude and dense-canopy examples.
The Lossless Feature Encoder is intended to mitigate this vulnerability by embedding Space-to-Depth mapping within the BiFPN topology. This design reduces information loss during downsampling and fuses fine-grained micro-panicle textures into deeper semantic layers, including high-altitude views from 12 m to 20 m. The results suggest that multi-scale robustness in precision agriculture benefits from explicit spatial preservation, especially around panicle boundary regions [47].

4.2. Linking Detection Accuracy to Image-Level Panicle Counting

In digital agriculture, panicle detection is most useful when it provides count information that can support downstream phenotyping. Many agricultural vision studies rely mainly on mean average precision, which may not fully reveal counting errors for traits such as panicle number per unit area [48].
The scatter plots showed larger count dispersion in several baseline models when the true count exceeded 60 panicles per image. This pattern is consistent with detection failures in dense and adherent clusters. By combining distributional similarity with inner-boundary refinement, Panicle-DETR reduced image-level counting error. This supports the view that loss functions should reflect the morphology of dense crop targets when object detection is used for phenotyping [49]. However, the present counting analysis is image-based. It does not yet establish plot-level yield prediction or video-level duplicate removal.

4.3. Engineering Viability and Low-Compute Inference Trade-Offs

For field-side agricultural phenotyping, near-real-time processing requires computational efficiency. Heavy backbones such as ResNet-50 can exceed 100 GFLOPs, whereas lightweight networks may lose accuracy in complex backgrounds. The results therefore point to a trade-off between model compactness and feature discrimination.
The FasterFD backbone represents one way to manage this trade-off. By using frequency-domain representations with learnable frequency-response reweighting, the network reduces redundant spatial computation and enhances panicle-related texture cues. Panicle-DETR operated at 53.0 GFLOPs with 13.78 M parameters and achieved 93.94% mAP@50. The low-compute notebook benchmark in Table 9 further shows that Panicle-DETR reached 16.9 FPS on a battery-powered GTX 1650 4 GB notebook while requiring 1.96 GB peak GPU memory. This provides hardware-aware evidence for resource-constrained field-side inference, but it does not replace validation on UAV-mounted computing platforms.

4.4. Limitations and Future Work

Several limitations remain. First, the current dataset primarily contains images acquired under adequate daytime illumination, and performance under low light, strong glare, or adverse weather needs further validation. Second, 3 m ultra-low-altitude images may be affected by rotor-induced airflow, wind-driven panicle motion, and dynamic occlusion. Although severely blurred frames were excluded during preprocessing, manual frame exclusion is not sufficient for continuous field operation. In addition, patch-based processing may truncate targets near patch borders and reduce wider contextual information, although this limitation was partly controlled through visual quality filtering and annotation review. Future work should include overlapping tiles, context-preserving inference, video-based quality control, temporal detection, deblurring, or target tracking to improve robustness under dynamic motion blur and edge-context loss.
Third, the current counting evaluation is image-based and does not perform cross-frame target association. Continuous video counting would require an additional tracking module to avoid repeated counts of the same panicle. Finally, the hardware-aware inference evaluation was conducted on a battery-powered low-compute notebook rather than on an actual UAV-mounted computer. The reported latency and memory results should therefore be interpreted as a proxy for resource-constrained field-side inference efficiency, not as direct evidence of onboard UAV deployment. Future research should examine portable-hardware benchmarking, model quantization, and flight-time validation while evaluating trade-offs among latency, power consumption, and multi-altitude counting accuracy.

5. Conclusions

This study introduces Panicle-DETR for rice panicle detection and counting in multi-altitude UAV imagery. The framework addresses constrained field-side computation and spatial variability by combining frequency-aware feature extraction, spatial-preserving multi-scale fusion, and a dense-target regression loss. The FasterFD backbone uses frequency-domain representations with learnable frequency-response reweighting to enhance panicle-related texture cues. The Lossless Feature Encoder reduces information loss during downsampling, while the NWD and Inner-IoU composite loss improves regression for dense panicle clusters.
On the composite multi-altitude dataset, Panicle-DETR achieved 93.94% mAP@50 and reduced the single-frame counting Mean Absolute Error to 4.28. This performance was obtained with 53.0 GFLOPs and 13.78 M parameters. In the battery-powered low-compute notebook benchmark, the model reached 16.9 FPS with 1.96 GB peak GPU memory and 5.2 GB peak system memory usage. These results support the potential of Panicle-DETR for resource-constrained field-side UAV image analysis, while onboard UAV deployment remains to be validated on dedicated edge hardware under real flight conditions. Future work should further validate continuous video counting, dynamic motion-blur robustness, and cross-region and cross-variety generalization.


Author Contributions

Conceptualization, J.Z. and Y.C.; methodology, J.Z., Y.C. and J.J.; software, J.Z., Y.C. and S.H.; validation, J.Z., Y.C., J.J., X.Z. and W.H.; formal analysis, J.Z. and Y.C.; investigation, J.Z., Y.C. and X.Z.; resources, Y.C.; data curation, J.Z., J.J. and W.H.; writing—original draft preparation, J.Z.; writing—review and editing, Y.C., S.H., X.Z. and W.H.; visualization, J.Z. and Y.C.; supervision, Y.C.; project administration, Y.C. All authors have read and agreed to the published version of the manuscript.

Funding

This research was funded by the Jiangxi Provincial Natural Science Foundation, grant number 20252BAC240198.

Institutional Review Board Statement

Not applicable.

Informed Consent Statement

Not applicable.

Data Availability Statement

The data presented in this study are available on request from the corresponding author.

Conflicts of Interest

The authors declare no conflicts of interest.

References

  1. Madec, S.; Jin, X.; Lu, H.; De Solan, B.; Liu, S.; Duyme, F.; Heritier, E.; Baret, F. Ear density estimation from high resolution RGB imagery using deep learning technique. Agric. For. Meteorol. 2019, 264, 225–234. [Google Scholar] [CrossRef] [Scilit]
  2. Ampatzidis, Y.; Partel, V. UAV-based high throughput phenotyping in citrus utilizing multispectral imaging and artificial intelligence. Remote Sens. 2019, 11, 410. [Google Scholar] [CrossRef] [Scilit]
  3. Chen, R.; Lu, H.; Wang, Y.; Tian, Q.; Zhou, C.; Wang, A.; Feng, Q.; Gong, S.; Zhao, Q.; Han, B. High-throughput UAV-based rice panicle detection and genetic mapping of heading-date-related traits. Front. Plant Sci. 2024, 15, 1327507. [Google Scholar] [CrossRef] [Scilit] [PubMed]
  4. Huang, J.; Wang, S.; Pei, Y.; Yin, Q.; Ding, Z.; Wang, J.; Wang, W.; Zhou, G.; Huo, Z. Estimate the Pre-Flowering Specific Leaf Area of Rice Based on Vegetation Indices and Texture Indices Derived from UAV Multispectral Imagery. Agriculture 2025, 15, 2293. [Google Scholar] [CrossRef] [Scilit]
  5. Bukowiecki, J.; Rose, T.; Kage, H. Sentinel-2 Data for Precision Agriculture?—A UAV-Based Assessment. Sensors 2021, 21, 2861. [Google Scholar] [CrossRef] [Scilit] [PubMed]
  6. Zhou, C.; Ye, H.; Hu, J.; Shi, X.; Hua, S.; Yue, J.; Xu, Z.; Yang, G. Automated counting of rice panicle by applying deep learning model to images from unmanned aerial vehicle platform. Sensors 2019, 19, 3106. [Google Scholar] [CrossRef] [Scilit] [PubMed]
  7. Guo, W.; Fukatsu, T.; Ninomiya, S. Automated characterization of flowering dynamics in rice using field-acquired time-series RGB images. Plant Methods 2015, 11, 7. [Google Scholar] [CrossRef] [Scilit] [PubMed]
  8. Shen, J.; Yue, J.; Liu, Y.; Yao, Y.; Feng, H.; Yang, H.; Guo, W.; Ma, X.; Fu, Y.; Shu, M.; et al. Analyzing maize stem circumference, stem height, and stem circumference-to-height ratio using UAV, UGV, and deep learning. Comput. Electron. Agric. 2025, 239, 111019. [Google Scholar] [CrossRef] [Scilit]
  9. Yuan, Z.; Gong, J.; Guo, B.; Wang, C.; Liao, N.; Song, J.; Wu, Q. Small Object Detection in UAV Remote Sensing Images Based on Intra-Group Multi-Scale Fusion Attention and Adaptive Weighted Feature Fusion Mechanism. Remote Sens. 2024, 16, 4265. [Google Scholar] [CrossRef] [Scilit]
  10. Chen, Y.; Xin, R.; Jiang, H.; Liu, Y.; Zhang, X.; Yu, J. Refined feature fusion for in-field high-density and multi-scale rice panicle counting in UAV images. Comput. Electron. Agric. 2023, 211, 108032. [Google Scholar] [CrossRef] [Scilit]
  11. Heng, Z.; Xie, Y.; Du, D. MIE-YOLO: A Multi-Scale Information-Enhanced Weed Detection Algorithm for Precision Agriculture. AgriEngineering 2026, 8, 16. [Google Scholar] [CrossRef] [Scilit]
  12. Oliveira, T.C.M.; Souza, J.B.C.; Almeida, S.L.H.; Filho, A.L.D.B.; Silva, R.H.D.S.; Carneiro, F.M.; da Silva, R.P. Combining Artificial Intelligence and Remote Sensing to Enhance the Estimation of Peanut Pod Maturity. AgriEngineering 2025, 7, 368. [Google Scholar] [CrossRef] [Scilit]
  13. Zhang, Y.; Xiao, D.; Liu, Y.; Wu, H. An algorithm for automatic identification of multiple developmental stages of rice spikes based on improved Faster R-CNN. Crop J. 2022, 10, 1323–1333. [Google Scholar] [CrossRef] [Scilit]
  14. Tanimoto, Y.; Zhang, Z.; Yoshida, S. Object Detection for Yellow Maturing Citrus Fruits from Constrained or Biased UAV Images: Performance Comparison of Various Versions of YOLO Models. AgriEngineering 2024, 6, 4308–4324. [Google Scholar] [CrossRef] [Scilit]
  15. Rodríguez-Lira, D.-C.; Córdova-Esparza, D.-M.; Álvarez-Alvarado, J.M.; Romero-González, J.-A.; Terven, J.; Rodríguez-Reséndiz, J. Comparative Analysis of YOLO Models for Bean Leaf Disease Detection in Natural Environments. AgriEngineering 2024, 6, 4585–4603. [Google Scholar] [CrossRef] [Scilit]
  16. Wu, H.; Guan, M.; Chen, J.; Pan, Y.; Zheng, J.; Jin, Z.; Li, H.; Tan, S. OE-YOLO: An EfficientNet-Based YOLO Network for Rice Panicle Detection. Plants 2025, 14, 1370. [Google Scholar] [CrossRef] [Scilit] [PubMed]
  17. Huang, D.; Chen, Z.; Zhuang, J.; Song, G.; Huang, H.; Li, F.; Huang, G.; Liu, C. DRPU-YOLO11: A Multi-Scale Model for Detecting Rice Panicles in UAV Images with Complex Infield Background. Agriculture 2026, 16, 234. [Google Scholar] [CrossRef] [Scilit]
  18. Wang, A.; Chen, H.; Liu, L.; Chen, K.; Lin, Z.; Han, J.; Ding, G. YOLOv10: Real-time end-to-end object detection. In Advances in Neural Information Processing Systems 37; NeurIPS: San Diego, CA, USA, 2024; Volume 37, pp. 107984–108011. [Google Scholar] [CrossRef] [Scilit]
  19. Guo, Y.; Zhan, W.; Zhang, Z.; Zhang, Y.; Guo, H. FRPNet: A Lightweight Multi-Altitude Field Rice Panicle Detection and Counting Network Based on Unmanned Aerial Vehicle Images. Agronomy 2025, 15, 1396. [Google Scholar] [CrossRef] [Scilit]
  20. Wu, P.; Zhao, J. LKD-YOLO: Improved YOLOv8 for Rice Panicle Detection in Drone Images. In Proceedings of the 2025 4th International Symposium on Computer Applications and Information Technology (ISCAIT), Xi’an, China, 21–23 March 2025; pp. 549–553. [Google Scholar]
  21. Liang, Y.; Li, H.; Wu, H.; Zhao, Y.; Liu, Z.; Liu, D.; Liu, Z.; Fan, G.; Pan, Z.; Shen, Z.; et al. A rotated rice spike detection model and a crop yield estimation application based on UAV images. Comput. Electron. Agric. 2024, 224, 109188. [Google Scholar] [CrossRef] [Scilit]
  22. Yao, M.; Li, W.; Chen, L.; Zou, H.; Zhang, R.; Qiu, Z.; Yang, S.; Shen, Y. Rice counting and localization in unmanned aerial vehicle imagery using enhanced feature fusion. Agronomy 2024, 14, 868. [Google Scholar] [CrossRef] [Scilit]
  23. Qian, Y.; Qin, Y.; Wei, H.; Lu, Y.; Huang, Y.; Liu, P.; Fan, Y. MFNet: Multi-scale feature enhancement networks for wheat head detection and counting in complex scene. Comput. Electron. Agric. 2024, 225, 109342. [Google Scholar] [CrossRef] [Scilit]
  24. Thayananthan, T.; Zhang, X.; Huang, Y.; Chen, J.; Wijewardane, N.K.; Martins, V.S.; Chesser, G.D.; Goodin, C.T. CottonSim: A vision-guided autonomous robotic system for cotton harvesting in Gazebo simulation. Comput. Electron. Agric. 2025, 239, 110963. [Google Scholar] [CrossRef] [Scilit]
  25. Lan, M.; Liu, C.; Zheng, H.; Wang, Y.; Cai, W.; Peng, Y.; Xu, C.; Tan, S. RICE-YOLO: In-field rice spike detection based on improved YOLOv5 and drone images. Agronomy 2024, 14, 836. [Google Scholar] [CrossRef] [Scilit]
  26. Cai, W.; Lu, K.; Fan, M.; Liu, C.; Huang, W.; Chen, J.; Wu, Z.; Xu, C.; Ma, X.; Tan, S. Rice growth-stage recognition based on improved YOLOv8 with UAV imagery. Agronomy 2024, 14, 2751. [Google Scholar] [CrossRef] [Scilit]
  27. Carion, N.; Massa, F.; Synnaeve, G.; Usunier, N.; Kirillov, A.; Zagoruyko, S. End-to-end object detection with transformers. In Proceedings of the European Conference on Computer Vision (ECCV), Glasgow, UK, 23–28 August 2020; pp. 213–229. [Google Scholar] [CrossRef] [Scilit]
  28. Zhao, Y.; Lv, W.; Xu, S.; Wei, J.; Wang, G.; Dang, Q.; Liu, Y.; Chen, J. DETRs beat YOLOs on real-time object detection. In Proceedings of the IEEE/CVF Conference on Computer Vision and Pattern Recognition (CVPR), Seattle, WA, USA, 17–21 June 2024; pp. 16965–16974. [Google Scholar] [CrossRef] [Scilit]
  29. Guo, Z.; Cai, D.; Jin, Z.; Xu, T.; Yu, F. Research on unmanned aerial vehicle (UAV) rice field weed sensing image segmentation method based on CNN-transformer. Comput. Electron. Agric. 2025, 229, 109719. [Google Scholar] [CrossRef] [Scilit]
  30. Teng, Z.; Chen, J.; Wang, J.; Wu, S.; Chen, R.; Lin, Y.; Shen, L.; Jackson, R.; Zhou, J.; Yang, C. Panicle-Cloud: An Open and AI-Powered Cloud Computing Platform for Quantifying Rice Panicles from Drone-Collected Imagery to Enable the Classification of Yield Production in Rice. Plant Phenomics 2023, 5, 0105. [Google Scholar] [CrossRef] [Scilit]
  31. Chen, J.; Kao, S.; He, H.; Zhuo, W.; Wen, S.; Lee, C.-H.; Chan, S.-H.G. Run, Don’t Walk: Chasing Higher FLOPS for Faster Neural Networks. In Proceedings of the IEEE/CVF Conference on Computer Vision and Pattern Recognition (CVPR), Vancouver, BC, Canada, 18–22 June 2023; pp. 12021–12031. [Google Scholar] [CrossRef] [Scilit]
  32. Chen, L.; Gu, L.; Li, L.; Yan, C.; Fu, Y. Frequency Dynamic Convolution for Dense Image Prediction. In Proceedings of the IEEE/CVF Conference on Computer Vision and Pattern Recognition (CVPR), Nashville, TN, USA, 11–15 June 2025. [Google Scholar] [CrossRef] [Scilit]
  33. Tan, M.; Pang, R.; Le, Q.V. EfficientDet: Scalable and Efficient Object Detection. In Proceedings of the IEEE/CVF Conference on Computer Vision and Pattern Recognition (CVPR), Seattle, WA, USA, 13–19 June 2020; pp. 10778–10787. [Google Scholar] [CrossRef] [Scilit]
  34. Sunkara, R.; Luo, T. No More Strided Convolutions or Pooling: A New CNN Building Block for Low-Resolution Images and Small Objects. In Machine Learning and Knowledge Discovery in Databases; Amini, M.R., Canu, S., Fischer, A., Guns, T., Kralj Novak, P., Tsoumakas, G., Eds.; Springer: Cham, Switzerland, 2023; Volume 13715, pp. 443–459. [Google Scholar] [CrossRef] [Scilit]
  35. Xu, C.; Wang, J.; Yang, W.; Yu, H.; Yu, L.; Xia, G.-S. Detecting tiny objects in aerial images: A normalized Wasserstein distance and a new benchmark. ISPRS J. Photogramm. Remote Sens. 2022, 190, 79–93. [Google Scholar] [CrossRef] [Scilit]
  36. Zhang, H.; Xu, C.; Zhang, S. Inner-IoU: More Effective Intersection over Union Loss with Auxiliary Bounding Box. arXiv 2023, arXiv:2311.02877. [Google Scholar]
  37. He, K.; Zhang, X.; Ren, S.; Sun, J. Deep Residual Learning for Image Recognition. In Proceedings of the IEEE Conference on Computer Vision and Pattern Recognition (CVPR), Las Vegas, NV, USA, 27–30 June 2016; pp. 770–778. [Google Scholar] [CrossRef] [Scilit]
  38. Howard, A.; Sandler, M.; Chu, G.; Chen, L.-C.; Chen, B.; Tan, M.; Wang, W.; Zhu, Y.; Pang, R.; Vasudevan, V.; et al. Searching for MobileNetV3. In Proceedings of the IEEE/CVF International Conference on Computer Vision (ICCV), Seoul, Republic of Korea, 27 October–2 November 2019; pp. 1314–1324. [Google Scholar] [CrossRef] [Scilit]
  39. Ma, X.; Dai, X.; Bai, Y.; Wang, Y.; Fu, Y. Rewrite the Stars. In Proceedings of the IEEE/CVF Conference on Computer Vision and Pattern Recognition (CVPR), Seattle, WA, USA, 17–21 June 2024; pp. 12051–12061. [Google Scholar] [CrossRef] [Scilit]
  40. Tan, M.; Le, Q.V. EfficientNetV2: Smaller Models and Faster Training. In Proceedings of the 38th International Conference on Machine Learning (ICML), Virtual Event, 18–24 July 2021; PMLR: London, UK, 2021; Volume 139, pp. 10096–10106. Available online: https://proceedings.mlr.press/v139/tan21a.html (accessed on 14 March 2026).
  41. Ren, S.; He, K.; Girshick, R.; Sun, J. Faster R-CNN: Towards Real-Time Object Detection with Region Proposal Networks. IEEE Trans. Pattern Anal. Mach. Intell. 2017, 39, 1137–1149. [Google Scholar] [CrossRef] [Scilit] [PubMed]
  42. Khanam, R.; Hussain, M. What is YOLOv5: A deep look into the internal features of the popular object detector. arXiv 2024, arXiv:2407.20892. [Google Scholar] [CrossRef] [Scilit]
  43. Yaseen, M. What is YOLOv8: An In-Depth Exploration of the Internal Features of the Next-Generation Object Detector. arXiv 2024, arXiv:2408.15857. [Google Scholar] [CrossRef] [Scilit]
  44. Khanam, R.; Hussain, M. YOLOv11: An Overview of the Key Architectural Enhancements. arXiv 2024, arXiv:2410.17725. [Google Scholar]
  45. Tian, Y.; Ye, Q.; Doermann, D. YOLOv12: Attention-Centric Real-Time Object Detectors. In Advances in Neural Information Processing Systems 38; NeurIPS: San Diego, CA, USA, 2025; Volume 38, pp. 78433–78457. Available online: https://proceedings.neurips.cc/paper_files/paper/2025/hash/7103444259031cc58051f8c9a4868533-Abstract-Conference.html (accessed on 14 March 2026).
  46. Nikouei, M.; Baroutian, B.; Nabavi, S.; Taraghi, F.; Aghaei, A.; Sajedi, A.; Ebrahimi Moghaddam, M. Small Object Detection: A Comprehensive Survey on Challenges, Techniques and Real-World Applications. Intell. Syst. Appl. 2025, 27, 200561. [Google Scholar] [CrossRef] [Scilit]
  47. Ramachandran, A.; Kumar, S. Border Sensitive Knowledge Distillation for Rice Panicle Detection in UAV Images. Comput. Mater. Contin. 2024, 81, 827–842. [Google Scholar] [CrossRef] [Scilit]
  48. Lu, X.; Shen, Y.; Xie, J.; Yang, X.; Shu, Q.; Chen, S.; Shen, Z.; Cen, H. Phenotyping of Panicle Number and Shape in Rice Breeding Materials Based on Unmanned Aerial Vehicle Imagery. Plant Phenomics 2024, 6, 0265. [Google Scholar] [CrossRef] [Scilit] [PubMed]
  49. Zhu, J.; Lin, Y.; Liu, Y.; Wang, H.; Qin, Y.; Li, M.; Xu, H.; He, Y. Intelligent agriculture: Deep learning in UAV-based remote sensing imagery for crop diseases and pests detection. Front. Plant Sci. 2024, 15, 1435016. [Google Scholar] [CrossRef] [Scilit] [PubMed]
Figure 1. Overview of the study area and UAV data acquisition. (a) Geographic location of the Gannan Red Seed Industry Rice Research Base in Jiangxi, China. The maps are displayed with longitude–latitude graticules in the WGS 84 geographic coordinate system (EPSG:4326). (b) Actual field conditions during the rice heading stage. (c) The DJI Mini 3 UAV used for 3 m ultra-low-altitude image acquisition.
Agriengineering 08 00294 g001
Figure 2. Workflow of the composite multi-altitude dataset construction.
Agriengineering 08 00294 g002
Figure 3. Examples of data augmentation strategies used in this study. (a) Geometric transformation (flipping); (b) Photometric distortion (brightness/contrast adjustment); (c) Noise injection.
Agriengineering 08 00294 g003
Figure 4. The overall network architecture of the proposed Panicle-DETR framework.
Agriengineering 08 00294 g004
Figure 5. Schematic diagram of the C2f-FasterFD module, illustrating the integration of Partial Convolution (PConv) and Frequency Dynamic Convolution (FDConv).
Agriengineering 08 00294 g005
Figure 6. The core components of the Lossless Feature Encoder (LFE). (a) Schematic diagram of the BiFPN structure, establishing bidirectional cross-scale connections; (b) Illustration of the Space-to-Depth Convolution (SPDConv) downsampling process, which reduces resolution while preserving spatial information by slicing spatial dimensions into the channel axis.
Agriengineering 08 00294 g006
Figure 7. Training curves of Precision, Recall, and mAP@50 for Panicle-DETR and representative baseline models. The curves summarize the optimization trajectories across the training schedule and are used to compare convergence behavior among models.
Agriengineering 08 00294 g007
Figure 8. Linear regression scatter plots of ground truth versus predicted panicle counts for all evaluated models.
Agriengineering 08 00294 g008
Figure 9. Qualitative detection results of representative models across varying flight altitudes. Green boxes denote true-positive detections, red boxes denote false negatives (missed panicles), and blue boxes denote false-positive detections.
Agriengineering 08 00294 g009
Figure 10. Representative failure modes of Panicle-DETR. Green boxes denote true-positive detections, red boxes denote false negatives (missed panicles), and blue boxes denote false-positive detections. (a) False positives from specular water reflections and false negatives due to severe flag leaf occlusion. (b) Detection failures under extreme solar illumination resulting in texture washout.
Agriengineering 08 00294 g010
Table 1. Composite dataset split with altitude-stratified image counts and panicle-instance totals.
SubsetImages by AltitudeTotalBoxes
3 m 7 m 12 m 20 m
Training51722866023343739163,906
Validation653811005660227,503
Test641140302168167478,478
Total646380710045586015269,887
Table 2. Detailed configuration of the unified training hyperparameters.
ParameterValue/Description
Input Resolution 640 × 640 pixels
OptimizerAdamW
Initial Learning Rate 1 × 10 3 (0.001)
Momentum0.9
Batch Size16
Total Epochs300
Learning Rate SchedulerCosine Annealing
Early Stopping Patience50 epochs
Weight Decay 1 × 10 4 (0.0001)
Repeated Runs3 random seeds (0, 1, and 2)
Table 3. Combinatorial ablation study isolating the performance impact and computational overhead of individual modules within the Panicle-DETR architecture.
VariantBaseline+FasterFD+LFE+LossPrecision (%)Recall (%)mAP@50 (%)GFLOPs
Baseline 89.5386.3792.4556.9
Model 1 89.8086.8092.9541.8
Model 2 89.7087.6093.2064.7
Model 3 89.6586.4592.5556.9
Model 4 90.4088.0093.6053.0
Model 5 90.0586.8593.0541.8
Model 6 89.9087.7593.3064.7
Panicle-DETR90.9788.3393.9453.0
Note: Bold font identifies the proposed configuration and its reported results; additional bold values indicate the best result in the corresponding column.
Table 4. Focused ablation of bounding-box regression losses under the same Panicle-DETR architecture.
Regression LossPrecision (%)Recall (%)mAP@50 (%)mAP@75 (%)mAP@50–95 (%)
NWD only90.4687.7193.4272.0263.38
Inner-IoU only90.3887.6493.3572.2563.21
NWD + Inner-IoU90.9788.3393.9474.1564.75
Note: Bold font identifies the proposed configuration and its reported results.
Table 5. Performance comparison across different backbone feature extraction networks. All candidates use the same LFE encoder and composite loss for fair evaluation.
Backbone/Block DesignPrecision (%)Recall (%)mAP@50 (%)GFLOPs
ResNet-50 [37]90.6787.7993.71108.5
HGNetv2-L [28]90.0887.2393.2274.2
MobileNetV3 [38]87.8284.1390.5047.7
FasterNet [31]89.4786.8392.8641.5
C2f-FasterNet90.2287.5293.2848.6
StarNet [39]88.4885.1091.8240.0
EfficientNetV2 [40]89.2386.8192.7949.5
FasterFD (Ours)90.9788.3393.9453.0
Note: Bold font identifies the proposed method and its reported results; additional bold values indicate the best result in the corresponding column.
Table 6. Quantitative comparison of detection performance and computational complexity among representative baseline models.
ModelP (%)R (%) F 1 (%)mAP@50 (%)mAP@75 (%)mAP@50–95 (%)Params (M)GFLOPs
Faster R-CNN [41]86.5084.1985.3390.5266.7858.9341.35180.6
YOLOv5m [42]88.5286.0887.2892.5070.8362.1225.0564.0
YOLOv8m [43]90.1387.1788.6393.6571.5062.8125.8478.7
YOLOv10m [18]88.8185.9187.3492.6870.9262.3116.4563.4
YOLOv11m [44]89.2286.4987.8393.1371.7763.3819.6965.6
YOLOv12m [45]90.4887.5088.9793.7972.5263.8719.5458.6
RT-DETR-r18 [28]89.5386.3787.9292.4568.1260.4819.8756.9
Panicle-DETR (Ours)90.9788.3389.6393.9474.1564.7513.7853.0
Note: Bold font identifies the proposed method and its reported results.
Table 7. Focused comparison with RT-DETR variants under the same evaluation protocol.
ModelP (%)R (%) F 1 (%)mAP@50 (%)mAP@75 (%)mAP@50–95 (%)Params (M)GFLOPs
RT-DETR-r18 [28]89.5386.3787.9292.4568.1260.4819.8756.9
RT-DETR-r34 [28]90.2287.3188.7493.2671.3563.1831.2590.6
RT-DETR-r50 [28]90.5887.7289.1393.6172.0863.8642.80134.8
Panicle-DETR (Ours)90.9788.3389.6393.9474.1564.7513.7853.0
Note: Bold font identifies the proposed method and its reported results.
Table 8. Repeated-run variability across three random seeds. Values are reported as mean ± SD.
ModelP (%)R (%)mAP@50 (%)mAP@75 (%)mAP@50–95 (%)
YOLOv8m [43]90.13 ± 0.1687.17 ± 0.1893.65 ± 0.1071.50 ± 0.2562.81 ± 0.22
YOLOv12m [45]90.48 ± 0.0987.50 ± 0.1393.79 ± 0.0672.52 ± 0.1963.87 ± 0.15
RT-DETR-r18 [28]89.53 ± 0.2086.37 ± 0.1692.45 ± 0.1468.12 ± 0.2260.48 ± 0.18
Panicle-DETR (Ours)90.97 ± 0.1488.33 ± 0.1793.94 ± 0.0874.15 ± 0.2364.75 ± 0.17
Note: Bold font identifies the proposed method and its reported results.
Table 9. Low-compute notebook GPU inference benchmark for representative detectors. The benchmark was conducted on a battery-powered notebook with an NVIDIA GeForce GTX 1650 GPU (NVIDIA Corporation, Santa Clara, CA, USA; 4 GB VRAM), 8 GB RAM, and an Intel Core i5-10300H CPU using batch size 1 and 640 × 640 input resolution.
ModelParams (M)GFLOPsLatency (ms) ↓FPS ↑GPU Memory (GB) ↓RAM (GB) ↓
YOLOv8m [43]25.8478.756.417.72.385.6
YOLOv12m [45]19.5458.650.219.92.115.4
RT-DETR-r18 [28]19.8756.970.814.12.645.9
Panicle-DETR (Ours)13.7853.059.116.91.965.2
Note: Bold font identifies the proposed method and its reported results. ↑ indicates that a higher value represents better performance, whereas ↓ indicates that a lower value represents better performance.
Table 10. Evaluation of panicle counting performance across different models.
ModelMAE ↓RMSE ↓ R 2
Faster R-CNN [41]8.2012.500.909
YOLOv5m [42]6.3510.800.932
YOLOv8m [43]5.059.350.949
YOLOv10m [18]5.609.950.942
YOLOv11m [44]4.959.250.950
YOLOv12m [45]4.859.120.951
RT-DETR-r18 [28]6.1510.200.939
Panicle-DETR (Ours)4.288.570.957
Note: Bold font identifies the proposed method and its reported results. ↑ indicates that a higher value represents better performance, whereas ↓ indicates that a lower value represents better performance.
Disclaimer/Publisher’s Note: The statements, opinions and data contained in all publications are solely those of the individual author(s) and contributor(s) and not of MDPI and/or the editor(s). MDPI and/or the editor(s) disclaim responsibility for any injury to people or property resulting from any ideas, methods, instructions or products referred to in the content.