1. Introduction
Rice is one of the world’s most important staple crops and supports food security, rural employment, and a broad range of domestic and industrial uses. At the field scale, panicle density and spatial distribution are key agronomic traits associated with final yield formation. Accurate, high-throughput quantification of rice panicles is therefore important for yield estimation, variety screening, and breeding-oriented phenotyping [
1,
2]. Compared with satellite imagery, unmanned aerial vehicle (UAV) remote sensing can provide higher spatial resolution, flexible flight-altitude control, and growth-stage-specific field observations, making it useful for panicle-level phenotyping [
3,
4]. Satellite platforms remain valuable for large-area and long-term monitoring, but their spatial resolution, cloud sensitivity, and revisit constraints limit direct detection of small panicle targets in dense canopies [
5].
However, UAV-based phenotyping has several practical constraints. Many studies still follow a “capture-and-process” workflow in which large image files are transferred to ground workstations for offline analysis [
6,
7]. This workflow can delay field decisions and increase data-transfer demands. Timely phenotyping therefore requires models that can run on resource-constrained field-side hardware while preserving accuracy under open-field imaging conditions [
8]. UAV platforms also introduce acquisition-level uncertainty. Flight altitude can vary because of wind, terrain, battery constraints, inspection needs, and operator control, changing the apparent panicle scale within and across missions. Low-altitude flights may provide more detail but also narrow the field of view and increase sensitivity to rotor-induced motion blur, wind-driven plant movement, and partial occlusion. In flooded paddies, leaf occlusion, water-surface reflection, and changing illumination further obscure small panicle targets [
9,
10]. These factors limit the direct transfer of laboratory or benchmark detectors to UAV-based rice phenotyping.
Deep learning has reduced reliance on manual feature engineering in crop phenotyping. Convolutional neural networks (CNNs) have been used for agricultural detection tasks including multi-scale weed detection [
11] and crop maturity evaluation with artificial intelligence (AI) and remote sensing [
12]. Early panicle-detection studies used two-stage models; for example, Zhang et al. [
13] improved Faster Region-based Convolutional Neural Network (Faster R-CNN) with multi-scale feature fusion. More recent work has emphasized lightweight one-stage detectors for UAV applications. Comparative studies have evaluated You Only Look Once (YOLO) variants under constrained UAV image datasets for yield estimation [
14] and have adapted these models to lighting variation and environmental noise [
15]. Related architectures, including EfficientNet-based OE-YOLO [
16] and DRPU-YOLO11 [
17], were developed for complex in-field backgrounds. Recent detectors such as YOLOv10 aim to reduce post-processing by eliminating non-maximum suppression (NMS) [
18]. Other studies address operational constraints through multi-altitude scale modeling [
19], knowledge distillation for lightweight deployment [
20], rotated bounding boxes for inclined panicles [
21], enhanced feature fusion for counting [
22], and multi-scale enhancement for complex backgrounds [
23]. These developments indicate clear progress, but efficient panicle detection remains difficult in dense canopies and field robotic settings [
24].
Despite these advances, CNN-based detectors remain limited by their dependence on local receptive fields. This can make it difficult to separate panicles from background vegetation during late growth stages, especially when adhesion and leaf occlusion are present [
25,
26]. Transformer-based detectors provide an alternative because they model longer-range dependencies. Detection Transformer (DETR) [
27] reformulates object detection as a set prediction problem, and the Real-Time Detection Transformer (RT-DETR) family [
28] improves inference efficiency with a hybrid encoder. However, their use in resource-constrained agricultural phenotyping remains less explored than YOLO-style detectors. Hybrid CNN-Transformer methods have shown value in agricultural segmentation and detection [
29]. Their direct application to UAV panicle imagery still faces two practical issues: fine panicle textures can be weakened by background noise, and downsampling can reduce the already small pixel footprint of high-altitude targets.
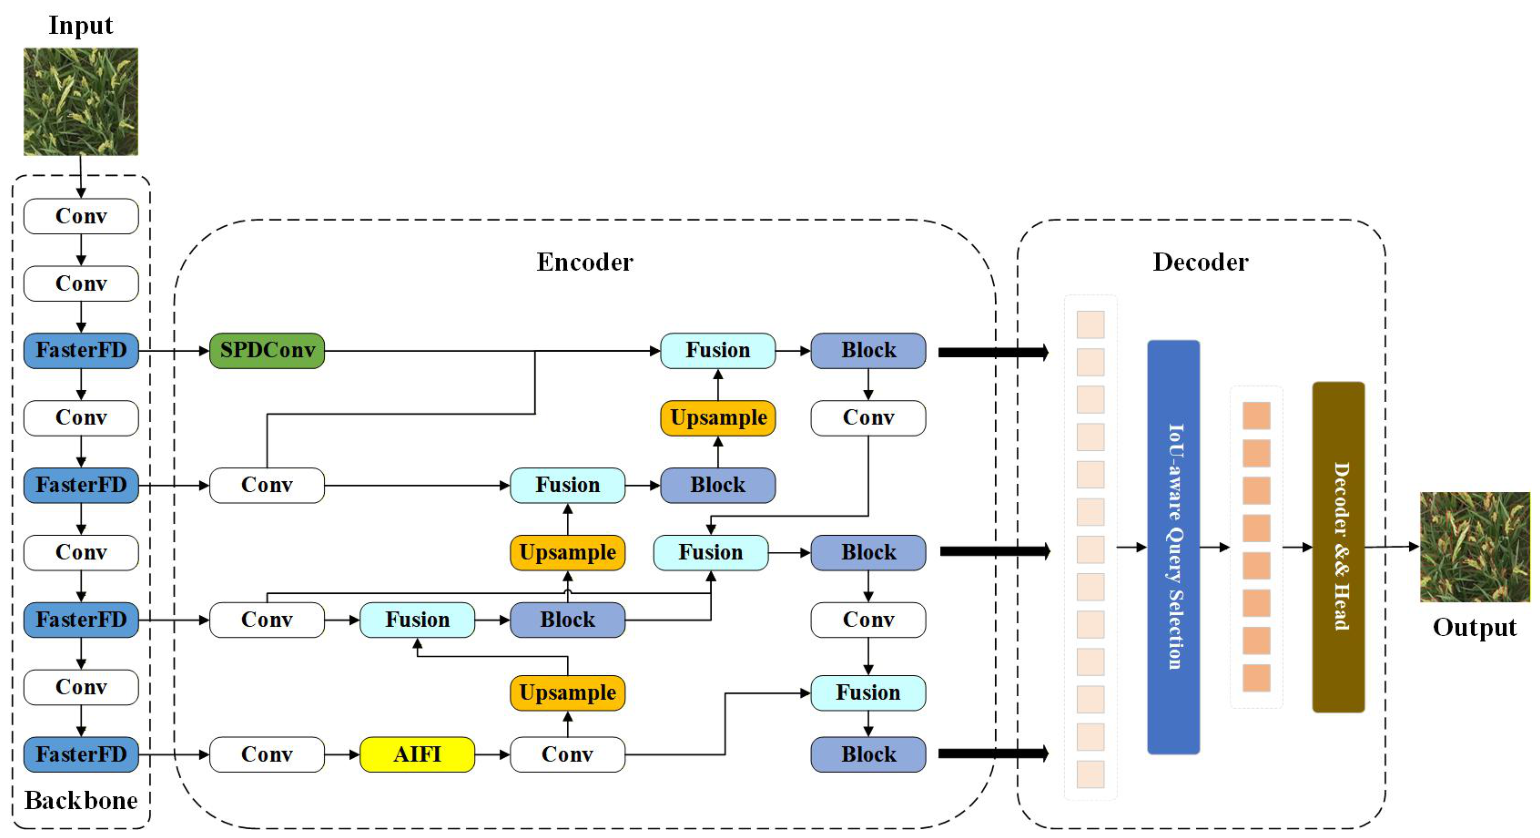
To address the combined requirements of detection accuracy, multi-altitude robustness, and deployment-oriented efficiency, this paper proposes an end-to-end precision phenotyping framework: Panicle-DETR. Designed for complex field environments and multi-altitude UAV operations, the lightweight framework introduces three core engineering components:
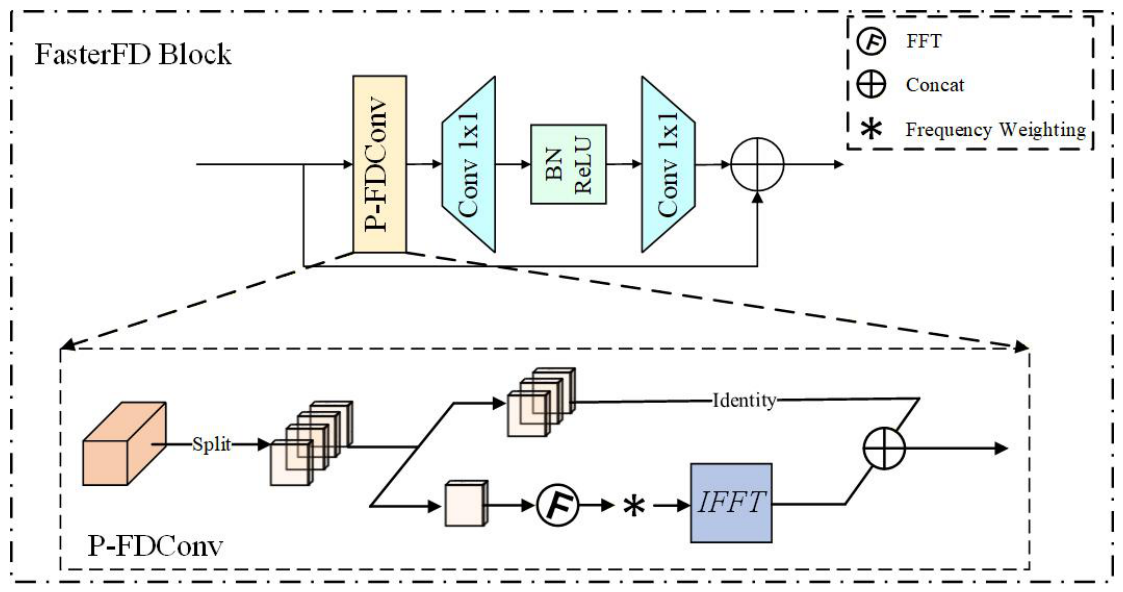
FasterFD (Frequency-Aware CSP Backbone): This backbone retains the Cross Stage Partial (CSP) hierarchy of YOLO-style networks and replaces standard bottlenecks with C2f-FasterFD modules. By combining Partial Convolution (PConv) with Frequency Dynamic Convolution (FDConv), it introduces learnable frequency-response reweighting to emphasize panicle-related texture cues while controlling computational cost.
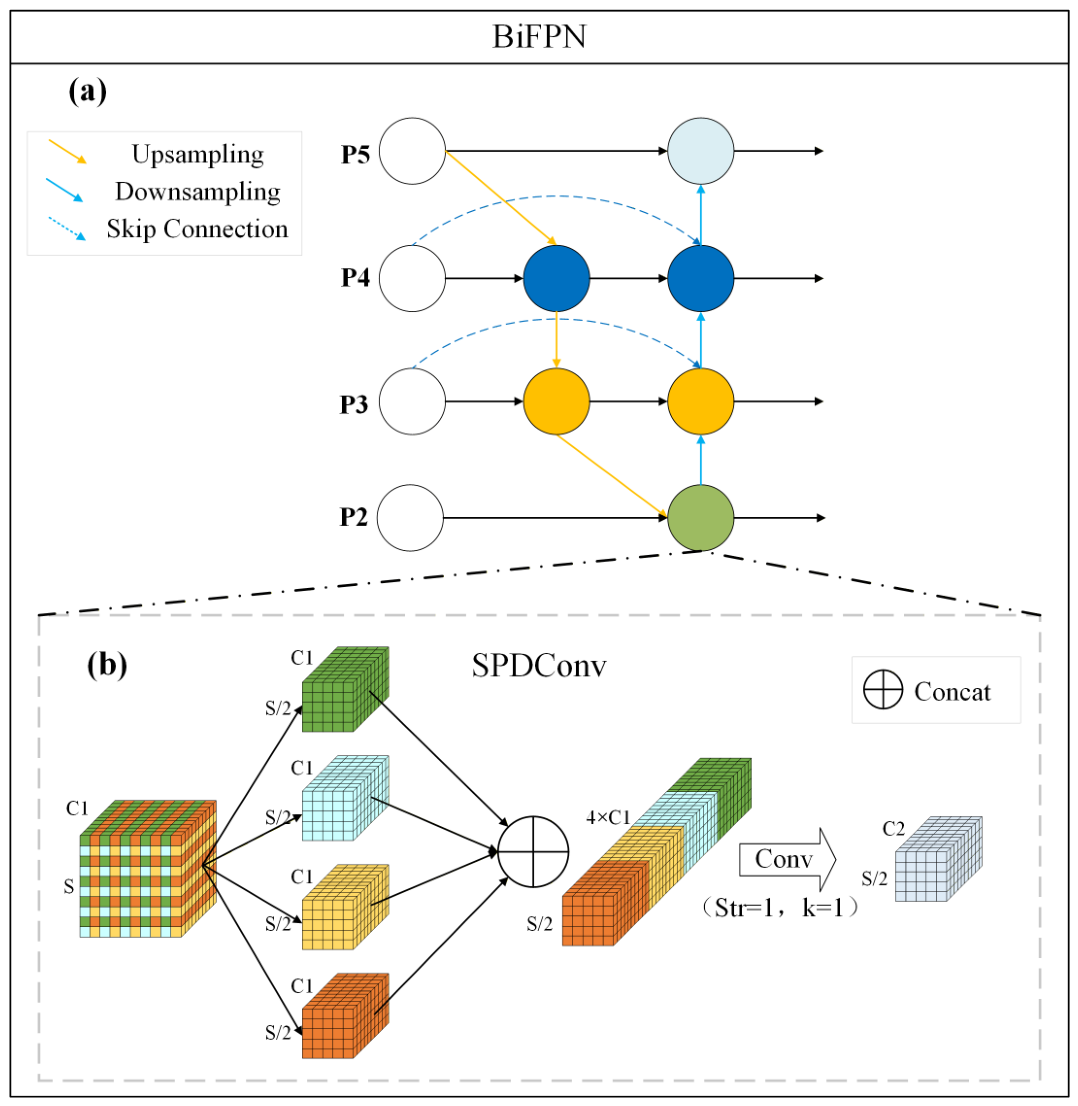
LFE (Lossless Feature Encoder): This encoder integrates Space-to-Depth mapping with bidirectional feature pyramids to preserve fine spatial information during cross-scale fusion, especially for small panicles captured from higher UAV altitudes.
Composite Metric Loss: This loss combines Normalized Gaussian Wasserstein Distance (NWD) and Inner Intersection over Union (Inner-IoU) to improve bounding box regression for dense and overlapping panicle clusters without adding inference-time computation.
3. Results
3.1. Ablation Study of Engineered Innovations
To quantify the contribution of each architectural component, we conducted a combinatorial ablation study. The evaluated components were the FasterFD backbone, the Bidirectional Feature Pyramid Network (BiFPN), and the composite bounding box regression loss (NWD + Inner-IoU). Computational complexity is reported as giga floating-point operations (GFLOPs). As detailed in
Table 3, the RT-DETR-r18 baseline was augmented with individual modules and pairwise combinations to assess their effects on localization accuracy and computational cost.
The ablation results show that FasterFD reduced computational demand relative to the RT-DETR-r18 baseline. Model 1 decreased GFLOPs by 26.5% (from 56.9 to 41.8) and increased mAP@50 from 92.45% to 92.95%. This pattern is consistent with the intended role of frequency-aware feature extraction, which reduces redundant background responses while preserving panicle-related texture information.
The LFE module improved recall and mAP@50, but increased computation when used alone. Model 2 reached 93.20% mAP@50 and 87.60% Recall, while GFLOPs increased to 64.7. This result is consistent with the role of Space-to-Depth mapping and bidirectional fusion in retaining fine spatial information. When LFE was combined with FasterFD (Model 4), GFLOPs decreased to 53.0 and mAP@50 reached 93.60%, indicating that the two modules partly offset each other’s accuracy–computation trade-offs.
The composite loss (NWD + Inner-IoU) was designed to improve boundary refinement for dense clusters without adding inference-time cost. When applied alone (Model 3), the gain was small, with mAP@50 reaching 92.55%. In the complete architecture, however, the composite loss increased Precision to 90.97% and mAP@50 to 93.94%. This indicates that distributional similarity and inner-boundary optimization are most useful when supported by more informative scale-aware features.
3.1.1. Focused Ablation of the Composite Loss
To isolate the contribution of each component in the composite regression loss, we conducted a focused ablation study using the same Panicle-DETR architecture while changing only the bounding-box regression loss.
Table 4 compares NWD alone, Inner-IoU alone, and the combined NWD + Inner-IoU loss. This analysis complements the combinatorial ablation in
Table 3 by testing whether the final gain depends on coupling distribution-sensitive tiny-object regression with inner-boundary refinement.
The focused comparison indicates that NWD and Inner-IoU contribute complementary effects to bounding-box regression. NWD alone reached 93.42% mAP@50, consistent with reduced sensitivity to small coordinate shifts. Inner-IoU alone achieved 72.25% mAP@75, consistent with improved boundary refinement for overlapping targets. Combining the two losses produced the strongest performance in this comparison, with 90.97% Precision, 88.33% Recall, 93.94% mAP@50, and 64.75% mAP@50–95.
3.1.2. Comparative Analysis of Backbone Architectures
To evaluate the FasterFD design, we benchmarked it against several vision backbones within the same Panicle-DETR framework, using the same BiFPN encoder and composite loss, as summarized in
Table 5. The compared backbones included parameter-heavy architectures (ResNet-50 [
37], HGNetv2-L [
28]), lightweight networks (MobileNetV3 [
38], StarNet [
39]), and efficient models (FasterNet [
31], EfficientNetV2 [
40]). We also evaluated a C2f-FasterNet variant that replaces C2f-FasterFD with a purely spatial partial-convolution block while retaining the same macro-architecture, BiFPN encoder, and composite loss.
Compared with ResNet-50, FasterFD achieved a slightly higher mAP@50 (93.94% versus 93.71%) with lower computation (53.0 versus 108.5 GFLOPs). Lightweight networks such as StarNet and MobileNetV3 had smaller computational footprints (40.0 and 47.7 GFLOPs), but lower mAP@50 values of 91.82% and 90.50%, respectively.
Compared with the original FasterNet architecture, which relies on spatial-domain partial convolutions and used 41.5 GFLOPs, FasterFD increased mAP@50 by 1.08 percentage points. The controlled C2f-FasterNet comparison further shows that replacing C2f-FasterFD with a spatial-only partial-convolution block lowered mAP@50 from 93.94% to 93.28%, while reducing GFLOPs from 53.0 to 48.6. This result indicates that the gain is associated not only with partial-convolution efficiency, but also with the frequency-aware reweighting used in C2f-FasterFD.
3.2. Comparative Experiments on the Composite Dataset
We then compared Panicle-DETR with representative detection architectures on the composite dataset. The evaluation integrates detection metrics, single-frame counting accuracy, and qualitative visual assessment.
3.2.1. Quantitative Detection Performance and Training Dynamics
Detection performance and complexity metrics for representative baseline models are presented in
Table 6, including RT-DETR-r18 as the direct baseline for Panicle-DETR. A separate comparison with the RT-DETR family is provided in
Table 7 to isolate the effect of increasing RT-DETR backbone capacity.
For overall detection performance, Panicle-DETR achieved 90.97% Precision and 89.63%
-score, outperforming the representative baseline models in
Table 6. On mAP@50, the proposed model reached 93.94%, while using 13.78 M parameters and 53.0 GFLOPs.
Within the RT-DETR family, increasing backbone capacity from r18 to r34 and r50 improved detection metrics, but the gain came with higher computation. GFLOPs increased from 56.9 in RT-DETR-r18 to 90.6 in RT-DETR-r34 and 134.8 in RT-DETR-r50. Panicle-DETR produced the highest mAP@50, mAP@75, and mAP@50–95 values in this focused comparison while using fewer parameters and lower GFLOPs than all three RT-DETR variants.
The difference was more pronounced under stricter overlap thresholds. Panicle-DETR achieved 74.15% mAP@75 and 64.75% mAP@50–95. These results are consistent with the role of the combined NWD and Inner-IoU loss in improving bounding box regression for irregular panicle boundaries.
3.2.2. Repeated-Run Variability Analysis
Table 8 summarizes the repeated-run results across three random seeds for Panicle-DETR and the representative baselines.
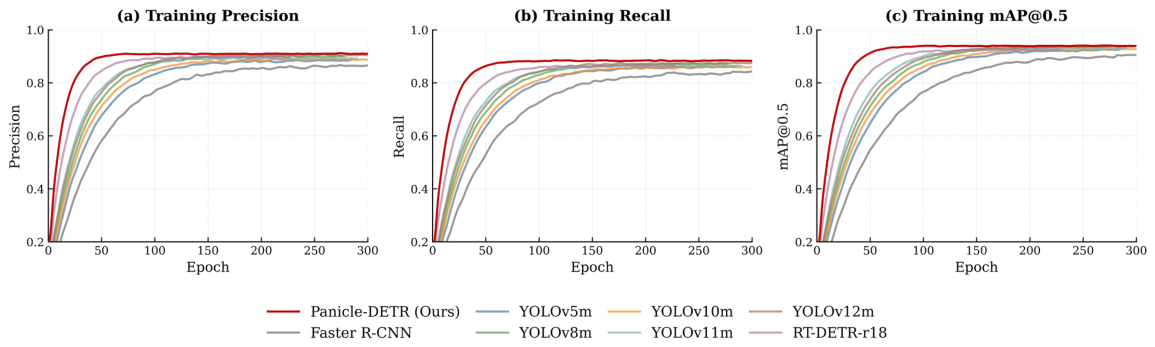
In addition to final accuracy, we examined the training trajectories of Precision, Recall, and mAP@50 in
Figure 7. Most models showed rapid improvement during the early training stage and then gradually approached a plateau. Panicle-DETR reached a high-performance region earlier than the representative baselines and maintained competitive values during the later epochs.
The convergence curves indicate that Panicle-DETR achieved strong final performance while retaining a smooth overall optimization trajectory. Faster R-CNN improved more slowly and reached a lower plateau, whereas several YOLO variants converged rapidly but remained slightly below Panicle-DETR in at least one of the three metrics. RT-DETR-r18 showed competitive early optimization, but its final mAP@50 and Recall were lower than those of Panicle-DETR. This curve-level comparison is used to describe training behavior rather than to claim uniformly smaller random fluctuation than all baselines.
3.2.3. Low-Compute Notebook Inference Evaluation
To add data-backed, hardware-aware evidence about resource-constrained field-side inference without making unsupported claims about onboard deployment, a low-compute notebook benchmark was conducted on the battery-powered notebook described in
Section 2.3.1. The notebook was disconnected from external power during testing to approximate a resource-constrained field-side operating condition. Unless otherwise stated, the benchmark used a batch size of 1 and the same
input resolution as the main desktop evaluation. All models were evaluated under the same PyTorch 32-bit floating-point (FP32) runtime without TensorRT, 8-bit integer (INT8) quantization, or hardware-specific acceleration. The inference evaluation reports single-image latency, frames per second (FPS), peak GPU memory, and peak system memory usage, thereby complementing the theoretical complexity metrics with hardware-aware evidence.
As summarized in
Table 9, Panicle-DETR achieved 16.9 FPS with 59.1 ms single-image latency on the battery-powered GTX 1650 notebook under PyTorch FP32 evaluation. Although YOLOv12m was the fastest evaluated model (19.9 FPS), Panicle-DETR required the lowest peak GPU memory (1.96 GB) and was faster and more memory efficient than RT-DETR-r18 while maintaining higher detection and counting accuracy.
This low-compute benchmark distinguishes model compactness from practical inference behavior under constrained hardware. Parameter count and GFLOPs indicate theoretical efficiency, whereas latency, FPS, and memory usage determine whether the model can be used on portable field-side computers. Because no UAV-mounted computer was used in this study, the results should be interpreted as evidence of notebook-based field-side inference efficiency rather than direct validation of onboard UAV deployment.
3.2.4. Agronomic Counting Accuracy and Consistency
In high-throughput phenotypic analysis, detection confidence alone may not fully reflect the reliability of panicle counting. Panicle counting errors were therefore evaluated to assess image-level count consistency, as summarized in
Table 10.
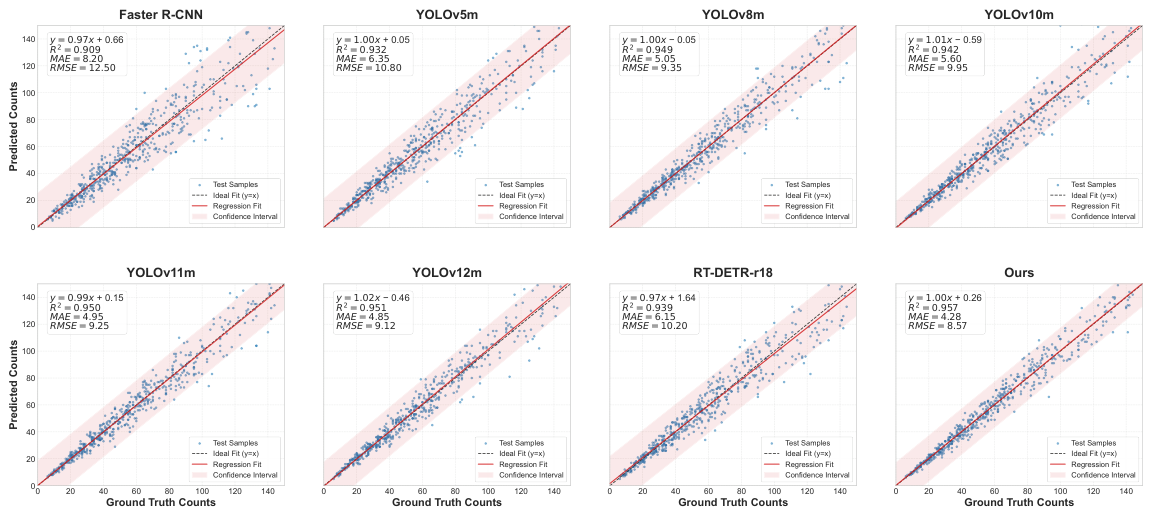
Panicle-DETR achieved a Mean Absolute Error of 4.28 and a Root Mean Square Error of 8.57. YOLOv8m [
43] and YOLOv12m [
45] showed strong detection performance, but their counting errors were higher, with Mean Absolute Errors of 5.05 and 4.85, respectively. This difference is consistent with the role of adaptive multi-scale fusion in preserving micro-target boundaries in dense and adherent panicles, thereby reducing false merging and missed detections.
Linear regression scatter plots of predicted counts versus ground-truth counts were used to examine count consistency across density levels. In
Figure 8, Faster R-CNN [
41] and YOLOv5m [
42] showed larger dispersion when the ground-truth count exceeded 60 panicles per image. Panicle-DETR predictions remained closer to the regression line, including in high-density images containing more than 100 panicles. With an
of 0.957, the model improved agreement between predicted and ground-truth single-frame counts. This result supports image-level panicle-density assessment, although field-scale yield estimation would still require calibration against plot-level yield measurements.
3.2.5. Qualitative Visual Validation Across Altitudes
To complement the quantitative metrics, qualitative visual assessment was conducted across UAV flight altitudes.
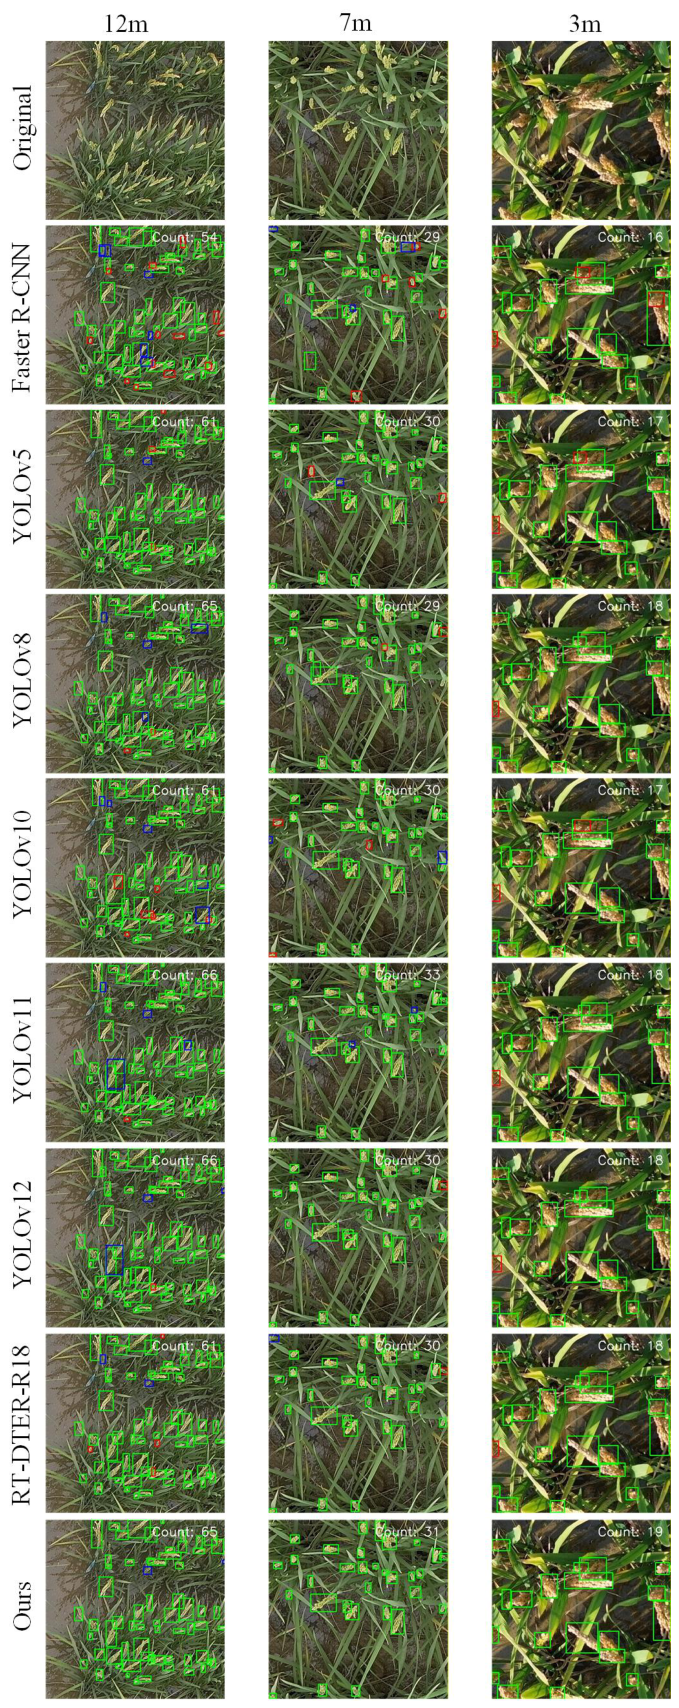
Figure 9 compares representative baseline outputs with Panicle-DETR outputs at altitudes of 12 m, 7 m, and 3 m, arranged from left to right.
Visual comparisons indicate that flight altitude strongly affects panicle appearance. At 12 m, spatial downsampling causes micro-targets to blend into the field background. Several baseline models produced more false negatives in these regions, whereas Panicle-DETR detected more of the small panicle targets. This observation is consistent with the role of the Lossless Feature Encoder in preserving high-altitude micro-panicle information.
At 7 m, dense adherent panicles increased the risk of bounding box merging and grouped false negatives. Panicle-DETR more clearly separated several adherent clusters, consistent with the use of NWD and Inner-IoU for dense target regression. At 3 m, the narrow field of view introduced truncated border targets and visually ambiguous panicles. Panicle-DETR produced more correct detections in these cases, although missed detections remained under strong occlusion and weak target contrast.
3.3. Error Analysis and Model Limitations
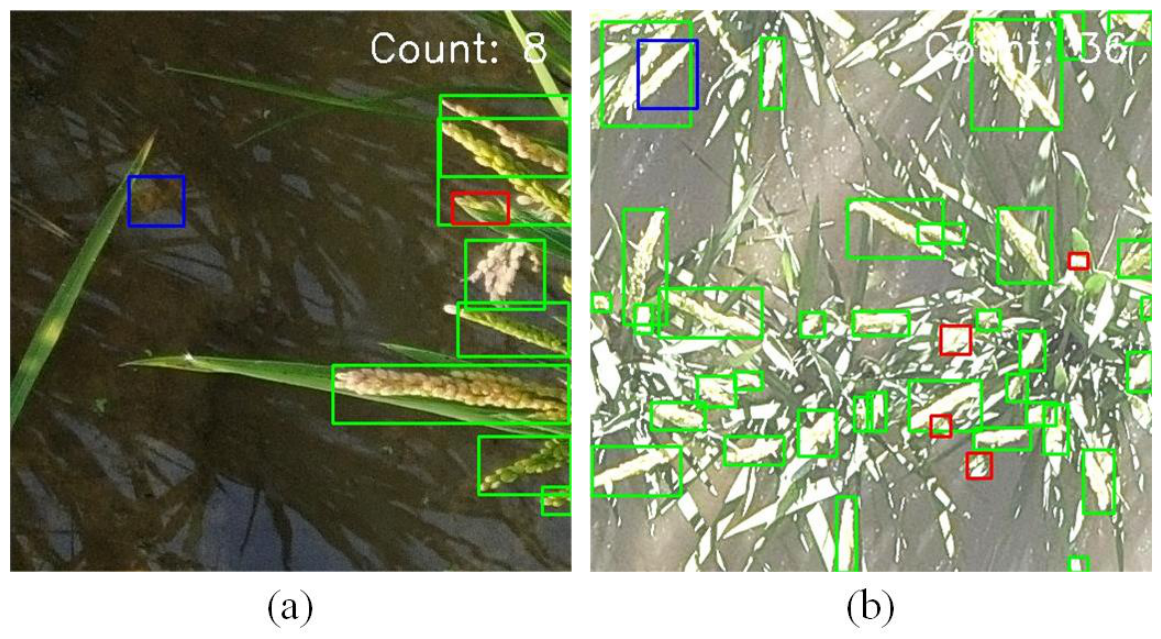
Error analysis was conducted to identify the practical limitations of Panicle-DETR in unstructured agricultural environments. Representative failure cases are shown in
Figure 10.
One failure mode, shown in panel (a), involves reflections on the water surface within irrigated paddies. Specular reflections of the sky or dense foliage can resemble panicle texture under specific solar angles, occasionally triggering false positives. Severe physical occlusion is another source of error. When a panicle is almost entirely masked by broad flag leaves, its textural and geometric cues can be too weak for reliable detection, leading to false negatives.
Strong illumination saturation also caused detection failures, as observed in panel (b). Under peak solar intensity, high brightness reduced the contrast between panicles and background regions. This led to missed detections when target texture was washed out and to false positives when overexposed background elements, such as withered leaves, were assigned high objectness scores. These limitations indicate that purely RGB-based detectors remain sensitive to illumination and occlusion, motivating future work on multi-sensor fusion or illumination-invariant augmentation.
4. Discussion
Deploying deep learning models for UAV-based high-throughput phenotyping remains difficult because open-field imagery varies in altitude, illumination, occlusion, background reflection, and available computation. The results of this study suggest that Panicle-DETR can address part of this problem by combining frequency-aware feature extraction, spatial-preserving feature fusion, and dense-target regression. The evidence is strongest for the composite multi-altitude image dataset and the notebook-based inference benchmark used here.
4.1. Addressing the Spatial–Semantic Trade-Off in Multi-Altitude Phenotyping
One motivation for the architecture was the feature degradation observed under UAV altitude variation from 3 m to 20 m. As noted in recent evaluations of small-object detection in aerial imagery [
46], standard strided convolutions can substantially reduce the pixel footprint of high-altitude micro-targets. In this study, architectures such as YOLOv12m achieved strong accuracy overall, but their errors were more evident in higher-altitude and dense-canopy examples.
The Lossless Feature Encoder is intended to mitigate this vulnerability by embedding Space-to-Depth mapping within the BiFPN topology. This design reduces information loss during downsampling and fuses fine-grained micro-panicle textures into deeper semantic layers, including high-altitude views from 12 m to 20 m. The results suggest that multi-scale robustness in precision agriculture benefits from explicit spatial preservation, especially around panicle boundary regions [
47].
4.2. Linking Detection Accuracy to Image-Level Panicle Counting
In digital agriculture, panicle detection is most useful when it provides count information that can support downstream phenotyping. Many agricultural vision studies rely mainly on mean average precision, which may not fully reveal counting errors for traits such as panicle number per unit area [
48].
The scatter plots showed larger count dispersion in several baseline models when the true count exceeded 60 panicles per image. This pattern is consistent with detection failures in dense and adherent clusters. By combining distributional similarity with inner-boundary refinement, Panicle-DETR reduced image-level counting error. This supports the view that loss functions should reflect the morphology of dense crop targets when object detection is used for phenotyping [
49]. However, the present counting analysis is image-based. It does not yet establish plot-level yield prediction or video-level duplicate removal.
4.3. Engineering Viability and Low-Compute Inference Trade-Offs
For field-side agricultural phenotyping, near-real-time processing requires computational efficiency. Heavy backbones such as ResNet-50 can exceed 100 GFLOPs, whereas lightweight networks may lose accuracy in complex backgrounds. The results therefore point to a trade-off between model compactness and feature discrimination.
The FasterFD backbone represents one way to manage this trade-off. By using frequency-domain representations with learnable frequency-response reweighting, the network reduces redundant spatial computation and enhances panicle-related texture cues. Panicle-DETR operated at 53.0 GFLOPs with 13.78 M parameters and achieved 93.94% mAP@50. The low-compute notebook benchmark in
Table 9 further shows that Panicle-DETR reached 16.9 FPS on a battery-powered GTX 1650 4 GB notebook while requiring 1.96 GB peak GPU memory. This provides hardware-aware evidence for resource-constrained field-side inference, but it does not replace validation on UAV-mounted computing platforms.
4.4. Limitations and Future Work
Several limitations remain. First, the current dataset primarily contains images acquired under adequate daytime illumination, and performance under low light, strong glare, or adverse weather needs further validation. Second, 3 m ultra-low-altitude images may be affected by rotor-induced airflow, wind-driven panicle motion, and dynamic occlusion. Although severely blurred frames were excluded during preprocessing, manual frame exclusion is not sufficient for continuous field operation. In addition, patch-based processing may truncate targets near patch borders and reduce wider contextual information, although this limitation was partly controlled through visual quality filtering and annotation review. Future work should include overlapping tiles, context-preserving inference, video-based quality control, temporal detection, deblurring, or target tracking to improve robustness under dynamic motion blur and edge-context loss.
Third, the current counting evaluation is image-based and does not perform cross-frame target association. Continuous video counting would require an additional tracking module to avoid repeated counts of the same panicle. Finally, the hardware-aware inference evaluation was conducted on a battery-powered low-compute notebook rather than on an actual UAV-mounted computer. The reported latency and memory results should therefore be interpreted as a proxy for resource-constrained field-side inference efficiency, not as direct evidence of onboard UAV deployment. Future research should examine portable-hardware benchmarking, model quantization, and flight-time validation while evaluating trade-offs among latency, power consumption, and multi-altitude counting accuracy.
5. Conclusions
This study introduces Panicle-DETR for rice panicle detection and counting in multi-altitude UAV imagery. The framework addresses constrained field-side computation and spatial variability by combining frequency-aware feature extraction, spatial-preserving multi-scale fusion, and a dense-target regression loss. The FasterFD backbone uses frequency-domain representations with learnable frequency-response reweighting to enhance panicle-related texture cues. The Lossless Feature Encoder reduces information loss during downsampling, while the NWD and Inner-IoU composite loss improves regression for dense panicle clusters.
On the composite multi-altitude dataset, Panicle-DETR achieved 93.94% mAP@50 and reduced the single-frame counting Mean Absolute Error to 4.28. This performance was obtained with 53.0 GFLOPs and 13.78 M parameters. In the battery-powered low-compute notebook benchmark, the model reached 16.9 FPS with 1.96 GB peak GPU memory and 5.2 GB peak system memory usage. These results support the potential of Panicle-DETR for resource-constrained field-side UAV image analysis, while onboard UAV deployment remains to be validated on dedicated edge hardware under real flight conditions. Future work should further validate continuous video counting, dynamic motion-blur robustness, and cross-region and cross-variety generalization.