1. Introduction
Measuring soil penetration resistance is important in agriculture and forestry, as well as in national defense more broadly. In agriculture, soil compaction is determined by measuring penetration resistance. Soil compaction is a major problem, as it negatively affects soil structure and plant growth [
1]. Excessive compaction reduces porosity and water infiltration into the soil. In addition, it hinders the development of plant roots and reduces yields [
2]. The use of heavy agricultural machinery can worsen subsoil compaction, and cause a 40–90% reduction in yield [
3,
4,
5]. Soil compaction impairs water infiltration, aeration, while increasing surface runoff and altering evaporation [
3]. Penetration resistance is also important in determining soil permeability. In forestry, it is important to assess whether machinery can operate on soil while enabling timber extraction with minimal impact on soil properties and the surrounding ecosystem [
6,
7,
8]. A similar challenge arises in military operations, where terrain trafficability is strategic and the use of heavy equipment in forested or swampy areas is critical [
9,
10].
Soil penetration resistance is usually measured with a cone penetrometer, which generally determines the pressure generated by the resistance of the soil when a cone is pushed into the soil [
11]. Penetration resistance is defined as:
where P
r is the penetration resistance (MPa), F is the force required to penetrate the soil (N), A is the base area of the cone (mm
2).
The force required to penetrate the soil consists of several components, including friction between the rod and the surrounding soil [
12]. Therefore, the penetration resistance as a function is expressed as follows:
where the shear strength is τ′, the geometry is χ, and the friction force is ϝ.
Penetration resistance, also known as the cone index, is widely used to assess soil strength, as measurements are simple, relatively rapid, and enable the development of soil strength profiles with depth [
13]. Considering vehicle trafficability, critical cone index values correspond to conditions where the applied load exceeds soil shear strength, causing soil failure [
14].
Penetration resistance is significantly affected by moisture, as the penetration resistance of the soil can change with even a small change in moisture, especially in organic and fine-grained soils [
15]. Studies have demonstrated a strong inverse relationship between soil moisture and penetration resistance [
16]. Moreover, field experiments have indicated that both the cone index and soil water content must be measured to adequately describe soil mechanical behavior. This, in turn, enables more informed decisions regarding soil suitability for cultivation and machinery operation [
17]. Recent studies in terramechanics and agricultural and forestry machinery have shown that soil moisture is one of the most important factors affecting soil bearing capacity and trafficability [
10]. Increased soil moisture reduces the bearing capacity under a wheel or track. Tests showed that the settlement of a tracked vehicle on clayey (bentonite-type) soils increased significantly with moisture content, rising from 1.10 cm at 5% to 3.80 cm at 30%. The results suggest that the soil bearing capacity decreases as moisture content increases [
18]. Outdoor tests of forestry machines have indicated similar results. In the forwarder repeated-pass tests, two soil moisture ranges were considered: 2.4–3.9% and 18.7–24.3%. Under lower moisture conditions, rut depth developed rapidly and reached a stable level, with only minor increases during subsequent passes [
19].
Given the importance of measuring soil moisture and the cone index (CI) in describing soil mechanical behavior under load, combined approaches have been developed to assess soil penetration resistance together with soil moisture. Vaz and Hopmans (2001) introduced a device that integrated a time-domain reflectometry (TDR) sensor into a cone penetrometer [
11]. This allowed simultaneous measurement of soil cone index and moisture. Their combined device provided detailed soil moisture profiles along with penetration resistance. The work revealed that the increase in penetration resistance was more related to soil compaction than to moisture. Sun et al. (2003) constructed a cone penetrometer with a frequency domain reflectometry (FDR) moisture sensor to measure real-time moisture content and penetration resistance in soil [
20]. This concept was extended by Sun et al. (2006) to a mobile horizontal penetrometer, which allowed simultaneous mapping of soil resistivity and moisture for precision agriculture applications [
21]. Their research confirmed that simultaneous measurements provide a more reliable assessment of soil conditions than separate measurements. Feldman et al. (2012) described a penetrometer combined with a capacitive moisture sensor as a rapid method for assessing soil moisture and density in geotechnical investigations [
22]. Iwasaki et al. (2020) applied an integrated system consisting of a penetrometer, a moisture sensor, and ground-penetrating radar to map the spatial variability in soil moisture and strength in wind-exposed areas (e.g., field edges adjacent to tree rows) [
23]. Their results demonstrated that joint interpretation of moisture profiles and penetration resistance improves the understanding of soil conditions. These studies highlight the continued interest in integrated sensing approaches for soil compaction mapping.
Soil moisture measurement using TDR and FDR methods is generally reliable and accurate under calibrated conditions. However, when applied across different soil types, sensor-related limitations can lead to significant measurement errors. Qi et al. (2024) investigated the accuracy of moisture sensors at varying salinity levels in a specific soil and found that measurements were overestimated at higher salinity [
24]. The TDR sensor measures the water content of the soil based on the propagation time and reflection signal of an electromagnetic pulse. Increasing soil salinity leads to higher electrical conductivity due to the greater concentration of free ions in the soil water. This, in turn, causes greater attenuation and distortion of the TDR signal, which makes the determination of the pulse propagation and reflection less accurate [
25]. As a result, the sensor may overestimate the water content of the soil. Millán et al. (2024) compared different soil moisture sensors available on the market (including TDR and FDR) and the effect of their calibration on the measurement results [
26]. They found that factory calibration is not always reliable; however, applying soil-specific calibration equations improved measurement precision [
26]. It can be concluded that soil composition affects the accuracy of moisture change sensors. Zawilski et al. (2023) investigated the suitability of the factory calibration of FDR moisture sensors in different soils [
27]. The study indicated that factory calibration does not account for soil-specific properties, leading to overestimation of moisture content in clayey soils [
27]. Many studies emphasize that dielectric soil moisture sensors require soil and condition-based calibration, as measurement accuracy depends on soil properties and the chosen calibration method [
17,
28,
29]. Research has shown that the general bottlenecks in soil moisture sensors include their inaccuracy in different soils (i.e., measurement environments). The main factors influencing measurement accuracy are mineral content, calibration and calibration function selection, sensor placement, and, to a lesser extent, temperature [
30]. However, the use of moisture sensors with a galvanic cell has not been widely reported in scientific literature. It is expected that this type of sensor is also affected by the factors described above. Electrochemical (galvanic cell) sensors are an alternative to, for example, TDR- or FDR-type sensors, using soil as an electrolyte. Galvanic cell-based soil moisture sensors are currently used, but they are more suitable for estimation than for precise measurements. The stability and accuracy of the sensor in different measurement environments remain the main challenges limiting its wider use [
31].
Conventional, hand-operated combination devices for measuring soil penetration resistance and moisture are simple and robust; however, they provide little information on penetration resistance, measurement speed, depth, or location. This limits the repeatability of measurements and the value of the data obtained [
32]. Automated devices can stabilize measurement speed and reduce operator error, which is a prerequisite for comparing data and drawing correct conclusions [
33]. In addition, no devices are currently available that can measure soil penetration resistance and moisture across different soil layers in a single operation. As a result, soil moisture is typically measured only at the same location as the penetration resistance measurement. Commercially available penetrometers with various capabilities provide reliable measurement data; however, moisture measurement is performed separately in these systems [
13]. Therefore, to determine the moisture content in different soil layers, excavations should be made to reach the appropriate depth to enable moisture determination. Soil moisture measurement technology has developed rapidly in recent years using dielectric, microwave, and IoT-based technologies. However, on-site calibration is still required, as the measurement results of sensors are affected by soil texture, mineral content, temperature, and installation conditions [
34].
Automated mobile systems (e.g., agricultural robots) allow for the collection of penetration resistance data from many points at different depths to inform field operation decisions and assess problem areas affecting yield [
35]. State-of-the-art stationary sensors and spectroscopic sensor technologies are increasingly being considered for field diagnostics; however, integration with soil penetration resistance measurements into a single system is still rare [
36]. Stationary sensors provide reliable measurements of soil parameters, including moisture; however, their integration into mobile penetration resistance devices is technologically complex and may reduce measurement accuracy. It would be appropriate to point out that the implementation of other measurement methodologies in mobile soil penetration resistance measuring devices is also limited by the same technical problems.
The aim of this work was to develop a technical solution for measuring soil penetration resistance, in which a volumetric moisture sensor with a galvanic cell was integrated into the measurement of soil penetration resistance. The purpose of a soil moisture sensor in measuring penetration resistance is to record the soil water content at different measurement depths simultaneously with the penetration resistance. The sensor is based on a galvanic cell, and the advantage of the sensor over other types of moisture sensors lies in the neutrality of minerals found in the soil, i.e., salts do not affect the measurement results of the sensor. This study presents the development of a measurement device and the calibration and integration of a galvanic cell-based moisture sensor, along with preliminary results from laboratory experiments. It is hypothesized that galvanic cell-based sensors are less sensitive to soil salinity than TDR-based sensors. TDR sensors operate by transmitting a fast electrical pulse and measuring its propagation and reflection. Increased soil salinity raises electrical conductivity, which enhances signal dispersion and can lead to overestimation of moisture content [
25].
2. Materials and Methods
2.1. General
Devices that allow for soil penetration resistance and volumetric moisture to be measured simultaneously in different soil layers are not available. Therefore, a prototype device has been developed as part of this work. The requirements for the device are given below.
The purpose of the device is to continuously measure soil penetration resistance and volumetric moisture at different measurement depths during the measurement cycle.
Since the NRMM (NATO Reference Mobility Model) is based on penetrometric data, the parameters to be measured are:
Technical data of the measuring device:
Maximum measuring depth 500 mm;
Measurement accuracy of measuring depth 10 mm;
Maximum measurable penetrometric resistance 300 psi;
Measurement accuracy of measured soil density (pressure) 2 psi;
Soil moisture measurement accuracy ±5% (expected, will be determined during testing);
Lowest determinable soil moisture value 5%;
Measuring rod diameter 20 mm;
Cone: standard cone ASEA EP 542.1 (2019) [
37], ASEA S313.3 (2014) [
38];
Device length 900 mm;
Measuring depth meter: laser type;
Soil moisture measurement sensor: galvanic;
GPS positioning.
The conventional TRIZ methodology was applied to guide the development process from concept to prototype. The process included a review of relevant scientific literature, the development of design solutions, the selection of suitable components, the design and calibration of a moisture sensor, and the presentation of the results.
2.2. Overview of Existing Solutions
Hong et al. (2019) developed a dynamic conical penetrometer integrated with a TDR moisture sensor and a temperature sensor to simultaneously estimate the volumetric water content and penetration resistance of sandy soils [
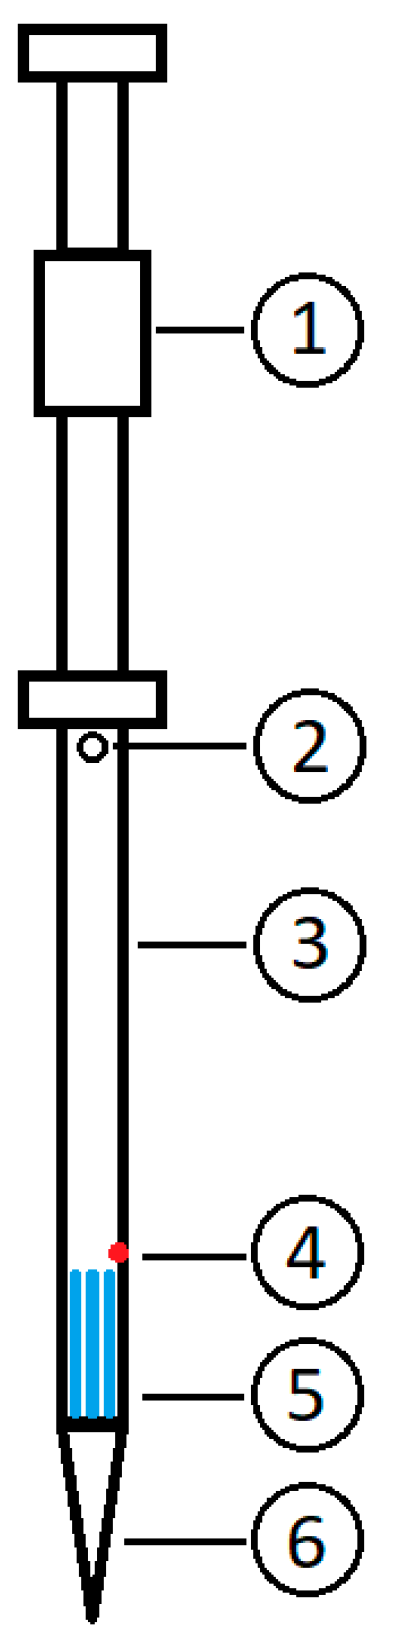
39].
Figure 1 illustrates the concept of a dynamic penetrometer. The moisture and temperature sensor is positioned directly behind the cone, beneath the rod. For dynamic penetration resistance measurement, the device has a slide hammer (pos. 1) at the top of the rod. The sensor cables run inside the rod, and an opening (pos. 2) is provided beyond the slide hammer’s working area for cable routing. The moisture sensor (pos. 5) is 80 mm long and has three waveguides, which are connected to the TDR module through a coaxial cable. A type K thermocouple has been selected as the temperature sensor (pos. 4), which is located on top of the moisture sensor. The rod (pos. 3) and the cone (pos. 6) are stainless steel for improved wear resistance.
Kumar and Singh (2025) introduced the STMET (Snow and Terrain Mobility Evaluation tool), a multi-purpose device that can collect various data to assess avalanche risk and terrain mobility [
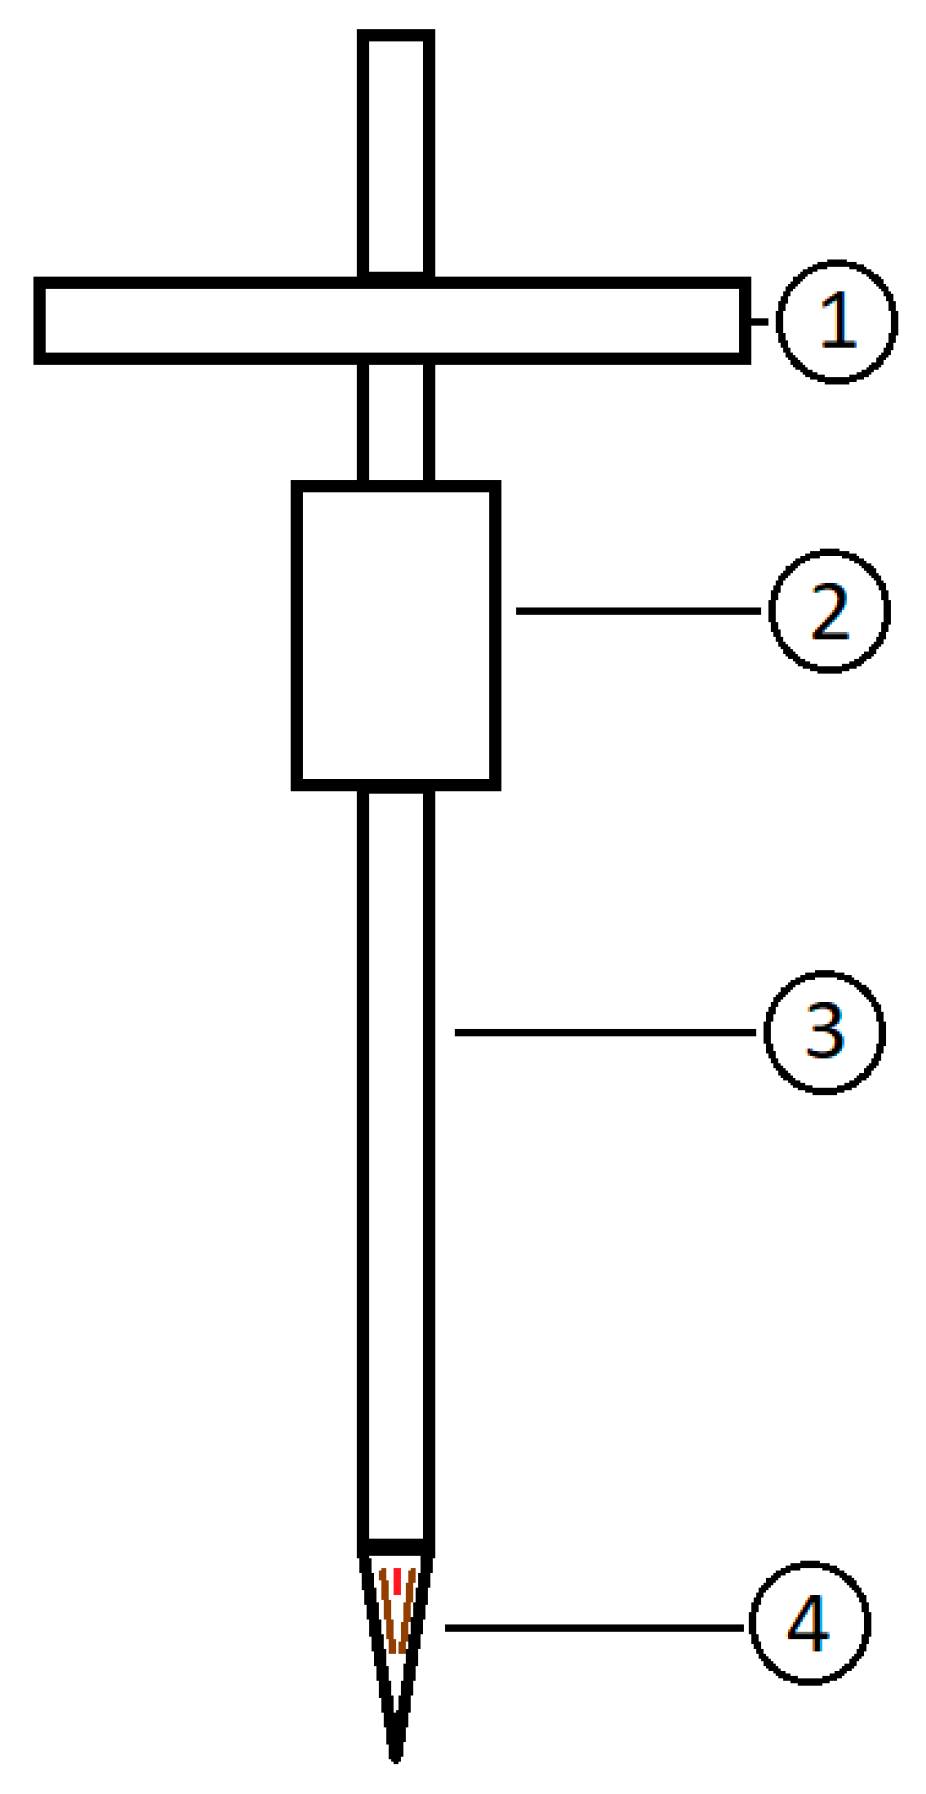
40]. STMET is designed for manual operation as the device allows for the measurement of soil penetration resistance, moisture, and temperature as well as the creation of profiles with these data. The device shown in
Figure 2 consists of a handle (pos. 1), an electronics box (pos. 2), containing a load-cell and a laser sensor (ToF), a rod (pos. 3), and a cone (pos. 4) with an integrated moisture (FDR) and temperature sensor (NTC thermistor).
The concepts in the previous examples are similar to many others [
23,
41,
42,
43]. Both are designed as portable, hand-operated devices that can collect data on both penetration resistance and soil moisture in a single measurement. The penetration force is applied axially to the rod. The moisture and temperature sensors are positioned close to the cone to measure the same soil zone as the penetration resistance.
2.3. Device Design and Components
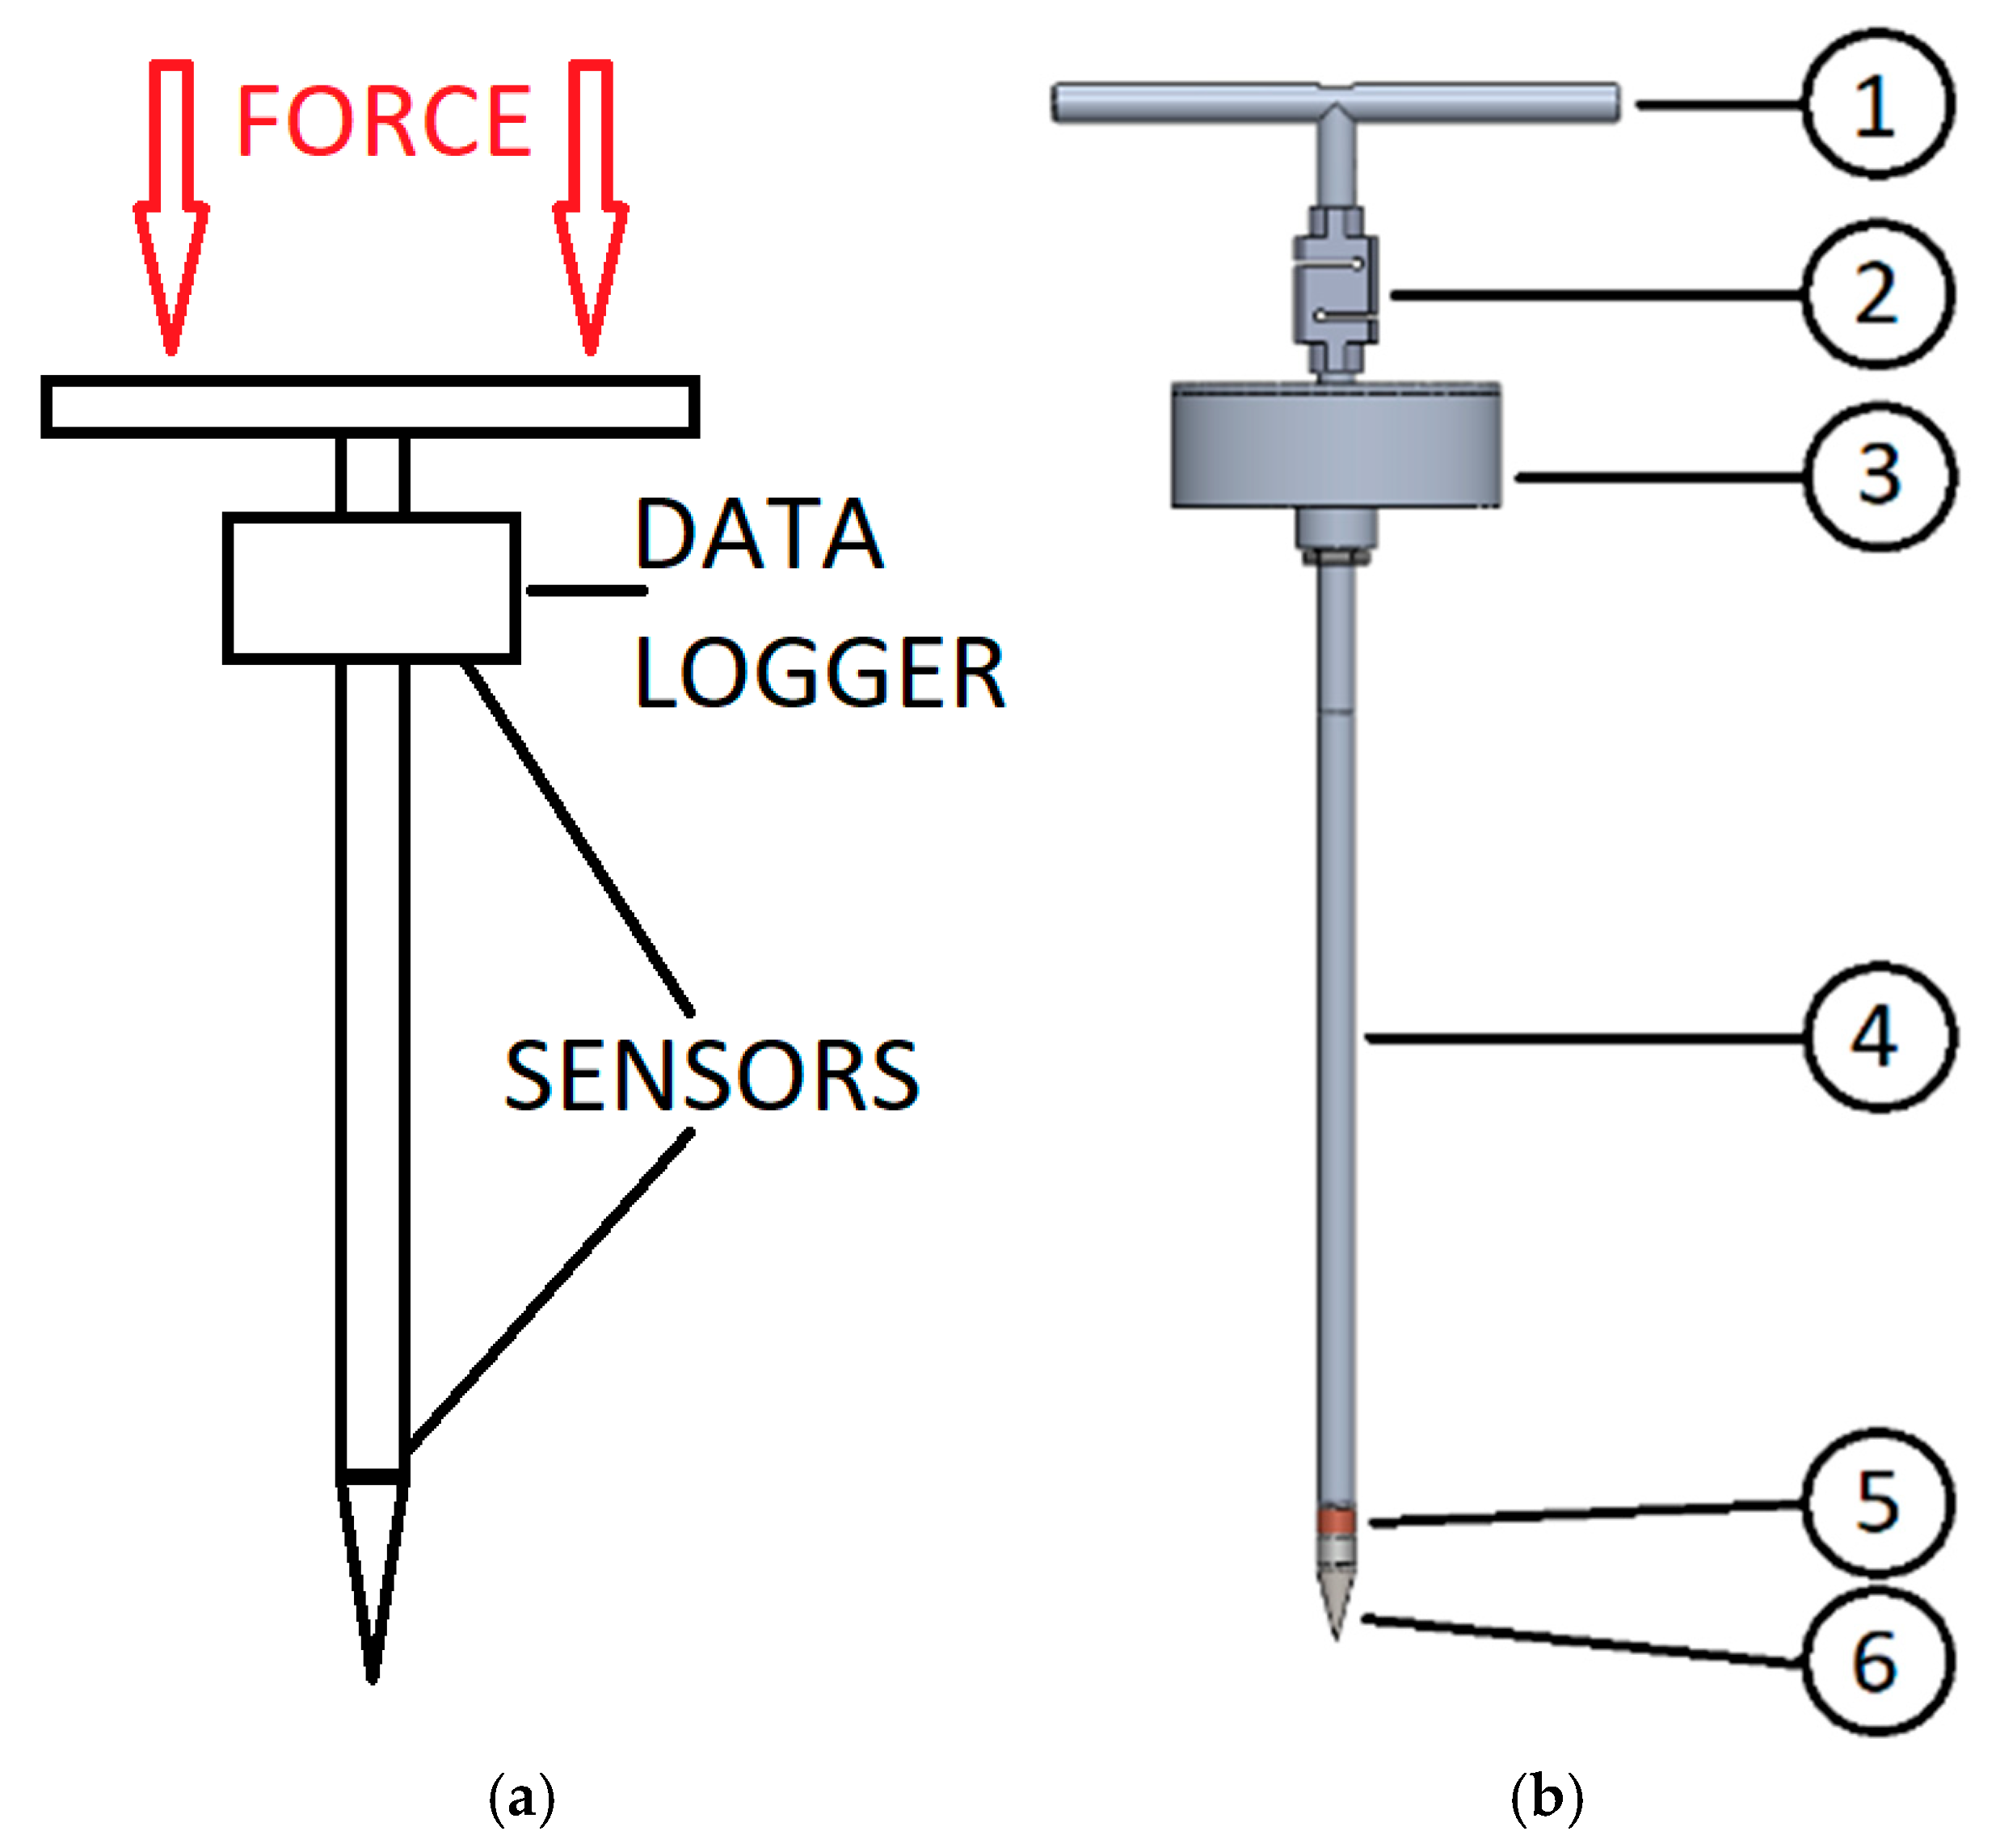
The prototype device is designed as a handheld penetrometer (
Figure 3) with integrated sensors and a data logger, enabling simultaneous measurement and data recording. To ensure comparability of results, the device is designed to apply the load axially to the rod, thereby minimizing the influence of lateral forces on measurement accuracy [
13].
The general concept of the designed device construction is presented in
Figure 3b and the use of electronic components in
Figure 4.
As shown in
Figure 3b, the assembled device consists of a central rod and a removable measuring cone with a standard 30° apex angle, in accordance with ISO 22476-1 [
44]. The cone is attached to the rod, which is connected to a force sensor positioned between the rod and the handle. The force sensor measures the axial force generated during penetration into the soil.
A laser-based distance sensor is used to measure probe depth. The sensor is mounted at the top of the device, with the laser beam directed parallel to the rod axis toward the cone. Depth and force data are recorded simultaneously, enabling the generation of penetration resistance profiles as a function of depth, consistent with approaches in previous studies [
45].
To measure soil moisture, a galvanic sensor is integrated into the lower part of the rod, ahead of the cone. The sensor consists of two electrodes made of copper and zinc. When the device is inserted into the soil, the electrodes form a galvanic cell with the soil water acting as the electrolyte. Under these conditions, the mineral content has a limited influence on the output voltage, as the current in the circuit is low. Consequently, the sensor output voltage remains stable even in mineral-rich soils. In the developed system, only the potential difference between the electrodes is measured.
The tension between zinc and copper is correlated with water content of the soil [
46]. The contact area of an electrode with the soil is approximately 817 mm
2. During operation, the voltage of the galvanic cell is measured by a microcontroller via an analog input and recorded in real-time. When the device is pressed into the soil, the values of the penetration resistance, moisture sensor, and measurement depth are recorded simultaneously, enabling a soil penetration resistance and moisture profile to be compiled.
When evaluating measurement accuracy, system time lag must be considered. The lowest sampling frequency is associated with the laser module (4 Hz), corresponding to a 250 ms update interval. Assuming a standard penetration rate, this results in a rod displacement of approximately 5 mm during one sampling period. Consequently, temporal misalignment between sensors introduces a maximum spatial offset of 5 mm, which must be accounted for in accuracy assessment. Volumetric soil moisture is obtained by converting the measured electrode voltage, as described in the
Section 3.
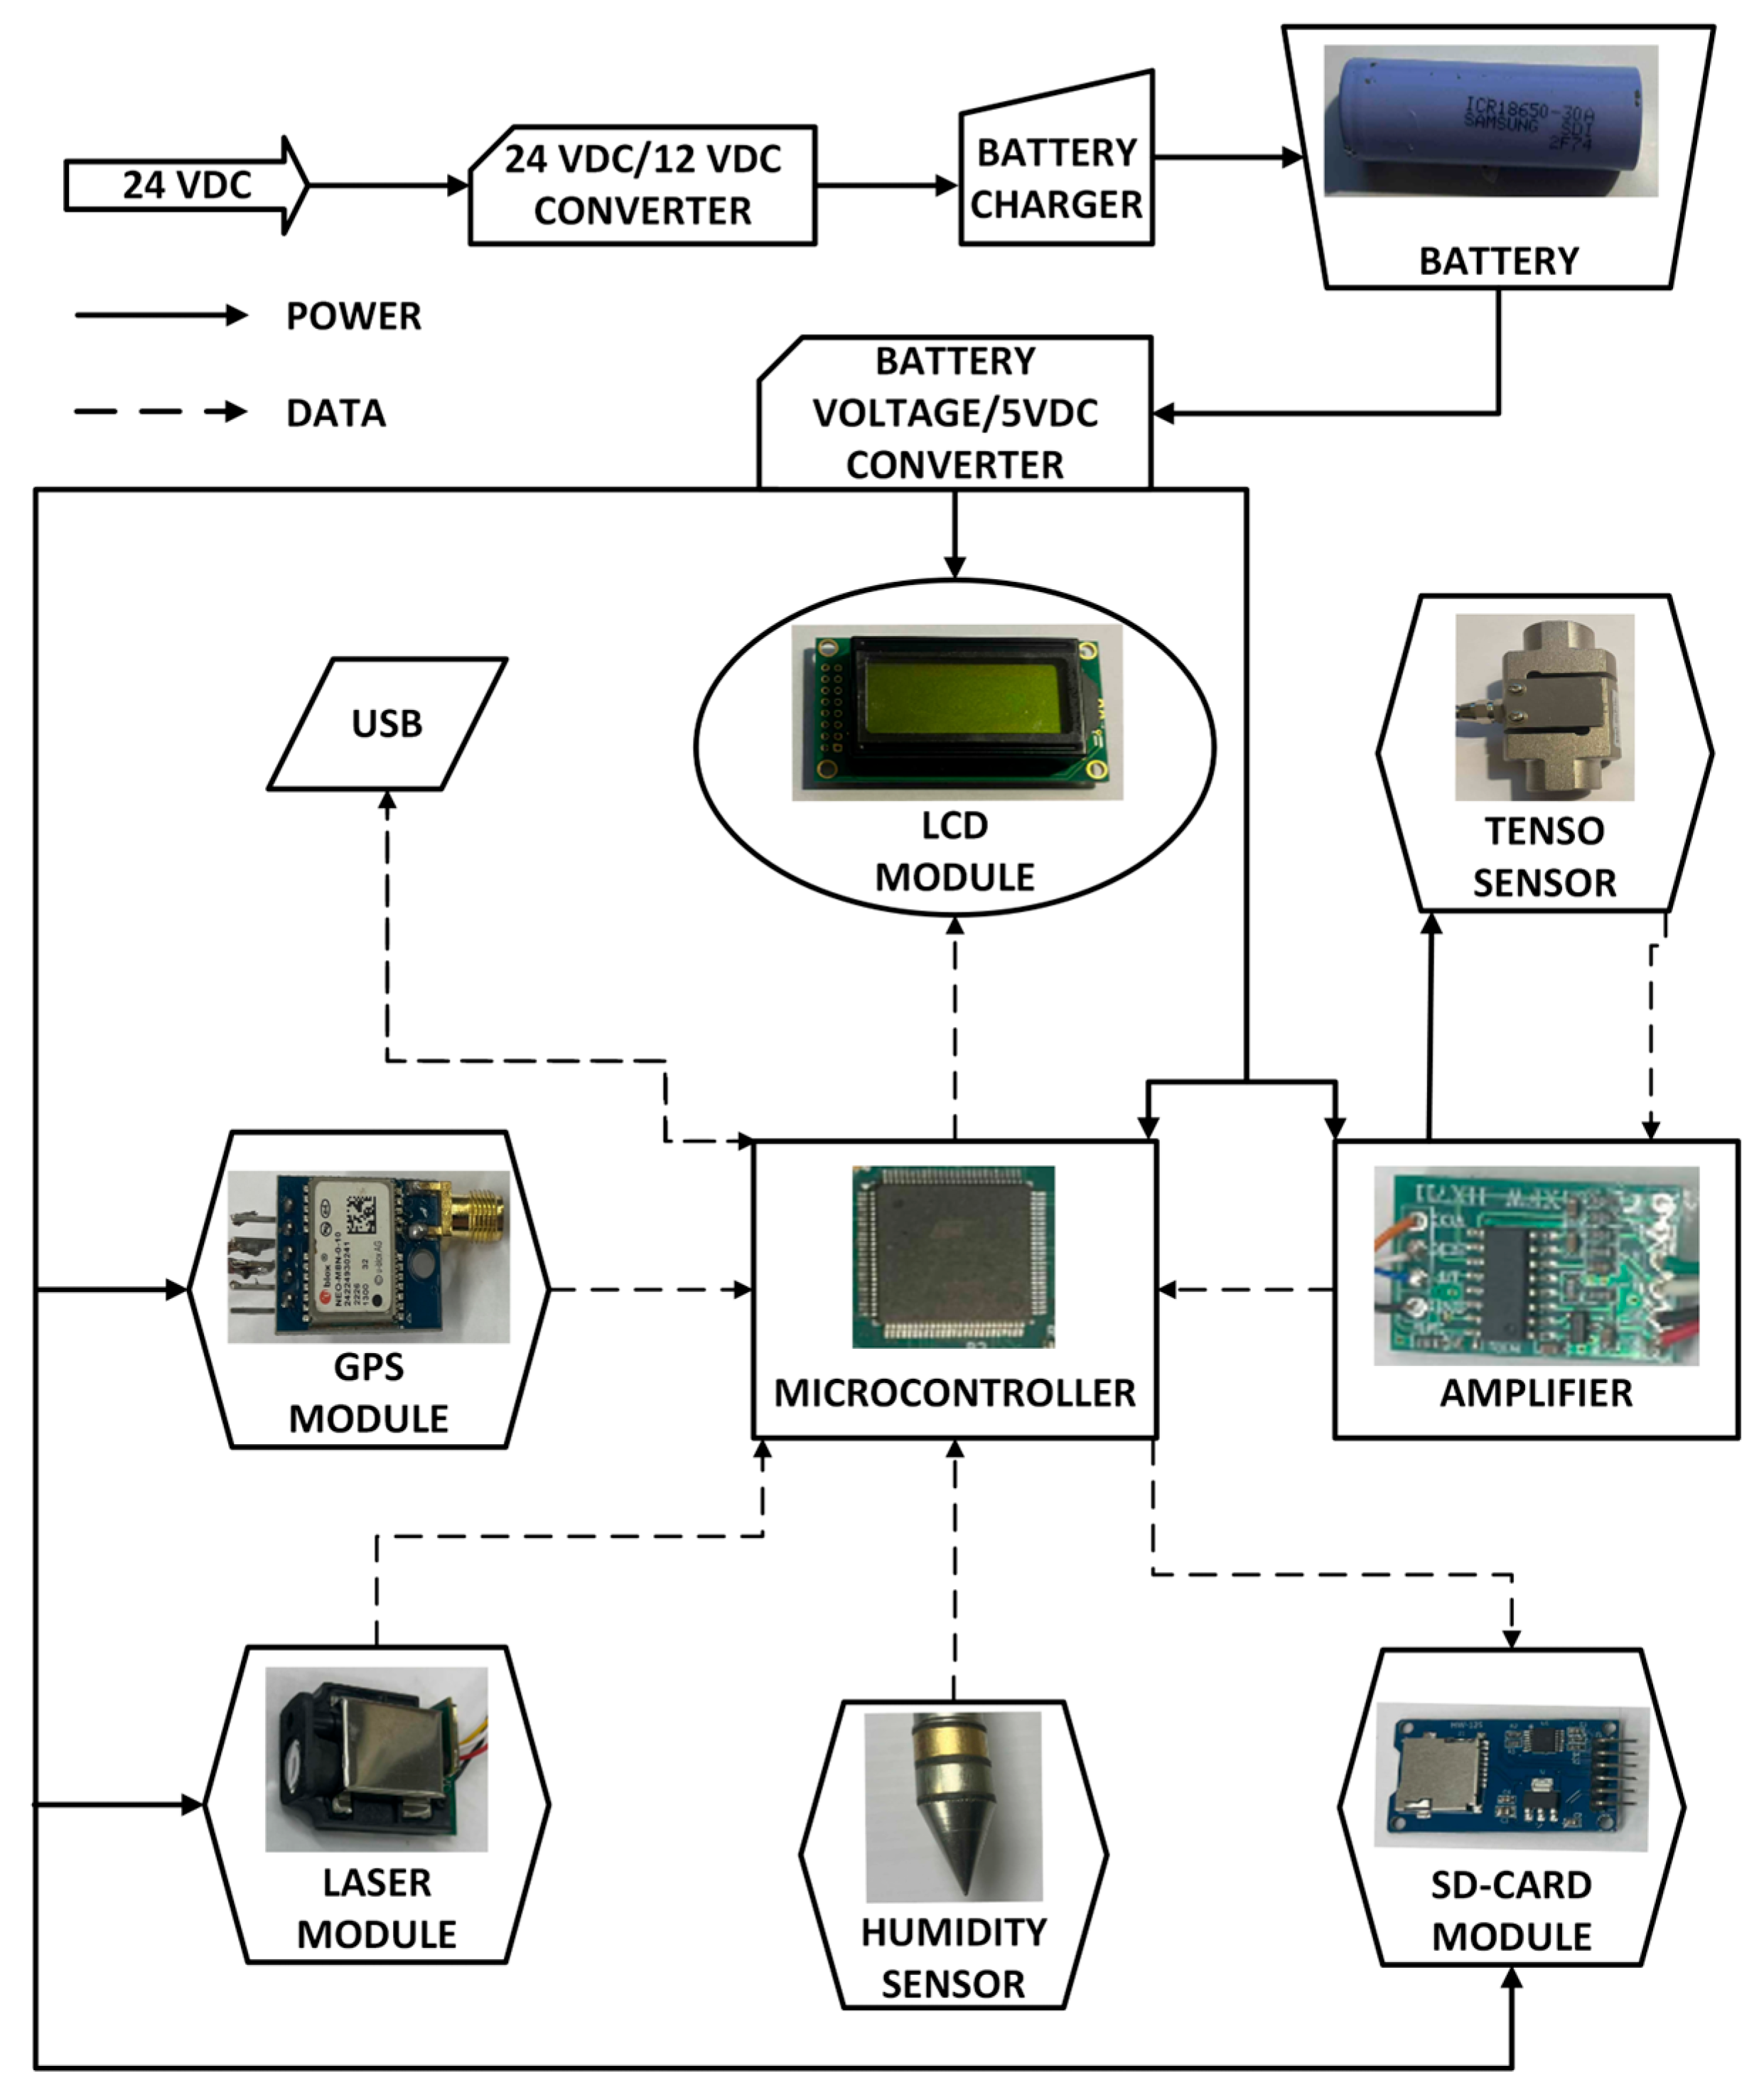
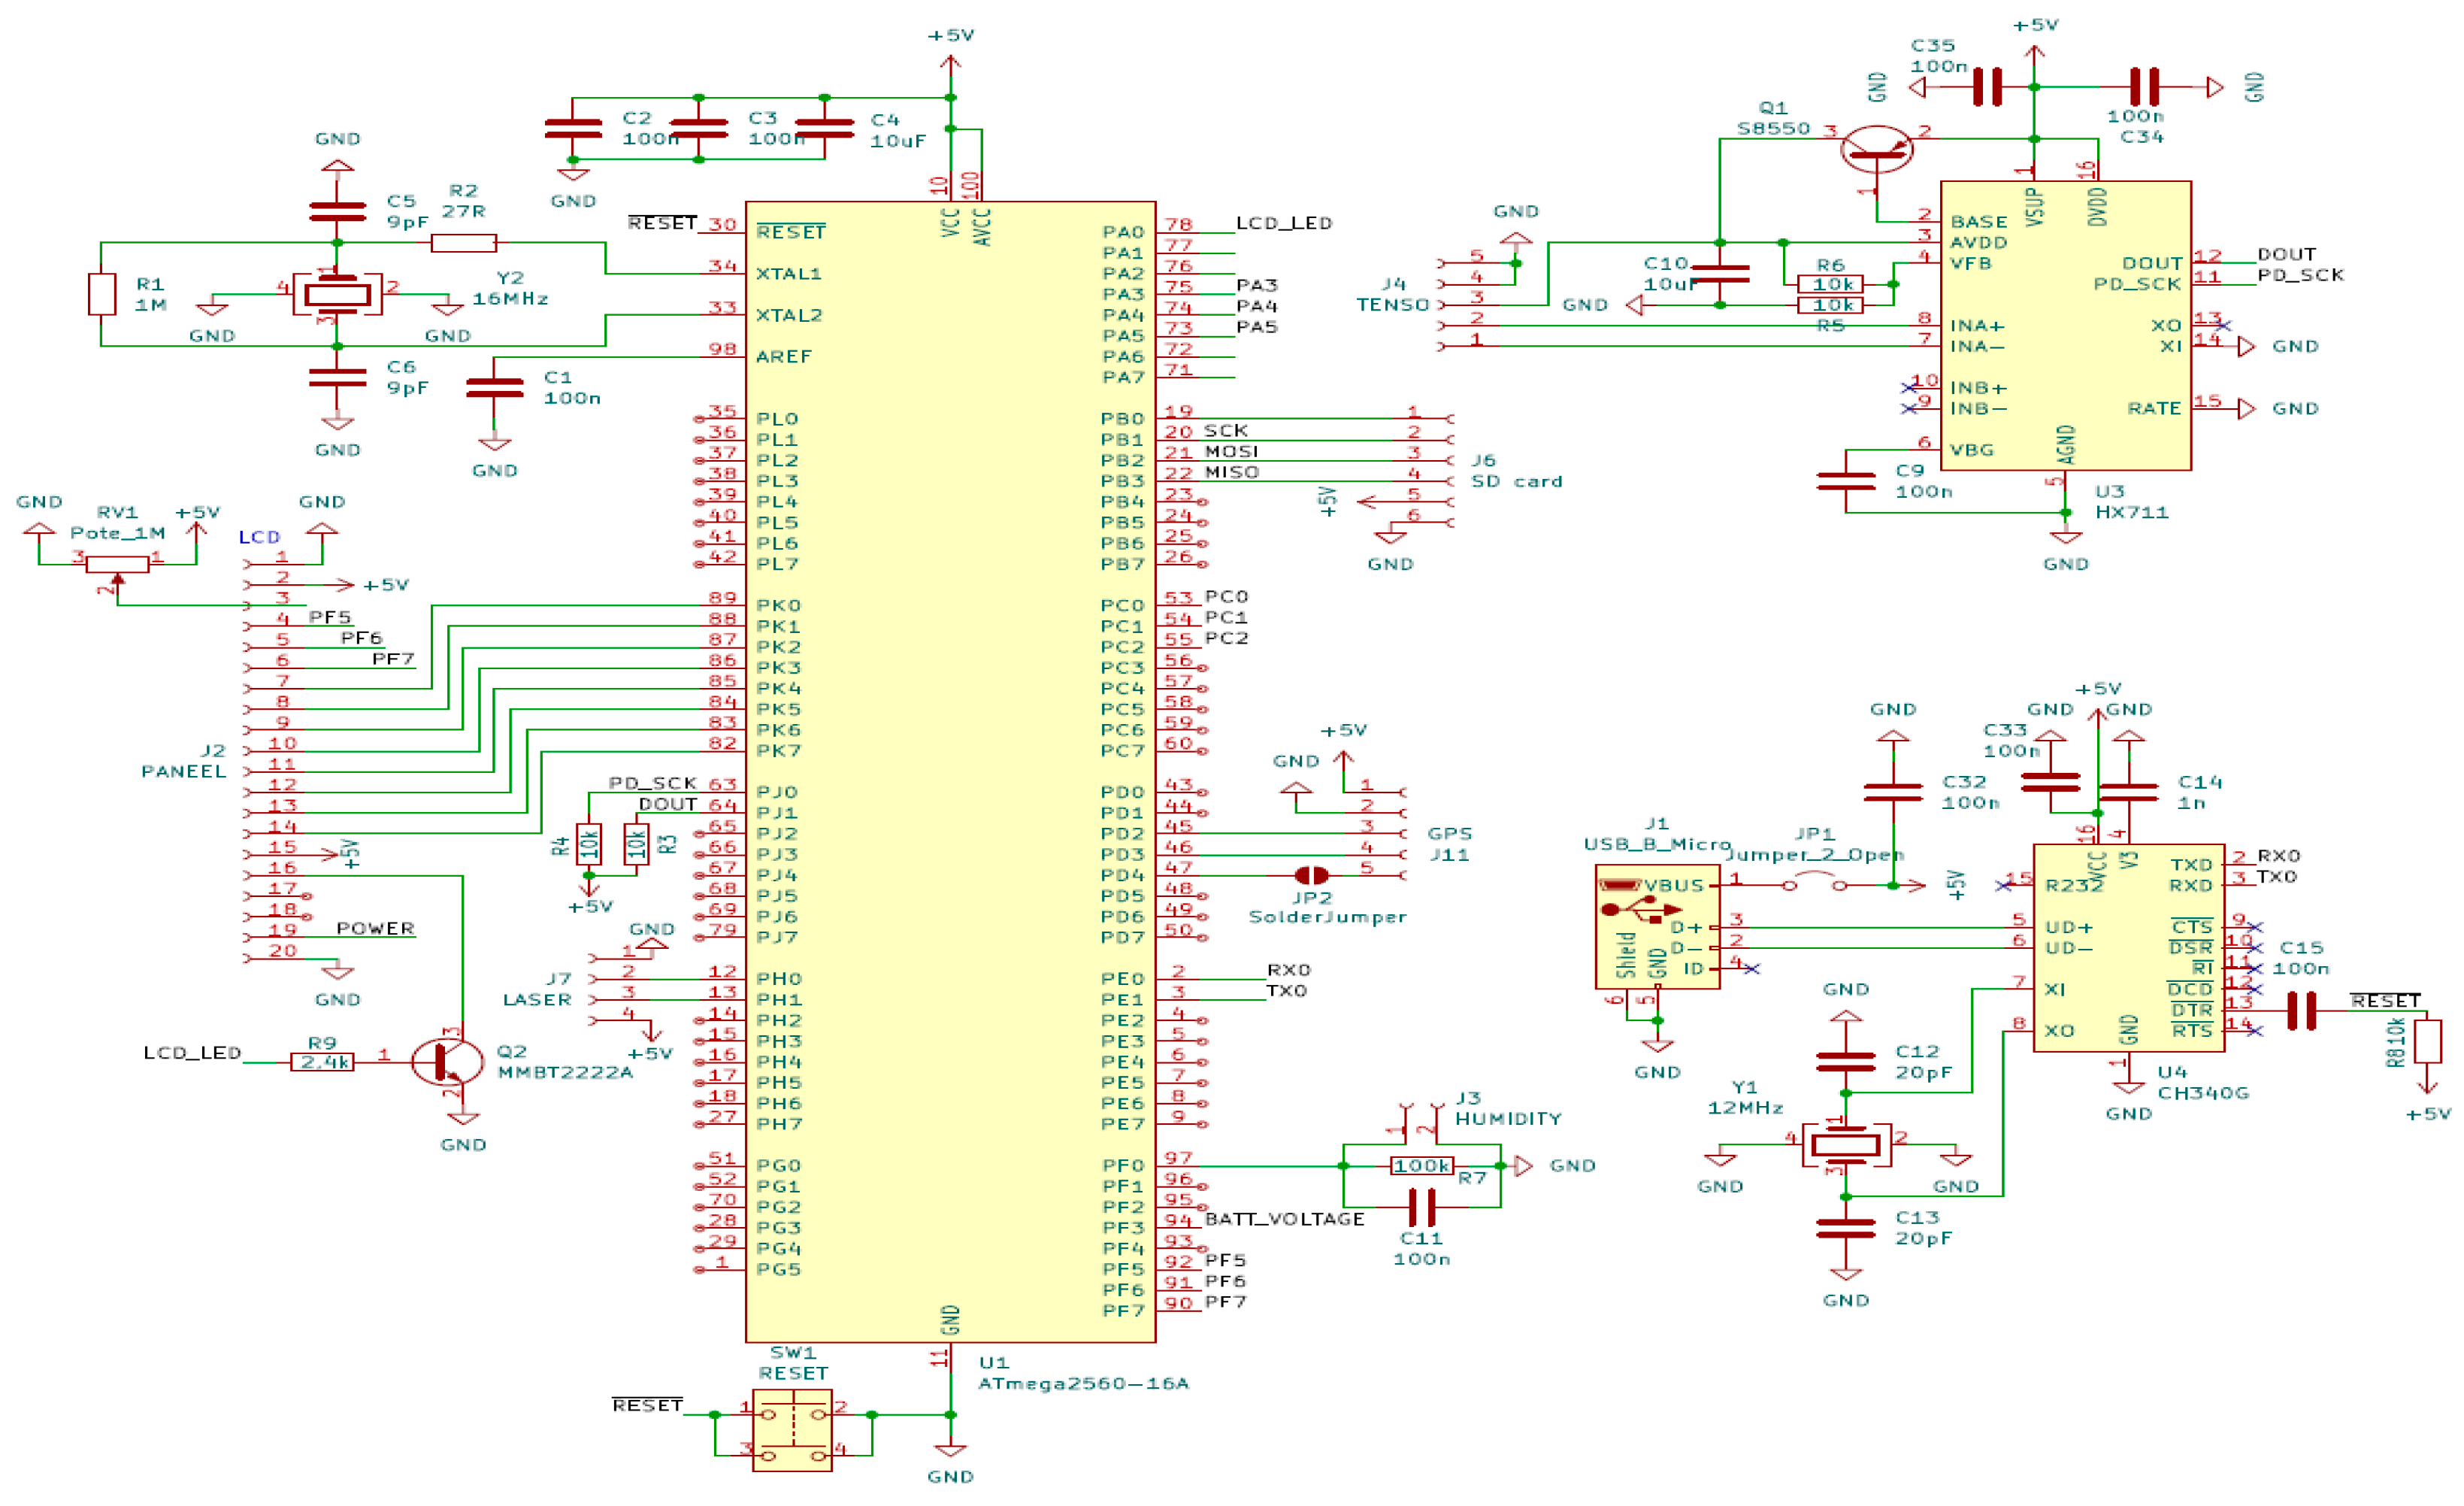
All sensors used in the device (strain gauge load cell, laser distance meter, and galvanic humidity electrodes) are connected to a microcontroller. This solution allows for the consolidation of measurement data from different types of sensors into a single system and ensures their simultaneous collection. Electrical connections, power circuits, and signal lines of the sensors are presented in
Figure 5 and
Figure 6, where the diagram of the entire measurement system is presented.
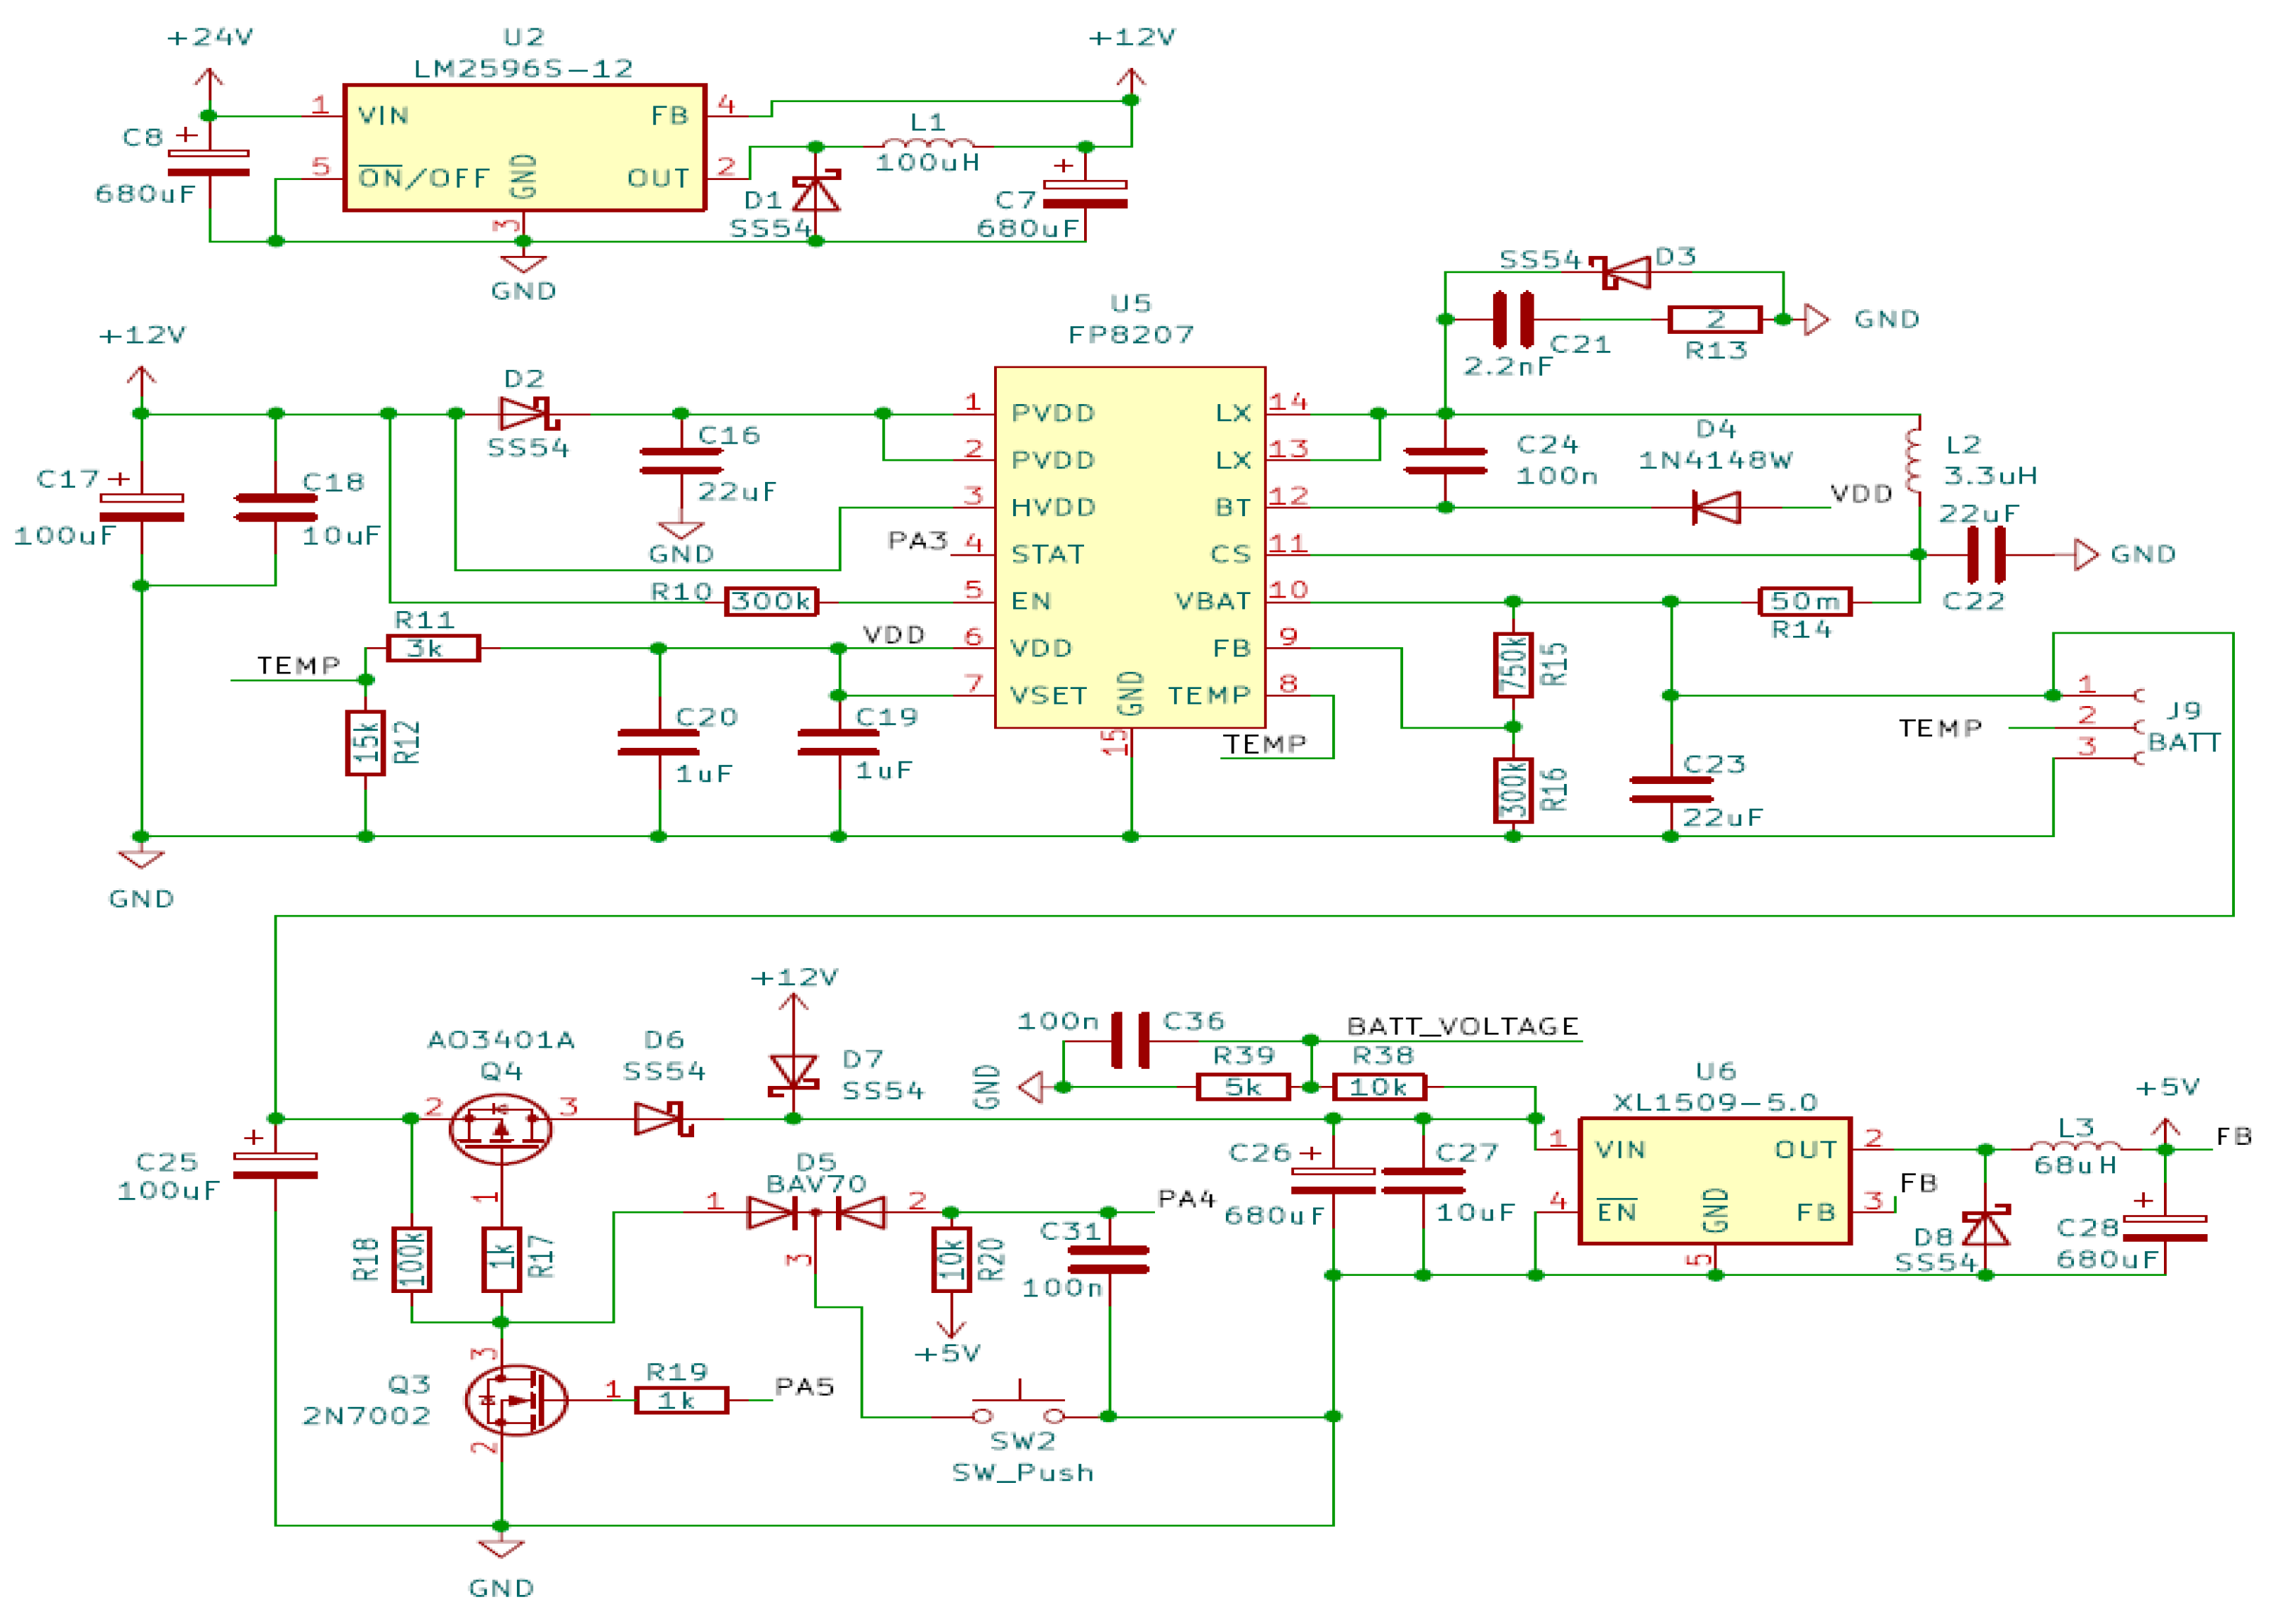
The power supply circuit is shown in
Figure 6.
The device is also equipped with a GPS-based location determination system. What is more, measurement data is stored on a memory card integrated into the device.
2.4. Moisture Sensor Calibration Procedure
To calibrate a galvanic moisture sensor, it is necessary to relate the voltage developed between the zinc and copper electrodes to the actual volumetric water content (VWC) of the soil. The calibration was carried out under laboratory conditions using dry soil with a stepwise increase in its water content. Oven-dried soil with a total volume of 1500 mL was used in the experiment. The soil moisture content was increased in 5% by volume steps, from 5% to 50%. At each step, a corresponding amount of water was added to the soil, calculated in relation to the volume of dry soil, which is expressed as:
where V
n is the water added (g), V
m is the volume of soil (cm
3), and s is the step change in moisture content in the experiment (%).
In each measurement, the sensor reading was recorded 2 s after voltage generation, corresponding to the moment the sensor contacted the soil. The tests were carried out at room temperature (21 °C). Calibration was performed with soil with a soil composition (according to FAO (Food and Agriculture Organization)) of 31% (clay), 47% (silt), 22% (sand) and a SOC (Soil Organic Content) of 7%. The soil sample was collected from southern Estonia, Tartu County (58.365131, 26.669275), at a depth of 10 cm. The dried soil was mechanically ground to obtain finer particles for efficient drying. The tests were conducted under identical conditions, with a mixing time of approximately 10–20 min. To determine the gravimetric and volumetric moisture, the soil used in the test was dried in an oven. The drying process lasted for 48 h at a temperature of 105 °C. The dried mixture was measured with an electronic moisture analyzer KERN MLS-D (Kern & Sohn GmbH, Balingen, Germany). The gravimetric moisture of the dried soil was 0.213%. KERN MLS-D is designed to determine the moisture content of liquid, porous, and solid materials. The analyzer determines moisture content using the thermogravimetric method.
After mixing the test soil, the soil was compacted with a pressure of 1 N/mm2. Before measurements, the soil was allowed to stabilize for approximately 30 min to avoid local moisture inconsistencies. The volumetric moisture content of the test soils was determined at each moisture level using two different devices:
Field Scout TDR 300 (3″ rods) (Spectrum technologies Inc., Aurora, Illinois, USA), which determined the volumetric water content of the soil;
KERN ALJ (Kern & Sohn GmbH, Balingen, Germany) series, which determined the sample mass in grams.
Gravimetric moisture determination was used to ensure measurement accuracy. The FieldScoutTDR300 device was used to obtain volumetric moisture reference data. The device is based on the TDR-based moisture determination methodology. The TDR sensor was chosen due to its high measurement accuracy, as it is considered one of the most accurate methods for determining soil moisture content. The Field Scout device can measure moisture in two setting modes, Standard and Hi Clay. Since the soil considered in this work is characterized by a higher clay content, the Hi Clay setting was used for the reference measurement. The reference data is important to determine the effect of salt on the TDR-based measurement system and to compare it with the developed galvanic cell measurement device.
At each moisture level, 10 replicate measurements were carried out. A 10 mL soil sample was taken and weighed with a KERN ALJ series device before and after drying. The samples were dried for 48 h at 105 °C after which the volumetric moisture percentage was calculated. The moisture sensor was calibrated using the KERN ALJ measurement results as reference data. In order to compare the sensor output with other similar ones, it was necessary to calibrate it for measuring the volumetric moisture content of the soil. To do this, the water content or gravimetric moisture content (GWC) of the soil sample must first be calculated.
To be precise, ω is the gravimetric moisture content (%), m
wet is the initial mass of the soil sample (g), and m
dry is the dry mass of the soil sample (g). The volumetric moisture content (VWC) can then be calculated, which is expressed as:
θv is the volumetric moisture, ρb is the dry density of the soil, ρw is the density of water, which is approximately 1 (1 in the calculations) at a given temperature.
The dry density
ρb is calculated as follows:
and
Ms is the mass of dried soil.
The measurement results were compiled in a table and analyzed using Microsoft Excel software 2013. To assess the calibration relationships, the coefficient of determination (R2) was calculated, which shows how accurately the trend line describes the data.
2.5. Determining the Effect of Salinity on Measuring Devices
To assess the effect of salinity, a calibration procedure similar to that described previously was applied. A total of 1500 mL of dried soil was used, and the moisture content was increased stepwise in three increments of 10%. In the first step, 10% water (by volume) was added, and measurements were performed using the FieldScout device, the developed device, and a 10 mL sample was collected for gravimetric moisture determination. In the subsequent steps, 10% water containing 5% salt (by volume) was added. Specifically, 7.5 g of salt was dissolved in 150 mL of water before measurements were performed.
3. Results and Discussion
The developed device allows simultaneous determination of soil penetration resistance, measurement depth, moisture, and geographic location, automatically saving the data to a memory card. Data is saved throughout the entire measurement cycle.
The development of the device is divided into stages, where the first stage describes the concept of the device, the second stage is the design and development, and the third stage is the sensor configuration stage.
3.1. First Stage: Concept
As is customary in a product development process, a literature analysis was performed, where existing devices and different solutions were reviewed. It became evident that there are different devices with the necessary functions described in the methodology section, but the determination of moisture in soils with high mineral content is still inaccurate. In addition, the devices are rather created for scientific purposes and are not available on the market. Based on this, the development process moved forward and the device concept was prepared (
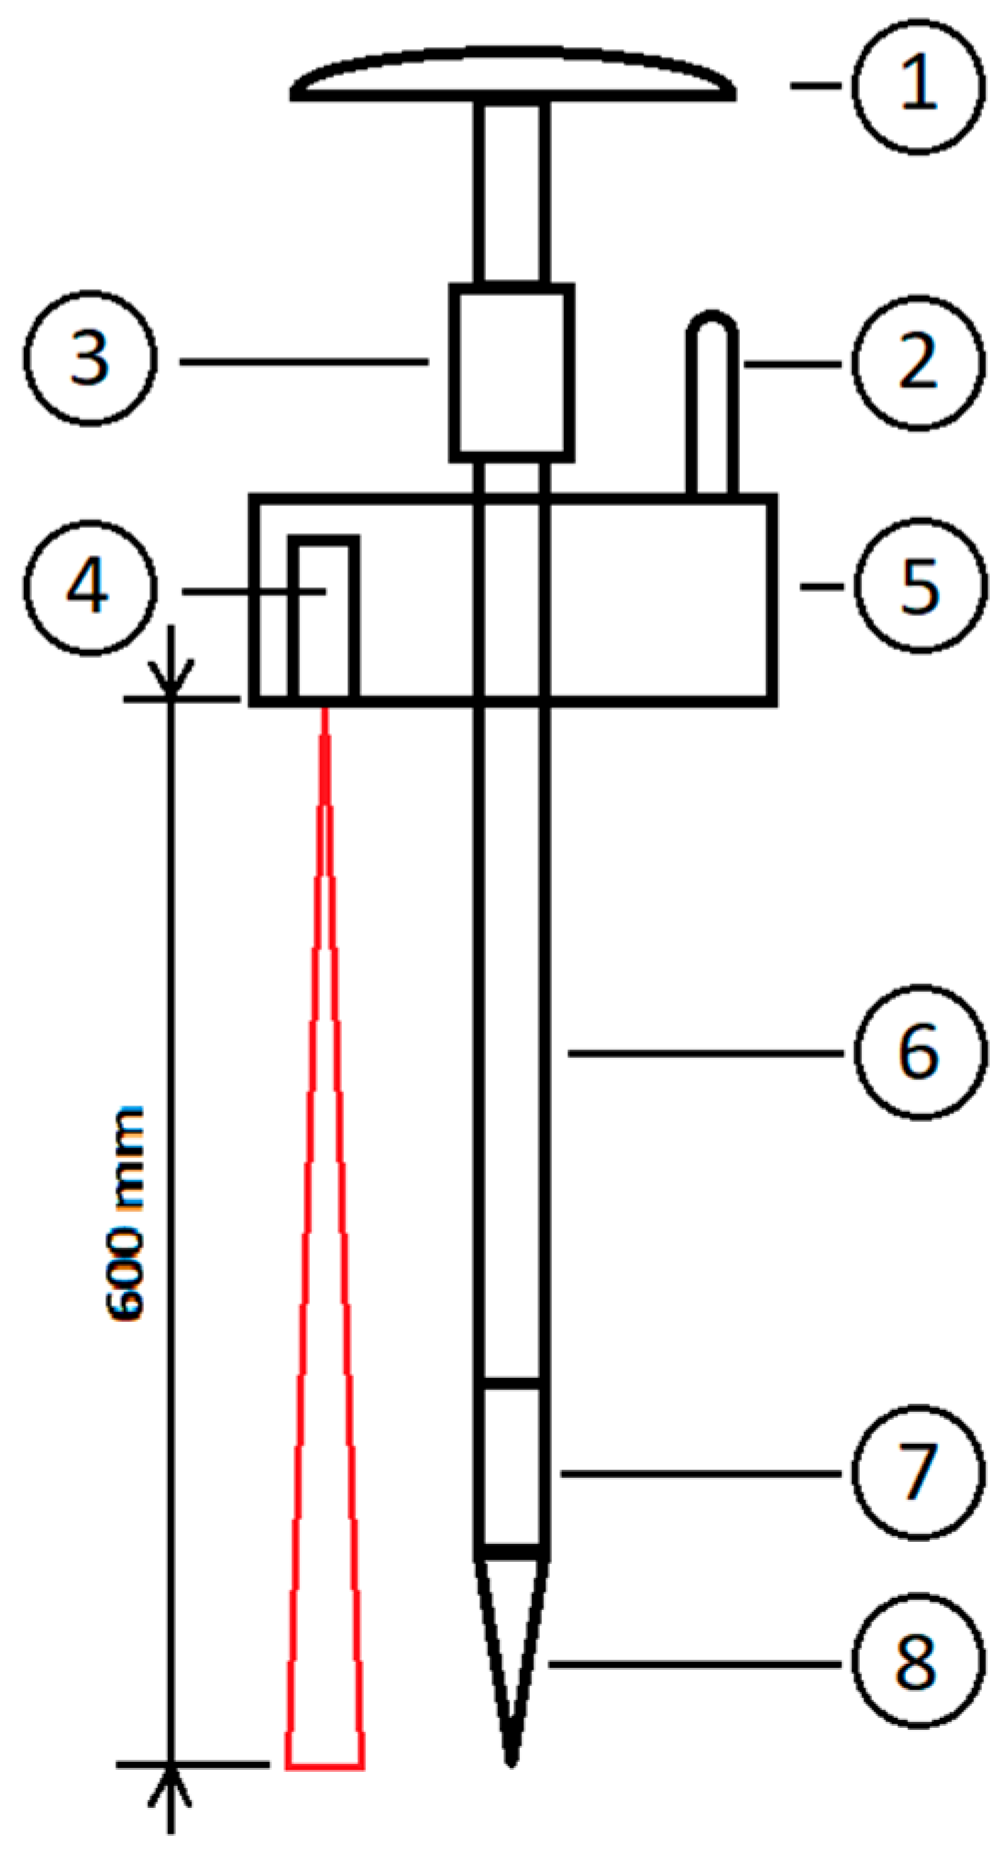
Figure 7).
The device is equipped with a handle to facilitate insertion into the soil. The electronics housing is compact yet accommodates all required control components, including the laser distance sensor. The maximum penetration depth is at least 500 mm; considering the specifications of the laser sensor, a minimum clearance of 100 mm between the sensor and the ground must be maintained at maximum depth. The moisture sensor is positioned near the end of the measuring rod to enable measurements across different soil layers.
3.2. Second Stage: Device Development
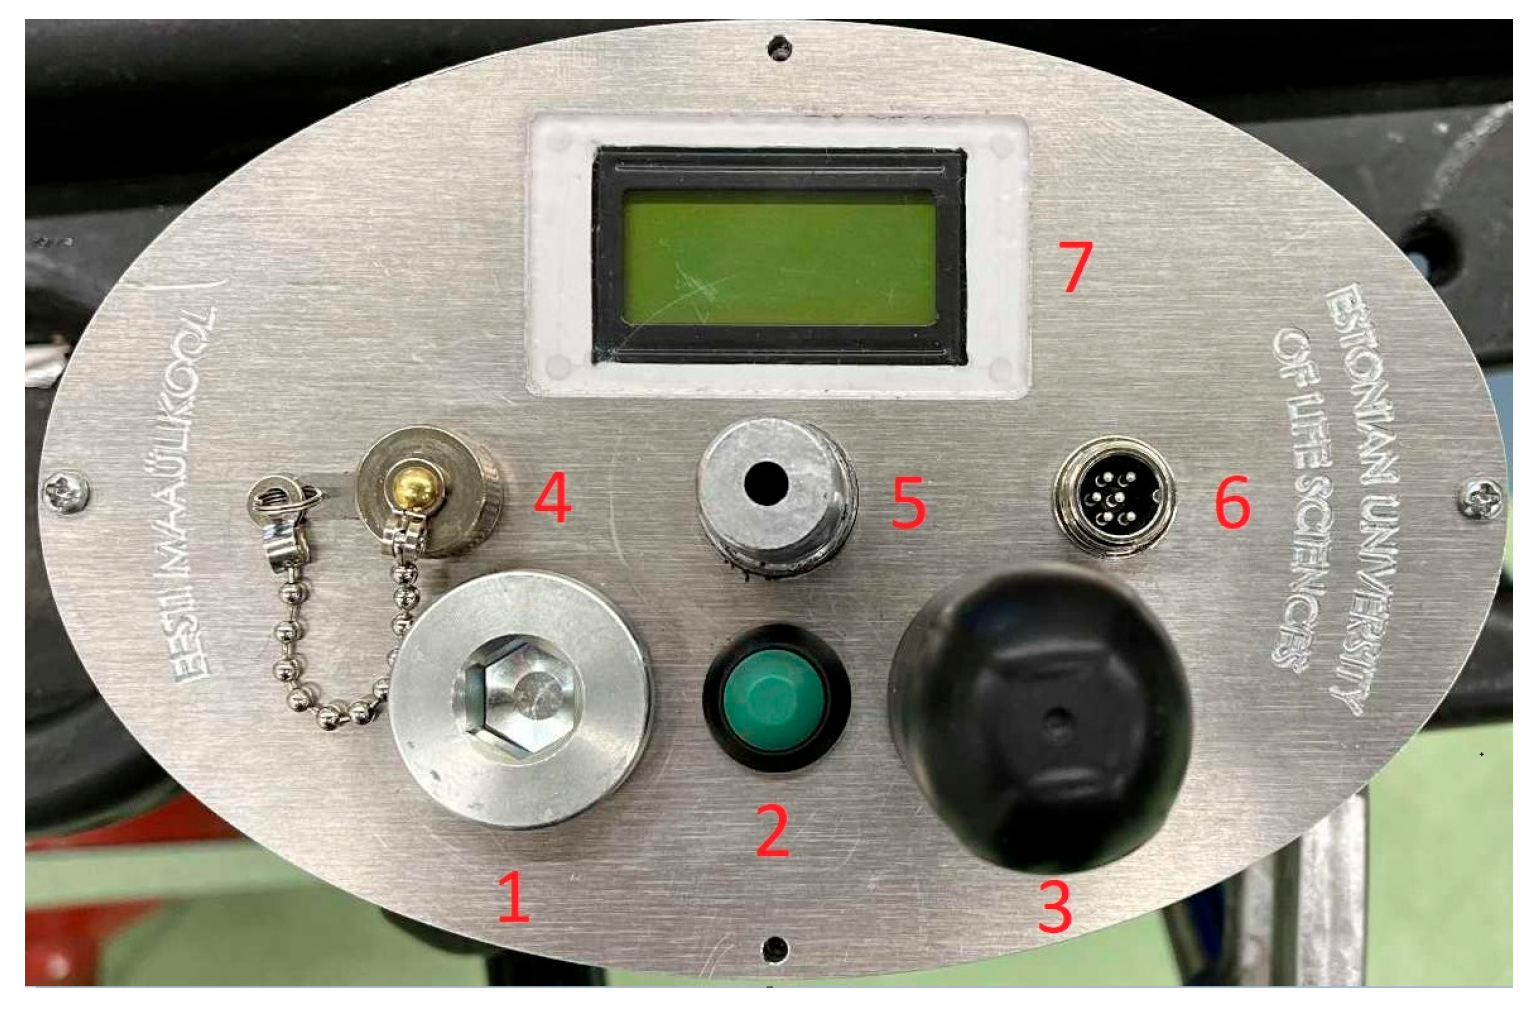
During the design process, it became apparent that maintaining the device at a 90° angle to the ground was difficult and depended strongly on handle geometry. Therefore, a T-shaped handle was selected to improve stability and ease of use. The force sensor is connected between the handle and the rod via a threaded connection. The rod includes a central bore for routing the moisture sensor cables. The moisture sensor is positioned beneath the rod, immediately behind the cone, with cables routed through the rod to the electronics housing. The cone is attached to the rod via a threaded connection, allowing replacement as a wear component. The electronics housing consists of two parts (base and lid) and is designed with an oval shape to balance compactness, durability, and user comfort. The lid integrates a GPS antenna, a battery charging port, a force sensor connector, an SD card access port, an operation button, and an LCD display for primary data visualization (
Figure 8).
The LCD is used to read the initial measurement results and indicate the device’s readiness for operation. The display provides real-time information on soil moisture, penetration resistance, depth, and battery level.
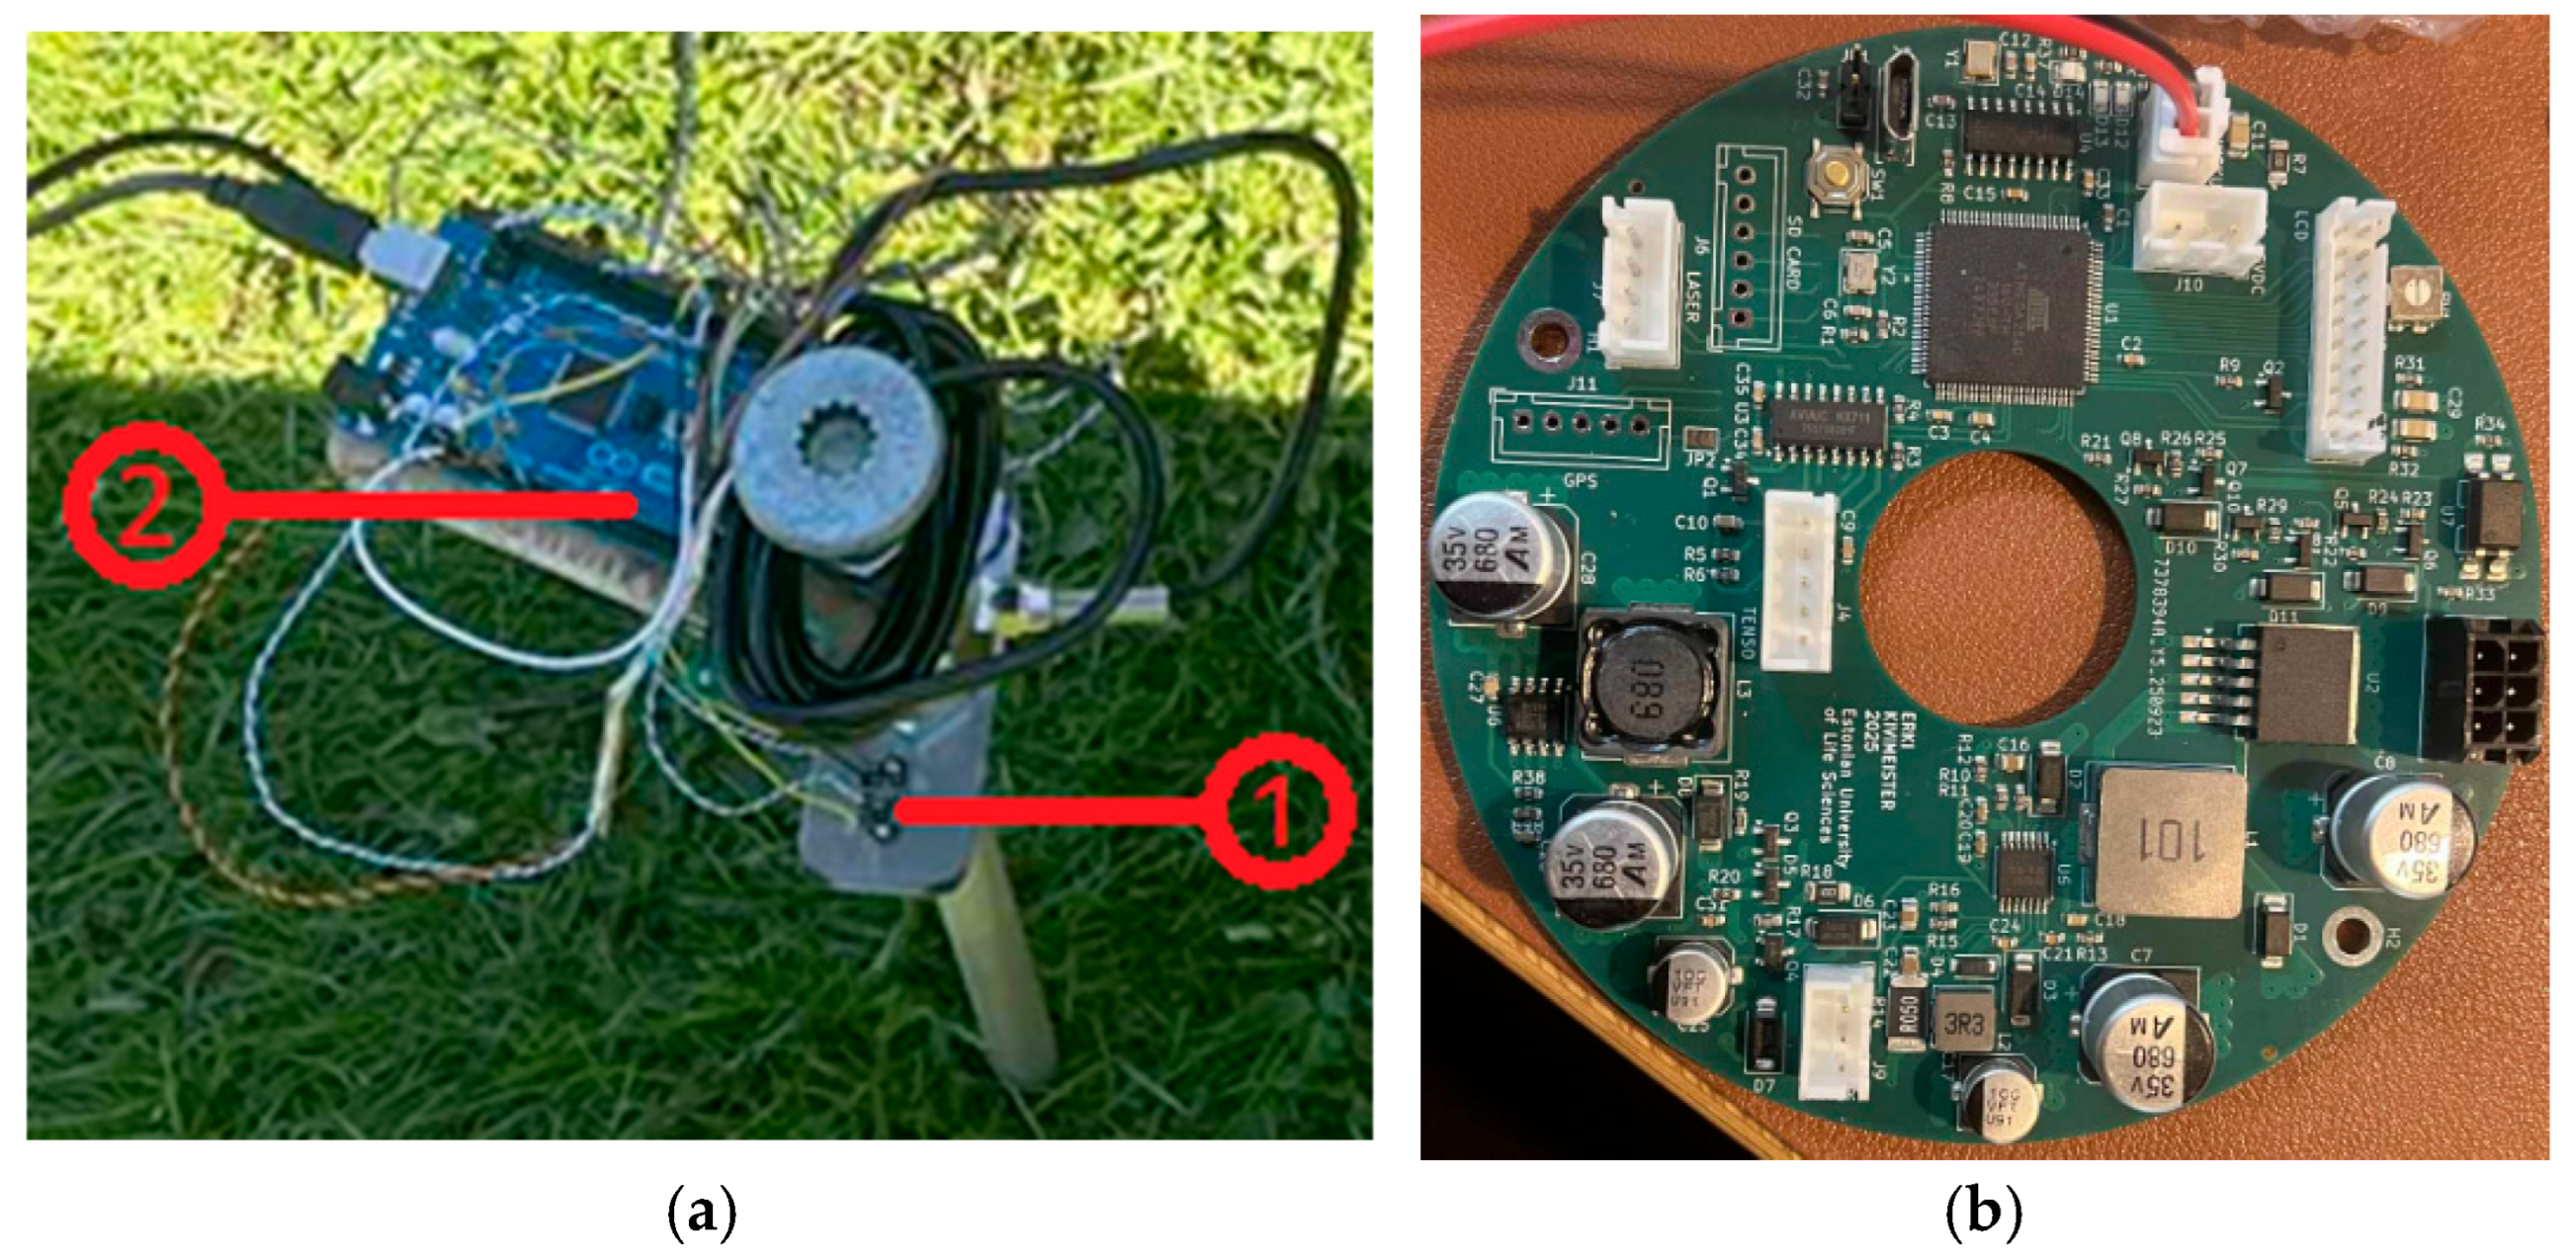
The development of the device began using the Arduino Mega 2560 (Arduino S.r.l., Monza, Italy) development board (
Figure 9a pos. 2), which was later replaced with a printed circuit board specially adapted for the device, where the same microcontroller was used (
Figure 9b).
The device supply voltage is 24 VDC and is reduced to 12 VDC by a voltage regulator. The battery, with a nominal voltage of 7.2 VDC, is charged via the FP8207 integrated circuit, which operates at 12 VDC. The battery output voltage is regulated to 5 VDC by a voltage regulator.
The strain gauge load cell is connected to a signal amplifier, which is connected to the serial interface of the microcontroller. The solution is similar to that presented in other research papers [
47]. The laser-based distance sensor provides a digital output through a second serial interface, from which the microcontroller reads out the distance between the sensor and the ground, based on which the measurement depth is calculated. The initial prototype used the VL53L0X (STMicroelectronics N.V., Plan-Les-Ouates, Switzerland) laser distance sensor (
Figure 9a pos. 1), which is compact and allows measuring distances up to 2000 mm, sufficient for this solution. However, tests indicated that the reliability of the sensor decreases in direct sunlight. Therefore, the VL53L0X sensor was replaced with a more capable SEN0366 sensor, which works more stably in direct sunlight conditions and is less sensitive to various disturbances.
The voltage between the zinc and copper electrodes of the galvanic moisture sensor is continuously measured by the microcontroller via a 10-bit analog input, as soil moisture typically varies with depth. A 1.1 V reference voltage is applied, resulting in a resolution of approximately 1 mV per reading. This corresponds to a measurement range divided into 1024 discrete levels, which are used as raw data for sensor calibration. The microcontroller organizes the measurements according to depth to generate a soil profile for each measurement.
The location is determined using the NEO-M8N multi-satellite GNSS module (GPS, GLONASS, etc.), with a positioning accuracy of approximately 3 m under open sky conditions with a good signal. The module communicates with the microcontroller via the first serial interface, transmitting latitude, longitude, and UTC time. At each measurement, the system records the test location with GPS coordinates and UTC time.
All sensor and GNSS data are recorded in real time on a microSD card connected to the microcontroller. The SD card module communicates via SPI. Time-stamped data are stored for each measurement, including depth, penetration resistance at the cone, volumetric moisture, and GPS coordinates. The device features an LCD with an LED indicator that provides user feedback (e.g., penetration resistance or moisture levels). After testing, the data file can be imported into analysis software for visualization and further analysis.
The Principle of Operation of the Device
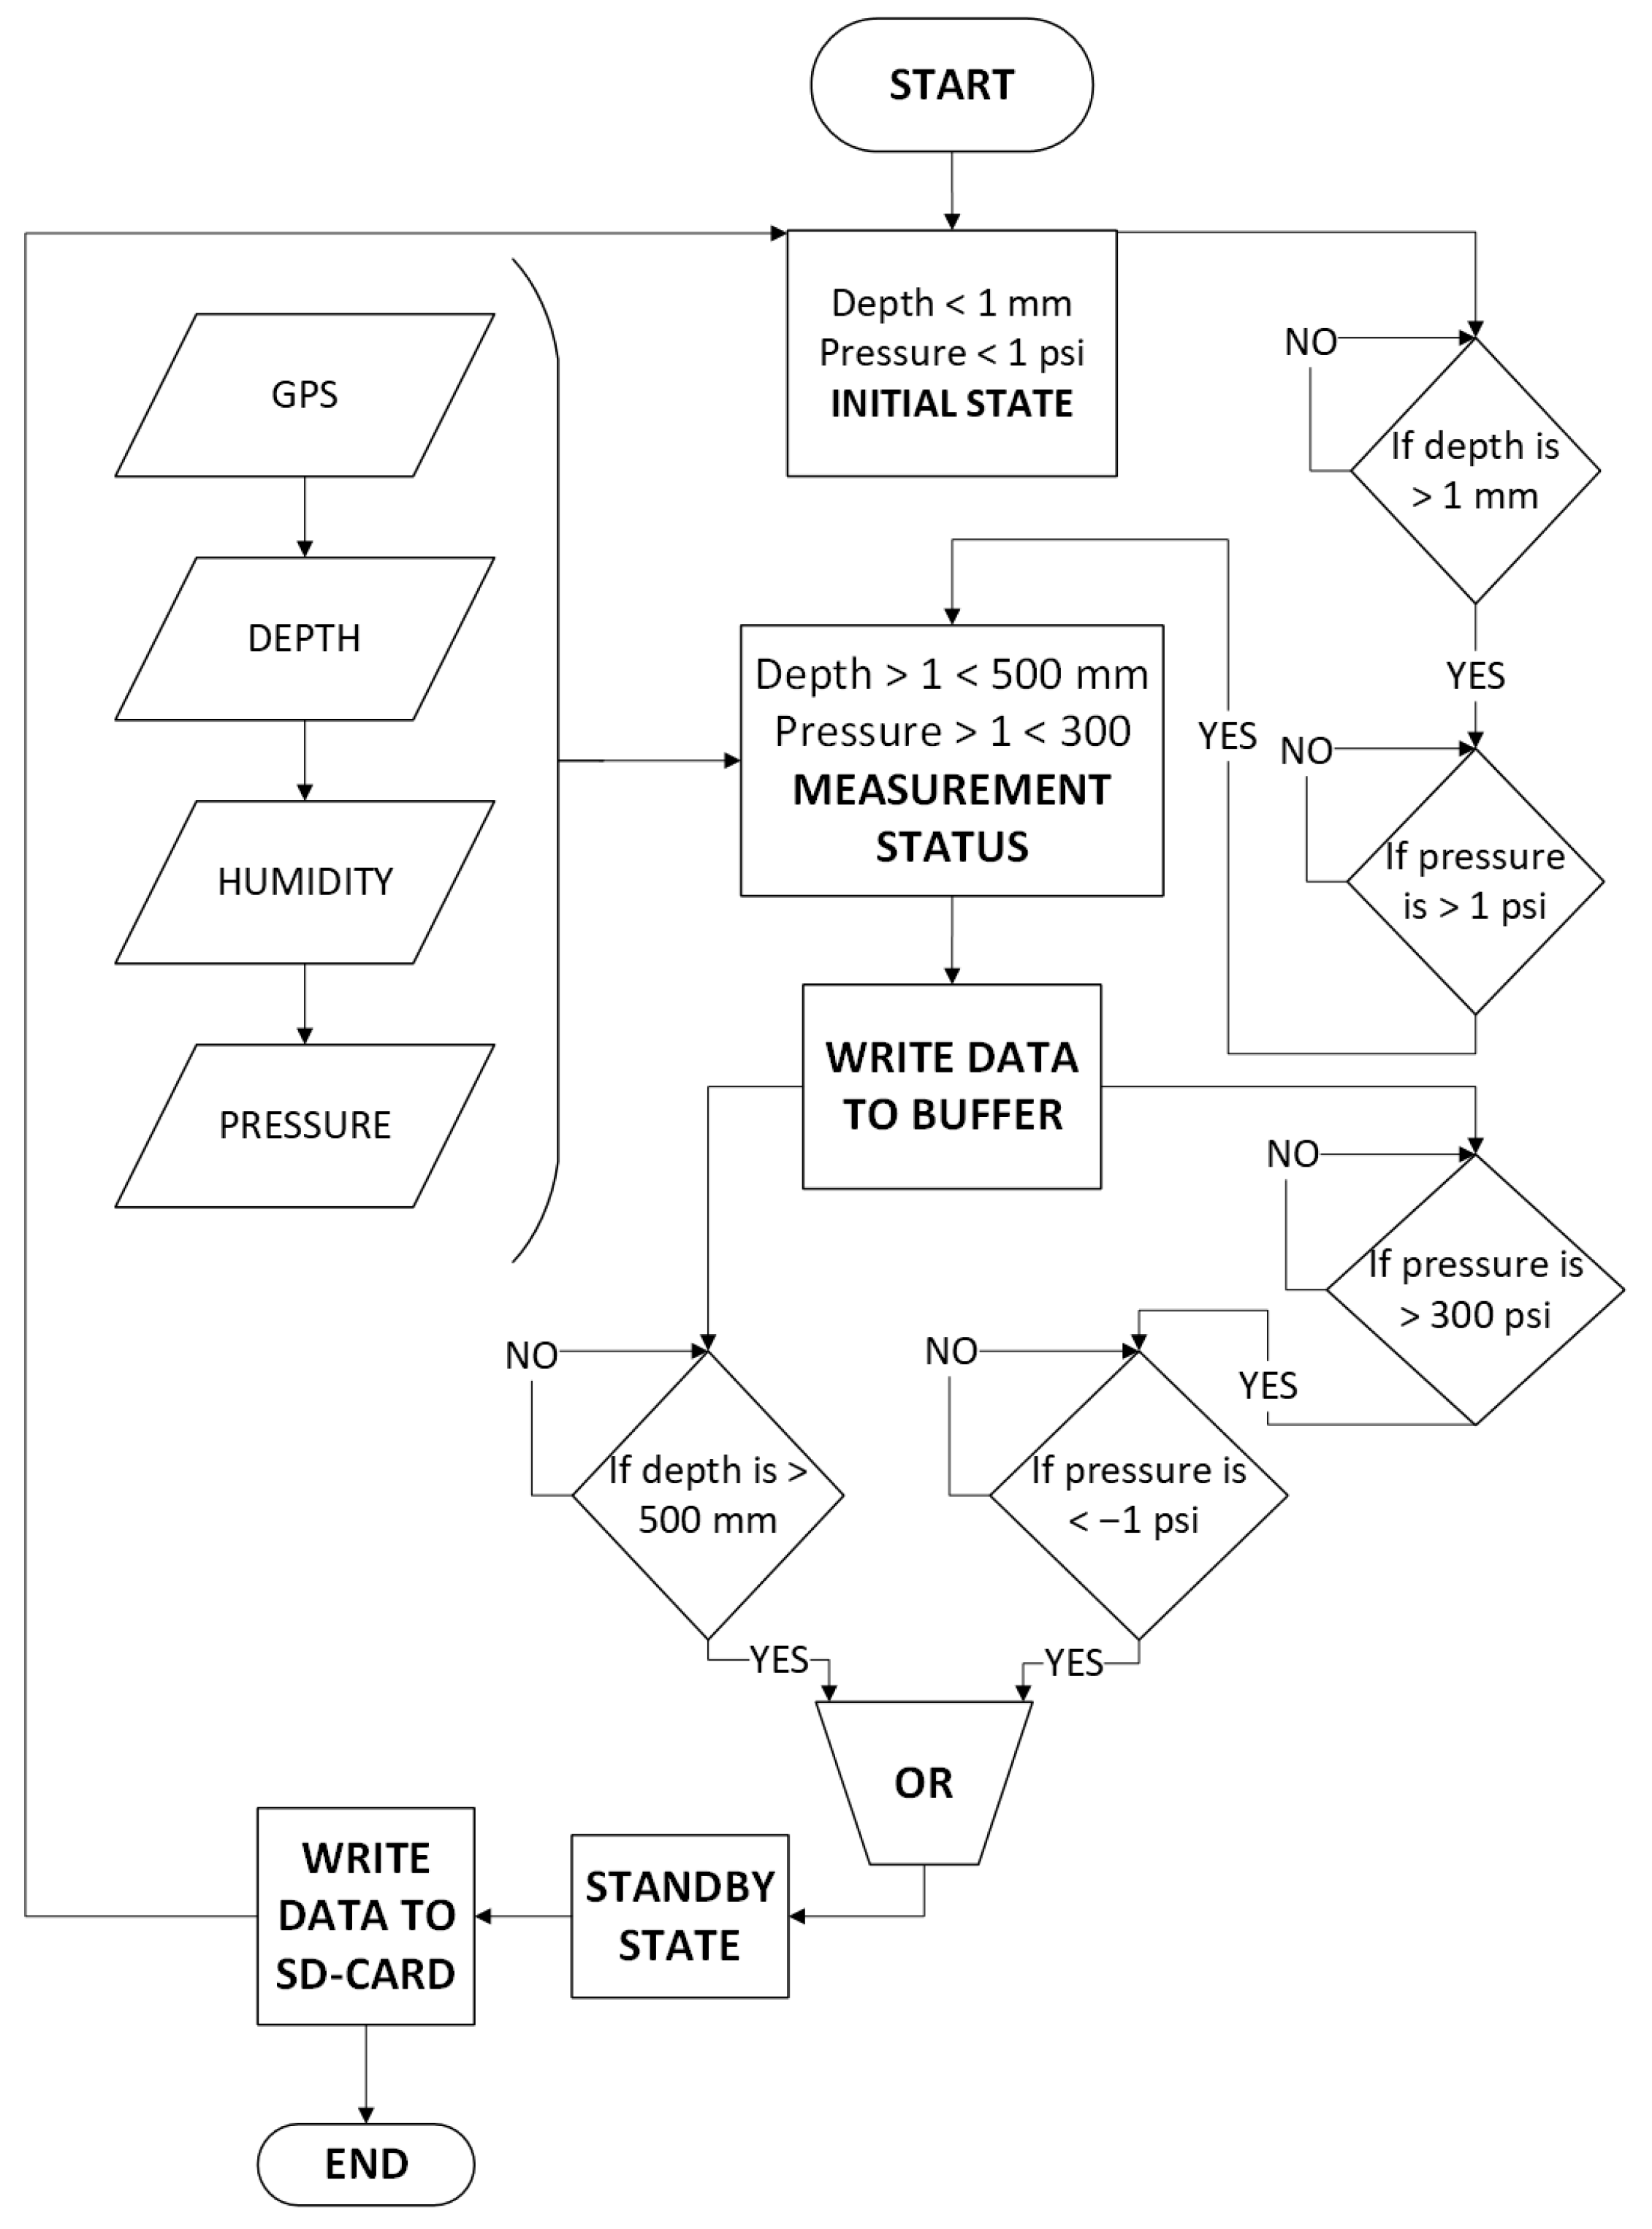
The operating principle of the device is described in
Figure 10 below. The software has been compiled according to the principal diagram.
The operating logic of the device is implemented as a finite state machine comprising three primary states: the initial state, the measurement state, and the wait state. The initial state is responsible for system startup and for monitoring the conditions required to initiate a measurement cycle. During this state, the device performs initialization of all relevant modules and continuously evaluates whether the predefined measurement criteria are satisfied. A transition from the initial state to the measurement state is triggered only when both of the following conditions are met simultaneously: the insertion depth of the device exceeds 1 mm, and the penetration resistance exceeds 1 psi.
The purpose of the measurement state is to collect measurement data. In this state, the parameters necessary for the operation of the device are continuously measured and stored in the buffer memory according to the current depth. This means that each measurement point is associated with a specific depth value, which allows the data to be analyzed correctly later. The measurement state lasts until a predetermined termination condition is reached. The transition from the measurement state to the standby state occurs when at least one of the previously defined termination conditions is met, such as maximum depth or maximum pressure value.
The purpose of the standby mode is to save the data of the completed measurement cycle and prepare the system for the next cycle. In this mode, the measurement data collected in the buffer memory is written to the SD card to ensure their permanent storage. When the data saving is successfully completed, the system is returned to the initial state. The device then starts monitoring the start conditions of the measurement cycle again and is ready to start the next measurement.
3.3. Third Stage: Setting Up the Sensors on the Device
3.3.1. Calibrating the Force Sensor
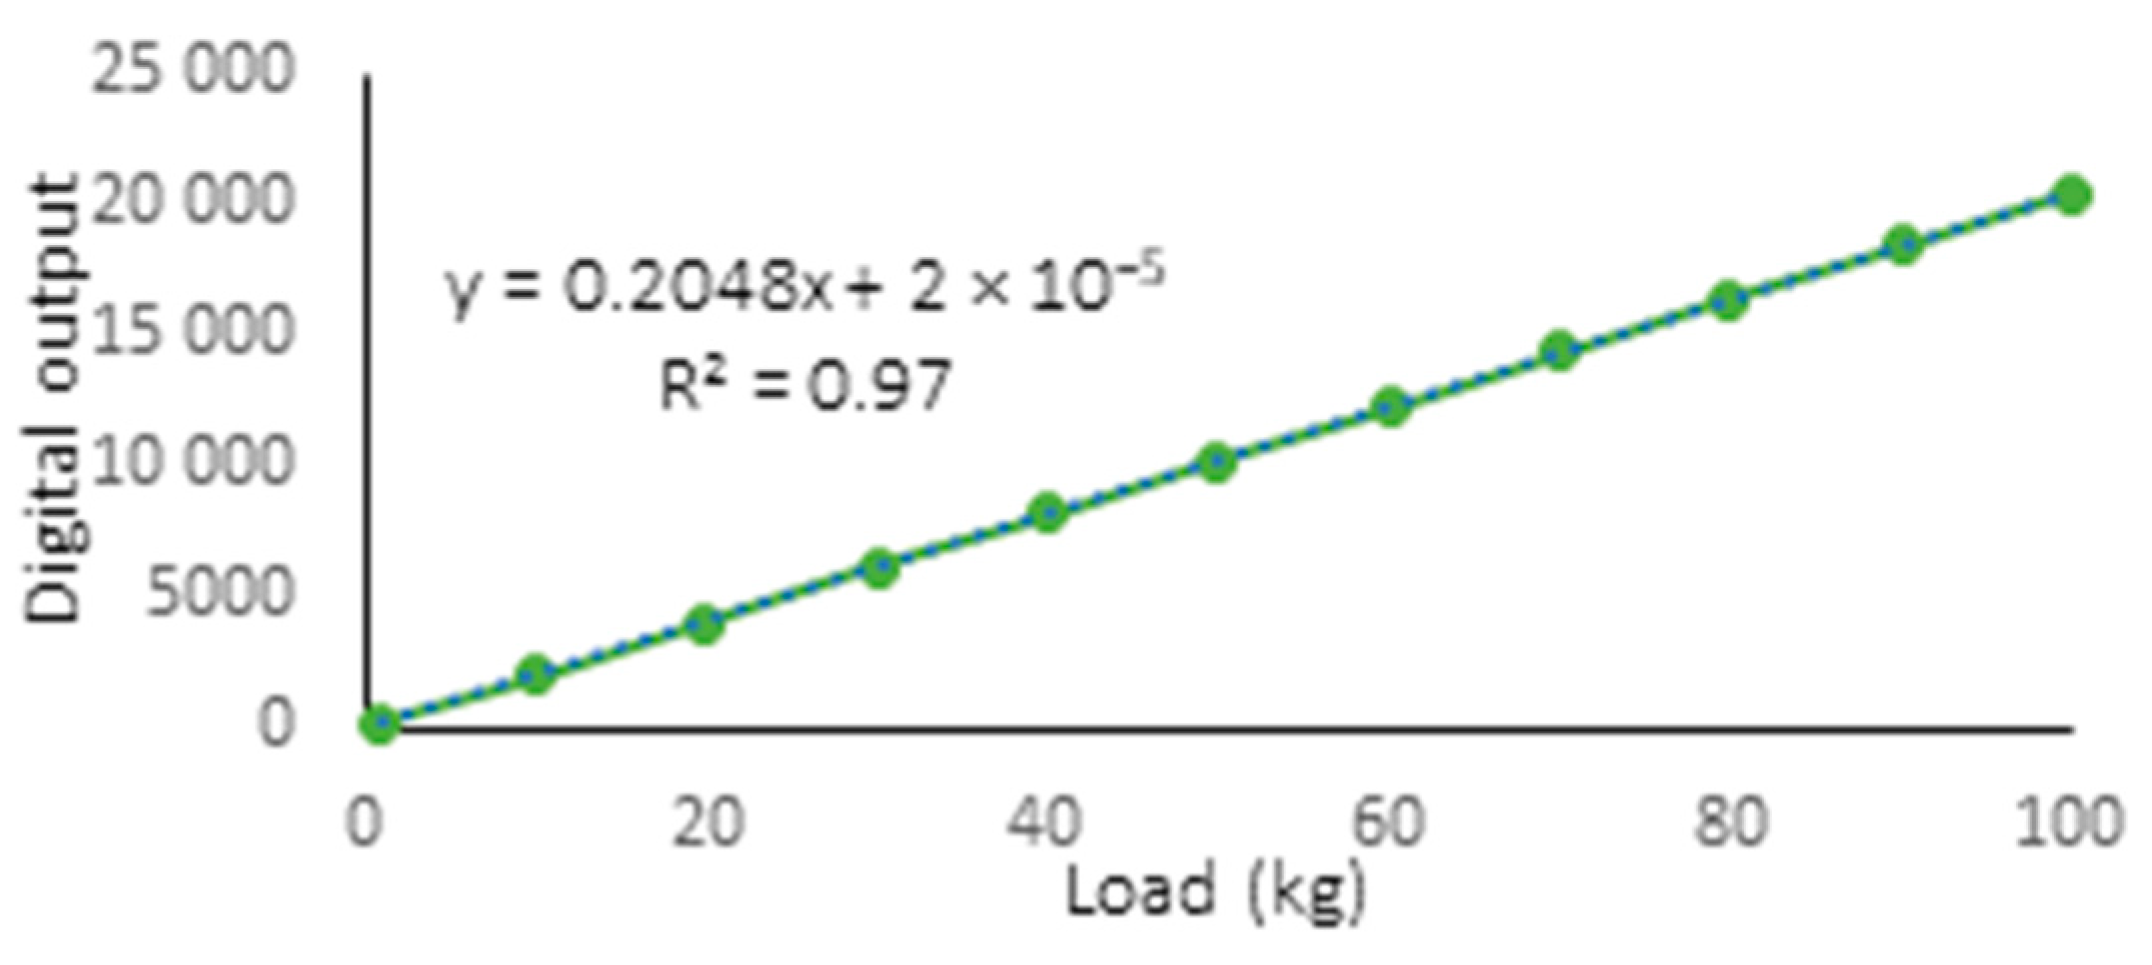
The force sensor used in the device was calibrated using known loads. The signal generated by the load was read through an amplifier circuit and transmitted to the microcontroller as a digital output. During calibration, increasingly larger loads were applied in 10 kg increments up to 100 kg, and the corresponding digital measurement result was recorded for each load level. The calibration relationship determined based on the measurement data was linear with the coefficient of determination R
2 = 0.97 (
Figure 11).
The sensor sensitivity was approximately 250 units per kg. This calibration was used to convert the sensor’s digital output into force and then calculate the penetration resistance (PSI) acting on the cone. When interpreting the results, the sensor’s measurement error must also be taken into account, which, according to the manufacturer, is 0.03%.
3.3.2. Calibrating the Laser Distance Sensor
The laser distance sensor module is factory calibrated; however, during setup it was necessary to determine whether the output distance is calculated from the front of the sensor or from the rear edge of the module. To check the accuracy, the sensor was moved by known distances and the result was compared with the module reading. The result indicated the measurement error to be less than 1 mm between 0 and 100 cm.
3.3.3. Calibrating the Moisture Sensor
In this work, two different types of moisture sensors were tested, capacitive and galvanic. First, a capacitive moisture sensor was tested, which consisted of two electrodes, a dielectric between them, and a signal processing circuit. The sensor oscillator was composed of a TLC555 integrated circuit, which generated a rectangular signal, the frequency of which depended on the values of a constant resistance and the sensor capacitance. As the moisture increased, the capacitance between the electrodes increased and the oscillator frequency decreased. The frequency was measured with a microcontroller and converted to moisture. In the experiments, the method proved to be stable in the case when the variable component of the soil was mainly water content. In practice, the measurement result with a capacitive sensor depends on the composition and dielectric properties of the soil, which can differ significantly in different soils. Therefore, the described solution was not universal enough for the purposes of this work, since the measurements are performed in different soil types.
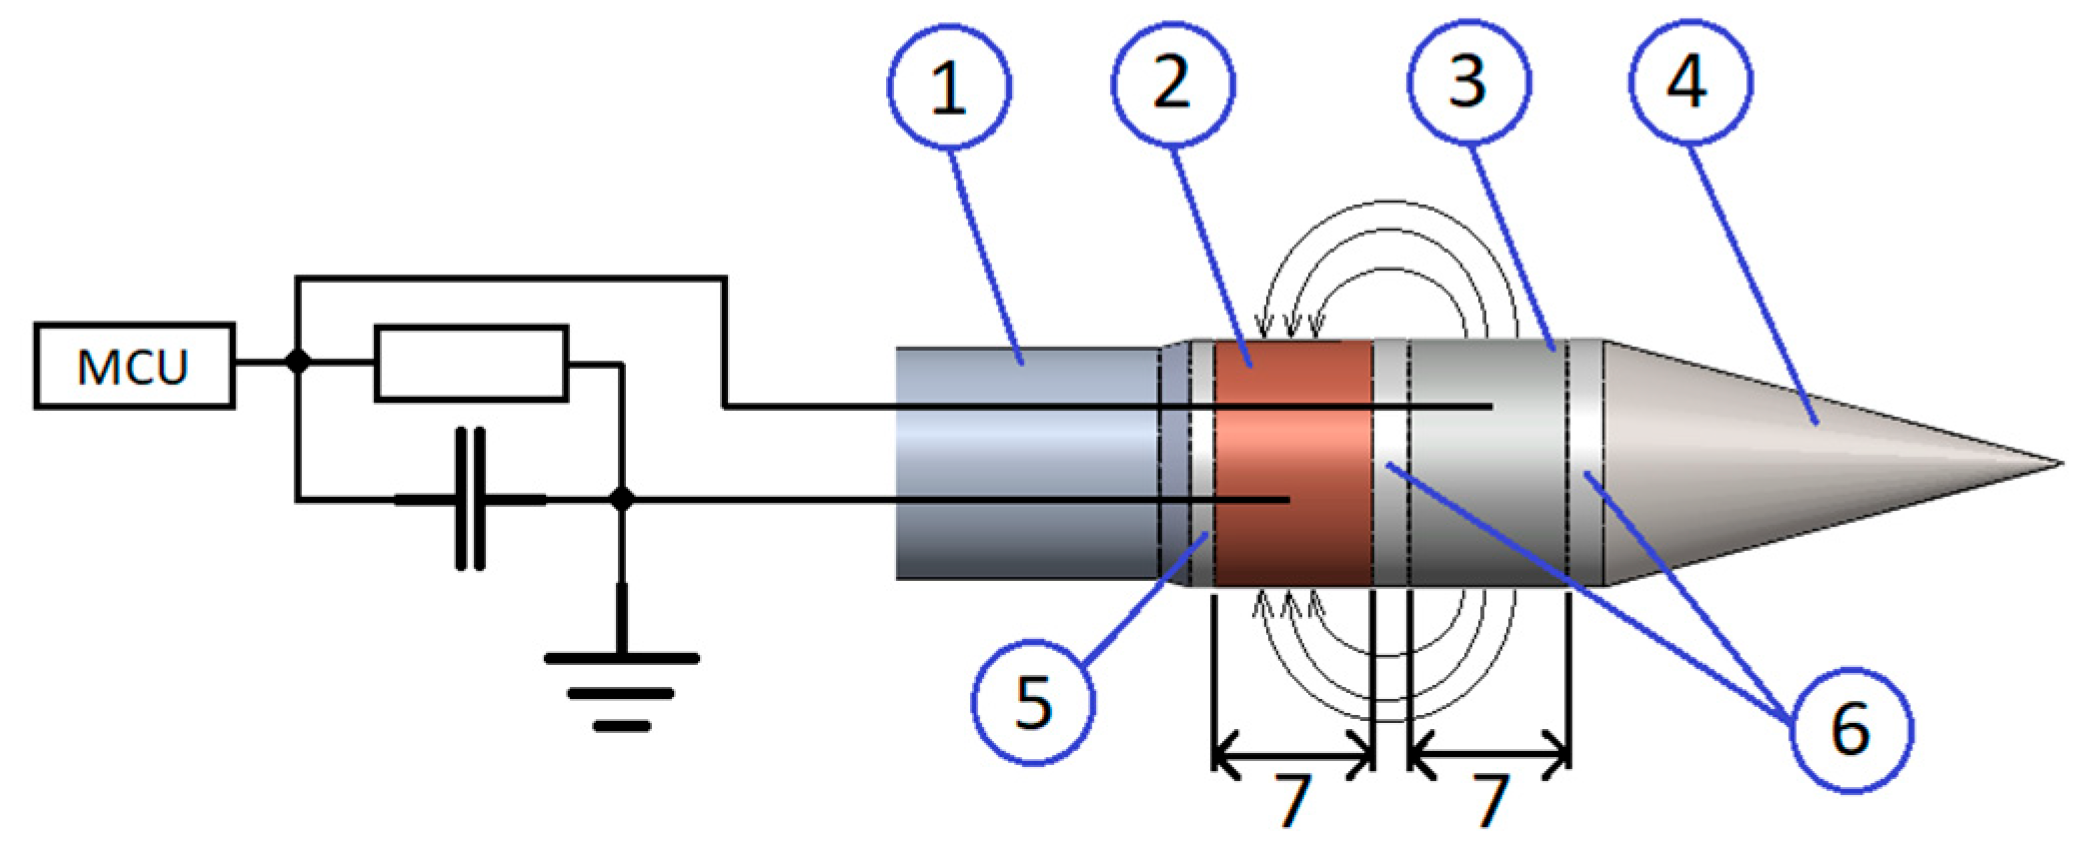
The second type of sensor used in the device under development is a galvanic moisture sensor (
Figure 12).
Figure 12 illustrates a galvanic soil moisture sensor, showing the movement of electrons and current. Electrons move from a zinc electrode (anode) to a copper electrode (cathode). Current flows through the circuit from the copper electrode to the zinc electrode. A capacitor smooths out voltage fluctuations so that the resulting voltage can be measured more stably by a microcontroller. The sensor response time is approximately 2 s. Calibration curves for the moisture sensor were constructed between the sensor output and the measurement results. The regression model used was linear at lower moisture content and became nonlinear at higher moisture content.
Table 1 and
Table 2 summarize the results of volumetric moisture content measurements obtained using the KERN ALJ and FieldScout TDR300 devices, respectively, across reference moisture levels ranging from 5% to 50%. Ten replicate measurements were performed at each moisture level, and the results are presented as mean ± standard deviation, with bias and relative error compared to the reference value.
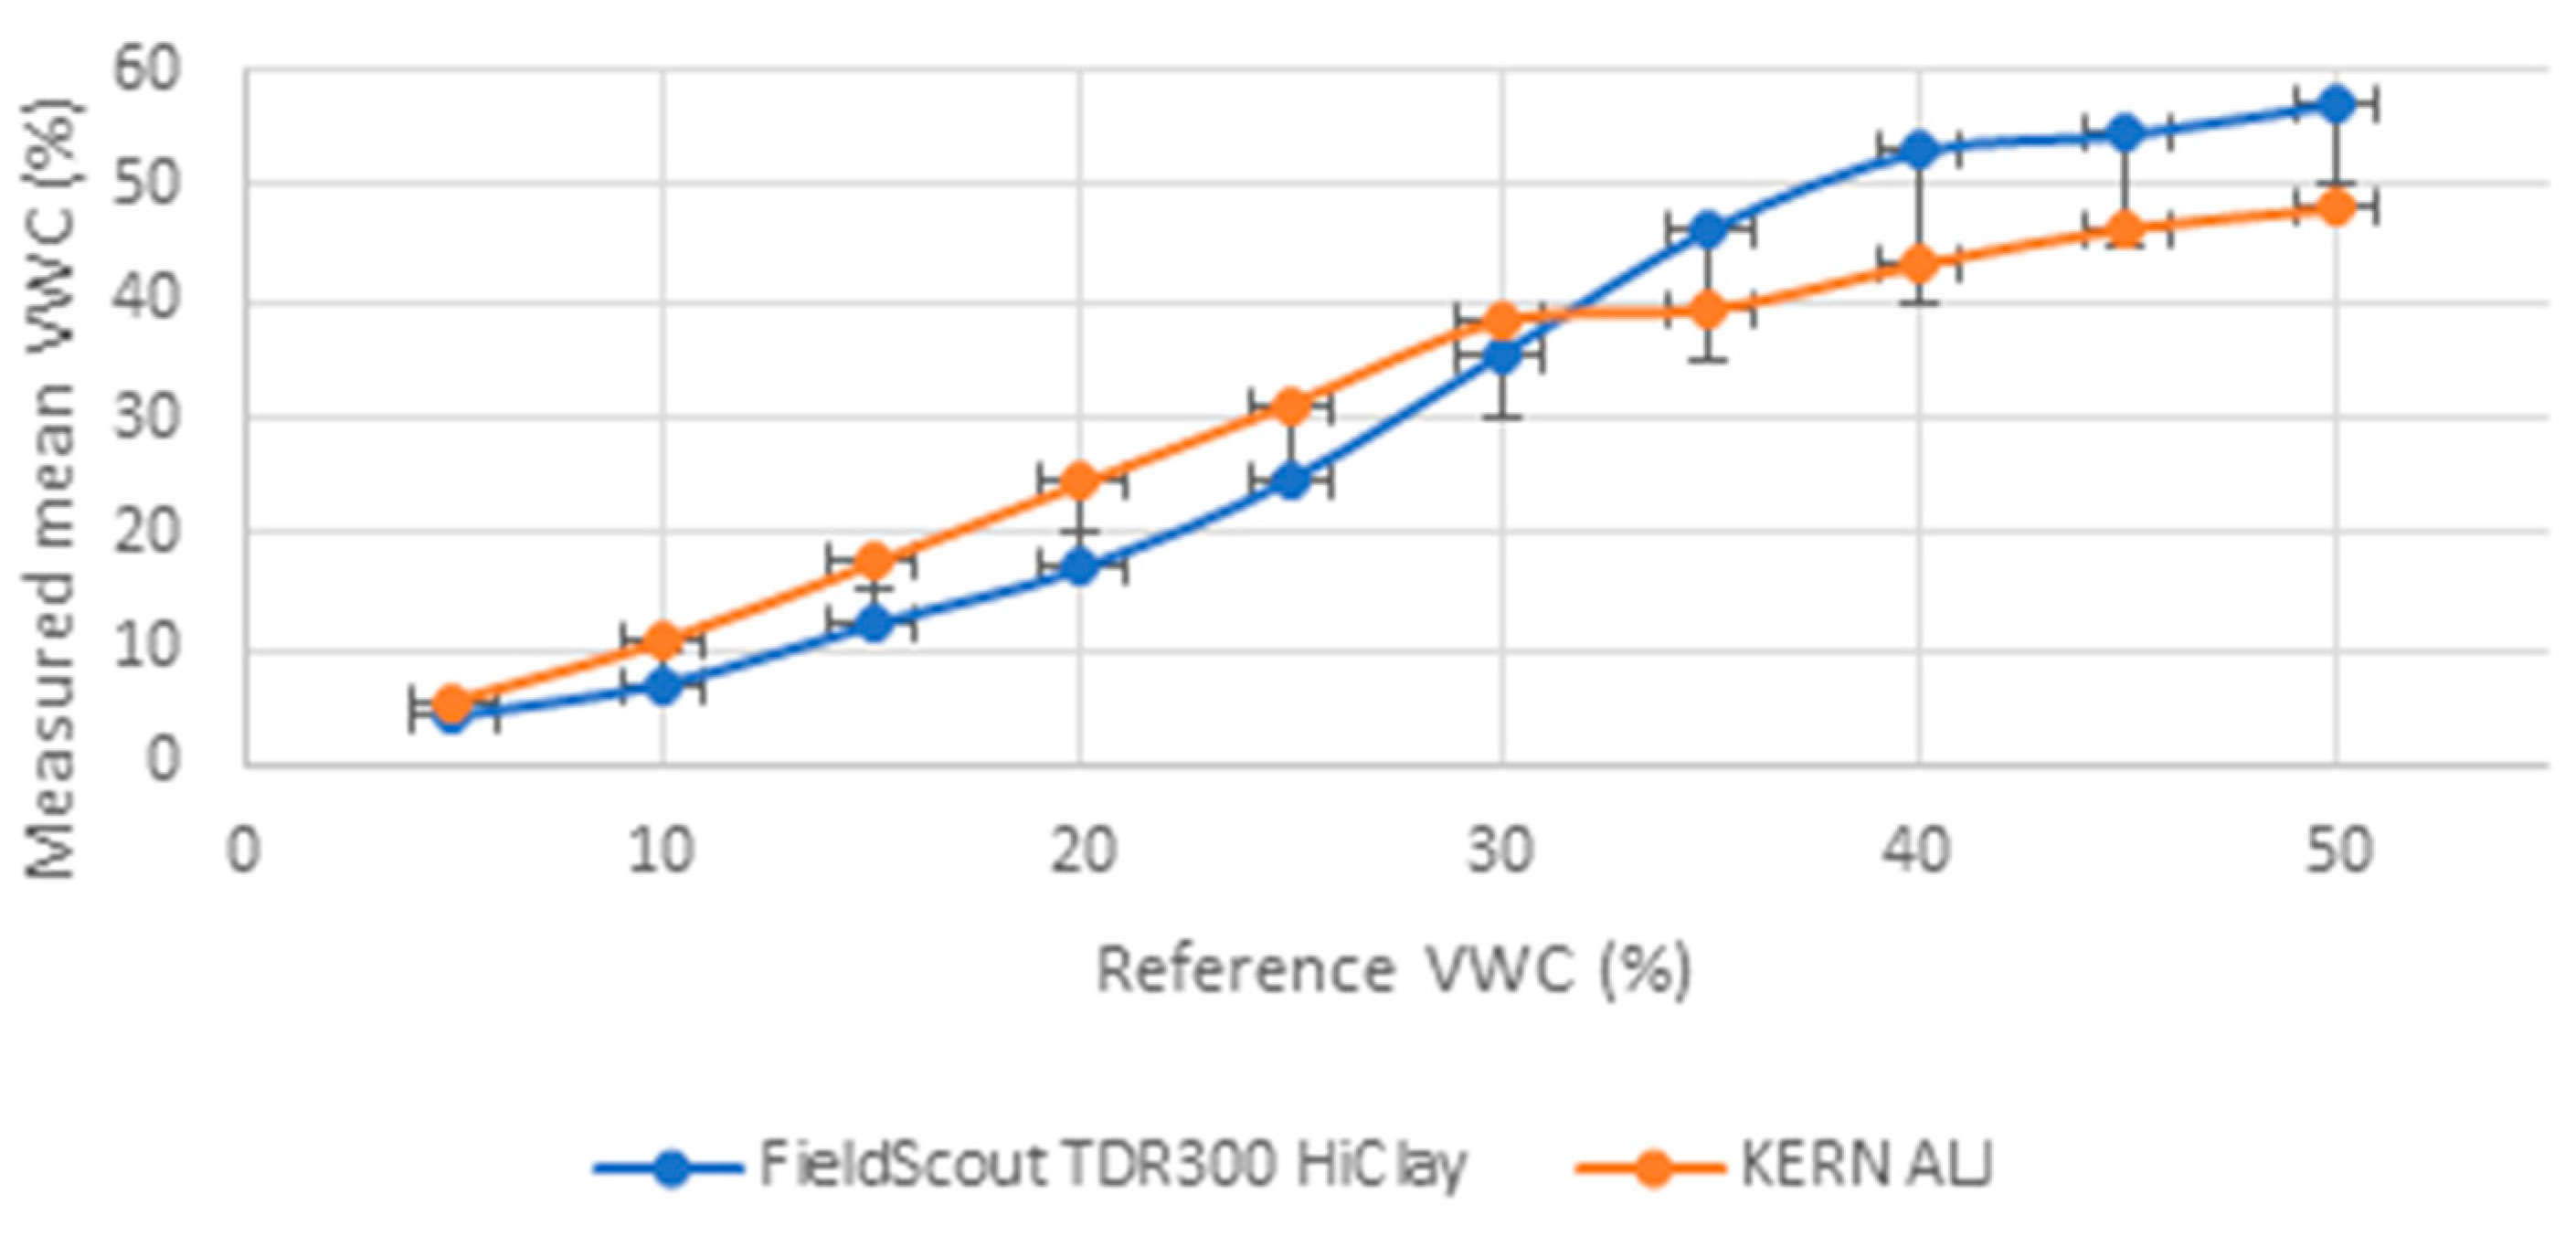
The KERN ALJ device measurements demonstrated consistent repeatability over the entire measurement range, with a standard deviation of approximately 0.33–1.78%. However, a systematic positive bias was evident in the range of 15–30%, with a maximum deviation of approximately +8.35%.
The Field Scout TDR300 also showed relatively low random error; however, there was a deviation from the reference values, especially at moisture levels above 30%, where the relative error exceeded 30%. Overall, the TDR method works relatively accurately compared to the thermogravimetric method.
In clay soils, thermogravimetric measurements may not be consistent with volume percent water addition, as these two approaches assume that the sample volume and bulk density remain constant during wetting. Swelling and shrinking clays change their volume and dry density during wetting/drying, and shrinkage during drying can increase bulk density, which in turn shifts volumetric water content estimates [
48,
49].
Figure 13 shows the volumetric soil moisture determined by the KERN ALJ and Field Scout TDR300 devices.
The volumetric water content measurements were compared with the aim of assessing the measurement accuracy of the TDR sensor and the correspondence of its results to the readings of the reference device. The comparison revealed that the TDR sensor provides fairly reliable results over the entire moisture range studied. Thus, it can be concluded that the TDR sensor is a suitable tool for rapid determination of soil volumetric moisture under normal conditions.
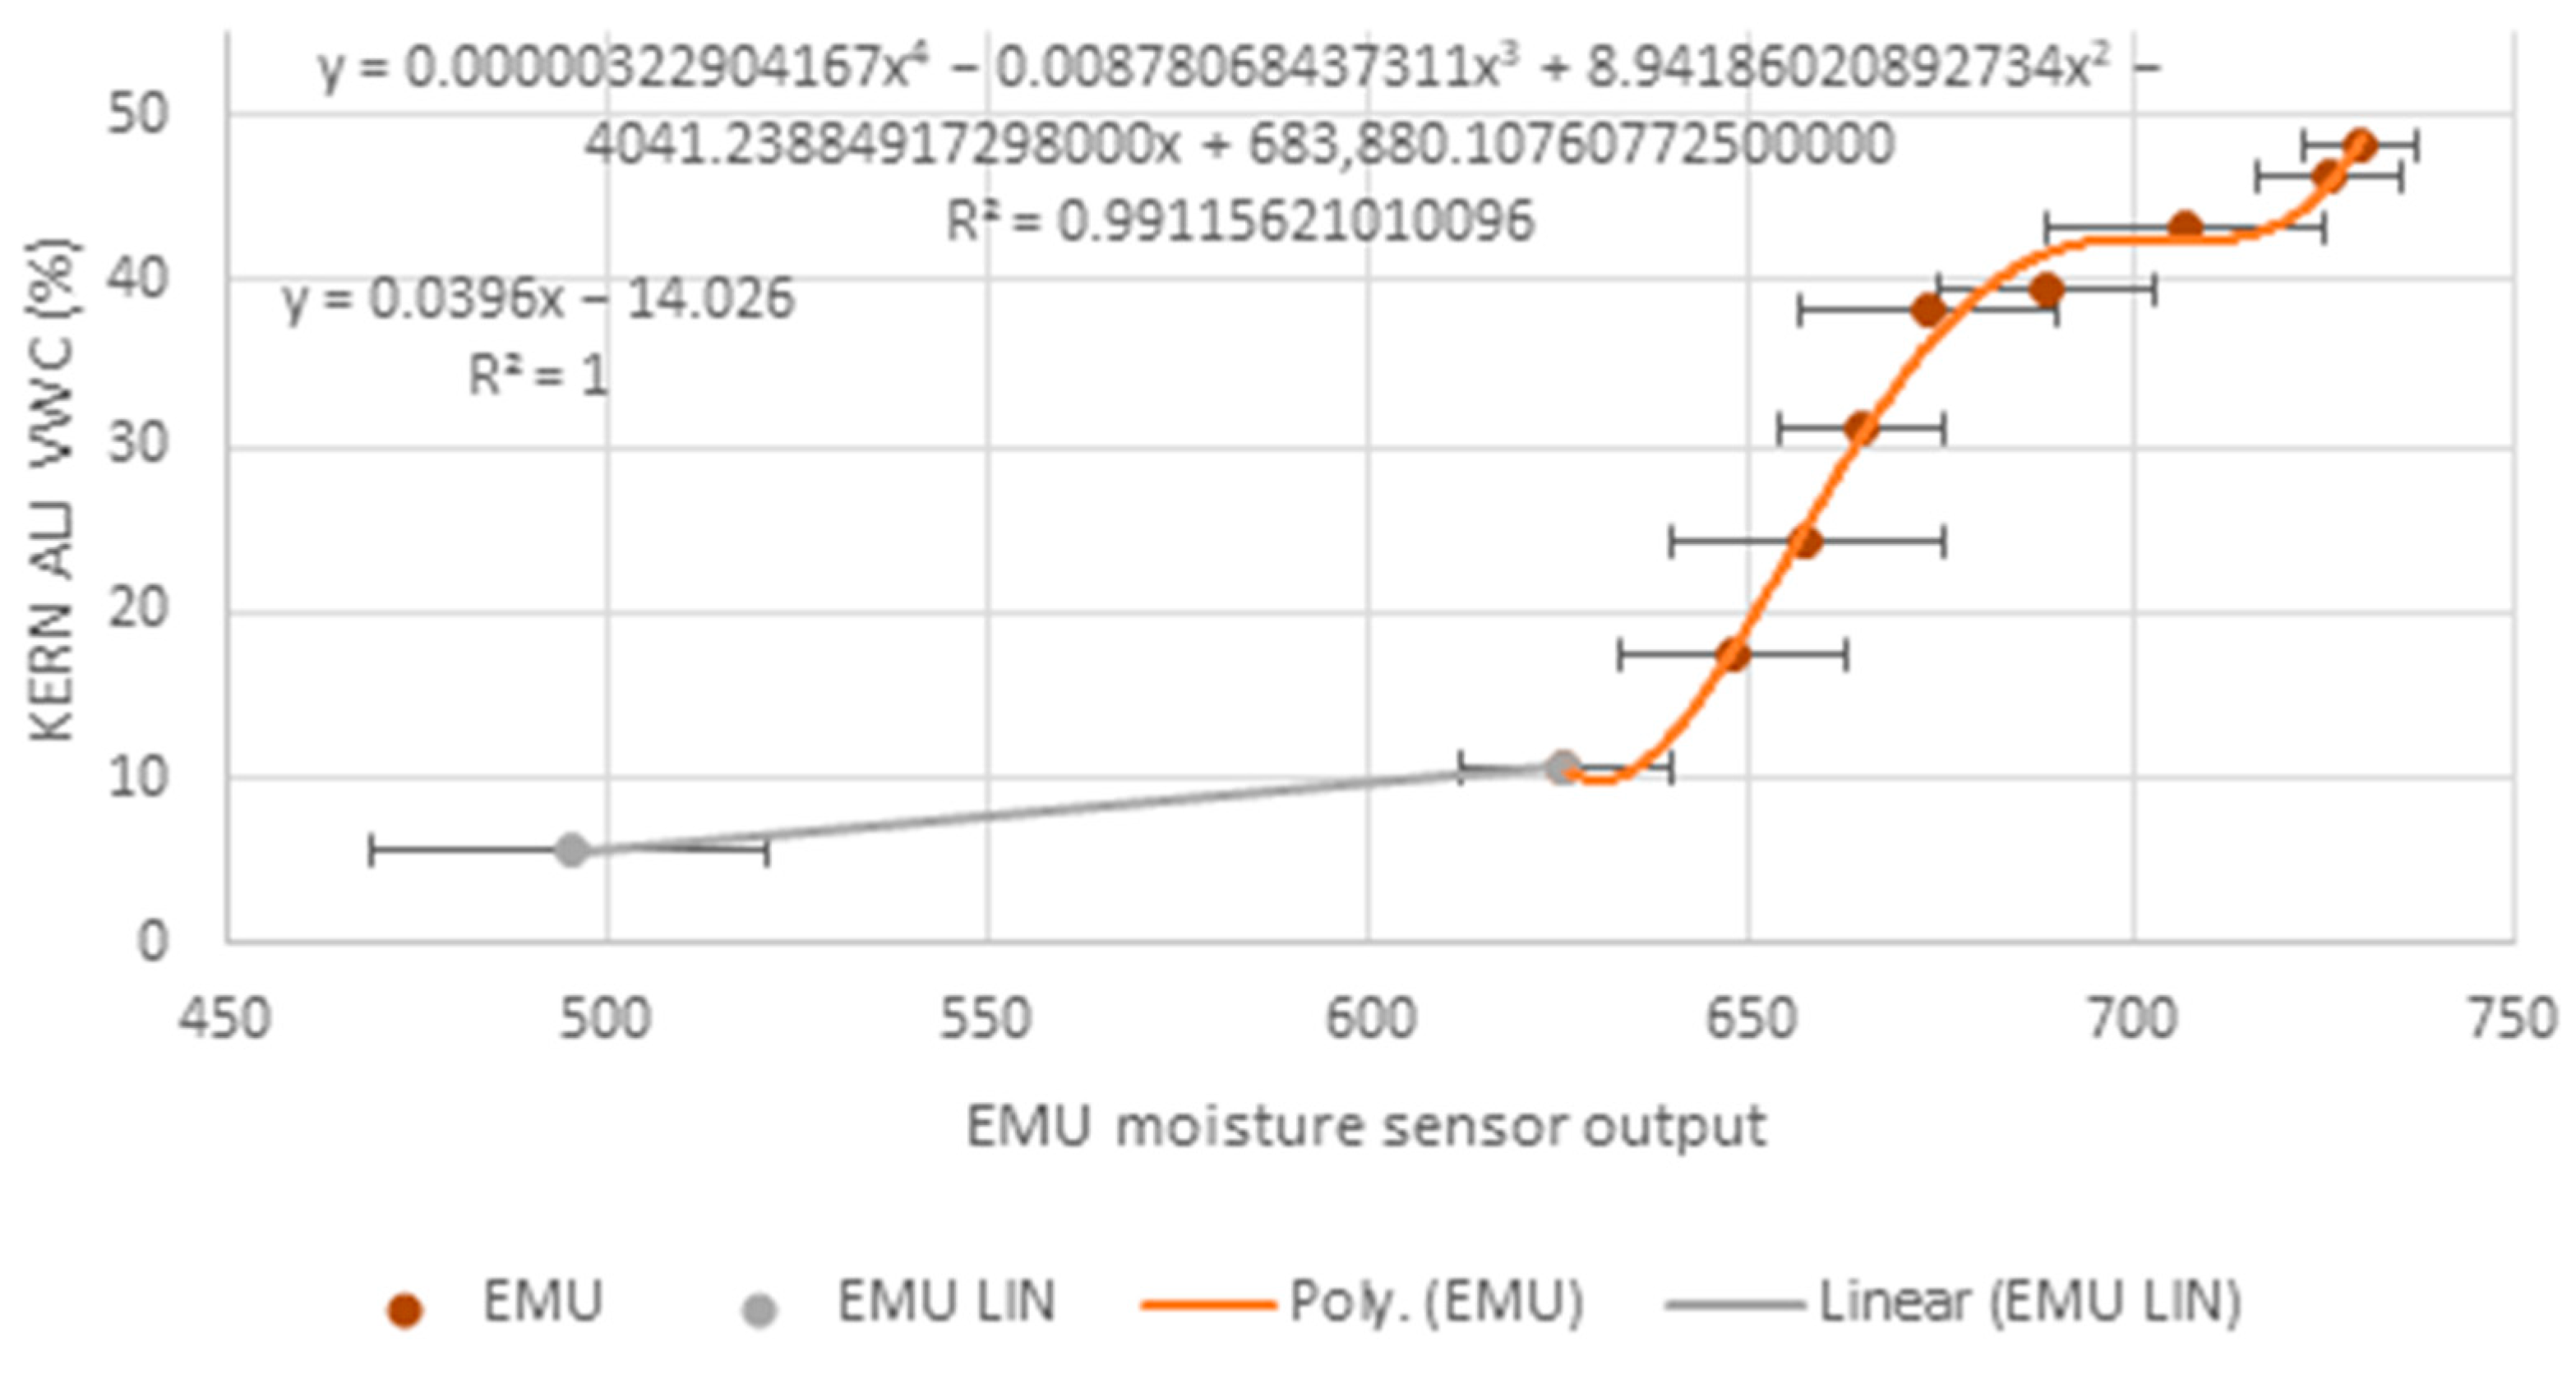
When compiling the calibration curve, the readings of the sensor under development, or raw data, were associated with the moisture content values determined with the KERN ALJ device, and a regression model was fitted to the resulting dataset. The analysis showed that the relationship between the sensor readings and moisture content was approximately linear in the lower moisture content range, but at higher moisture contents, the relationship became nonlinear. Therefore, the calibration curve was described as two-part, with a linear dependence in the lower moisture content range and an exponential dependence in the higher moisture content range.
In
Figure 14, relationship 1 (EMU LIN) is presented in linear form and relationship 2 (EMU) is described as an exponential dependence. The resulting model was used to convert the so-called raw sensor readings into corrected volumetric moisture. These relationships are used only within the calibration range.
Table 3 shows the average measured value, standard deviation, and coefficient of variation in the test device.
The results presented in
Table 3 indicate that the average sensor output increases consistently with the increase in the reference volumetric water content (VWC) in the range of 5–50%, indicating a clear positive relationship between the humidity level and the measurement signal. The standard deviation, which characterizes the dispersion of the measurement results, ranges from 6.15 to 15.29%, while the coefficient of variation is 0.96–2.15%. The CV values indicate a good agreement between the measurement results and indicate the response of the sensor at different humidity levels.
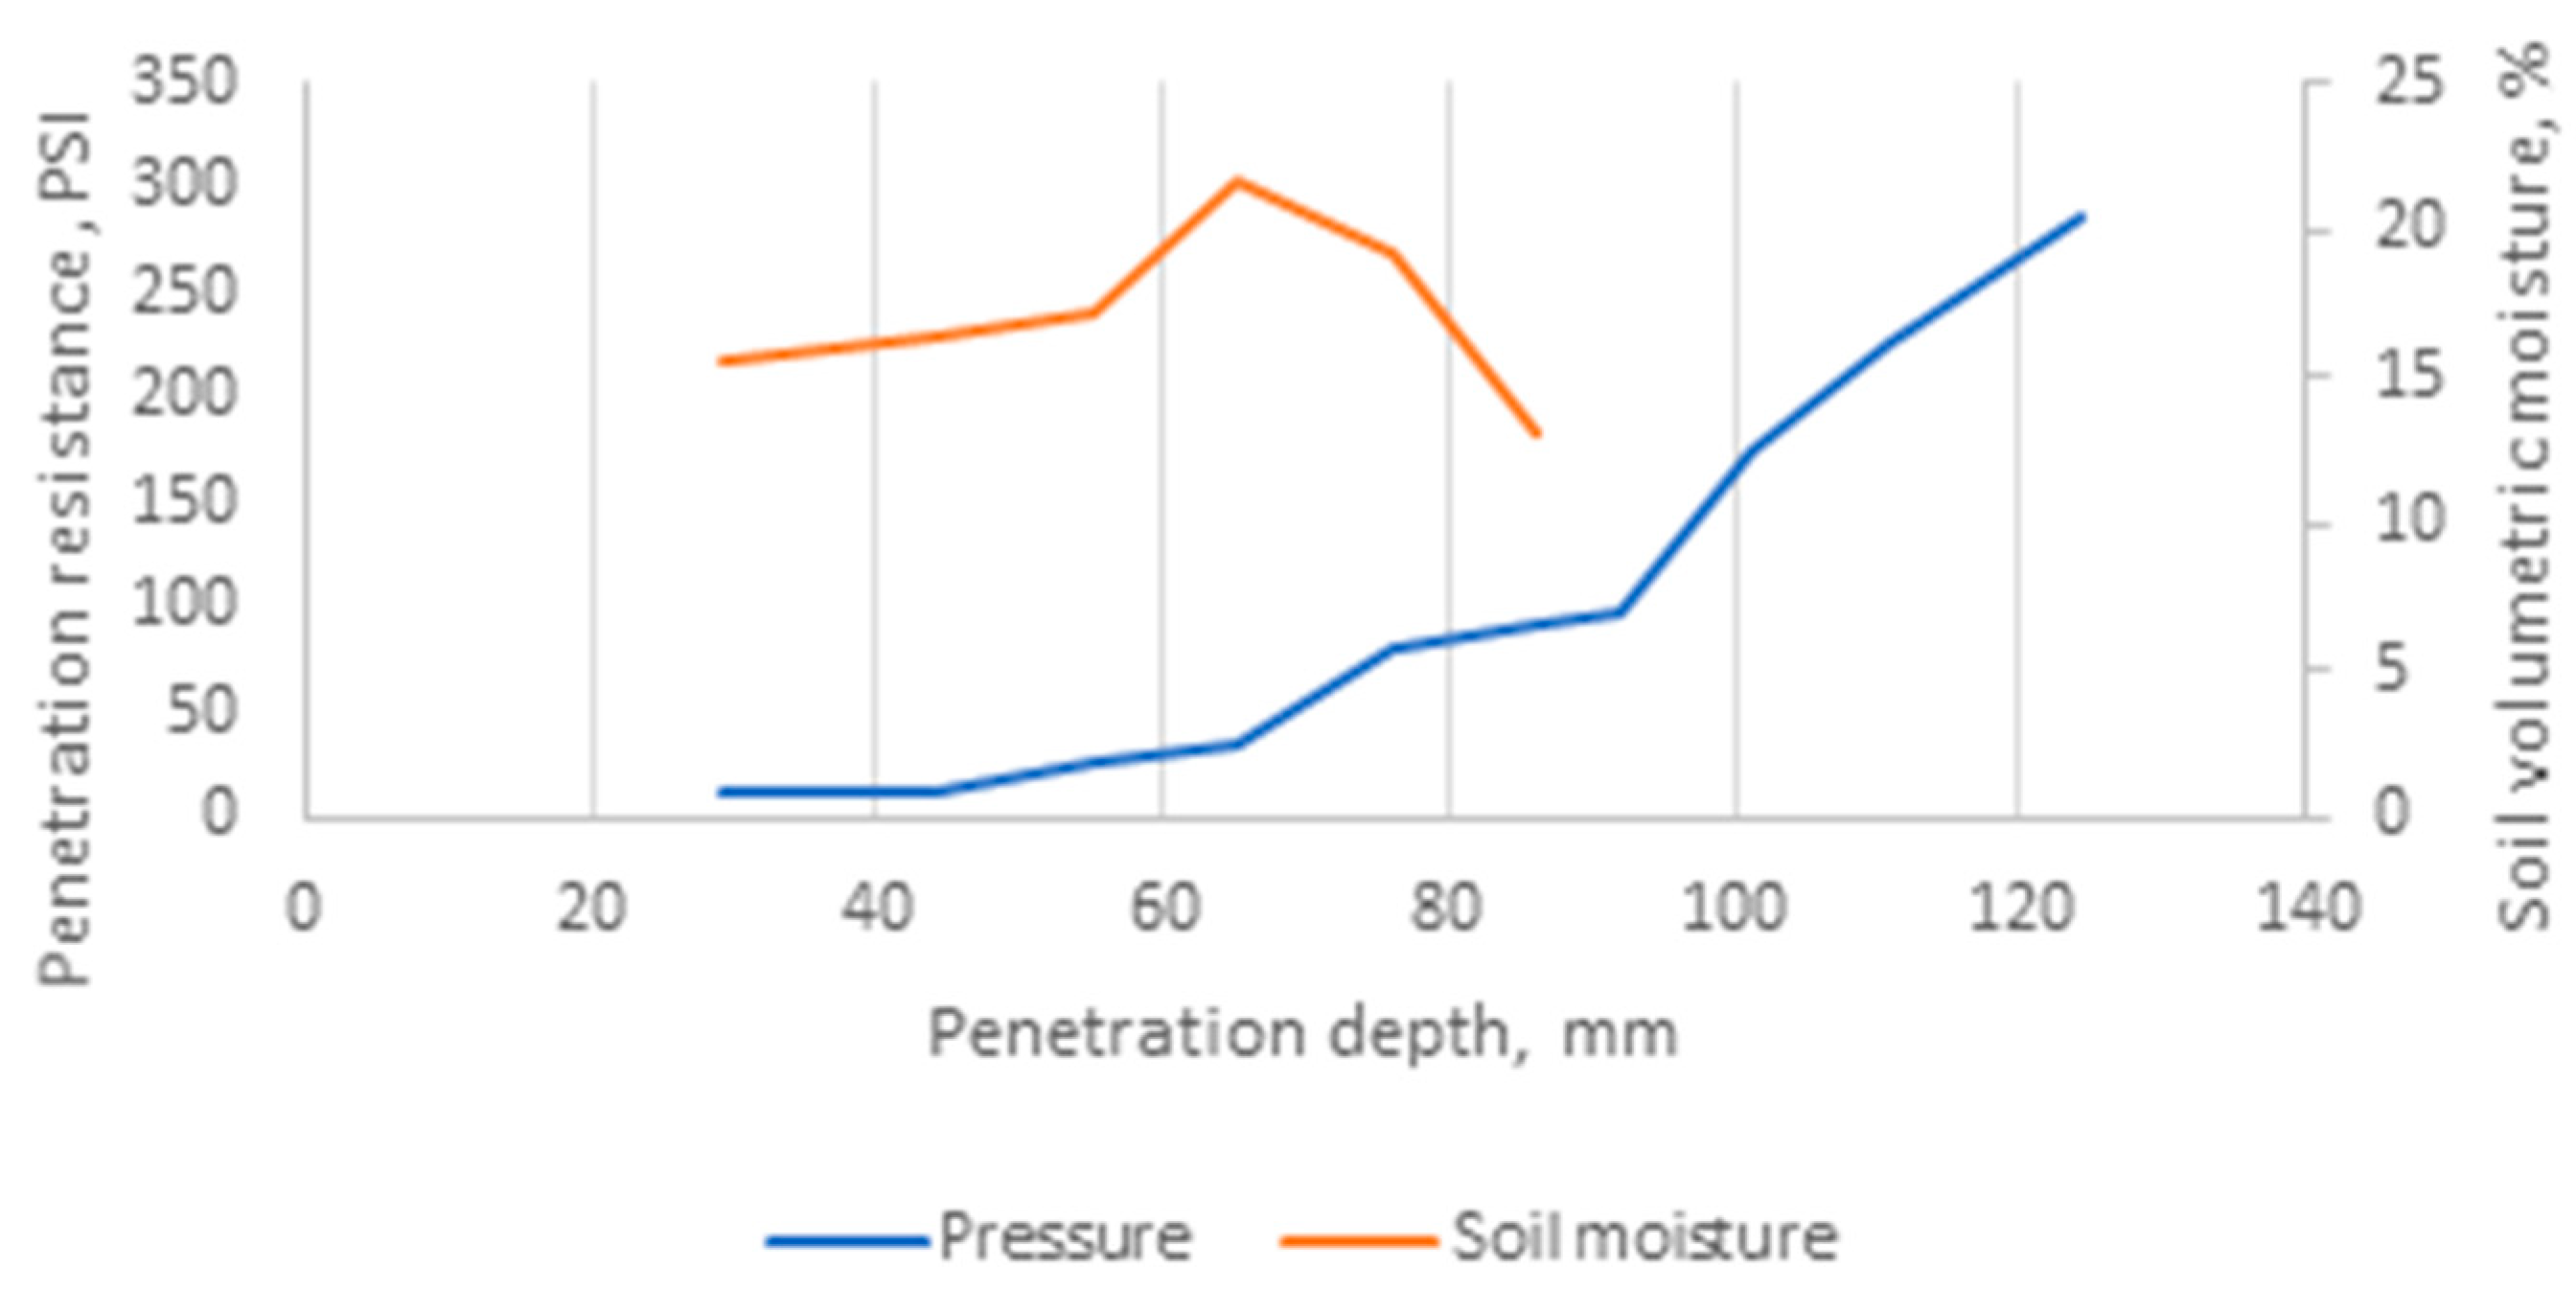
Figure 15 shows sample data from a field test, showing penetration resistance and volumetric moisture as a function of depth.
The moisture data are compared with the pressure data, as the moisture sensor is located close to the cone and thus records soil properties within nearly the same spatial region as the pressure measurements. However, due to the differing internal positions of the sensors within the device, the effective measurement range of the moisture data is shorter than that of the pressure data by approximately the length of the sensor. Consequently, the start and end points of the two measurements do not fully coincide, and their relative spatial offset must be considered during data interpretation. The figure is intended primarily to illustrate the operating principle of the device and to demonstrate the expected relationship between pressure and moisture readings as the device advances through the soil. It does not represent an exact dataset from a specific test, but rather a schematic graph designed to clarify the functioning of the measurement system.
3.4. The Effect of Minerality on Volumetric Moisture Measurement Data
In this work, the effect of salinity (minerality) was separately evaluated, as dielectric methods used to determine soil moisture (e.g., TDR/FDR) can give systematically inaccurate results when electrical conductivity increases. The reason is that moisture is derived from the measured dielectric, but a soil solution with a high ion content increases the conductivity component of the signal and affects the signal propagation, which is why the device may misinterpret the change due to conductivity as an increase in the amount of water. Therefore, in outdoor conditions (e.g., fertilized fields, coastal soils, areas affected by road salt, organic-rich or highly mineralized soils), salinity is one of the most important confounding factors, which can make direct comparison of readings from two sensors misleading.
The purpose of the mineralization test was to assess whether salinity affects the TDR-type sensor and how it affects the galvanic sensor. The following
Table 4 presents the test data for determining the effect of salt.
Table 3 indicates that the Field Scout device is significantly affected by salinity, suggesting that the measurement signal was influenced by electrical conductivity, not the actual change in water content. The galvanic sensor readings were within a reasonable range compared to the volumetric moisture calculated by the gravimetric method. The results support the conclusion that in this configuration, the galvanic cell solution is more stable to minerality/salinity disturbances than the TDR solution. The measurements were performed under practically zero current conditions, which is why the voltage drop is small and the measurement signal depends mainly on the electrode potentials (Nernst relationship). However, it should be noted that high minerality can affect the surface processes of the electrodes; therefore, soil-based calibration is still necessary.
4. Conclusions
The aim of this work was to develop a solution for measuring soil penetration resistance, where the measurement of volumetric moisture is integrated into the same measurement cycle and occurs simultaneously with the penetration resistance at different depths. The work resulted in a hand-held prototype that simultaneously measures the force acting on the cone (to determine the penetration resistance), the measurement depth (with a laser sensor), the soil moisture (with a galvanic cell-based electrode solution), and the location of the measurement point (GNSS), automatically saving the results to a memory card. The design of the device allows for the formation of both the penetration resistance and moisture profile up to a depth of 500 mm during the same measurement.
In laboratory tests, the force sensor was calibrated with known loads, and a linear relationship was obtained, which allows the load cell output to be reliably converted into the pressure acting on the cone. Control measurements of the laser distance sensor showed a measurement error of less than 1 mm in the range 0–100 cm. In the case of the galvanic moisture sensor, the voltage between the electrodes was related to the volumetric moisture content (VWC) using a regression model, considering that the relationship is approximately linear at lower moisture contents and becomes nonlinear at higher moisture contents. In addition, a comparison of the effect of salinity showed that the TDR-based reference device gave excessively high moisture readings in saline soil, while the galvanic cell-based measurement remained significantly more stable. This indicates the neutrality of the galvanic sensor to minerality/salinity disturbances (although the accuracy still depends on the calibration and the measurement environment).
The integrated measurement concept (PR + VWC + depth + GNSS) creates the prerequisites for interpreting the soil condition in a real measurement situation, where moisture is one of the most important factors influencing the penetration resistance. This allows better informed decisions to be made based on the collected data in agriculture (compaction mapping and work scheduling), forestry (permeability and soil damage risk), and other landscape permeability assessment applications. It should be noted that the test data presented in this work were obtained under controlled laboratory conditions, which is why they do not yet allow for final conclusions about the system’s performance in real field conditions. Additional field tests in different soil and weather conditions are necessary to validate the sensor and the entire measurement system. Although the developed solution demonstrated clear potential in laboratory tests, its practical implementation requires further development, additional calibration, and reliability testing in a real-world environment.
Future work should focus on expanding the calibration of the moisture sensor in different soils and on assessing the long-term stability and wear effects of the electrodes. It is also necessary to include temperature data to enable the application of temperature correction and to assess the effect of temperature on the measurement results. In addition, the system should be compared with other sensors to assess the reliability of the measurement results and to identify its potential advantages in saline soils. These developments would help to reduce the bottlenecks associated with the device and improve the applicability of the system.