Article

Energy Recovery from Sewage Sludge in Ribeirão Preto: A Comparative Analysis Between UASB and Activated Sludge Systems

by
Aylla Joani M. de O. Pontes
,
Yone Domingues dos Santos Nascimento
,
Ivan Felipe Silva dos Santos
,
Geraldo Lúcio Tiago Filho
and
Regina Mambeli Barros
*
Institute of Natural Resources—IRN, Federal University of Itajubá—UNIFEI, Itajubá 37500-903, MG, Brazil
*
Author to whom correspondence should be addressed.
AgriEngineering 2026, 8(4), 137; https://doi.org/10.3390/agriengineering8040137
Submission received: 27 January 2026 / Revised: 21 March 2026 / Accepted: 25 March 2026 / Published: 2 April 2026
(This article belongs to the Section Sustainable Bioresource and Bioprocess Engineering)

Abstract

Energy recovery from sewage sludge represents a sustainable and technically feasible alternative to promote integration between environmental sanitation and renewable energy generation. This study presents a case analysis of the municipality of Ribeirão Preto, São Paulo, focusing on comparisons between two wastewater treatment systems: an Upflow Anaerobic Sludge Blanket (UASB) reactor and a continuous-flow activated sludge system. Using the UASB configuration, we prepared a preliminary design of a treatment plant based on population and effluent generation projections over a 20-year horizon. The estimated sludge and biogas production allowed us to simulate electricity generation then. The comparative economic assessment, which employed Net Present Value (NPV) and Internal Rate of Return (IRR) indicators in accordance with ANEEL Resolution No. 482/2012, showed that the UASB system yields hard superior methane (up to 3235.6 m3/day) and higher electricity generation potential (1839.7 MWh/year) than the activated sludge system (1990 m3/day and 1654.3 MWh/year, respectively). Both systems were economically viable, with a positive NPV, an IRR of up to 16.83%, and payback periods starting in the first cycle. Furthermore, we estimated the cost per cubic meter of generated biomethane, conducted a sensitivity analysis, and assessed the impact on the most important economic indicators, all to identify the advantages and disadvantages of the proposed project and the best use of the generated biogas. This analysis showed that it is possible to recover energy from sewage treatment systems while also reusing sewage sludge for agricultural applications, thereby highlighting additional environmental and economic benefits, particularly in regions with a strong presence of agribusiness, e.g., Ribeirão Preto.

1. Introduction

Urbanization, population growth, and increasing demands for public sanitation services have led to greater levels of sewage sludge production, a by-product of the wastewater treatment process. Traditionally, this was viewed as waste to be disposed of; however, sewage sludge has increasingly become seen as a potential source of renewable energy and agricultural resources. The challenges involved in managing sewage sludge, e.g., high treatment costs, environmental risks, and the need for sustainable practices, have prompted research into alternative uses for this material. One of the most promising strategies is anaerobic digestion, a biological process that converts organic matter into sludge and biogas, a combustible gas primarily comprising methane. This biogas can be then used to generate electricity and heat, thereby improving the energy self-sufficiency of wastewater treatment plants (WWTPs) and reducing greenhouse gas emissions. Notably, methane has a global warming potential that is more than twenty times greater than carbon dioxide. As such, CO2 and greenhouse gas emissions must be urgently reduced [1,2,3,4].
Brazil is facing changes in the basic sanitation sector, brought about by the New Legal Framework for Sanitation established by Laws No. 11.445/2007 and No. 14.026/2020 [5,6], which aim for universal access by 2033: 99% for drinking water and 90% for sewage collection and treatment. However, over 90 million Brazilians still lack access to sewage collection, with treatment rates rising only slightly from 51.2% to 52.2% between 2021 and 2022 [7]. According to the Sewage Atlas of the National Water and Basic Sanitation Agency [8], around 43% of the Brazilian population has access to collected and treated sewage, while 12% use individual solutions, e.g., septic tanks, totaling 55%, with some of these treatment solutions being inadequate. At the current pace, complete universalization may not happen until 2070, and would require investments exceeding R$509 billion [9]. This situation also affords an opportunity for energy recovery from the Wastewater Treatment Plants (WWTPs), with biogas production potential in Brazil projected to exceed 97 billion Nm3 per year by 2031 [10,11]. Federal Decree No. 11.003/2022 [12] promotes the sustainable use of biogas and biomethane, and supports decarbonization and circular economy goals.
The Brazilian RenovaBio program, established by Law No. 13.576/2017 [13], aims to promote the sustainable expansion of biofuels while reducing greenhouse gas emissions and meeting the Paris Agreement goals [14,15]. Biogas produced in WWTPs has become an essential source of renewable energy, especially when converted into biomethane. By including biomethane in RenovaBio, certified producers can issue Decarbonization Credits (CBIOs), providing economic incentives for using treated sewage as an energy source. This integration transforms STPs into active participants in Brazil’s energy transition, contributing to a diversified energy grid and a decarbonized transportation sector [15,16,17].
While wastewater treatment plants (WWTPs) are effective in purifying wastewater, they generally consume a considerable amount of electricity, which is estimated to be between 0.3 and 0.8 kWh per cubic meter. Additionally, anaerobic digestion of excess sludge can only provide about 50% of the total energy consumption required [18]. Christoforidou et al. [19] evaluated energy consumption in wastewater treatment plants (WWTPs) in Greece using key performance indicators. They measured specific energy consumption per population equivalent (3 to 150 kWh/Person Equivalent), per cubic meter treated (0.2 to 2.0 kWh/m3), and per unit of organic load removed (0.03 to 7.13 kWh/CODremoved). Mattio Gebrezgabher [20] reported an energy demand of 20 to 30 kWh per person per year. The Brazilian Biogas Association (ABiogás) estimates that Brazil’s total technical potential for biogas production is about 84.6 billion Nm3 per year, mainly from urban sanitation sources like landfills and WWTPs. In the short term, the immediate biogas potential is around 10.8 billion Nm3 per year, primarily generated from municipal solid waste and sewage effluents [21]. Probiogas [22] identified key benefits of biogas energy production as being: decentralized generation, combined heat and power, reduced methane emissions, and potential profits from energy partnerships.
Anaerobic digestion is a crucial process for stabilizing and decreasing municipal sewage sludge [23]. Results from the Life Cycle Assessment showed that anaerobic digestion has a lower environmental impact than composting, with the difference being between 6.5% and 7.5% [24]. Anaerobic digestion is a biological process that converts organic materials like sewage sludge into biogas and digestate [25]. The latter is a mixture of biomass, water, and both inert and undigested solids, with potential fertilizer properties.
Biogas is an energy source, and digestate can be used as a value-added fertilizer [25,26]. Biogas technology could be a more appealing option given its compact design, cleaner operation, and the variety of products it generates, including gas for energy and processed solid waste that can be used as organic fertilizer. Methane is the primary component of biogas, retaining approximately 90% of the energy from the substrate [27]. Furthermore, a sewage treatment plant can continuously produce biogas via anaerobic digestion [23], and anaerobic digestion more effectively removes pathogens, especially in multi-stage digesters with a pasteurization step. Thus, the resulting byproduct, digestate, can serve as a high-quality fertilizer with improved nutrient availability for plants [27]. It also affords other benefits, including reduced phosphate levels [28,29,30,31,32], making it a sustainable method for producing organic-mineral fertilizers from locally available renewable resources with a low carbon footprint [33].
Sewage sludge, which includes activated sludge, contains 6–8% nitrogen (N) when measured considering dry matter [33]. The anaerobic digestion of sludge enhances the breakdown of organic matter, increasing levels of soluble nutrients like total ammonia nitrogen and ortho-phosphate, which plants can easily absorb [26,34]. This process also sanitizes sewage sludge, particularly at thermophilic temperatures (50–55 °C) (Smith et al., 2005) [35], even though it was not originally intended as a method for disinfecting sludge [35]. In short, an additional benefit is that pathogen reduction can be achieved at mesophilic temperatures (30–35 °C) [26,36].
Basrawi et al. [23] compared biogas-fueled micro gas turbine cogeneration systems with various output powers across different scales of sewage treatment plants under various ambient temperature conditions. The authors concluded that the micro gas turbine cogeneration system, which operates at full load with an energy input similar to biogas produced on-site, was the most efficient. Biogas from sewage digesters contains 55% to 65% methane [37,38], 35% to 45% carbon dioxide, and less than 1% nitrogen. Biogas from organic waste digesters, however, has 60% to 70% methane and 30% to 40% carbon dioxide, with less than 1% nitrogen. In landfills, methane content ranges from 45% to 55%, carbon dioxide from 30% to 40%, and nitrogen from 5% to 15% [37]. It contains smaller levels of contaminants like hydrogen sulfide, nitrogen, water, oxygen, ammonia, and siloxanes, with concentrations varying by gas source [39]. For biogas containing 75% CH4, the calorific value is high at 26.9 MJ/m3 or 7.5 kWh/m3 [40].
Rasi and Rintala [37] examined biogas from a sewage treatment plant serving Jyväskylä, three nearby towns, and two factories. Biogas was produced in two 2750 m3 digester tanks that stabilized the plant’s sludge. Most of the biogas was used for heat and mechanical energy, with the excess being flared off. Rasi and Rintala [37] suggest that producing biogas for vehicle fuel is simpler from manure or sewage sludge, given the lower nitrogen and halogenated compound levels, which facilitates upgrading.
Venkatesh and Elmi [41] developed a methodology for analyzing the economic and environmental aspects of handling sewage sludge biogas in wastewater treatment plants (WWTPs). This approach was applied to the Bekkelaget WWTP in Oslo, Norway, considering 49 option-cost scenarios. Technologies like the Upflow Anaerobic Sludge Blanket (UASB) reactor are becoming increasingly relevant given their effectiveness in treating domestic sewage in tropical regions, and since they can produce biogas during the treatment process [2,3,4]. In contrast, aerobic systems, e.g., activated sludge, have higher energy requirements and require an additional anaerobic digestion stage for energy recovery from the produced sludge [2,3,4]. The two systems have distinct implications regarding investment, operation, and energy production.
In regions with strong agricultural potential, like Ribeirão Preto in São Paulo State, Brazil, the constant demand for intensive energy use and the emphasis on sustainability create a competitive advantage. Integrating sewage treatment with renewable energy generation has several advantages. This approach not only promotes energy efficiency and reduces environmental liabilities but also allows stabilized sludge to be reused as a soil conditioner, thereby supporting circular economy principles.
The Arrudas WWTP in Brazil, operated by COPASA, best exemplifies biogas-based energy cogeneration. It has a capacity of 4500 L per second, serves about 1.5 million residents, and treats 50% of Belo Horizonte’s and 40% of Contagem’s sewage. The facility includes a Small Thermoelectric Power Plant (STP) with three sets of four 200 kW microturbines, totaling 2.4 MW, which meets up to 90% of the plant’s energy needs using methane from sludge biodigesters. The system recycles heat from exhaust gases to enhance anaerobic digestion, thereby increasing biogas production. The project has already received over R$50 million in investments, resulting in savings of up to R$2.7 million annually [42,43,44].
This study evaluates and compares the energy potential and economic viability of biomethane production from treated effluent (via UASB) and sludge generated by a continuous flow activated sludge system. This is done by considering their contribution to biogas and biofertilizers separately. To accomplish this, projections for population growth and effluent generation over the next 20 years were considered. We also simulated implementing a wastewater treatment plant in the municipality of Ribeirão Preto-SP. The expected results can inform sustainable infrastructure development strategies that integrate the energy, sanitation, and agriculture sectors.

2. Materials and Methods

2.1. Place of Study

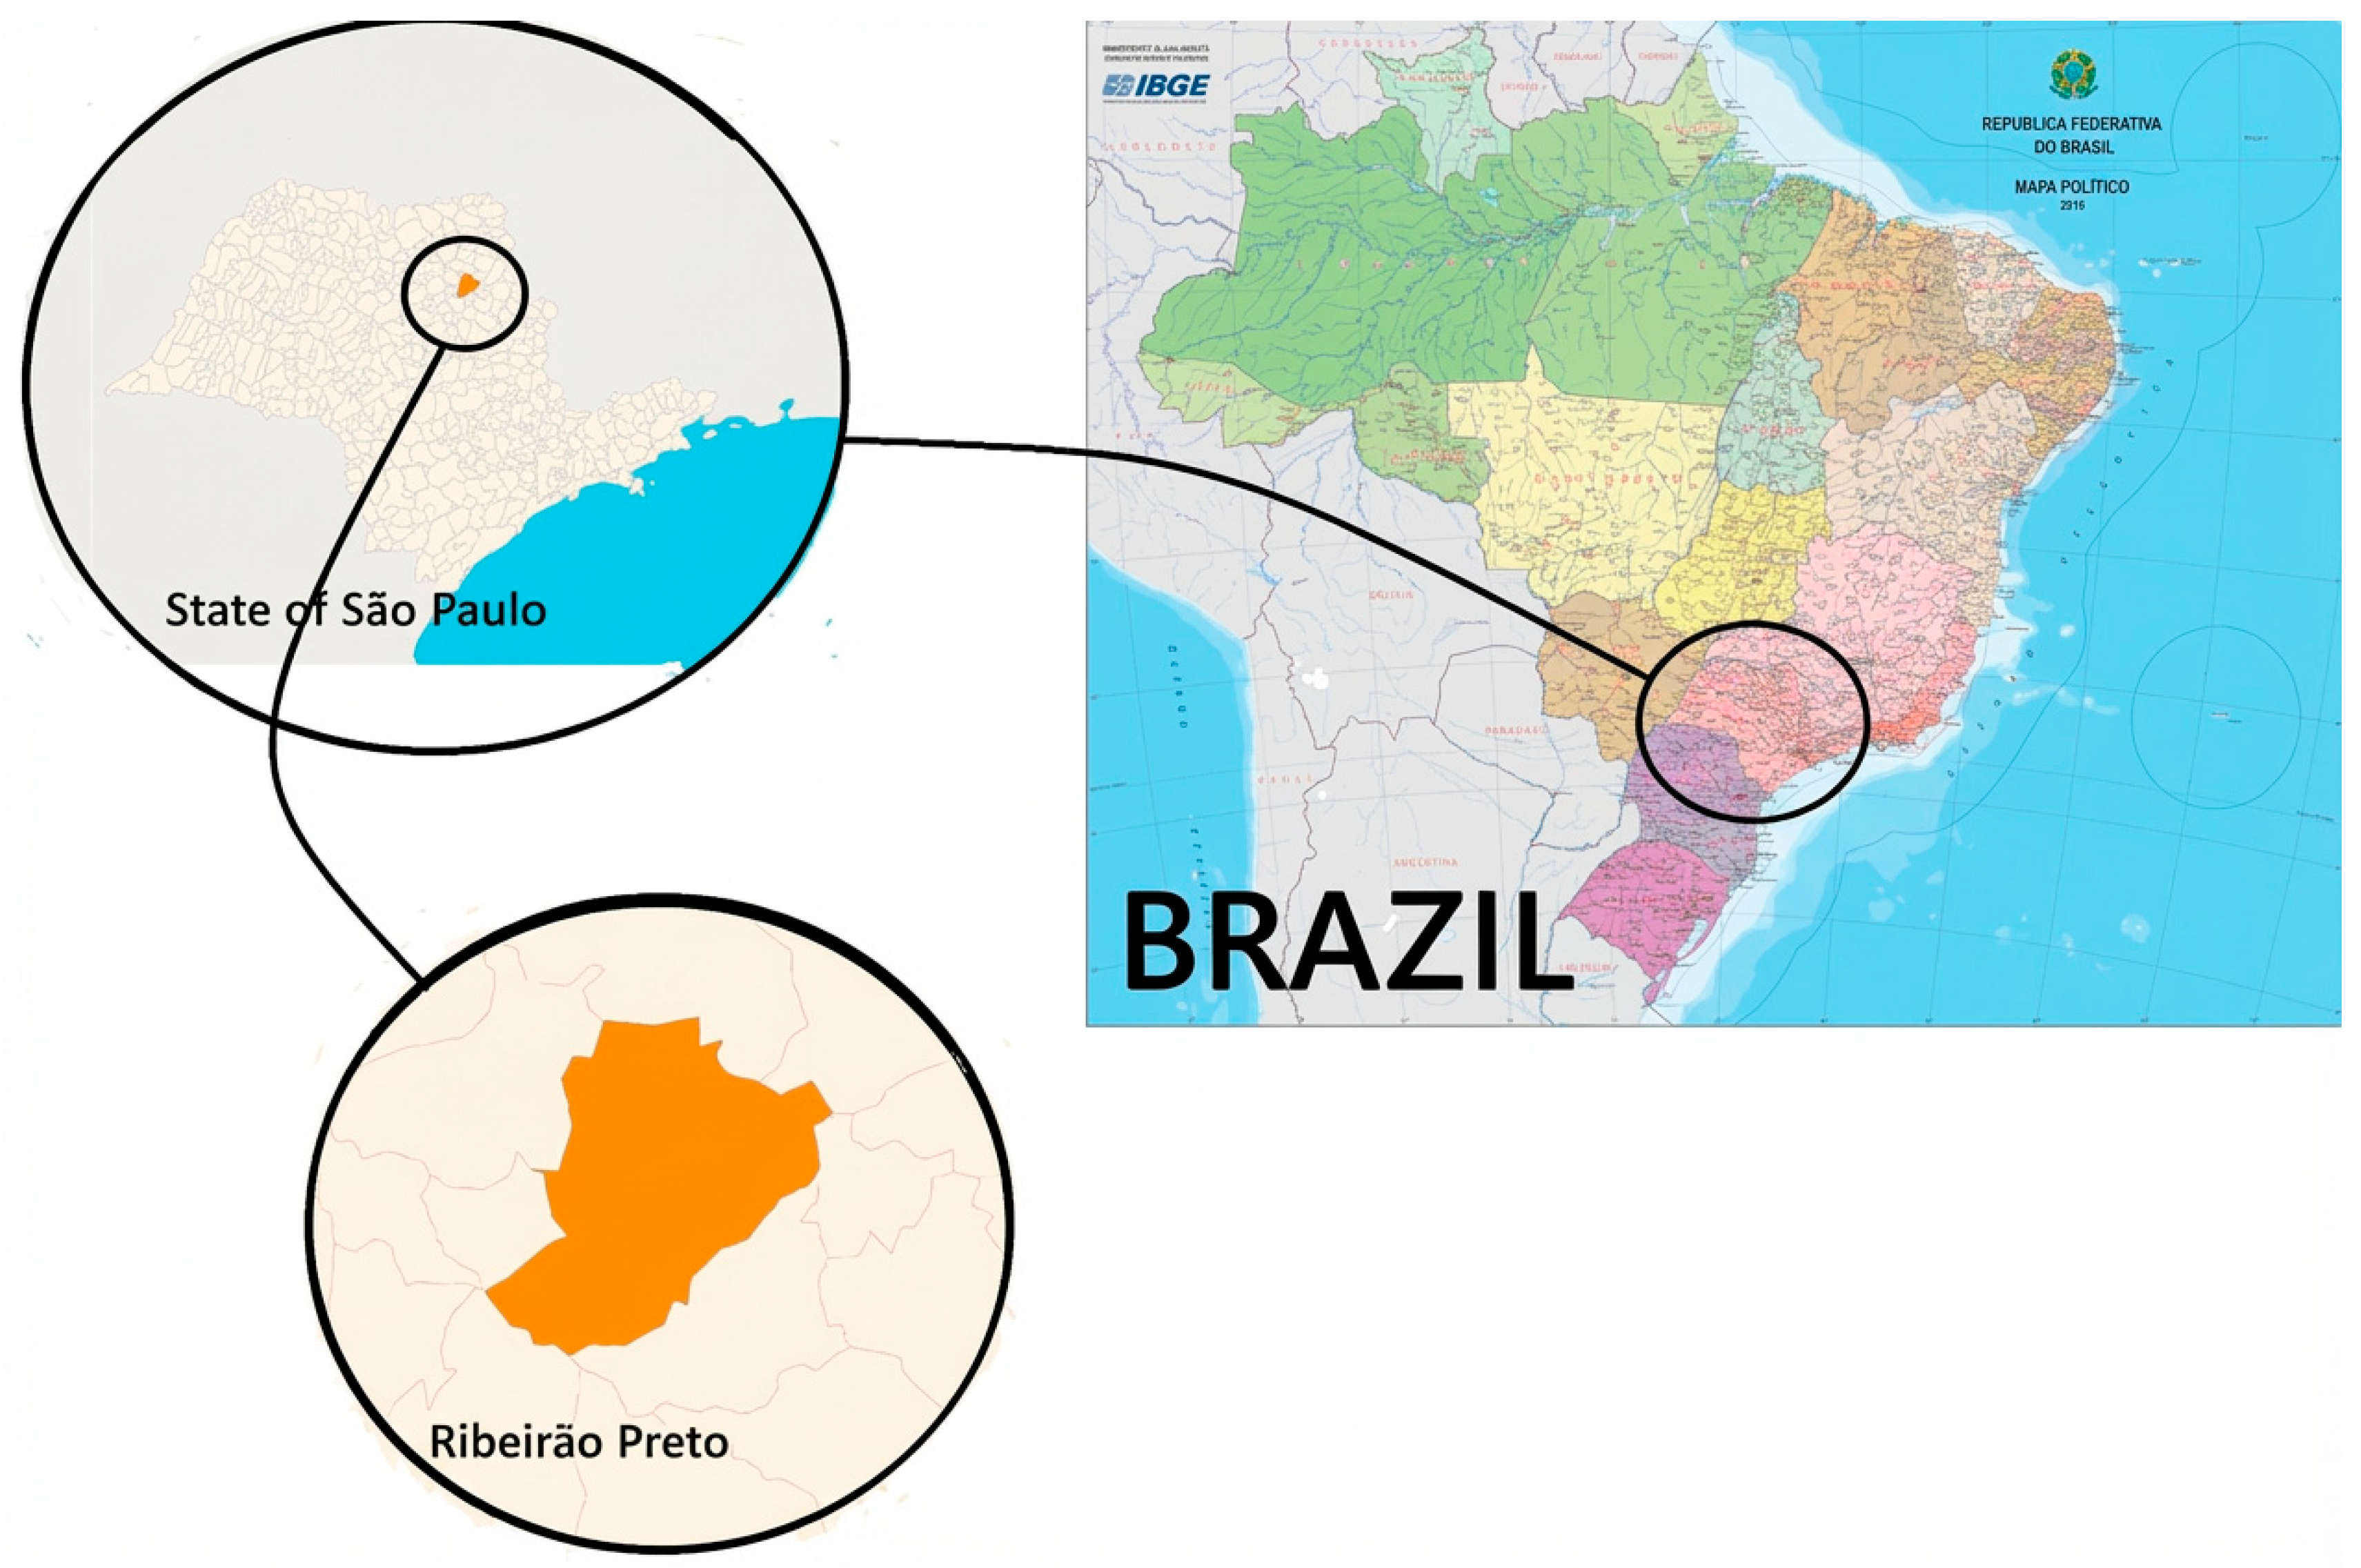
Ribeirão Preto, located in the northeastern region of São Paulo, Brazil, covers an area of 650.95 km2, with 226.35 km2 designated as urban perimeter [45]. According to the 2022 census, as reported by the Brazilian Institute of Geography and Statistics (IBGE), this city had a population of 698,642 inhabitants [45]. Figure 1 shows the location of Ribeirão Preto within São Paulo state on a Brazilian political map.

2.2. Population Projections

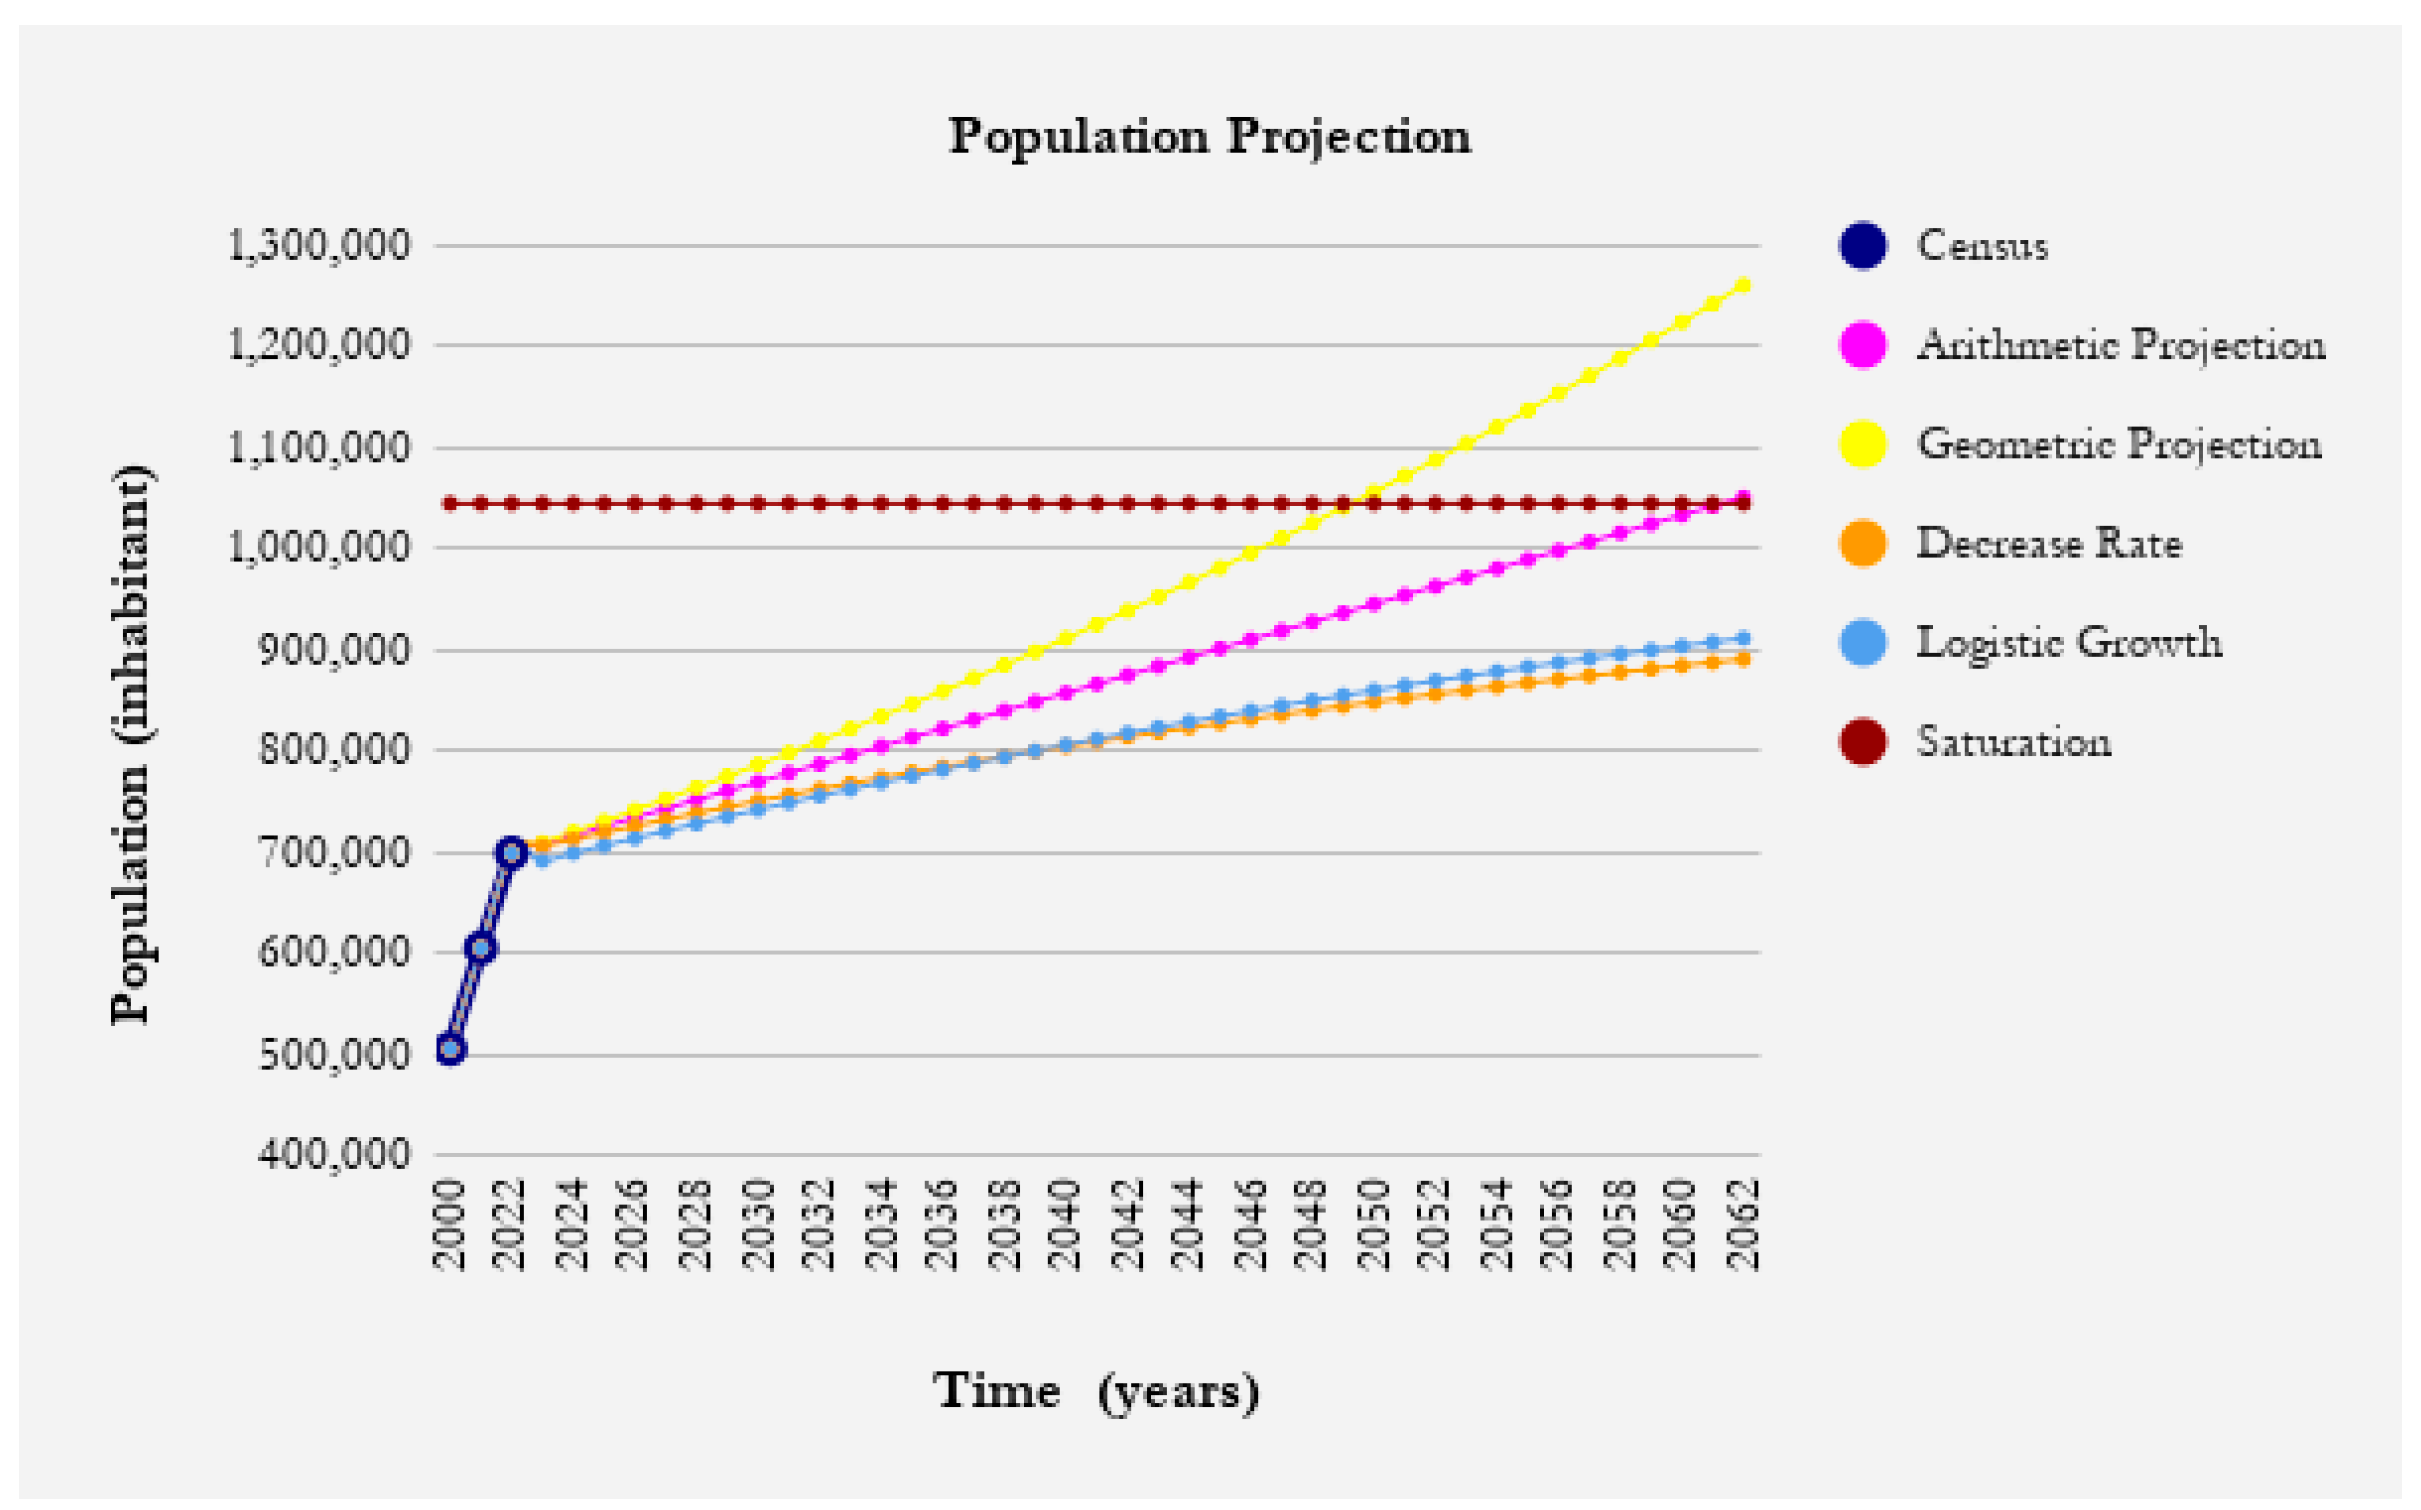
The population was projected using demographic data from 2000, 2010, and 2022, obtained from the IBGE website [47]. The population projections started in 2025, and extended out over a 20-year horizon. Arithmetic, geometric, and logistic projection models are valued for their simplicity and effectiveness in estimating total populations [48]. While these models, particularly the logistic model, illustrate growth patterns influenced by environmental and social factors, they are limited in other ways, especially during rapid growth phases. Although they can be useful for predicting population growth in constrained environments [49], these models do not fully capture the complexities of modern demographics, including age and sex changes, or the impact of unforeseen events like political and economic crises [50] and technological advancements [51].
We employed arithmetic, geometric, and logistic projection methods in this study. Ultimately, we chose the logistic growth rate projection, as presented by Qasin [52] and Von Sperling [3] given its adequacy in the logistic growth model. The growth rate is given in Equation (1), and the resulting estimates are outlined in Equation (2).
d P d t = K 1 × P × ( P s P P s )
where
  • P = population at time (t);
  • t = time (years);
  • Ps = Carrying capacity;
  • K1 = Intrinsic growth rate (proportional growth constant).
P t = P s 1 + e K 1 × ( t t 0 )
where:
  • Pt = projected population at time (t);
  • t0 = the inflection point (t), i.e., the growth rate is at maximum.

2.3. Sewage Production Projection

The sewage production projection considered the total flow rate (Qt) of effluents, which included domestic flows, the infiltration flow rate (Qinf), and the industrial flow rate (Qind).
The average domestic flow rate is calculated using Equation (3).
Qavg = qavg × N × R
where:
  • Qavg = Average domestic wastewater flow rate (L/day);
  • qavg = Average per capita domestic wastewater contribution (L/inhabitants × day); taken at 272.23, based on the National Sanitation Information System (SNIS), in 2022 [53];
  • N = contributing population (person);
  • R = Return coefficient (sewage/water), considered equal to 0.8.
Qinf is defined as 0.3 L/s/km, according to the ABNT NBR 9649/86 standard [54].
The Qind [52] value was determined in this study using hypothetical data from a small craft beer producer. The selection of a brewing industry as the primary contributor to Qind is justified given the scenario-based modeling approach that reflects the socioeconomic identity of Ribeirão Preto. The region, which is recognized as a major technological and agribusiness hub, has a traditional and well-established beverage sector. To ensure that the model remained grounded in local consumption dynamics, Qind was derived from the ‘First National Survey on Alcohol Consumption Patterns in the Brazilian Population’ conducted by the Center for Information on Health and Alcohol (CISA) [55], which showed that 52% of surveyed Brazilians had consumed alcoholic beverages at least once in the previous year. Approximately 60% of this percentage was related to beer consumption. Therefore, it is reasonable to estimate that at least 30% of the Brazilian population drinks beer. By applying these metrics to the population in the study area and assuming a typical daily consumption of one standard dose (350 mL), we can calculate the estimated annual beer production values. To convert the production volume into wastewater flows, we applied the methodology established by Von Sperling [3], adopting a ratio where each m3 of beer produced corresponds to 10 m3 of sewage flow. In so doing, we ensured that the calculated energy potential corresponded to a realistic contribution of the organic load.
The total flow rate (Qt) was calculated following a methodology established by Von Sperling [3,56], which involved summing the domestic, infiltration, and industrial flow rates. From these volumes, additional parameters were derived.
We also applied sensitivity analysis to the data by varying the input parameters from ±30% [57], to ensure the reliability of the projected wastewater flow rate. This sensitivity assessment also encompassed population projections, since the wastewater flow projection is [57,58].

2.4. UASB Reactor Dimensioning

The UASB reactors were sized based on Biochemical Oxygen Demand (BOD), and the biochemical oxygen demand (BOD) for domestic wastewater (BODdomestic) was determined using Equation (4). This was adapted from the methodology established by Von Sperling (2005) [3,56].
BOD domestic ( kg / day ) = P P B O D × N 1000
where:
  • PPBOD = Per Capita Production of BOD per inhabitant, taken as 50 g BOD5/inhabitant × day, according to Von Sperling (2005) [3,59].
  • N = contributing population (inhabitants).
The biochemical oxygen demand for the industrial source (BODindustrial) was calculated based on data provided by Von Sperling (2005) [3] for BOD generation in beer production. A ratio of 350 [inhabitants/(m3/day)] was considered for each volume unit (in m3) of effluent produced, and the BOD was determined using Equation (5).
BOD industrial ( kg / day ) = V e f l u e n t × 350 1000
The total Biochemical Oxygen Demand (BOD) is calculated by adding the values of domestic and industrial BOD.

2.5. Sizing the Activated Sludge System

The parameters used for sizing the system, e.g., gas yield (0.12 m3/kg BOD), organic matter removal rates, and operating conditions, follow methodologies established in Brazilian literature, and which have been widely applied in wastewater treatment plant projects in Brazil. Studies by Von Sperling [3], Nuvolari [4], and Jordão & Pessoa [60] show the suitability of these estimated values for Brazilian tropical conditions, especially for UASB anaerobic reactors. Thus, the parameters, albeit simplified, reflect technically validated practices, and allow for realistic estimates for feasibility analysis.
The activated sludge system was sized based on the projected population size for Ribeirão Preto, SP, and the calculated average and maximum flow rates from Section 2.3 for the final project year of 2045. This process involved sizing complete-mix conventional-rate reactors, sludge thickeners, and secondary clarifiers, which collectively comprise the entire activated sludge system.
All data required for this sizing are given in Table 1, and the calculation methodology was based on studies by Nuvolari [4]. Estimating sludge production from WWTPs is essential for sustainable solid waste management, particularly biosolids. In Brazil, CONAMA Resolution 498/2020 [61] allows treated sludge to be used in soil, if it meets quality and safety standards. This sludge can improve soil quality and provide essential nutrients to plants, reducing landfill waste and promoting nutrient recycling for agricultural sustainability and environmental protection. Treated sewage sludge from anaerobic digestion can be classified as organic fertilizer if it meets the criteria in Annex III of Normative Instruction SDA No. 25 (23 July 2009) [62]. This document defines sewage sludge as a material from sewage treatment processes, ensuring its safety for agricultural use.

2.6. Calculating Energy Potential

2.6.1. Estimating Biogas from Effluent

The energy potential of methane (CH4) from the treated effluent in the UASB reactor was calculated by estimating the output power and the annual energy production, as shown in Equations (6) and (7) [63,64,65].
P = Q C H 4 × T E × E c × P C H 4 × ( 1 31,536,000     1 1000 )
E = P × t × F C
where:
  • P = Power available each year (kW);
  • QCH4 = methane flow (m3CH4/year);
  • PcCH4 (J/m3CH4) = calorific value of methane;
  • Ec = biogas collection efficiency (%);
  • TE = turbine/engine efficiency (33%);
  • 31,536,000 = number of seconds in 1 year (s/year);
  • 1/1000 = to transform the unit from J/s to kW;
  • E—Electric Energy (kWh/year);
  • t = operating time (h);
  • FC = capacity factor (0.6).

2.6.2. Production and Use of Sludge in Biogas Generation

To estimate biogas production from the sludge generated and treated in the activated sludge system, we adopted a value of Pgas = 0.12 m3/kg BOD [3]. Biogas production can be calculated using Equation (8), which applies to systems that incorporate primary sedimentation as a pretreatment step. This process typically removes about 70% of the total suspended solids (TSS) load. Conversely, for systems without primary sedimentation, Pgas is calculated using the method described in Equation (9).
Pgas = 0.12 × BOD load (kg/m3) × Qavg (m3/day) × Remaining COD rate
Pgas = 0.12 × BOD load (kg/m3) × Qavg (m3/day)
where:
  • BOD load = 0.383;
  • Qavg = 108,915.84;
  • Remaining COD rate = 70%.

2.7. Economic Feasibility Analysis

The economic analysis involved calculating the NPV using Equation (10), the IRR, and the LCOE with Equation (11) for biomethane, as per [63,64,65,66,67,68,69].
NPV = t = 0 m ( Q C H 4 × T ) C O M I ( 1 + i ) n
where:
  • CO&M = cost of operation and maintenance;
  • I = initial investment in the project;
  • T = selling price of CH4;
  • n = analysis period;
  • i = interest rate, taken as 8% per year, as per Campello et al. [69].
Regarding Equation (10), instead of using QCH4 for sales, we considered the parameter “Electric Energy,” which is defined as the annual electricity sold based on the Brazilian A-5 auction prices ranging from BRL 194.96/MWh (US$34.99/MWh) to over BRL 600/MWh (US$107.68/MWh) in 2022 [70,71]. Values were converted to US dollars at the exchange rate as of July 16, 2025, as reported by the Central Bank of Brazil, where 1 US Dollar was 5.572201 Brazilian Reais [72].
NPV analysis helps determine a project’s feasibility. If NPV is greater than zero (NPV > 0), the project is feasible. Conversely, if NPV is negative (NPV < 0), the project is deemed infeasible. Furthermore, the Internal Rate of Return IRR reflects the point at which the value of net inflows equals the net investment value. Thus, a positive IRR also indicates project feasibility [66,67,68].
L C O E = ( R $ k g ) = t = 0 m C C H 4 ( 1 + i ) n t = 0 m Q C H 4 ( 1 + i ) n
where:
  • CCH4 = sum of costs associated with CH4 production;
  • n = analysis period;
  • i = interest rate, adopted as 8%;
  • QCH4n = methane flow generated in the analysis period.
The Levelized Cost of Energy (LCOE) represents the average total cost of building and operating an energy generation system over its entire lifespan, divided by the total amount of energy it produces during that period. This metric indicates the average price at which the energy must be sold for the project to remain financially viable [48,65,67,68,69].
To ensure that the economic calculations reflected real-world conditions, the average cost was estimated using a methodology established by the United States Environmental Protection Agency [73] (Equation (12)) for UASB reactors. This approach was replicated for the activated sludge system, with an additional 20% as recommended by Santos et al. [74]. The remaining input values used in the economic calculations are shown in Table 2.
A v e r a g e   C o s t   ( U S $ ) = 19.278   ×   ( k W   C a p a c i t y ) 0.6207
The production cost per m3 of biomethane was estimated for both systems using several key parameters (Table 3), as described in Section 2, and based on values reported by Sales Silva et al. [75], Crispim et al. [76], Investing.com [77], and Simão, J. (2025) [78]. These parameters included the calculated methane flow rate, the methane concentration in the biogas, and the lower heating value (LHV) of methane. Additionally, factors were computed following the methodology established by Simão, J. (2025) [78], including the required investment for the production system (Equation (13)), operation and maintenance costs (Equation (14)), and biomethane production costs per m3 (Equation (15)).
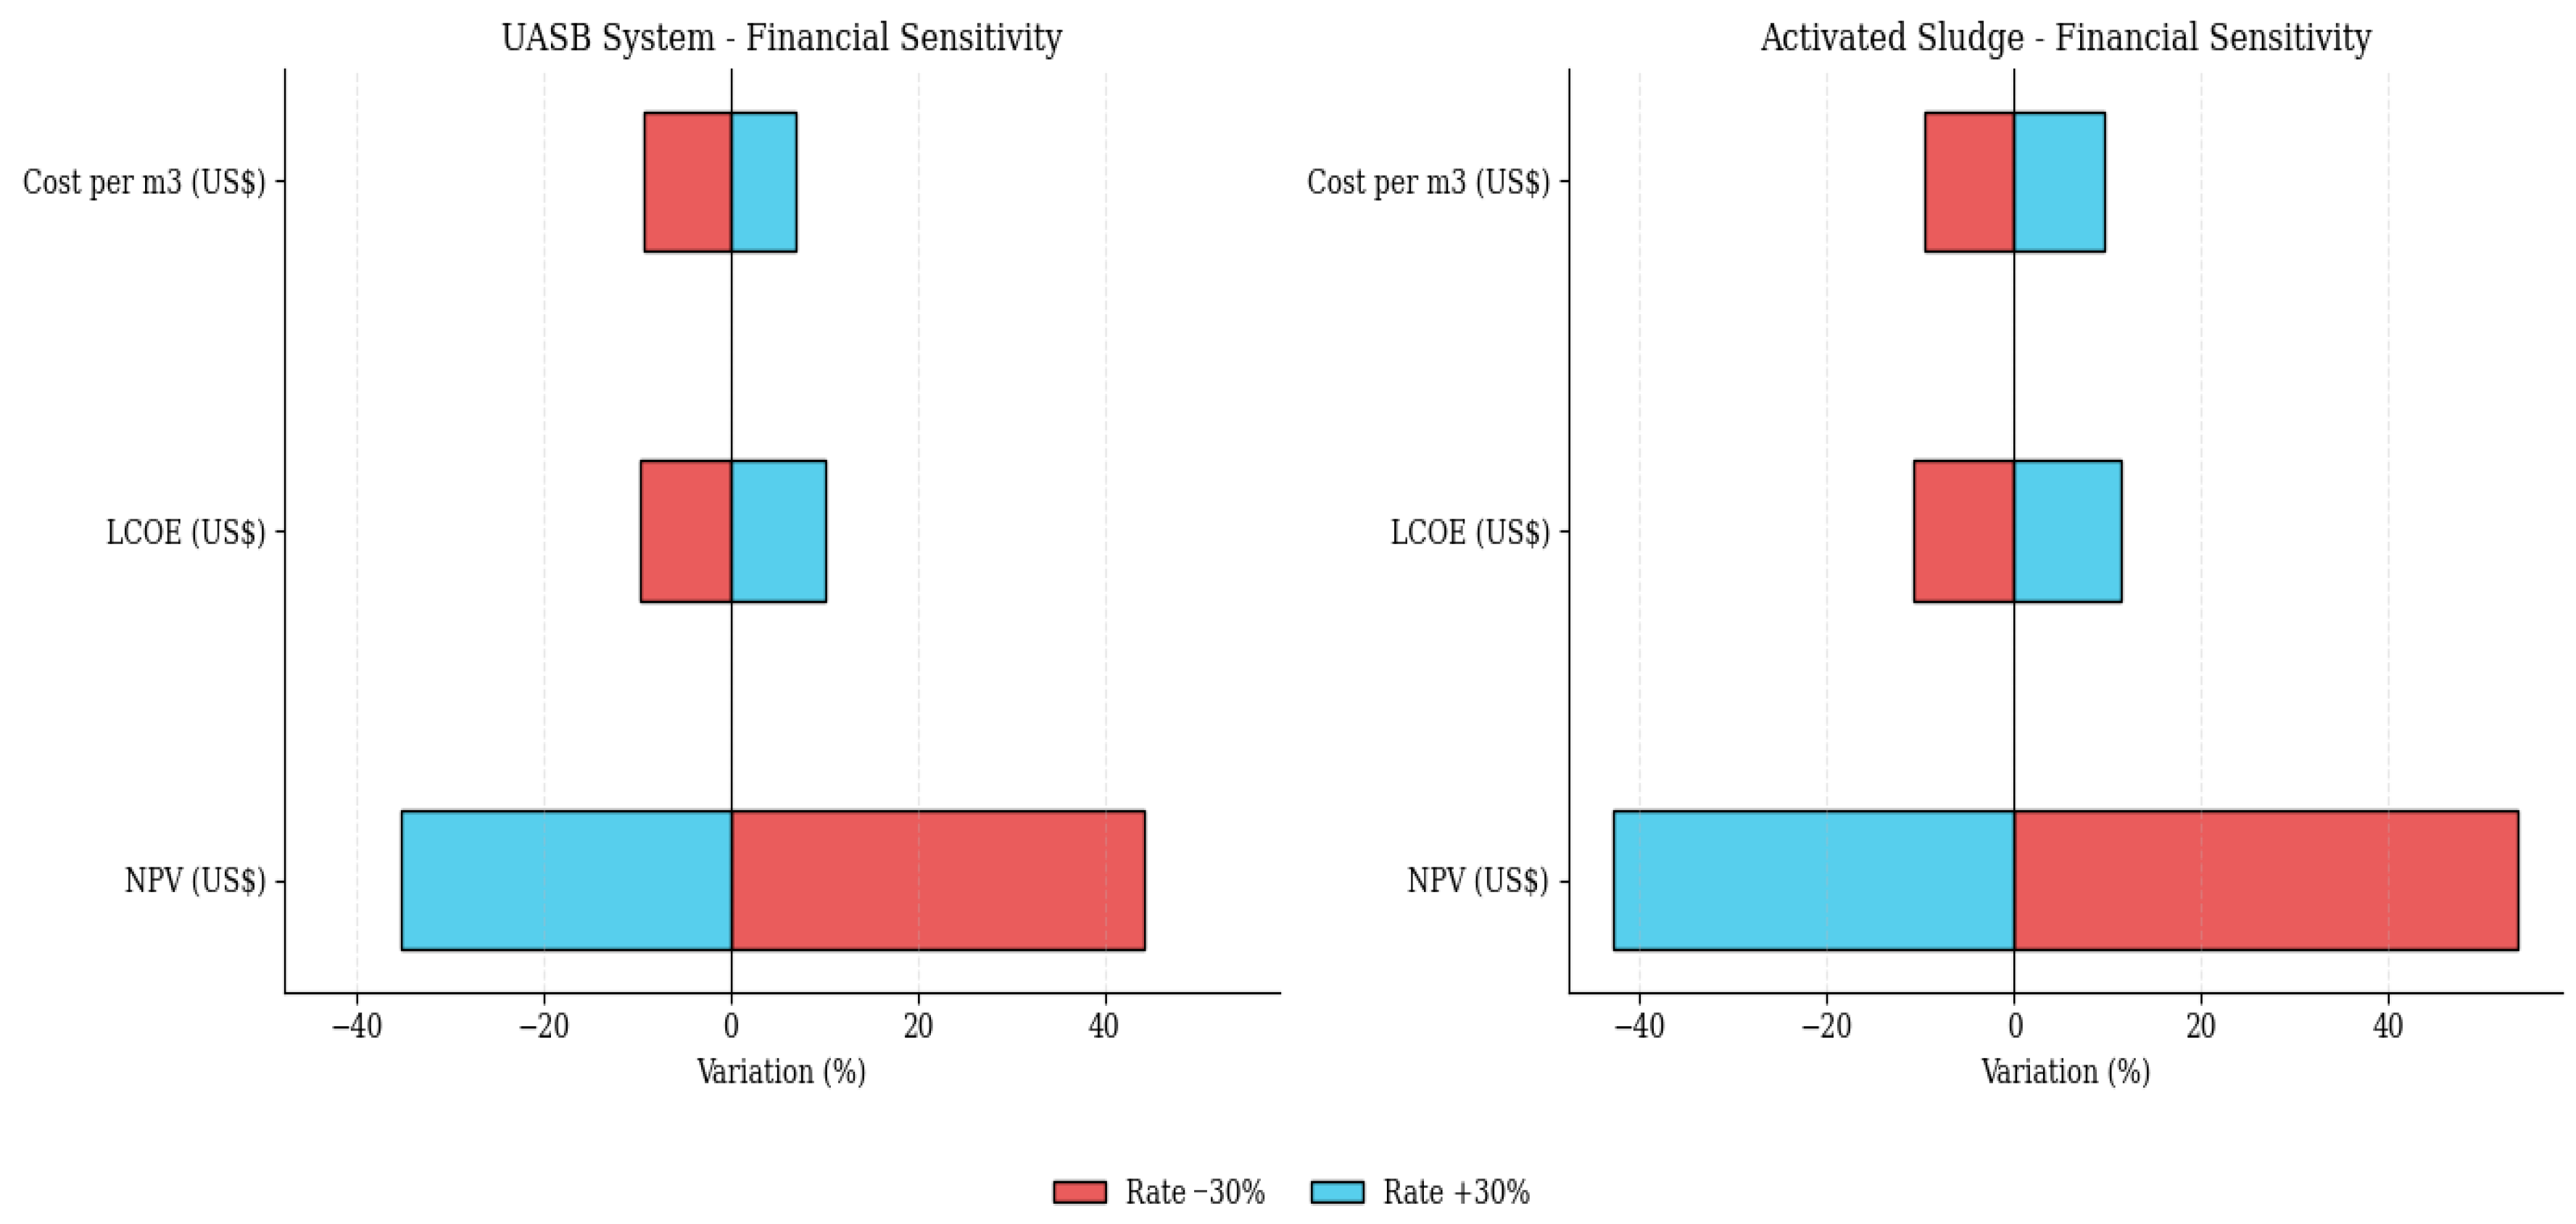
The economic calculations also incorporated a sensitivity analysis of the discount rate, varying by ±30%, and the corresponding effects were further examined through the visual output of a tornado diagram [57,58] to ensure greater consistency among the results.
I n v e s t m e n t   C o s t = ( 246,531 × Q C H 4 0.593 )
where:
  • Q C H 4    = biomethane flow rate (m3/year).
C O & M = ( 7323 × ( Q C H 4 ) 0.291 ) × Q C H 4
where:
  • CO&M = cost of operation and maintenance (US$);
  • Q C H 4   = biomethane flow rate (m3/year).
C Q = t = 1 m C O & M ( 1 + i ) t + I t = 1 m Q ( 1 + i ) t
where:
  • CQ = levelized cost of production of biomethane (US$/m3);
  • t = time, CO&M = cost of operation and maintenance for the year (US$);
  • i = discount rate (%);
  • Q = production of biomethane in (m3/year);
  • I = total investment (US$).

3. Results

3.1. Population Projections

The results of the population projection calculations are given in Figure 2. This graph shows the outcomes of the arithmetic, geometric, and logistic projections over 20 years, starting in 2025. By the end of this period, the estimated population of Ribeirão Preto, São Paulo, is projected to reach 833,982 inhabitants using the logistic growth model.

3.2. Sewage Flow Rate Estimates

The flow rates for domestic and industrial sewage were measured from 2025 to 2045, and the results are given in Table 4. Using these values, Table 5 shows the calculated Biochemical Oxygen Demand (BOD) concentrations for both domestic and industrial sewage over the entire project period.

3.3. Projections and Biogas Production via the UASB Reactor

Based on the input data, the projections for the Upflow Anaerobic Sludge Blanket (UASB) reactor indicated a total required volume of 32,760 m3 and a total useful surface area of 8400 m2. Thus, 50 reactors would be needed, each measuring 40 m in length.
The hydraulic retention time (HRT) is calculated as the total reactor volume divided by the average flow rate, resulting in 7.2 h.
The estimated biogas production (Pgas), methane, and sludge levels for 0.15 kgVSS/kgCOD, both with and without a primary sedimentation system, at a sludge removal efficiency of 70%, are given in Table 6.
Based on the generated methane values, we then estimated the energy potential and its conversion into electricity. The values were: 308.82 kW of power and 1893.69 MWh/year of potential electricity generation.

3.4. Projections and Biogas Production via the Activated Sludge System

The sizing calculations for the activated sludge system show that five double-stage digester units would be required to meet the projected effluent demands for the final projected population. The total reactor volume needed would be 129,110.4 m3. Each reactor has a useful depth of 7.8 m and a freeboard of 1.5 m, which results in a surface area of 5541.47 m2.
The sludge retention time was set at 20 days. The concentration of volatile solids (VS) in the reactor measured 2.297 kg/m3, while the net daily production of total suspended solids (TSS) amounted to 17,755.0 kg/day. When sizing the secondary reactor, the volatile solids value was adjusted to accurately determine the total suspended solids concentration using the relation VS/TSS = 0.75, resulting in a value of 3.06 kg/m3.
To finalize the design of the activated sludge system and the secondary clarifier, and to comply with the upflow criteria established by Nuvolari [4], we calculated the dimensions of the sludge thickener and the anaerobic biodigester. The results of these calculations are shown in Table 7 and Table 8, respectively.
The biogas generated in this process was estimated at 3061 m3/day, while the production of biomethane was 1990 m3/day. Based on the methane volume produced, its energy potential was calculated at 269.77 kW, and the electricity generated from this was equivalent to 1654.27 MWh per year.

3.5. Economic Feasibility

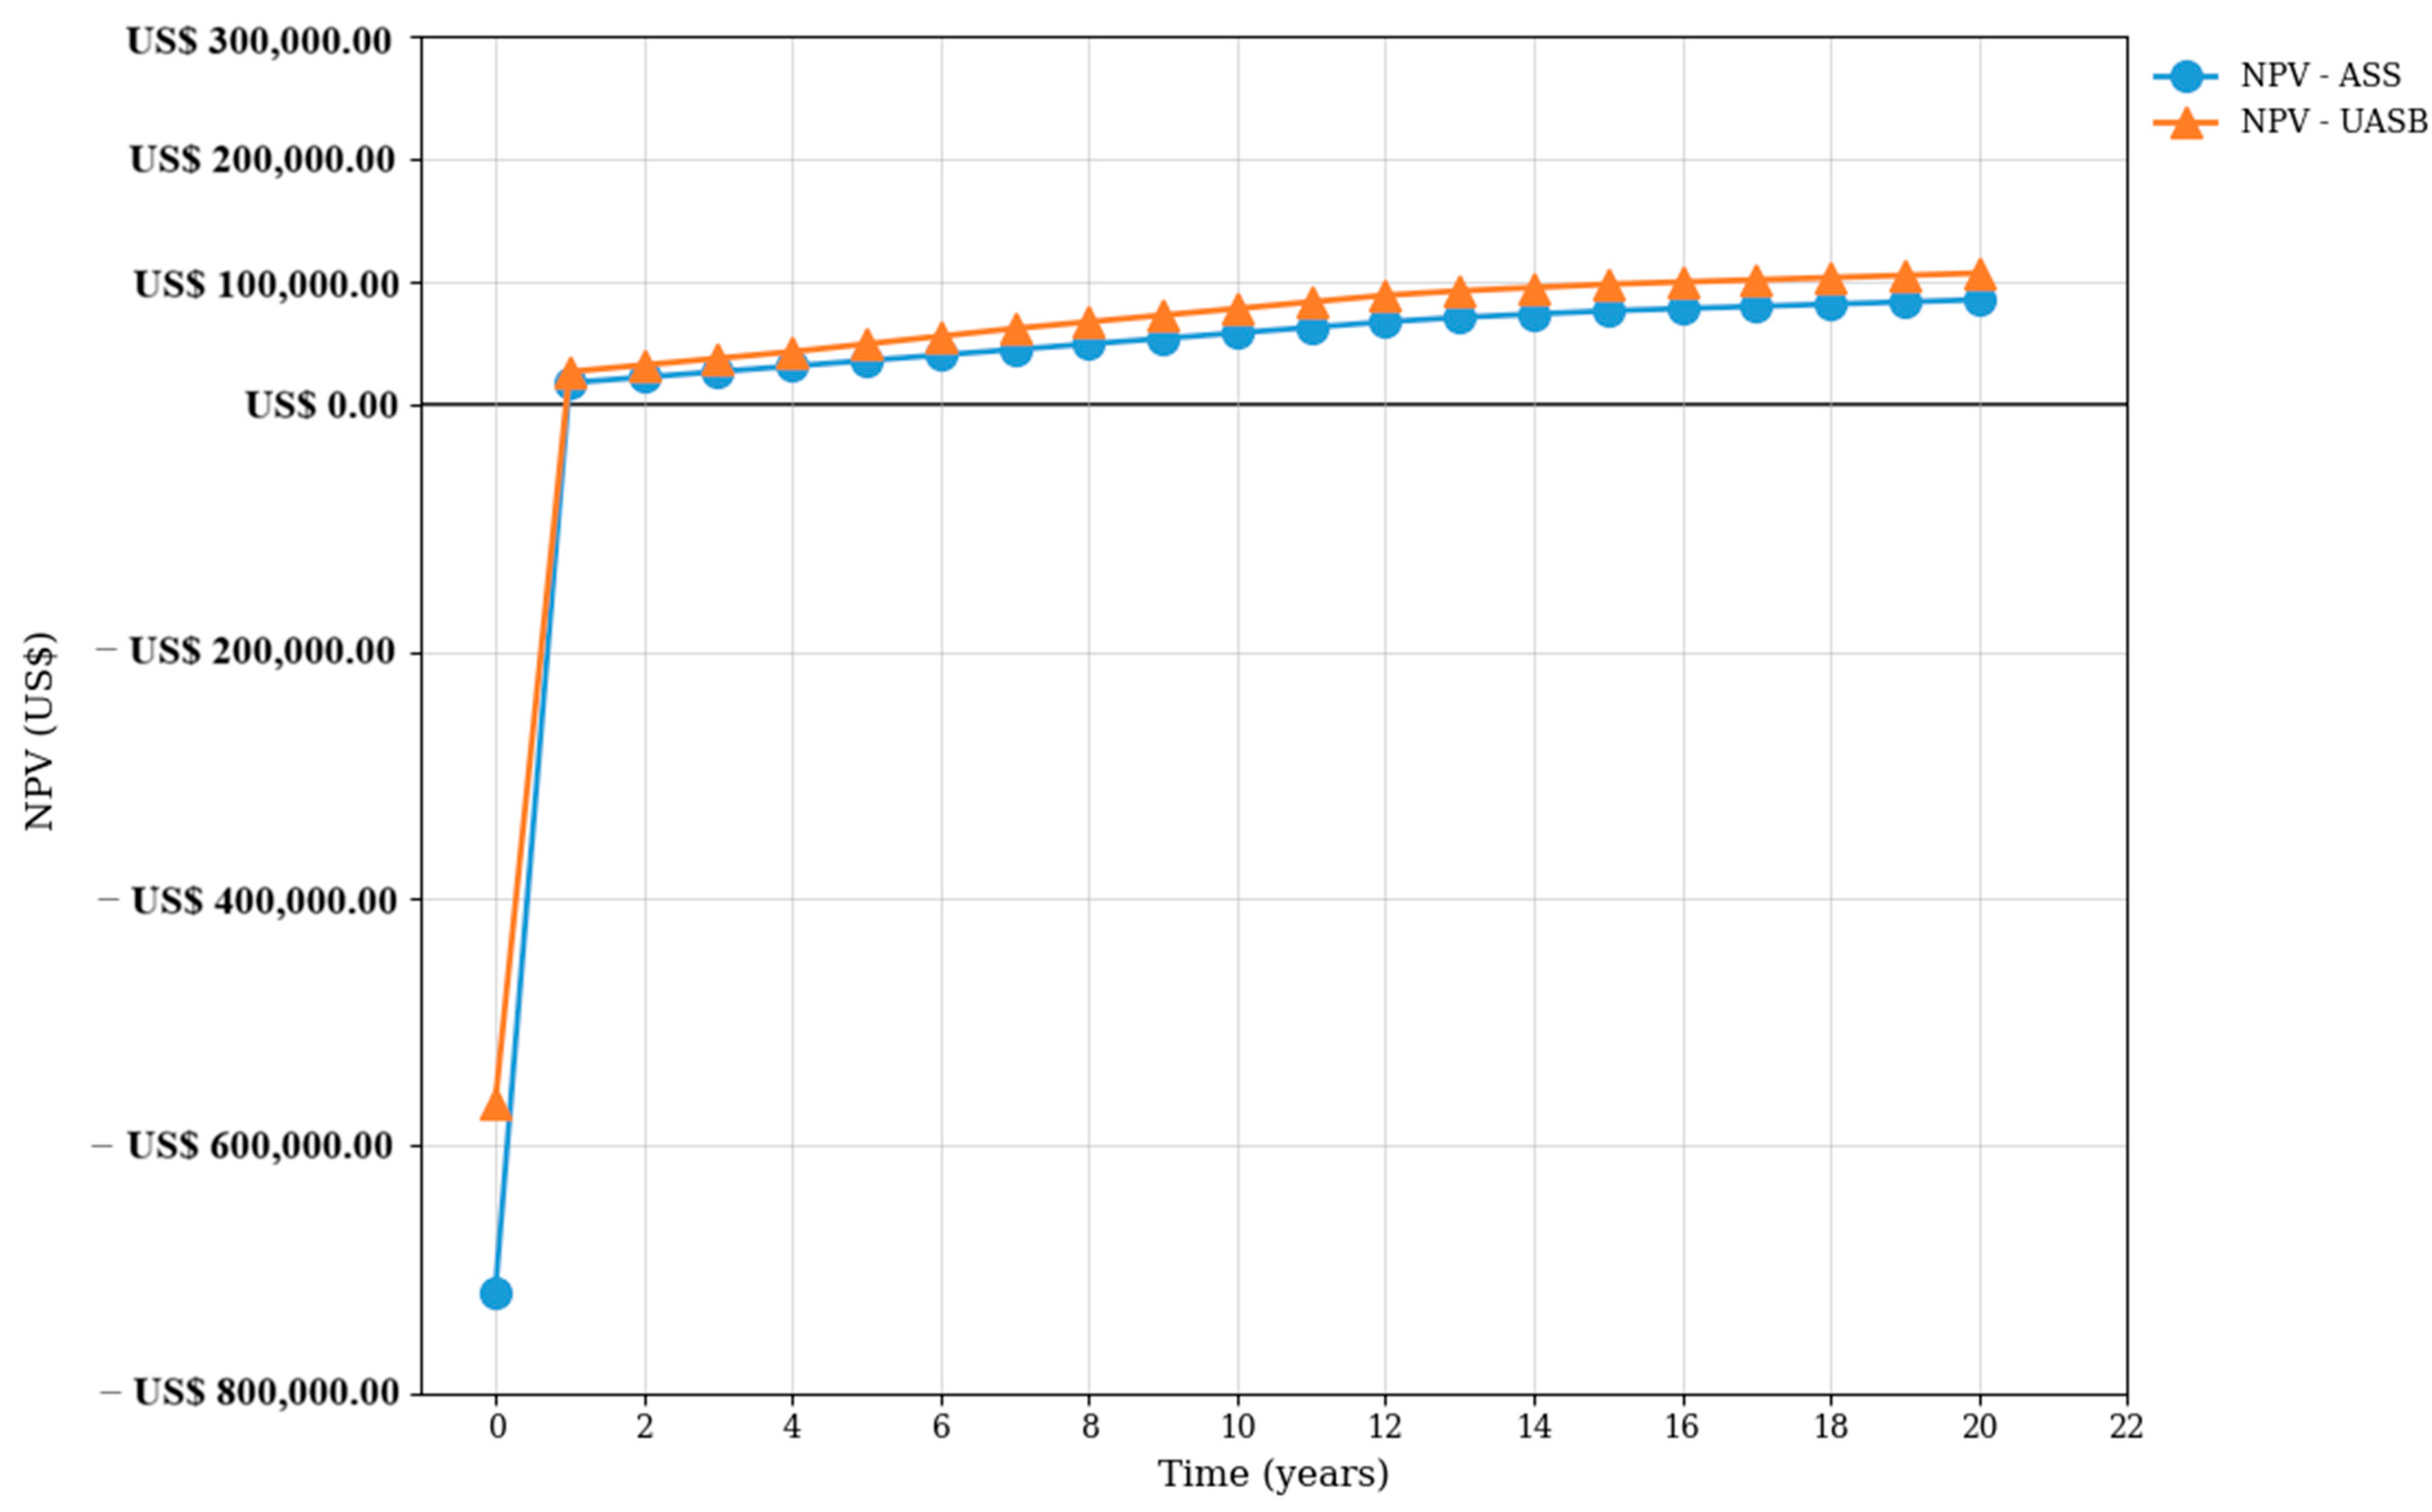
The economic feasibility assessment conducted for both systems confirmed their viability, yielding a positive internal rate of return (IRR) and investment payback within the first year of the project. The results for the calculated parameters are given in Table 9. At the same time, Figure 3 shows the cash flows and payback periods for both the UASB and activated sludge systems.
The estimated cost of producing biomethane per m3 was close to the reference market sales price at US$ 0.497 [65]. The higher cost was for biomethane produced in the activated sludge system, while the cheaper cost was for biomethane produced in the UASB system (18.3% cheaper). The results from this stage are summarized in Table 10.

Sensitivity Analyses

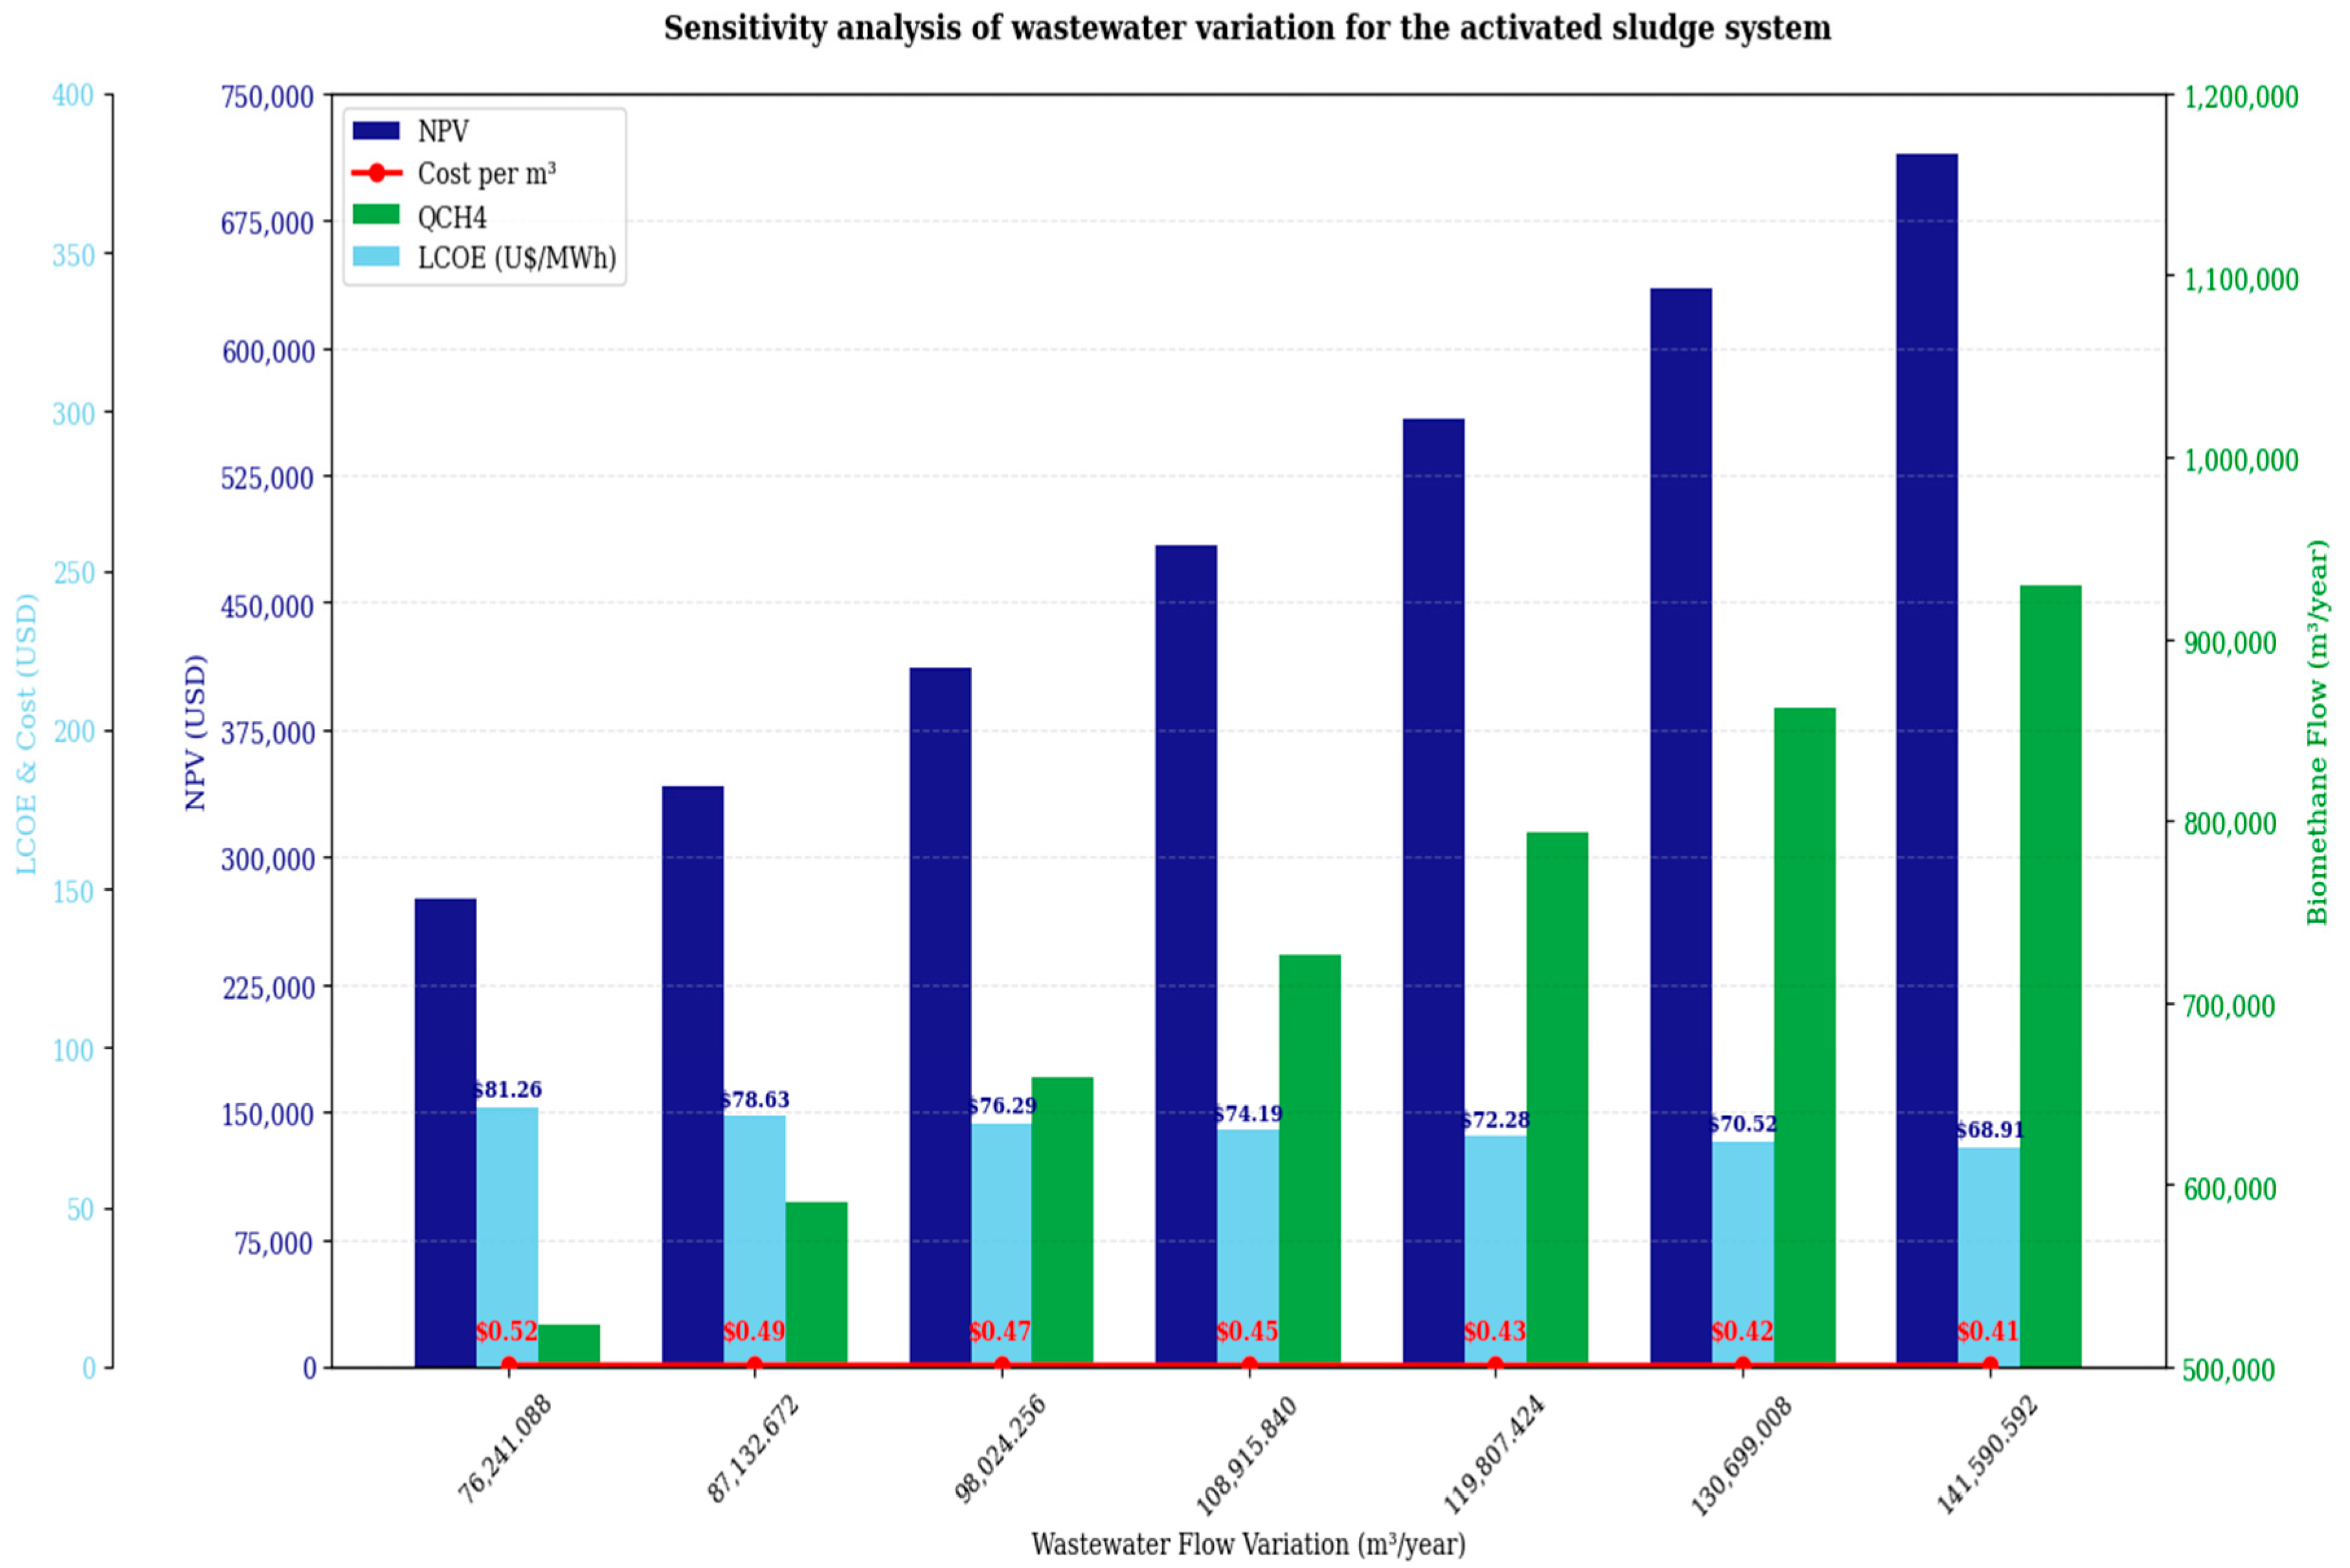
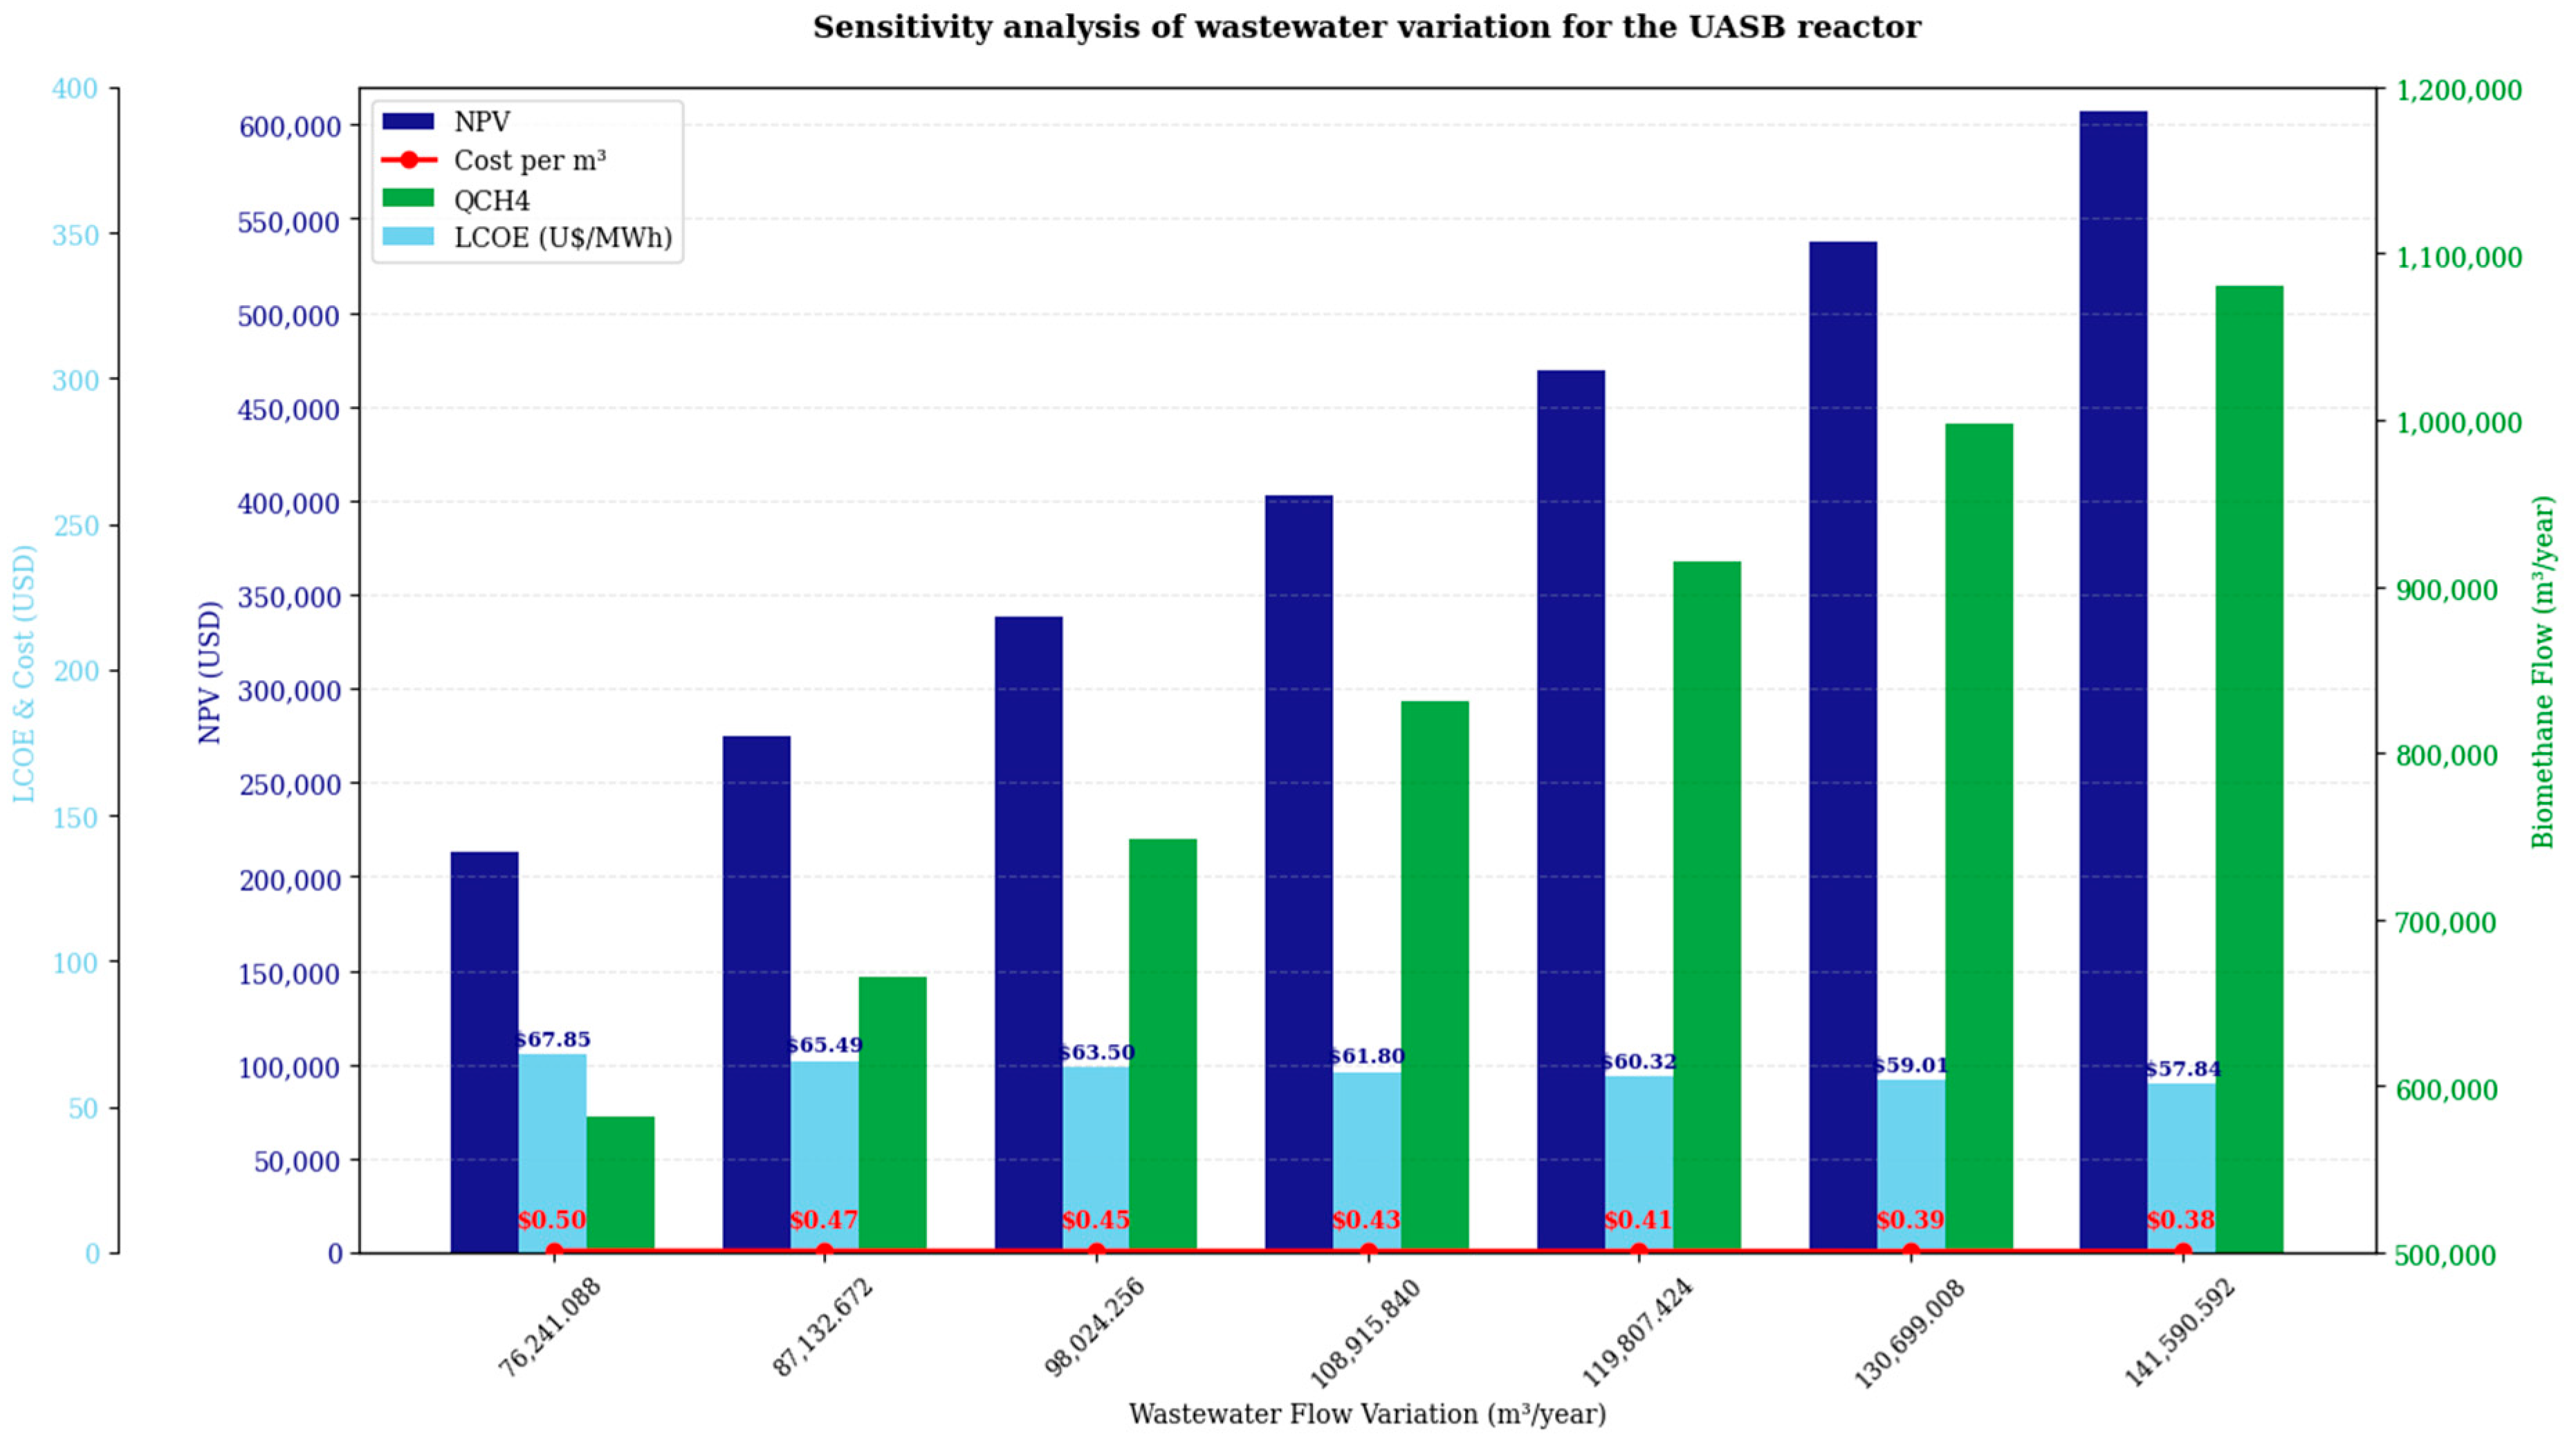
Sensitivity analysis was performed to ensure the reliability of the economic calculations. Selected parameters that exhibited substantial variability under real-world conditions were analyzed, e.g., the projected wastewater flow rate and the discount rate. These parameters directly affect economic and operational indicators, including the biomethane flow rate, NPV, LCOE, and the estimated cost of producing one cubic meter of biomethane. Accordingly, the effects of varying the wastewater flow rate by ±30% and their impact on the other indicators are shown in Figure 4 for the activated sludge system and in Figure 5 for the UASB system.
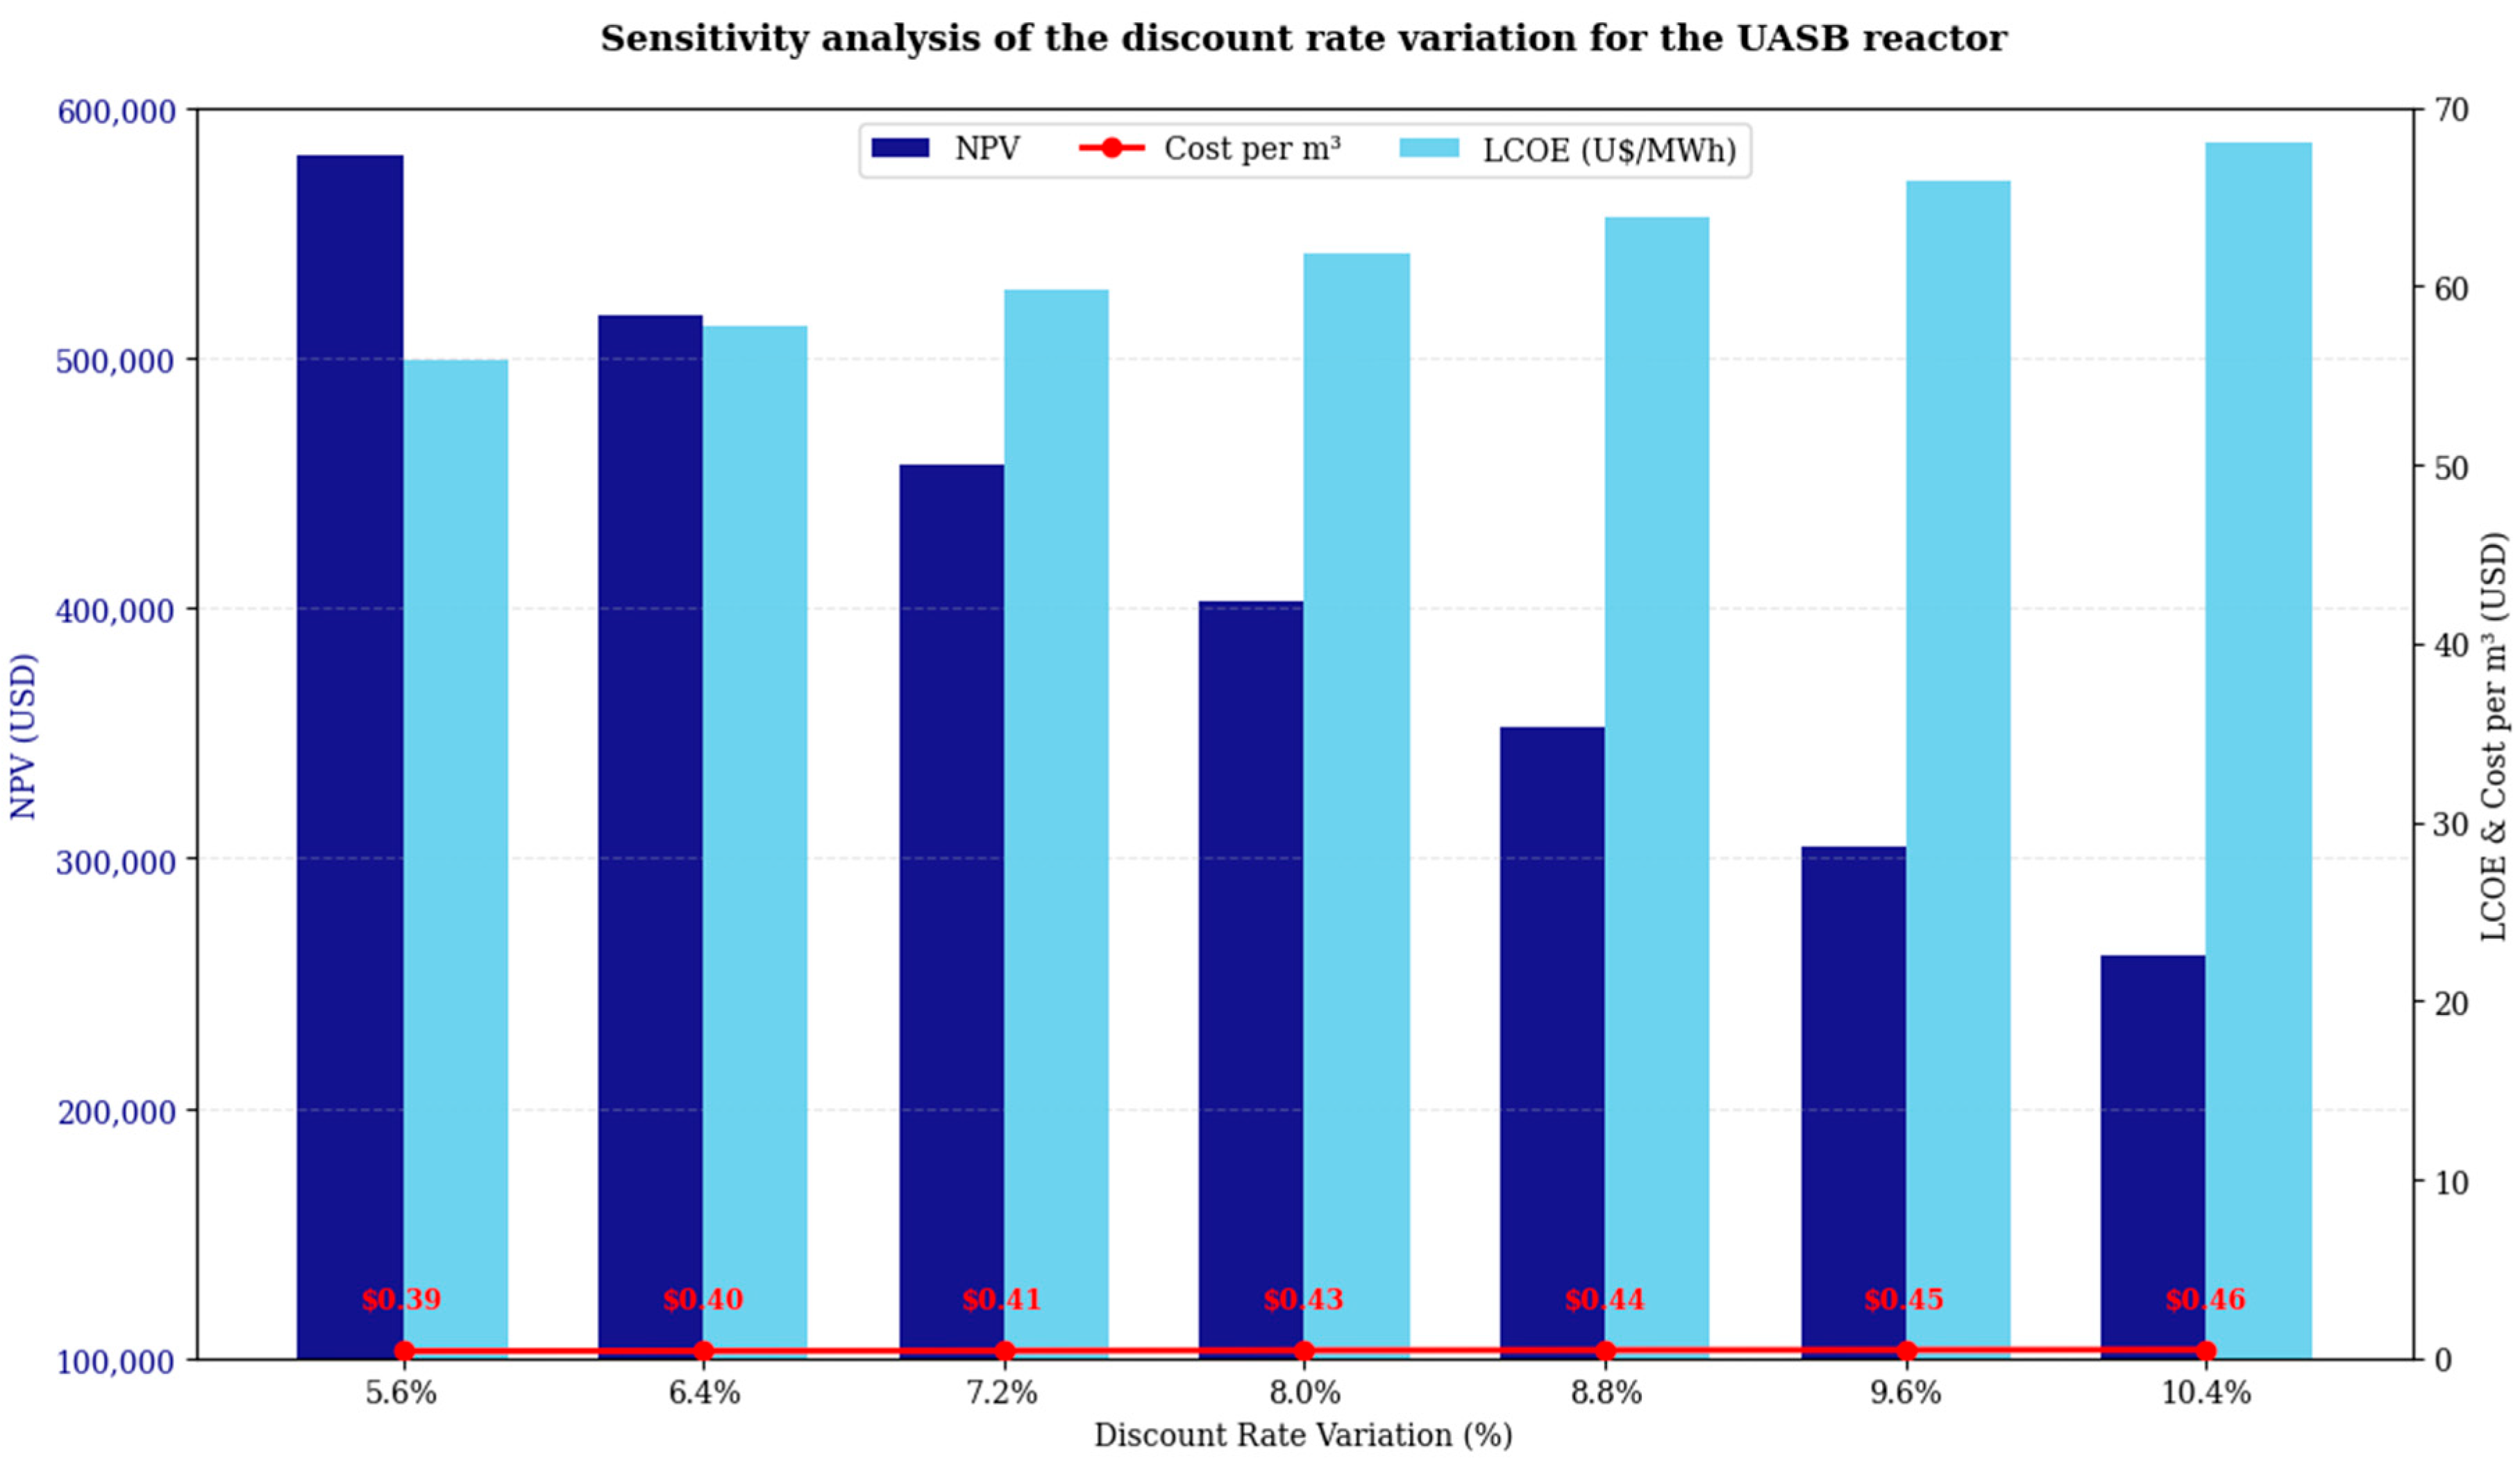
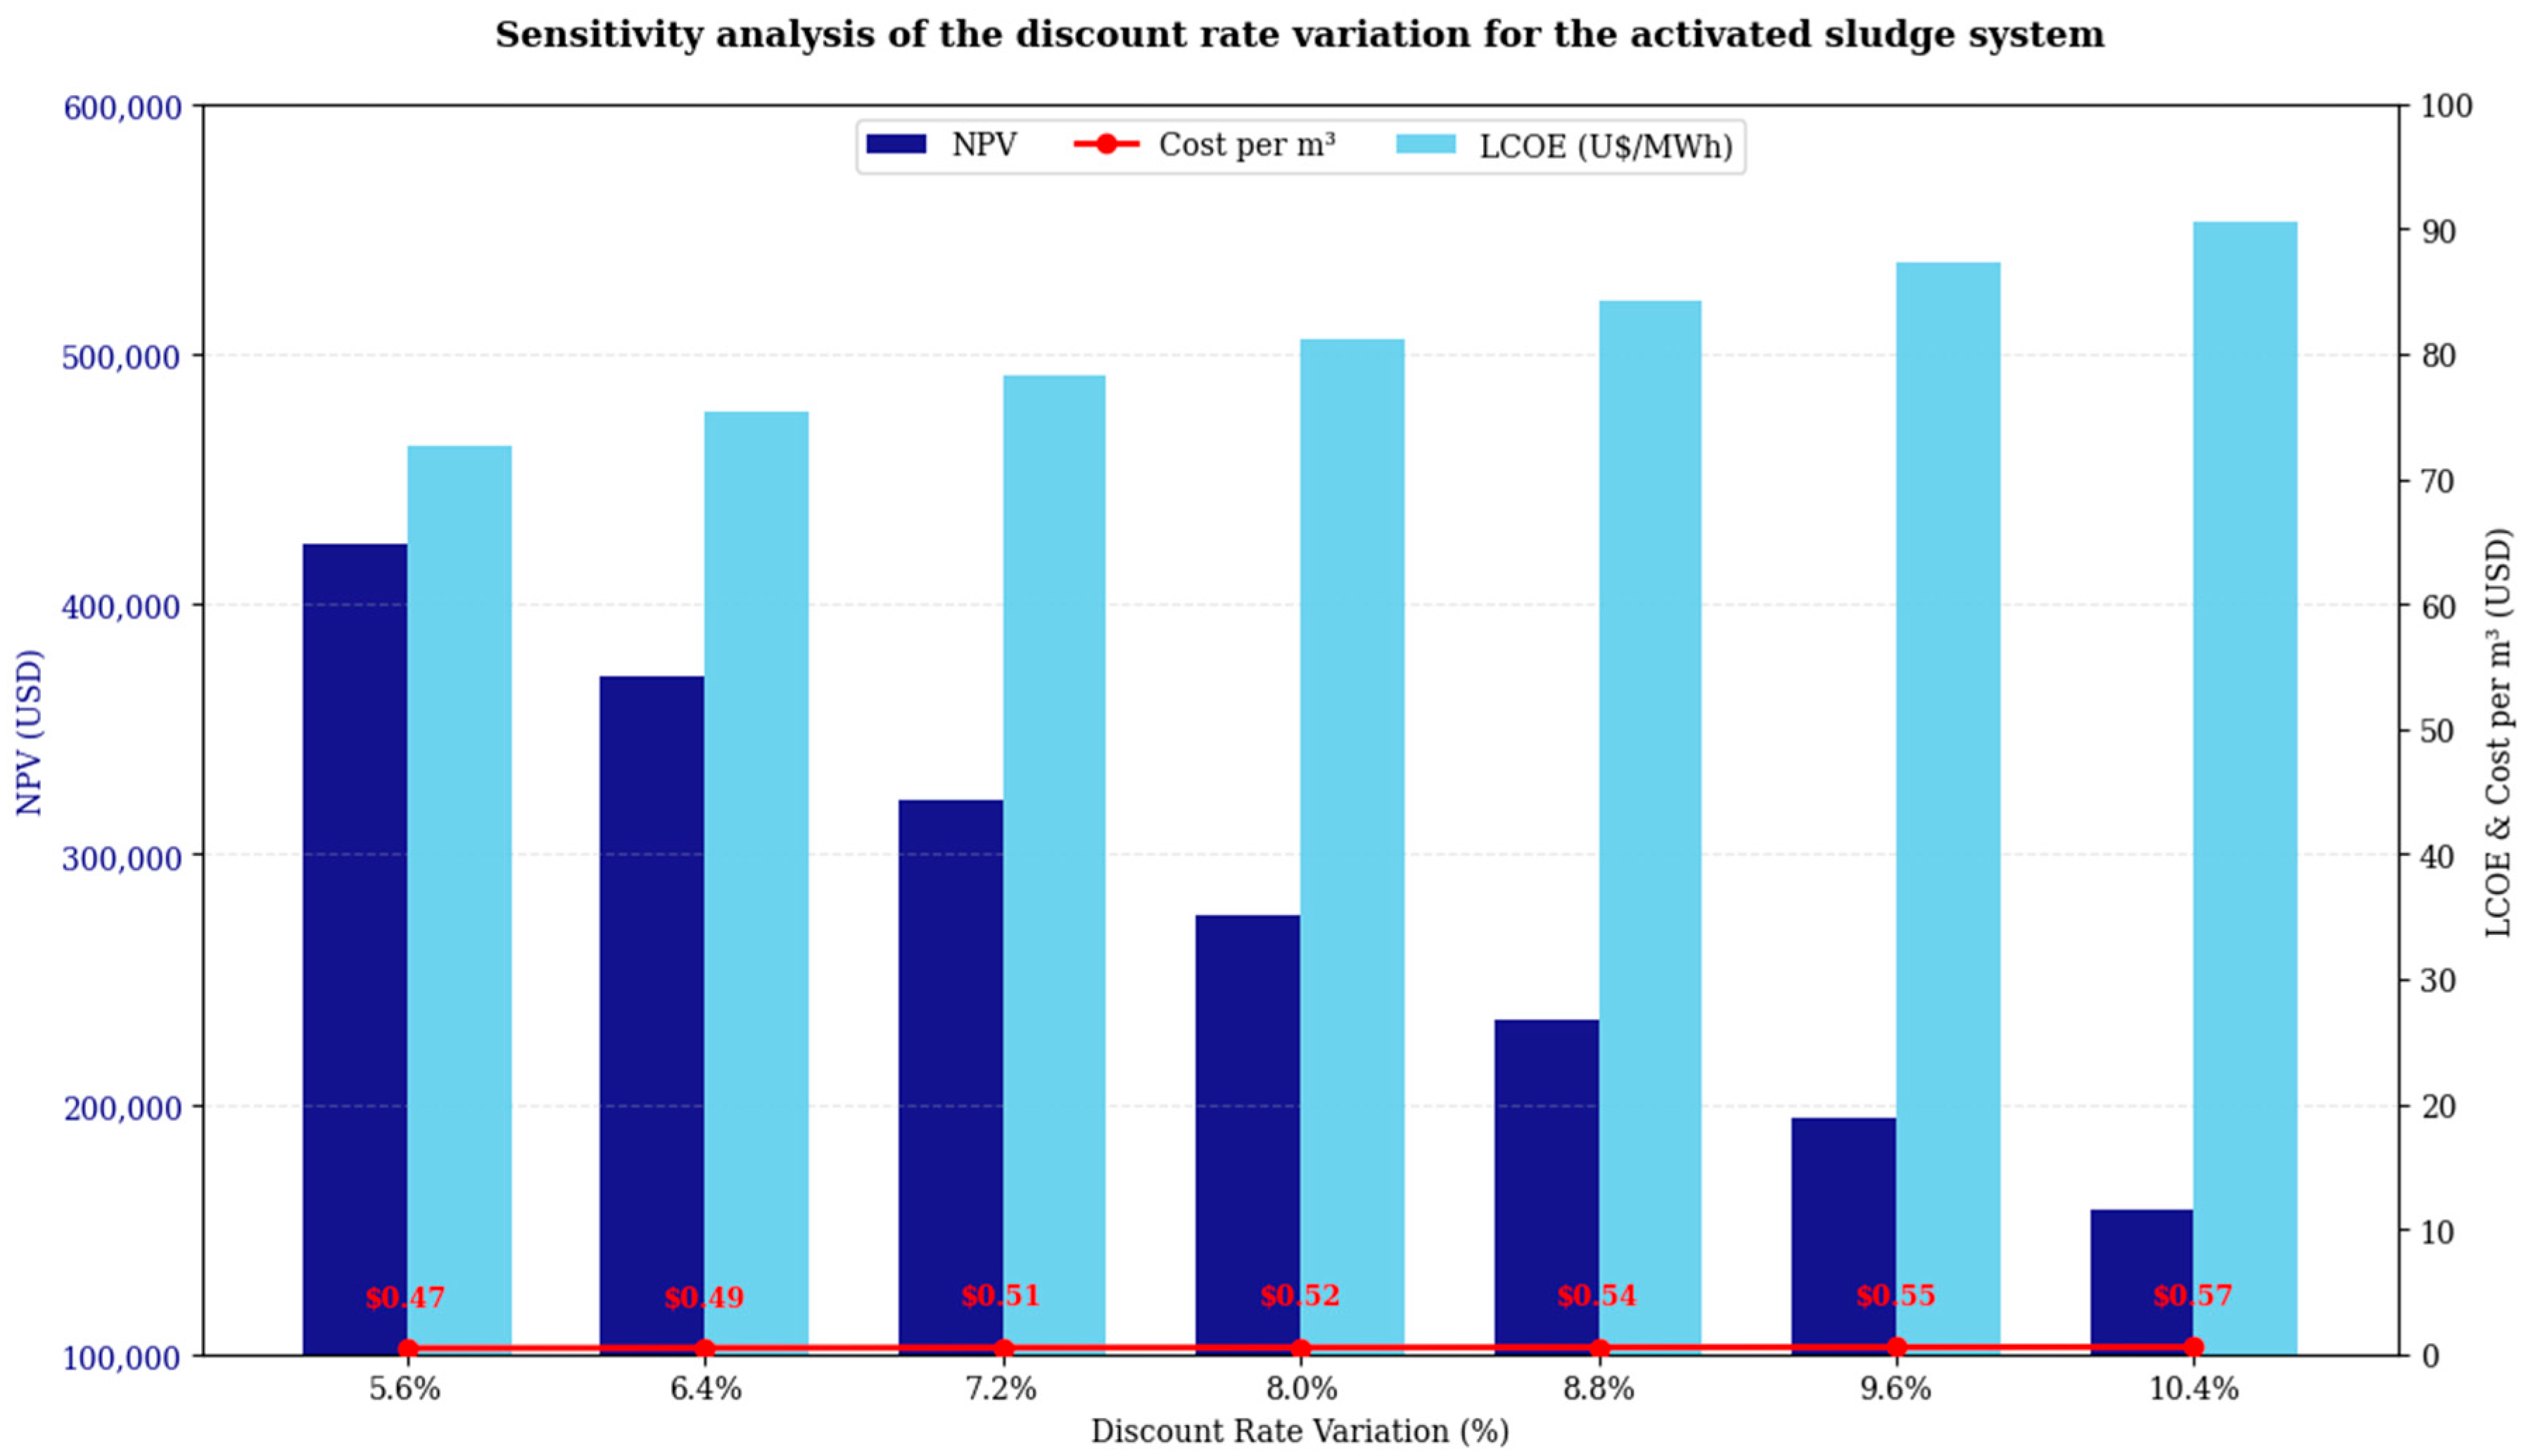
The results from the ±30% variations in the discount rate were evaluated in terms of their impact on economic indicators such as NPV, LCOE, and biomethane production cost per m3. The resulting values are shown in Figure 6 for the activated sludge system, and in Figure 7 for the UASB system.
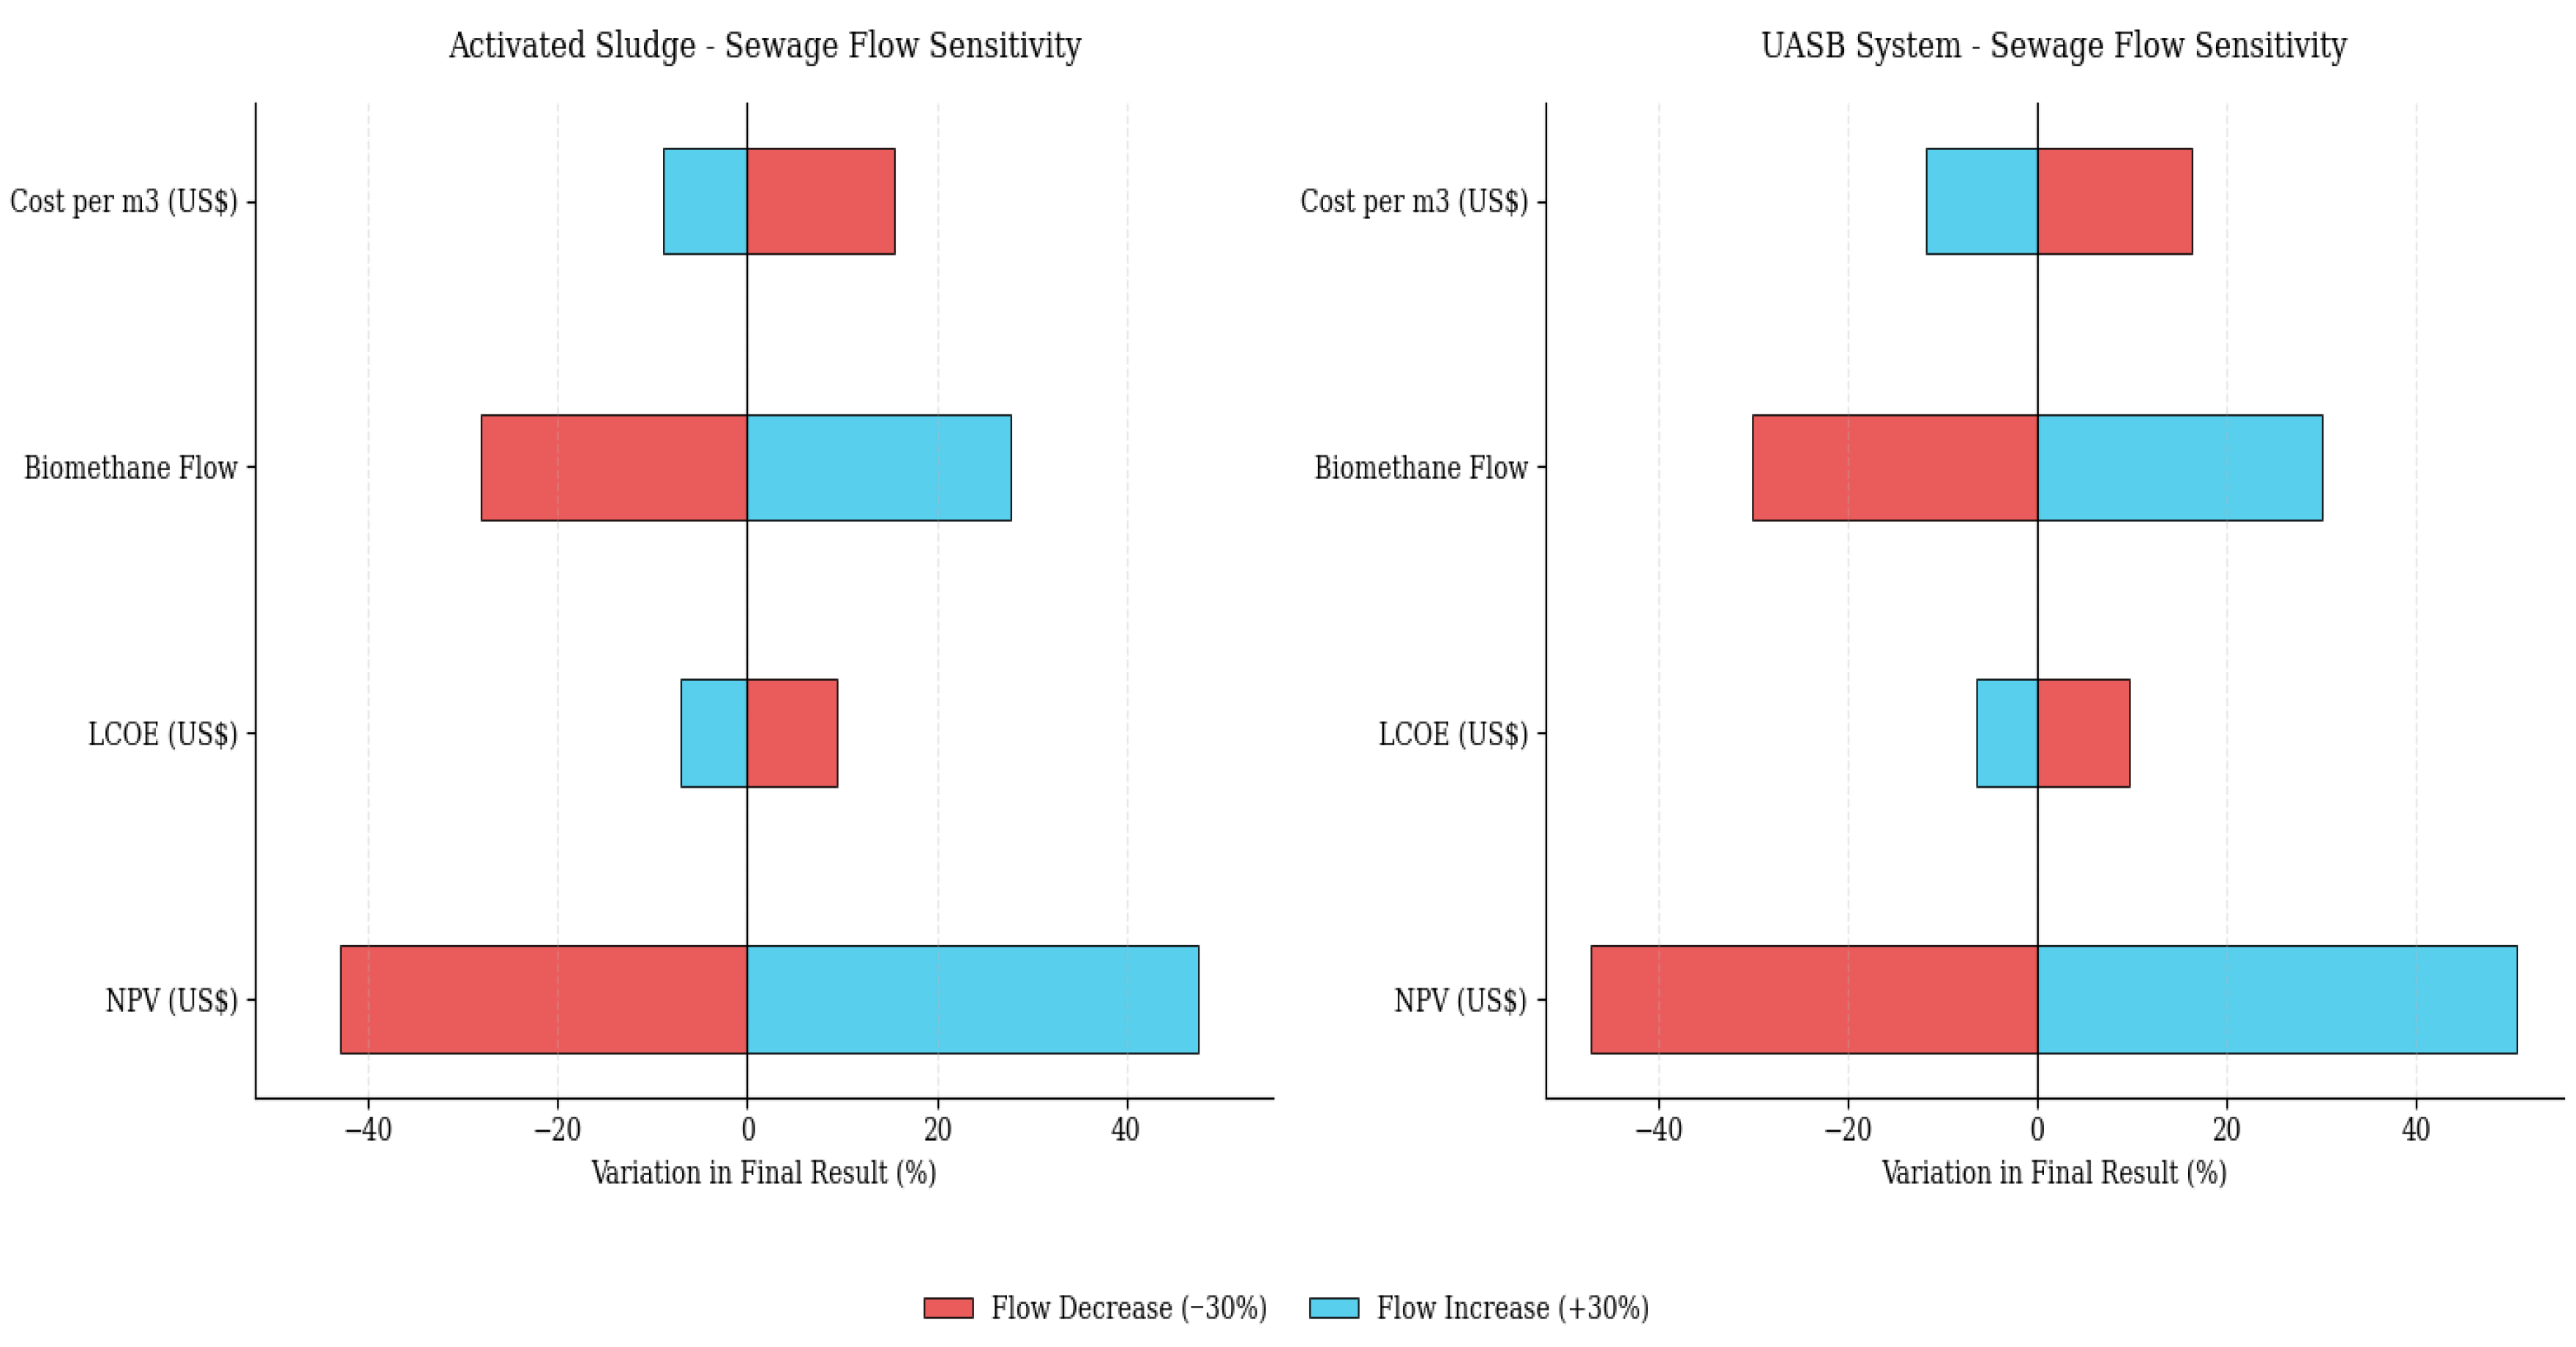
A tornado diagram was applied to the considered parameters to synthesize the results of the sensitivity visually analyses. Figure 8 shows the sensitivity of the projected wastewater flow rate and its impact on the operational and economic indicators, comparing the activated sludge and UASB systems. Figure 9 shows the same comparative assessment based on the sensitivity of the discount rate.
Across all evaluated scenarios, Net Present Value (NPV) was the indicator with the highest relative sensitivity, exhibiting the largest variation in response to ±30% changes in both the projected wastewater flow rate and the discount rate. The biomethane flow rate responded linearly and directly to operational variations. In contrast, LCOE and the unit cost per m3 showed an inverse relationship with the influent volume, with moderate variations ranging from 6% to 16%.

3.6. Agricultural Use of Activated Sludge

The findings from this study highlight significant advantages for the agricultural sector, particularly using sludge treated as a soil conditioner. The UASB system is estimated to produce up to 8985.6 kg of VSS daily without primary decantation. This sludge is a valuable source of nutrients that can improve soil fertility and reduce the need for chemical fertilizers. Furthermore, the daily production of TSS is estimated at 17,755 kg, representing a considerable amount of material that can also be repurposed as a soil conditioner.

4. Discussion

According to the projections, Ribeirão Preto, São Paulo, Brazil, is expected to reach an estimated population of 833,982 inhabitants at the end of the 20-year period, i.e., the timeframe established for project implementation. The logistic growth model explicitly accounts for environmental and social factors that influence population growth and incorporates the carrying capacity of the environment [50]. This model is widely used in demographic studies to predict population dynamics under constraints. Its ability to depict growth patterns makes it a valuable tool for urban planning and resource allocation studies [50]. The results of this present study indicate significant potential for biogas and methane production from wastewater treatment in Ribeirão Preto, São Paulo, Brazil, highlighting the feasibility of energy recovery from this resource. The estimated methane production for the UASB system was approximately 2277.63 m3/day with primary sedimentation, and 3235.6 m3/day without primary sedimentation. In contrast, the estimated methane production in the activated sludge system (ASS) was 1990 m3/day.
These values corroborate Chernicharo [2,79], who highlighted that UASB-type anaerobic reactors can generate between 0.20 and 0.35 m3 CH4/kg COD removed, depending on temperature, wastewater characteristics, and system efficiency.
The greater biogas production potential of the UASB system, compared to activated sludge, stems from its anaerobic configuration, which converts organic matter directly into methane without requiring an additional digestion step. This advantage is especially significant in tropical regions, where high average temperatures favor microbial activity and increase process efficiency [2,3].
However, this system presents operational challenges, i.e., greater sensitivity to load variations and the risk of accumulated solids.
In this context, it is important to consider potential inhibitors present in industrial wastewater, including effluent from the brewing industry, which was examined in this study. These effluents can lead to the accumulation of volatile fatty acids (VFAs), lowering the pH below 6.5 and thereby inhibiting methanogenic archaeal activity [2]. Another factor to consider is nutrient imbalance: the inputs of specific industrial effluents may alter the C:N:P (carbon, nitrogen, and phosphorus) ratio, which can limit microbial growth [3,60]. Accordingly, future studies should conduct Specific Methanogenic Activity (SMA) and Biochemical Methane Potential (BMP) tests using real samples from the Ribeirão Preto industrial park to validate the theoretical methane yields estimated in this study.
The activated sludge system, while more stable for treatment, consumes more energy and requires a secondary digestion step for energy recovery, which increases operating costs. This comparison highlights that UASB may be more attractive, both from an energy and economic perspective, for cities with a high level of agricultural activity and a favorable climate.
In our study, 0.15 m3 CH4/kg COD [3] yielded conservative estimates, reinforcing the potential to enhance biogas production by 5% through operational improvements. Sustainable biogas production in municipal sewage treatment plants is widely recognized for its benefits, including energy efficiency and nutrient recycling. Recent reviews stress the need for innovative strategies to enhance biogas generation from sewage sludge [80,81,82].
From an energy perspective, the UASB system showed potential electricity generation of 1839.69 MWh/year, whereas the activated sludge system showed 1654.27 MWh/year. Studies show that using biogas for electricity generation significantly enhances the operational sustainability of wastewater treatment plants, meeting approximately 50% to 70% of the sanitation system’s energy demand, contingent on the efficiency of the conversion process [80,81,82].
Bachmann et al. [82] reported that wastewater treatment plants (WWTPs) achieve electrical self-sufficiency of about 37% in smaller plants (<10,000 population equivalent, PE) and between 68% and 100% in larger plants (>100,000 PE). They also reported that the electrical energy generated by WWTPs ranges from 10 to 20 kWh per population equivalent (PE) per year. Similar values, between 50% and 70%, were reported by Lima et al. [83]. Hao et al. [18] evaluated the feasibility of operating carbon-neutral wastewater treatment plants in China and concluded that biogas recovery could supply up to 60% of the plants’ energy demand. The European Biogas Association [84] reported that anaerobic treatment can reduce energy consumption by up to 75% compared with aerobic treatment.
Outside of Brazil, international studies reinforce the importance of integrating sanitation and energy generation. In Europe, several treatment plants have already achieved energy self-sufficiency, e.g., in Germany and Denmark, which use biogas to meet 100% of their electricity and heat demand [82,84]. In China, recent studies demonstrate the potential to operate carbon-neutral sewage treatment plants by combining anaerobic digestion with energy recovery and carbon-credit generation [18]. These international studies show that adopting UASB and activated sludge systems in Brazil aligns with a global trend toward making sanitation systems more sustainable and energy-efficient.
In economic terms, both systems were viable, exhibiting positive NPV and IRR values, i.e., 14.69% for the activated sludge system, and 16.83% for the UASB system. This reinforces the financial viability of implementing energy recovery units that make use of the generated biogas. Additionally, when compared to the LCOE values reported by Energy Research Office (EPE) [65] for conventional thermal sources in Brazil, the benefits of these systems become even more apparent (about R$400/MWh). The analyzed systems showed a lower levelized cost (between US$ 61.82/MWh and US$ 81.29/MWh), showing competitiveness and helping to diversify the energy mix.
However, it is important to emphasize that the superiority of the results obtained by the UASB system is contextualized, in this study, within the regional and climatic specificities of the municipality of Ribeirão Preto and consequently of Brazil, where tropical and subtropical areas are present and contribute to the efficiency of anaerobic digestion, which is highly sensitive to operating temperature, showing better performance when the ambient temperature remains in the mesophilic range (between 20 °C and 35 °C), favored in this case by the study region. On the other hand, in temperate regions or cold climates (psychrophilic conditions), the UASB process faces significant challenges, such as reduced biogas yield and the potential for solids accumulation, which would increase both the CAPEX and OPEX of the process due to thermal stabilization. Therefore, while the UASB configuration presents a robust case for energy recovery in the context of sanitation in areas with tropical and subtropical climates, its applicability as a primary treatment stage in colder climate regions requires careful evaluation.
The cash flow analysis showed a payback period of approximately one year for both systems, as shown in Figure 3, demonstrating real economic advantages and a rapid financial return for the project. The calculated unit costs for biogas production, which ranged from US$ 0.43 to US$ 0.52/m3, were in line with the Brazilian market reference price of US$ 0.497/m3. However, these values represent ‘initial costs’ and do not include storage, purification, or transportation costs. Since base costs already account for approximately 86–90% of the market price, external sales may operate with narrow profit margins. Consequently, the project’s strategic viability is better aligned with energy sales, or, in this context, can be maximized through on-site biogas use, which avoids additional logistical costs and leverages the identified economies of scale.
Furthermore, the RenovaBio program (Law No. 13.576/2017) [13] also represents a strategic opportunity, given the narrow margins in the unit cost of biogas, as it allows biomethane producers to issue Decarbonization Credits (CBIOs). Since methane has a global warming potential that is 20 times greater than CO2, capturing and transforming methane into fuel significantly contributes to energy transitions and provides an economic incentive that can decouple project viability from natural gas sales. Additionally, the regional economic profile of Ribeirão Preto as a strong agro-technological and biofuel hub offers opportunities for co-digestion. Mixing sewage sludge with organic waste from local agribusiness can substantially increase biogas production without proportionally increasing initial investments. Finally, prioritizing in situ energy recovery for self-consumption can reduce a plant’s electricity demand by up to 70%, thereby protecting the project from logistical costs and fossil fuel market fluctuations.
Table 11 compares the baseline scenario, as described in this article, and a circular integration scenario to highlight the possibilities for economic growth, considering the potential economic opportunities arising from the use and application of the marketable resources involved in this project.
Table 11 clearly shows that although the financial viability of the UASB system is already positive in the current model, the profit margin can be significantly expanded by monetizing environmental externalities. CBIOs can be issued, for example, thereby transforming environmental liabilities into tradable financial assets and protecting the project against fluctuations in the cost of biomethane production. Furthermore, the agricultural application of sludge eliminates landfill costs and generates a high-value-added product for the regional agricultural community.
The tornado diagram shows that the economic feasibility of both technologies is primarily influenced by Net Present Value (NPV), the most sensitive indicator across all scenarios. The Activated Sludge system is more operationally vulnerable, as its profitability is strongly affected by changes in wastewater flow rate (a 47.03% decrease in NPV with a −30% variation). In contrast, the UASB system shows greater financial sensitivity, being most affected by changes in the discount rate (a 53.80% increase in NPV when the rate is reduced by 30%). The analysis confirms consistent economies of scale: increasing the influent flow rate not only raises biomethane production but also systematically reduces LCOE and the unit cost per m3, thereby improving the overall economic efficiency of the systems.
With respect to the discount rate, the results highlight the weight of the cost of capital in long-term feasibility. We observed an inverse relationship of high magnitude in both systems, reducing the rate to 5.6% (a −30% variation), which increases NPV more aggressively than any other variable assessed. In the UASB system, this sensitivity was particularly pronounced, resulting in a 53.80% increase in NPV. For the Activated Sludge (AS) system, the increase was 44.19%. This indicates that UASB is financially more “elastic”, meaning that its economic attractiveness depends critically on low-interest-rate environments or access to subsidized credit lines. In contrast, the impact on LCOE and cost per m3 remained moderate, ranging from 10% to 11%, suggesting that while investor profitability is highly volatile, energy production costs are relatively resilient to macroeconomic changes.
The sensitivity analysis shows that biogas production from urban effluents is technically feasible but financially sensitive. The main warning for managers and investors lies in the mismatch between the relative stability of production costs (LCOE) and the volatility of profitability (NPV). While unit costs remain competitive under moderate variations, returns on capital may be severely impaired by interest-rate fluctuations or disruptions in treatment scale, with the UASB system being more exposed to financial risks and the Activated Sludge system to operational risks.
The agricultural use of treated sludge has proven viable when legal and environmental criteria are met. Brazilian studies indicate that sludge from anaerobic processes, such as UASB, contains significant concentrations of nitrogen (6–8% dry matter) and phosphorus, which can improve soil structure [3,60]. International research also confirms that anaerobic digestion reduces pathogens and increases nutrient availability, making the sludge comparable to conventional organic fertilizers [35]. Thus, agricultural applications should be seen not only as a disposal alternative but also as an integral part of the circular economy and sustainable agriculture.
The findings of this study corroborate Campello et al. [69], who assessed the economic viability of using biogas generated from WWTPs to produce electricity in Minas Gerais, Brazil. They reported positive NPV and IRR values exceeding 8%, with a payback period of approximately 1.25 years for cities with populations over 250,000. Additionally, Enebe et al. [85,86] emphasized the sustainable generation of biogas and syngas from sewage sludge, indicating that anaerobic digestion and gasification are promising methods for energy production.
Sludge from WWTP can meet soil quality standards after anaerobic digestion, provided it meets the criteria set out in CONAMA Resolution No. 498/2020 [61]. According to this Resolution, digestion must occur for at least 15 days at 35–55 °C or 60 days at 20 °C for Class B biosolids. To reduce vector attractiveness, VS must be reduced by at least 38% or alternative criteria in CONAMA Resolution 498/2020 [61] must be met. If a 38% reduction in VS is not achieved, the process can still be accepted if laboratory tests show that the same sludge sample has less than a 17% reduction in VS after an additional 40 days at 30–37 °C [61]. According to Normative Instruction SDA No. 25/2009 [59], organic fertilizers made from sewage sludge are classified as Class D. These products come from sewage treatment and have specific restrictions [59]:
  • − They must be applied using mechanized equipment.
  • − Prohibited in pastures, and for growing vegetables, tubers, roots, flooded crops, or any crops with edible parts touching the soil.
  • − Personal protective equipment (PPE) is required during handling and application.
To register Class D fertilizers, you must provide the raw material source, nutrient and contaminant details, and an environmental operating license for using sewage sludge in agriculture. The label must include usage restrictions and recommendations in accordance with relevant authorities [59].
The application rate of treated sewage sludge as an organic fertilizer should be determined based on the lowest value among the following criteria:
(1)
The amount of nitrogen available in the biosolids relative to the crop’s needs;
(2)
The requirement for correcting soil acidity, particularly for biosolids treated through alkaline processes;
(3)
The maximum annual application rate or accumulated load limits for chemical substances, especially in Class B biosolids;
(4)
The necessary dose of organic matter for rehabilitating degraded areas [61].
These calculations must account for soil characteristics, the crop’s nutritional requirements, and established limits to prevent environmental contamination. They should be carried out by a qualified technical manager and included in the application project [61].
Other factors that also need to be addressed are the efficiency of pathogen removal and the control of heavy metals, to guarantee sanitary safety in the agricultural reuse of sewage treatment byproducts. Comparative studies have shown that UASB systems, although efficient in removing organic load, are limited with respect to microbiological inactivation when operated in isolation. Research indicates that UASB systems reduce thermotolerant coliforms by approximately 1 log, maintaining helminth egg concentrations above 1.0 egg/L, which may make direct reuse in certain crops unfeasible without subsequent disinfection steps [86,87]. In contrast, systems that use aerobic processes or combined configurations show superior performance, achieving pathogen removals on the order of 3 logs [86].
Regarding heavy metals, the literature highlights that elements like Cd, Pb, Cr, and Ni are of critical concern, because they are non-biodegradable and persistent in the soil. Compliance with international standards, like the European Directive 86/278/EEC, establishes strict limits (e.g., Cd: 20–40 mg/kg; Pb: 750–1200 mg/kg), serving as a basis for monitoring the quality of biosolids [88]. The controlled application of stabilized sludge not only reduces the environmental impact of landfill disposal but also promotes the circular economy by recycling essential nutrients, provided that the treatment ensures the effective reduction in these contaminants and pathogens to levels safe for human and animal consumption.
The integration of sewage treatment and agriculture promotes resource recycling, reduces environmental risks, and supports sustainable agricultural practices. These findings acquire particular significance when considered in the context of Ribeirão Preto. With a GDP per capita of R$55,484.91 (2021) and a Human Development Index of 0.800 (2010) [46], the city demonstrates strong socioeconomic indicators. Its economy is deeply rooted in agribusiness and biofuel production, sectors that already integrate biotechnology, clean energy, and advanced materials [45,46,47]. The presence of five development hubs, particularly in biofuels, agritech, and technology, underscores the region’s readiness to adopt and expand renewable energy initiatives, such as biogas recovery from wastewater [45,46,47]. Therefore, integrating sewage treatment with energy and agricultural applications not only addresses environmental and sanitation challenges but also aligns with the region’s broader economic and technological development strategy.


5. Conclusions

The transition toward a sustainable sanitation model in Ribeirão Preto (SP) is not only technically feasible but also strategically imperative given projected population growth to 833,982 inhabitants over the next 20 years. This study confirms that energy recovery from urban effluent has significant potential to diversify the local energy mix, with the UASB system demonstrating technical and energetic superiority (generation of up to 1839.69 MWh/year) compared to the activated sludge system (1654.27 MWh/year), benefiting from the region’s tropical climatic conditions.
From an economic perspective, the robustness of the projects was supported by strong financial indicators, including a positive NPV, an IRR of up to 16.83%, and a payback period of approximately one year. The levelized cost of energy (LCOE) proved highly competitive relative to conventional Brazilian thermal sources; however, the unit cost analysis of biogas suggests that maximum project viability is achieved through on-site use, thereby mitigating logistics and upgrading/purification costs that could otherwise compress margins for external commercialization.
Finally, integrating wastewater treatment with agriculture through the use of biosolids closes the loop of the circular economy. It aligns the sanitation sector with Ribeirão Preto’s economic profile as a hub for agrotechnology and biofuels. Thus, adopting these technologies goes beyond addressing basic sanitation challenges, positioning the municipality at the forefront of urban sustainability and energy security.

Author Contributions

Conceptualization, R.M.B.; methodology, R.M.B., I.F.S.d.S. and G.L.T.F.; software, R.M.B., I.F.S.d.S. and G.L.T.F.; validation, R.M.B., I.F.S.d.S. and G.L.T.F.; formal analysis, A.J.M.d.O.P., and Y.D.d.S.N.; investigation, A.J.M.d.O.P., and Y.D.d.S.N.; resources, R.M.B.; data curation, R.M.B., I.F.S.d.S. and G.L.T.F.; writing—A.J.M.d.O.P. and Y.D.d.S.N.—review and editing, R.M.B., I.F.S.d.S. and G.L.T.F.; visualization, R.M.B., I.F.S.d.S. and G.L.T.F.; supervision, R.M.B., I.F.S.d.S. and G.L.T.F.; project administration, R.M.B.; funding acquisition, R.M.B. All authors have read and agreed to the published version of the manuscript.

Funding

This research was funded by the Brazilian National Council for Scientific and Technological Development (Conselho Nacional de Desenvolvimento Científico e Tecnológico, CNPq; in Portuguese) for the Research Productivity Grant to Prof. Regina Mambeli Barros (PQ1D, Process Number 303036/2021-4). This research was funded by the Minas Gerais State Agency for Research and Development (Fundação de Amparo à Pesquisa do Estado de Minas Gerais, FAPEMIG, in Portuguese) for granting financial support by Project: RED-00090-21, “Theoretical-experimental evaluation of the production and use of green hydrogen in Minas Gerais” and to the National Agency of Petroleum, Natural Gas and Biofuels – PRH for granting a Doctorate scholarship (Finance Code 1) to Aylla Joani M. de O. Pontes.

Institutional Review Board Statement

Not applicable.

Informed Consent Statement

Not applicable.

Data Availability Statement

The authors confirm that the data supporting the findings of this study are available within the article.

Conflicts of Interest

The authors declare that they have no conflicts of interest.

Abbreviations

The following abbreviations are used in this manuscript:
ABNTBrazilian Association of Technical Standards
ANEELNational Electric Energy Agency
ASSActivated Sludge System
BODBiochemical Oxygen Demand
CETESBEnvironmental Company of the State of São Paulo
CISACenter for Information on Health and Alcohol
CODChemical Oxygen Demand
EPEEnergy Research Office
HRTHydraulic Retention Time
IBGEBrazilian Institute of Geography and Statistics
IPCCIntergovernmental Panel on Climate Change
IRRInternal Rate of Return
LCOELevelized Cost of Energy
LCVLower calorific value
NBRBrazilian Standard
NPVNet Present Value
PPEPersonal protective equipment
SNISNational Sanitation Information System
TSSTotal Suspended Solids
UASBUpflow Anaerobic Sludge Blanket
VSSVolatile Suspended Solids
WWTPWastewater Treatment Plant

References

  1. IPCC. Climate Change 2023: Synthesis Report; Contribution of Working Groups I, II and III to the Sixth Assessment Report of the Intergovernmental Panel on Climate Change; Core Writing Team, Lee, H., Romero, J., Eds.; IPCC: Geneva, Switzerland, 2023; pp. 35–115. [Google Scholar] [CrossRef] [Scilit]
  2. Chernicharo, C.A.L. Reatores Anaeróbios: Princípios do Tratamento Biológico de Águas Residuárias; Série Princípios do Tratamento Biológico de Águas Residuárias; DESA/UFMG: Belo Horizonte, Brasil, 2001; Volume 4. [Google Scholar]
  3. Von Sperling, M. Introdução à Qualidade das Águas e ao Tratamento de Esgotos, 3rd ed.; Departamento de Engenharia Sanitária e Ambiental, UFMG: Belo Horizonte, Brasil, 2005. [Google Scholar]
  4. Nuvolari, A. Estações de Tratamento de Esgotos: Aspectos Técnicos e Econômicos; CETESB: São Paulo, Brasil, 2003. [Google Scholar]
  5. Presidência da República. Lei nº 11.445, de 5 de janeiro de 2007. Estabelece diretrizes nacionais para o saneamento básico; cria o Comitê Interministerial de Saneamento Básico; altera as Leis nos 6.766, de 19 de dezembro de 1979, 8.666, de 21 de junho de 1993, e 8.987, de 13 de fevereiro de 1995; e revoga a Lei nº 6.528, de 11 de maio de 1978. In Diário Oficial da União; Presidência da República: Brasília, Brazil, 2007; de 8.1.2007 e retificado em 11.1.2007. Available online: https://www.planalto.gov.br/ccivil_03/_Ato2007-2010/2007/Lei/L11445.htm (accessed on 11 August 2025).
  6. Presidência da República. Lei nº 14.026, de 15 de julho de 2020. Atualiza o marco legal do saneamento básico e altera a Lei nº 9.984, de 17 de julho de 2000, para atribuir à Agência Nacional de Águas e Saneamento Básico (ANA) competência para editar normas de referência sobre o serviço de saneamento, a Lei nº 10.768, de 19 de novembro de 2003, para alterar o nome e as atribuições do cargo de Especialista em Recursos Hídricos, a Lei nº 11.107, de 6 de abril de 2005, para vedar a prestação por contrato de programa dos serviços públicos de que trata o art. 175 da Constituição Federal, a Lei nº 11.445, de 5 de janeiro de 2007, para aprimorar as condições estruturais do saneamento básico no País, a Lei nº 12.305, de 2 de agosto de 2010, para tratar dos prazos para a disposição final ambientalmente adequada dos rejeitos, a Lei nº 13.089, de 12 de janeiro de 2015 (Estatuto da Metrópole), para estender seu âmbito de aplicação às microrregiões, e a Lei nº 13.529, de 4 de dezembro de 2017, para autorizar a União a participar de fundo com a finalidade exclusiva de financiar serviços técnicos especializados. In Diário Oficial da União; Presidência da República: Brasília, Brazil, 2020; de 16.7.2020. Available online: https://www.planalto.gov.br/ccivil_03/_ato2019-2022/2020/lei/l14026.htm (accessed on 11 August 2025).
  7. Sistema Nacional de Informações Sobre Saneamento (SNIS). Diagnóstico dos Serviços de Água e Esgoto–Ano Base 2023; SNIS: Brasilia, Brazil, 2025. Available online: https://www.gov.br/cidades (accessed on 11 August 2025).
  8. Agência Nacional de Águas e Saneamento Básico. Atlas Esgotos: Despoluição de Bacias Hidrográficas; ANA: Brasília, Brazil, 2025. Available online: https://www.ana.gov.br/atlasesgotos/ (accessed on 11 August 2025).
  9. G1. Marco do Saneamento Faz 5 Anos, Mas Universalização Pode Ficar Só Para 2070. 31/07/2025 17h38. Available online: https://g1.globo.com/pr/parana/especial-publicitario/icities-the-smart-cities-hub/noticia/2025/07/31/marco-do-saneamento-faz-5-anos-mas-universalizacao-pode-ficar-so-para-2070.ghtml (accessed on 11 August 2025).
  10. Empresa de Pesquisa Energética (EPE). Potencial Técnico de Produção de Biogás no Brasil; EPE: Brasilia, Brazil, 2025. Available online: https://www.epe.gov.br/pt/imprensa/noticias/potencial-de-biogas-de-residuos-no-horizonte-decenal (accessed on 11 August 2025).
  11. UNIDO. Projeto GEF Biogás Brasil é Estendido Até Dezembro de 2025; UNIDO: Vienna, Austria, 2025; Available online: https://brasil.un.org/pt-br/289182-unido-dire%C3%A7%C3%A3o-estende-projeto-gef-biog%C3%A1s-brasil-at%C3%A9-dezembro-de-2025 (accessed on 11 August 2025).
  12. Decreto nº 11.003, de 21 de Março de 2022. Institui a Estratégia Federal de Incentivo ao Uso Sustentável de Biogás e Biometano. In Diário Oficial da União; Presidência da República: Brasília, Brazil, 2022. Available online: https://www.planalto.gov.br/ccivil_03/_Ato2019-2022/2022/Decreto/D11003.htm (accessed on 11 August 2025).
  13. Presidência da República. Lei nº 13.576, de 26 de dezembro de 2017. Institui a Política Nacional de Biocombustíveis (RenovaBio). In Diário Oficial da União; Presidência da República: Brasília, Brazil, 2017. Available online: https://www.planalto.gov.br/ccivil_03/_Ato2015-2018/2017/Lei/L13576.htm (accessed on 11 August 2025).
  14. United Nations. Paris Agreement under the United Nations Framework Convention on Climate Change. In Proceedings of the Conference of the Parties, 21st Session, Paris, France, 30 November–13 December 2015; Available online: https://treaties.un.org/doc/Treaties/2016/02/20160215%2006-03%20PM/Ch_XXVII-7-d.pdf (accessed on 11 August 2025).
  15. Presidência da República. Decreto nº 9.073, de 5 de junho de 2017. Promulga o Acordo de Paris sob a Convenção-Quadro das Nações Unidas sobre Mudança do Clima, celebrado em Paris, em 12 de dezembro de 2015, e firmado em Nova Iorque, em 22 de abril de 2016. In Diário Oficial da União; Presidência da República: Brasília, Brazil, 2017. Available online: https://www.planalto.gov.br/ccivil_03/_Ato2015-2018/2017/Decreto/D9073.htm (accessed on 11 August 2025).
  16. Agência Nacional do Petróleo, Gás Natural e Biocombustíveis (ANP). RenovaBio; ANP: Brasilia, Brazil, 2025. Available online: https://www.gov.br/anp/pt-br/assuntos/renovabio (accessed on 11 August 2025).
  17. Ministério de Minas e Energia—MME. RenovaBio e a Regulamentação Dos CBIOs; MME: Brasilia, Brazil, 2025. Available online: https://www.gov.br/mme/pt-br/assuntos/secretarias/petroleo-gas-natural-e-biocombustiveis/renovabio-1 (accessed on 11 August 2025).
  18. Hao, X.; Liu, R.; Huang, X. Evaluation of the potential for operating carbon neutral WWTPs in China. Water Res. 2015, 87, 424–431. [Google Scholar] [CrossRef] [Scilit]
  19. Christoforidou, P.; Bariamis, G.; Iosifidou, M.; Nikolaidou, E.; Samaras, P. Energy Benchmarking and Optimization of Wastewater Treatment Plants in Greece. Environ. Sci. Proc. 2020, 2, 36. [Google Scholar] [CrossRef] [Scilit]
  20. Mattioli, A.; Gatti, G.B.; Mattuzzi, G.P.; Cecchi, F.; Bolzonella, D. Co-digestion of the organic fraction of municipal solid waste and sludge improves the energy balance of wastewater treatment plants: Rovereto case study. Renew. Energy 2017, 113, 980–988. [Google Scholar] [CrossRef] [Scilit]
  21. World Biogas Association. Market Report Brazil 2025; WBA: London, UK, 2025; Available online: https://www.worldbiogasassociation.org (accessed on 11 August 2025).
  22. PROBIOGÁS. Guia Técnico de Aproveitamento Energético de Biogás em Estações de Tratamento de Esgoto (Tecnhical Guide of Biogas Energy Recovery in Sewage Treatment Plants), 2nd ed.; Ministério das Cidades: Brasilia, Brazil, 2017. [Google Scholar]
  23. Basrawi, M.; Yamada, F.B.T.; Nakanishi, K.; Katsumata, H. Analysis of the performances of biogas-fuelled micro gas turbine cogeneration systems (MGT-CGSs) in middle- and small-scale sewage treatment plants: Comparison of performances and optimization of MGTs with various electrical power outputs. Energy 2012, 38, 291–304. [Google Scholar] [CrossRef] [Scilit]
  24. Morsink-Georgali, P.-Z.; Kylili, A.; Fokaides, P.A.; Papadopoulos, A.M. Compost versus biogas treatment of sewage sludge dilemma assessment using life cycle analysis. J. Clean. Prod. 2022, 350, 131490. [Google Scholar] [CrossRef] [Scilit]
  25. Di Costanzo, N.; Di Capua, F.; Cesaro, A.; Carraturo, F.; Salamone, M.; Guida, M.; Esposito, G.; Giordano, A. Headspace micro-oxygenation as a strategy for efficient biogas desulfurization and biomethane generation in a centralized sewage sludge digestion plant. Biomass Bioenergy 2024, 183, 107151. [Google Scholar] [CrossRef] [Scilit]
  26. Di Costanzo, N.; Cesaro, A.; Di Capua, F.; Esposito, G. Exploiting the Nutrient Potential of Anaerobically Digested Sewage Sludge: A Review. Energies 2021, 14, 8149. [Google Scholar] [CrossRef] [Scilit]
  27. Kothari, R.; Tyagi, V.V.; Pathak, A. Waste-to-energy: A way from renewable energy sources to sustainable development. Renew. Sustain. Energy Rev. 2010, 14, 3164–3170. [Google Scholar] [CrossRef] [Scilit]
  28. Miranzadeh, M.B.; Jafarsalehi, M.; Akram, J.; Ebrahimi, M.; Mazaheri, A.; Mashayekh, M. Boosting biogas production in the wastewater treatment plants: A narrative review on co-digestion of sewage sludge with internal and external organic waste. Bioresour. Technol. Rep. 2024, 26, 101856. [Google Scholar] [CrossRef] [Scilit]
  29. Chrispim, M.C.; Scholz, M.; Nolasco, M.A. Biogas recovery for sustainable cities: A critical review of enhancement techniques and key local conditions for implementation. Sustain. Cities Soc. 2021, 72, 103033. [Google Scholar] [CrossRef] [Scilit]
  30. Chrispim, M.C.; Scholz, M.; Nolasco, M.A. A framework for resource recovery from wastewater treatment plants in megacities of developing countries. Environ. Res. 2020, 188, 109745. [Google Scholar] [CrossRef] [Scilit]
  31. Sarvajayakesavalu, S.; Lu, Y.; Withers, P.J.A.; Pavinato, P.S.; Pan, G.; Chareonsudjai, P. Phosphorus recovery: A need for an integrated approach. Ecosyst. Health Sustain. 2018, 4, 48–57. [Google Scholar] [CrossRef] [Scilit]
  32. McCarty, P.L.; Bae, J.; Kim, J. Domestic Wastewater Treatment as a Net Energy Producer–Can This be Achieved? Environ. Sci. Technol. 2011, 45, 7100–7106. [Google Scholar] [CrossRef] [Scilit]
  33. Chojnacka, K.; Skrzypczak, D.; Szopa, D.; Izydorczyk, G.; Moustakas, K.; Witek-Krowiak, A. Management of biological sewage sludge: Fertilizer nitrogen recovery as the solution to fertilizer crisis. J. Environ. Manag. 2023, 326, 116602. [Google Scholar] [CrossRef] [Scilit]
  34. Scaglia, B.; Tambone, F.; Corno, L.; Orzi, V.; Lazzarini, Y.; Garuti, G.; Adani, F. Potential agronomic and environmental properties of thermophilic anaerobically digested municipal sewage sludge measured by an unsupervised and a supervised chemometric approach. Sci. Total Environ. 2018, 637–638, 791–802. [Google Scholar] [CrossRef] [Scilit] [PubMed]
  35. Smith, S.R.; Lang, N.L.; Cheung, K.H.M.; Spanoudaki, K. Factors controlling pathogen destruction during anaerobic digestion of biowastes. Waste Manag. 2005, 25, 417–425. [Google Scholar] [CrossRef] [Scilit] [PubMed]
  36. Orzi, V.; Scaglia, B.; Lonati, S.; Riva, C.; Boccasile, G.; Alborali, G.L.; Adani, F. The role of biological processes in reducing both odor impact and pathogen content during mesophilic anaerobic digestion. Sci. Total Environ. 2015, 526, 116–126. [Google Scholar] [CrossRef] [Scilit]
  37. Rasi, S.; Rintala, A.; Veijanen, J. Trace compounds of biogas from different biogas production plants. Energy 2007, 32, 1375–1380. [Google Scholar] [CrossRef] [Scilit]
  38. Bin Khawer, M.U.; Naqvi, S.R.; Ali, I.; Arshad, M.; Juchelková, D.; Anjum, M.W.; Naqvi, M. Anaerobic digestion of sewage sludge for biogas & biohydrogen production: State-of-the-art trends and prospects. Fuel 2022, 329, 125416. [Google Scholar] [CrossRef] [Scilit]
  39. Starr, K.; Gabarrell, X.; Villalba, G.; Talens, L.; Lombardi, L. Life cycle assessment of biogas upgrading technologies. Waste Manag. 2012, 32, 991–999. [Google Scholar] [CrossRef] [Scilit]
  40. Rosa, A.P.; Chernicharo, C.A.L.; Lobato, L.C.S.; Silva, R.V.; Padilha, R.F.; Borges, J.M. Assessing the potential of renewable energy sources (biogas and sludge) in a full-scale UASB-based treatment plant. Renew. Energy 2018, 124, 21–26. [Google Scholar] [CrossRef] [Scilit]
  41. Venkatesh, G.; Elmi, R.A. Economic–environmental analysis of handling biogas from sewage sludge digesters in WWTPs (wastewater treatment plants) for energy recovery: Case study of Bekkelaget WWTP in Oslo (Norway). Energy 2013, 58, 220–235. [Google Scholar] [CrossRef] [Scilit]
  42. Copasa. Sustainable ETE–Biogas Use at the Arrudas ETE; Copasa Institutional: Belo Horizonte, Brazil, 2018; Available online: https://www.copasa.com.br/wps/portal/internet/esgotamento-sanitario/valorizacao-do-esgoto/conteudos/ete-sustentavel/!ut/p/z0/rVBLb8IwDP4tO_RoJSDtdeyQtkFhIC4ruUxeGphZG5ckRRO_fgZpTEJ7HSblEH-2v4eVUaUyHre0wkTssZZ6YS6exrrI74tCj6bz4a3Oi_n0bjq8mT8MtBop8_OAMPTDZDBZKdNiegHyS1blFmsOtEOLDBWDiytOAlv2yXUVR1W65CB2MTmfcOvqX4Qml98IeU5kCYWwrdGLmIOAdh-uEWYZcM0J0IXOoieEZ25g7cQDWAziiSPoK-hp6OvetSoDV7QjBo9Qs8WaKhRyeZ97UhxXm86LkZYOFo4a_XPQvb11Wm82JlfmcIG3pMpIcgDLLUaE41kyTfIL3qVMty4sqRakaYPzETP9kVV6X2XN9EnWTP8ta6b_MWv7ahaz5jGfjfOzd4CAKG8!/?uri=nm%3Aoid%3AZ6_L0KAHKK0JORIF0AKROGOIBRNC0 (accessed on 11 August 2025).
  43. Menezes, E. Inauguration of the Arrudas ETE Thermoelectric Plant; O Tempo: Belo Horizonte, Brazil, 2012; Available online: https://www.otempo.com.br/cidades/governo-e-copasa-inauguram-termoeletrica-que-reaproveita-gases-poluentes-para-gerar-energia-1.394202 (accessed on 11 August 2025).
  44. Minas Gerais. SUPRAM (Superintendência Regional de Meio Ambiente). Renewal of the Arrudas ETE Operating License; Technical Report; 2022; p. 52. Available online: https://sistemas.meioambiente.mg.gov.br/licenciamento/uploads/maTh8ftxGIE2vVWVkCxIkm-3StzXJfqe.pdf (accessed on 11 August 2025).
  45. Brazilian Institute of Geography and Statistics. 2022 Population Census: Results; IBGE: Rio de Janeiro, Brazil, 2022. Available online: https://www.ibge.gov.br (accessed on 7 July 2025).
  46. Brazilian Institute of Geography and Statistics. 2021 Continuous Cartographic Bases of Brazil: Political Map of Brazil 2500k and 5M. Available online: https://www.ibge.gov.br/apps/basescartograficas/#/home (accessed on 12 August 2025).
  47. Brazilian Institute of Geography and Statistics. Cities and States: Ribeirão Preto-SP. Available online: https://www.ibge.gov.br/cidades-e-estados/sp/ribeirao-preto.html (accessed on 12 August 2025).
  48. Ayhan, H.O. Population Projection and Adjustment Methodologies for Household Sample Surveys: An Overview of Methodology; Iris Publishers: San Francisco, CA, USA, 2018; Available online: https://irispublishers.com/abba/fulltext/population-projection-and-adjustment-methodologies-for-household-sample-surveys-an-overview-of-methodology.ID.000503.php (accessed on 7 August 2025).
  49. Vanella, P.; Deschermeier, P.; Wilke, C.B. An overview of population projections—Methodological concepts, international data availability, and use cases. Forecasting 2020, 2, 346–363. [Google Scholar] [CrossRef] [Scilit]
  50. Pelagalli, C.; Faccio, S.; Casari, P. Mathematical modeling and simulation of logistic growth. Appl. Sci. 2025, 15, 4409. [Google Scholar] [CrossRef] [Scilit]
  51. Marchetti, C.; Meyer, P.S.; Ausubel, J.H. Human population dynamics revisited with the logistic model: How much can be modeled and predicted? Technol. Forecast. Soc. Change 1996, 53, 1–30. Available online: https://phe.rockefeller.edu/publication/poppies/ (accessed on 11 August 2025). [CrossRef] [Scilit]
  52. Qasin, S.R. Wastewater Treatment Plants–Planninng Design and Operation, 2nd ed.; Technomic Publishing Company: Lancaster, PA, USA, 1999; p. 1107. [Google Scholar]
  53. Ministry of Cities. National Secretariat for Environmental Sanitation. National Sanitation Information System–SNIS. In Water and Wastewater Services Diagnosis—2022; SNSA: Brasília, Brazil, 2023. Available online: https://www.gov.br/cidades/pt-br/acesso-a-informacao/acoes-e-programas/saneamento/snis/produtos-do-snis/painel-de-informacoes (accessed on 7 July 2025).
  54. NBR 9649:1986; Design of Domestic Wastewater Treatment Plants. Brazilian Association of Technical Standards: Rio de Janeiro, Brazil, 1986.
  55. Center for Information on Health and Alcohol. First National Survey on Alcohol Consumption Patterns in the Brazilian Population; CISA: São Paulo, Brazil, 2007; Available online: https://cisa.org.br/ (accessed on 7 July 2025).
  56. von Sperling, M.M. Basic Principles of Wastewater Treatment; IWA Publishing: London, UK, 2002. [Google Scholar]
  57. Hamedani, S.R.; Villarini, M.; Colantoni, A.; Carlini, M.; Cecchini, M.; Santoro, F.; Pantaleo, A. Environmental and Economic Analysis of an Anaerobic Co-Digestion Power Plant Integrated with a Compost Plant. Energies 2020, 13, 2724. [Google Scholar] [CrossRef] [Scilit]
  58. Grasham, O.; Dupont, V.; Cockerill, T.; Camargo-Valero, M.A.; Twigg, M.V. Hydrogen via reforming aqueous ammonia and biomethane co-products of wastewater treatment: Environmental and economic sustainability. Sustain. Energy Fuels 2020, 4, 5835–5850. [Google Scholar] [CrossRef] [Scilit]
  59. Ministério da Agricultura, Pecuária e Abastecimento—MAPA. Instrução Normativa SDA nº 25, de 23 de julho de 2009. In Diário Oficial da União, Seção 1, nº 173; Presidência da República: Brasília, Brazil, 2009. Available online: https://www.gov.br/agricultura/pt-br/assuntos/insumos-agropecuarios/insumos-agricolas/fertilizantes/legislacao/in-25-de-23-7-2009-fertilizantes-organicos.pdf/view (accessed on 7 July 2025).
  60. Jordão, E.P.; Pessoa, C.A. Tratamento de Esgotos Domésticos, 8th ed.; ABES: Rio de Janeiro, Brazil, 2017. [Google Scholar]
  61. CONAMA. Resolução nº 498, de 19 de agosto de 2020. Define critérios e procedimentos para produção e aplicação de biossólido em solos, e dá outras providências. In Diário Oficial da União, n° 161, de 21/08/20, Seção 01; CONAMA: Madrid, Brazil, 2020; pp. 265–269. Available online: https://conama.mma.gov.br/?option=com_sisconama&task=arquivo.download&id=797 (accessed on 7 July 2025).
  62. Barros, R.M.; Filho, G.L.T.; da Silva, T.R. The electric energy potential of landfill biogas in Brazil. Energy Policy 2014, 65, 150–164. [Google Scholar] [CrossRef] [Scilit]
  63. The Environmental Company of São Paulo-CETESB. Biogas: Generation and Energy Use (Biogás Geração e Uso Energético: Aterros); v. 1.0; The Brazilian Ministry of Science and Technology-The Environmental Sanitation Technology Company (Companhia de Tecnologia de Saneamento Ambiental); CETESB-MCT-SMA: São Paulo, Brazil, 2006. Available online: http://www.cetesb.sp.gov.br/mudancasclimaticas/biogas/Softwares/16Softwares (accessed on 3 December 2012).
  64. Bruck, M.; Sandborn, P.; Goudarzi, N. A Levelized Cost of Energy (LCOE) model for wind farms that include Power Purchase Agreements (PPAs). Renew. Energy 2018, 122, 131–139. [Google Scholar] [CrossRef] [Scilit]
  65. Energy Research Office. Cost Parameters Notebook–PDE 2031; EPE: Brasília, Brazil, 2022. Available online: https://www.epe.gov.br/sites-pt/publicacoes-dados-abertos/publicacoes/PublicacoesArquivos/publicacao-607/topico-591/Caderno%20de%20Par%C3%A2metros%20de%20Custos%20-%20PDE2031.pdf (accessed on 7 July 2025).
  66. dos Santos, I.F.S.; Barros, R.M.; Filho, G.L.T. Electricity generation from biogas of anaerobic wastewater treatment plants in Brazil: An assessment of feasibility and potential. J. Clean. Prod. 2016, 126, 504–514. [Google Scholar] [CrossRef] [Scilit]
  67. dos Santos, I.F.S.; Vieira, N.D.B.; Barros, R.M.; Filho, G.L.T.; Soares, D.M.; Alves, L.V. Economic and CO2 avoided emissions analysis of WWTP biogas recovery and its use in a small power plant in Brazil. Sustain. Energy Technol. Assess. 2016, 17, 77–84. [Google Scholar] [CrossRef] [Scilit]
  68. Freitas, F.F.; Coelho, U.R.; Silva, S.T.S.; Gomes, A.A.L.; Barros, R.M.; Filho, G.L.T.; Lora, E.E.S.; dos Santos, I.F.S. Study of the Potential for Energy Use of Biogas from a Wastewater Treatment Plant to a Medium-Sized City: A Technical, Economic, and Environmental Analysis. Waste Biomass Valorization 2022, 13, 3509–3521. [Google Scholar] [CrossRef] [Scilit]
  69. Campello, L.D.; Barros, R.M.; Filho, G.L.T.; dos Santos, I.F.S. Analysis of the economic viability of the use of biogas produced in wastewater treatment plants to generate electrical energy. Environ. Dev. Sustain. 2021, 23, 2614–2629. [Google Scholar] [CrossRef] [Scilit]
  70. Canal Energia. A-5 Auction Prices Range from BRL 194.96/MWh to over BRL 600/MWh. 2022. Available online: https://www.canalenergia.com.br/noticias/53221995/precos-do-a-5-variam-de-r-19496mwh-a-mais-r-600mwh (accessed on 7 July 2025).
  71. Central Bank of Brazil-BCB. Currency Converter. Available online: https://www.bcb.gov.br/conversao (accessed on 16 July 2025).
  72. Silva, S.T.S.; Barros, R.M.; dos Santos, I.F.S.; Crispim, A.M.d.C.; Filho, G.L.T.; Lora, E.E.S. Technical and economic evaluation of using biomethane from sanitary landfills for supplying vehicles in the Southeastern region of Brazil. Renew. Energy 2022, 196, 1142–1157. [Google Scholar] [CrossRef] [Scilit]
  73. United States Environmental Protection Agency (EPA). LMOP Landfill Gas Energy Cost Model (LFGcost-Web): User’s Manual; (Version 3.6); U.S. Environmental Protection Agency: Washington, DC, USA, 2023. Available online: https://www.epa.gov/system/files/documents/2023-09/lfgcost_web_v3.6_usersmanual_sep2023.pdf (accessed on 21 January 2026).
  74. dos Santos, R.E.; dos Santos, I.F.S.; Barros, R.M.; Bernal, A.P.; Filho, G.L.T.; Silva, F.d.G.B.d. Generating electrical energy through urban solid waste in Brazil: An economic and energy comparative analysis. J. Environ. Manag. 2019, 231, 198–206. [Google Scholar] [CrossRef] [Scilit]
  75. Crispim, A.M.d.C.; Barros, R.M.; Filho, G.L.T.; dos Santos, I.F.S. An economic study of hydrogen and ammonia generation from the reforming of biogas from co-digestion of municipal solid waste and wastewater sludge in a Brazilian state. Int. J. Hydrogen Energy 2024, 67, 312–326. [Google Scholar] [CrossRef] [Scilit]
  76. INVESTING.COM. Biomethane: The First Price Indicator Is Born. 2024. Available online: https://br.investing.com/analysis/biometano-nasce-o-primeiro-indicador-de-preco-200463206 (accessed on 10 July 2025).
  77. Chernicharo, C.A.L. Anaerobic Reactors: Fundamentals and Applications, 2nd ed.; UFMG: Belo Horizonte, Brazil, 2007. [Google Scholar]
  78. Simão, J.M. Mercado Potencial de Biogás e Biometano Proveniente de Saneamento no Sul de Minas: Aspectos Regulatórios, Técnicos e Econômicos. Licentiate Thesis, Universidade Federal de Itajubá, Itajubá, Brazil, 2025. [Google Scholar]
  79. Gupta, A.S.; Khatiwada, D. Investigating the sustainability of biogas recovery systems in wastewater treatment plants—A circular bioeconomy approach. Renew. Sustain. Energy Rev. 2024, 199, 114447. [Google Scholar] [CrossRef] [Scilit]
  80. Bilotta, P.; Ross, B.Z.L. Estimate of energy generation and greenhouse gas emission avoided from biogas recovery in a wastewater treatment plant. Eng. Sanitária Ambient. 2016, 21, 275–282. [Google Scholar] [CrossRef] [Scilit]
  81. BIOGAS GUIDE. Biogas Guide–Planning, Production and Use. 2021. Available online: https://www.guiadobiogas.com.br/download/P3_Guia_FINAL.pdf (accessed on 10 July 2025).
  82. Bachmann, N. Sustainable biogas production in municipal wastewater treatment plants. In IEA Bioenergy Task 37; IEA: Paris, France, 2015; Available online: https://task37.ieabioenergy.com/wp-content/uploads/sites/32/2022/02/Wastewater_biogas_grey_web-1.pdf (accessed on 8 August 2025).
  83. Lima, D.; Appleby, G.; Li, L. A Scoping Review of Options for Increasing Biogas Production from Sewage Sludge: Challenges and Opportunities for Enhancing Energy Self-Sufficiency in Wastewater Treatment Plants. Energies 2023, 16, 2369. [Google Scholar] [CrossRef] [Scilit]
  84. European Biogas Association. The Role of Biogas Production from Industrial Wastewaters in Reaching Climate Neutrality by 2050; European Biogas Association: Brussels, Belgium, 2021; Available online: https://www.europeanbiogas.eu/wp-content/uploads/2025/06/Paper-The-role-of-biogas-production-from-wastewater-in-reaching-climate-neutrality-by-2050.pdf (accessed on 8 August 2025).
  85. Enebe, N.L.; Chigor, C.B.; Obileke, K.; Lawal, M.S.; Enebe, M.C. Biogas and syngas production from sewage sludge: A sustainable source of energy generation. Methane 2023, 2, 192–217. [Google Scholar] [CrossRef] [Scilit]
  86. Rolim, H.O.; Chaves, J.R.; Nunes, A.B.A.; Silva Filho, H.A.; Santos, E.V.M. Qualidade dos efluentes de sistemas de tratamento biológico UASB e UCT para reúso agrícola. Rev. Agro. Amb. 2016, 9, 393–414. [Google Scholar] [CrossRef] [Scilit]
  87. Collivignarelli, M.C.; Abbà, A.; Frattalone, A.R.; Carnevale Miino, M.; Padovani, S.; Katsoyiannis, I.A.; Torretta, V. Legislation for the Reuse of Biosolids on Agricultural Land in Europe: Overview. Sustainability 2019, 11, 6015. [Google Scholar] [CrossRef] [Scilit]
  88. Al-Gheethi, A.A.; Mohamed, R.M.S.R.; Enead, M.A.; Al-Rekabi, W.S.; Al-Sharabee, M.A.S. Removal of pathogenic bacteria from sewage-treated effluent and biosolids for agricultural purposes. Appl. Water Sci. 2018, 8, 74. [Google Scholar] [CrossRef] [Scilit]
Figure 1. The location of Ribeirão Preto within São Paulo state in Brazil. Source: The authors of this study, based on information available in IBGE (2025) [46,47].
Agriengineering 08 00137 g001
Figure 2. Population projections for Ribeirão Preto (2025–2045) using the arithmetic, geometric, and logistic models, based on census data and demographic trends.
Agriengineering 08 00137 g002
Figure 3. Cash flow projections for UASB and activated sludge systems based on biomethane sales, highlighting revenue limitations under current market conditions.
Agriengineering 08 00137 g003
Figure 4. Sensitivity analysis of sewage flow and its impact on biomethane flow, NPV, LCOE, and cost of biomethane production per m3, for the activated sludge system.
Agriengineering 08 00137 g004
Figure 5. Sensitivity analysis of sewage flow and its impact on biomethane flow, NPV, LCOE, and cost of biomethane production per m3, for the UASB system.
Agriengineering 08 00137 g005
Figure 6. Sensitivity analysis of the discount rate and its impact on NPV, LCOE, and cost of biomethane production per m3 for the activated sludge system.
Agriengineering 08 00137 g006
Figure 7. Sensitivity analysis of the discount rate and its impact on NPV, LCOE, and cost of biomethane production per m3, for the UASB system.
Agriengineering 08 00137 g007
Figure 8. Tornado diagram of the sensitivity analysis of sewage flow and its impact on operational and economic indices, a comparison between the UASB system and activated sludge.
Agriengineering 08 00137 g008
Figure 9. Tornado diagram of the sensitivity analysis of the discount rate and its impact on economic indices, and a comparison between the UASB system and the activated sludge system.
Agriengineering 08 00137 g009
Table 1. Design parameters for sizing the activated sludge system, including average flow rates, biochemical oxygen demand (BOD), and suspended solids concentrations.
ParametersValues
Average design flow rate (L/s)1260.6
Average BOD5 at the treatment plant inlet—S (mg/L)383.0
Average BOD5 after passing through the primary decanter—S0 (mg/L)268.1
Efficiency of TSS removal in the primary clarifier (%)—Adopted60
Average BOD5 after passing through the secondary decanter—Se (mg/L)4.0
Average TSS at station inlet (mg/L)3062.0
Sludge production coefficient (kgSS/kgBOD)—Adopted0.7
Concentration of the VSS/SST ratio (Adopted in the aeration tank)0.75
Operating cycle of drying beds (days)7
Table 2. Input values used in the economic feasibility analysis, covering average costs, operation and maintenance, taxes, and energy sales prices. Values considered for the economic viability calculations.
ParametersValuesSource
Average costEquation (12)[73,74]
Average operating and maintenance cost86.14 US$/kW×year[70]
Average charges and taxes39.79 US$/kW×year[70]
Energy selling priceUS$ 108.32[71]
Discount rate8%Adopted as [69]
Table 3. Economic parameters employed for estimating the sales price of biomethane, including investment costs, operating expenses, methane concentration, and the discount rate. Values adopted for projecting the sales price of biomethane.
ParametersValuesSource
Investment in the CH4 production systemEquation (13)
US$ 4,927,758,121.80
[78]
Operating and maintenance costsEquation (14)
203,907,232.63 US$/year
[78]
Biomethane selling price0.497 US$/m3[65]
Discount rate8%Taken as [65,66,67,68,69]
Methane concentration in biogas60%Taken as [65,66,67,68,69]
LCV CH435.5 MJ/m3Taken as [65,66,67,68,69]
Table 4. Estimated domestic, industrial, and total sewage flows in Ribeirão Preto between 2025 and 2045, based on population and consumption projections.
YearSewage Flow (L/s)
Domestic FlowIndustrial FlowInfiltration Flow RateTotal Flow
01043.00.00921.21064.2
51095.60.00922.31117.9
101144.80.0123.31168.1
151190.30.0124.31214.5
201235.50.0125.01260.6
Table 5. Biochemical demand (BOD) loads for domestic and industrial sewage in Ribeirão Preto (2025–2045), expressed in kg/day.
YearAverage BOD Load (kg/day)
DomesticIndustrialTotal
035,202.1626.8135,228.97
536,977.3728.1637,005.54
1038,637.3129.4338,666.74
1540,173.7030.6040,204.30
2041,699.1031.6741,730.77
Table 6. Estimated yields of the UASB reactor with and without primary decantation, including daily production of biogas, methane, and volatile suspended solids (sludge).
YieldsWith Primary DecantationWithout Primary Decantation
Biogas3504.04 m3/d5005.77 m3/d
Methane2277.63 m3/d3253.6 m3/d
Sludge6289.9 kgVSS/d8985.6 kgVSS/d
Table 7. Design parameters for sludge thickeners in the activated sludge system, including the number of units, area, diameter, and solid concentrations.
ParametersValues
Quantity of thickeners122
Total Area9581.9 m2
Area (unit)78.54 m2
Diameter10 m
Total solids concentration at decanter inlet (TSC)3.15 kg/m3
Concentration of solids at the bottom of the decanter (Cu)7.5 kg/m3
Load of solids retained in the primary decanter (PST)210,622.0 kg/day
Disposal flow rate (Qd)2367.3 m3/day
Sludge flow19.9 m3/day
Table 8. Design parameters for anaerobic sludge digesters in the activated sludge system, including total volume, number of units, and useful height for digestion.
ParametersValues
Quantity of anaerobic sludge digestion5
Total Volume130,000 m3
Digester unit volume26,000.0 m3
Height for supernatant accumulation0.6 m
Height for gas accumulation1.5 m
Height for scum accumulation0.6 m
Useful height for active digestion layer (Huseful)7.8 m
Table 9. Economic feasibility results for UASB and activated sludge systems for electricity generation, including investment costs, operating costs, revenue, net present value (NPV), levelized cost of energy (LCOE), and internal rate of return (IRR).
ParametersASS aUASB b
InvestmentUS$ 624,042.59US$ 676,745.80
Project operation and maintenance costUS$ 23,239.12US$ 26,602.38
Cost of project charges and taxesUS$ 9925.04US$ 11,361.43
Revenue179,184.76 US$/year205,117.08 US$/year
Net present value (NPV)US$ 275,836.52US$ 403,055.93
Levelized cost of energy (LCOE)81.29 US$/MWh61.82 US$/MWh
Internal rate of return (IRR)14.69%16.83%
Notes: (a) ASS: Activated sludge system; (b) UASB: Upflow Anaerobic Sludge Blanket.
Table 10. Results of estimating the cost of producing one m3 of biomethane.
ParametersASS aUASB b
Biomethane flow rate (QCH4) (m3/year)482,457.00767,384.76
Investment cost (US$)7,019,322.808,478,673.70
Operating and maintenance costs (US$/year)699,650.22972,261.65
Production cost per m3 of biomethane (US$)0.520.43
Notes: (a) ASS: Activated sludge system; (b) UASB: Upflow Anaerobic Sludge Blanket.
Table 11. Comparative Analysis of Scenarios for Increasing Economic Viability.
Impact VariableCurrent Baseline ScenarioCircular Integration ScenarioTechnical Justification
Main Revenue SourceDirect sale of Biomethane (0.497/m3).Biomethane + Decarbonization Credits (CBIOs).Integration into the RenovaBio program (Law No. 13.576/2017).
Methane Production3253.6 m3/day (UASB without sedimentation).Increased production via Co-digestion.Addition of organic waste from the regional agribusiness of Ribeirão Preto.
Sludge ManagementOperational disposal cost.Commercialization as Biofertilizer.High Nitrogen (6–8%) and Phosphorus content in stabilized sludge.
Economic IndicatorsNPV:
US$ 403.055,93
IRR:16.83%.
High NPV and Reduced Payback.Reduced dependence on the volatility of gas prices.
Energy EfficiencyGeneration of 1839.69 MWh/year.Self-consumption (In situ) + Sale of Surplus.Meeting up to 70–100% of the wastewater treatment plant’s demand (ANEEL Resolution 482/2012).
Disclaimer/Publisher’s Note: The statements, opinions and data contained in all publications are solely those of the individual author(s) and contributor(s) and not of MDPI and/or the editor(s). MDPI and/or the editor(s) disclaim responsibility for any injury to people or property resulting from any ideas, methods, instructions or products referred to in the content.