1. Introduction
Agricultural operations are among the most dangerous labor activities. Accidents frequently happen, resulting in lesions and, in some situations, deaths. Operators of agricultural machines are submitted to physical, chemical and biological agents such as vibrations, noise, dust, smoke, chemical products and microorganisms, among others. From the simplest to the complex mechanized agricultural tasks, during these activities, the operators are exposed to many harmful agents, of which the mechanical vibrations can be highlighted [
1].
Pesticide application technology has been widely studied and improved upon for years. The application of pesticides eliminates and controls insects, invasive plants, and diseases in crops through a minimum dose distributed effectively without causing damage to the environment and human health. The success of phytosanitary treatment in agricultural crops is derived from the quality of the product used, as well as the technology developed for its application [
2,
3,
4,
5,
6].
In parallel with the development of pesticide application processes, sprayers were modernized, became self-propelled, more robust, and obtained operational performances never achieved by mounted and trailed sprayers. The advantages of self-propelled sprayers include operation at higher speeds, a wide application range, a large volume reservoir, and the safety provided by the cabin to the operators [
7].
Ref. [
8] measured the whole-body vibrations (WBV) to which the operator was subjected at different speeds in a tractor-sprayer mechanized set where the sprayer was of the mounted type. According to the [
1] classification of the effect of vibration intensity on operator comfort, the authors concluded that the speed of 4 km h
−1 produced a slightly uncomfortable effect, while speeds of 5 and 7 km h
−1 produced a very uncomfortable effect. The RMS accelerations found in the tractor seat for speeds of 4, 5, and 7 km h
−1 were 0.4925, 0.5050, and 0.5200 m s
−2, respectively.
Exposure to WBV can cause musculoskeletal disorders, as well as pain in the lumbar spine of machine operators. In addition, studies on exposure to WBV indicate that there is a higher incidence of harmful changes in the spines of tractor drivers, truck drivers, forklift operators, and industrial transport drivers [
9].
Ref. [
10] conducted a survey with 1155 operators in which they measured the vibration severity in tractors, evaluated the operators’ posture, and asked them about the presence of low back pain. The results indicated that approximately 80% of the interviewed operators reported that they felt low back pain. Factors such as the intensity, duration, and frequency of exposure to WBV can affect the health of agricultural operators even under normal working conditions [
11,
12].
The tire-soil interaction transmits vibrations through the axles of the tractor to the machine components and elements. Therefore, vibration monitoring can be performed from the axles of the tractor. The damping systems used in agricultural tractor seats are designed based on the vibrations that act on the tractor [
11]. The improvements in machine designs occur through analysis of operations; it is necessary to adapt work conditions to humans by using ergonomic precepts to reduce fatigue and stress and by seeking a safer and more comfortable workplace [
13].
It is important to measure the vibration severity that affects the operator and compare it with the current vibration standards in the context of ergonomics. Several studies have assessed the vibration severity in agricultural tractors and mechanized sets [
8,
11,
14,
15,
16,
17]. However, this type of study has been rarely performed on self-propelled sprayers. Considering that self-propelled sprayers are specific machines used to perform the application of phytosanitary products and also that their operation speed could be higher than other typical operations, it is important to study the vibration severity in the cabin of this kind of machine. In this way, the objective of the present paper is to measure the vibration severity in the front and rear axles of a self-propelled sprayer, as well as on the floor of the operator’s cabin and on the operator’s seat. The vibration transmissibility between these data collection points was also measured. Additionally, the present research was able to verify whether the vibration is in accordance with the current standards.
2. Materials and Methods
The present research was conducted in an experimental area located at coordinates 21°42′ S latitude and 44°26′ W longitude and a mean altitude of 972 m. The climate of the city is of the CWb type according to the Köppen classification. The soil of the area where the experiment was conducted has clayey characteristics with a sandy-clayey tendency. The relief of the experimental area can be characterized as flat. Additionally, the experimental area, during the trials, was conducted using a no-tillage farming system.
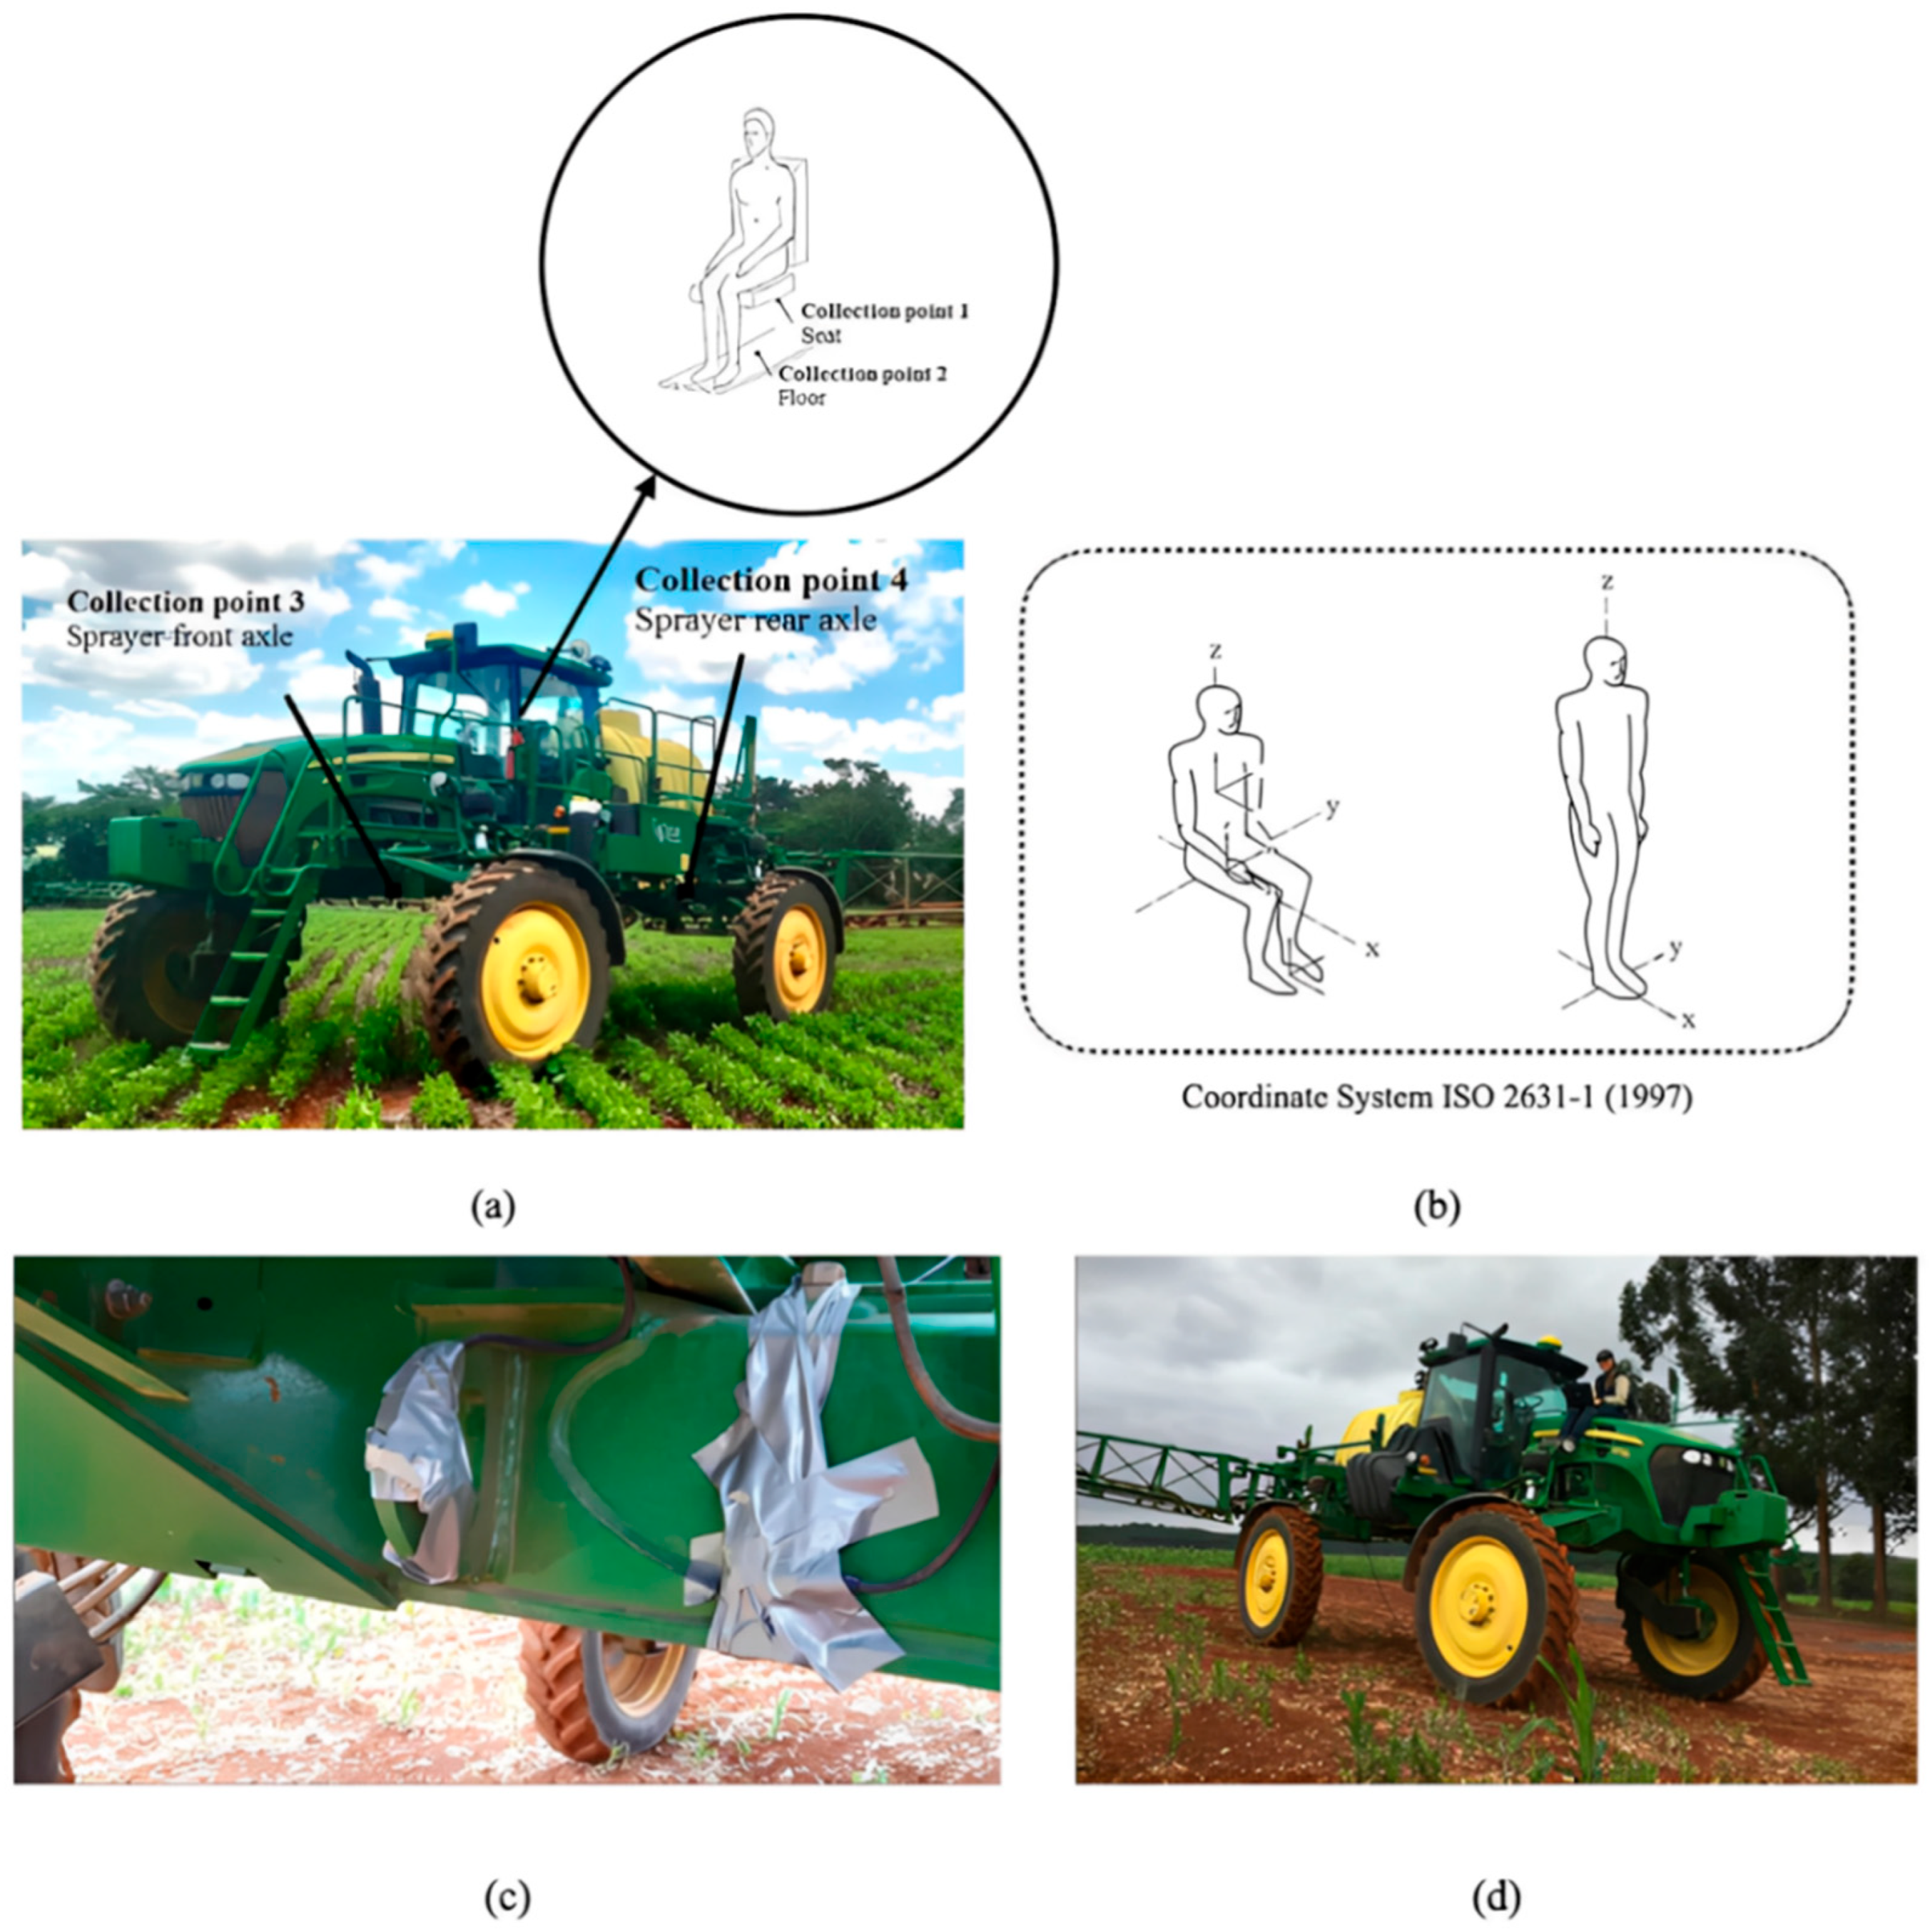
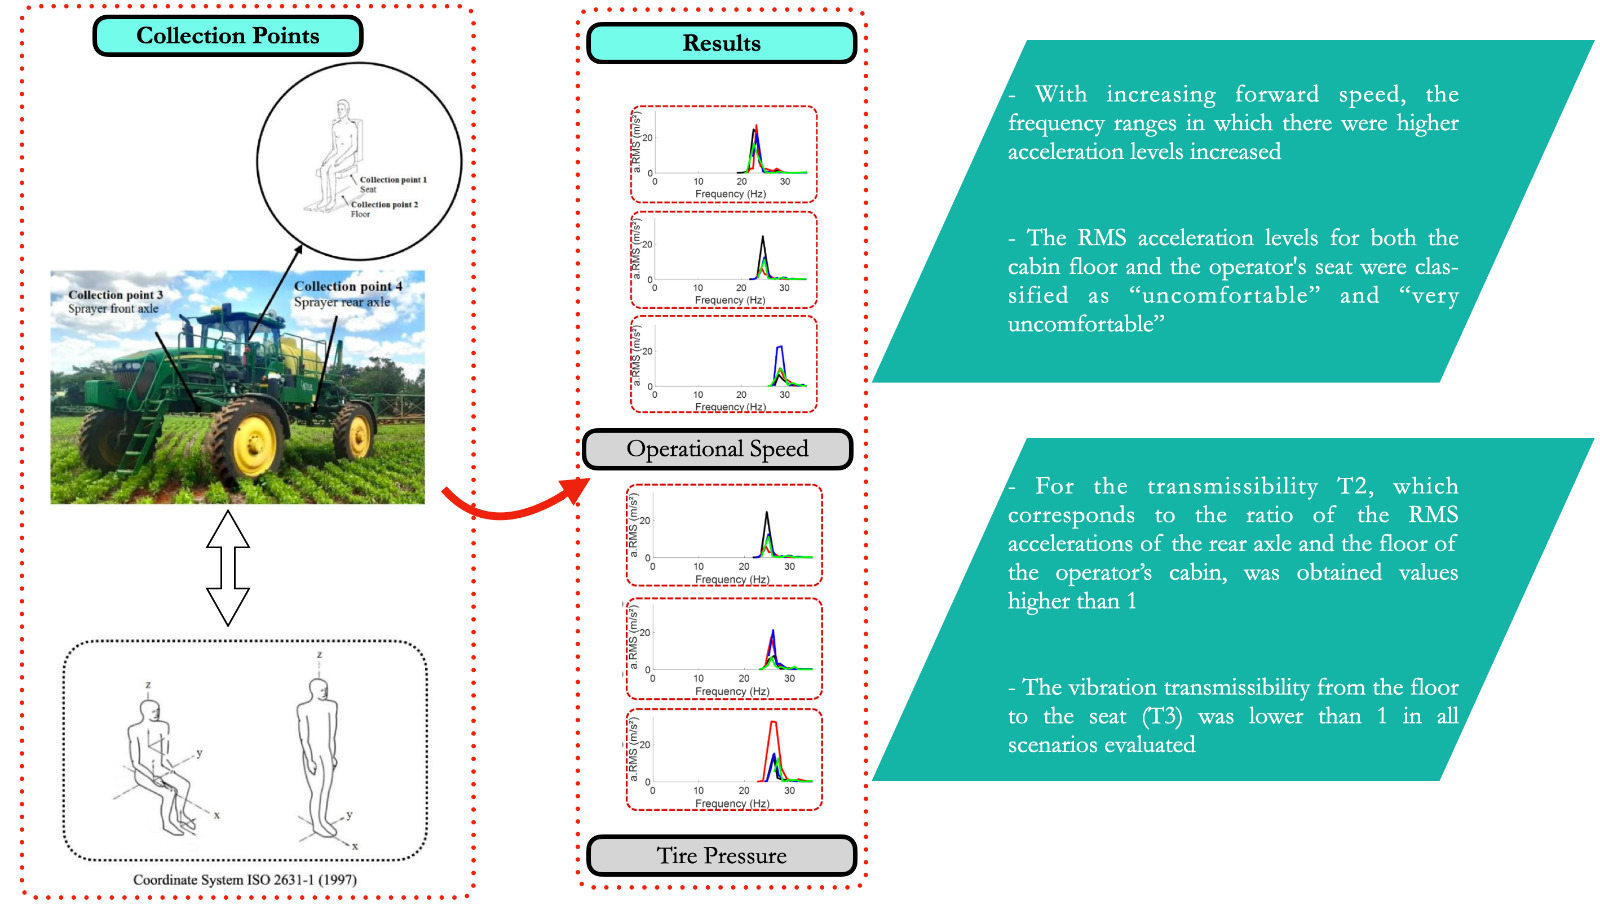
The mechanical vibration monitoring points were near the operator’s seat (point 1), the floor of the operator’s cabin (point 2), the front axle (point 3) and the rear axle (point 4) of a John Deere 4730 self-propelled sprayer, as presented in
Figure 1a. It is important to emphasize that this type of machine presents an independent suspension, composed of air bags, that generates high stability for pulverization bars and also for the operator. The machine presented less than 10 years of use and also presented pre-owned tires in excellent condition. At all monitoring points, X, Y and Z axes were considered (longitudinal, transverse, and vertical, respectively). Uniaxial accelerometers were used; in this way, three (03) accelerometers at each monitoring point were necessary in order to determine the signals in X, Y and Z axes (
Figure 1c). The accelerometers were located according to [
1], which regulates the methods for the evaluation of the WBV.
Figure 1b shows the coordinate system proposed by this standard, which takes the operator’s working position as a reference point.
The data acquisition system was from National Instruments (NI). Three modules with 4 input channels were used, a microcomputer containing LabView software, 2016 version, with the Sound and Vibration package, the necessary cabling to interconnect them, and MATLAB software, R2017b version, for signal processing. The NI 9234 modules have the following specifications: 50 ppm sampling rate accuracy, resolution of 12.5 ns, and frequency measurement range from 0 to 20 MHz. Additionally, the NI 9234 is a 4-channel module with features built in, which includes automatic anti-aliasing filters that adjust it to the selected sample rate. The transducers consisted of 12 high-sensitivity PCB Piezotronics industrial accelerometers, which have a sensitivity of 100 mV/g, a frequency measurement range of 0.5 to 8000 Hz, and a mass of 74 g. The power source used to power the computer and the modules was a battery with a DC to AC transformer.
The Nyquist sampling theorem was considered during the data acquisition process. This theorem proposes that the sampling frequency be at least two times higher than the highest frequency contained in the signal so that the signal is faithfully represented in terms of frequency content, which in mathematical terms is represented by fs ≥ 2fc, which is the sampling frequency, and fc is the highest frequency in the signal [
18]. In occupational health, the WBV can bring risks to health during long exposures. Considering the WBV frequencies are between 0.1 and 80 Hz, during the execution of the experiment, it was decided to use a sampling rate 5 times the highest frequency to be analyzed; therefore, this parameter was 400 Hz.
2.1. Signal Analysis
The objective was to extract the spectral frequencies and vibrations, and the Root Mean Square accelerations (RMS) from the collected data and to use the RMS to obtain the vibration transmissibility of each axle to the floor of the operator’s cabin and that from there to the operator’s seat. The spectra were evaluated in the frequency domain and the RMS values in the time domain.
The signal path started at the sprayer tires, passed through the sprayer components, arrived at the data collection points, and was captured by the accelerometers. The accelerometers transmitted the signal to the modules, which in turn transmitted it to LabView. Until then, the signal was in the time domain; therefore, MATLAB was used to transform it into the frequency domain by using the Fast Fourier Transform (FFT). In MATLAB, a low-pass filter was used, and the amplitude data were smaller than 0.1 m s−2. The signal, therefore, culminated in the frequency spectrum, which showed the characteristic frequencies through the amplitude peaks that characterized the highest concentration of energy at certain points of the spectrum.
The RMS means from the acceleration data, according to Equation (1), because these means include the central tendency of the data and the vibration dispersion.
where:
aRMS is the RMS acceleration in m s−2;
N is the number of acceleration occurrences;
a is the acceleration data in m s−2.
To aim the energy quantification contained in the oscillatory movement and its respective damage potential due to operator exposure, with the calculation of the RMS acceleration. They measured the vibration transmissibility, which is the relation between the RMS acceleration signals of two vibration monitoring points, from the RMS data to establish whether there was a reduction or increase in the vibration severity. The vibration transmissibility was measured between the front axle and floor (T1), rear axle and floor (T2), and floor and the seat (T3), aiming to assess the vibration levels to which an operator would be exposed. The transmissibility values were determined by Equations (2)–(4).
where:
T1, T2 and T3 are the vibration transmissibilities in per cent;
RMSseat is the RMS acceleration in the operator’s seat in m s−2;
RMSfloor is the RMS acceleration in the floor of the operator’s cabin in m s−2;
RMSfront-axle is the RMS acceleration found in the front axle in m s−2;
RMSrear-axle is the RMS acceleration found in the rear axle in m s−2.
According to [
1], the acceleration signal can be summarized as a total value weighted from orthogonal coordinates (Equation (5)).
awx, awy and awz are the effective values of the weighted accelerations relative to the orthogonal axes x, y, and z, respectively, in m s−2;
kx, ky and kz are multiplicative factors;
In [
1], the weighted mean that targets the effects of periodic vibration on the health of seated people exposed to WBV has the following multiplicative factor values: kx = 1.4, ky = 1.4, and kz = 1.
2.2. Variables Evaluated During Field Operations
The variables operating speed and tire inflation pressure are routinely changed, often one as a function of the other, in field operations. The experiment was performed by considering different levels of these factors to reliably characterize the spraying operation.
Since most of the applications performed by the self-propelled sprayer are performed at 11 km h−1, it was considered the speeds of 10, 11, and 12 km h−1, named S1, S2, and S3, respectively. The pressure variations P1, P2, and P3 corresponded to pressures of 48 psi, 50 psi, and 52 psi (330.9 kPa, 344.7 kPa and 358.5 kPa), respectively. The self-propelled sprayer had its own compressor, which was used to change the pressures, along with the pressure gauge. Considering that the operation speed had already stabilized, the distance traveled for the evaluation of the analyzed factors was 50 m, which characterized an experimental unit. The distance traveled by the machine was controlled using the application Strava, version 198.8.
2.3. Statistical Analysis of the Data
The vibration severity and vibration transmissibility were evaluated from an experiment according to a completely randomized design in a 3 × 3 factorial scheme, with 4 replicates. The factors evaluated included pressure (P1, P2 and P3) and speed (S1, S2 and S3). The data was subjected to the Shapiro-Wilk normality test and analysis of variance, with significance defined at the 5% level of probability. From the analysis of variance, there are double interactions between the factors studied. The means of the quantitative factors were studied by regression analysis, in which the models were determined according to their coefficient of determination (R2), the significance of the coefficients and analysis of the lack of fit. The statistical analyses were performed in the software R.
3. Results
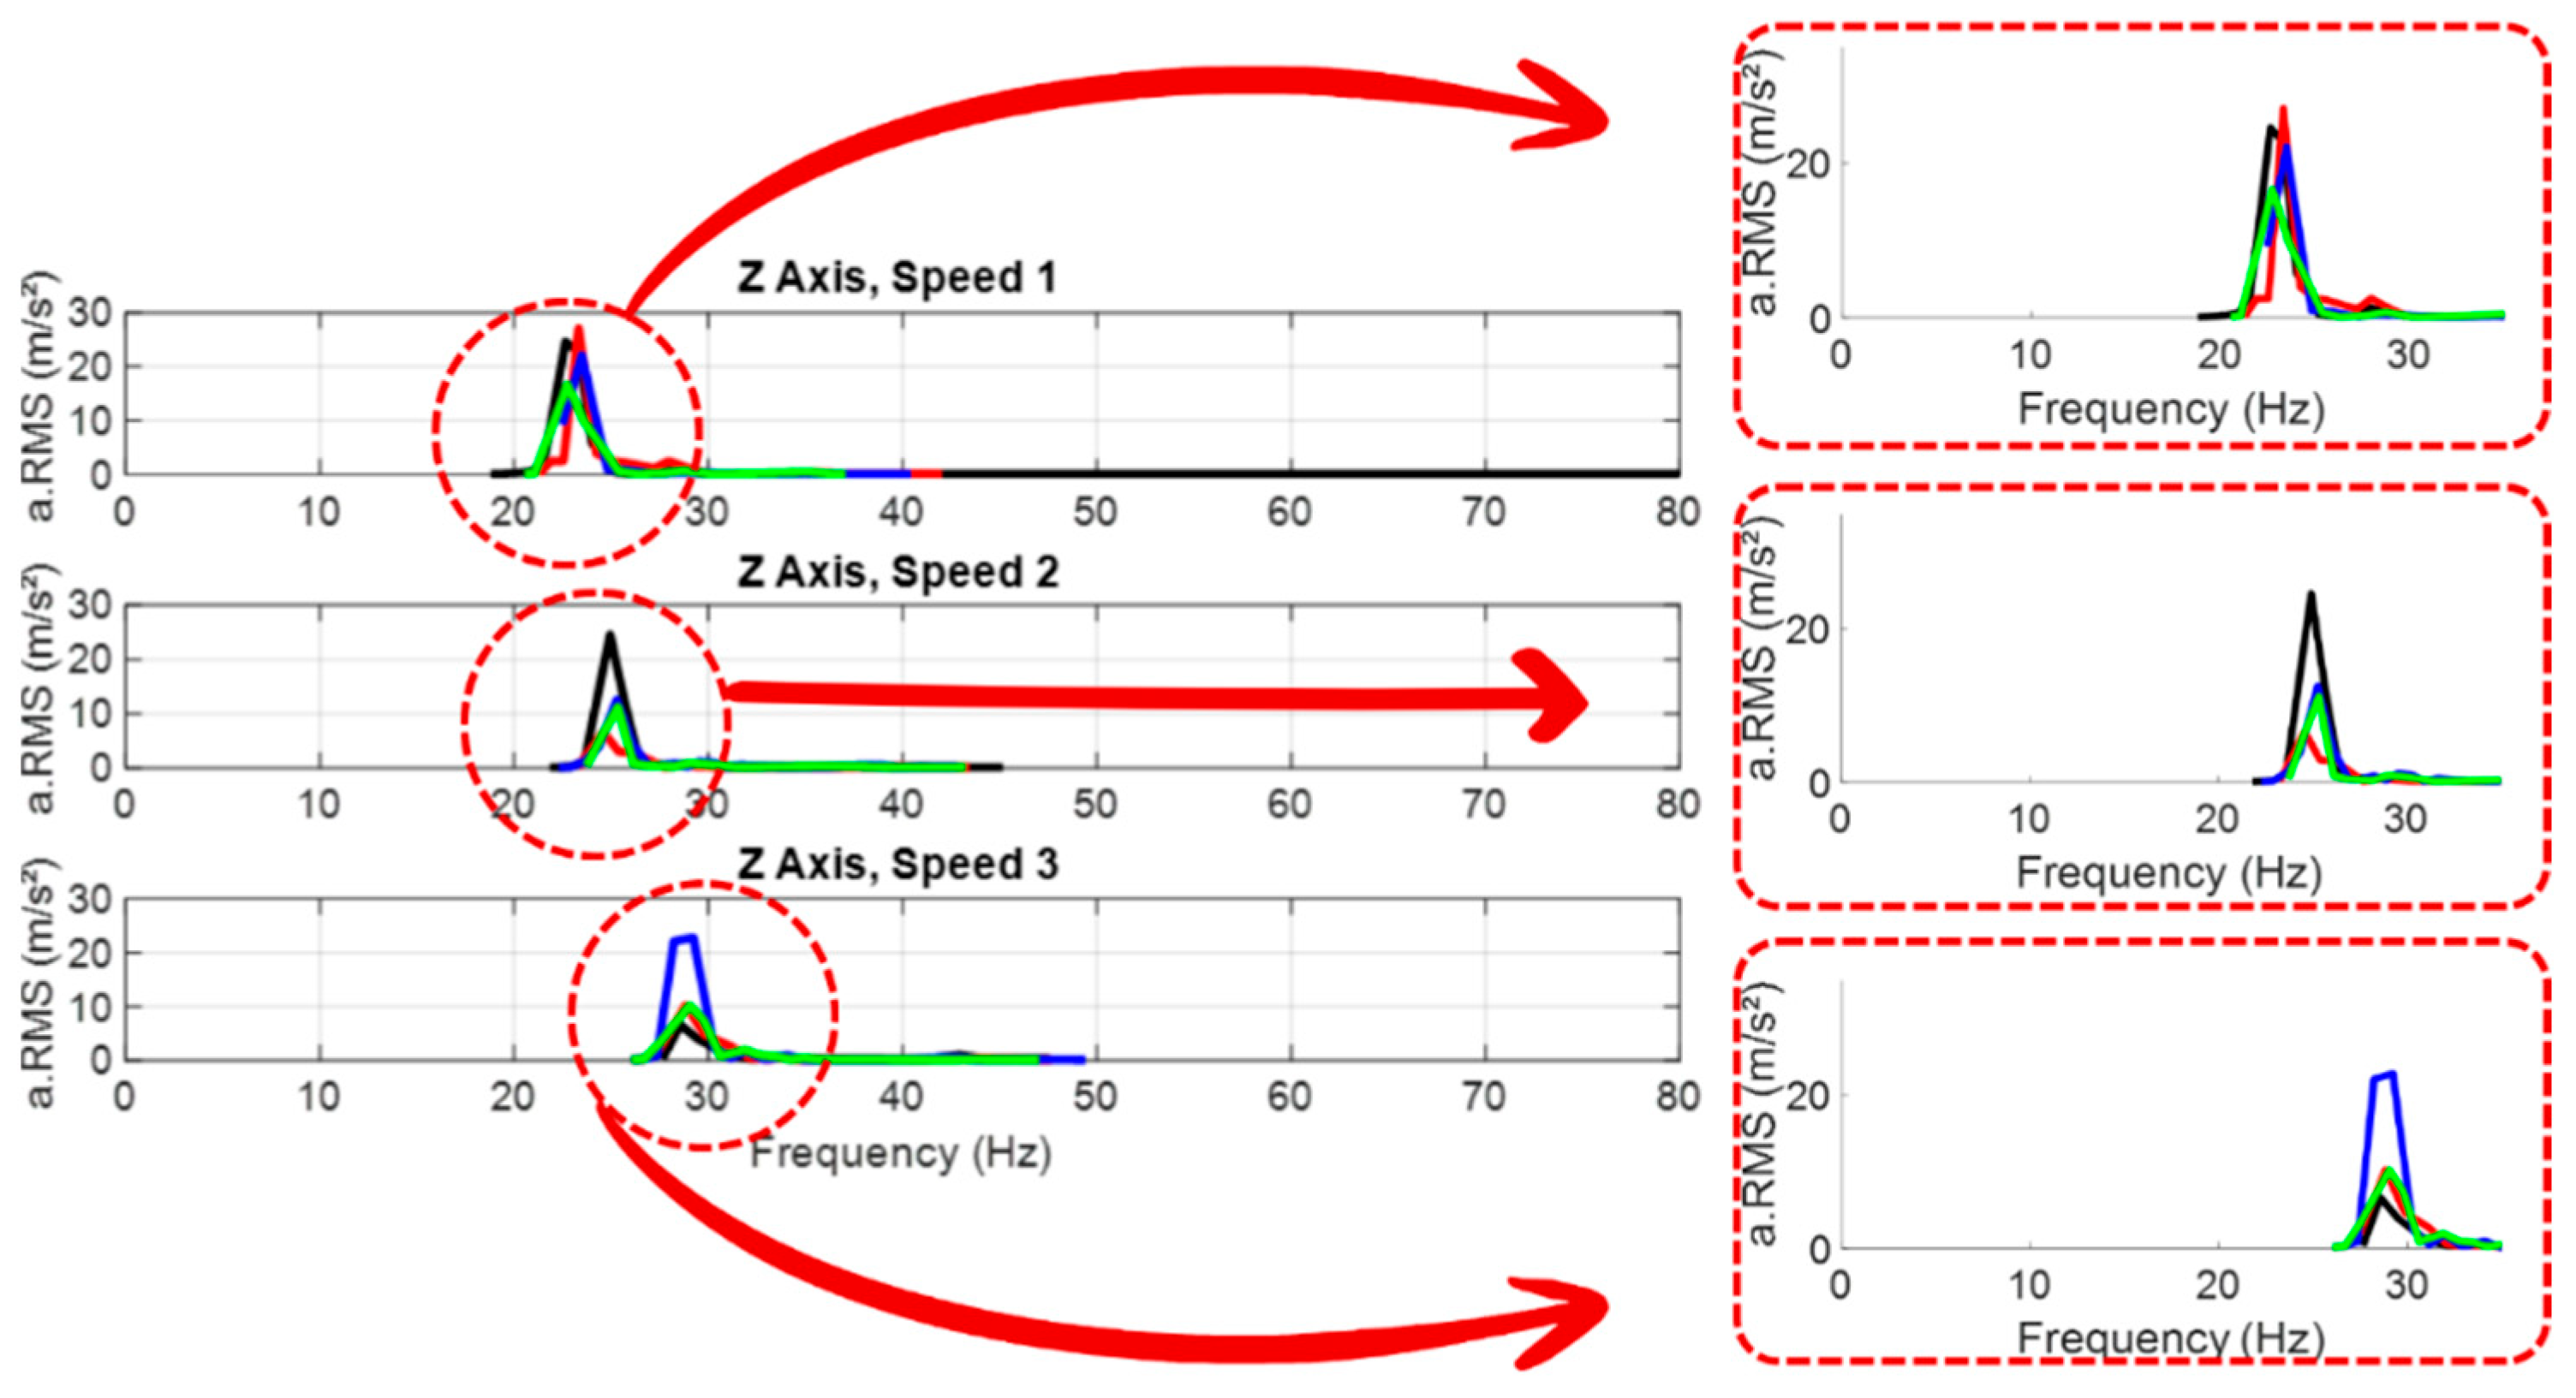
The frequency spectra are shown in
Figure 2 by fixing the pressure P1 for the data of the Z-axis, in the operator’s seat, and by varying the three speeds.
Figure 2 shows that with increasing speed, there is an increase in frequencies corresponding to the RMS acceleration peaks. At speed S1, the peaks occur between 22 and 24 Hz; at speed S2, the peaks occur between 25 and 26 Hz; and at speed S3, the peaks occur between 28 and 29 Hz.
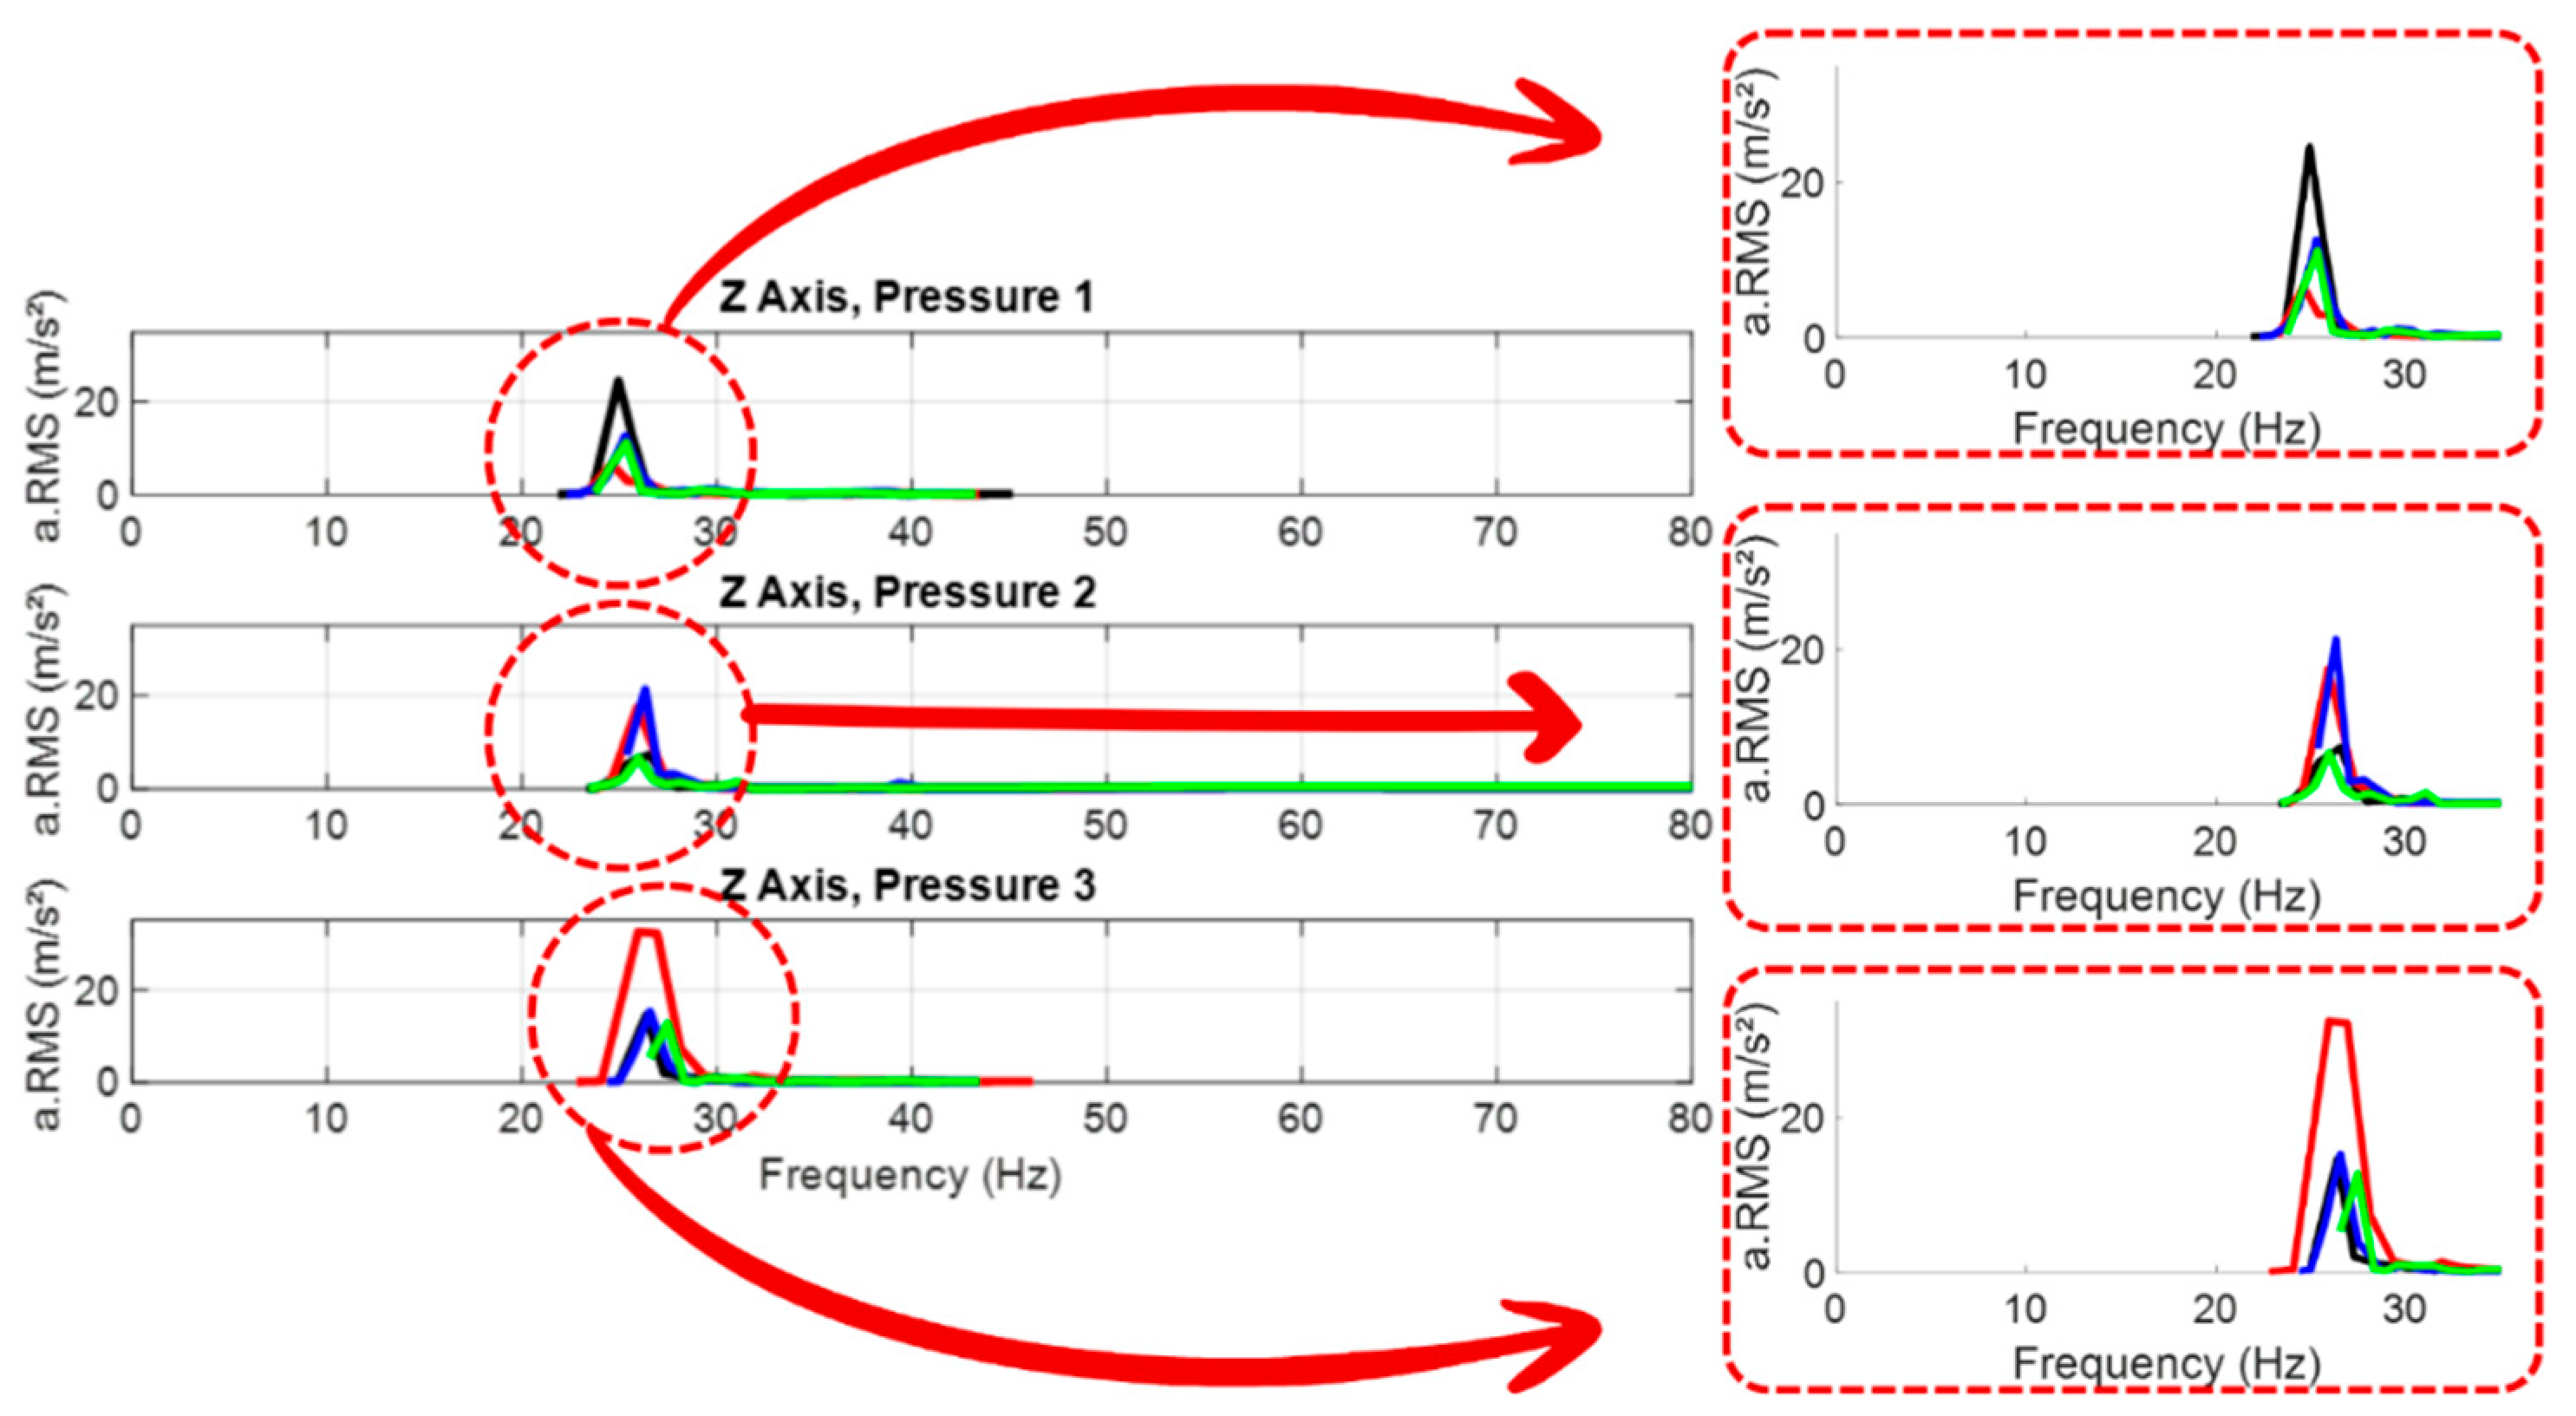
The frequency spectra shown in
Figure 3 are obtained by fixing the speed S2 for the Z-axis data in the operator’s seat and by varying the three pressures.
In the frequency spectra of the tire inflation pressure, there is no significant increase in the frequencies corresponding to the RMS acceleration peaks because, for the three inflation pressures, as shown in
Figure 3, the acceleration peaks are concentrated at frequencies of 25 and 26 Hz.
Table 1 and
Table 2 show the results for the analysis of variance of the RMS accelerations determined in the rear axle, front axle, cabin floor, operator seat and transmissibility by considering the factors evaluated and the interaction between them.
From the results of the analysis of variance (
Table 1 and
Table 2), in which the interactions between the factors pressure and speed were significant, it was decided to evaluate the interaction between these factors from the response surfaces.
In
Table 3 are presented the models selected for the RMS accelerations, obtained from the regression analysis, considering the interaction between inflation pressure and speed in the self-propelled sprayer, on the different collection points in this machine (
Figure 1).
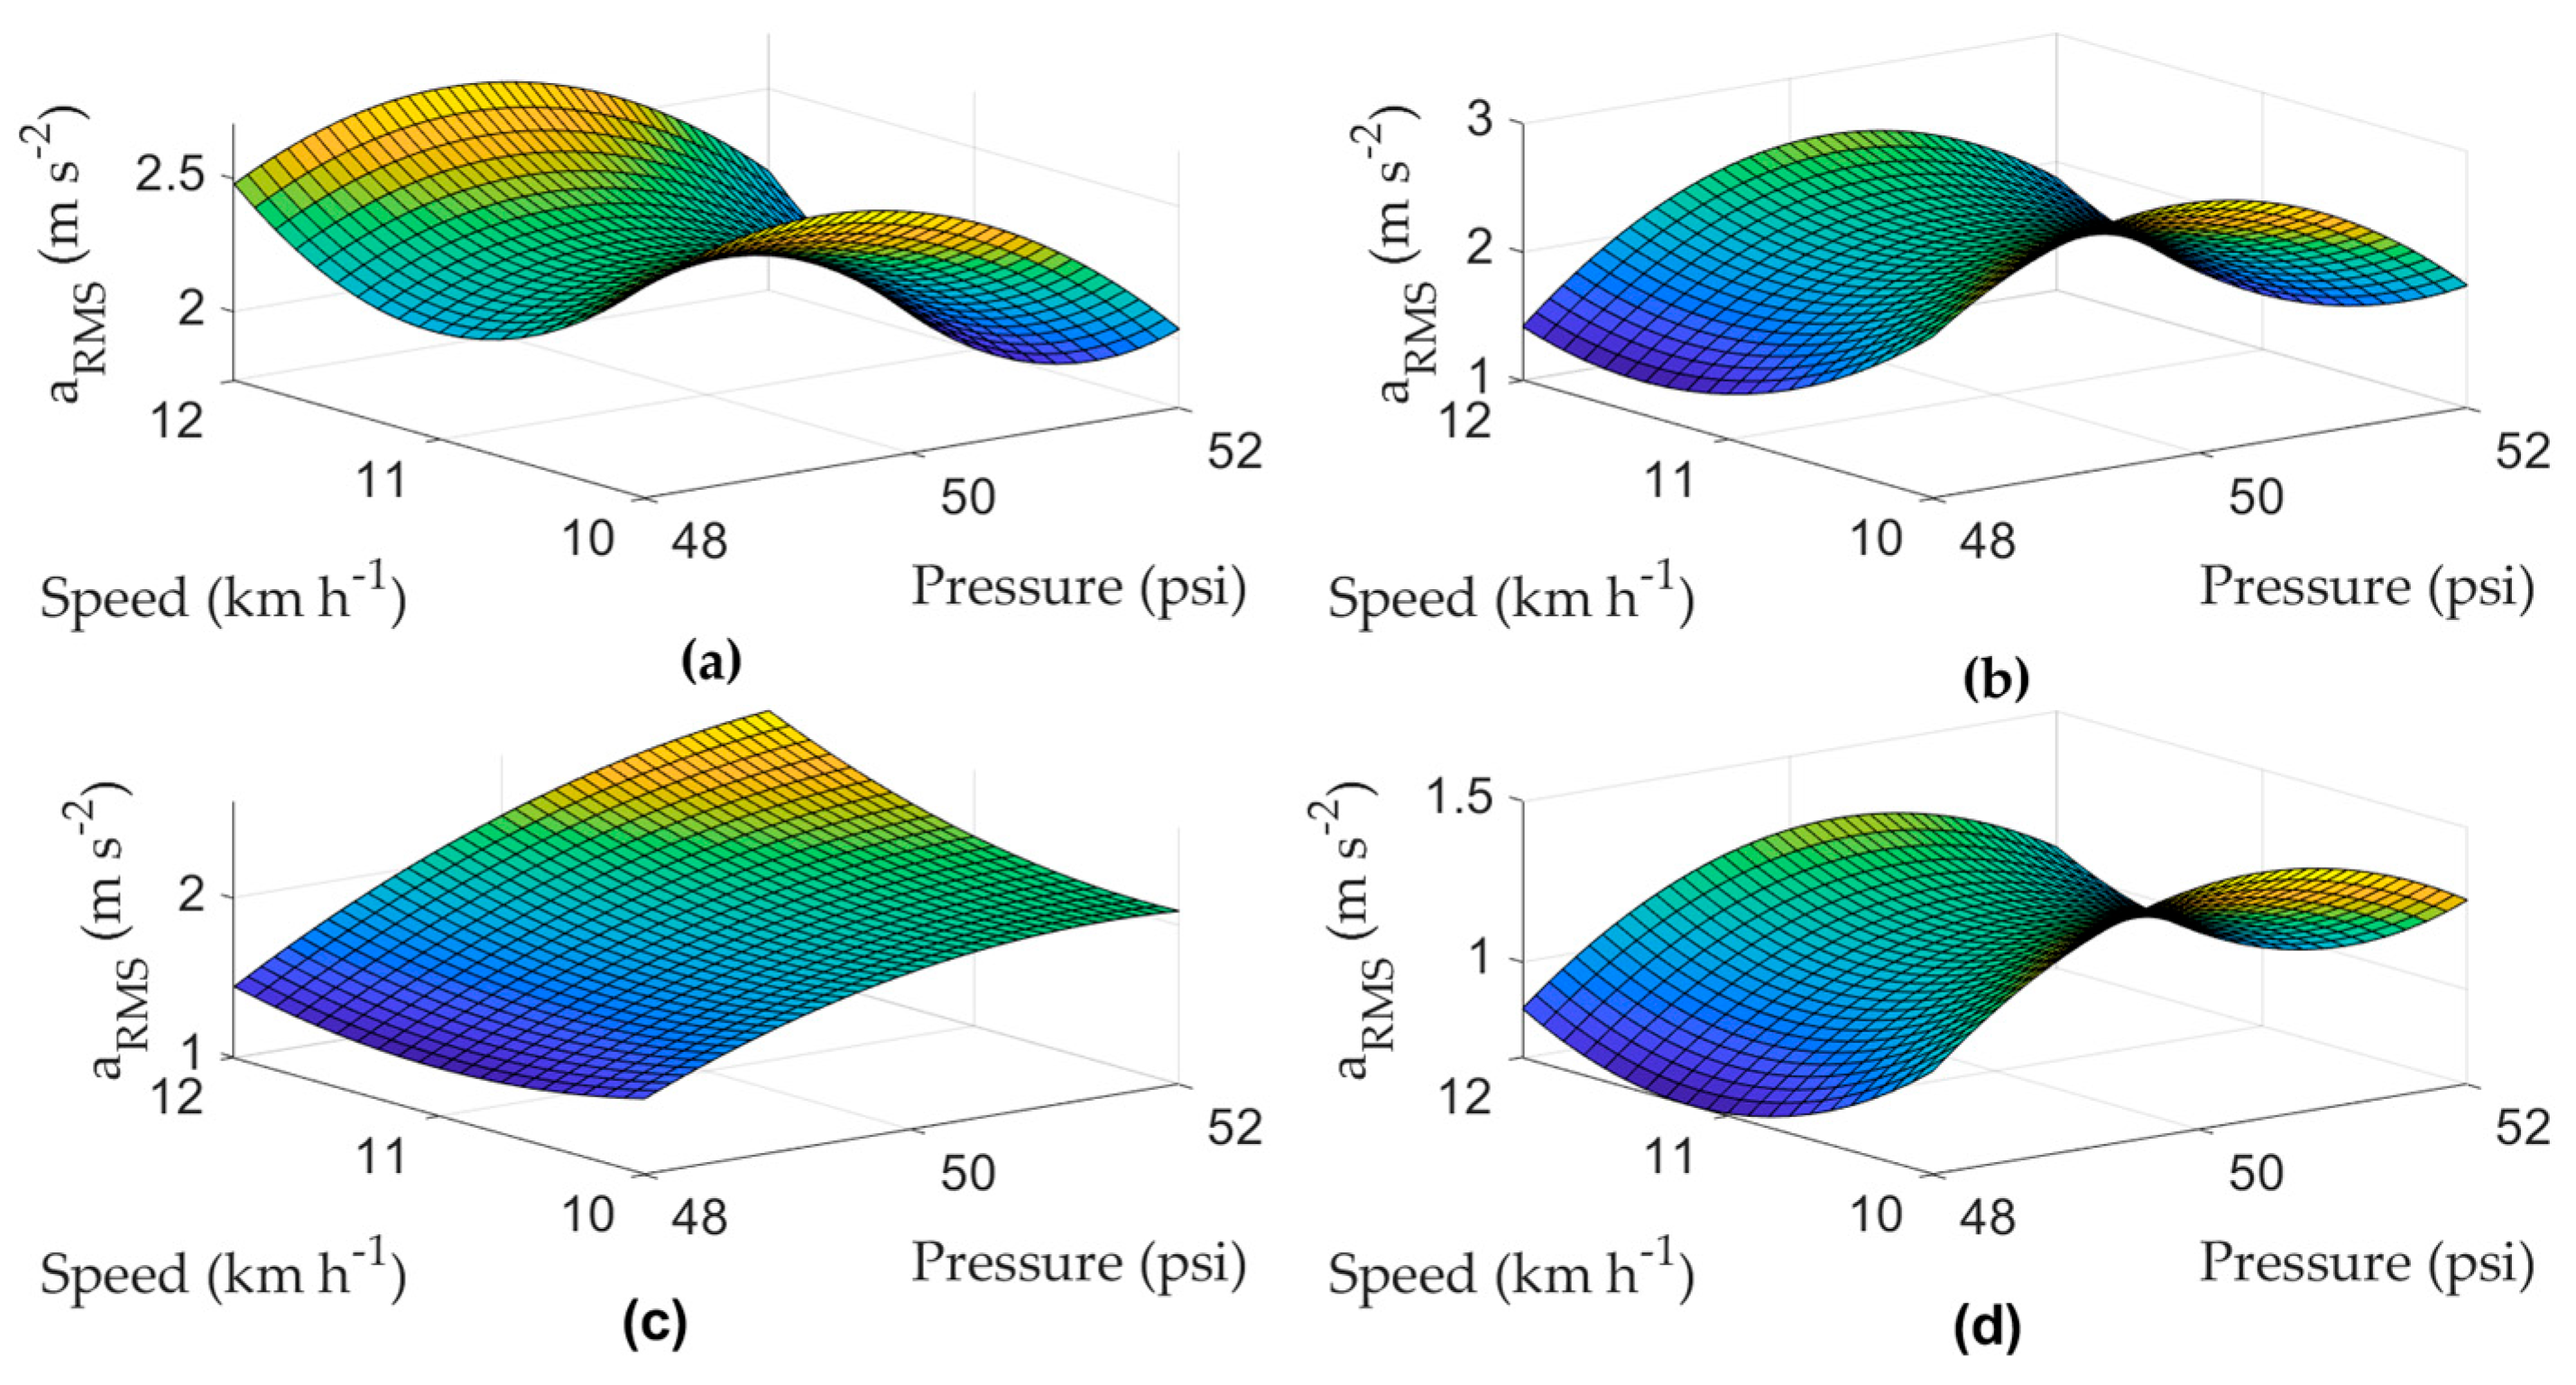
In
Figure 4, the response surfaces for RMS accelerations on the collection points of the self-propelled sprayer as a function of the travel speed and tire inflation pressure.
The maximum RMS acceleration on the front axle occurs at a speed of 12 km h
−1 for a pressure of 48 psi (330.9 kPa), as presented in
Figure 4a, and the values of RMS accelerations on the front axle are between 1.5 and 2.7 m s
−2. In
Figure 4b, it can be observed that the maximum RMS acceleration occurs at a speed of 10 km and a pressure of 50 psi (344.7 kPa), and the values of RMS accelerations are between 1.5 and 2.5 m s
−2. In
Figure 4c, the response surface for the floor of the sprayer operating cabin is presented; the RMS acceleration values are between 1.5 and 2.7 m s
−2. The maximum RMS accelerations on the operator’s seat occur at a speed of 12 km h
−1 for an inflation pressure of 52 psi (358.5 kPa), as presented in
Figure 4d, with RMS accelerations between 0.8 and 1.6 m s
−2.
In
Table 4 are presented the models selected for the transmissibility of vibration, obtained from the regression analysis, considering the interaction between inflation pressure and speed in the self-propelled sprayer, considering different collection points on this machine. In
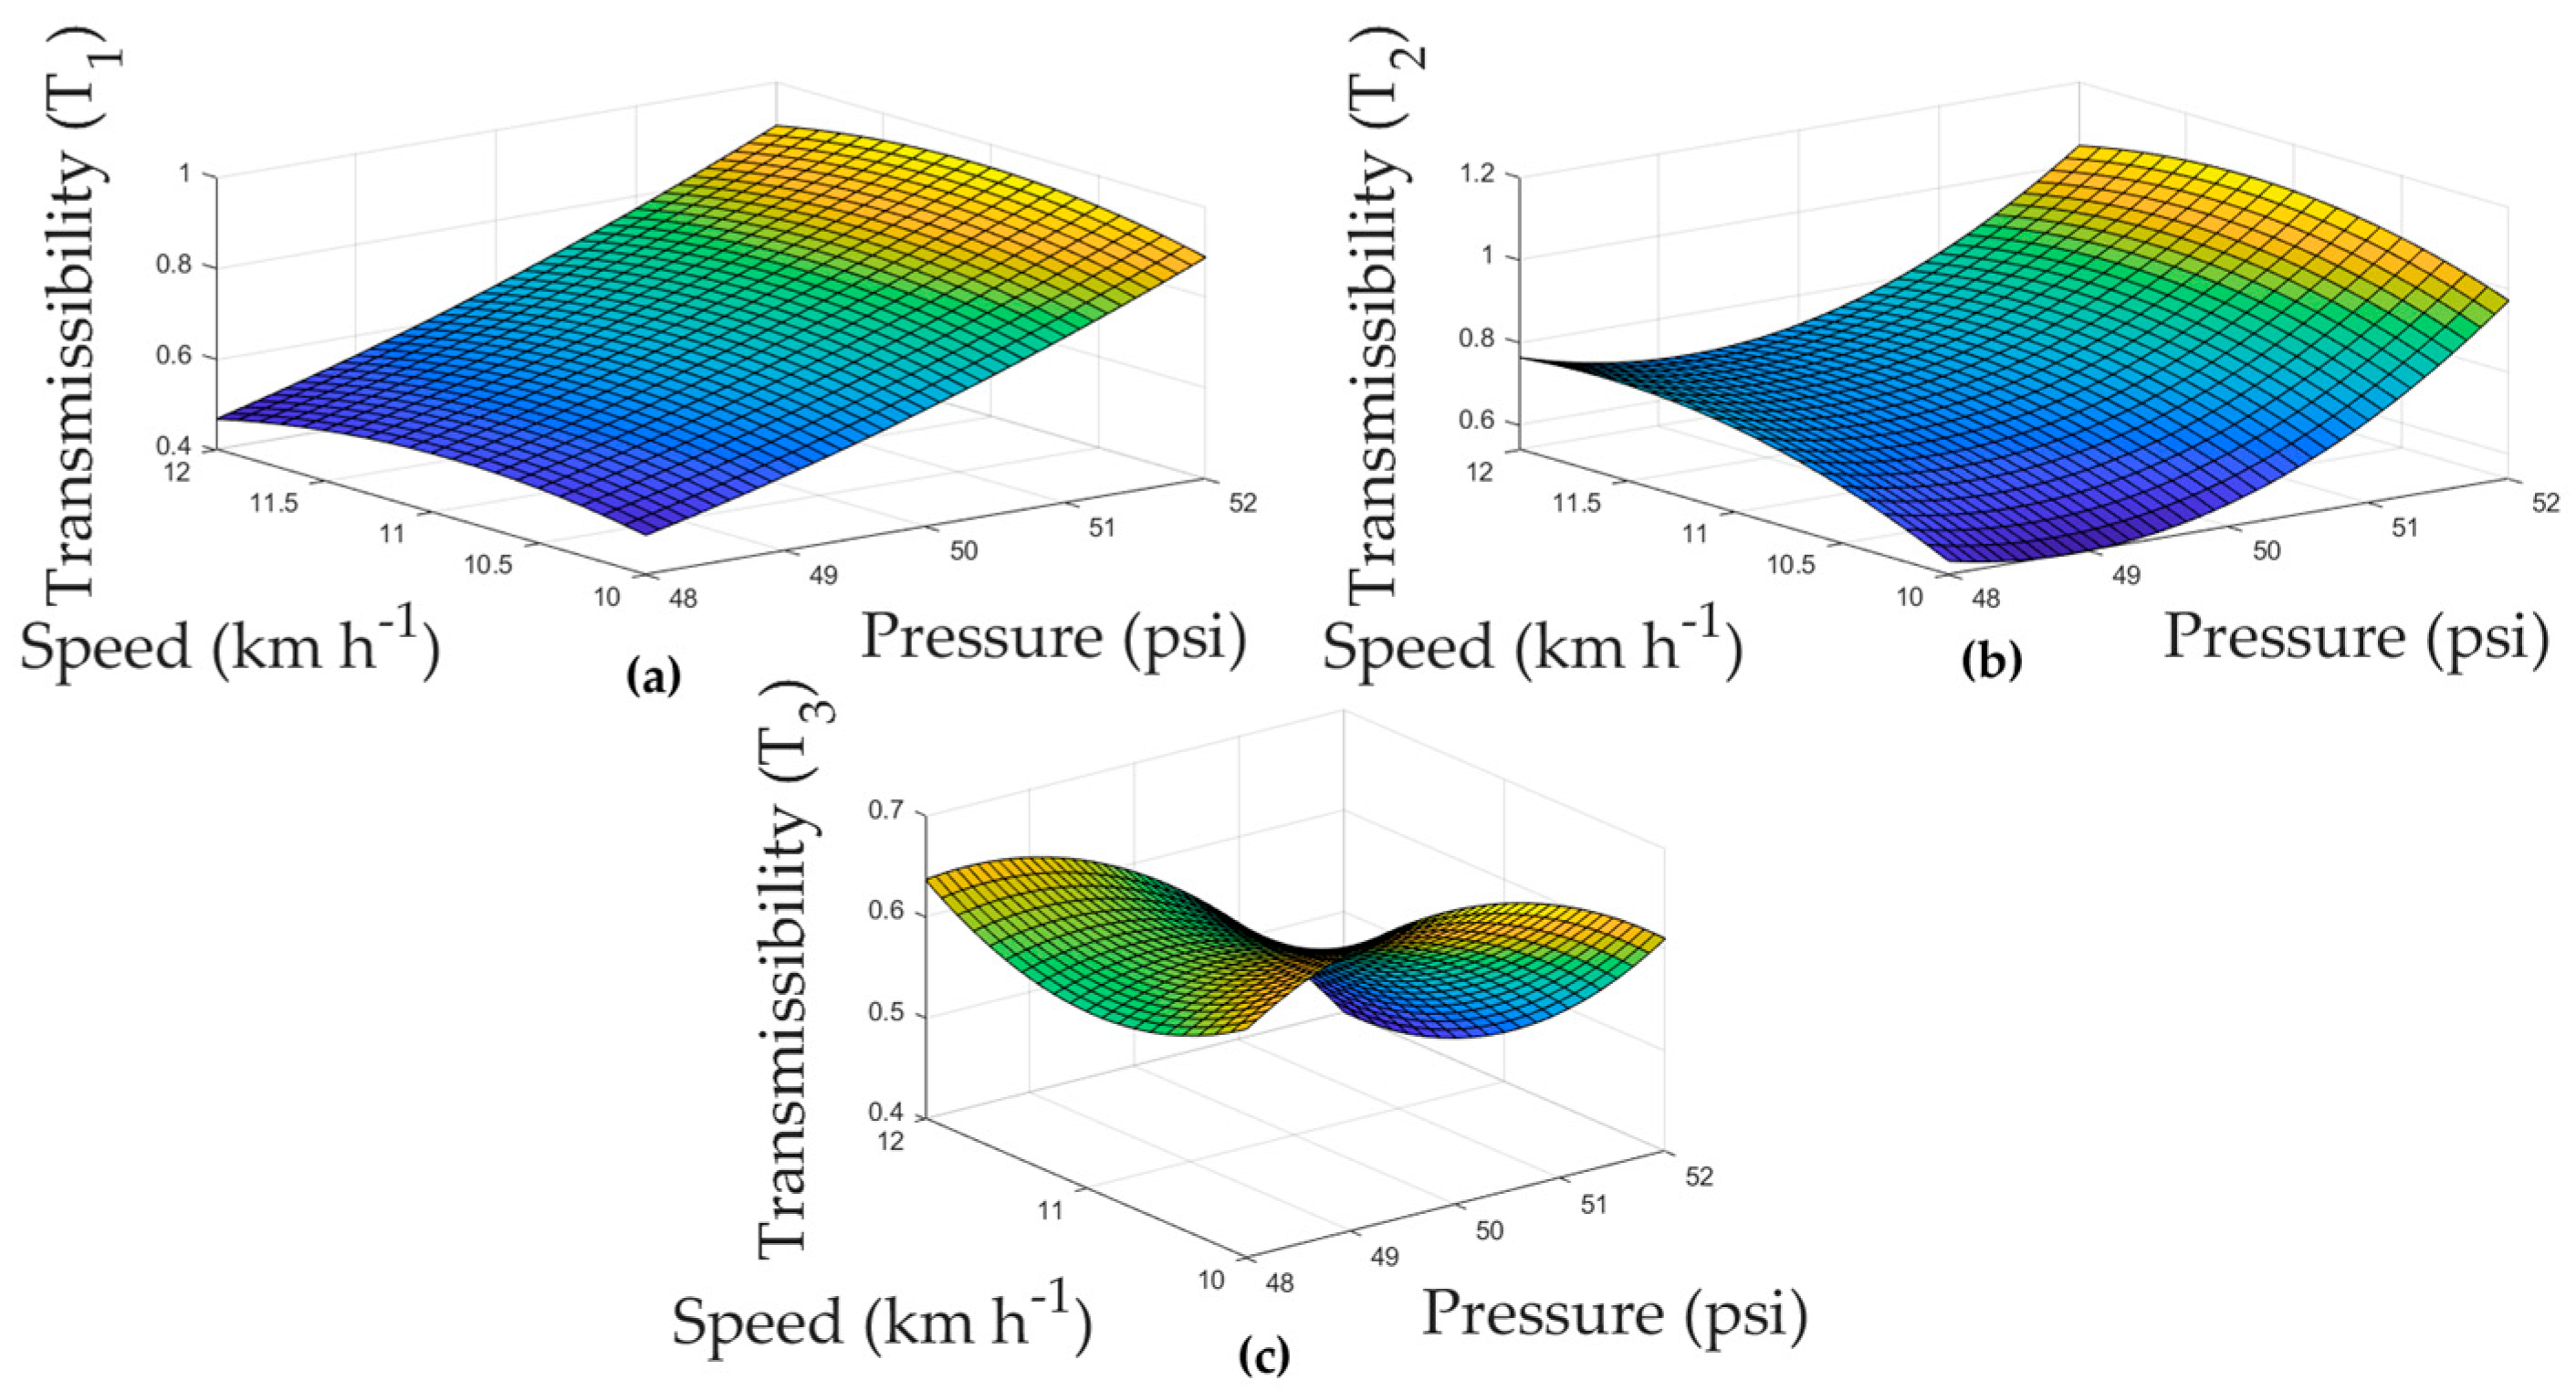
Figure 5, the response surfaces for the transmissibility of vibration on the self-propelled sprayer are shown.
Figure 5a shows the response surface corresponding to transmissibility T1, in which the maximum values occur for all speed values at a pressure of 52 psi (358.5 kPa); however, there are no transmissibility values greater than 1.
Figure 5b shows that transmissibility values are higher than 1 for inflation pressures between 51.5 (355.1 kPa) and 52 psi (358.5 kPa) and for all speed values greater than 10.5 km h
−1. For transmissibility T3, as presented in
Figure 5c, the maximum transmissibility occurs at a speed of 12 km h
−1 for an inflation pressure value of 48 psi (330.9 kPa); however, there are no transmissibility values above 1.
4. Discussion
A study assessed the vibration transmissibility inside the cabin and outside the cabin of an 83.80 hp (62.49 kW) tractor coupled to a scarifier, by varying the forward speed, scarification depth and ballast types [
19]. The same study observed an increase in the vibration transmissibility for the range of 0 to 15 Hz for the total metallic ballast, for the range of 0 to 19 Hz for the partial metallic ballast, and for the range of 71 to 76 Hz for the total liquid ballast.
Ref. [
20] evaluated the vibration severity in four tractors with different powers; they showed tolerable RMS acceleration values according to the [
1] in the frequency ranges between 5 and 10 Hz for one work shift of 8 h. Corroborating the present study, the frequency ranges between 20 and 30 Hz for the studied tractors showed high values of RMS accelerations in the vertical direction (Z-axis).
An experiment conducted by [
17], in which Whole Body Vibration was evaluated at the interface between the operator and the seat in a tractor coupled to a seeder, indicated that RMS accelerations were classified as “extremely uncomfortable” for all tire inflation pressures and in all directions of data collection, according to [
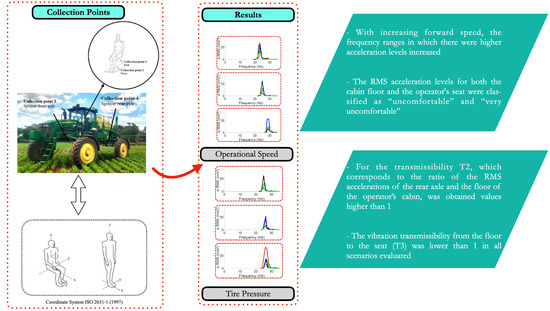
1]. In the same way, observing the results obtained for the self-propelled sprayer, the RMS accelerations for the cabin floor and the operator’s seat were classified as “uncomfortable” and “very uncomfortable”. However, considering the spectral analysis developed, it was possible to observe that, for the self-propelled sprayer, the acceleration peaks are concentrated at frequencies of 25 and 26 Hz, as presented in
Figure 2 and
Figure 3.
Ref. [
1] classify values between 1.25 and 2.5 m s
−2 as “very uncomfortable” and values above 2 m s
−2 as “extremely uncomfortable”. In this study, the maximum RMS acceleration on the front axle exceeded 2 m s
−2, so the operators will be “extremely uncomfortable”. From the values found on the front axle of the sprayer, the daily exposure limit value, according to [
21], is 4 h and 23 min.
Ref. [
12] measured the vibration severity in the front and rear axles of an agricultural tractor in plowing and harrowing operations, considering the activation and nonactivation of the auxiliary front-wheel drive (AFWD). For the plowing operation, the highest RMS accelerations occurred for the nondriven traction, with 1.14 m s
−2 for the rear axle and 1.36 m s
−2 for the front axle. For the harrowing operation, the highest RMS acceleration on the front axle occurred with the activation of the AFWD, reaching a value of 1.26 m s
−2, but the highest RMS acceleration for the rear axle occurred without the activation of the AFWD (1.07 m s
−2). These values are close to the minimum values found in the present study for the front and rear axles.
In the rear axle of the sprayer (1.5–2.5 m s
−2), according to the [
1], the RMS acceleration values can fall into the following categories: “uncomfortable” for values between 0.8 and 1.6 m s
−2); “very uncomfortable” for values between 1.25 and 2.5 m s
−2 and “extremely uncomfortable” for values greater than 2 m s
−2). According to [
21], the limit value for the rear axle of the operator is 4 h and 36 min.
Ref. [
22] found values up to 115.62 m s
−2 in the direction transverse to the tractor displacement with the engine operating at 2000 rpm, transducers affixed to the operator’s seat, and the tractor coupled to a 3-disc plow. In the same study, the maximum RMS acceleration in the direction transverse to the tractor displacement for the tractor coupled to an offset harrow of 14 discs was 24.11 m s
−2, also for the highest experimental engine speed of 2000 rpm. This study found values acceptable by the [
1] for the vertical and longitudinal directions; however, for the transverse direction, the values reached unacceptable levels for a workload of 8 h per day.
On the floor of the sprayer operating cabin, according to [
1], the classification is “uncomfortable”, “very uncomfortable”, and “extremely uncomfortable”, as mentioned above for the rear axle of the sprayer. According to [
21], the daily exposure limit value for the mean value found on the floor of the sprayer operating cabin is 4 h and 23 min.
The RMS acceleration values for the seat (0.8–1.25 m s
−2) are classified as “uncomfortable” (0.8–1.6 m s
−2), according to the ISO 2631-1 standard. The daily exposure limit value for the operator’s seat is 9 h, according to the [
21]. Ref. [
23] evaluated the vibration severity at the base of the seat and on the operator’s seat of a 75 cv tractor coupled to an offset harrow grader by varying the forward speed (5, 6, and 7 km h
−1), they found values above the acceptable limits according to [
1]. The highest RMS acceleration for the seat base was 20 m s
−2, while the maximum for the seat was 2.5 m s
−2. The authors emphasized that the high RMS acceleration values found were due to the displacement of the tractor on the plowed surface and to the pulled implement. In this study, it can be observed that the values of RMS accelerations in the floor and operator’s seat are lower than those reported in the referenced study.
Ref. [
13] installed an accelerometer at the base of the operation station to measure the vibration severity in an 85 cv tractor by varying the forward speed (4, 8, and 14 km h
−1) and the tire inflation pressure (14, 20, and 26 psi). With increasing forward speed and tire inflation pressure, the recorded RMS acceleration levels increased. On the floor and the operator’s seat of the sprayer, this behavior can be observed too.
Analyzing the transmissibility, the stability of the rear axle causes its vibration severity to be lower than the vibration severity on the floor of the operator’s cabin (T1 below 1). The position of the rear axle in relation to the operator’s cabin also favors lower RMS acceleration values. The seat in regard to the attenuation of the mechanical vibration that reaches the sprayer cabin (T3 below 1).
Ref. [
24] measured the vibration transmissibility on a tractor seat in a test environment in which accelerometers were placed as follows: one at the base of the seat, one next to the shaker that propagated the vibrations, and one at the interface between the seat and the buttocks of the operator. The authors considered the RMS excitation accelerations of the system of 0.5, 1.0, and 2.0 m s
−2, which corresponded to resonance frequencies of 4.75, 2.25, and 2.0 Hz, respectively. The transmissibilities for each of the RMS excitation accelerations were 1.09, 1.19, and 1.36, respectively. This differs from the present study since the values found were results from involuntary excitations and not focused on the resonance accelerations resulting from the displacement of the sprayer.