Article

Leveraging Transfer Learning for Determining Germination Percentages in Gray Mold Disease (Botrytis cinerea)

by
Luis M. Gómez-Meneses
1,
Andrea Pérez
2,
Angélica Sajona
2,
Luis F. Patiño
3,
Jorge Herrera-Ramírez
4,
Juan Carrasquilla
5 and
Jairo C. Quijano
2,*
1
Faculty of Engineering, Instituto Tecnológico Metropolitano, Medellín 050034, Colombia
2
Faculty of Sciences and Education, Politécnico Colombiano Jaime Isaza Cadavid, Medellín 050022, Colombia
3
Faculty of Agricultural Sciences, Politécnico Colombiano Jaime Isaza Cadavid, Medellín 050022, Colombia
4
Faculty of Exact and Applied Sciences, Instituto Tecnológico Metropolitano, Medellín 050034, Colombia
5
Institute for Theoretical Physics, ETH Zürich, 8093 Zurich, Switzerland
*
Author to whom correspondence should be addressed.
AgriEngineering 2025, 7(9), 303; https://doi.org/10.3390/agriengineering7090303
Submission received: 1 August 2025 / Revised: 4 September 2025 / Accepted: 15 September 2025 / Published: 18 September 2025
(This article belongs to the Special Issue Implementation of Artificial Intelligence in Agriculture)

Abstract

The rapid and accurate identification of pathogenic spores is essential for the early diagnosis of diseases in modern agriculture. Gray mold disease, caused by Botrytis cinerea, is a significant threat to several crops and is traditionally controlled using fungicides or, alternatively, by UV-C radiation. Classically, the determination of conidial germination percentage, a key indicator for assessing pathogen viability, has been a manual, time-consuming, and error-prone process. This study proposes an approach based on deep learning, using one-stage detectors to automate the detection and counting of germinated and non-germinated conidia in microscopy images. We trained and assessed the performance of three models under several metrics: YOLOv8, YOLOv11, and RetinaNET. The results show that these three architectures provide an efficient and accurate solution for the recognition of gray mold conidia viability. Selecting the best model, we performed the task of detecting and counting conidia for determining the germination percentage on samples treated with different UV-C radiation dosages. The results show that these deep-learning models achieved counting accuracies that closely matched those obtained with conventional manual methods, yet they delivered results far more rapidly. Because they operate continuously without fatigue or operator bias, these models begin to open possibilities, after widening field tests and datasets, for efficient and fully automated monitoring pipelines for disease management in the agro-industry.

1. Introduction

In recent years, the field of biology has undergone a significant transformation as the generation and analysis of biological data have become increasingly complex [1]. The exponential growth in the variety and volume of data in biology and agriculture has created challenges that require efficient and accurate solutions [2]. In response to this growing demand, machine learning techniques have emerged as invaluable tools for understanding and studying biological and agricultural processes [3,4,5].
An example of a significant agricultural problem is the disease known as gray mold, which is caused by the pathogenic fungus Botrytis cinerea and affects a variety of crops, from flowers to fruits and vegetables. This disease has become one of the most significant threats to greenhouse and outdoor crops [6,7]. Botrytis cinerea infection occurs through natural wounds and openings in plant tissue, including microcracks, insect damage, areas previously infected by other pathogens, and other types of physical damage. Symptoms of infection include necrotic spots on leaves, stems, and fruit, and lesions on petals [8]. The traditional management of this disease includes the use of fungicides, preventive measures such as removal of infected tissue, and the regulation of environmental humidity [8,9,10]. An alternative method of controlling this infection is UV-C radiation. Unlike many chemical fungicides, UV-C is non-selective, which means it can treat multiple pathogens (including Botrytis cinerea) without them developing resistance. It is also safe and environmentally friendly [11,12,13,14,15,16,17,18,19,20,21,22,23,24,25]. Although potential side effects such as impacts on non-target microorganisms or leaf tissues could be expected, these effects are typically minimized by optimizing dose [25,26,27].
At the microscopic level, determination of whether a Botrytis cinerea conidium has germinated is based on observation of the formation of a germ tube, a structure that grows from the conidium in the direction of the nutrient source [28]. Traditionally, the assessment of conidial germination percentage has been done by the direct manual counting method, where samples are diluted and placed in agar Petri dishes, and then the germinated and non-germinated conidia are counted using bright-field microscopy to estimate the percentage of viability in the sample [25,26,29,30].
Machine learning has emerged as a powerful tool in agriculture, improving disease detection and crop monitoring to optimize management strategies [5,31,32]. Transfer learning has been particularly useful in adapting pretrained models for specific agricultural applications, including the classification of microscopic structures such as fungal spores [33,34,35]. One promising direction involves developing transfer learning methods that enable models to be trained on smaller, more diverse datasets. Additionally, transfer learning can enhance the robustness of models by leveraging knowledge from related subjects [36,37,38,39].
Traditional diagnostic methods, primarily based on visual inspection, are often time-consuming, labor-intensive, and reliant on human expertise, limiting their effectiveness in early disease detection. In response to these limitations, artificial intelligence (AI) has emerged as a transformative tool for automated monitoring and diagnosis of plant diseases [40]. The integration of AI with real-time data acquisition technologies has accelerated the development of intelligent farming systems. These advancements support a more efficient, precise, and sustainable agricultural practice [41].
The accurate counting and classification of cells in microscopic images is a fundamental task in biomedical research, clinical diagnostics, and industrial biotechnology. Traditional manual methods, such as the use of hemocytometers or visual estimates by researchers, are not only time-consuming but also prone to variability and subjectivity. Developments with machine learning can outperform traditional approaches in accuracy and reproducibility [42,43,44,45], including accurate and automated cell recognition and counting in fluorescence images [43,46,47]. For instance, pipelines integrating tools like ilastik [48] and ImageJ enable high-throughput, low-cost fungal and yeast cell counting [44], while AI-based models in pathology significantly reduce the error margins in tumor cellularity estimation compared to expert human observers [42,45].
In the case of fungal cells, automated detection and counting are essential for early disease diagnosis in precision agriculture. Traditional methods are labor-intensive and less reproducible, prompting the adoption of deep learning and computer vision approaches [49,50]. Recent models such as YOLOv5 and Faster R-CNN have achieved high accuracy in identifying spores under complex conditions, distinguishing them from background noise and impurities [34,44,51,52].
Deep learning techniques have also been successfully applied to pollen analysis to detect pollen germination and measure pollen tube length from microscopic images [53]. Similarly, accurate assessment of seed germination is essential for evaluating seed quality. With this regard, the SeedGerm platform combines cost-effective imaging with machine-learning analysis, enabling reliable germination scoring across species [54]. Likewise, deep learning models such as YOLO and Faster R-CNN have demonstrated high accuracy in classifying germinated seeds in soybean and other grains [55,56].
This study employed a deep learning-based approach to address a specific challenge in biology: evaluating the efficiency and effectiveness of conidia counting to determine germination percentage in Botrytis cinerea, a common pathogen of agricultural crops. This process, traditionally performed manually, is slow and prone to errors, which negatively impacts agricultural production. Three single-stage detection architectures, YOLOv8, YOLOv11, and RetinaNet [57], were initialized with weights pretrained on the COCO dataset [58] and subsequently fine-tuned for the detection and classification of germinated versus non-germinated conidia; their efficacy was assessed using precision metrics and inference-time measurements. After transfer learning, the fine-tuning training was performed using a synthetic 500 high-resolution images dataset containing balanced proportions of germinated and non-germinated conidia. The generated dataset was created by data augmentation and Poisson blending techniques [59]. A different experimental dataset containing 30 high-resolution images was employed to test the best performing model of the three for determining the germination percentage in each image.

2. Materials and Methods

2.1. Extraction and Culture of Botrytis cinerea

The strains used in the experiment were obtained directly from post-harvest cut roses (variety MovieStar provided by a local company Inversiones Coquette S.A., Medellín, Colombia) showing signs and symptoms of the disease. The BOTR2 strain of the Botrytis cinerea fungus belonging to the collection of microorganisms of the Regional Bioprospecting laboratory of the Politécnico Colombiano Jaime Isaza Cadavid was used. The morphology of the fungal strain was corroborated in terms of its compliance with Koch’s postulates, by which the strain reproduced the characteristic symptoms of the gray mold disease in plants. The rose petals were placed in humid chambers with specific conditions of 20 ± 2 °C and 94% relative humidity, with 12 h of light per day. After 7 days, a layer of gray-brown mold formed on the surface of the rose petals. Then, 10 mL of sterile water was added to the petals to extract the mycelium and spores. Finally, the mycelium was removed by double gauze filtration.
A solution of 1 × 10⁴ conidia/mL was prepared and the surfactant Tween 80 was added at a concentration of 0.1 cc/L. The solution was then placed in Petri dishes containing 3% bacteriological agar culture medium.

2.2. UV-C Radiation Experiments

To obtain different germination percentages, the Petri dishes were irradiated with UV-C light produced by the OSRAM Puritec HNS 8W G5® germicidal lamp (ams-OSRAM AG, Premstaetten, Austria). Some samples were irradiated at a dose of 1080 J·m−2 and others at a dose of 810 J·m−2 once every day for 4 days. These doses and treatments were selected based on previous experiences using UV-C for fungi control [25,26]. In addition, control samples, 0 J·m−2, were included without exposure for the same 4 days. The Petri dishes were then sealed with parafilm® (Bemis Company, Inc., Neenah, WI, USA), and incubated at 22 °C in darkness for 48 h to be ready for image acquisition.

2.3. Dataset Generation

2.3.1. Image Acquisition

An Olympus CX33 microscope (Olympus Corporation, Hachioji, Tokyo, Japan) with 40× magnification was used for image acquisition. Images were captured using an AmScope MU130 USB 2.0 digital RGB microscope camera with reduction lens and two C-mount adapters (AmScope, Irvine, CA, USA). The maximum resolution (4096 × 3288) was achieved using AmScope software version 3.7, which also allows adjustments of resolution, image modification (e.g., exposure, saturation, white balance), as well as sampling, counting, and histogram functions. Automatic exposure control was used during acquisition. A total of 60 high-resolution images (4096 × 3288) were acquired, 20 images at a UV-C dose of 1080 J·m−2, 20 images at a UV-C dose of 810 J·m−2, and 20 images without UV-C treatment (control). The procedure of gray mold extraction and image acquisition is shown in Figure 1.

2.3.2. Image Labeling

Two main classes were defined: Germinated conidia (G), and Non-Germinated conidia (NG). To perform the labeling of the existing classes, the minimal outer rectangle of the spore was used as a basic reference to manually label the image and reduce the interference of background information in the bounding box. This labeling process was performed using DarkLabel “https://github.com/darkpgmr/DarkLabel.git (accessed on 12 July 2025)”, where two files (.txt and .XML) were generated with the target species and the corresponding coordinates.
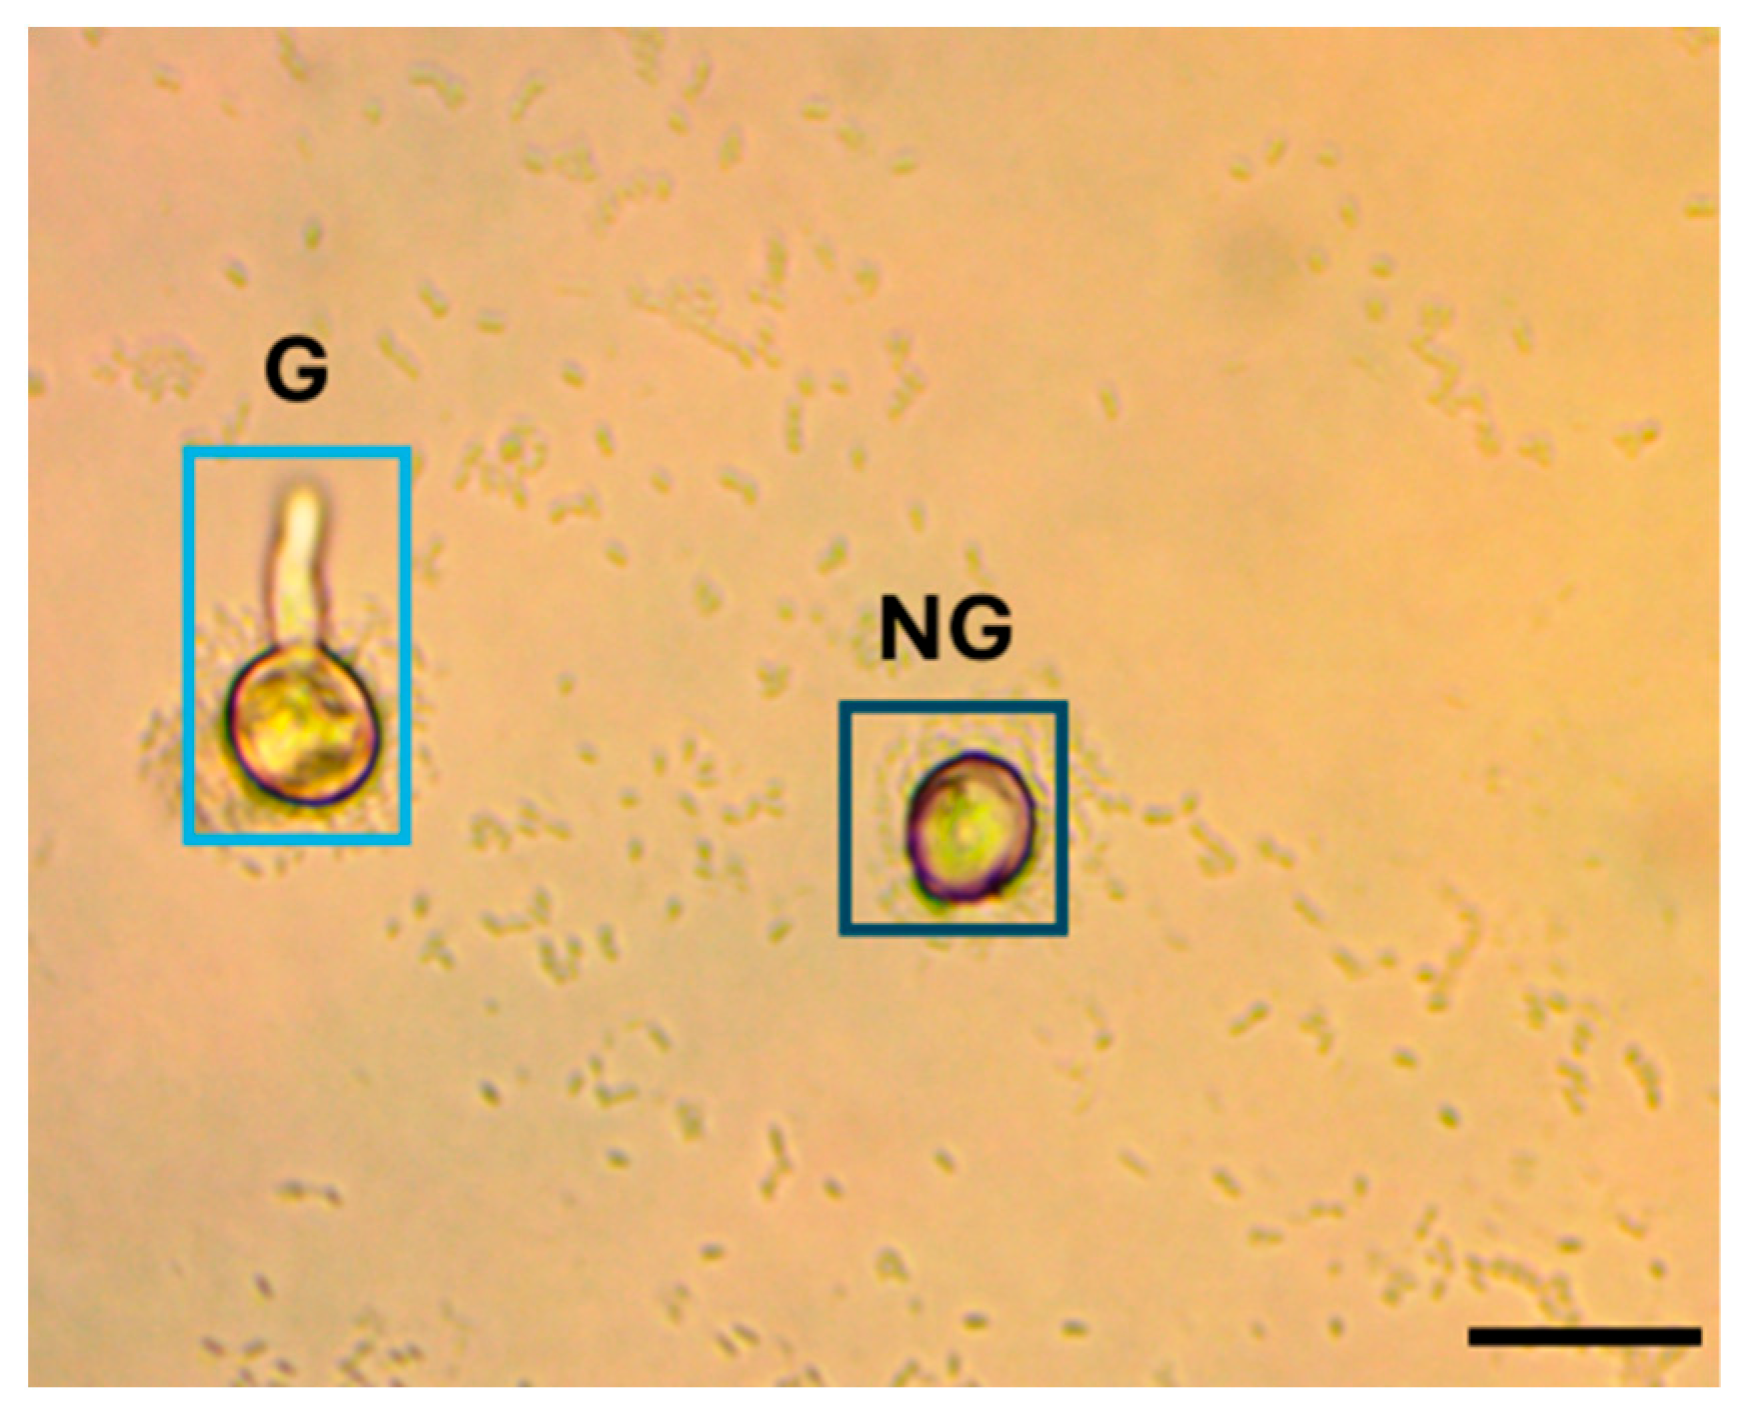
An example of a microscopic image is shown in Figure 2 along with a typical example of the labeling. Standard non-germinated conidia of Botrytis cinerea are oval and have no germ tube, whereas standard germinated conidia have a germ tube. From the original 60 images, we randomly selected 30 images, 10 per treatment from which 412 labeled images of individual conidia were obtained, including 209 G and 203 NG conidia. These 30 images were used for training the single-stage detection models. The other 30 images were kept for testing the best model for determining the percentage of germination. We note that using 30 real images with 412 labeled conidia to seed the synthetic generation and model training imposes a limitation on biological variability, which we address later in the Section 4.

2.3.3. Dataset Synthesis and Augmentation

To enlarge the dataset and to reduce the risk of over-fitting, we generated synthetic high-resolution images from the original crops of the individual conidia, following a three-step workflow:
1.
The individual annotated conidia were randomly rotated before being inserted into the background images at 40×. To implement a data augmentation strategy without introducing bias from minor variations, each crop was rotated at discrete angles of 90°, 180°, or 270°. This operation is described by the rotation matrix in Equation (1).
x y = cos θ sin θ sin θ cos θ x y ,   θ π 2 , π , 3 π 2 .
Here ( x , y ) and ( x , y ) denote the original and transformed pixel coordinates, respectively.
2.
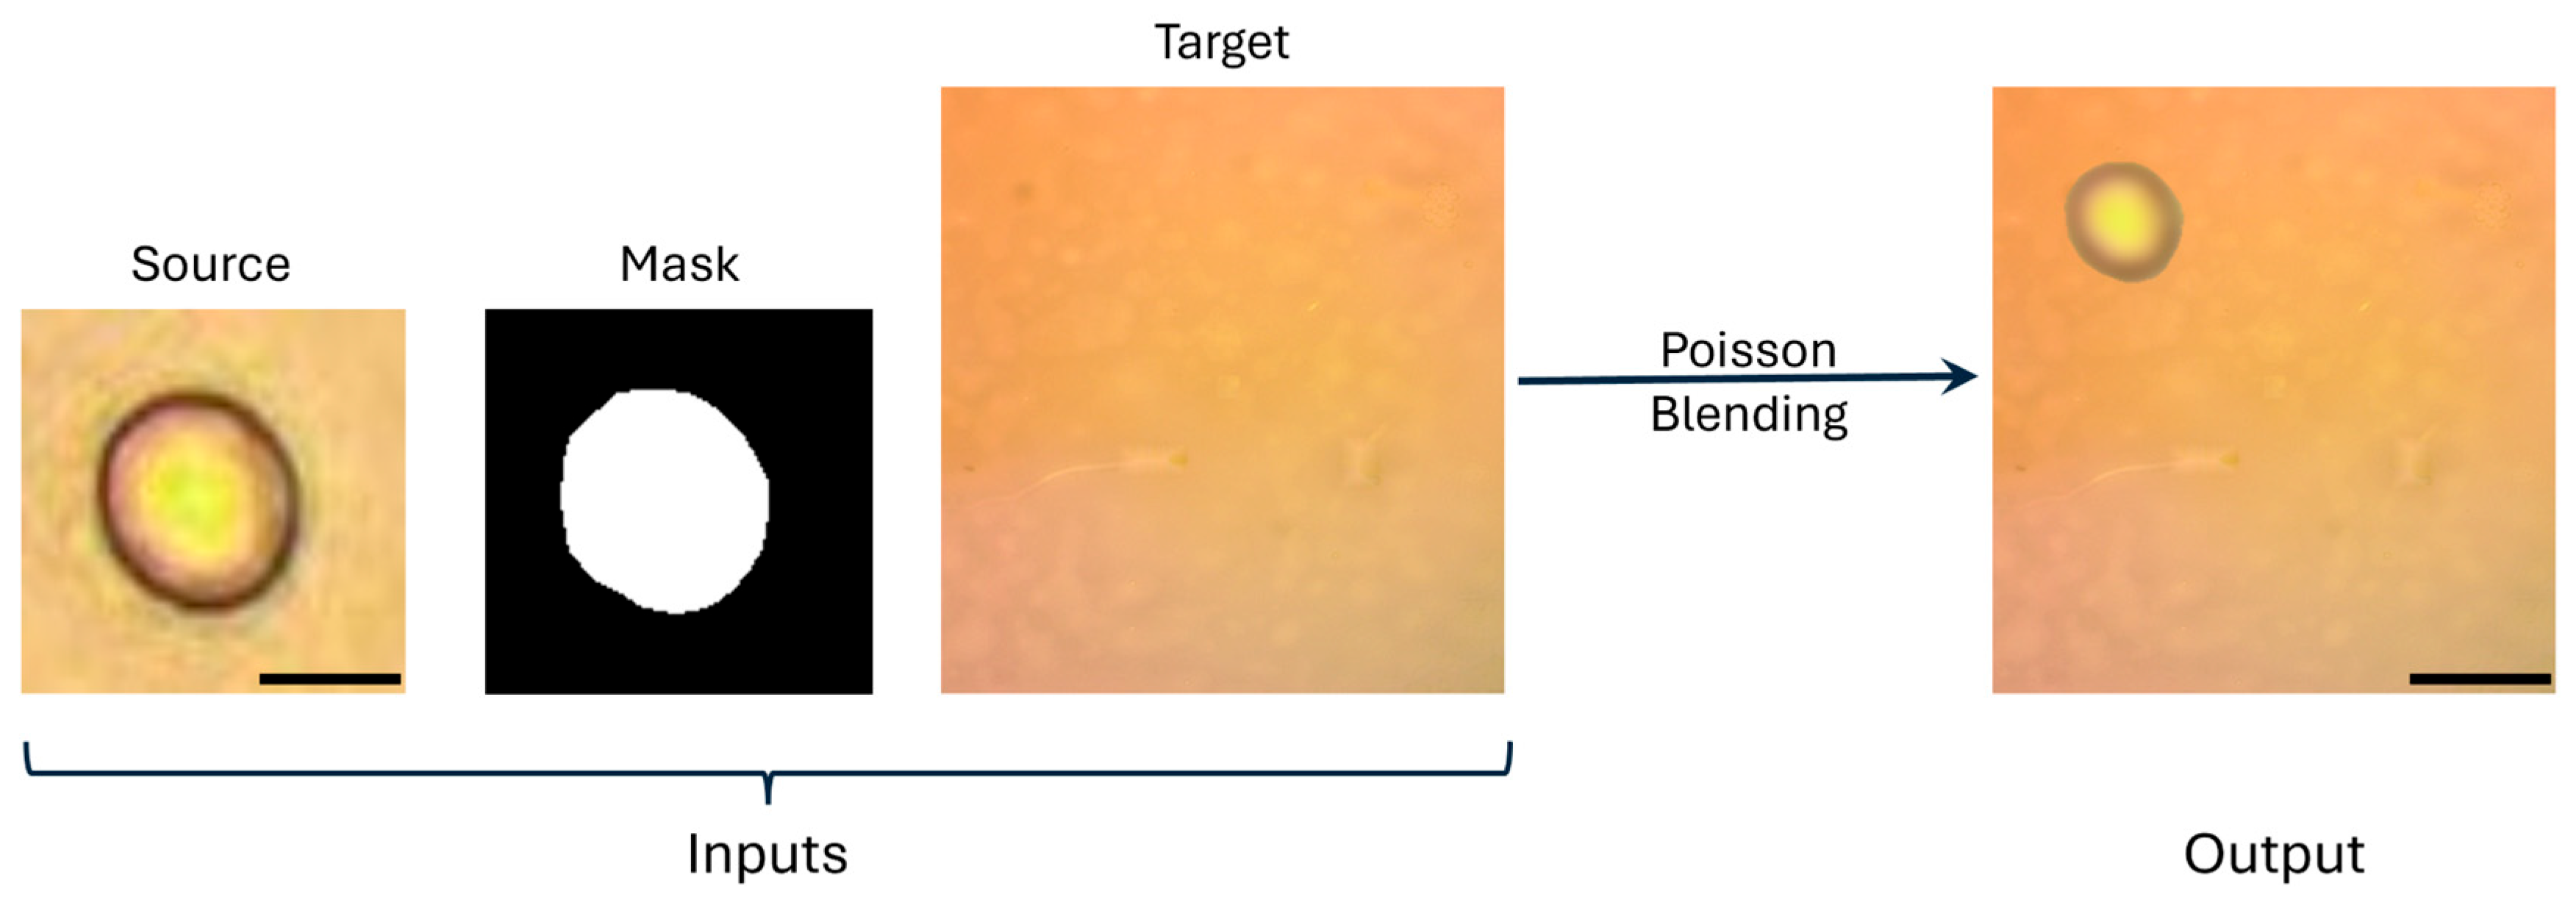
Augmented crops were inserted into clean background fields, also captured at 40×. We applied the Poisson blending technique because it is an image composition approach that preserves the local gradient structure of the inserted object while adapting to the illumination and texture of the background, avoiding visible seams [59]. Figure 3 shows this process that begins with a source image, obtained through manual annotation, consisting of cropped conidia extracted from images acquired using a 40× microscope objective. A target image is then used, also captured with a 40× objective. A binary mask defines the exact region of the conidium to be blended. The blending was performed using OpenCV (version 4.11.0) seamlessClone in NORMAL_CLONE mode with full-resolution masks, ensuring that inserted crops conformed to local intensity and texture variations in the background. To reduce boundary carry-over, masks were morphologically eroded with a disk structuring element of 3 pixels. To objectively validate the realism of these synthetic images, we computed two no-reference image quality metrics: NIQE (Natural Image Quality Evaluator) [60] and BRISQUE (Blind/Referenceless Image Spatial Quality Evaluator) [61]. In both metrics, lower scores correspond to higher visual naturalness and fewer artifacts.
3.
The centroid of each inserted conidium was randomly sampled, and proposals whose Intersection-over-Union (IoU) with previously placed instances exceeded a predefined threshold of 1% were discarded to prevent overlaps.
This procedure enabled each conidium to be represented in different orientations without introducing redundancy within a single synthetic image; that is, multiple insertions of the same conidium were avoided, even when presented with different rotations. The combination of variable orientations and random placement within the target image contributed to generating a more diverse, balanced, and representative dataset, thereby helping to optimize the training of the deep learning-based detection models.
Following this procedure, a total of 500 high-resolution synthetic images were generated, each containing between 5 and 15 conidia, with a total of 4984 labels. A balanced ratio between G and NG conidia was maintained. To assess realism, we compared NIQE and BRISQUE scores between original and synthetic images. Original real images achieved NIQE = 1.43 and BRISQUE = 0.0588, while the synthetic images obtained NIQE = 1.18 and BRISQUE = 0.0420. Since lower values in both metrics indicate higher quality and naturalness, these results confirm that the generated images are visually coherent and artifact-free. Furthermore, the Poisson blending process preserves the original spatial calibration, as shown by the scale bars in the figures.

2.3.4. Dataset Preparation and Subset Allocation

The dataset was divided into training, validation, and test subsets using a stratified random distribution to preserve class balance and reduce sampling bias.
As summarized in Table 1, the dataset contains 500 high-resolution microscopy images and 4984 labeled bounding boxes. The training set includes 400 images (80%) and 4006 boxes; the validation and test subsets contain 50 images each (10%), with 484 and 494 boxes, respectively. The split was performed at the synthetic image level, ensuring that no image is duplicated across subsets. We acknowledge that some individual conidial cutouts may be reused in different synthetic images assigned to separate subsets; however, each reuse occurs in a distinct visual context (backgrounds, positions, and rotations, with a non-overlap rule at IoU = 0.01), which minimizes pixel-level redundancy and significantly reduces the risk of data leakage. This distribution strategy provides sufficient data for model learning while preserving independent samples for validation and testing, supporting overfitting reduction and reliable evaluation across learning stages.

2.4. Single-Stage Detection Models

This study considered single-stage detection models because we intend to transfer this investigation into potential applications of automated tasks, specifically the one proposed in this work of determining the percentage of germination. These architectures were selected to avoid heavy computational models and to facilitate their potential transfer to embedded systems.
YOLOv8, YOLOv11 and RetinaNet were selected for evaluation in this study due to their representative characteristics in terms of overall accuracy (Mean Average Precision: mAP), inference speed, and model size, key factors for future deployment in embedded systems for agricultural applications. When used in the COCO dataset, YOLOv11 stands out for offering the highest inference speed (~250 FPS) while maintaining high accuracy (mAP50-95: 53.4%) and a moderate model size (~49 MB), making it particularly suitable for real-time tasks in resource-constrained environments [62]. YOLOv8 presents a more compact model (~87 MB) and competitive speed (~95 FPS), providing an efficient option for low-power devices without a major compromise in accuracy (mAP50-95: 52.9%) [63] RetinaNet, despite being larger (~146 MB), slower (~18 FPS), and less accurate (mAP50-95: 33.5%) “https://github.com/yhenon/pytorch-retinanet.git (accessed on 15 July 2025)” than YOLOv8 and YOLOv11, was included as a widely recognized baseline in object detection, enabling meaningful comparisons between traditional and more recent architectures (Table 2 summarizes these models’ features). The joint evaluation of these three models aims to identify the best trade-off between detection performance, computational efficiency, and deployment feasibility in embedded systems for smart agriculture.

2.4.1. YOLOv8

YOLOv8 is structured into three main stages: backbone, neck, and prediction (head). The initial backbone of alternating Conv and C2f (CrossStage Partial with two convolutions) blocks extracts hierarchical features while reducing computational load. These multiscale features flow into the neck, where up/downsampling, concatenation, and a SPPF (Spatial Pyramid PoolingFast) layer fuse context from different resolutions. Finally, the detection head outputs class probabilities and boundingbox offsets at three scales, enabling accurate localization of objects of varied size in one forward pass. The modular design balances accuracy with speed, making YOLOv8 well-suited for microscopy tasks. Figure 4 shows the general scheme for this architecture.

2.4.2. YOLOv11

YOLOv11 maintains the three-stage layout of the YOLO family but deepens the feature extractor. Its backbone replaces the C2f blocks of YOLOv8 with C3k2 modules (three-layer Cross-Stage Partial blocks with a 2 × 2 kernel) that increase representational depth without incurring extra latency. A lightweight SPPF layer supplies multi-scale context, while a C2PSA (Cross-Stage Partial with Spatial Attention) module highlights salient regions, a useful trait for sparse targets. The neck merges features at multiple resolutions through upsampling, concatenation, and additional C3k2 blocks, feeding a single-stage detection head that outputs class scores and bounding boxes. Figure 5 shows a diagram of this architecture.

2.4.3. RetinaNet

RetinaNet pairs a deep residual backbone with a top down Feature Pyramid Network (FPN) to address the large-scale variations common to object detection. In this model version, ResNet50 is adopted as the backbone: its successive Conv1–Conv5 stages yield feature maps of decreasing spatial size and increasing semantic richness. These maps feed the FPN, which first propagates high level context downward via lateral connections and then merges it with lower level features, producing a balanced set of multiscale representations (levels P3–P7). At each pyramid level, a lightweight prediction head applies parallel classification and boundingbox regression branches, enabling dense detection across scales in a single forward pass. RetinaNet’s focal loss optimization allows for competitive accuracy without the overhead proposal of other earlier detectors. Figure 6 shows the general structure of the model.

2.5. Evaluation Metrics

To evaluate the models for detecting germinated and non-germinated conidia, predictions are classified based on their accuracy. A true positive (TP) is recorded when the model detects a conidium with an IoU ≥ 0.5 relative to the ground truth annotation and correctly classifies it as either germinated or non-germinated. A false positive (FP) occurs when an object is detected that does not correspond to a conidium, or when a real conidium is detected but assigned to the wrong class. Finally, a false negative (FN) is recorded when the model fails to detect a conidium present in the image.
The metrics used to evaluate the models include: Precision (Equation (2)): measures the proportion of correctly detected conidia relative to the total number of predictions made; Recall (Equation (3)): indicates the percentage of conidia present in the image that were effectively detected by the model; F1 score (Equation (4)): represents the balance between precision and recall, calculated as their harmonic mean; IoU (Equation (5)): measures the degree of overlap between the predicted bounding box and the ground truth box, and is calculated as the area of their intersection divided by the area of their union. This is a key metric in object detection; mAP50 (Equation (6)): corresponds to the mean Average Precision is computed at an IoU threshold of 0.5, following the COCO evaluation protocol. This metric accounts for both the correct localization and classification of conidia.
P r e c i s i o n = T P T P + F P
R e c a l l = T P T P + F N .
F 1   s c o r e = 2 P r e c i s i o n R e c a l l P r e c i s i o n + R e c a l l .
I o U = A r e a   o f   i n t e r s e c t i o n A r e a   o f   u n i o n .
m A P 50 = 1 N i = 1 N A P 50 i ,  
where N represents the total number of classes and A P 50 is the precision for each class at an IoU of 0.5. As can be inferred from the equations, these metrics are dimensionless with normalized values between 0 and 1 range.

2.6. Transfer Learning and Training Protocol

All three detectors were finetuned under identical settings to ensure a fair comparison. We initialized each network with weights pretrained on COCO, then trained for 50 epochs with the AdamW optimizer (batch = 16) on an NVIDIAT4 GPU. Images were resized to 640 × 640 px and augmented in the HSV color space to improve robustness to illumination and color contrast variability. A cosine schedule (with warmup for YOLOv11) controlled the learning rate (LR) for the YOLO models, whereas RetinaNet followed a stepdecay policy. Binary Cross-Entropy (BCE) plus Complete Intersection over Union (CIoU) loss was used for YOLO detectors and focal loss for RetinaNet. Backbone choices reflect each framework’s reference design: a C2fbased network for YOLOv8, EfficientRep for YOLOv11, and ResNet50FPN for RetinaNet. Table 3 presents a summary of these conditions.
It should be noted that the original images were acquired at a resolution of 4096 × 3288 pixels (Section 2.3.1). For this project, two approaches were evaluated: resizing to 640 × 640, aiming to balance detail and model efficiency, and resizing to 1024 × 1024, in order to better preserve small objects. The experiments showed no differences in accuracy; therefore, 640 × 640 was adopted as the final resolution, providing an optimal balance between accuracy and computational efficiency.

3. Results

3.1. Training and Validation Results

Figure 7 shows the evolution of the evaluation metrics for the three models throughout the training epochs. YOLOv8 and YOLOv11 outperform RetinaNet across all evaluated metrics. Both YOLO models achieve higher precision, F1 score, and mAP50 in fewer epochs than RetinaNet. The YOLOv8 model exhibits more stable performance, particularly in terms of precision and mAP50.
Figure 8 presents the confusion matrix for each of the models evaluated in this study. The confusion matrices allow for the evaluation of the performance of detection and classification models applied to G and NG conidia. These matrices show how the system classifies each type of conidium in comparison to the ground truth labels.
The YOLOv8 and YOLOv11 models demonstrate high performance, with correct classification rates exceeding 96% for both G and NG conidia. Notably, YOLOv11 achieves the highest precision in identifying G conidia, with a minimal false negative rate. RetinaNet model shows lower performance in classifying both G and NG conidia.

3.2. Test of the Models for Conidium Detection

The evaluation results of the models on the test dataset using the defined evaluation metrics are summarized in Table 4.
As shown in Table 4, YOLOv11 outperforms both YOLOv8 and RetinaNet across nearly all metrics, achieving the highest F1 scores (0.988 for G and 0.995 for NG), the best IoU values (0.968 and 0.950), and a top AP50 of 0.998 for G class. Inference time is also in its favor, with YOLOv11 running slightly faster than YOLOv8 (0.1443 s vs. 0.1556 s) and dramatically faster than RetinaNet (3.83 s). While RetinaNet shows competitive mAP and recall, it lags in localization accuracy (IoU) and precision, especially for the NG class. As shown by the training evaluation metrics, these results also highlight the superiority of YOLO models in detection and classification tasks based on the features extracted from microscopy images.
More specifically, given its superior accuracy and efficiency, although the magnitude of improvement over YOLOv8 is small, we consider YOLOv11 the most suitable model for our intended deployment, because of its reduced model size, ensuring high detection performance with less processing time and less hardware demands that is key for real-time or large-scale image analysis.

3.3. Germination Percentage Estimation and Comparison with the Manual Approach

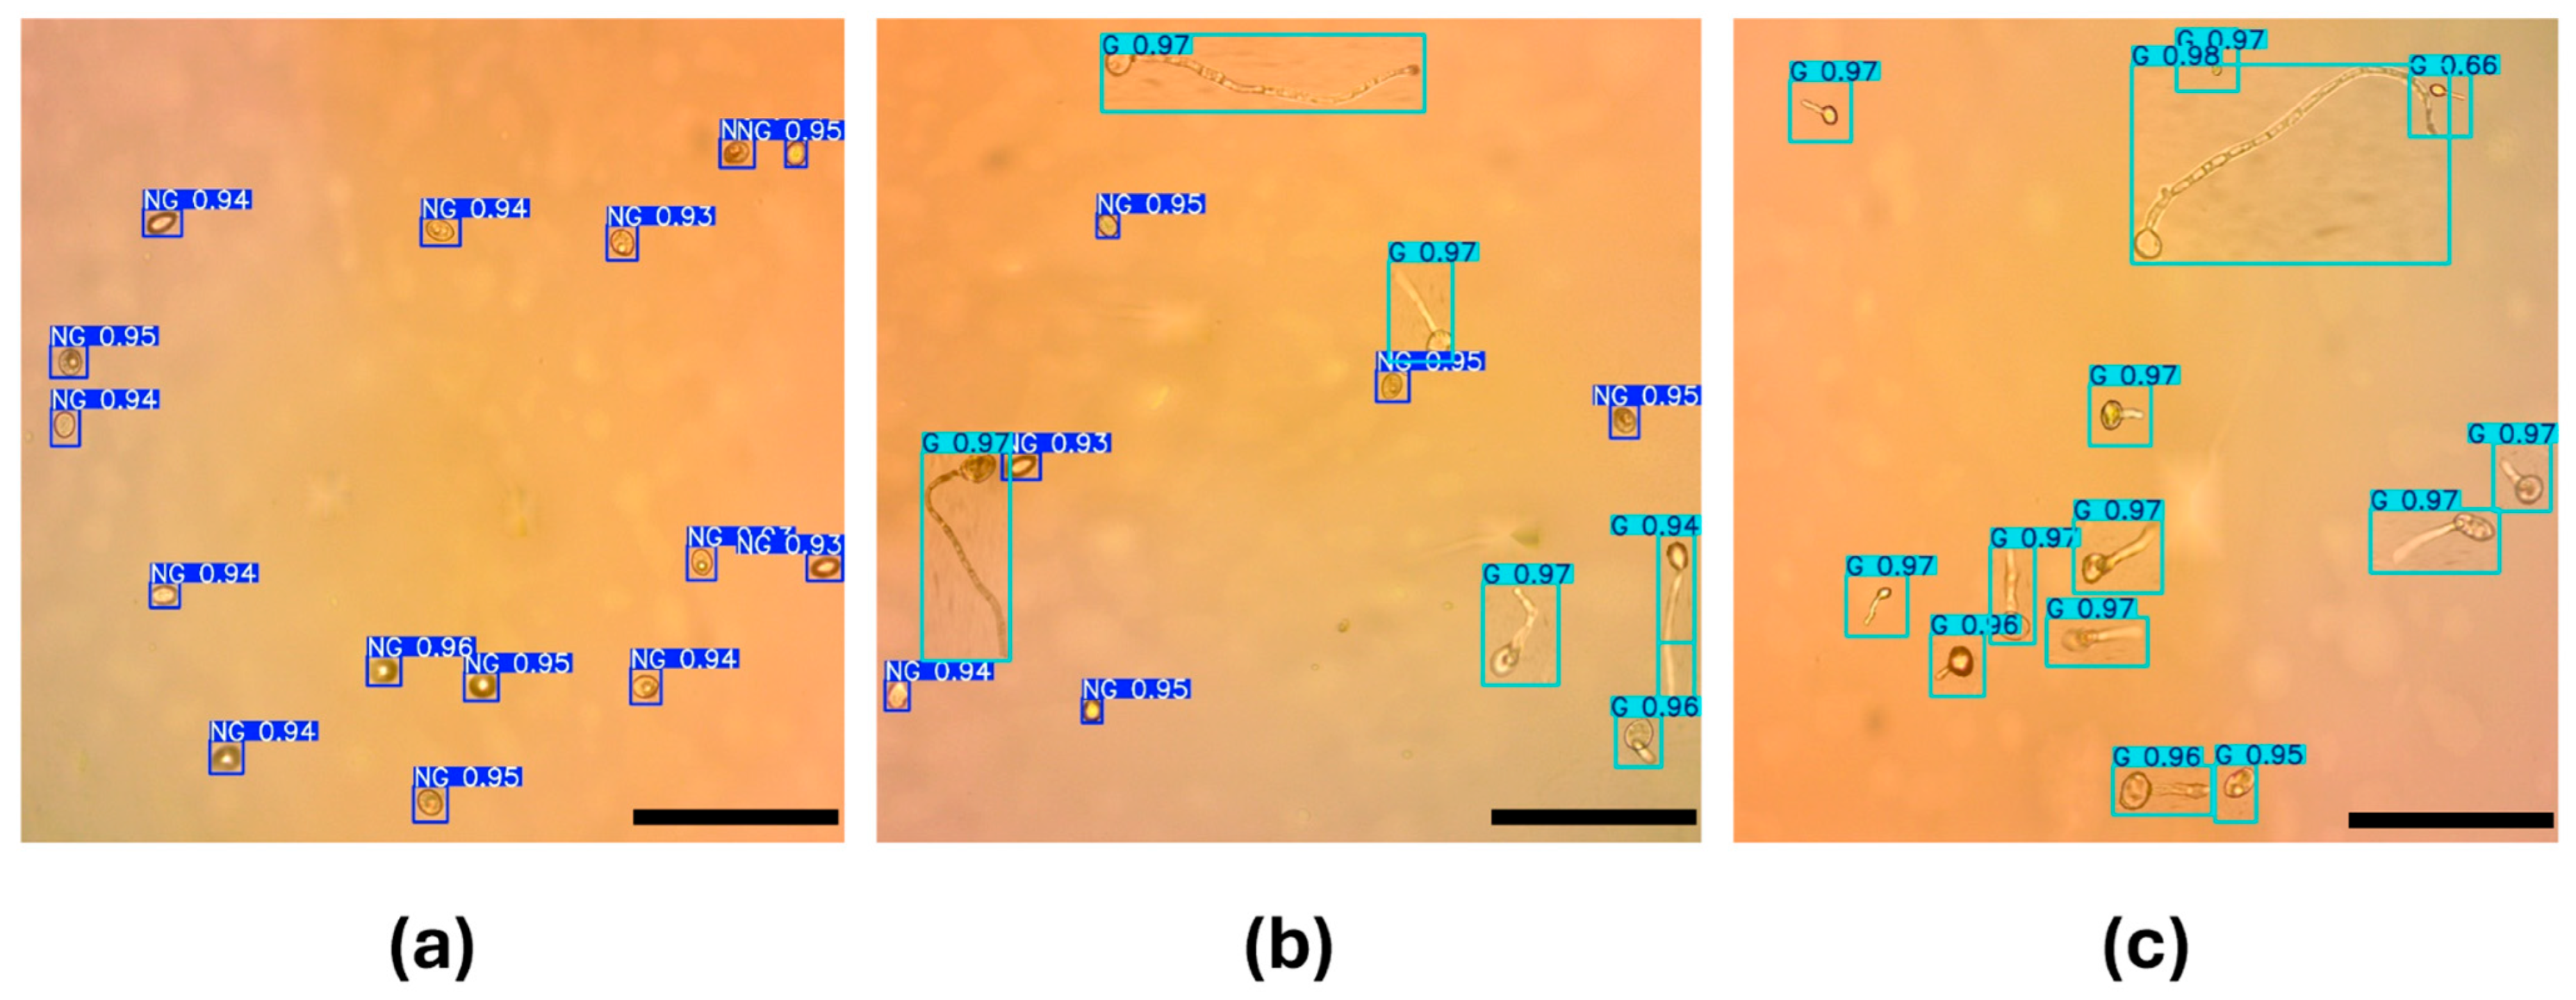
To automatically estimate the germination percentage, the YOLOv11 model was applied to images corresponding to three experimental groups: two subjected to UV-C radiation treatments (1080 J·m−2 and 810 J·m−2), and one untreated control group (0 J·m−2). Figure 9 shows a representative example of the model’s performance on an image from each of these three groups. In each case, the model’s predictions for the two conidium classes are displayed, allowing for an assessment of its detection capability under different experimental conditions and, consequently, of its potential to automatically estimate the germination percentage.
The results presented in Figure 9 demonstrate that YOLOv11 provides accurate and consistent performance in detecting G and NG conidia. The model maintains appropriate detection even under challenging conditions; however, some errors are observed: in Figure 9c, the model detects an NG conidium as a G conidium (false positive), as could be expected from the confusion matrix results (Figure 8b).
Table 5 presents the germination percentage of each data group obtained through manual counting, alongside the germination percentage estimated by the YOLOv11 model. Using the numerical results of the model detection (number of NG and G conidia), the percentage of germination is calculated automatically as the rate 100 × G / ( N G + G ) . To validate the efficiency of automatic detection in comparison to the conventional method, we assumed that the manual counting is the ground truth reference for comparison and error calculation. The Root Mean Squared Error (RMSE) was used to compare the manually obtained results with those generated by YOLOv11.
The RMSE values in Table 5 further support the model’s reliability in estimating germination percentages. For the group exposed to 1080 J·m−2 of UV-C radiation, the RMSE is 0.17%, indicating an almost perfect match between the model prediction and the manual count. In the group treated with 810 J·m−2, the RMSE is 3.07%, reflecting only a minimal discrepancy. The control group (0 J·m−2) yields a higher RMSE of 8.72%, suggesting a slight overestimation of germinated conidia by the model. This is probably because the false positives are mainly found in G detection rather than in NG, due to some difficulties where one germ tube could be detected as belonging to two different cells if they are superposed or too close to each other. Despite this, the estimated value remains close to the manual measurement, confirming the robustness of YOLOv11 across different germination levels, even though it was finetuned on a synthetic dataset, and its suitability for practical applications and deployment.
The model weights of the trained YOLOv11 architecture, together with an inference example, are available in a public repository “https://github.com/LuisGomez-Meneses/Botrytis-Germination-TL.git (accessed on 26 July 2025)”.

4. Discussion

Manual cell counting has traditionally been employed for estimating germination percentages in fungal research. However, numerous studies have emphasized its inherent limitations, including time consumption, susceptibility to human error, and high inter-observer variability [42,44,50]. Recent advancements in computer vision and artificial intelligence have demonstrated that automated systems not only outperform manual methods in terms of accuracy and reproducibility but also enable high-throughput analysis essential in biological and agricultural research [51]. However, their performance is influenced by the composition and representativeness of the synthetic datasets used for training, which should be considered when interpreting results.
In our study, we evaluated a range of UV-C doses to induce varying states of conidial germination. A clear dose–response relationship was observed, with increasing UV-C intensity resulting in progressively lower germination percentages. These findings confirm the potential of UV-C radiation as a dose-dependent antifungal strategy. Several studies have previously demonstrated the efficacy of UV-C in inhibiting Botrytis cinerea spore germination under in vitro conditions. Even brief exposures can significantly reduce germination, depending on the dose [17,18,19,20,21,22,23,25,27]. For example, UV-C exposure effectively inhibited the germination of Botrytis cinerea, Fusarium oxysporum, and Alternaria alternata, providing pathogen control without leaving toxic residues in soil or water [64]. Furthermore, postharvest studies demonstrated that UV-C applications can significantly reduce decay and suppress Botrytis cinerea infections in fruits such as apples and grapes, achieving control levels comparable to fungicides but without chemical residues [15]. These findings reinforce UV-C as a residue-free and eco-friendly strategy that aligns with sustainable crop protection. Our results are consistent with previous literature and support the integration of UV-C as a non-chemical alternative for rapid screening and gray mold control, although economic feasibility and scalability still require further evaluation.
Under identical training conditions: 50 epochs, AdamW optimizer, batch size 16 and 640 × 640 pixel inputs on an NVIDIA T4 GPU, the three detectors converged at different rates but achieved high accuracy. YOLOv11 yielded the highest mAP50 of 0.997 and average F1-score of 0.992 on the heldout test set, with an average inference time of 144 ms per image. YOLOv8 attained a comparable mAP50 of 0.992 and average F1 = 0.980, while processing an image in 156 ms. RetinaNet matched YOLOv11 in mAP50 (0.997) but lagged in average F1 at 0.962 and required 3.83 s per frame. These results confirm YOLOv11’s optimal balance of speed and accuracy for real-time viability screening, position YOLOv8 as a lighter alternative, and relegate RetinaNet. These findings support the growing consensus that YOLO architectures, especially those versions with optimizations, offer a solution for automated fungal cell counting under constraints of high speed and high performance inference.
The comparative analysis with manual counts further supports the reliability of YOLOv11 for germination estimation. The RMSE values in UV-C treated groups were notably low—0.17% for the 1080 J·m−2 condition and 3.07% for the 810 J·m−2 group—indicating a high agreement between automated and manual measurements. Even in the control group (0 J·m−2), where germination was highest, the RMSE remained within a tolerable range at 8.72%, despite a slight overestimation of the model. These discrepancies are comparatively lower or like those reported in recent studies applying deep learning models for detection and quantification tasks in agriculture. For instance, one study reported an RMSE of 0.33% in impurity rate detection for machine-picked seed cotton using Cotton-YOLO-Seg [65], while another found YOLO-based germination classification in soybean seeds yielded prediction errors ranging from 0 to 0.110 using MSE as the metric [55]. Additionally, another investigation demonstrated high correlations between manual and automated flower counts in rapeseed using GhP2-YOLO [66]. Although these studies target different biological structures and tasks, the results underline YOLO’s versatility and robustness in agricultural applications. Other studies have found that manual counting of germinated seeds and fungal conidia is time-consuming and subjective, often leading to discrepancies between operators when distinguishing individual spores, especially in clustered or overlapping samples [43,44,45]. In large-scale assays, weak or partially emerged radicles may be overlooked and overlapping conidia registered as single units, while operator fatigue further increases errors; similar observer-dependent variability has also been reported in pathology, where manual cellularity estimation shows significant inconsistencies across examiners [42,54,56].
Recent advances in deep learning have significantly enhanced the determination of germination states in both fungal and plant systems. Mask R-CNN has been successfully used to detect and classify germinated pollen grains while measuring pollen tube length [53]. Similarly, Faster R-CNN has been applied in grain crops to compute key germination indices such as Mean Germination Time and Germination Uncertainty [56]. In legume crops, YOLOv8 achieved 95% accuracy in distinguishing germinated from non-germinated soybean seeds, demonstrating high precision and low prediction error [55]. In our study, three single-pass object detection models—YOLOv8, YOLOv11, and RetinaNet—were evaluated. The results clearly indicate that YOLO-based models offer shorter inference times and higher accuracy in detecting germinated and non-germinated fungal conidia. Conversely, RetinaNet exhibited inferior performance, with lower detection accuracy and significantly slower inference times.

Limitations and Sources of Error

Our training set was ultimately seeded by 30 real microscopic images obtained under controlled conditions. Although this design simplifies ground truth, it constrains natural variation. As a result, rare morphologies (e.g., multiple short germ tubes, collapsed spores) may be under-represented, which can bias detector confidence on atypical cases.
The images were acquired with a single optical chain (Olympus CX33, 40× objective, AmScope MU130). Field conditions could imply variable conditions that could affect detector performance. Some procedures like Flat-field correction, white-balance standardization, and the use of reference targets would be advisable for field deployment.
We used Poisson blending to generate 500 full-resolution synthetic images from cropped, labeled conidia, and we objectively compared synthetic versus original image realism using NIQE/BRISQUE, which yielded lower (better) scores for the synthetic set, indicating minimal visible artifacts. Even so, synthetic pipelines can still transfer subtle biases. To mitigate leakage, we split data at the image level and enforced non-overlap and diverse contexts; while individual crops can reappear across synthetic images, they do so against different backgrounds, positions, and rotations, which reduces pixel-level redundancy and supports independent evaluation.
The reliance on a modest real dataset (60 images total; 30 used to seed training) limits immediate generalizability, despite the strong internal test performance and fast inference of YOLOv11 (e.g., high F1/AP with ~0.144 s per image). We therefore plan to: collect multi-site, multi-strain real images spanning additional hosts and growth conditions; and extend the synthetic pipeline with domain randomization (illumination, noise, focus) and rare-morphology priors.
Transitioning from bench microscopy to field monitoring introduces scale drift, scene clutter, partial occlusions, and motion. Practical mitigations include tiling with overlap for large FOVs, focus stacking or shallow-depth cues, color/illumination calibration, and small on-device models (quantized YOLO) to keep latency compatible with scouting. Our current detector choice (YOLOv11) already showed favorable speed/accuracy in the lab, supporting feasibility for real-time or near-real-time scenarios with appropriate domain adaptation.

5. Conclusions

We introduced an automated pipeline to detect Botrytis cinerea conidia and estimate germination percentages directly from microscopy images, achieving high accuracy and fast inference with YOLOv11 relative to alternatives, which supports practical, high-throughput analysis in laboratory settings. The approach leverages a synthetic image workflow (Poisson blending) validated with NIQE/BRISQUE metrics to augment a limited real dataset, while adopting split and non-overlap policies to reduce leakage.
The comparison with manual counts confirmed the reliability of the YOLOv11 model, with low RMSE values, particularly in the groups treated with UV-C radiation. These results support its use as an automated tool for the rapid and objective assessment of germination percentage, representing an advantage over traditional methods.
Finally, the implementation of this computer vision and deep learning-based approach provides a scalable framework for in vitro germination studies, with potential for adaptation to other fungal or agricultural systems. Its integration into evaluation protocols could accelerate other antifungal strategies, such as the use of UV-C radiation, contributing to a more sustainable and efficient management of diseases.

Author Contributions

Conceptualization, J.C.Q. and L.F.P.; methodology, J.C.Q. and J.H.-R.; software, A.P., A.S. and L.M.G.-M.; validation, L.M.G.-M., J.C.Q. and J.H.-R.; formal analysis, L.M.G.-M., J.C.Q. and J.H.-R.; investigation, A.P., A.S., L.F.P., J.C.Q. and J.H.-R.; data curation, J.C.Q. and J.H.-R.; writing—original draft preparation, A.P., J.C. and J.C.Q.; writing—review and editing, J.C., J.C.Q. and J.H.-R.; visualization, L.M.G.-M. and J.H.-R.; supervision, J.C., J.C.Q. and J.H.-R. All authors have read and agreed to the published version of the manuscript.

Funding

This research received no external funding.

Institutional Review Board Statement

The fungal strain used in this study was obtained from post-harvest cut roses (variety MovieStar, provided by Inversiones Coquette S.A., Medellín, Colombia).

Informed Consent Statement

Not applicable.

Data Availability Statement

The data presented in this study are available on request from the corresponding author.

Conflicts of Interest

The authors declare no conflicts of interest.

References

  1. Deshpande, D.; Chhugani, K.; Ramesh, T.; Pellegrini, M.; Shiffman, S.; Abedalthagafi, M.S.; Alqahtani, S.; Ye, J.; Liu, X.S.; Leek, J.T.; et al. The Evolution of Computational Research in a Data-Centric World. Cell 2024, 187, 4449–4457. [Google Scholar] [CrossRef]
  2. Andersen, L.K.; Reading, B.J. A Supervised Machine Learning Workflow for the Reduction of Highly Dimensional Biological Data. Artif. Intell. Life Sci. 2024, 5, 100090. [Google Scholar] [CrossRef]
  3. Reddy, G.S.; Manoj, S.; Reddy, K. Leveraging Machine Learning Techniques in Agriculture: Applications, Challenges, and Opportunities. J. Exp. Agric. Int. 2025, 47, 43–57. [Google Scholar] [CrossRef]
  4. Xu, C.; Jackson, S.A. Machine Learning and Complex Biological Data The Revolution of Biological Techniques and Demands for New Data Mining Methods. Genome Biol. 2019, 20, 76. [Google Scholar] [CrossRef]
  5. Aijaz, N.; Lan, H.; Raza, T.; Yaqub, M.; Iqbal, R.; Pathan, M.S. Artificial Intelligence in Agriculture: Advancing Crop Productivity and Sustainability. J. Agric. Food Res. 2025, 20, 101762. [Google Scholar] [CrossRef]
  6. Dean, R.; Van Kan, J.A.L.; Pretorius, Z.A.; Hammond-Kosack, K.E.; Di Pietro, A.; Spanu, P.D.; Rudd, J.J.; Dickman, M.; Kahmann, R.; Ellis, J.; et al. The Top 10 Fungal Pathogens in Molecular Plant Pathology. Mol. Plant Pathol. 2012, 13, 414–430. [Google Scholar] [CrossRef] [PubMed]
  7. Cheung, N.; Tian, L.; Liu, X.; Li, X. The Destructive Fungal Pathogen Botrytis cinerea—Insights from Genes Studied with Mutant Analysis. Pathogens 2020, 9, 923. [Google Scholar] [CrossRef]
  8. Elad, Y.; Williamson, B.; Tudzynski, P.; Delen, N. Botrytis: Biology, Pathology and Control; SpringerNature: Berlin, Germany, 2007; pp. 1–403. [Google Scholar] [CrossRef]
  9. Orozco-mosqueda, M.C.; Kumar, A.; Fadiji, A.E.; Babalola, O.O.; Puopolo, G.; Santoyo, G. Agroecological Management of the Grey Mould Fungus. Plants 2023, 12, 637. [Google Scholar] [CrossRef]
  10. Iwaniuk, P.; Lozowicka, B. Biochemical Compounds and Stress Markers in Lettuce upon Exposure to Pathogenic Botrytis cinerea and Fungicides Inhibiting Oxidative Phosphorylation. Planta 2022, 255, 61. [Google Scholar] [CrossRef] [PubMed]
  11. Darras, A.I.; Joyce, D.C.; Terry, L.A. Postharvest UV-C Irradiation on Cut Freesia Hybrida, L. Inflorescences Suppresses Petal Specking Caused by Botrytis cinerea. Postharvest. Biol. Technol. 2010, 55, 186–188. [Google Scholar] [CrossRef]
  12. Marquenie, D.; Lammertyn, J.; Geeraerd, A.H.; Soontjens, C.; Van Impe, J.F.; Nicola, B.M.; Michiels, C.W. Inactivation of Conidia of Botrytis cinerea and Monilinia Fructigena Using UV-C and Heat Treatment. Int. J. Food Microbiol. 2002, 74, 27–35. [Google Scholar] [CrossRef]
  13. Marquenie, D.; Geeraerd, A.H.; Lammertyn, J.; Soontjens, C.; Van Impe, J.F.; Michiels, C.W.; Nicolaï, B.M. Combinations of Pulsed White Light and UV-C or Mild Heat Treatment to Inactivate Conidia of Botrytis cinerea and Monilia Fructigena. Int. J. Food Microbiol. 2003, 85, 185–196. [Google Scholar] [CrossRef]
  14. Pan, J.; Vicente, A.R.; Martínez, G.A.; Chaves, A.R.; Civello, P.M. Combined Use of UV-C Irradiation and Heat Treatment to Improve Postharvest Life of Strawberry Fruit. J. Sci. Food Agric. 2004, 84, 1831–1838. [Google Scholar] [CrossRef]
  15. Janisiewicz, W.J.; Takeda, F.; Glenn, D.M.; Camp, M.J.; Jurick, W.M. Dark Period Following UV-C Treatment Enhances Killing of Botrytis cinerea Conidia and Controls Gray Mold of Strawberries. Phytopathology 2016, 106, 386–394. [Google Scholar] [CrossRef] [PubMed]
  16. Jin, P.; Wang, H.; Zhang, Y.; Huang, Y.; Wang, L.; Zheng, Y. UV-C Enhances Resistance against Gray Mold Decay Caused by Botrytis cinerea in Strawberry Fruit. Sci. Hortic. 2017, 225, 106–111. [Google Scholar] [CrossRef]
  17. Mercier, J.; Roussel, D.; Charles, M.-T.; Arul, J. Systemic and Local Responses Associated with UV- and Pathogen-Induced Resistance to Botrytis cinerea in Stored Carrot. Phytopathology 2000, 90, 981–986. [Google Scholar] [CrossRef] [PubMed][Green Version]
  18. Mercier, J.; Baka, M.; Reddy, B.; Corcuff, R.; Arul, J. Shortwave Ultraviolet Irradiation for Control of Decay Caused by Botrytis cinerea in Bell Pepper: Induced Resistance and Germicidal Effects. J. Am. Soc. Hortic. Sci. 2001, 126, 128–133. [Google Scholar] [CrossRef]
  19. Charles, M.T.; Makhlouf, J.; Arul, J. Physiological Basis of UV-C Induced Resistance to Botrytis cinerea in Tomato Fruit. II. Modification of Fruit Surface and Changes in Fungal Colonization. Postharvest. Biol. Technol. 2008, 47, 21–26. [Google Scholar] [CrossRef]
  20. Charles, M.T.; Benhamou, N.; Arul, J. Physiological Basis of UV-C Induced Resistance to Botrytis cinerea in Tomato Fruit. III. Ultrastructural Modifications and Their Impact on Fungal Colonization. Postharvest. Biol. Technol. 2008, 47, 27–40. [Google Scholar] [CrossRef]
  21. Charles, M.T.; Goulet, A.; Arul, J. Physiological Basis of UV-C Induced Resistance to Botrytis cinerea in Tomato Fruit. IV. Biochemical Modification of Structural Barriers. Postharvest. Biol. Technol. 2008, 47, 41–53. [Google Scholar] [CrossRef]
  22. Charles, M.T.; Tano, K.; Asselin, A.; Arul, J. Physiological Basis of UV-C Induced Resistance to Botrytis cinerea in Tomato Fruit. V. Constitutive Defence Enzymes and Inducible Pathogenesis-Related Proteins. Postharvest. Biol. Technol. 2009, 51, 414–424. [Google Scholar] [CrossRef]
  23. Nigro, F.; Ippolito, A.; Lima, G. Use of UV-C to Reduce Storage Rot of Table Grapes. Postharvest. Biol. Technol. 1998, 13, 171–181. [Google Scholar] [CrossRef]
  24. Ouhibi, C.; Attia, H.; Nicot, P.; Lecompte, F.; Vidal, V.; Lachaâl, M.; Urban, L.; Aarrouf, J. Effects of Nitrogen Supply and of UV-C Irradiation on the Susceptibility of Lactuca Sativa L to Botrytis cinerea and Sclerotinia Minor. Plant Soil. 2015, 393, 35–46. [Google Scholar] [CrossRef]
  25. Vega, K.; Ochoa, S.; Patiño, L.F.; Herrera-Ramírez, J.A.; Gómez, J.A.; Quijano, J.C. UV-C Radiation for Control of Gray Mold Disease in Postharvest Cut Roses. J. Plant Prot. Res. 2020, 60, 351–361. [Google Scholar] [CrossRef]
  26. Valencia, M.A.; Patiño, L.F.; Herrera-Ramírez, J.A.; Castañeda, D.A.; Gómez, J.A.; Quijano, J.C. Using UV-C Radiation and Image Analysis for Fungus Control in Tomato Plants. Opt. Pura Y Apl. 2017, 50, 369–378. [Google Scholar] [CrossRef]
  27. Cucu, M.A.; Choudhary, R.; Trkulja, V.; Garg, S.; Matić, S. Utilizing Environmentally Friendly Techniques for the Sustainable Control of Plant Pathogens: A Review. Agronomy 2025, 15, 1551. [Google Scholar] [CrossRef]
  28. Nassr, S. Effect of Factors on Conidium Germination of Botrytis cinerea in Vitro. Int. J. Plant Soil. Sci. 2013, 2, 41–54. [Google Scholar] [CrossRef]
  29. Uddin, M.J.; Huang, X.; Lu, X.; Li, S. Increased Conidia Production and Germination In Vitro Correlate with Virulence Enhancement in Fusarium Oxysporum f. Sp. Cucumerinum. J. Fungi. 2023, 9, 847. [Google Scholar] [CrossRef]
  30. Lopes, R.B.; Martins, I.; Souza, D.A.; Faria, M. Influence of Some Parameters on the Germination Assessment of Mycopesticides. J. Invertebr. Pathol. 2013, 112, 236–242. [Google Scholar] [CrossRef]
  31. Waqas, M.; Naseem, A.; Humphries, U.W.; Hlaing, P.T.; Dechpichai, P.; Wangwongchai, A. Applications of Machine Learning and Deep Learning in Agriculture: A Comprehensive Review. Green Technol. Sustain. 2025, 3, 100199. [Google Scholar] [CrossRef]
  32. Ballena-Ruiz, J.; Arcila-Diaz, J.; Tuesta-Monteza, V. Automated Detection and Counting of Gossypium Barbadense Fruits in Peruvian Crops Using Convolutional Neural Networks. AgriEngineering 2025, 7, 152. [Google Scholar] [CrossRef]
  33. Huang, T.-S.; Wang, K.; Ye, X.-Y.; Chen, C.-S.; Chang, F.-C. Attention-Guided Transfer Learning for Identification of Filamentous Fungi Encountered in the Clinical Laboratory. Microbiol. Spectr. 2023, 11, e0461122. [Google Scholar] [CrossRef]
  34. Zhou, H.; Lai, Q.; Huang, Q.; Cai, D.; Huang, D.; Wu, B. Automatic Detection of Rice Blast Fungus Spores by Deep Learning-Based Object Detection: Models, Benchmarks and Quantitative Analysis. Agriculture 2024, 14, 290. [Google Scholar] [CrossRef]
  35. Zieliski, B.; Sroka-Oleksiak, A.; Rymarczyk, D.; Piekarczyk, A.; Brzychczy-Woch, M. Deep Learning Approach to Describe and Classify Fungi Microscopic Images. PLoS ONE 2020, 15, e0234806. [Google Scholar] [CrossRef]
  36. Attri, I.; Awasthi, L.K.; Sharma, T.P.; Rathee, P. A Review of Deep Learning Techniques Used in Agriculture. Ecol. Inform. 2023, 77, 102217. [Google Scholar] [CrossRef]
  37. Hossen, M.I.; Awrangjeb, M.; Pan, S.; Mamun, A. Al Transfer Learning in Agriculture: A Review. Artif. Intell. Rev. 2025, 58, 97. [Google Scholar] [CrossRef]
  38. Chen, J.; Chen, J.; Zhang, D.; Sun, Y.; Nanehkaran, Y.A. Using Deep Transfer Learning for Image-Based Plant Disease Identification. Comput. Electron. Agric. 2020, 173, 105393. [Google Scholar] [CrossRef]
  39. Shoaib, M.; Sadeghi-Niaraki, A.; Ali, F.; Hussain, I.; Khalid, S. Leveraging Deep Learning for Plant Disease and Pest Detection: A Comprehensive Review and Future Directions. Front. Plant Sci. 2025, 16, 1538163. [Google Scholar] [CrossRef]
  40. Pacal, I.; Kunduracioglu, I.; Alma, M.H.; Deveci, M.; Kadry, S.; Nedoma, J.; Slany, V.; Martinek, R. A Systematic Review of Deep Learning Techniques for Plant Diseases. Artif. Intell. Rev. 2024, 57, 304. [Google Scholar] [CrossRef]
  41. Bharman, P.; Ahmad Saad, S.; Khan, S.; Jahan, I.; Ray, M.; Biswas, M. Deep Learning in Agriculture: A Review. Asian J. Res. Comput. Sci. 2022, 13, 28–47. [Google Scholar] [CrossRef]
  42. Kiyuna, T.; Cosatto, E.; Hatanaka, K.C.; Yokose, T.; Tsuta, K.; Motoi, N.; Makita, K.; Shimizu, A.; Shinohara, T.; Suzuki, A.; et al. Evaluating Cellularity Estimation Methods: Comparing AI Counting with Pathologists’ Visual Estimates. Diagnostics 2024, 14, 1115. [Google Scholar] [CrossRef]
  43. Xie, W.; Noble, J.A.; Zisserman, A. Microscopy Cell Counting and Detection with Fully Convolutional Regression Networks. Comput. Methods Biomech. Biomed. Eng. Imaging Vis 2018, 6, 283–292. [Google Scholar] [CrossRef]
  44. Li, C.; Ma, X.; Deng, J.; Li, J.; Liu, Y.; Zhu, X.; Liu, J.; Zhang, P. Machine Learning-Based Automated Fungal Cell Counting under a Complicated Background with Ilastik and ImageJ. Eng. Life Sci. 2021, 21, 769–777. [Google Scholar] [CrossRef]
  45. Patakvölgyi, V.; Kovács, L.; Drexler, D.A. Artificial Neural Networks Based Cell Counting Techniques Using Microscopic Images: A Review. In Proceedings of the 2024 IEEE 18th International Symposium on Applied Computational Intelligence and Informatics (SACI), Timisoara, Romania, 23–25 May 2024; pp. 327–332. [Google Scholar] [CrossRef]
  46. Aldughayfiq, B.; Ashfaq, F.; Jhanjhi, N.Z.; Humayun, M. YOLOv5-FPN: A Robust Framework for Multi-Sized Cell Counting in Fluorescence Images. Diagnostics 2023, 13, 2280. [Google Scholar] [CrossRef]
  47. Emre Dedeagac, C.; Koyuncu, C.F.; Adams, M.M.; Edemen, C.; Ugurdag, B.C.; Ilgim Ardic-Avci, N.; Fatih Ugurdag, H. A Guided-Ensembling Approach for Cell Counting in Fluorescence Microscopy Images. IEEE Access 2024, 12, 1. [Google Scholar] [CrossRef]
  48. Berg, S.; Kutra, D.; Kroeger, T.; Straehle, C.N.; Kausler, B.X.; Haubold, C.; Schiegg, M.; Ales, J.; Beier, T.; Rudy, M.; et al. Ilastik: Interactive Machine Learning for (Bio)Image Analysis. Nat. Methods 2019, 16, 1226–1232. [Google Scholar] [CrossRef]
  49. Li, K.; Zhu, X.; Qiao, C.; Zhang, L.; Gao, W.; Wang, Y. The Gray Mold Spore Detection of Cucumber Based on Microscopic Image and Deep Learning. Plant Phenomics 2023, 5, 0011. [Google Scholar] [CrossRef] [PubMed]
  50. Lei, Y.; Yao, Z.; He, D. Automatic Detection and Counting of Urediniospores of Puccinia Striiformis f. Sp. Tritici Using Spore Traps and Image Processing. Sci. Rep. 2018, 8, 13647. [Google Scholar] [CrossRef] [PubMed]
  51. Zhao, Y.; Liu, S.; Hu, Z.; Bai, Y.; Shen, C.; Shi, X. Separate Degree Based Otsu and Signed Similarity Driven Level Set for Segmenting and Counting Anthrax Spores. Comput. Electron. Agric. 2020, 169, 105230. [Google Scholar] [CrossRef]
  52. Zhao, E.; Zhao, H.; Liu, G.; Jiang, J.; Zhang, F.; Zhang, J.; Luo, C.; Chen, B.; Yang, X. Automated Recognition of Conidia of Nematode-Trapping Fungi Based on Improved YOLOv8. IEEE Access 2024, 12, 81314–81328. [Google Scholar] [CrossRef]
  53. Zhang, M.; Zhao, J.; Hoshino, Y. Deep Learning-Based High-Throughput Detection of in Vitro Germination to Assess Pollen Viability from Microscopic Images. J. Exp. Bot. 2023, 74, 6551–6562. [Google Scholar] [CrossRef]
  54. Colmer, J.; O’Neill, C.M.; Wells, R.; Bostrom, A.; Reynolds, D.; Websdale, D.; Shiralagi, G.; Lu, W.; Lou, Q.; Le Cornu, T.; et al. SeedGerm: A Cost-Effective Phenotyping Platform for Automated Seed Imaging and Machine-Learning Based Phenotypic Analysis of Crop Seed Germination. New Phytol. 2020, 228, 778–793. [Google Scholar] [CrossRef] [PubMed]
  55. Zanetoni, H.H.R.; Araujo, L.G.; Almeida, R.P.; Cabral, C.E.A. Artificial Intelligence in the Identification of Germinated Soybean Seeds. AgriEngineering 2025, 7, 169. [Google Scholar] [CrossRef]
  56. Genze, N.; Bharti, R.; Grieb, M.; Schultheiss, S.J.; Grimm, D.G. Accurate Machine Learning-Based Germination Detection, Prediction and Quality Assessment of Three Grain Crops. Plant Methods 2020, 16, 157. [Google Scholar] [CrossRef]
  57. Lin, T.-Y.; Goyal, P.; Girshick, R.; He, K.; Dollár, P. Focal Loss for Dense Object Detection. In Proceedings of the IEEE International Conference on Computer Vision (ICCV), Venice, Italy, 22–29 October 2017. [Google Scholar]
  58. Lin, T.-Y.; Maire, M.; Belongie, S.J.; Bourdev, L.D.; Girshick, R.B.; Hays, J.; Perona, P.; Ramanan, D.; Dollár, P.; Zitnick, C.L. Microsoft COCO: Common Objects in Context. In Proceedings of the 13th European Conference, Zurich, Switzerland, 6–12 September 2014. [Google Scholar]
  59. Pérez, P.; Gangnet, M.; Blake, A. Poisson Image Editing. ACM Trans. Graph 2003, 22, 313–318. [Google Scholar] [CrossRef]
  60. Mittal, A.; Soundararajan, R.; Bovik, A.C. Making a “Completely Blind” Image Quality Analyzer. IEEE Signal Process Lett. 2013, 20, 209–212. [Google Scholar] [CrossRef]
  61. Mittal, A.; Moorthy, A.K.; Bovik, A.C. No-Reference Image Quality Assessment in the Spatial Domain. IEEE Trans. Image Process 2012, 21, 4695–4708. [Google Scholar] [CrossRef]
  62. Jocher, G.; Qiu, J. Ultralytics YOLO11; Ultralytics: Frederick, MD, USA, 2024. [Google Scholar]
  63. Jocher, G.; Chaurasia, A.; Qiu, J. Ultralytics YOLOv8; Ultralytics: Frederick, MD, USA, 2023. [Google Scholar]
  64. Hahlbohm, A.; Struck, C.; de Mol, F.; Strehlow, B. UV-C Treatment Has a Higher Efficacy on Reducing Germination of Spores Rather than Mycelium Growth. Eur. J. Plant Pathol. 2025, 172, 761–777. [Google Scholar] [CrossRef]
  65. Jiang, L.; Chen, W.; Shi, H.; Zhang, H.; Wang, L. Cotton-YOLO-Seg: An Enhanced YOLOV8 Model for Impurity Rate Detection in Machine-Picked Seed Cotton. Agriculture 2024, 14, 1499. [Google Scholar] [CrossRef]
  66. Wang, N.; Cao, H.; Huang, X.; Ding, M. Rapeseed Flower Counting Method Based on GhP2-YOLO and StrongSORT Algorithm. Plants 2024, 13, 2388. [Google Scholar] [CrossRef] [PubMed]
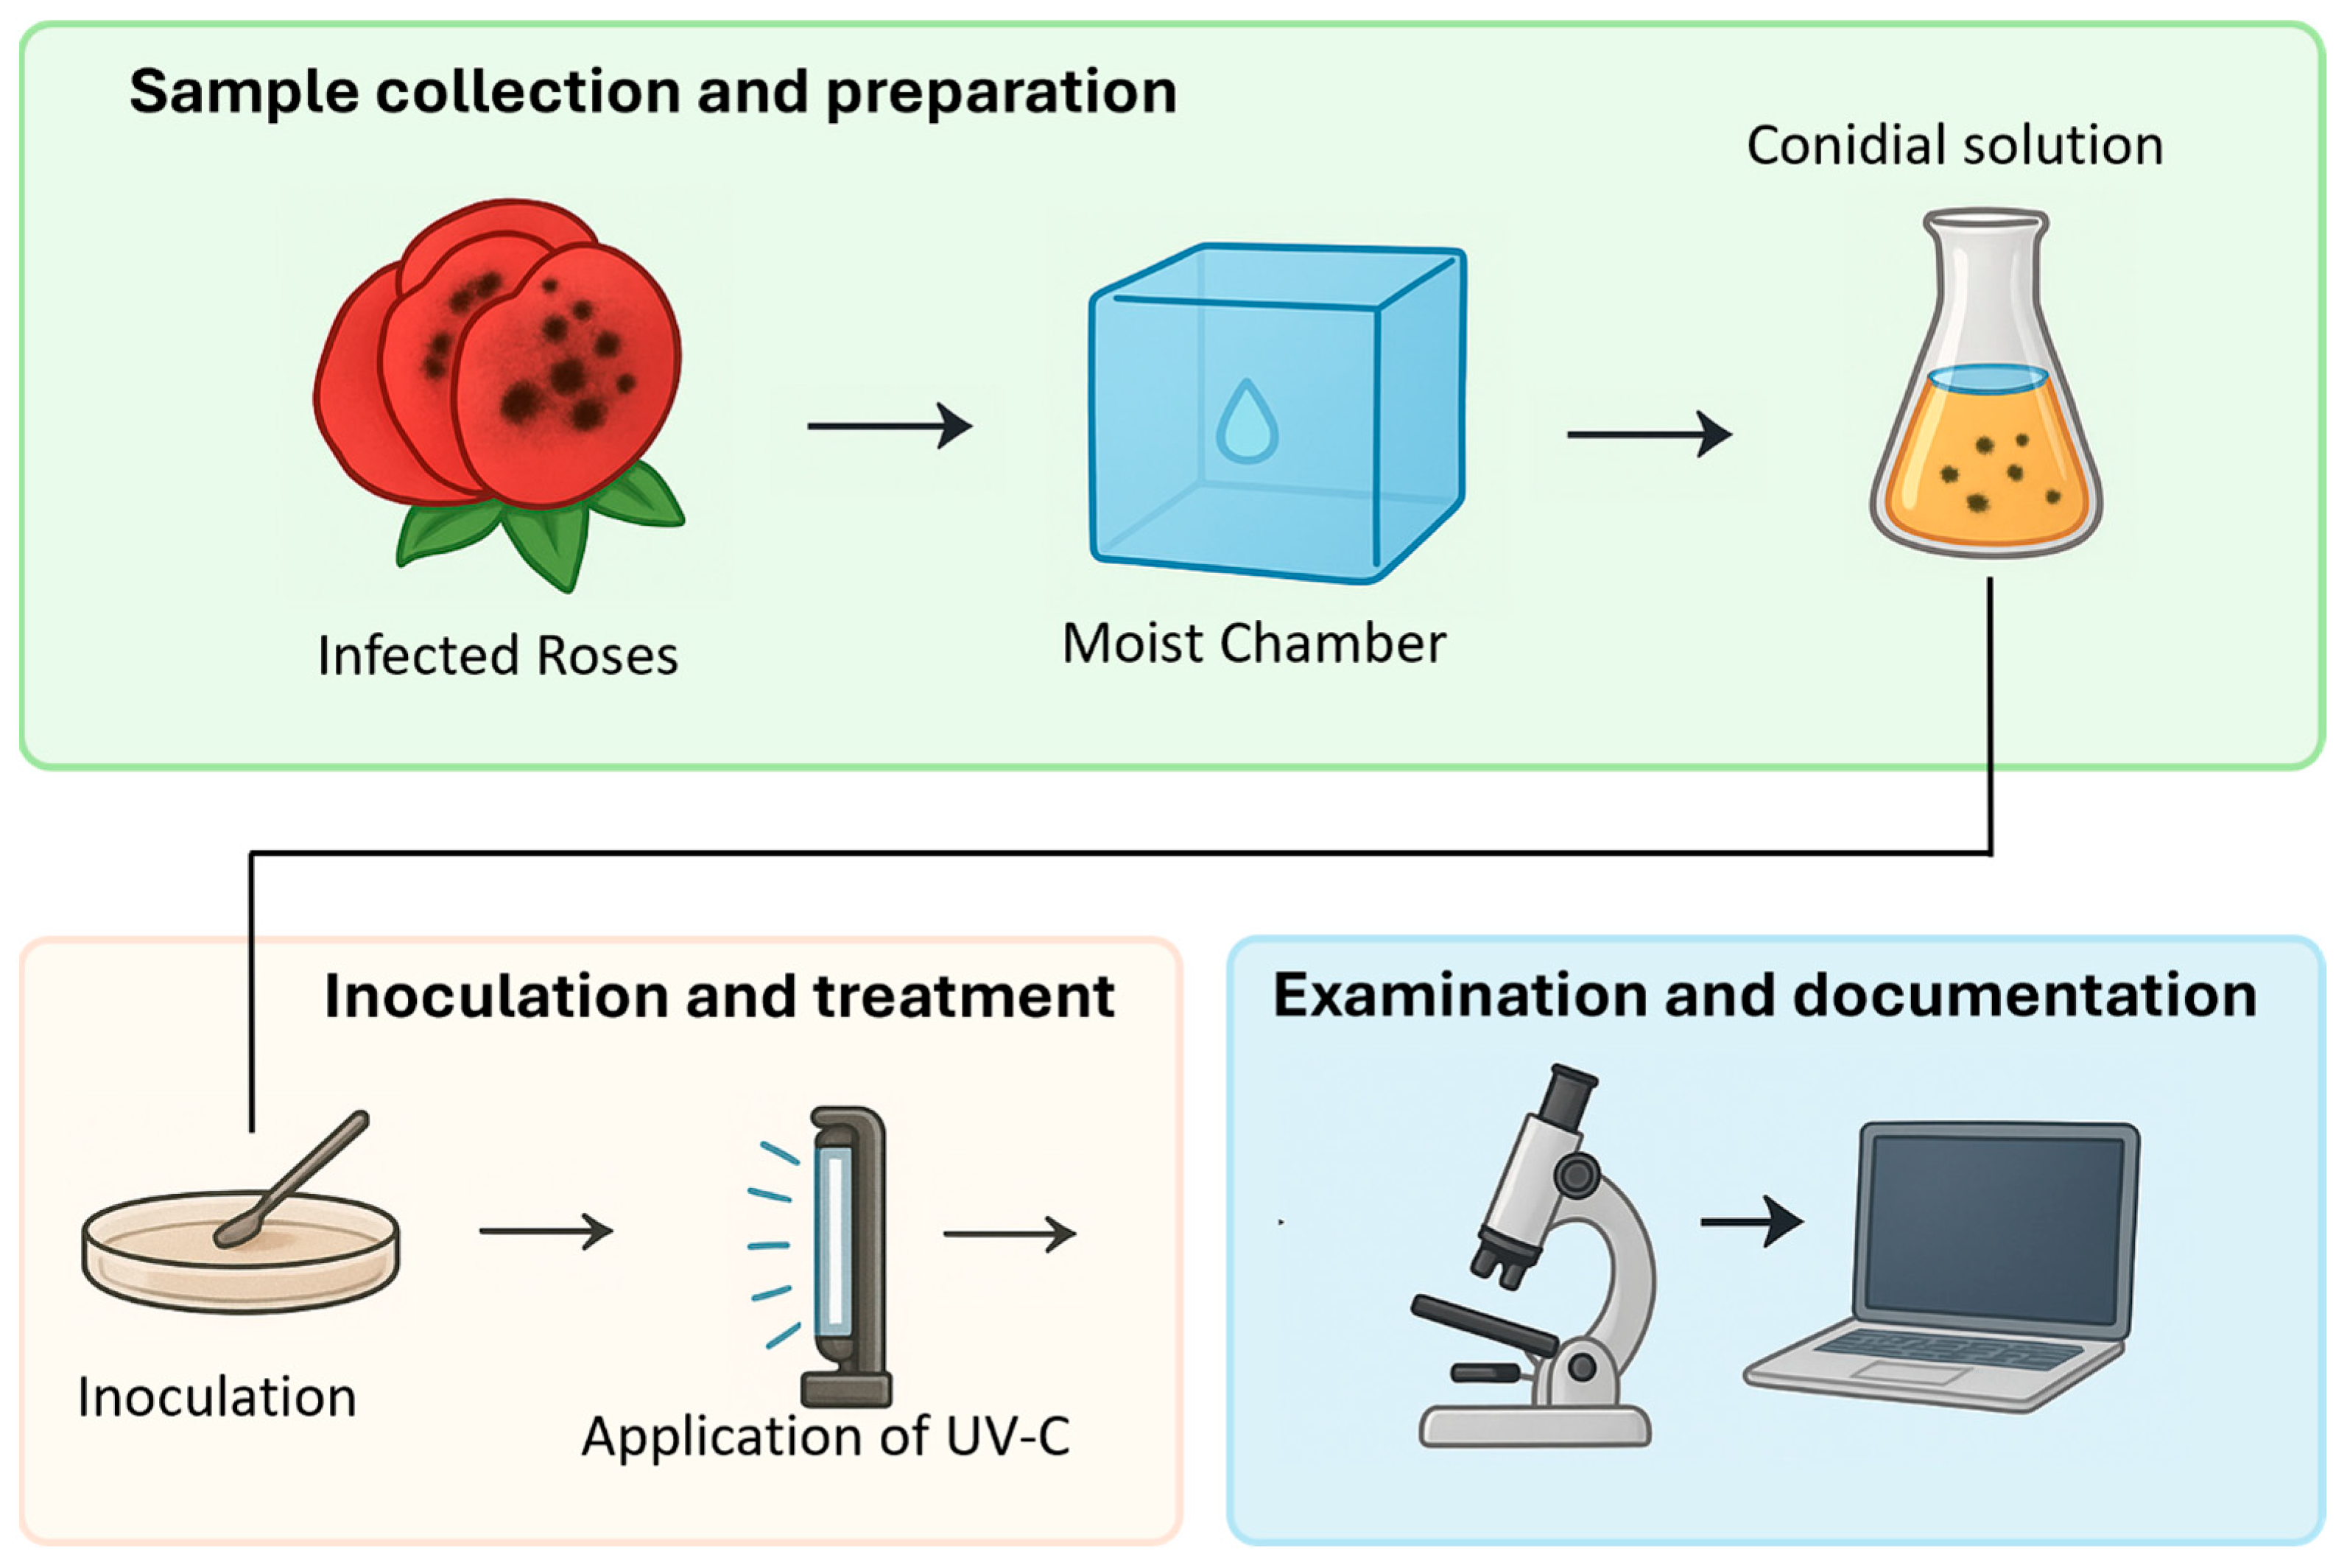
Figure 1. Procedure for extracting gray mold spores and image acquisition.
Agriengineering 07 00303 g001
Figure 2. Example of a gray mold conidia image with labeling for conidia classified as non-germinated (NG) and conidia classified as germinated (G). Scale bar 20 µm.
Agriengineering 07 00303 g002
Figure 3. Illustration of the Poisson blending integration process using microscopic images. The figure shows the source image with its corresponding binary mask, the target background, and the final blended output. Scale bars: 10 µm (source) and 20 µm (output).
Agriengineering 07 00303 g003
Figure 4. YOLOv8 model architecture: the backbone extracts features, the neck fuses multi-scale information (using SPPF and concat/upsample operations), and the head outputs object detections in a single stage. Blue and black boxes in the output image indicate germinated (G) and non-germinated (NG) conidia, respectively. Scale bar 50 µm.
Agriengineering 07 00303 g004
Figure 5. YOLOv11 model architecture: The input passes through a Conv + C3k2 backbone; SPPF aggregates multi-scale context and C2PSA applies spatial attention. A multiscale neck then fuses these feature-s, and a single-stage detection head produces the final class labels and bounding boxes. Blue and black boxes in the output image indicate germinated (G) and non-germinated (NG) conidia, respectively. Scale bar 50 µm.
Agriengineering 07 00303 g005
Figure 6. RetinaNet architecture with a ResNet50 backbone. Here a ResNet50 backbone extracts hierarchical features, the FPN constructs multiscale maps (P3–P7), and parallel heads predict class probabilities and boundingbox offsets. Blue and black boxes in the output image indicate germinated (G) and non-germinated (NG) conidia, respectively. Scale bar 50 µm.
Agriengineering 07 00303 g006
Figure 7. Models’ training and validation results in Precision, Recall, mAP50, and F1 score metrics.
Agriengineering 07 00303 g007
Figure 8. Normalized confusion matrices of the models. (a) Confusion matrix of the YOLOv8 model, (b) of the YOLOv11 model, and (c) of the RetinaNet model. The labels G, NG and BG stand for Germinated, Non-Germinated, and Background, respectively. The color intensity indicates the normalized value, with darker shades representing higher values.
Agriengineering 07 00303 g008
Figure 9. Results of gray mold spore detection in different cases using the model YOLOv11. Detection results in an image with (a) 1080 J·m−2 UV-C treatment, (b) 810 J·m−2 UV-C treatment, and (c) 0 J·m−2 (Control). Scale bar 50 µm.
Agriengineering 07 00303 g009
Table 1. Dataset distribution among the training, validation, and test subsets.
SubsetHigh Resolution ImagesBonding Boxes with LabelsPercentage
Training400400680%
Validation5048410%
Test5049410%
Total5004984100%
Table 2. Summary of characteristics over COCO dataset of single-stage models selected in this work.
ModelAccuracy (mAPbbox on COCO)Inference Speed (FPS)Model Size
YOLOv852.9%~95 ~87 MB
YOLOv1153.4%~250 ~49 MB
RetinaNet33.5%~18 ~146 MB
Table 3. Summary of training hyper-parameters for YOLOv8, YOLOv11, and RetinaNet. All models were fine-tuned under the same computational environment with pretrained weights from the COCO dataset.
HyperparameterYOLOv8YOLOv11RetinaNet
Batch size161616
GPUGPU NVIDIA T4GPU NVIDIA T4GPU NVIDIA T4
OptimizerAdamWAdamWAdamW
Epochs505050
Image size640640640
SchedulerCosine + LRCosine with warmupStep LR
LossBCE + CIoU lossBCE + CIoU lossFocal Loss
Data augmentationHSVHSVHSV
BackboneC2f-based (custom)EfficientRepResNet50-FPN
PretrainedCOCOCOCOCOCO
Table 4. Comparison of metrics for the YOLOv8, YOLOv11, and RetinaNet models on the test subset. Values in bold format highlight best metric results for each class.
ModelClassPrecisionRecallF1-ScoreIoUAP50mAP50Inference Time (s)
YOLOv8G
NG
0.958
0.973
0.988
0.995
0.973
0.986
0.920
0.913
0.989
0.995
0.9920.1556
YOLOv11G
NG
0.977
0.995
0.998
0.995
0.988
0.995
0.968
0.950
0.998
0.995
0.9970.1443
RetinaNetG
NG
0.934
0.922
0.990
0.995
0.966
0.957
0.913
0.884
0.995
0.999
0.9973.83
Table 5. Comparison of germination percentages manually obtained and those predicted by the YOLOv11 model across the three experimental groups.
Groups of 10 ImagesMean Germination Percentage (Manual)Mean Germination Percentage (YOLOv11)RMSE (%)
1080 J·m−2 UV-C treatment2.312.250.17
810 J·m−2 UV-C treatment44.8044.443.07
0 J·m−2 UV-C (Control)95.5999.98.72
Disclaimer/Publisher’s Note: The statements, opinions and data contained in all publications are solely those of the individual author(s) and contributor(s) and not of MDPI and/or the editor(s). MDPI and/or the editor(s) disclaim responsibility for any injury to people or property resulting from any ideas, methods, instructions or products referred to in the content.