Article

Design of an Automated System for Classifying Maturation Stages of Erythrina edulis Beans Using Computer Vision and Convolutional Neural Networks

School of Mechatronics Engineering, Universidad Peruana de Ciencias Aplicadas, Lima 15023, Peru
*
Authors to whom correspondence should be addressed.
AgriEngineering 2025, 7(9), 277; https://doi.org/10.3390/agriengineering7090277
Submission received: 11 July 2025 / Revised: 8 August 2025 / Accepted: 18 August 2025 / Published: 27 August 2025
(This article belongs to the Special Issue Implementation of Artificial Intelligence in Agriculture)

Abstract

Erythrina edulis, commonly known as pajuro, is a large leguminous plant native to the Amazon region of Peru. Its seeds are valued for their high protein content and their potential to enhance food security in rural communities. However, the current methods of harvesting and sorting are entirely manual, making the process labor-intensive, time-consuming, and subject to high variability, particularly in industrial contexts. A custom lightweight convolutional neural network (CNN) was developed from scratch and optimized specifically for real-time execution on embedded hardware. The model employs ReLU activation, Adam optimization, and a SoftMax output layer to enable efficient and accurate classification. The system employs a fixed-region segmentation strategy to prevent overcounting and utilizes GPIO-based control on a Raspberry Pi 5 to synchronize seed classification with physical sorting in real time. Seeds identified as defective are automatically removed via a servo-controlled ejection mechanism. The integrated system combines object detection, image processing, and real-time actuation, achieving a classification accuracy exceeding 99.6% and an average processing time of 12.4 milliseconds per seed. The proposed solution contributes to the industrial automation of pajuro sorting and provides a scalable framework for color-based grain classification applicable to a wide range of agricultural products.

1. Introduction

Erythrina edulis, commonly known as pajuro in Peru, is a leguminous, tree-like plant belonging to the Fabaceae family. Native to the Americas, it is widely distributed across South America, ranging from Venezuela to Bolivia [1]. The crop produces knobby pods approximately 20 to 25 cm in length, each containing between two and six edible seeds measuring 2 to 3.5 cm long and around 2 cm wide [2]. These seeds must be extracted and classified according to their size and maturity stage, which is typically categorized as ripe, overripe, or unfit for consumption.
Pajuro is notable for its high protein content, which ranges between 18% and 24%, and the quality of its proteins is superior to that of many other legumes. Its amino acid profile is comparable to that of eggs, making it an important nutritional resource [3]. The biological value of pajuro protein reaches 70.9, surpassing other legumes such as lentils (44.6), beans (58), peas (63.7), and broad beans (54.8) [4]. Despite its nutritional potential, its consumption remains largely limited to local communities, and no dedicated industry has yet emerged to promote its use [5].
In large-scale harvesting, ensuring uniform seed size and optimal ripeness is essential for quality assurance. However, individual pods often contain seeds at varying maturity stages. Seeds develop a characteristic red color when ripe and turn dark brown if stored for more than eight days after harvest, reducing their sensory and nutritional properties [6]. Currently, the harvesting and classification processes are entirely manual. Workers use knives to extract seeds, a practice that is both hazardous and inefficient, especially when processing large volumes. Proper grading is rarely performed due to seed variability, which hinders standardization and lowers market value.
Field observations and interviews with farmers in Luya (Amazonas, Peru) indicate that a worker can sort approximately 3.5 kg of seeds per hour, earning USD 2.40. This translates to a labor cost of around USD 685.70 to manually process one metric ton of pajuro. For plantations with 156 trees per hectare and an average yield of 170 kg per tree, the annual production reaches 26,520 kg per hectare, resulting in an estimated labor cost of USD 18,181.10 per hectare per year, not accounting for other operational expenses. Furthermore, the absence of a defined harvest season demands continuous labor throughout the year [6].
To address these limitations, computer vision and deep learning techniques have emerged as promising tools for agricultural automation. These technologies enable real-time inspection, defect detection, and classification across various crops, including tomatoes, strawberries, coffee, and legumes [7]. In particular, convolutional neural networks (CNNs) have demonstrated superior performance in identifying defects and classifying legume samples under diverse conditions [8].
Models such as YOLO, originally designed for real-time object detection, have been successfully adapted for agricultural applications due to their ability to segment images into discrete regions and analyze multiple items simultaneously. This approach has proven effective in avoiding overcounting in products like fruits and vegetables [9]. The use of attention mechanisms and multi-input architectures, such as the combination of fruit and leaf images, has further enhanced class discrimination in morphologically similar crops, including tropical and jujube fruits [9].
Recent adaptations of CNN-based models such as YOLO have been applied to agricultural tasks requiring real-time object detection and simultaneous analysis of multiple items [9]. Models like PP-YOLO have incorporated spatial attention mechanisms and image preprocessing to detect fruit trees with high precision, achieving mAP50 values of up to 98.3% [10]. Similarly, YOLOv8n-based models optimized for embedded hardware have enabled real-time fruit detection using lightweight architectures of less than 4 MB [11]. These developments align with the objectives of the present study, which proposes a compact CNN architecture optimized for deployment on Raspberry Pi 5 (Raspberry Pi Ltd., Cambridge, UK; manufactured at Sony UK Technology Centre, Pencoed, South Wales, UK).
Several studies have validated the effectiveness of conventional image processing and machine learning techniques for the classification of legumes and grains. These methods are often low-cost and applicable in practical agricultural contexts. For example, a vision-based system using classifiers such as SVM, MLP, k-Nearest Neighbors (k-NN), and Decision Trees distinguished seven varieties of dry beans, with the SVM achieving 100% accuracy for some categories [12]. Similarly, coffee beans were classified by species and origin using Artificial Neural Networks (ANN) and k-NN, achieving up to 96.66% accuracy based on simple morphological features [13]. In another study, a vibratory conveyor system combined with image processing effectively rejected defective lima beans, achieving over 95% efficiency after 2200 trials [14]. Basic RGB extraction techniques were also applied to identify and remove black coffee beans with 100% accuracy on test images [15]. Additionally, RGB histograms were used to evaluate the “hard-to-cook” phenomenon in red beans, showing a strong correlation between color change and water absorption capacity, which enabled non-destructive ripeness evaluation [16].
Beyond traditional approaches, many researchers have employed ANN and spectral or optical sensors for non-invasive quality assessment. In one study, backscattering laser imaging combined with ANN accurately predicted firmness and total soluble solids in apricots, achieving R2 values of 0.974 and 0.963, respectively [17]. Hyperspectral sensing has also been used to estimate water content and classify ripeness in strawberries, achieving over 98% classification accuracy with an RMSE of 0.0092 g/g [18]. CNNs have also been employed for real-time fruit spoilage detection, with the VGG16 model reaching 95% accuracy [19].
Further advancements in CNN-based models have introduced architectures such as TRA-CNN, which integrate spatial and channel attention mechanisms to enhance classification accuracy. In jujube fruit classification, TRA-CNN achieved 94.77% accuracy by incorporating features from fruits, leaves, and textures [9]. Other approaches have used MobileNet-v2 features in combination with machine learning classifiers to classify Indian mangoes, achieving 99.5% accuracy [20]. Hybrid architectures combining CNNs with Recurrent Neural Networks (RNN) and Long Short-Term Memory (LSTM) units have also outperformed SVM and Feedforward Neural Networks (FFNN) in fruit classification tasks [21]. In coffee classification, SqueezeNet models enhanced with Vision Transformers (ViT) reached 85.9% accuracy in identifying bean varieties and roast levels [22]. These findings underscore the importance of hybrid and deep architectures in precision agriculture [23].
The integration of real-time object detection with industrial vision systems has led to substantial gains in sorting efficiency. For instance, the Mask-RCNN algorithm, combined with ResNet50, detected coffee defects with a mean average precision (mAP) of 0.99 and an accuracy of 94% at a conveyor speed of 35 RPM [24]. In the table olive industry, a prototype system incorporating liquid transport and traceability mechanisms achieved 98% efficiency in removing small fruits and 89.3% accuracy in maturity classification, offering both logistical and quality improvements [25].
Despite these technological advancements, native crops like pajuro have received limited attention. The absence of specialized datasets and tailored computational models hinders the development of automated solutions suited to local agricultural conditions. This study addresses this gap by developing a computer vision-based classification system for pajuro seeds. The proposed system offers a methodological framework for assessing ripeness and size, incorporating visual descriptors informed by local practices.
This work introduces methodological innovations that extend beyond engineering implementation. First, a lightweight convolutional neural network (CNN) was developed from scratch to enable real-time classification on the Raspberry Pi 5, a low-cost embedded device, without relying on external accelerators. The architecture uses the ReLU activation function in hidden layers, the Adam optimizer for training, and a SoftMax layer for final classification. Second, a fixed-region segmentation strategy was adopted to reduce inference time and prevent overcounting by restricting the analysis to predefined zones aligned with the conveyor layout. Third, the classification module was integrated with real-time actuator control through the GPIO interface of the Raspberry Pi, ensuring low-latency and deterministic sorting. Together, these contributions result in a compact, efficient, and scalable framework for AI-based agricultural classification in resource-constrained environments.
The remainder of this article is structured as follows: Section 2 details the materials and methods used in this study, including the classification criteria for pajuro seeds, the mechanical design of the sorting system, and the hardware components such as the Raspberry Pi 5 and the camera. This section also outlines the methodology for dataset preparation, image processing, model comparison, and the logic behind the selection system. Section 3 presents and discusses the experimental results, focusing on the training behavior and stability of the proposed CNN, an evaluation of alternative YOLO-based models, and a performance comparison against human classification. Finally, Section 4 provides the conclusions and highlights the main contributions and potential future improvements of the proposed system.

2. Materials and Methods

2.1. Materials for Image-Based Classification System

This section describes the main components that comprise the proposed image-based classification system for pajuro seeds. It begins by outlining the classification criteria based on seed size and ripeness, which guide the visual identification process. Then, it details the mechanical structure designed to support and transport the seeds during acquisition and sorting. Finally, the embedded hardware used for image capture and system control is presented, including the Raspberry Pi 5 and the selected camera module, both chosen for their balance between performance and cost-effectiveness in real-time agricultural applications.

2.1.1. Pajuro Seeds Classification by Size and Ripeness

The pajuro samples used in this study were collected in the town of Luya, located in the department of Amazonas, Peru, from a plantation consisting of approximately 40 trees with continuous fruit availability throughout the year.
To establish reliable classification criteria, the seeds were categorized based on two variables: ripeness stage and the physical size of the pod. Ripeness was divided into two categories, namely optimal ripeness and overripe. Size was determined by measuring the physical dimensions of the pod and classifying the fruits into three categories: small, medium, and large.
Prior to image acquisition and computer-based classification, the samples were subjected to an automatic mechanical sorting process. This process separated the fruits according to pod length and width, ensuring a controlled size distribution for the subsequent recognition stage.
The size classification criteria used in this study are presented in Table 1, which summarizes the ranges of length and width corresponding to each size group.
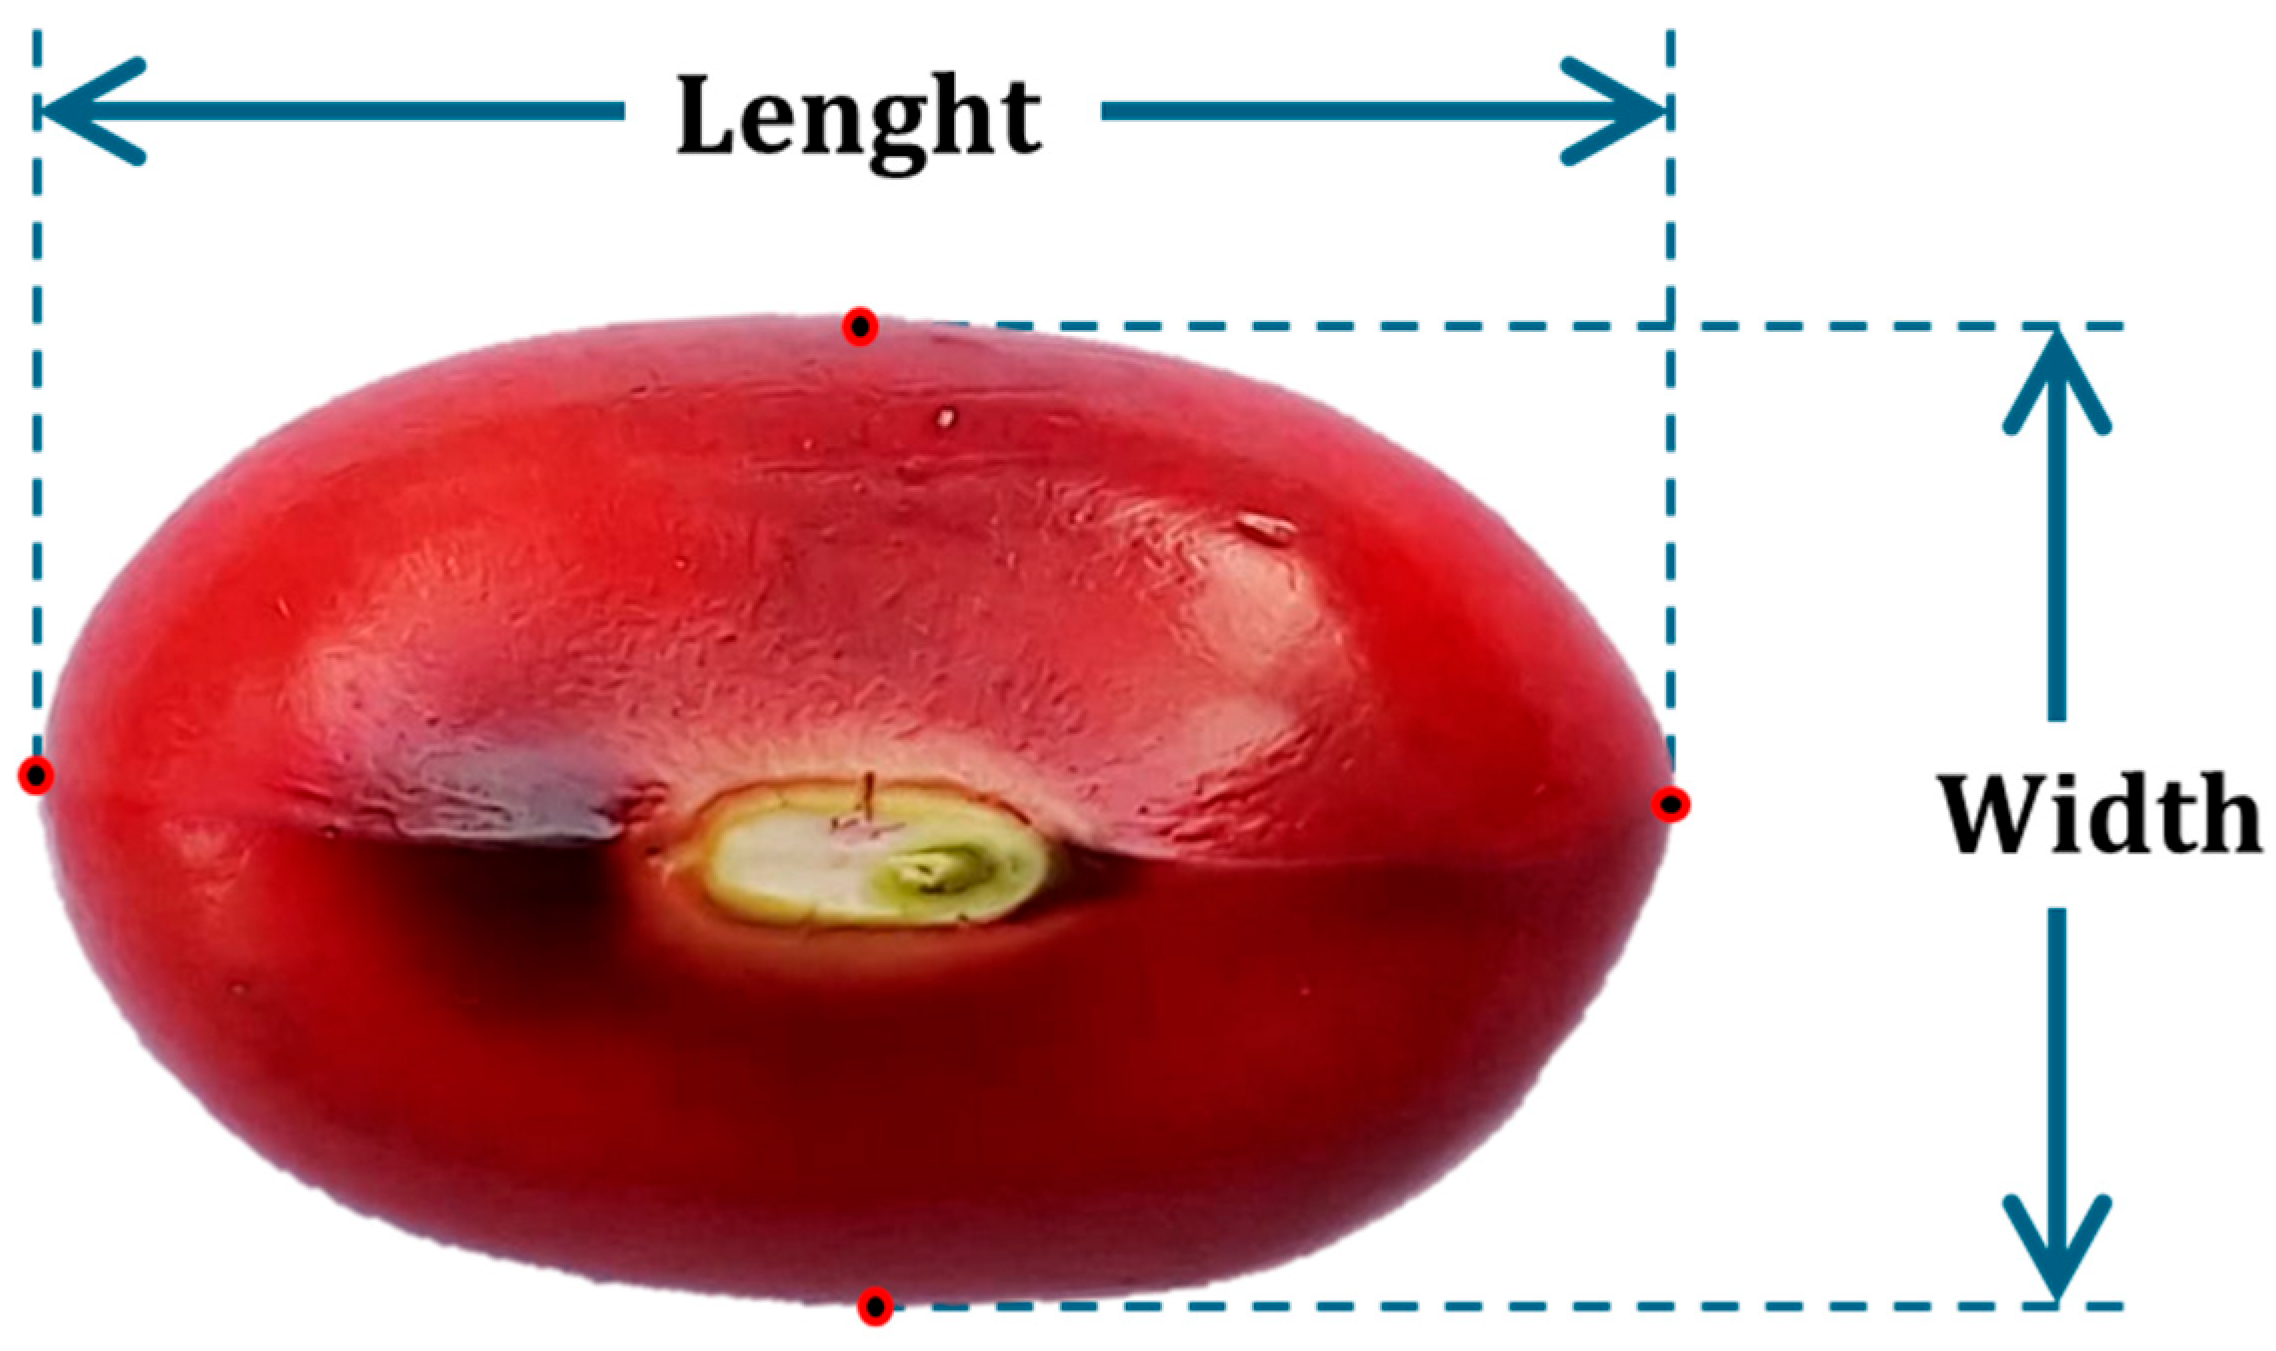
The length of each pajuro seed was measured from tip to tip along its main longitudinal axis, while the width was recorded at the widest central region, perpendicular to the length. All measurements were carried out manually using a calibrated digital caliper with a resolution of 0.01 mm to ensure precision and repeatability. The specific anatomical landmarks used to determine these dimensions are depicted in Figure 1 and correspond to the classification criteria detailed in Table 1. The distinction between optimally ripe and overripe pajuro seeds was initially established based on visual criteria provided by local farmers. According to their expertise, a deep red rind indicates adequate ripeness, while a dark brown coloration is characteristic of overripe seeds.
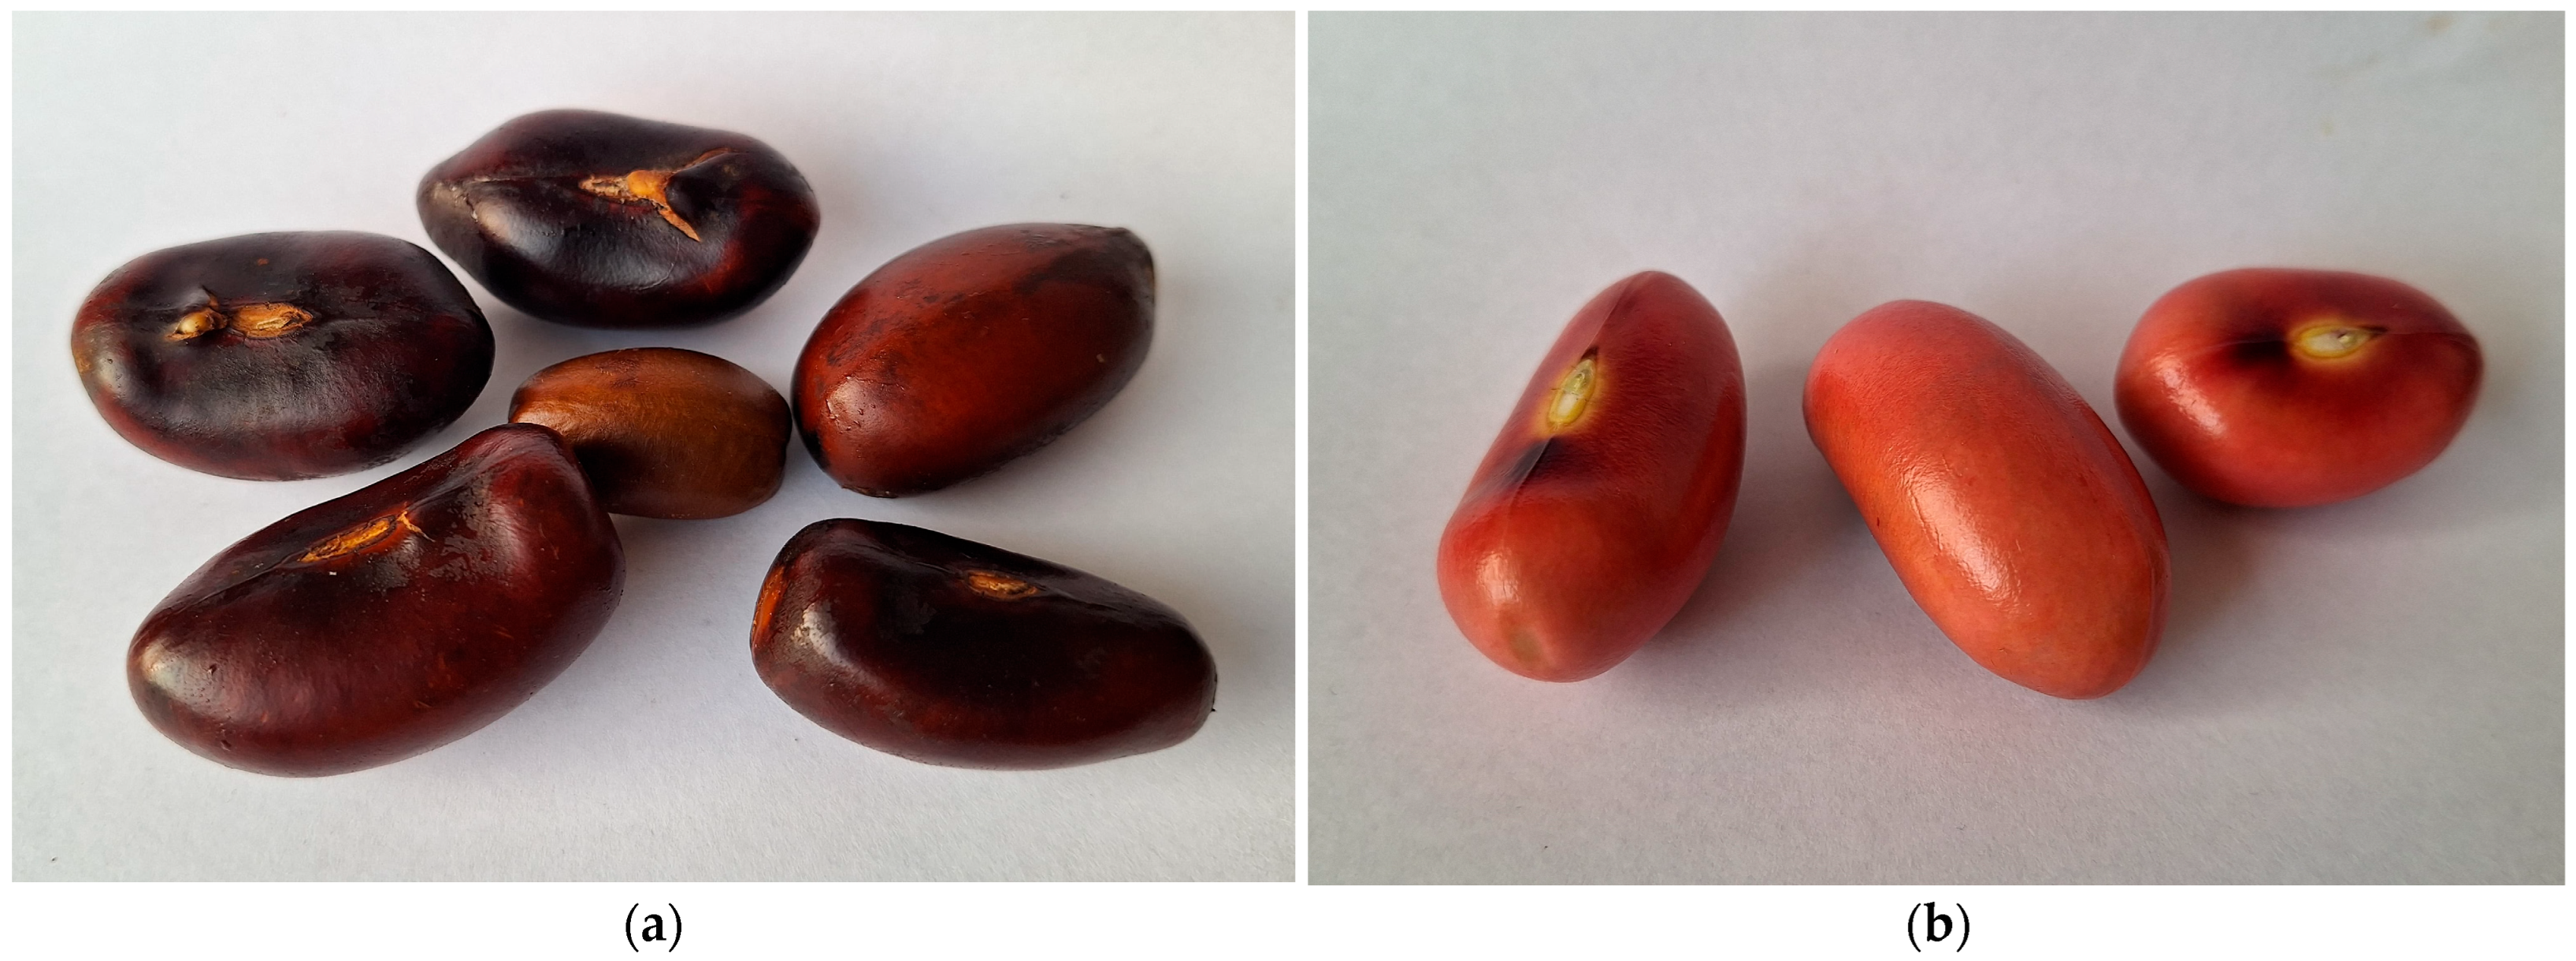
Representative examples of both ripeness categories are provided in Figure 2, where panel (a) displays overripe seeds with a dark brown color, and panel (b) shows seeds exhibiting reddish hues associated with optimal ripeness.

2.1.2. Mechanical Design

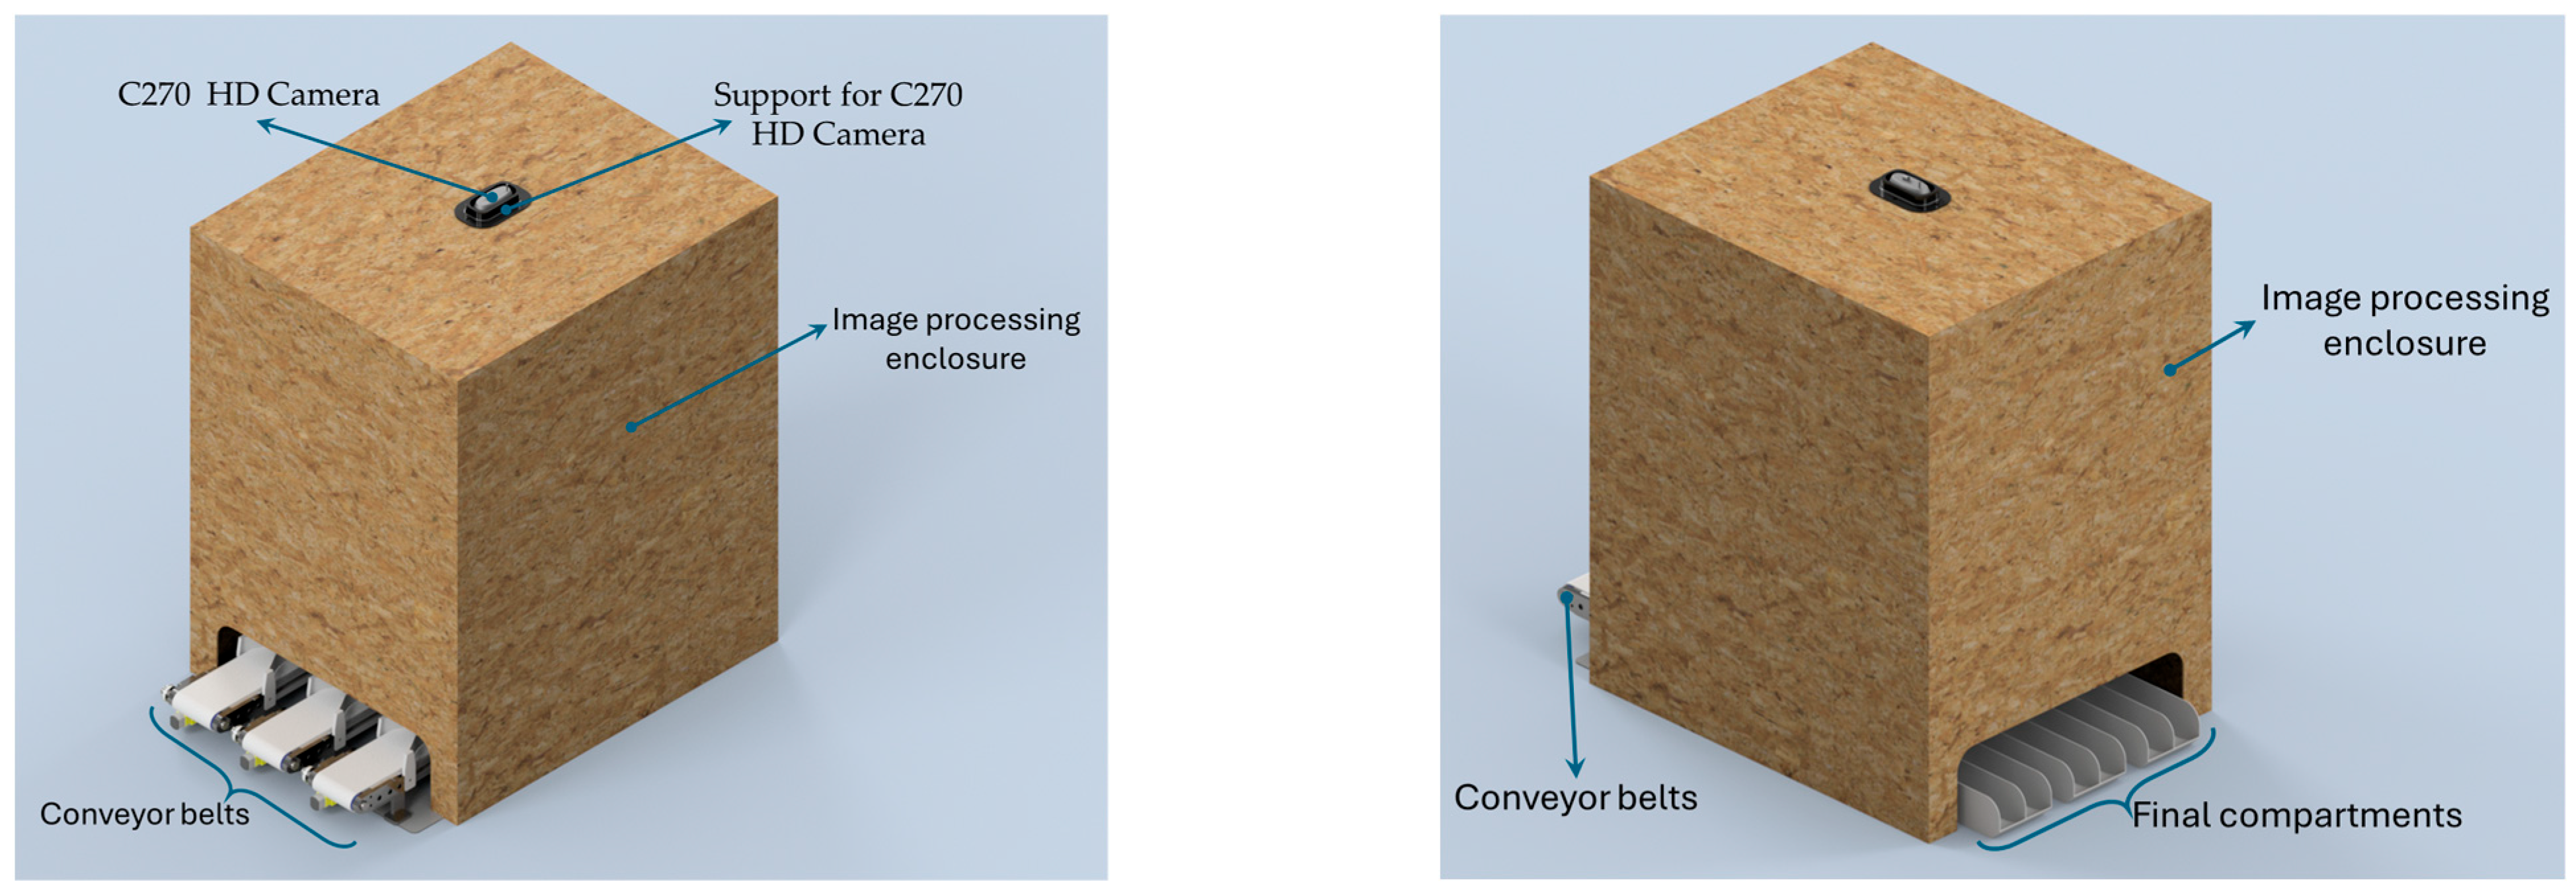
The image processing enclosure has dimensions of 500 mm × 600 mm × 900 mm, with a wall thickness of 2.5 mm. A camera is mounted at the top of the structure and is responsible for video acquisition and real-time image processing. The system incorporates LED lighting installed on the top cover of the enclosure, providing constant and uniform illumination. This lighting condition is essential to maintain the consistency and accuracy required for the sorting process. The overall configuration of the system, including the location of the camera, is illustrated in Figure 3.
Each of the three conveyor belts is assigned to a specific grain size category (small, medium, or large) and incorporates a front alignment mechanism that centers the grains before they enter the detection area. The pre-alignment mechanism, which is illustrated in Figure 4, is essential to ensure accurate detection of the ripeness stage and efficient sorting of the grains.
Once the grain is captured by the camera and classified by the vision system, the result is converted into a physical action through a sorting servomechanism located at the end of each conveyor belt. This mechanism includes an electronically controlled rotary actuator that redirects the grain to one of two final compartments, depending on its ripeness: optimal or overripe.
The operation of this actuator is synchronized with the artificial intelligence classification system, enabling automatic sorting in real time. As a result, the system separates the beans into six final categories, which correspond to three size classes (small, medium, and large) and two ripeness stages.
The complete mechanical configuration is illustrated in Figure 5a, which shows the three parallel conveyor belts, alignment modules, servomechanisms, and final destination compartments. The servomechanism operates using a PWM signal (pulse width modulation) generated by the embedded system based on the Raspberry Pi 5 platform. The underlying control principle is represented in Figure 5b, and the main technical characteristics are summarized in Table 2.

2.1.3. Raspberry Pi 5

The hardware platform selected for the development and implementation of the seed classification and sorting system was the Raspberry Pi 5 Model B with 8 GB of RAM (Raspberry Pi Ltd., Cambridge, UK; manufactured at Sony UK Technology Centre, Pencoed, South Wales, UK). The Raspberry Pi is a compact and cost-effective single-board computer widely used in embedded artificial intelligence and computer vision applications. Its small size, low power consumption, and adequate computational capabilities make it especially suitable for real-time processing tasks in resource-constrained or mobile environments.
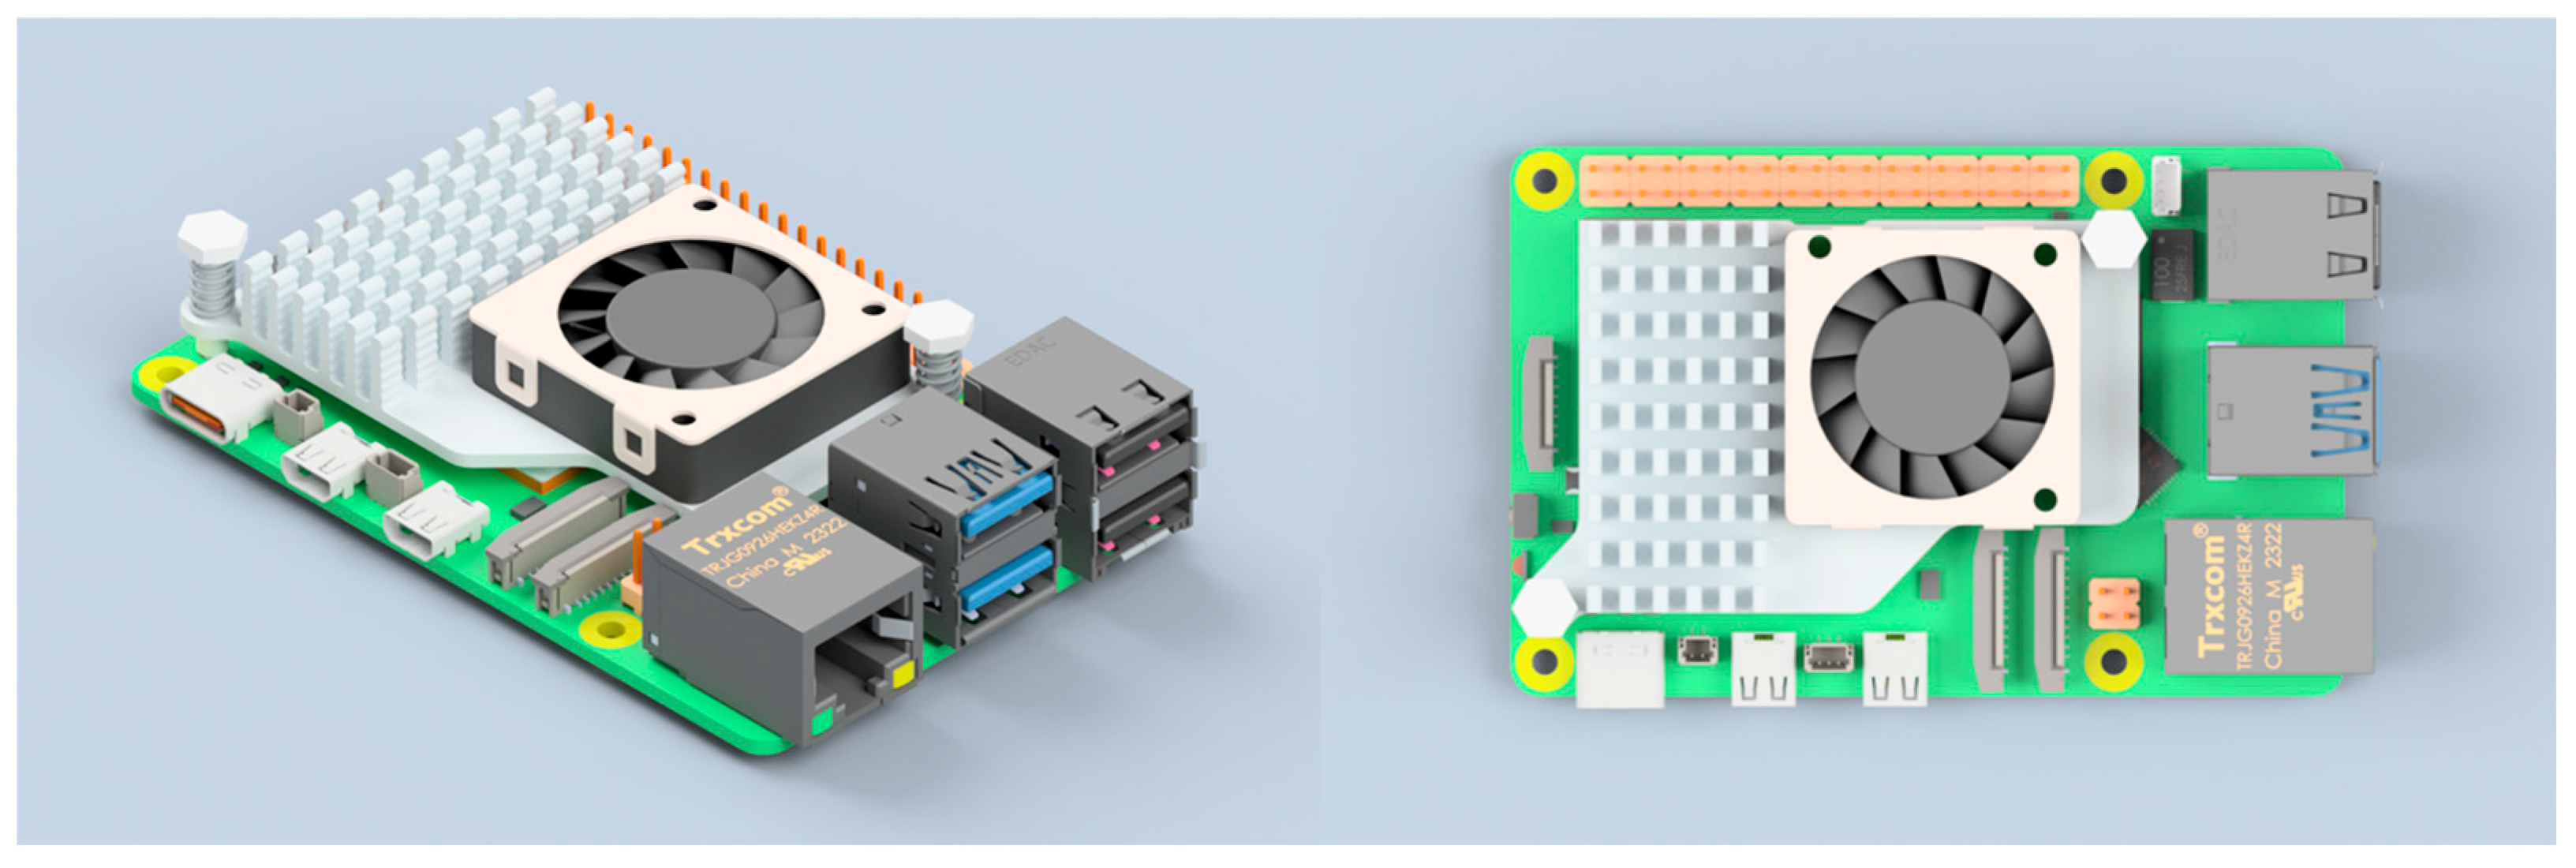
In this research, the Raspberry Pi 5 served as the central processing unit responsible for running both the custom convolutional neural network (CNN) model and the YOLOv5s object detection model directly on-device. Equipped with a 64-bit quad-core ARM Cortex-A76 processor at 2.4 GHz and 8 GB of LPDDR4X RAM, this board provided the necessary resources to execute inference in real time without requiring external accelerators. A visual representation of the Raspberry Pi 5 used in the system is shown in Figure 6, highlighting its compact layout and standard I/O interfaces.
The platform’s 40-pin GPIO header was configured to control the actuation system via PWM signals, while its USB 3.0 ports provided high-speed communication with the image capture devices. In addition, support for dual-band Wi-Fi and Bluetooth 5.0 enabled seamless integration with remote development and monitoring environments. The Raspberry Pi’s ability to manage both lightweight classification operations and full-frame object detection processes made it an optimal choice for deploying artificial intelligence applications at the edge.
The technical specifications of the Raspberry Pi 5 are summarized in Table 3, highlighting the key hardware features relevant to its function in supporting AI-based seed classification and real-time mechanical control.

2.1.4. Camera

The sample images were acquired using a Logitech HD C270 webcam (Logitech International S.A., Lausanne, Switzerland; manufactured in Suzhou, China), selected for its affordability and adequate resolution for real-time machine vision applications. This device includes a 1/6″ CMOS sensor and a fixed 4.0 mm lens, offering a horizontal field of view (FOV) of 60°, which is appropriate for monitoring the entire inspection area from a stationary camera positioned above the conveyor belts. This model has also been successfully used in related image-based detection systems, such as the identification and tracking of microplastics in aquatic environments, where real-time detection and low-cost hardware were critical design requirements [26]. The main technical specifications of the camera are summarized in Table 4.
The images were saved in JPEG format at a resolution of 1080 × 720 pixels, which exceeds the native resolution of the sensor to allow for improved detail in grain analysis. Video acquisition was performed at a constant rate of 30 frames per second (fps), ensuring proper synchronization with the classification system operating in real time.
To determine the effective field of view of the camera within the inspection chamber, its optical parameters and installation height were taken into account. A schematic diagram of the field of view, based on the camera’s aperture angle and its vertical distance to the transport surface, is provided in Figure 7. This visualization confirms that the entire width of the three conveyor belts is included within the frame.

2.2. Methodology

2.2.1. Dataset

Image acquisition was performed on 3 June 2025, in Lima, Peru, under controlled environmental conditions. The setup included a fixed LED lighting system installed inside a dedicated image processing enclosure, providing uniform illumination across all samples. Images were captured while the conveyor belt was in motion in order to simulate realistic operational conditions. To ensure consistency, variables such as lighting intensity, conveyor speed, and camera height were kept constant throughout the entire acquisition process.
All images were stored in JPG format. An initial filtering step was applied to remove blurred or low-quality images. To enhance dataset variability, data augmentation was performed using tools provided by the Roboflow platform, resulting in a total of 1200 usable images. These were divided into training and validation sets, with 80% allocated for training and 20% for validation.
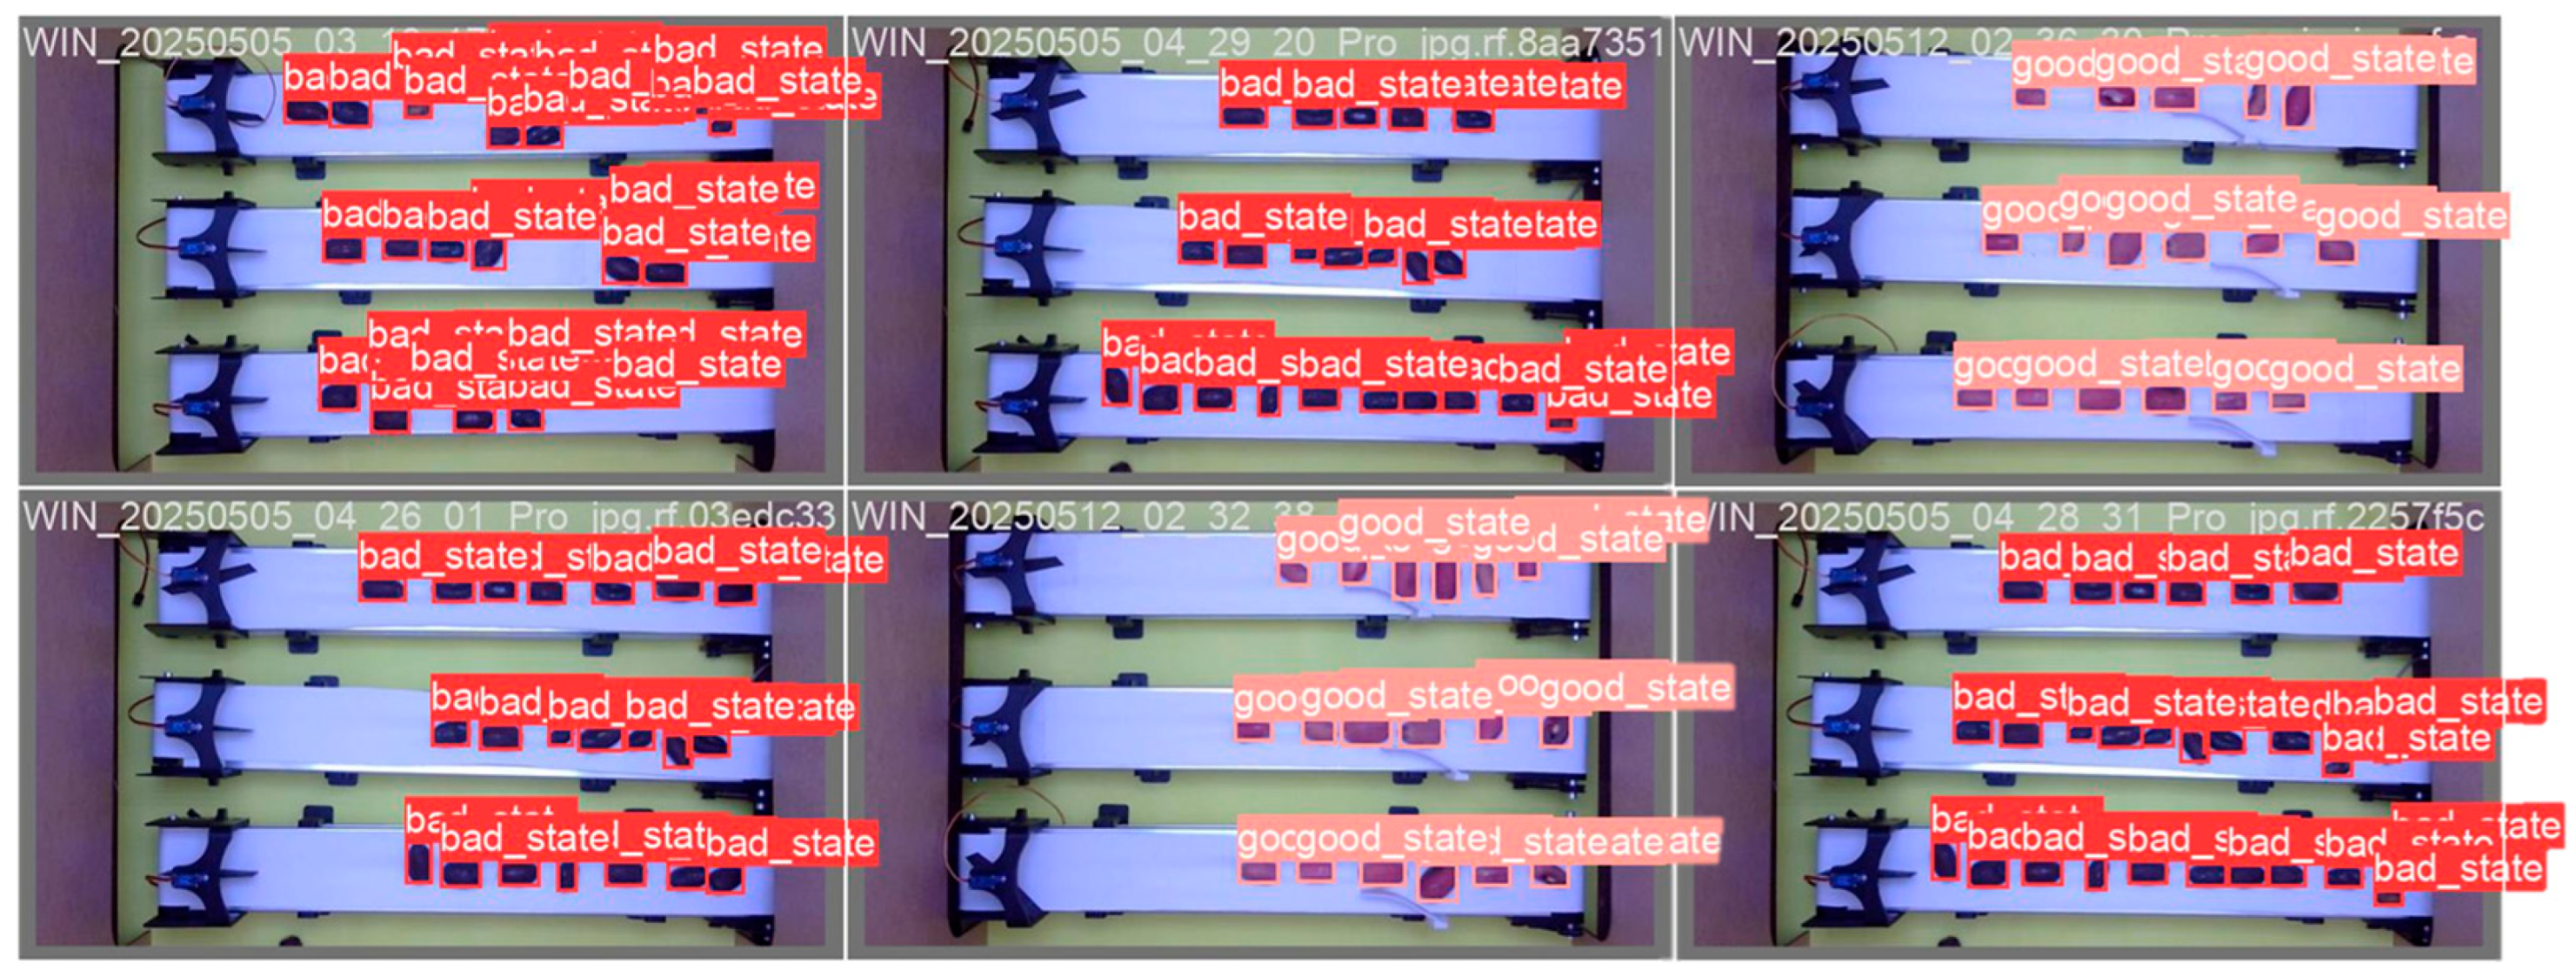
Annotation was also conducted using Roboflow, which supports bounding box labeling. Each seed was manually enclosed within a rectangular bounding box to ensure precise localization. Two class labels were used: good_state for optimally ripe seeds and bad_state for overripe seeds. The annotations were exported in plain text files following the YOLO format, where each line contains a class identifier followed by the normalized coordinates of the bounding box. A visual example of the annotated dataset is provided in Figure 8, where labeled bounding boxes and class tags are displayed on the input images.
During the training phase of the neural network, images were classified not only by ripeness but also by seed size. This dual classification enabled the model to learn from six distinct combinations of features. The distribution of samples across these six categories, which are defined by three size groups (small, medium, and large) and two ripeness levels (optimal and overripe), is presented in Table 5.

2.2.2. Preprocessing

To establish a quantitative reference, digital analysis was performed in the HSV color space (Hue, Saturation, Value) using the labeled images. The average value ranges obtained for each ripeness state are summarized in Table 6.
To ensure real-time operation, the system integrates image acquisition, preprocessing, classification, and physical actuation into a single processing cycle executed entirely on a Raspberry Pi 5. A camera positioned at the top of the processing cabinet continuously captures the video stream of the conveyor belts. These images are segmented into fixed rectangular regions, selected to achieve a balance between spatial resolution, processing speed, and the preservation of morphological details of the grains.

2.2.3. Processing

The real-time classification system was developed to identify and categorize pajuro (Erythrina edulis) grains as they move along conveyor belts in an agroindustrial context. At the core of the system is a lightweight convolutional neural network (CNN), designed from the ground up and specifically optimized for binary classification of grains into two categories: good_state (optimally ripe) and bad_state (overripe).
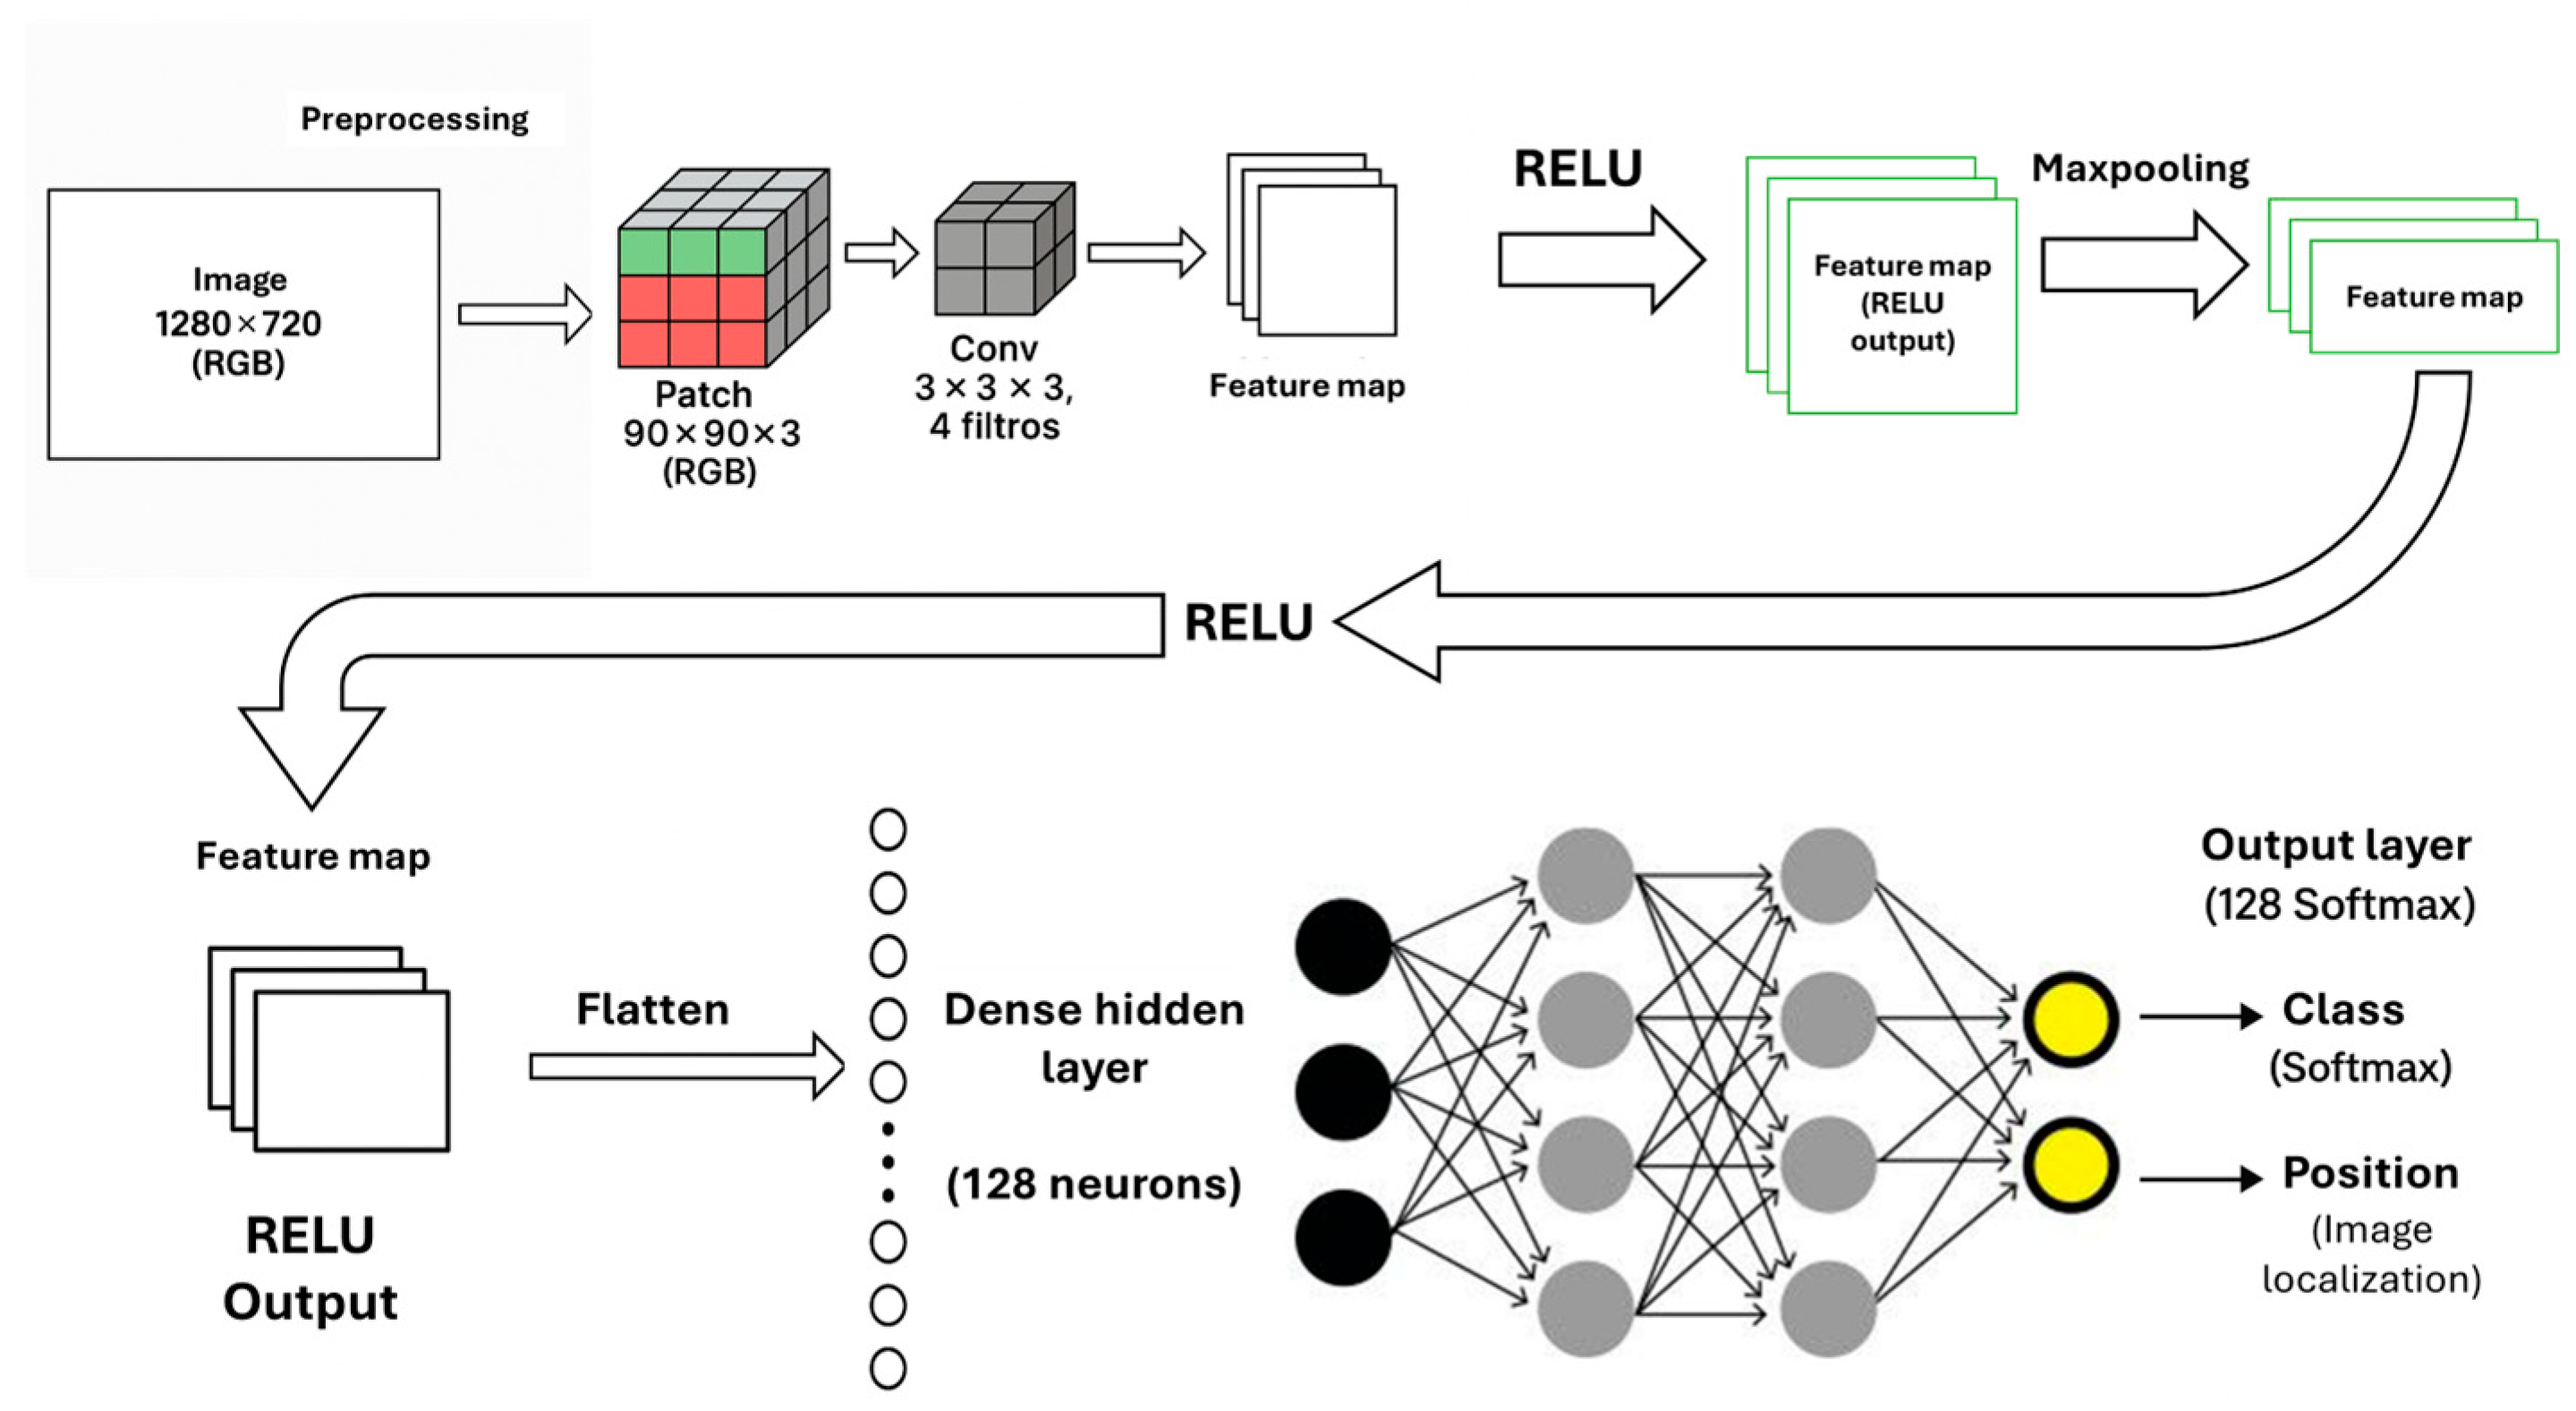
Each image segment is normalized and resized before being processed by the neural network. The architecture consists of two convolutional layers containing 4 and 8 filters, respectively. Each convolutional layer is followed by a ReLU activation function and a max pooling operation to reduce spatial dimensionality. The activation function applied in both the convolutional and dense layers is the rectified linear unit (ReLU), defined as in Equation (1).
f x = max 0 , x
The extracted features are then flattened and passed to a dense network composed of a fully connected layer with 128 neurons and ReLU activation. This dense layer allows nonlinear combinations of the extracted patterns, facilitating the final discrimination between classes. To enhance generalization performance and mitigate overfitting, a dropout layer with a dropout rate of 30 percent was included. The final classification is performed using a SoftMax layer with three output neurons, each representing one of the defined classes. This activation function transforms the output values z i into normalized probabilities z ^ i , according to Equation (2), where C = 2 is the total number of classes
S o f t M a x ( z ^ i ) = e z i j = 1 3 e z j   ,   i = 1,2 ,   , C
The model was trained using five-fold stratified cross-validation on a dataset comprising 2010 labeled images. Each image was processed into 140 × 140 pixel segments and balanced across the target classes. For each fold, the model was trained over 30 epochs using a batch size of 16. Optimization was carried out using the Adam algorithm with a learning rate of 0.001. The loss function employed was categorical cross entropy, as shown in Equation (3), where y i represents the true class label encoded using one-hot representation, and y ^ i denotes the predicted probability for class i .
L = i = 1 3 y i · l o g ( y ^ i )
These equations were implemented manually within the training loop to provide greater control over the optimization process and to ensure compatibility with embedded platforms such as the Raspberry Pi (Raspberry Pi Ltd., Cambridge, UK; manufactured at Sony UK Technology Centre, Pencoed, South Wales, UK). The overall architecture of the proposed neural network is depicted in Figure 9.
The CNN architecture was designed to be compact and efficient, optimized for real-time operation on embedded platforms such as the Raspberry Pi 5. This decision was guided by the visual simplicity of the data: segmented images of pajuro beans exhibiting low morphological variability and neutral backgrounds. In this context, two convolutional layers with 4 and 8 filters, respectively, were selected. These filters were sufficient to extract relevant patterns in color, edges, and texture. During the early stages of training, the filters act as spatial and spectral feature extractors, enabling the network to accurately distinguish between optimally ripe and overripe seeds without the need for deeper architectures.
The use of a single dense layer with 128 neurons was determined empirically to provide an effective balance between feature abstraction and training stability. Deeper architectures or configurations with a larger number of filters did not yield significant improvements in classification accuracy but did increase the risk of overfitting and inference latency. Under this configuration, the model achieved an accuracy exceeding 99% across five-fold cross-validation, as reported in Section 3.1.
In contrast, other studies employing more complex architectures—such as GoogleNet and VGG19—for similar legume classification tasks have reported lower accuracies of approximately 96.7%, along with significantly higher computational costs [27]. Therefore, the proposed network is not excessive but rather a strategic solution tailored to the characteristics of the product, the limitations of embedded hardware, and the empirical behavior observed during training.
After classification, the predicted output is transmitted to actuators located at the end of each conveyor belt. Based on the assigned class, each seed is directed into the corresponding container (good_state or bad_state), ensuring that only valid detections trigger the mechanical sorting mechanism. This system provides an efficient, scalable, and cost-effective solution for real-time classification of underutilized crops such as pajuro, with particular relevance in rural agro-industrial settings.
The YOLO model was trained using the YOLOv5 framework, which is a single-stage detector that formulates object localization and classification as a unified regression task. In contrast to region-based approaches such as Faster R-CNN, YOLO processes the entire input image in a single forward pass, enabling high-speed inference while maintaining competitive accuracy. During postprocessing, redundant detections are eliminated using nonmaximum suppression (NMS).
For this study, the YOLOv5s variant was selected due to its balance between architectural complexity and inference speed. Model training was performed in a GPU-accelerated environment with CUDA support (NVIDIA Tesla T4, 16 GB), which significantly reduced training time and allowed for larger batch processing. Transfer learning was employed by initializing the model with pre-trained weights (yolov5s.pt), which helped accelerate convergence on the custom dataset.
A total of 100 training epochs were conducted using a batch size of 20 and an input resolution of 640 × 640 pixels, consistent with the default configuration of YOLOv5s. Although powers of two, such as 16 or 32, are typically favored for GPU optimization, empirical testing with various batch sizes demonstrated that a value of 20 yielded more stable training dynamics and better convergence for the dataset used. This batch size also aligned more effectively with the total number of images (2010), reducing the number of leftover samples per epoch and preventing memory overflows during data augmentation. Considering these factors, the selected batch size was well-suited to the model architecture and the computational constraints of the training environment on Google Colab (Google Research, Mountain View, CA, USA; accessed in July 2025), running Python 3.9 with TensorFlow 2.13.0)
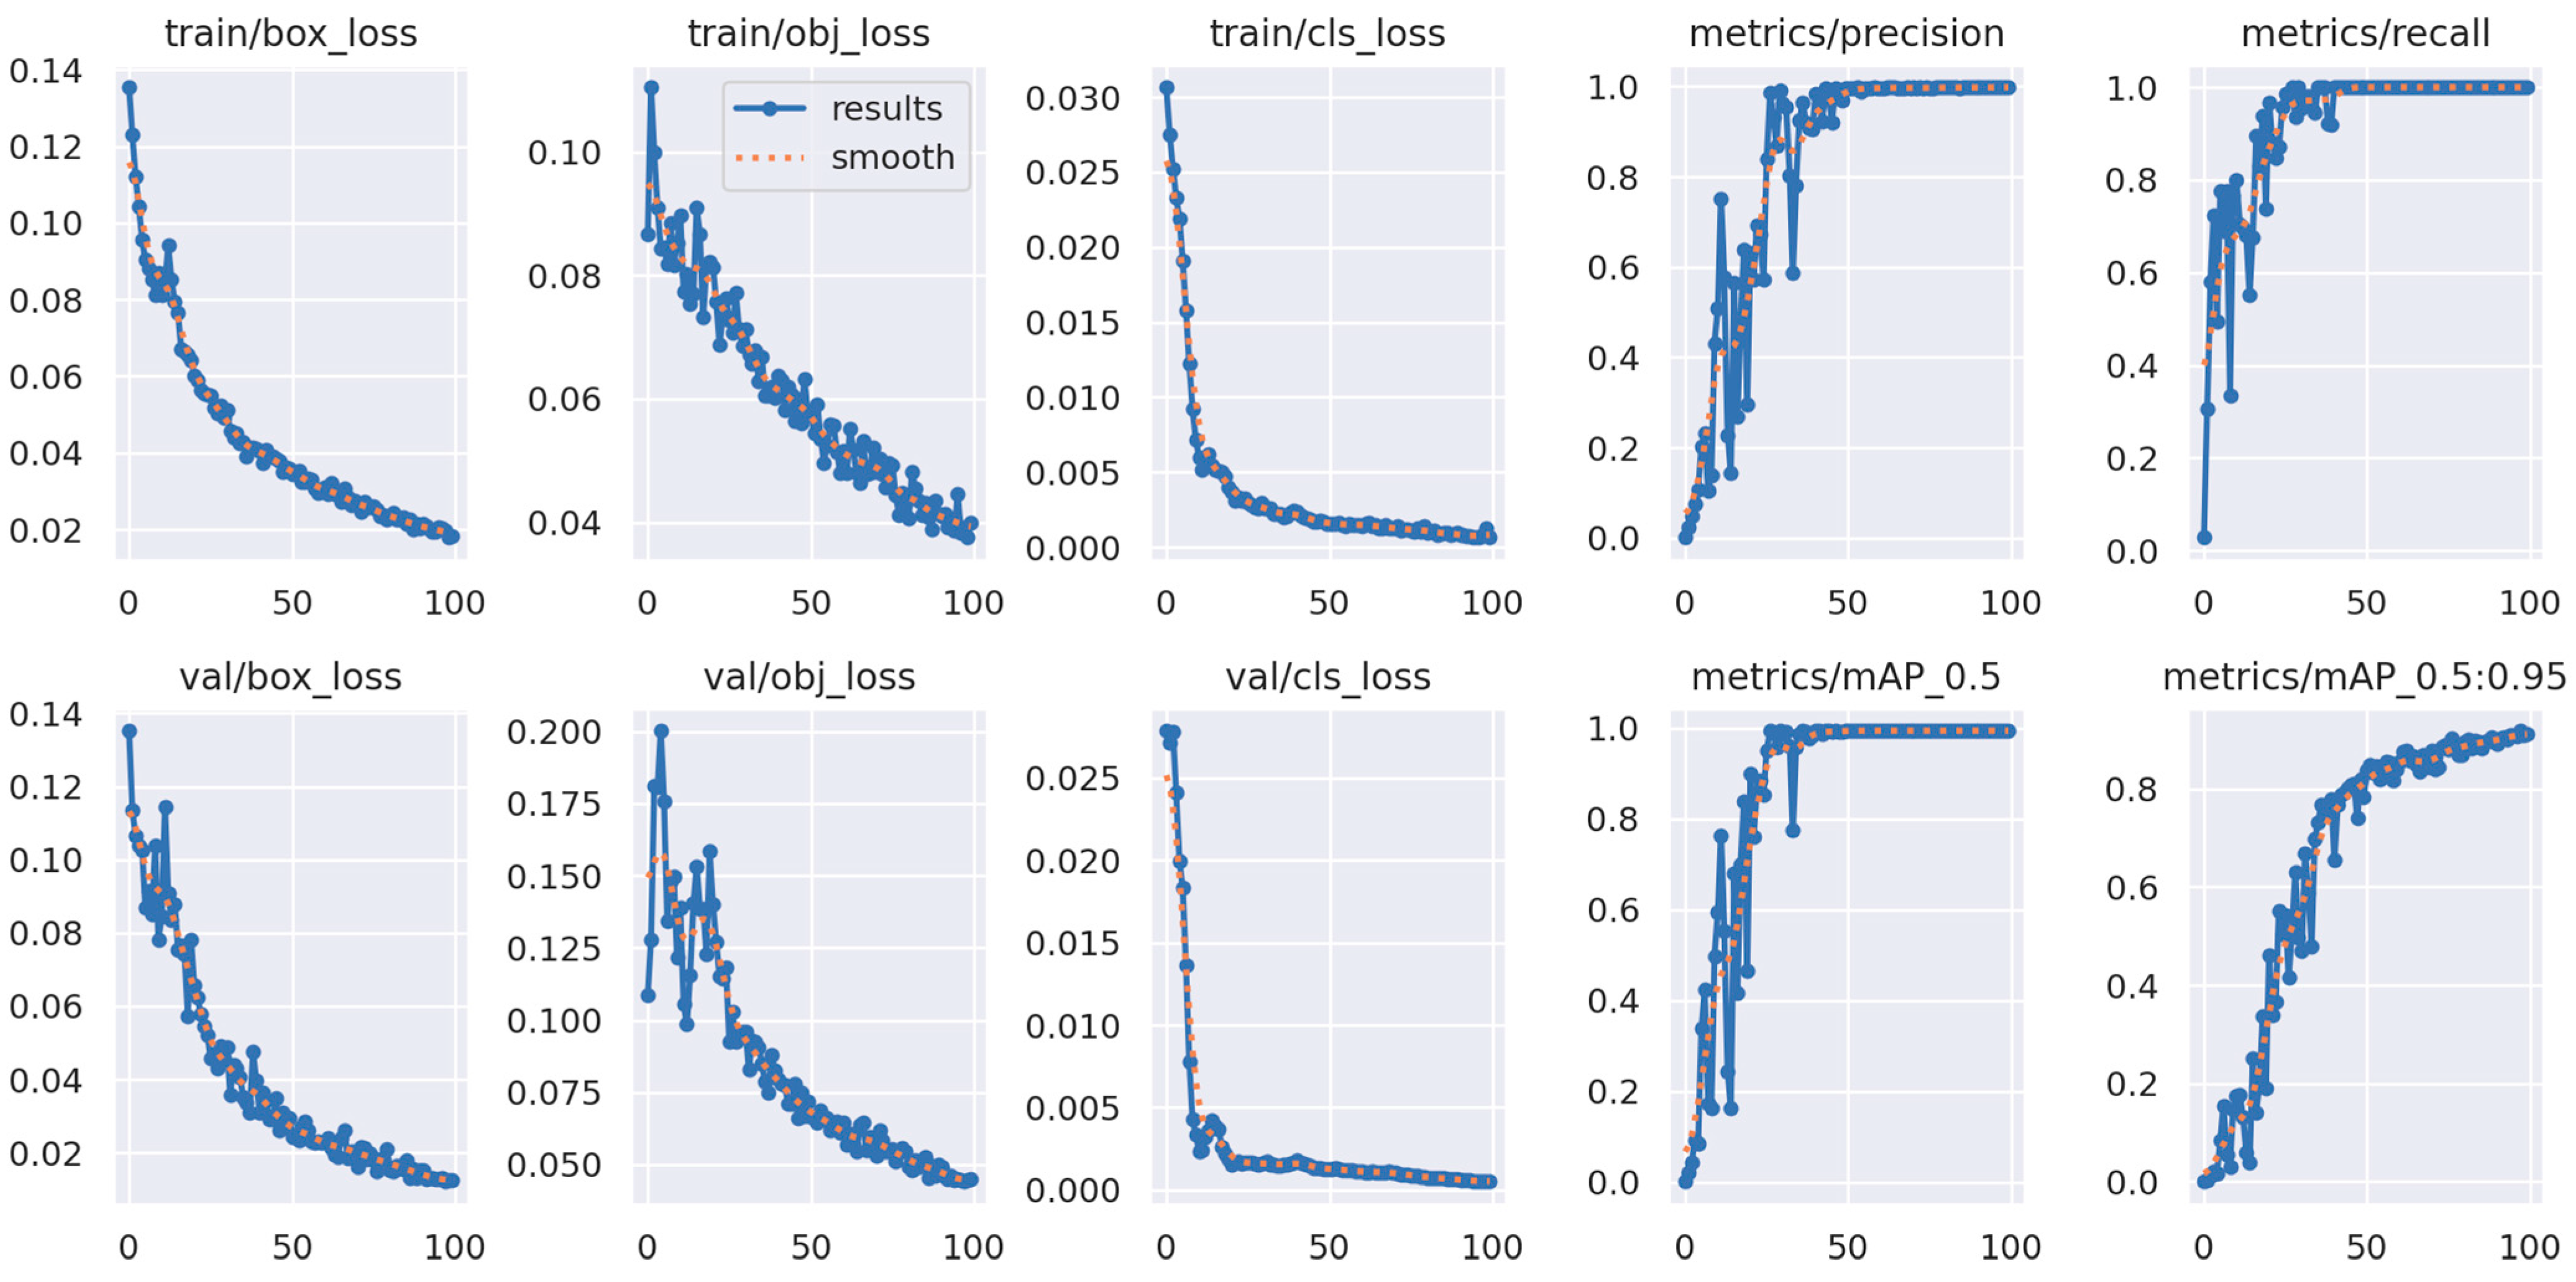
Model optimization was conducted by minimizing a composite loss function composed of three main components: (i) bounding box regression loss, (ii) objectness confidence loss, and (iii) categorical cross entropy loss for classification. Throughout training, key performance metrics—including precision, recall, and mean average precision (mAP)—were monitored to assess learning progression and generalization capacity. In particular, the model was evaluated using mAP@0.5 (mean average precision at 50 percent IoU threshold) and mAP@0.5:0.95, which averages mAP across multiple IoU thresholds ranging from 0.5 to 0.95 in increments of 0.05.
These metrics, along with training loss curves and sample inference results, were analyzed post training to verify the model’s effectiveness in detecting and classifying individual seeds under varying conditions of size and ripeness.
Once trained, the YOLOv5s model was deployed in a real-time inference environment to support the operational classification and sorting of seeds. To ensure reliable decision making before actuation, the detection was performed on the entire image frame, allowing the model to locate and classify all visible seeds. In addition, predefined bounding boxes were virtually positioned over specific conveyor belt regions, just before the entry point to the servo-controlled sorting mechanism. This configuration enabled the system to determine whether a seed classified as good_state or bad_state was present within any of the target zones. Based on the detection result, the corresponding actuator was triggered to direct the seed to its appropriate destination.
The inference logic incorporated a two-level confidence filtering strategy. Detections with confidence scores below 0.35 were discarded to reduce false positives. For detections exceeding this threshold, the bounding box position was evaluated to determine whether the object was located within one of the predefined regions. If the detection was found in a valid area and its confidence exceeded 0.99, a classification check was executed. Detections classified as good_state (optimal ripeness) activated a command that rotated the associated servo motor to 0 degrees, enabling the mechanical sorting operation.
The full decision-making pipeline, which spans from image preprocessing to final actuation, is summarized in Figure 10. This architecture ensures both high responsiveness and robustness in the presence of uncertain or low-confidence detections.

2.2.4. Comparison

The custom CNN model and the YOLOv5s approach adopt fundamentally different strategies for image processing and seed selection within the classification system. These differences are particularly evident in how each model manages image input, applies detection logic, and activates the mechanical sorting mechanism.
The proposed CNN model and the YOLOv5s approach adopt fundamentally different strategies for image processing and seed selection within the classification system, particularly in how they handle image input, apply detection logic, and activate the mechanical sorting mechanism. The CNN model operates on predefined cropped regions of interest, each corresponding to a specific area on the conveyor belts located just before the servo-actuated sorting unit. By limiting the analysis to these fixed zones, the system avoids processing the entire image, reduces the risk of overcounting due to overlapping seeds, and minimizes computational demand. Each ROI is independently classified as either good_state or bad_state, and actuation is triggered only when a seed is identified within one of these regions. This method provides high execution efficiency, with an average inference time of 12.3 milliseconds per region, making it particularly suitable for deployment on resource-constrained platforms such as the Raspberry Pi.
In contrast, the YOLOv5s model performs analysis of the entire image frame in a single inference pass, simultaneously detecting and classifying all seeds present. Instead of relying on cropped input regions, the model outputs bounding boxes along with associated class labels for each detected object. To localize sorting decisions, three virtual decision zones are overlaid onto the frame, each aligned with a specific conveyor belt. After each inference cycle, the system evaluates whether any detected seed lies within one of these zones. If so, the corresponding servo motor is activated to direct the seed to the appropriate output container. Although this strategy requires greater computational resources and results in an average inference time of 41.7 milliseconds per frame, it provides a comprehensive understanding of the entire scene and allows for increased flexibility in handling positional variations in seeds across the conveyor width.
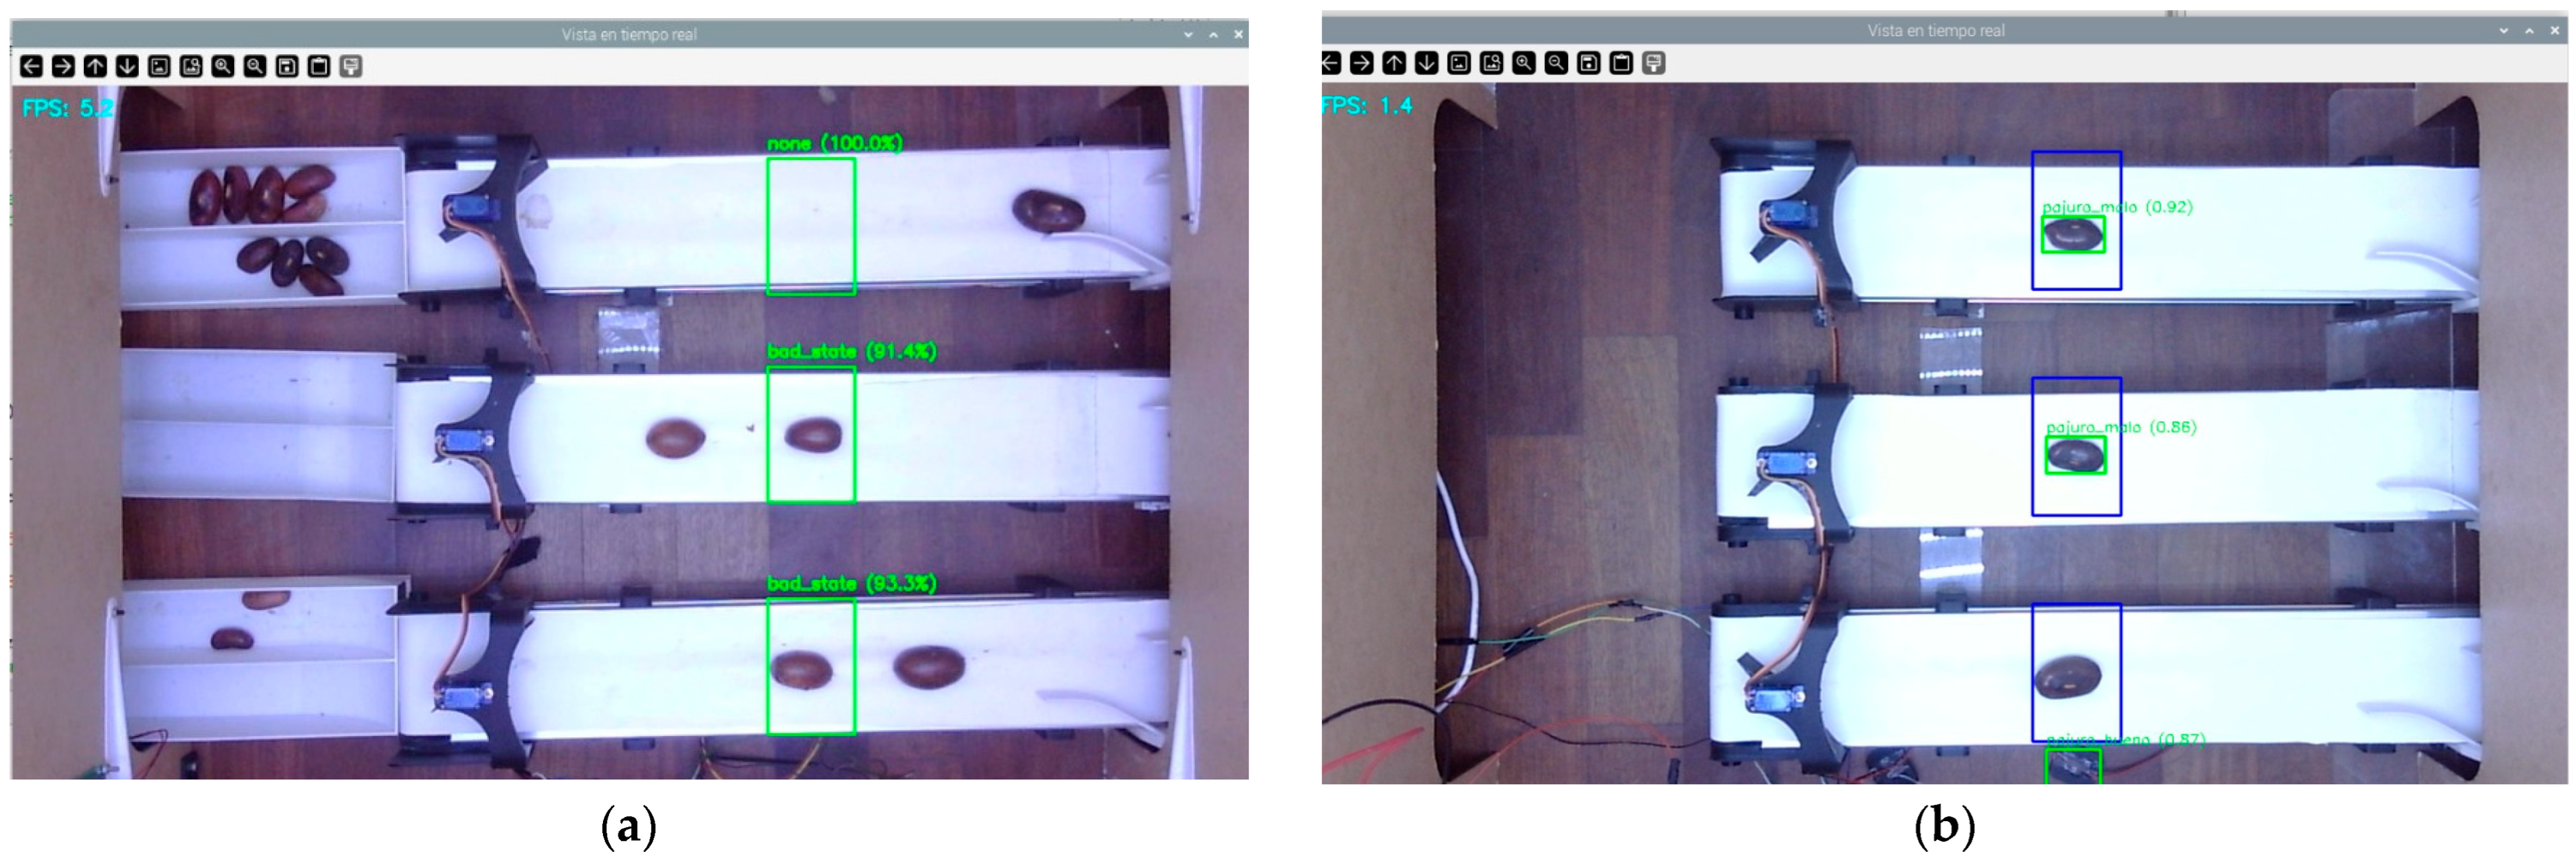
The practical differences between these two approaches are illustrated in Figure 11. In Figure 11a, the behavior of the CNN model is shown, where only the predefined regions of interest are analyzed, and each produces a binary classification result that triggers actuation. In Figure 11b, the YOLOv5s implementation is shown, where the entire image frame is processed to detect all visible seeds, and actuation is determined based on whether a detected object intersects any of the virtual decision zones.
The average fps values reported for both the CNN and YOLOv5s models were measured during real-time execution on a Raspberry Pi 5 with 8 GB RAM, using a USB webcam at 1080 p resolution. Inference time was computed on a frame-by-frame basis using the expression in Python 3.9, see Equation (4).
f p s = 1.0   /   ( t i m e . t i m e ( ) s t a r t _ t i m e )
where s t a r t _ t i m e represents the moment before processing each frame. The fps was then displayed in real time using the c v 2 . p u t T e x t ( ) function from OpenCV and averaged over several seconds to ensure consistency and reduce fluctuations. This method captures the effective processing rate perceived during live classification with camera input.

2.2.5. Selection System Logic

The core function of the selection system is to translate the output of the neural network models into physical actions that direct each seed to its appropriate destination. Although the proposed CNN and the YOLOv5s models rely on different detection methodologies, both approaches implement actuation through servo mechanisms controlled by the classification results.
In the CNN approach, the decision to activate a servo is determined by the classification output of each predefined region. Once a region is evaluated and a class label is assigned, the system immediately maps this label to a corresponding sorting action. A seed classified as good_state prompts the servo to route it into the bin designated for viable seeds, while a bad_state triggers diversion to a separate compartment. If no seed is detected or the classification is inconclusive, no actuation occurs. This direct correspondence between the classification result and actuator response simplifies the control logic and ensures precise timing.
In the YOLOv5s pproach, the selection logic evaluates whether any detected bounding box, along with its associated class label, falls within a virtual decision zone defined on the image frame. Each zone is spatially aligned with a specific conveyor belt. When a bounding box labeled as good_state or bad_state intersects one of these zones, the system activates the corresponding servo mechanism. This spatially selective actuation ensures that only seeds properly aligned with the conveyor belts trigger a sorting action.
In both implementations, actuation commands are issued as PWM signals generated by the Raspberry Pi and are synchronized with the classification output. While the CNN strategy relies on localized region-wise classification, and YOLO applies spatial filtering after detection, the final decision in both systems is governed by a conditional trigger: mechanical sorting occurs only when a seed is confidently classified and correctly positioned within the designated area.

3. Results and Discussion

3.1. Training Behavior and Model Stability

The proposed convolutional neural network was trained using a five-fold stratified cross-validation protocol applied to a dataset of 2010 labeled images. Each image was segmented into regions of 140 × 140 pixels and categorized into two classes: good_state (optimally ripe) and bad_state (overripe). For each fold, the model was trained for 30 epochs using a batch size of 16, the Adam optimizer with a learning rate of 0.001, and the categorical cross entropy loss function.
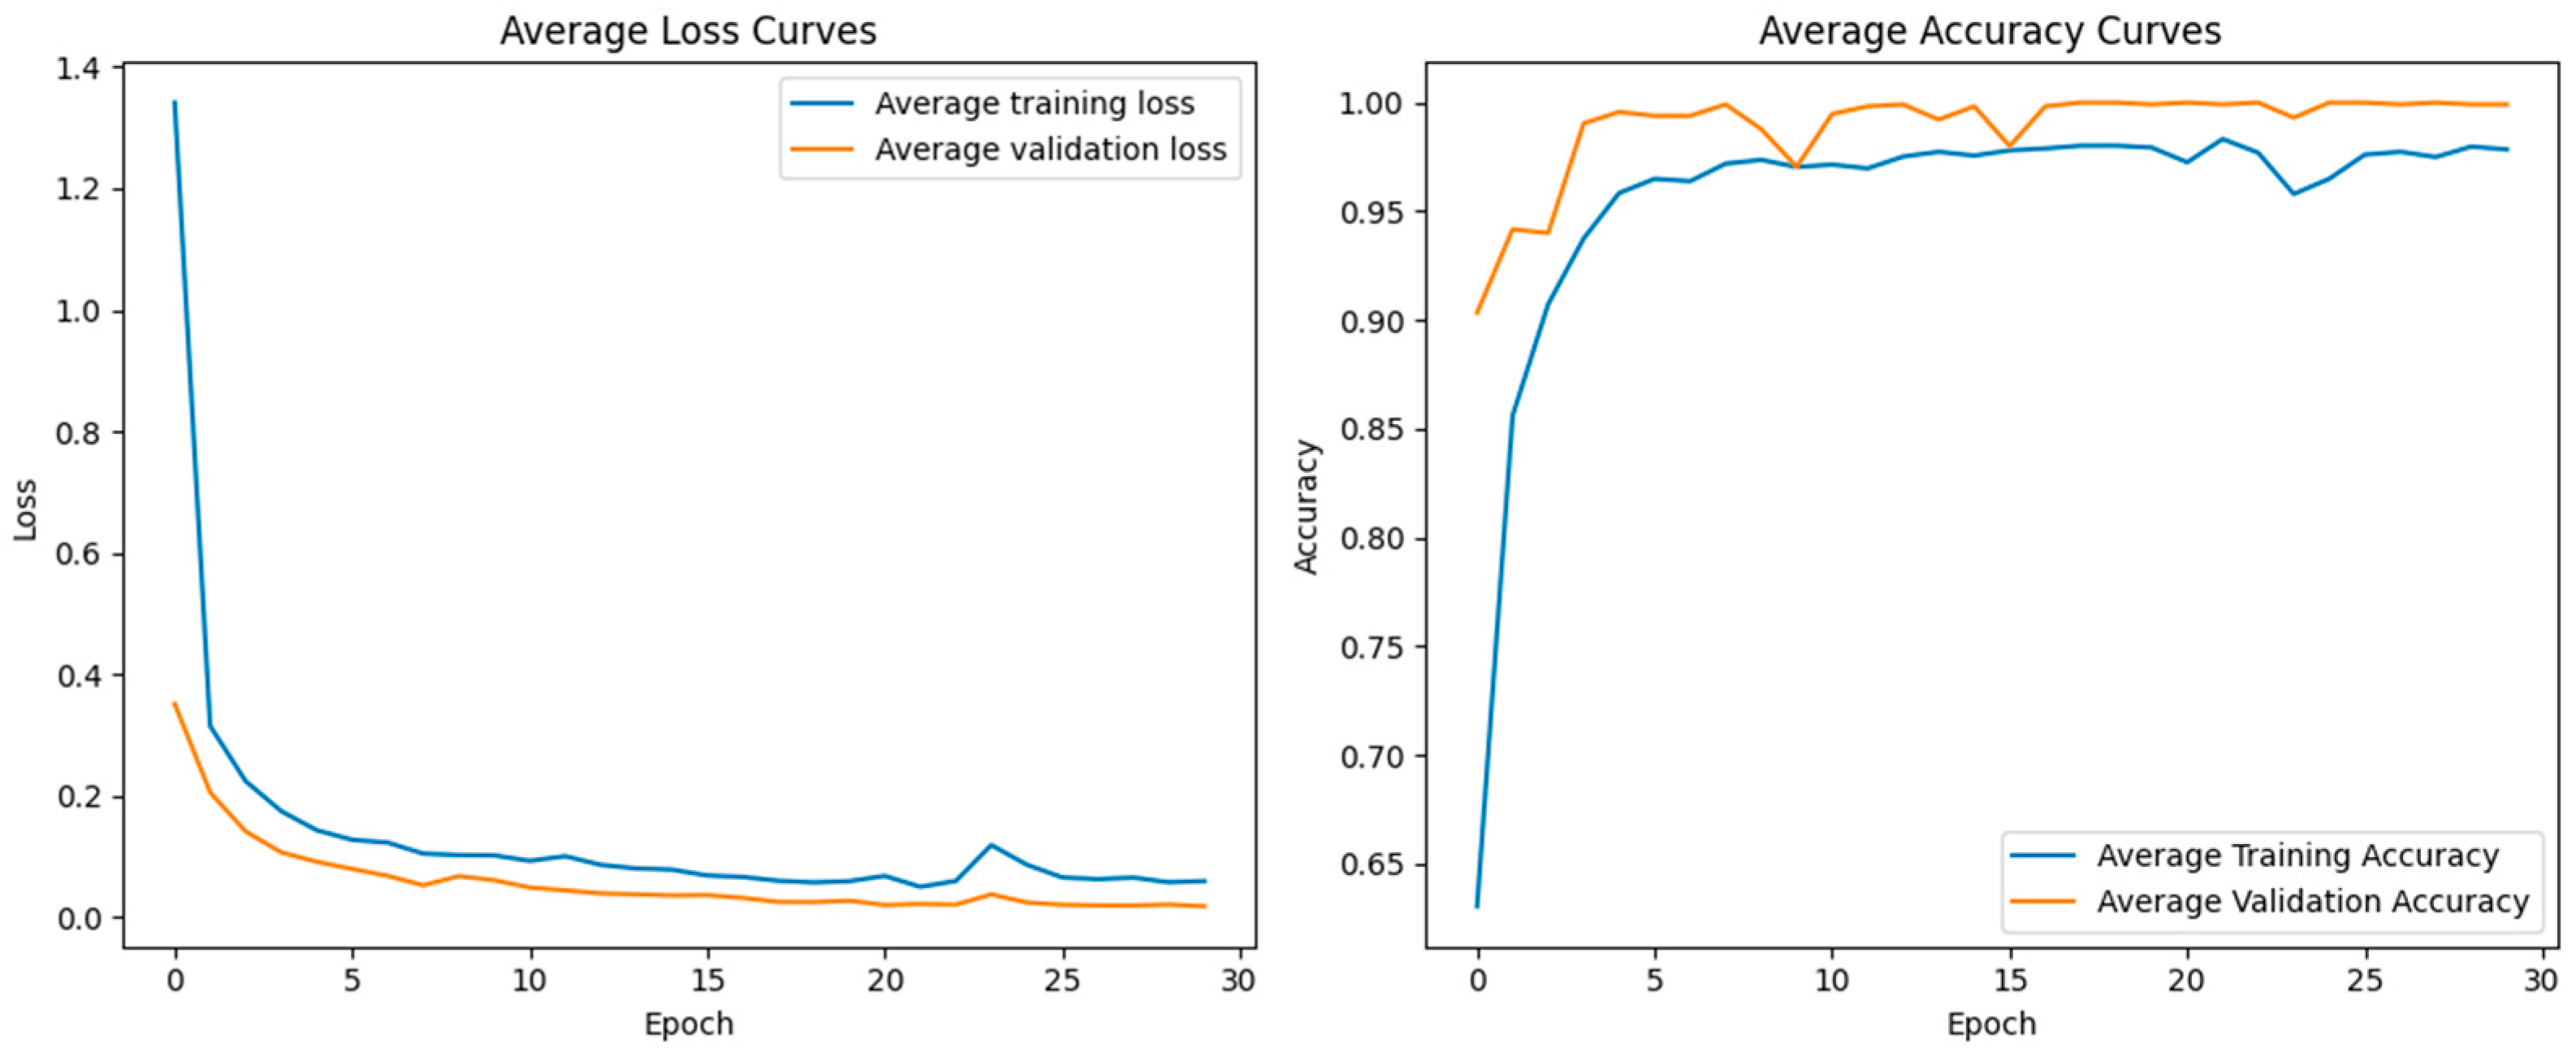
The average training and validation curves obtained from the cross-validation procedure are shown in Figure 12. The results indicate early convergence, with accuracy exceeding 98 percent by epoch 10 and loss values approaching zero. The mean performance across the folds reveals consistent validation behavior with minimal signs of overfitting, which is attributed to the inclusion of dropout layers and the fixed region segmentation strategy applied during preprocessing.
The model demonstrated high robustness throughout training, as reflected in the average curves across the five validation folds. Classification accuracy consistently exceeded 98 percent after the first 10 epochs, and loss values approached zero before epoch 20. The averaged trends reveal stable convergence with minimal signs of overfitting, which can be attributed to the use of dropout layers and the fixed-size patch segmentation strategy. The final average validation accuracy reached 99.5 percent, confirming the model’s ability to reliably extract ripeness-related features from RGB input data under controlled conditions.
To evaluate the risk of overfitting in the proposed convolutional neural network, a five-fold cross-validation strategy was implemented during training. The classification metrics obtained across all folds were consistent, demonstrating strong generalization capability. Furthermore, the training and validation curves exhibited stable and parallel convergence, with no evidence of divergence or oscillatory behavior. These results indicate that the model successfully avoids overfitting, despite the moderate size of the dataset (2010 images), thanks to its compact design and the relatively low number of trainable parameters.
In contrast, the YOLOv5 model, although capable of processing entire images in real time, exhibited slightly lower classification accuracy when evaluated under the same conditions. While it achieved high mean average precision (mAP) values and provided integrated object localization, it showed greater sensitivity to background noise and object scale variation. These factors, combined with its higher computational demand, made it less efficient in scenarios with fixed and known object positions, such as the one addressed in this study. The training and validation loss curves of the YOLOv5 model, generated during the training phase on Google Colab, are presented in Figure 13. These curves illustrate the model’s convergence behavior and performance stability during the learning process.
Overall, the proposed CNN model outperformed YOLOv5 in terms of classification accuracy, training consistency, and suitability for deployment in structured environments. Its tailored architecture, specifically designed for the characteristics of the pajuro grain dataset, resulted in a more reliable and resource-efficient solution.

3.2. Cumulative Classification Results

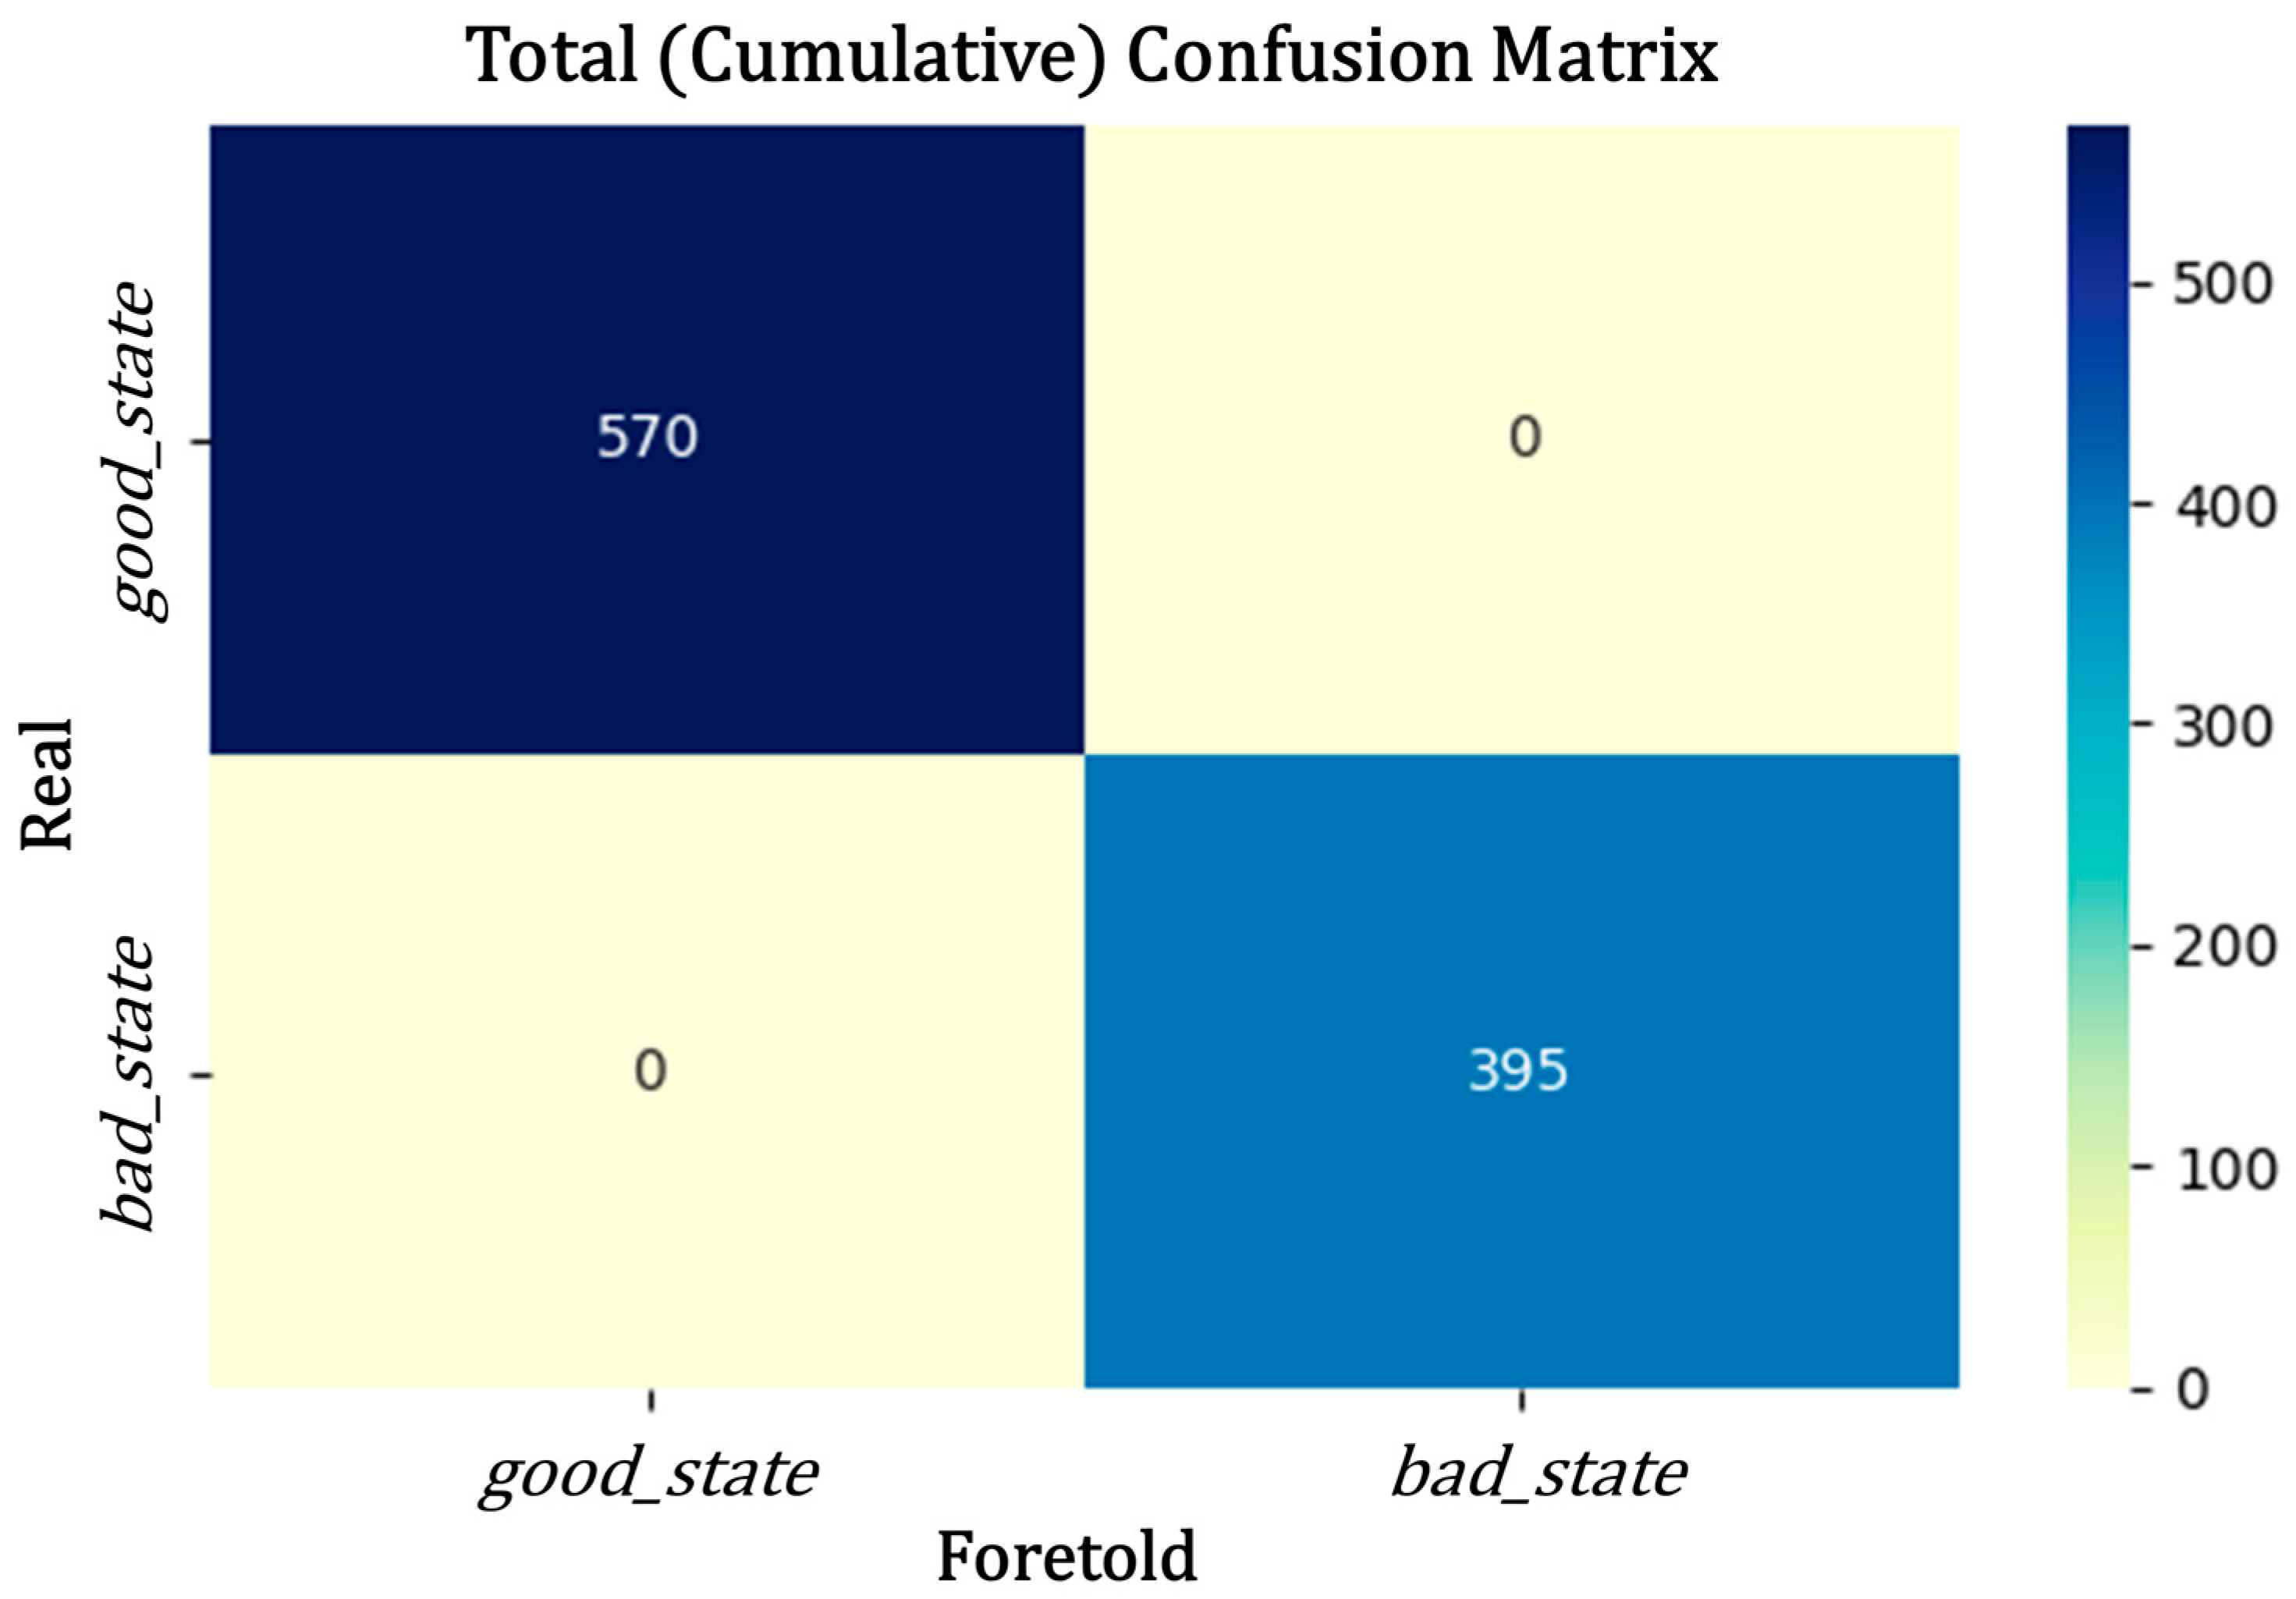
The cumulative performance of the proposed model across all test sets demonstrated perfect classification: all 570 segments labeled as good_state and 395 labeled as bad_state were correctly identified. These labels, defined during the manual annotation phase of the dataset, represent the two quality categories used by the vision system—good_state corresponding to acceptable pajuro beans and bad_state to defective ones. The aggregated confusion matrix, shown in Figure 14, confirms the absence of misclassifications across both classes.
Such reliability is essential in real-time sorting environments, where even isolated errors can result in incorrect actuator responses, either by rejecting viable beans or by failing to remove defective ones.
The precision, recall, and F1 score values for both the proposed CNN and YOLOv5s models are presented in Table 7. While the YOLO model achieved strong performance, the CNN architecture demonstrated superior results in both classes, reaching perfect or near-perfect scores. These findings indicate that models specifically designed with domain-specific constraints, such as consistent seed morphology and fixed image patch sizes, can outperform general object detectors in highly structured and specialized classification tasks.
The discrepancy in performance is particularly evident in the recall values, where the proposed CNN model achieved 0.997 for both classes, indicating a lower rate of false negatives. This aspect is especially relevant in agricultural sorting tasks, where failing to detect a defective or overripe seed can compromise product quality or contaminate downstream processing stages. Similarly, the F1 scores confirm the model’s consistency across classes, showing no significant tradeoff between precision and recall.
In terms of efficiency, the average inference time per image segment was 12.3 milliseconds for the CNN model, compared to 41.7 milliseconds for YOLO. This difference, representing more than a threefold increase in speed, is primarily attributed to the CNN’s simpler architecture, optimized input size, and the absence of a complete object localization pipeline. With an inference rate of approximately five frames per second, the proposed model supports real-time operation, even on low-power devices. In contrast, YOLO’s more general framework, although robust and widely adopted, imposes a higher computational load and is less suited for environments with limited hardware resources and energy availability.
This substantial gain in both speed and accuracy positions the proposed CNN model as a practical solution for embedded agricultural applications, such as seed sorting or quality control systems operating on platforms like the Raspberry Pi. Moreover, the fixed input configuration used during training ensures stable performance, as the model does not need to generalize across varying object scales, random positions, or complex backgrounds, which are often sources of error in task-specific scenarios using general detection frameworks.

3.3. Evaluation of Alternative YOLO Models

To support the selection of YOLOv5s as the baseline model, additional experiments were conducted using two alternative object detection architectures: YOLOv5n and YOLOv8. These evaluations were performed under identical classification tasks and hardware constraints to ensure fair comparison.
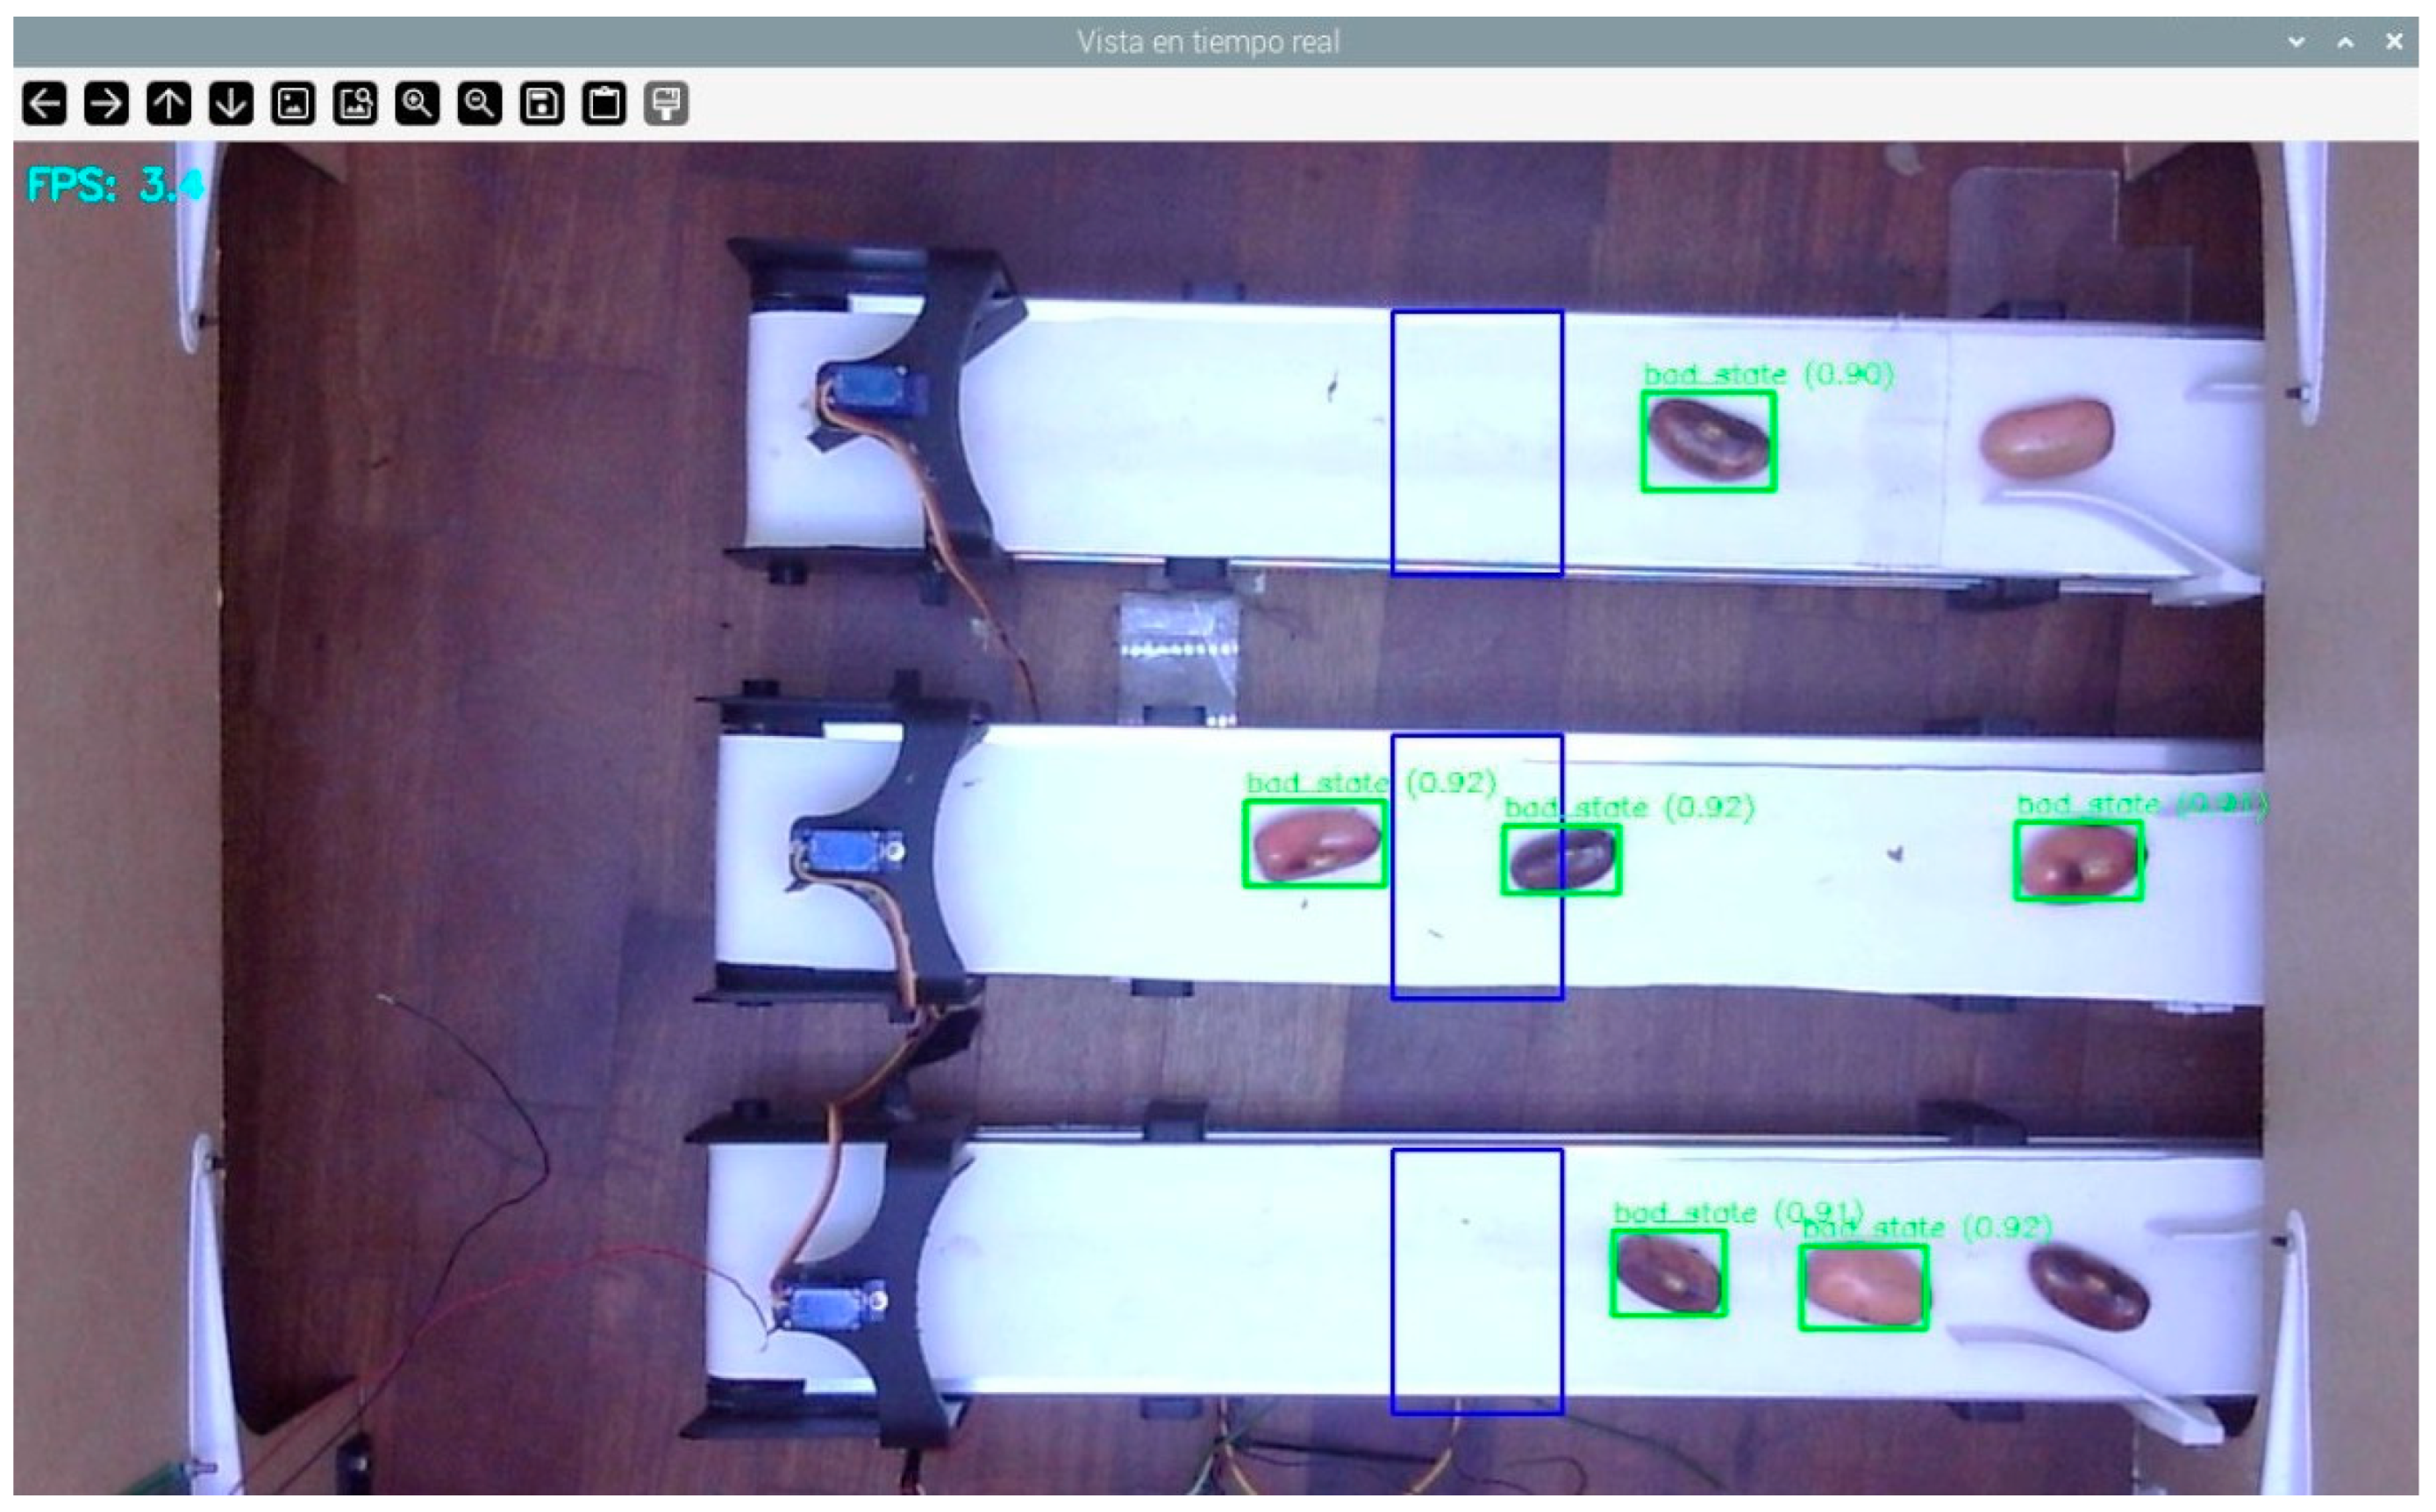
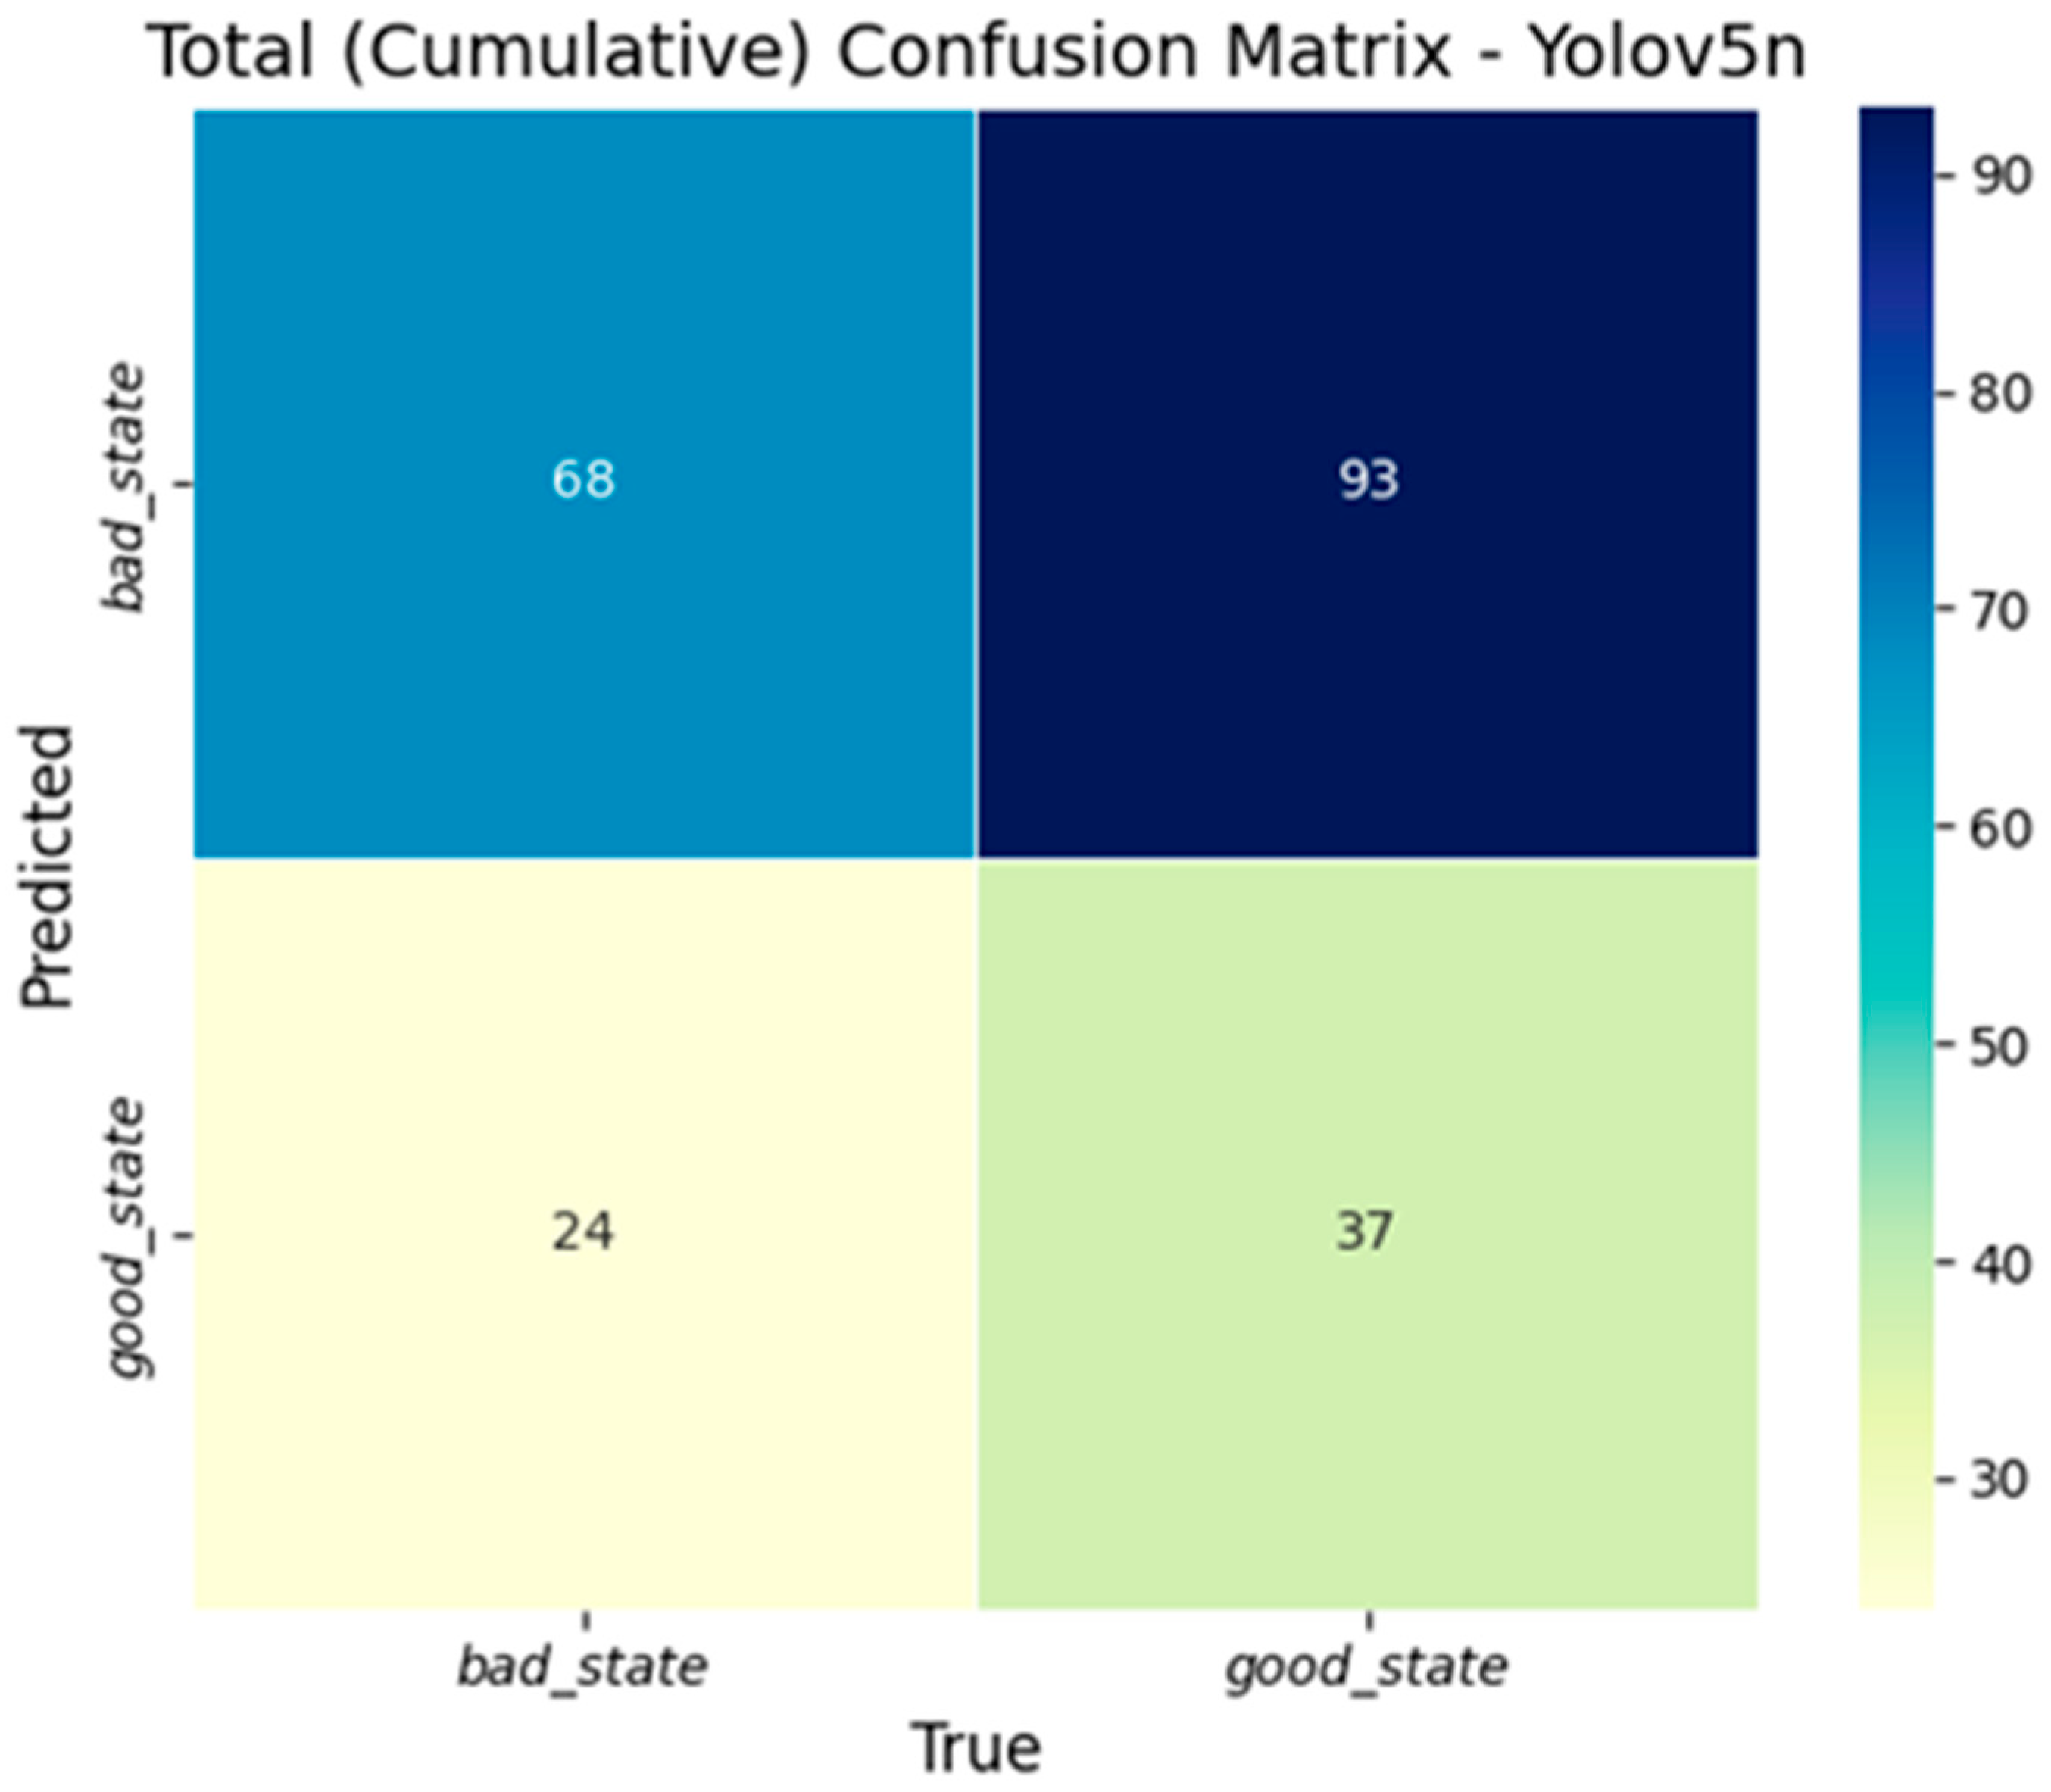
YOLOv5n was selected due to its lightweight design, which prioritizes inference speed and a reduced computational load. On the Raspberry Pi 5, it achieved an average processing speed of 3.5 frames per second. However, this gain in speed came at the expense of classification accuracy. As shown in Figure 15, the model systematically misclassified all detected regions as “bad_state”, regardless of actual seed maturity. This behavior is further confirmed by the confusion matrix in Figure 16, which reveals a complete absence of true positives for the “good_state” category. Despite its high speed, YOLOv5n fails to meet the accuracy requirements necessary for reliable real-time agricultural sorting, making it unsuitable for the intended application.
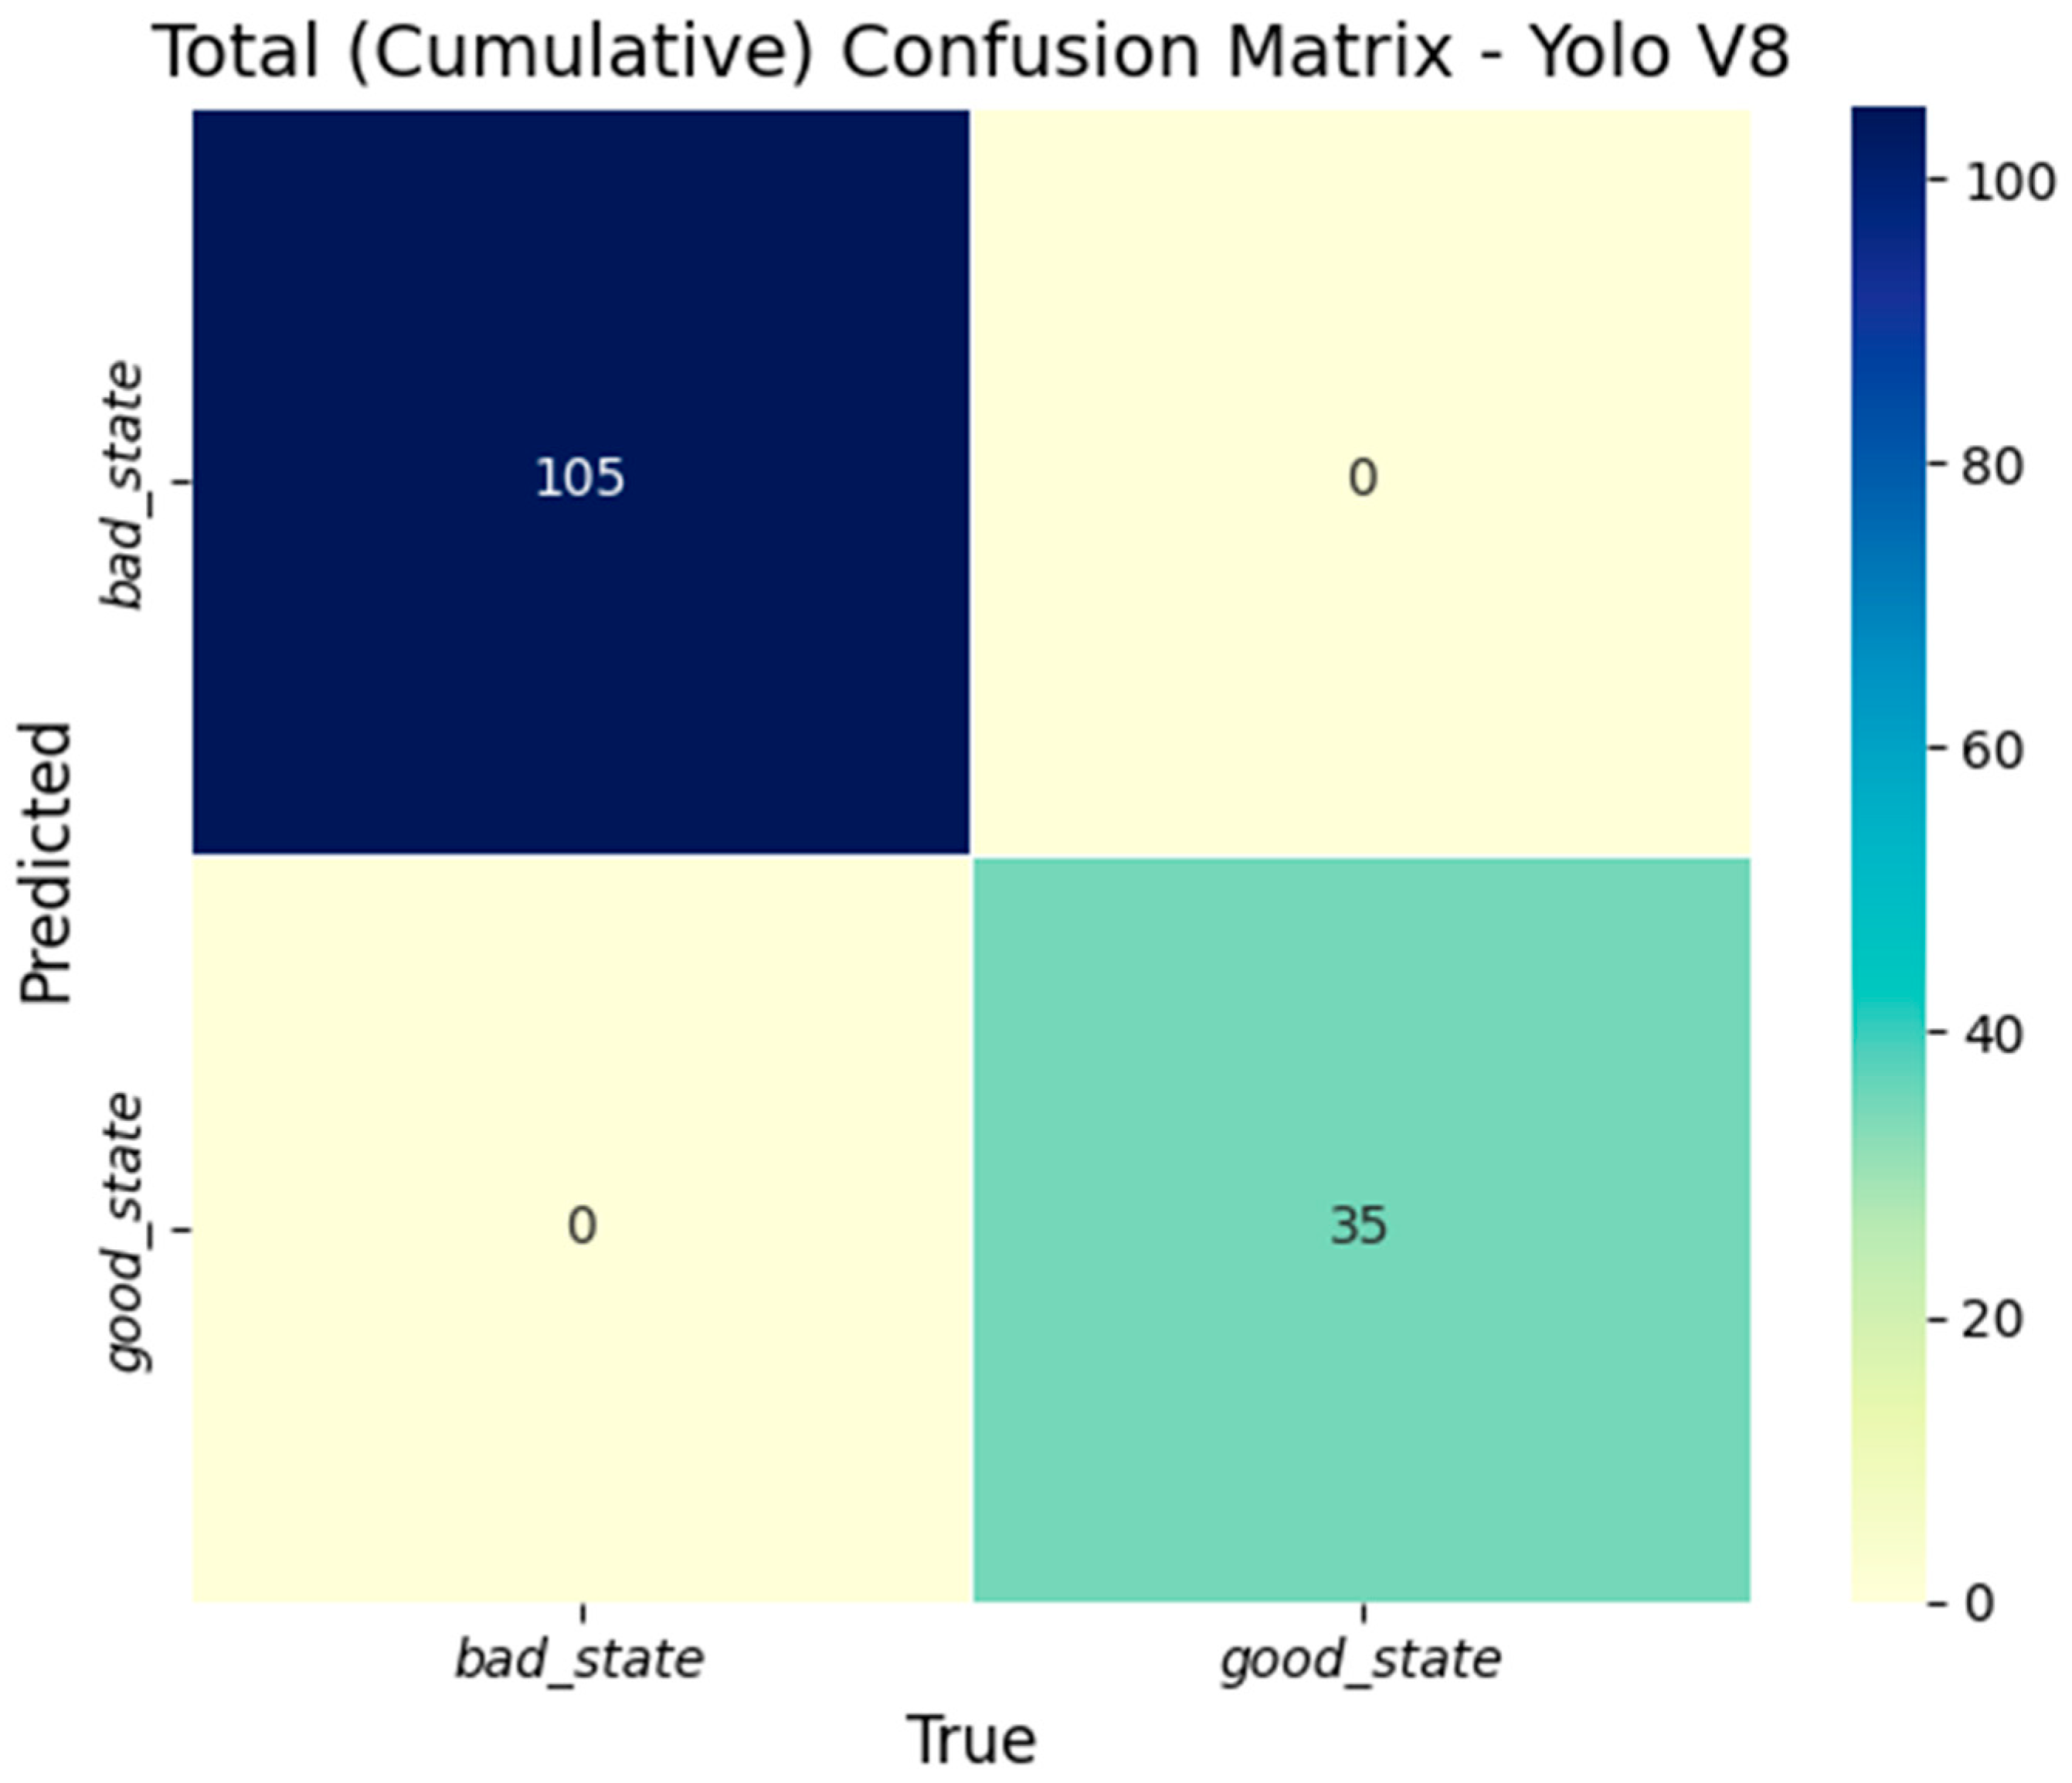
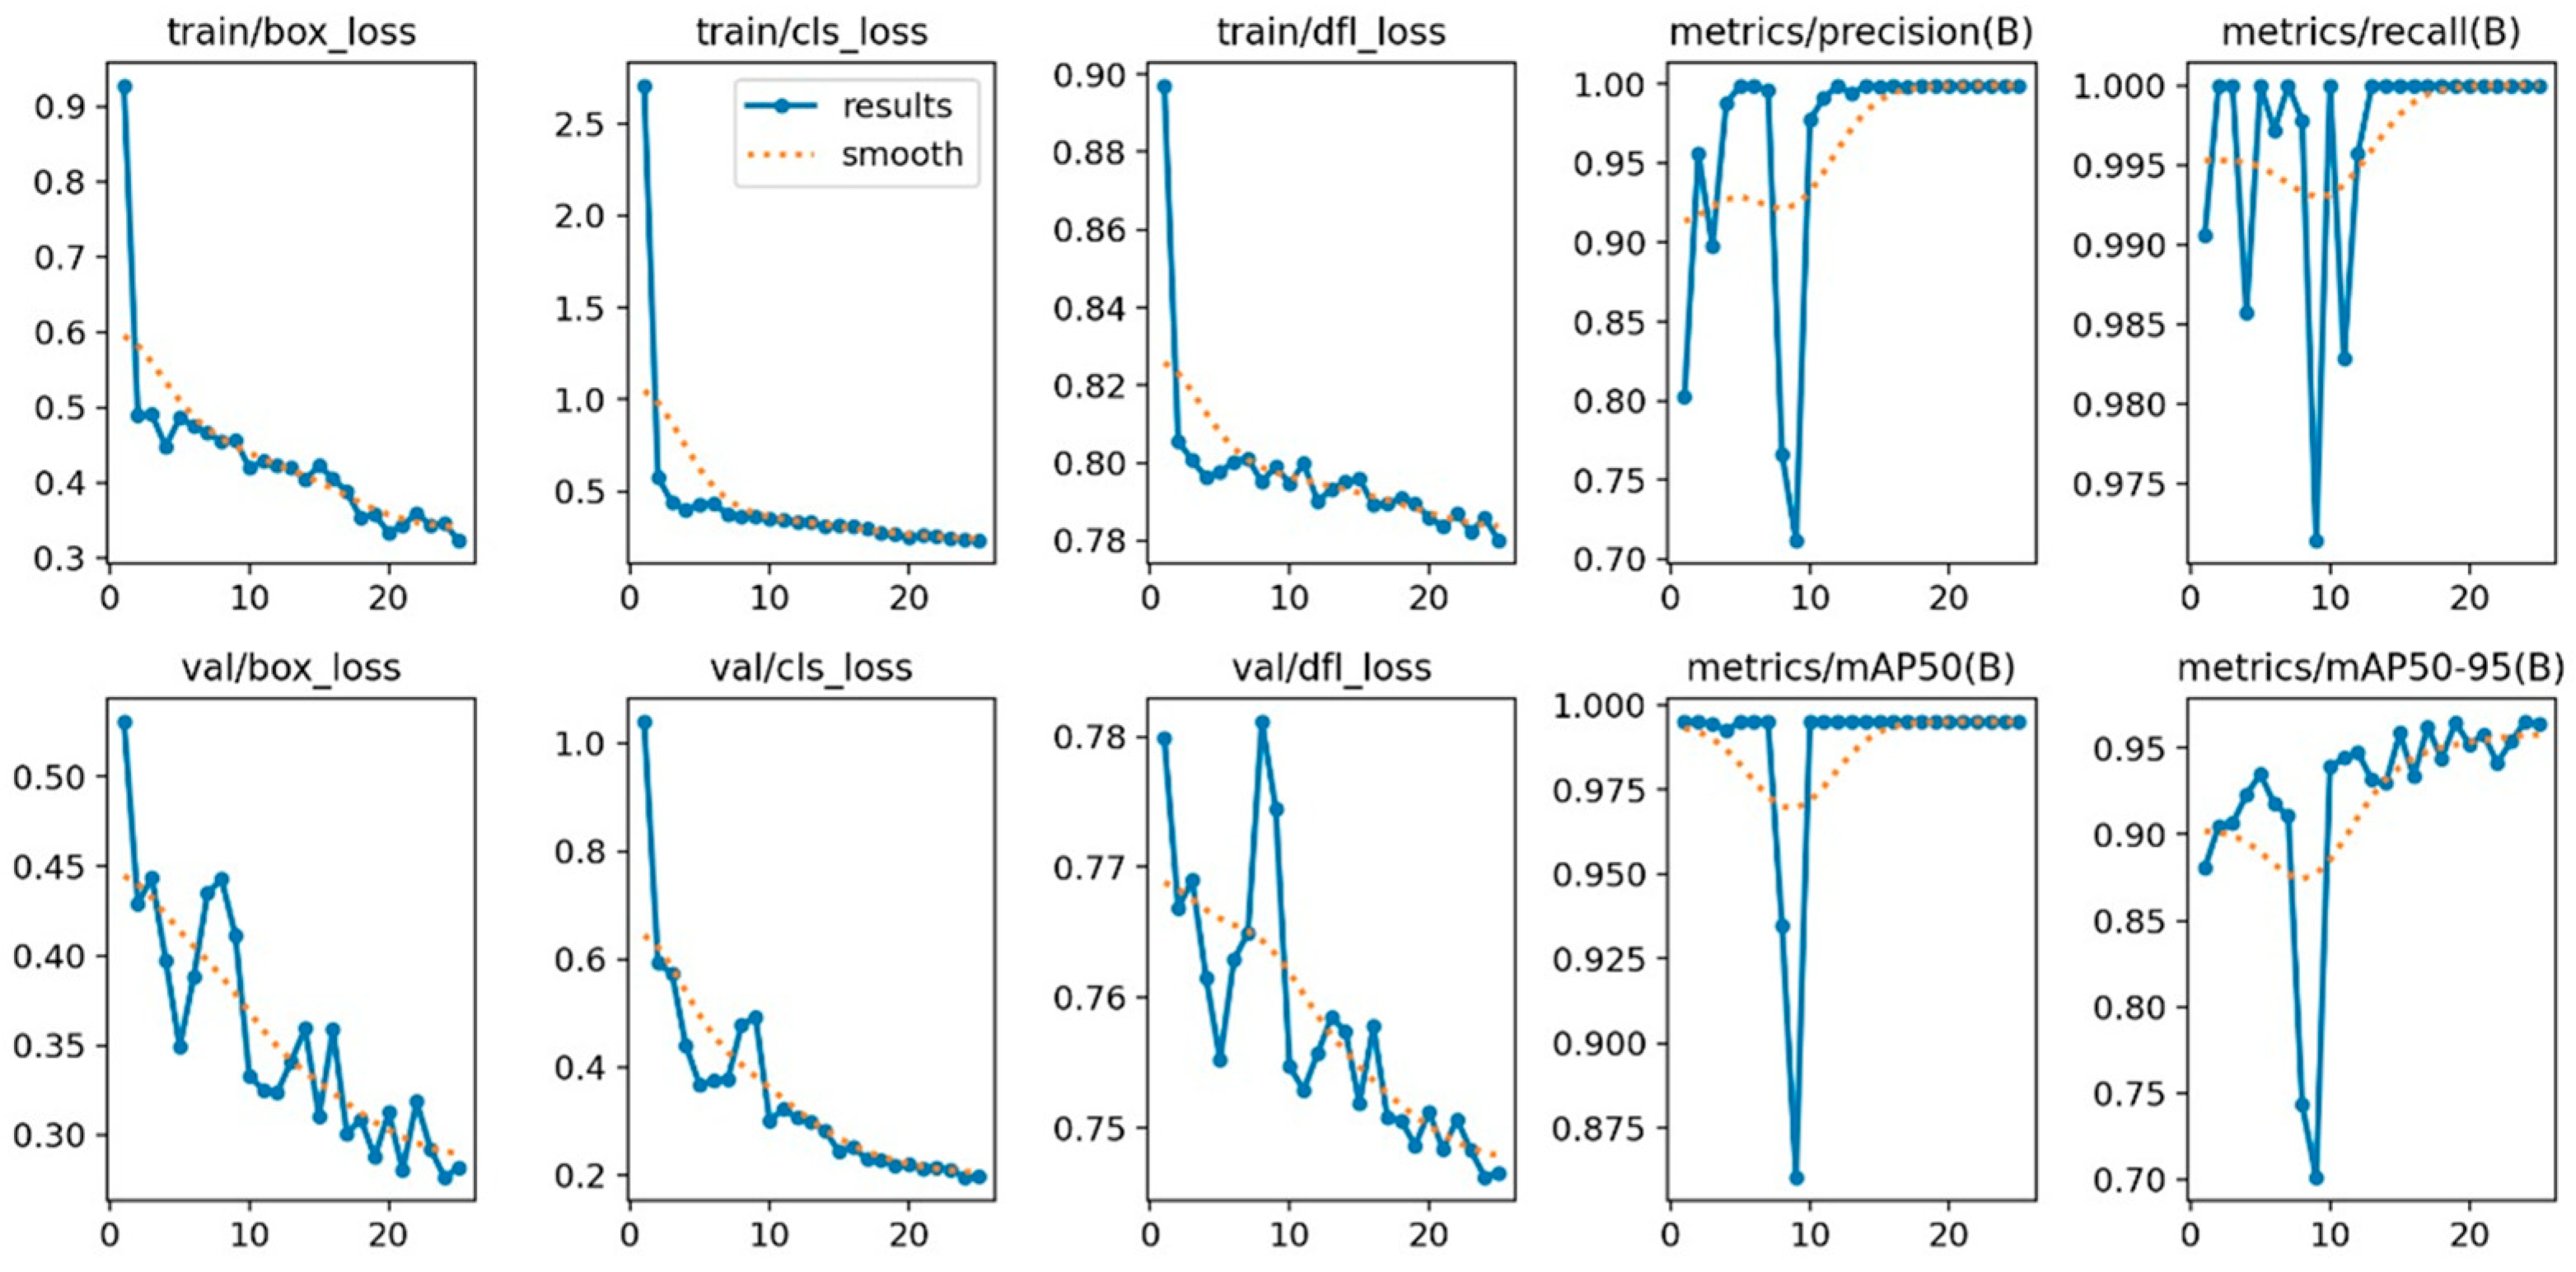
In contrast, YOLOv8 exhibited markedly superior classification performance. Validation metrics indicated a precision of 99.9%, a recall of 99.8%, and an mAP50 score of 96.9%. The confusion matrix presented in Figure 17 confirms complete separation between the “good_state” and “bad_state” classes, reflecting high predictive reliability. Furthermore, the training curves shown in Figure 18 demonstrate consistent loss minimization and stable evolution of performance metrics over 25 epochs, suggesting effective learning and generalization.
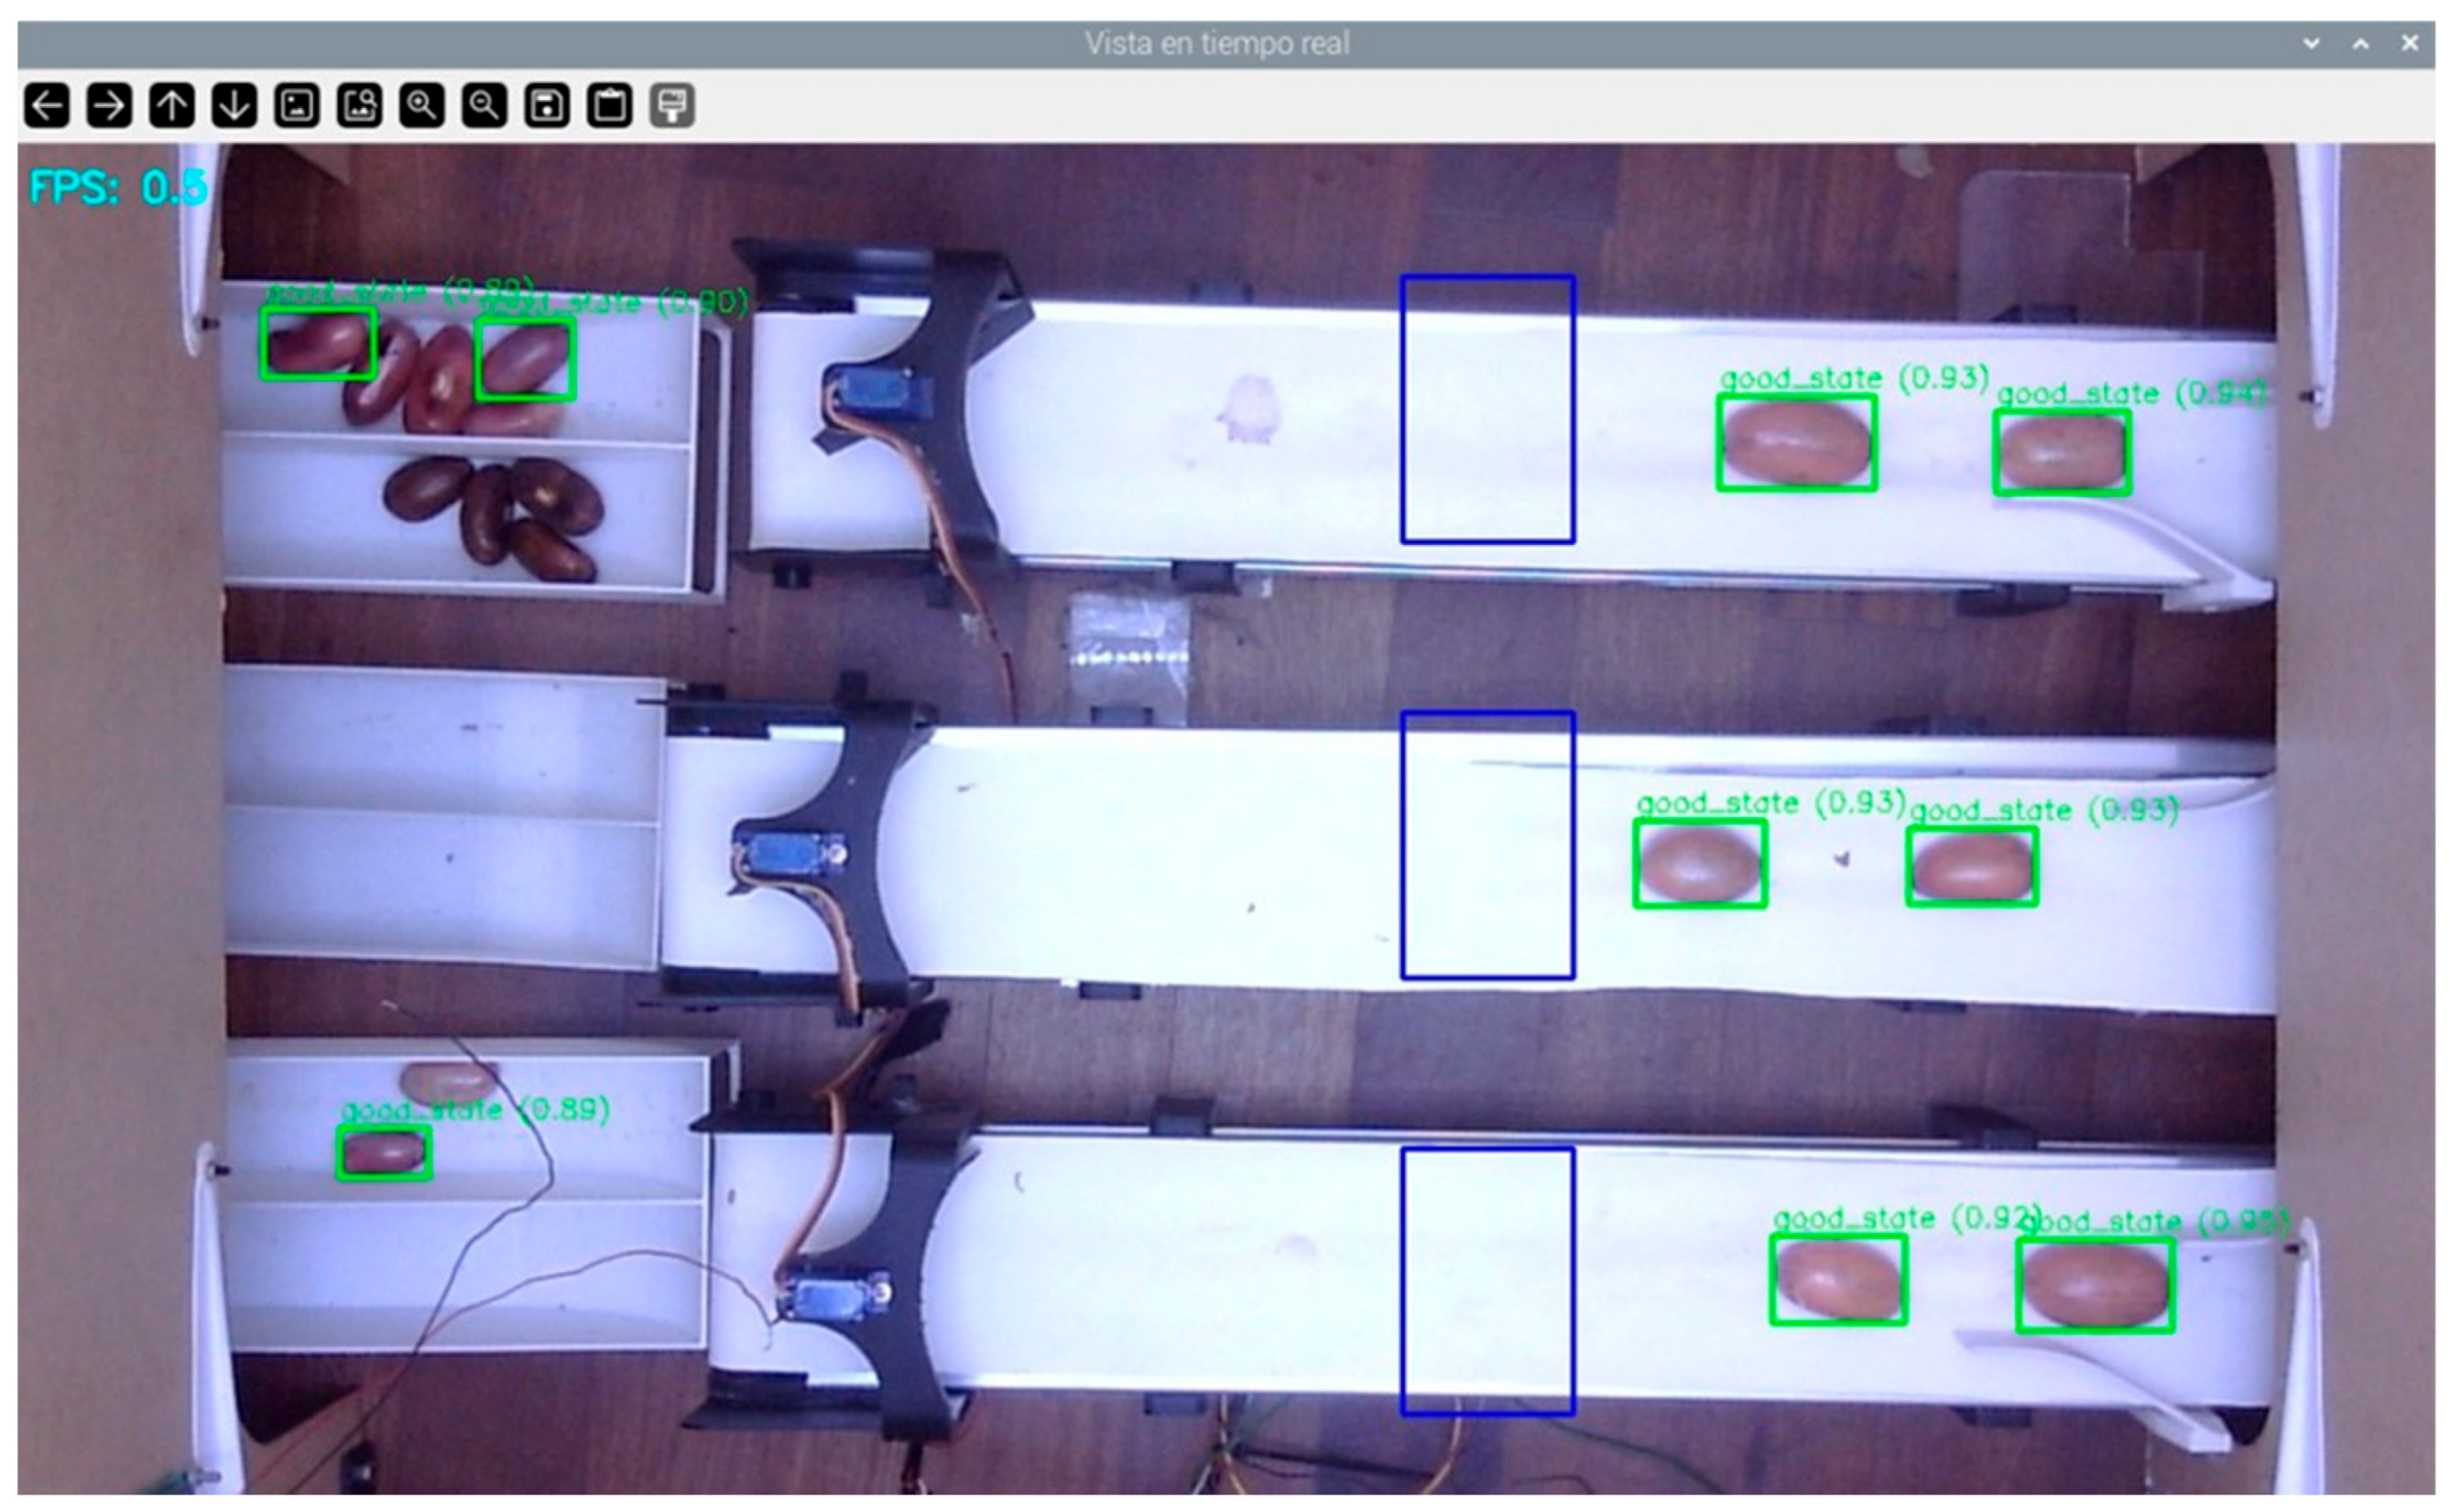
Despite these strengths, inference tests conducted on the Raspberry Pi 5 revealed a critical limitation: the model achieved an average frame rate of only 0.5 fps, as depicted in Figure 19. This low inference speed makes YOLOv8 unsuitable for real-time deployment in conveyor-based sorting systems, where rapid detection and actuation are essential for operational viability.
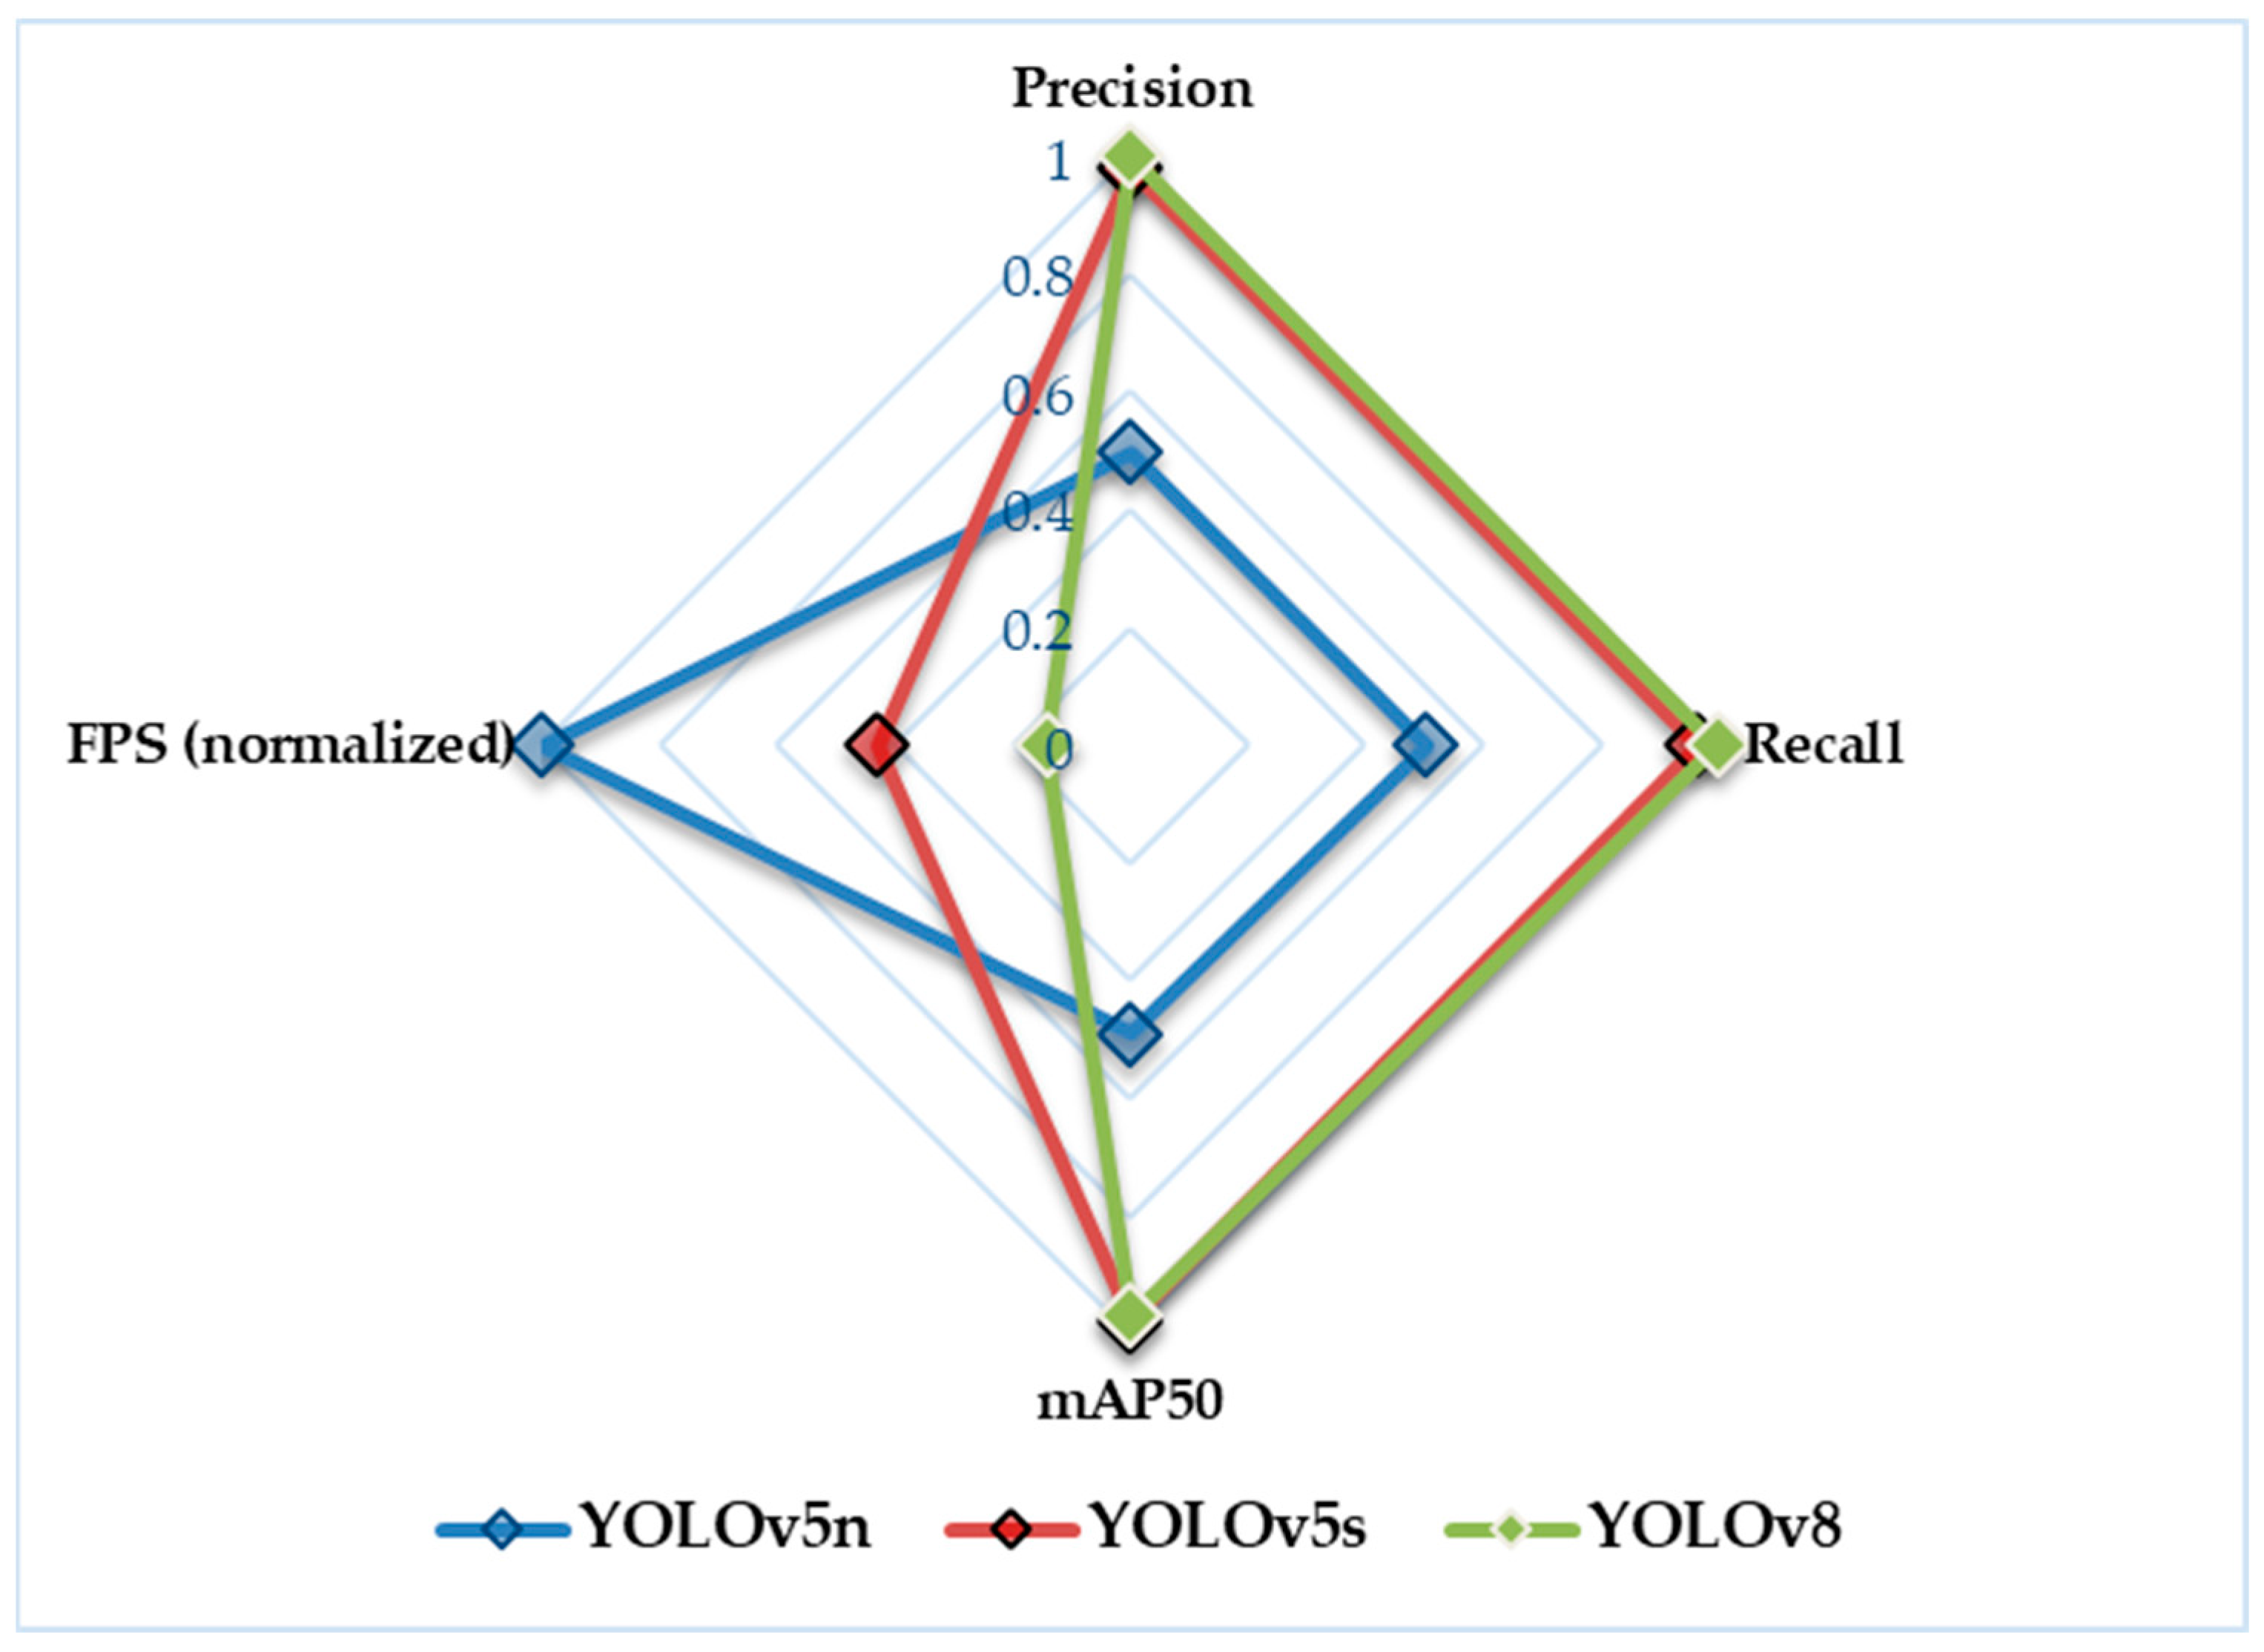
To summarize and compare the performance of all evaluated YOLO models, Table 7 presents the key classification metrics and inference speeds. Additionally, a radar plot is included in Figure 20 to visually illustrate the trade-offs between accuracy and processing speed across the three architectures.
The results confirm that YOLOv5s offers the most balanced solution for the embedded application requirements of this study. It achieves high classification accuracy while maintaining a processing speed compatible with real-time deployment on the Raspberry Pi 5. Although YOLOv8 demonstrated the highest accuracy, its low inference speed (0.5 fps) renders it unsuitable for time-sensitive sorting tasks. Conversely, YOLOv5n delivered a higher processing speed (3.5 fps) but failed to provide reliable classification, as it misclassified all samples.
The fps values reported in Table 8 were obtained using the same real-time evaluation methodology described in Section 2.2.4, ensuring consistent and comparable results. Based on this analysis, YOLOv5s was selected as the baseline architecture, as it provides the best trade-off between detection accuracy and inference latency under the hardware constraints of this study.

3.4. Comparison with Human Performance

To evaluate the effectiveness of the automated classification system relative to manual labor, a comparative study was carried out involving human operators. Each bean was individually assessed by three experienced local workers with practical knowledge of pajuro harvesting and manual sorting procedures in the Luya region (Amazonas, Peru). The classification results were then compared with the predictions produced by both neural network models.
For reference labeling, a consensus approach was adopted: the label assigned to each bean corresponded to the majority vote among the three evaluators, meaning that at least two operators agreed on the same class. This consensus served as the ground truth to assess both the accuracy of individual human performance and the reliability of the AI models under realistic classification scenarios.
The three human operators, all of whom had previous experience in manual sorting of agricultural grains, showed variability in their classification decisions. This outcome is consistent with existing findings in the literature related to manual grading of agricultural products [25]. A total of 180 samples were independently evaluated by each operator. The average classification time per bean was 1.47 s, with noticeable variability attributed to subjective judgment and operator fatigue. A summary of the comparative results between the automated models and human operators, including accuracy, consistency, and average classification time, is provided in Table 9.
Although human performance remains reasonably high, the automated systems, particularly the proposed CNN model, demonstrate a clear advantage in both accuracy and consistency. The classification speed achieved by the CNN model, which operates in less than 13 milliseconds per segment, significantly exceeds what is feasible through manual inspection. This efficiency highlights its suitability for implementation in continuous agroindustrial processes that require real-time decision making.
Furthermore, the observed variation among human operators, with an average agreement rate of 89.5 percent, emphasizes the need for standardization in quality control tasks. Inconsistencies caused by fatigue, differences in experience, and cognitive bias can lead to unreliable sorting outcomes. In contrast, artificial intelligence models trained on well-annotated datasets apply consistent classification criteria, reduce subjectivity, and ensure reproducible results across evaluations.

Statistical Analysis of Model Disagreements

To evaluate whether the differences observed between classification methods were statistically significant rather than the result of random variation, McNemar’s test with Yates’ continuity correction was applied. This non-parametric test is specifically designed to compare the performance of two classifiers on the same dataset, focusing on asymmetries in their classification errors.
Unlike traditional accuracy-based comparisons, McNemar’s test does not rely on overall correct predictions but instead assesses whether one classifier tends to outperform the other in the cases where they disagree. This approach is particularly useful when both models achieve high overall accuracy, as it can reveal systematic performance differences that would otherwise remain undetected.
Two pairwise comparisons were conducted: (1) between the proposed CNN model and the YOLOv5s detector, and (2) between the CNN model and human operators. Each evaluation involved a balanced test set of 900 samples. The corresponding contingency tables are presented in Table 10 and Table 11, which show the number of instances where both classifiers agreed, as well as cases in which only one provided the correct prediction.
In the first comparison, between the CNN and YOLOv5s, McNemar’s test resulted in a chi-squared statistic of 9.33 and a p-value of 0.0022. This indicates that the likelihood of such a disagreement pattern occurring by chance, assuming both models had equal error distributions, is only 0.22%. Since this p-value is well below the standard significance threshold of 0.05, the null hypothesis of equivalent performance is rejected. Therefore, it can be concluded that the CNN significantly outperforms YOLOv5s in scenarios where their predictions differ.
In the second comparison, between the CNN model and human operators, McNemar’s test yielded a chi-squared statistic of 66.96 with a p-value lower than 0.0001. This extremely low probability strongly indicates that the disagreement pattern is not due to chance but rather reflects a systematic superiority of the CNN model over human judgment in classification tasks. The result confirms that the CNN consistently outperforms human operators, particularly in challenging or ambiguous cases.
Taken together, these findings provide robust statistical support for the reliability of the proposed CNN model. Not only does it achieve high overall accuracy, but it also demonstrates superior performance in instances where traditional classification methods, such as manual evaluation by human operators or general-purpose object detectors like YOLOv5s, tend to be less effective. The application of McNemar’s test confirms that the differences observed are statistically significant and reflect a genuine advantage of the proposed approach.

3.5. Discussion of Relative Performance

The results obtained demonstrate a clear superiority of the automated classification models over manual sorting by human operators, both in terms of accuracy and processing speed. Among the evaluated architectures, the custom-designed CNN model achieved perfect classification performance along with the shortest inference time, confirming the advantages of employing task-specific neural networks in agricultural applications.
These findings are consistent with previous studies in other crops, where artificial intelligence-based classifiers have outperformed human operators not only in precision but also in repeatability. For example, one study reported 94 percent accuracy using a YOLOv3 model for cherry coffee grading, resulting in significant reductions in manual processing time [28]. In comparison, the custom CNN model in this study achieved 100 percent accuracy on the pajuro test set and processed each sample in under 13 milliseconds, demonstrating both technical precision and operational viability in real-time conditions.
The slight performance gap between the custom CNN model and the YOLO architecture highlights the importance of model specialization. While YOLO is a general-purpose framework suitable for a wide range of real-time detection tasks, its structure is not optimized for binary classification problems with low visual variability, such as the maturity grading of pajuro beans. In contrast, the custom CNN model was specifically designed and trained for this task, incorporating tailored parameters and fixed input segmentation strategies that prevent overcounting and enhance classification accuracy.
Furthermore, human decision making is inherently variable and subject to factors such as fatigue, prior experience, visual perception, and cognitive bias. As discussed in Section 3.3, the average agreement among human operators remained below 90 percent, and their classification speed was significantly slower than that of the automated models. These limitations reinforce the need to adopt automated alternatives, particularly in regions where industrial-scale pajuro processing remains underdeveloped.
The successful deployment of the custom CNN model on a low-cost embedded platform such as the Raspberry Pi further strengthens its practical applicability. This hardware integration allows for scalable implementation in rural or remote environments, thereby promoting the technological development of underutilized crops like pajuro and contributing to improved postharvest quality control in local production chains.
From a practical standpoint, the mechanical configuration of the proposed system enables a maximum processing capacity of approximately 81 kg of pajuro per hour per conveyor belt, assuming continuous operation and optimal grain flow. This estimate is based on experimental timing and spacing conditions: each grain requires approximately six seconds to travel from entry to sorting, and a minimum spacing of 50 mm is necessary to ensure accurate classification. With an effective conveyor length of 57 cm, the system can process up to nine grains per cycle, yielding a total of 5400 grains per hour. Considering an average grain weight of 15 g, this corresponds to an output of 81 kg per hour. Such performance represents a substantial improvement over manual methods and reinforces the potential of the system for deployment in agroindustrial contexts.

3.6. Comparison with Related Studies

The results obtained in this study, which employed a custom convolutional neural network for pajuro grain classification, demonstrate an average accuracy of 99.7 percent with inference times of only 12.3 milliseconds per segment. These outcomes not only surpass traditional manual classification methods but also outperform general architectures such as YOLO. Despite its extensive validation in agricultural applications, YOLO exhibited longer processing times of 41.7 milliseconds and slightly lower classification accuracy.
When compared with recent research on Egyptian cotton fiber classification using deep learning, the advantages of the proposed system become evident. In that study, pre-trained models including VGG19, AlexNet, and GoogleNet were applied to classify fibers from five cotton cultivars, achieving accuracies ranging from 75.7 to 90.0 percent depending on the cultivar and architecture used [27]. Although that work highlights the effectiveness of transfer learning and the handling of a diverse range of fiber qualities, training times were significantly longer, reaching up to 487.345 s, and optimized inference times for embedded hardware were not reported. This limits the applicability of such models in real-time scenarios, particularly in rural or resource-constrained environments.
Additionally, while the aforementioned study explored model fusion strategies to slightly improve accuracy—achieving up to 92.9 percent in the best configuration—the system proposed in the present work attains high performance without the need for fusion techniques. This results in lower computational complexity and improved operational efficiency. The superior performance can be attributed to the specialized nature of the custom convolutional neural network, which was specifically designed for the morzphological characteristics of pajuro grains and the operational constraints of the processing environment. This contrasts with the more generic and resource-intensive pre-trained architectures employed in other studies.
While this study focused on a specific native crop, Erythrina edulis (pajuro), and was conducted in a controlled testing environment, the system was developed with scalability and adaptability as fundamental design principles. The modular structure of the solution, which includes a conveyor belt mechanism, an overhead camera, and a real-time classification module executed on an embedded platform with low cost, can be replicated in multiple parallel lines to increase processing capacity in industrial contexts. As described in Section 3.5, each conveyor unit is capable of handling up to 81 kg of seeds per hour. Therefore, by deploying several synchronized modules, the system can be scaled to meet higher production demands without substantially increasing computational requirements or hardware complexity.
Although the convolutional neural network was trained specifically using visual features extracted from pajuro seeds, the methodology applied in this study is broadly transferable. It integrates color-based segmentation, classification restricted to predefined regions of interest, and actuation through a servo-driven sorting mechanism. This approach can be adapted to other agricultural products that exhibit visually distinguishable maturity or quality indicators. By retraining the model with appropriately labeled datasets, the system can be extended to crops such as beans, maize, or coffee, as long as they present identifiable visual characteristics relevant for classification.
One limitation of the current implementation lies in its evaluation under controlled lighting and environmental conditions. While this approach facilitated consistent training and testing, it may reduce the model’s robustness in variable real-world scenarios. Future work will address this by incorporating data collected under diverse lighting conditions, camera orientations, and sensor types, thereby improving the model’s generalization capacity without requiring changes to the existing system hardware.
In addition, the conveyor belt operated at a fixed speed during evaluation to maintain synchronization between detection and actuation. However, the system’s processing loop is already optimized for low-latency execution, making it feasible to adapt to variable conveyor speeds through minor modifications to the timing logic. This opens the door for further experimentation on the relationship between belt velocity, accuracy, and sorting response time.
Finally, although this work focused specifically on pajuro seeds, the modular design of both hardware and software components makes the system readily adaptable to other native legumes that share similar visual traits. Future developments will focus on validating the system’s robustness, flexibility, and scalability across a broader range of agricultural applications.

4. Conclusions

This study presented a lightweight convolutional neural network specifically designed for the classification of pajuro (Erythrina edulis) grains according to their ripeness stage. The proposed model was trained using stratified five-fold cross-validation and achieved an average validation accuracy of 99.7 percent, with near-perfect precision, recall, and F1 scores for both optimally ripe and overripe classes. These results confirm the model’s robustness and reliability under controlled imaging conditions.
In comparison with the YOLOv5s architecture, a widely used general-purpose object detector, the proposed CNN model consistently outperformed it across all evaluation metrics. While YOLOv5s achieved precision and recall values close to 97 and 98 percent, respectively, the custom network exceeded 99 percent in both categories. This improvement reflects a significant reduction in misclassifications and a more consistent performance, particularly under structured input conditions.
Beyond classification accuracy, the model also demonstrated a notable advantage in computational efficiency. With an average inference time of 12.3 milliseconds per segment, considerably faster than the 41.7 milliseconds observed for YOLOv5s, the system is capable of real-time operation at five frames per second, even when deployed on low-power platforms such as the Raspberry Pi. This level of performance highlights its suitability for embedded agricultural applications where energy efficiency, processing speed, and hardware limitations are critical factors.
In summary, the results validate the benefits of developing task-specific neural network architectures tailored to the morphological and operational characteristics of agricultural products. The proposed CNN model not only achieves high classification performance but also offers a scalable and cost-effective solution for real-time sorting in agro-industrial environments. Its successful implementation for the classification of pajuro grains demonstrates strong potential for broader application to other native or underutilized crops, contributing to the advancement of precision agriculture in regions with limited technological infrastructure.
Author Contributions

Conceptualization, H.P., C.T. and C.I.; methodology, C.T.; software, H.P.; validation, H.P., C.T. and C.I.; formal analysis, H.P., C.T. and C.I.; investigation, H.P. and C.T.; resources, C.I.; data curation, H.P.; writing—original draft preparation, C.T. and H.P.; writing—review and editing, C.T. and C.I.; visualization, C.T.; supervision, C.I.; project administration, C.I. All authors have read and agreed to the published version of the manuscript.

Funding

The authors would like to thank the “Dirección de Investigación de la Universidad Peruana de Ciencias Aplicadas” for the support provided to carry out this research work through the UPC-EXPOST-2025-1 incentive.

Institutional Review Board Statement

Not applicable.

Data Availability Statement

The original contributions presented in the study are included in the article. Further inquiries can be directed to the corresponding author.

Acknowledgments

The authors would like to express their gratitude to the local farmers of Luya (Amazonas, Peru) for their valuable collaboration and insights regarding the traditional classification of Erythrina edulis (pajuro) grains. We also extend our sincere thanks to the School of Mechatronics Engineering at Universidad Peruana de Ciencias Aplicadas (UPC) for the academic guidance, technical resources, and institutional support provided throughout the development of this research.

Conflicts of Interest

The authors declare no conflicts of interest.

References

  1. Córdova, G.E. Análisis Químico Proximal de Granos y Harina de ‘Pajuro’ (Erythrina Edulis) y Elaboración de Una Bebida Proteica Con Sabor a Chocolate. 2018. Available online: https://repositorio.upch.edu.pe/handle/20.500.12866/3764 (accessed on 2 July 2025).
  2. Roa, J.G. Evaluación de impacto ambiental de un proyecto agroforestal. Caso: Siembra de 150.000 árboles de ‘Erythrina edulis’, municipio Andrés Bello, estado Mérida-Venezuela. Rev. Geográfica Venez. 2004, 45, 247–277. Available online: https://dialnet.unirioja.es/servlet/articulo?codigo=1166047&info=resumen&idioma=SPA (accessed on 2 July 2025).
  3. Correa, J.L.; Zapata, J.E.; Hernández-Ledesma, B. Release of Bioactive Peptides from Erythrina edulis (Chachafruto) Proteins under Simulated Gastrointestinal Digestion. Nutrients 2022, 14, 5256. [Google Scholar] [CrossRef] [PubMed]
  4. Paucar, T.A.; Bardalez, P.T. Aceptabilidad Del Pajuro (Erytrhina edulis) en Preparaciones Culinarias Para el Consumo Humano Por Profesionales de Alimentos, Lima—Perú, 2015. Universidad Peruana Unión: Lima, Peru, 2016. Available online: http://repositorio.upeu.edu.pe/handle/20.500.12840/585 (accessed on 2 July 2025).
  5. Daza, L.D.; Montealegre, M.Á.; Reche, C.; Sandoval-Aldana, A.; Eim, V.S.; Váquiro, H.A. Chachafruto starch: Physicochemical characterization, film-forming properties, and 3D printability. Int. J. Biol. Macromol. 2023, 247, 125795. [Google Scholar] [CrossRef] [PubMed]
  6. Guía Para el Cultivo y Aprovechamiento del Chachafruto o Balú: Erythrina Edulis Triana ex Micheli—Obras Generales—Colecciones Digitales—Biblioteca Virtual del Banco de la República. Available online: https://babel.banrepcultural.org/digital/collection/p17054coll10/id/1300/rec/1 (accessed on 2 July 2025).
  7. Hou, L.; Liu, Z.; You, J.; Liu, Y.; Xiang, J.; Zhou, J.; Pan, Y. Tomato Sorting System Based on Machine Vision. Electronics 2024, 13, 2114. [Google Scholar] [CrossRef]
  8. Rashvand, M.; Nikzadfar, M.; Laveglia, S.; Bozorgi, A.; Paterna, G.; Matera, A.; Gioia, T.; Altieri, G.; Di Renzo, G.C.; Genovese, F. Advancing legume quality assessment through machine learning: Current trends and future directions. J. Food Compos. Anal. 2025, 142, 107532. [Google Scholar] [CrossRef]
  9. Song, Y.; Cao, J.; Liu, Z.; Meng, X.; Yuan, Y.; Liu, T. Multi-organ Jujube Classification Based on a Visual Attention Mechanism. Appl. Fruit Sci. 2024, 66, 1363–1376. [Google Scholar] [CrossRef]
  10. Akdoğan, C.; Özer, T.; Oğuz, Y. PP-YOLO: Deep learning based detection model to detect apple and cherry trees in orchard based on Histogram and Wavelet preprocessing techniques. Comput. Electron. Agric. 2025, 232, 110052. [Google Scholar] [CrossRef]
  11. Nguyen, D.T.; Do, P.B.L.; Nguyen, D.D.K.; Lin, W.C. A lightweight and optimized deep learning model for detecting banana bunches and stalks in autonomous harvesting vehicles. Smart Agric. Technol. 2025, 11, 101051. [Google Scholar] [CrossRef]
  12. Koklu, M.; Ozkan, I.A. Multiclass classification of dry beans using computer vision and machine learning techniques. Comput. Electron. Agric. 2020, 174, 105507. [Google Scholar] [CrossRef]
  13. Arboleda, E.R.; Fajardo, A.C.; Medina, R.P. Classification of coffee bean species using image processing, artificial neural network and K nearest neighbors. In Proceedings of the 2018 IEEE International Conference on Innovative Research and Development, ICIRD, Bangkok, Thailand, 11–12 May 2018; pp. 1–5. [Google Scholar] [CrossRef]
  14. Injante, H.; Gutierrez, E.; Vinces, L. A Vibratory Conveying System for Automatic Sorting of Lima Beans through Image Processing. In Proceedings of the 2020 IEEE 27th International Conference on Electronics, Electrical Engineering and Computing, INTERCON, Lima, Peru, 3–5 September 2020. [Google Scholar] [CrossRef]
  15. Arboleda, E.R.; Fajardo, A.C.; Medina, R.P. An image processing technique for coffee black beans identification. In Proceedings of the 2018 IEEE International Conference on Innovative Research and Development, ICIRD, Bangkok, Thailand, 11–12 May 2018; pp. 1–5. [Google Scholar] [CrossRef]
  16. Laurent, B.; Ousman, B.; Dzudie, T.; Carl, M.M.; Emmanuel, T. Digital camera images processing of hard-to-cook beans. J. Eng. Technol. Res. 2010, 2, 177–188. [Google Scholar]
  17. Mozaffari, M.; Sadeghi, S.; Asefi, N. Prediction of the quality properties and maturity of apricot by laser light backscattering imaging. Postharvest Biol. Technol. 2020, 186, 111842. [Google Scholar] [CrossRef]
  18. Raj, R.; Cosgun, A.; Kulić, D. Strawberry Water Content Estimation and Ripeness Classification Using Hyperspectral Sensing. Agronomy 2022, 12, 425. [Google Scholar] [CrossRef]
  19. Reka, S.S.; Bagelikar, A.; Venugopal, P.; Ravi, V.; Devarajan, H. Deep Learning-Based Classification of Rotten Fruits and Identification of Shelf Life. Comput. Mater. Contin. 2024, 78, 781–794. [Google Scholar] [CrossRef]
  20. Zhang, Y.; Li, X.; Chen, W.; Zang, Y. Image Classification Based on Low-Level Feature Enhancement and Attention Mechanism. Neural Process. Lett. 2024, 56, 217. [Google Scholar] [CrossRef]
  21. Gill, H.S.; Khalaf, O.I.; Alotaibi, Y.; Alghamdi, S.; Alassery, F. Fruit Image Classification Using Deep Learning. Comput. Mater. Contin. 2022, 71, 5135–5150. [Google Scholar] [CrossRef]
  22. Ratha, A.K.; Barpanda, N.K.; Sethy, P.K.; Behera, S.K. Automated Classification of Indian Mango Varieties Using Machine Learning and MobileNet-v2 Deep Features. Trait. Du Signal 2024, 41, 669–679. [Google Scholar] [CrossRef]
  23. Alhasson, H.F.; Alharbi, S.S. Classification of Saudi Coffee beans using a mobile application leveraging squeeze vision transformer technology. Neural Comput. Appl. 2025, 37, 8629–8649. [Google Scholar] [CrossRef]
  24. Talunga, E.; Indrabayu; Nurtanio, I. Detection of Coffee Bean Defects on Conveyor Machines Using the Mask-RCNN Algorithm. In Proceedings of the 2024 8th International Conference on Information Technology, Information Systems and Electrical Engineering, ICITISEE, Yogyakarta, Indonesia, 29–30 August 2024; pp. 138–143. [Google Scholar] [CrossRef]
  25. Bayano-Tejero, S.; Martínez-Gila, D.; Blanco-Roldán, G.; Sola-Guirado, R.R. Cleaning system, batch sorting and traceability between field-industry in the mechanical harvesting of table olives. Postharvest Biol. Technol. 2023, 199, 112278. [Google Scholar] [CrossRef]
  26. Sarker, M.A.B.; Butt, U.; Imtiaz, M.H.; Baki, A.B. Automatic Detection of Microplastics in the Aqueous Environment. In Proceedings of the 2023 IEEE 13th Annual Computing and Communication Workshop and Conference, CCWC, Las Vegas, NV, USA, 8–11 March 2023; pp. 768–772. [Google Scholar] [CrossRef]
  27. Rady, A.; Fisher, O.; El-Banna, A.A.A.; Emasih, H.H.; Watson, N.J. Computer Vision and Transfer Learning for Grading of Egyptian Cotton Fibres. AgriEngineering 2025, 7, 127. [Google Scholar] [CrossRef]
  28. Valles-Coral, M.A.; Bernales-Del-Aguila, C.I.; Benavides-Cuvas, E.; Cabanillas-Pardo, L. Efectividad de un prototipo seleccionador de café cerezo con reconocimiento de imágenes usando machine learning. Rev. Bras. Ciências Agrárias 2023, 18, e2586. [Google Scholar] [CrossRef]
Figure 1. Reference dimensions used for the classification of pajuro seeds. Length is defined as the maximum distance along the longitudinal axis, and width is measured at the widest central transverse section.
Agriengineering 07 00277 g001
Figure 2. (a) Overripe pajuro grains; (b) pajuro grains at optimal ripeness.
Agriengineering 07 00277 g002
Figure 3. Image processing enclosure including the three conveyor belts and the top-mounted camera used for real-time video acquisition and grain classification.
Agriengineering 07 00277 g003
Figure 4. Pre-alignment mechanism for the conveyor belt.
Agriengineering 07 00277 g004
Figure 5. (a) Mechanical conveyor belt system used for grain transport and alignment; (b) servomechanism responsible for grain selection based on ripeness classification.
Agriengineering 07 00277 g005
Figure 6. Raspberry Pi 5 Model B (8 GB), used as the main embedded platform for on-device execution of CNN and YOLOv5 models in the seed classification system.
Agriengineering 07 00277 g006
Figure 7. FOV Logitech HD C270.
Agriengineering 07 00277 g007
Figure 8. Example of training data with labels. Each image displays manually labeled seeds enclosed within bounding boxes using the Roboflow platform. The class labels correspond to two categories: good_state (0) and bad_state (1), indicated by red identifiers positioned above each bounding box.
Agriengineering 07 00277 g008
Figure 9. Architecture of the proposed neural network.
Agriengineering 07 00277 g009
Figure 10. Decision pipeline of the YOLO model, showing the sequence from image preprocessing to classification and actuator triggering.
Agriengineering 07 00277 g010
Figure 11. (a) Real-time classification using the CNN model with fixed regions of interest on the conveyor belts; (b) full-frame detection with virtual decision zones using the YOLOv5s model.
Agriengineering 07 00277 g011
Figure 12. Average across all folds of training and validation accuracy curves of the custom CNN model.
Agriengineering 07 00277 g012
Figure 13. Training and validation loss curves of the YOLOv5 model, obtained during the training session conducted in Google Colab.
Agriengineering 07 00277 g013
Figure 14. Confusion matrix corresponding to the test set for the final Erythrina classification model, applied to segmented images of pajuro grains.
Agriengineering 07 00277 g014
Figure 15. Real-time inference output of YOLOv5n misclassifying all regions as “bad_state”.
Agriengineering 07 00277 g015
Figure 16. Confusion matrix of YOLOv5n showing lack of class discrimination.
Agriengineering 07 00277 g016
Figure 17. Confusion matrix of YOLOv8 with correct predictions for both classes.
Agriengineering 07 00277 g017
Figure 18. Training loss and metric evolution curves of YOLOv8 across 25 epochs.
Agriengineering 07 00277 g018
Figure 19. Real-time execution of YOLOv8 on Raspberry Pi 5 showing correct detections but with very low fps.
Agriengineering 07 00277 g019
Figure 20. Radar chart comparing normalized performance metrics of YOLOv5n, YOLOv5s, and YOLOv8.
Agriengineering 07 00277 g020
Table 1. Classification of pajuro according to the physical dimensions of the pod.
Length (cm)Width (cm)
Small≤3.5≤1.6
Medium3.6–4.91.7–2.4
Large≥5.0≥2.5
Table 2. Technical specifications of the selection servomotor.
ParameterValue
Weight9 g
Dimensions22.2 × 11.8 × 31 mm
Stall Torque1.8 kgf·cm
Operating speed0.1 s/60°
Rated Voltage4.8 V (~5 V)
Dead bandwidth10 µs
Temperature range0–55 °C
Maximum rotation angle~180° (±90° from center)
Table 3. Technical specifications of the Raspberry Pi 5 Model B.
SpecificationDescription
ProcessorQuad-core ARM Cortex-A76 @ 2.4 GHz
RAM8 GB LPDDR4X
Storage InterfacemicroSD card slot + PCIe 2.0 (via FPC connector)
USB Ports2 × USB 3.0, 2 × USB 2.0
Video Outputs2 × micro-HDMI (4Kp60 supported)
NetworkingGigabit Ethernet, Dual-band Wi-Fi (802.11ac), Bluetooth 5.0
GPIO Header40-pin standard GPIO
Dimensions85.6 mm × 56.5 mm
Operating SystemRaspberry Pi OS (64-bit)
Power Supply Requirement5V DC via USB-C, minimum 5A recommended
Table 4. Technical specifications of the C270 camera.
ParameterValue
Image sensor1/6″ CMOS, 640 × 480 pixels (350 K Pixels)
Still image resolution1280 × 960 (1.2 MP real)
Frame rate30 fps (in VGA mode)
Captured video resolution1080 × 720 pixels
Lens4.0 mm
Angle of view (FOV)60°
MicrophoneIntegrated with noise suppression
PC interfaceUSB 2.0
Table 5. Number of samples per size and maturity category.
SizeOptimal RipeningOverripening
Small383289
Medium 508258
Large 299273
Table 6. HSV value ranges by ripening stage.
StateH (Hue)S (Saturation)Value
Optimal ripening[0.001–0.032][0.629–0.738][0.717–0.773]
Overripening[0.000–0.020][0.472–0.648][0.066–0.083]
Table 7. Per-class metrics for automatic models.
ClassModelPrecisionRecallF1 ScoreInference Time (ms)fps
YOLOv5sgood_state0.9770.9610.96941.71.5
bad_state0.9790.9680.975
Custom CNN modelgood_state0.9960.9970.99612.35
bad_state0.9980.9970.996
Table 8. Comparative metrics of YOLO models.
MethodPrecision (%)Recall (%)mAP50 (%)fps (Raspberry Pi)
YOLOv5n49.750.449.13.5
YOLOv5s97.896.597.81.5
YOLOv899.999.896.90.5
Table 9. Classification accuracy and processing time: AI models and human operators.
MethodAccuracy (%)Recall (%)F1 Score (%)Time Per Sample
Human Operator90.3--1.47 s
YOLOv5s97.896.597.241.7 ms
Proposed CNN Model99.799.799.612.3 ms
Table 10. Contingency matrix of classification disagreements between CNN and YOLOv5s.
YOLOv5s CorrectYOLOv5s Incorrect
Proposed CNN Model Correct87718
Proposed CNN Model Incorrect32
Table 11. Contingency matrix of classification disagreements between CNN and human.
Human CorrectHuman Incorrect
Proposed CNN Model Correct80880
Proposed CNN Model Incorrect48
Disclaimer/Publisher’s Note: The statements, opinions and data contained in all publications are solely those of the individual author(s) and contributor(s) and not of MDPI and/or the editor(s). MDPI and/or the editor(s) disclaim responsibility for any injury to people or property resulting from any ideas, methods, instructions or products referred to in the content.