Article

Precision Mapping of Fodder Maize Cultivation in Peri-Urban Areas Using Machine Learning and Google Earth Engine

by
Sasikarn Plaiklang
1,
Pharkpoom Meengoen
1,
Wittaya Montre
1 and
Supattra Puttinaovarat
2,*
1
Faculty of Business Administration, Rajamangala University of Technology Isan, Nakhon Ratchasima 30000, Thailand
2
Faculty of Science and Industrial Technology, Prince of Songkla University, Surat Thani Campus, Surat Thani 84000, Thailand
*
Author to whom correspondence should be addressed.
AgriEngineering 2025, 7(9), 302; https://doi.org/10.3390/agriengineering7090302
Submission received: 19 July 2025 / Revised: 4 September 2025 / Accepted: 12 September 2025 / Published: 16 September 2025
(This article belongs to the Section Remote Sensing in Agriculture)

Abstract

Fodder maize constitutes a key economic crop in Thailand, particularly in the northeastern region, where it significantly contributes to livestock feed production and local economic development. Nevertheless, the planning and management of cultivation areas remain a major challenge, especially in urban and peri-urban agricultural zones, due to the limited availability of spatial data and suitable analytical frameworks. These difficulties are exacerbated in urban settings, where the complexity of land use patterns and high spectral similarity among land cover types hinder accurate classification. The Google Earth Engine (GEE) platform provides an efficient and scalable solution for geospatial data processing, enabling rapid land use classification and spatiotemporal analysis. This study aims to enhance the classification accuracy of fodder maize cultivation areas in Mueang District, Nakhon Ratchasima Province, Thailand—an area characterized by a heterogeneous mix of urban development and agricultural land use. The research integrates GEE with four machine learning algorithms: Random Forest (RF), Support Vector Machine (SVM), Naïve Bayes (NB), and Classification and Regression Trees (CART). Eleven datasets were developed using Sentinel-2 imagery and a combination of biophysical variables, including elevation, slope, Normalized Difference Vegetation Index (NDVI), Normalized Difference Built-up Index (NDBI), and Modified Normalized Difference Water Index (MNDWI), to classify land use into six categories: fodder maize cultivation, urban and built-up areas, forest, water bodies, paddy fields, and other field crops. Among the 44 classification scenarios evaluated, the highest performance was achieved using Dataset 11—which integrated all spectral and biophysical variables—with the SVM classifier. This model attained an overall accuracy of 97.41% and a Kappa coefficient of 96.97%. Specifically, fodder maize was classified with 100% accuracy in both Producer’s and User’s metrics, as well as a Conditional Kappa of 100%. These findings demonstrate the effectiveness of integrating GEE with machine learning techniques for precise agricultural land classification. This approach also facilitates timely monitoring of land use changes and supports sustainable land management through informed planning, optimized resource allocation, and mitigation of land degradation in urban and peri-urban agricultural landscapes.

1. Introduction

Maize is one of the most important cereal crops globally, alongside rice and wheat, serving as a primary food source for both humans and livestock [1]. By 2050, the global demand for maize is projected to increase by 70–100% to meet the needs of a growing population, expected to reach 9.8 billion [2]. However, current fodder maize production levels remain insufficient to meet this rising demand [3]. In the 2022/2023 production year, global fodder maize output declined by 5.25%, totaling approximately 1157.95 million tons, primarily due to extreme drought and heat in the United States—currently the largest maize producer. Similar production declines were observed in the European Union and Ukraine, highlighting the sector’s vulnerability to climate change. Concurrently, global demand for fodder maize decreased by 2.65%, largely due to economic slowdowns in major consuming countries such as the United States, China, and the EU. Nevertheless, projections for subsequent years indicate an upward trend in both production and demand, driven by economic recovery and the continued growth of the livestock feed industry [4].
In Thailand, maize is a key economic crop utilized across multiple sectors, including food production, animal feed, and green industries such as bioplastics and ethanol manufacturing [5]. Major cultivation areas include Phetchabun, Nakhon Ratchasima, Loei, Lopburi, and Nakhon Sawan provinces [6]. However, a substantial proportion of fodder maize cultivation in Thailand occurs in areas that are unsuitable for sustainable production. Approximately 45% of these areas are within forest reserves, while another 30% are classified as marginal lands, contributing to low yield per rai and raising concerns over environmental sustainability and trade compliance. Furthermore, over 90% of fodder maize cultivation is rainfed, leaving it vulnerable to drought and erratic rainfall patterns.
Despite these limitations, demand for fodder maize from the animal feed industry continues to grow, accounting for over 90% of domestic consumption. The ongoing geopolitical conflict between Russia and Ukraine has also disrupted global grain supply chains, potentially increasing pressure on Thailand’s maize production system. Without improvements in production efficiency and sustainable land use planning, Thailand risks supply shortfalls and a loss of market share to neighboring countries [4].
Nakhon Ratchasima Province, located in northeastern Thailand, covers approximately 12.80 million rai (equivalent to 2.05 million hectares) and ranks as the leading fodder maize-producing province in the region. In 2023, the province accounted for 902,000 rai (approximately 144,320 hectares), representing 51.78% of the regional fodder maize cultivation area, followed by Sisaket and Ubon Ratchathani [7]. However, recent trends indicate a decline in both cultivation area and productivity, largely due to factors such as inconsistent rainfall, soil degradation, and changing climatic conditions. These challenges have prompted some farmers to switch to more economically viable crops such as sugarcane and cassava [8]. Consequently, domestic fodder maize production has become insufficient to meet industrial and export demands.
To address these challenges, technological solutions in precision agriculture have been widely recognized. In particular, the application of geospatial technologies and automated systems enables efficient land use planning, crop monitoring, and yield estimation. Remote sensing and geographic information systems (GIS) offer powerful tools for land cover classification and change detection. Traditionally, pixel-based classification techniques have been used; however, their effectiveness is often hindered by spectral noise from clouds and shadows [9]. Recent advances in machine learning (ML) and deep learning (DL) provide alternative approaches that can handle large, complex, and noisy datasets without relying on predefined parameters [10,11,12,13].
Machine learning algorithms have demonstrated high performance in land use and land cover (LULC) classification, offering advantages in accuracy, scalability, and automation compared to manual and conventional supervised classification methods. The integration of machine learning with cloud-based geospatial platforms, such as Google Earth Engine (GEE), has further enhanced the capacity for rapid, large-scale analysis [14]. GEE is an open-source platform developed by Google in 2010, enabling users to access and process multi-source satellite data without local storage or high-performance computing infrastructure [15,16]. It supports remote sensing workflows through JavaScript-based programming and provides access to extensive datasets, including Sentinel-2 imagery, NDVI, and other biophysical indices [17].
Several studies have successfully applied Google Earth Engine (GEE) with ma-chine learning algorithms for agricultural mapping. For instance, [15] demonstrated that Random Forest (RF) achieved the highest accuracy (93.34%) and Kappa coefficient (0.92) in classifying winter crops in India using Sentinel-2 data. Other studies compared multiple algorithms, including Support Vector Machine (SVM), Decision Trees (DT), and Artificial Neural Networks (ANN), showing that model performance varied by data type and preprocessing methods [18,19,20]. One study utilized Landsat time-series data on GEE to generate land cover maps, achieving accuracies of 78–80% using median composite classification [19]. Another study applied RF and SVM for LULC classification in India, achieving up to 99.36% accuracy and a Kappa coefficient of 99.11% [14]. In Thailand, object-based classification using RF on Sentinel-2 median composites yielded a 95.58% overall accuracy and a 0.94 Kappa coefficient in mapping economic crop plantations [20].
Given these findings, the present study emphasizes the role of geospatial technology in addressing the challenges of fodder maize production in Thailand. Specifically, this research aims to apply the Google Earth Engine platform, in conjunction with multiple machine learning algorithms, to accurately classify fodder maize cultivation areas in Mueang District, Nakhon Ratchasima Province. The study employs Sentinel-2 spectral data and biophysical indices—including slope, elevation, NDVI, NDBI, and MNDWI—to generate eleven datasets. These datasets are used with four ML algorithms: RF, SVM, Naïve Bayes (NB), and Classification and Regression Trees (CART), to classify land use into six categories: maize fields, urban and built-up areas, forests, water bodies, paddy fields, and other field crops. The classification results are compared to determine the most effective algorithm and data combination for accurate mapping and land use planning.
Research Objectives
  • To accurately classify fodder maize cultivation areas by integrating Google Earth Engine with machine learning techniques.
  • To evaluate and compare the classification accuracy of different machine learning algorithms and datasets to identify the most suitable approach for mapping fodder maize fields.

2. Materials and Methods

2.1. Study Area

The study was conducted in Mueang District, Nakhon Ratchasima Province, located in the central part of the province on the Korat Plateau. The geographical coordinates of the area are approximately 14°58′16″ N latitude and 102°5′59″ E longitude, with an elevation ranging from 180 to 210 m above sea level. The total area of the district is approximately 755.60 square kilometers (equivalent to 75,560 hectares or 471,000 rai), accounting for 3.69% of the total land area of Nakhon Ratchasima Province. The southern portion of the study area consists of undulating hills, with parts of the southwestern region designated as reserved forest areas. In contrast, the lower northern and central sections are relatively flat and suitable for agricultural activities. Key water resources in the area include the Lam Takhong Canal and a network of irrigation canals that support local farming systems. Mueang District also serves as the administrative, transportation, and communication hub of the province and is considered a key agricultural production zone. The area supports the cultivation of major economic crops such as rice, fodder maize, and cassava. A map of the study area is provided in Figure 1.

2.2. Data and Equipment

The following datasets and equipment were utilized in this study:
  • Multispectral satellite imagery was acquired from the Sentinel-2A and Sentinel-2B platforms under the Copernicus Sentinel-2 Surface Reflectance (S2_SR) product, provided by the European Space Agency (ESA). Nineteen cloud-free images were selected across tile IDs T47PRS and T48PTB, covering the study area in Mueang District, Nakhon Ratchasima, Thailand. These images were acquired during the dry season, between 11 January and 30 April 2024, to minimize atmospheric interference and improve spectral separability.
The imagery includes four spectral bands at 10 m spatial resolution, specifically:
  • Band 3 (Green: 560 nm);
  • Band 4 (Red: 665 nm);
  • Band 8 (Near-Infrared: 842 nm);
  • Band 11 (Shortwave Infrared: 1610 nm).
They are particularly relevant for detecting vegetation vigor, moisture content, and distinguishing urbanized areas. These bands were used as inputs for feature combination with NDVI, NDBI, MNDWI, slope, and elevation in the classification process.
2.
Biophysical variables, including elevation and slope, derived from the ALOS World 3D–30 m Digital Elevation Model (DEM), provided by the Japan Aerospace Exploration Agency (JAXA).
3.
Land use data obtained from the Land Development Department of Thailand (2021), which were used as ancillary data for understanding general land use trends and supporting reference-based interpretation.
4.
Global Positioning System (GPS) devices (Garmin eTrex 10), used for field data collection and location validation.
5.
Personal computers, employed for data processing, analysis, and algorithm implementation.
6.
Digital cameras (iPhone series), used for capturing ground reference photos during field surveys to support the interpretation of LULC types.
7.
Administrative boundary maps sourced from the Department of Provincial Administration, Ministry of Interior, Thailand, used for delineating the study area and generating mapping outputs aligned with official territorial extents.
8.
Google Earth Engine (GEE), an open-source, cloud-based geospatial analysis platform used for data processing, classification, and visualization.

2.3. Research Methodology

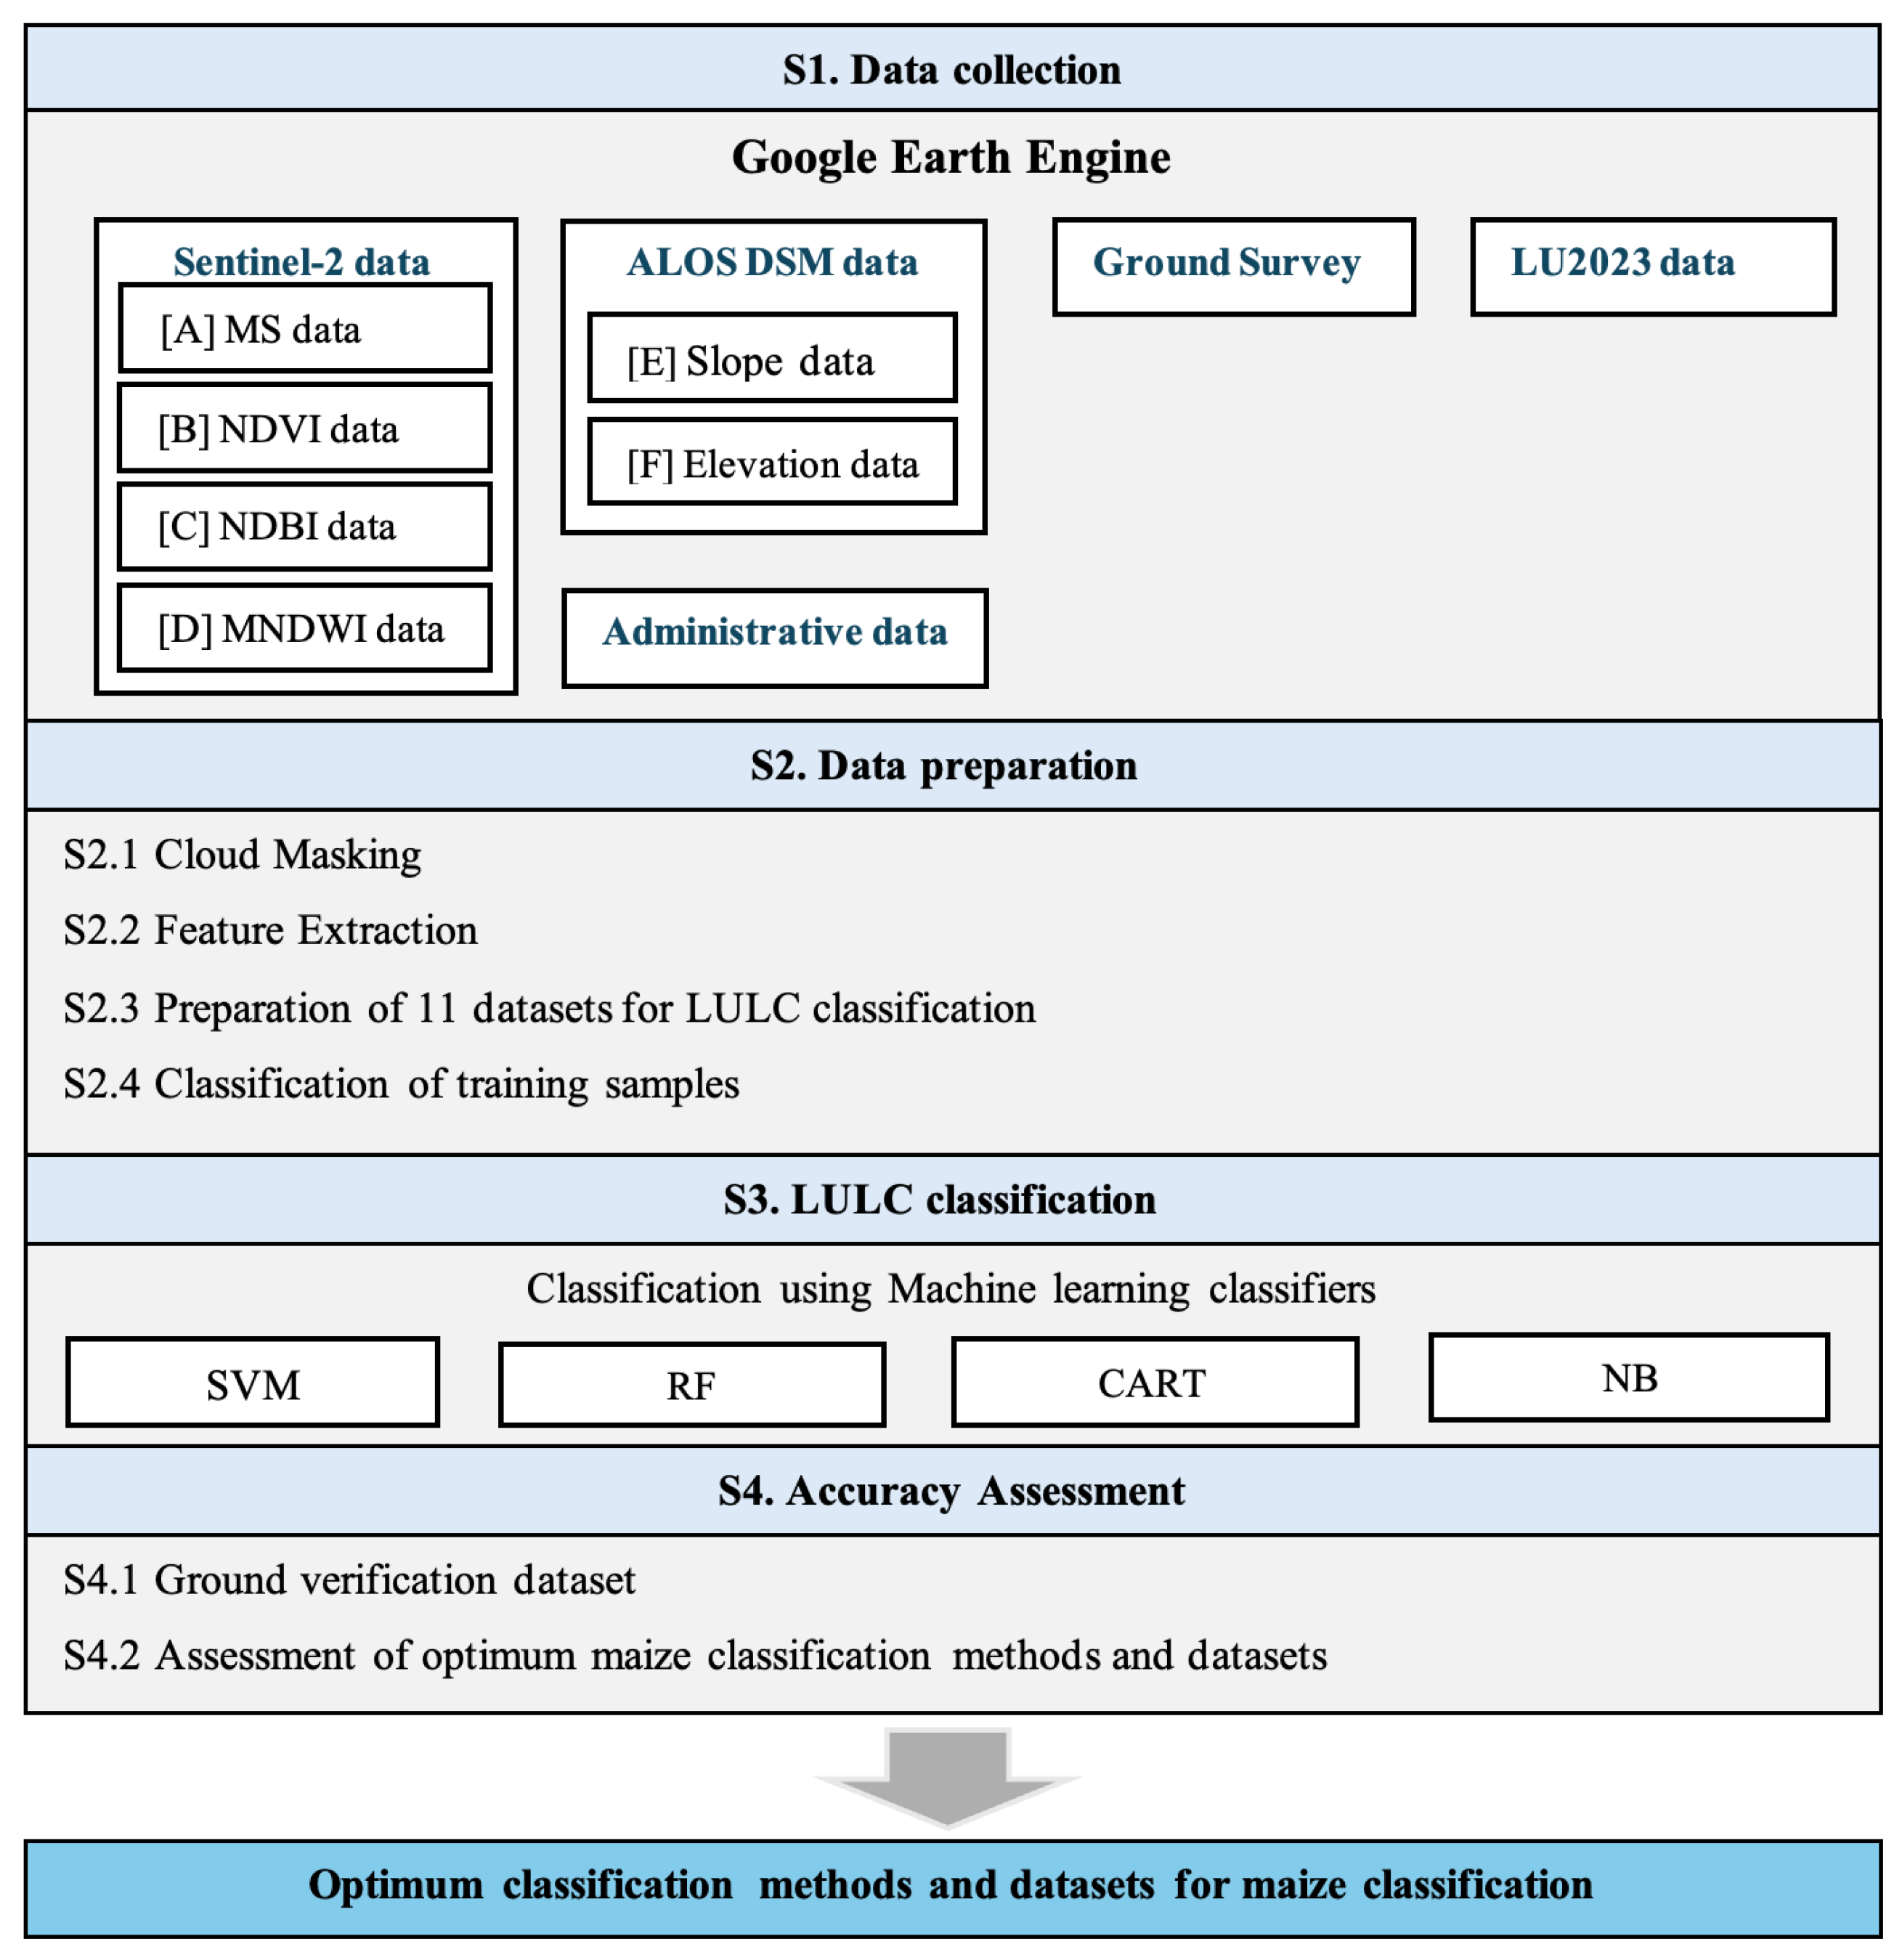
The research process in this study is divided into steps, as shown in Figure 2.
This section may be divided by subheadings. It should provide a concise and precise description of the experimental results, their interpretation, as well as the experimental conclusions that can be drawn.
The framework is described as follows:
S1. Data Collection
A single cloud-free image obtained during the dry season was selected due to its minimal cloud cover and high spectral clarity. Although median composite images from multiple dates may reduce temporal anomalies, such composites in the rainy season are often affected by persistent cloud cover and haze in this region. Therefore, a single high-quality dry season image was preferred.
Digital elevation and slope data extracted from the ALOS DSM (Digital Surface Model).
Additional relevant data, including administrative boundary data from FAO, and 2023 land use and land cover data for Nakhon Ratchasima Province, obtained from the Land Use Policy and Planning Division, Department of Land Development, Ministry of Agriculture and Cooperatives, along with ground truth survey data.
S2. Data Preparation
To establish the band selection criteria for land cover classification, four bands from Sentinel-2 imagery—Band 3 (Green), Band 4 (Red), Band 8 (Near-Infrared), and Band 11 (Shortwave Infrared)—were selected based on their proven spectral separability for vegetation analysis and land surface discrimination. These bands are commonly used in vegetation indices such as NDVI and in identifying vegetation vigor, water content, and bare land. The selection was guided by previous literature and preliminary visual assessment using Google Earth Engine (https://code.earthengine.google.com, accessed on 15 February 2025). Although Principal Component Analysis (PCA) can be beneficial for dimensionality reduction, the use of selected spectral bands with known biophysical relevance was preferred to maintain interpretability and enhance model performance.
S2.1 Geometric Correction and Cloud Masking
Preprocessing of Sentinel-2 imagery included geometric correction and cloud masking using the Google Earth Engine (GEE) platform. Geometric corrections were inherently handled through the Level-2A surface reflectance product, which provides ortho-rectified images with accurate geolocation. For cloud masking, the built-in QA60 band was used in combination with the cloud probability layer from the Sentinel-2 Cloud Probability dataset. Pixels with a cloud probability value above 60% were masked out. A custom GEE script was developed to automate the image selection process and exclude unsuitable scenes. The complete code is available at https://code.earthengine.google.com/bd827ba6051cc20ab5b85b195ffecef6 (accessed on 15 June 2025) for reproducibility.
S2.2 Feature Extraction
In this study, five key features were extracted to support land use and land cover (LULC) classification: NDVI (Normalized Difference Vegetation Index), NDWI (Normalized Difference Water Index), NDBI (Normalized Difference Built-up Index), elevation, and slope. These features were selected based on their proven effectiveness in distinguishing agricultural, built-up, and natural land types, especially in tropical environments such as Thailand.
NDVI is widely used to assess vegetation vigor and chlorophyll content and is effective in identifying crop areas such as fodder maize [21]. NDWI enhances the detection of water features and soil moisture, which is important for differentiating irrigated crops and wetlands [22]. NDBI helps identify urbanized or built-up areas by emphasizing surfaces with high reflectance in SWIR and low reflectance in NIR [23].
Elevation and slope were derived from the ALOS Digital Surface Model (DSM), which provide valuable topographic context—especially for distinguishing upland from lowland farming zones.
The Formulas used are as follows:
NDVI = (B8 − B4)/(B8 + B4)
NDWI = (B3 − B8)/(B3 + B8)
NDBI = (B11 − B8)/(B11 + B8)
These indices and terrain features were chosen to balance spectral, hydrological, and topographic information to enhance the classifier’s ability to differentiate LULC types relevant to fodder maize cultivation.
S2.3 Dataset Preparation
Eleven datasets were constructed by combining Sentinel-2 multispectral imagery bands 3, 4, 8 and 11 with the extracted features (NDVI, MNDWI, NDBI, slope, and elevation). These datasets were prepared for subsequent land use and land cover classification as follows:
Dataset 1: Reflectance bands 3, 4 and 8.
Dataset 2: Bands 3, 4 and 8 combined with slope data.
Dataset 3: Bands 3, 4 and 8 combined with elevation data.
Dataset 4: Bands 3, 4 and 8 combined with slope and elevation data.
Dataset 5: Bands 3, 4 and 8 combined with slope, elevation, and NDBI.
Dataset 6: Bands 3, 4 and 8 combined with slope, elevation, and MNDWI.
Dataset 7: Bands 3, 4 and 8 combined with slope, elevation, and NDBI.
Dataset 8: Bands 3, 4 and 8 combined with slope, elevation, MNDWI, and NDBI.
Dataset 9: Bands 3, 4 and 8 combined with slope, elevation, NDVI, and NDBI.
Dataset 10: Bands 3, 4 and 8 combined with slope, elevation, NDVI, and MNDWI.
Dataset 11: Bands 3, 4 and 8 combined with slope, elevation, NDVI, MNDWI, and NDBI.
Feature normalization was not applied in this study. This decision was based on the nature of the machine learning algorithms used, particularly Random Forest and CART, which are generally robust to differing input feature scales. Additionally, initial tests showed that the models performed well without normalization. However, we acknowledge that normalization may improve the performance of other algorithms such as SVM and Naïve Bayes, and this will be explored in future work.
Although the combinations of bands and indices were manually defined, they were based on domain knowledge and prior studies that emphasize the relevance of vegetation indices (e.g., NDVI), moisture detection (e.g., MNDWI), urban differentiation (e.g., NDBI), and terrain features (slope and elevation) in LULC classification. The progressive addition of variables across datasets was intended to assess the incremental effect of each feature group.
We acknowledge that correlation analysis and feature importance estimation (e.g., via Random Forest or PCA) could help reduce redundancy among features. However, such techniques were not applied in this study in order to maintain clarity and interpretability of the input combinations. Furthermore, mean spectral signature analysis was not conducted, and we recognize that this may help visualize class separability in future work. Expanding feature selection with statistical measures will be considered in subsequent studies to enhance model generalization and performance.
S2.4 Training Sample Selection and Classification Model Application
Field survey data were collected from representative locations within Mueang District, Nakhon Ratchasima Province, which includes a variety of land use types and topographic conditions. Ground truth points were obtained using handheld GPS devices and photographic documentation. Each location was validated against high-resolution imagery in Google Earth Engine to ensure accuracy.
A total of 1000 sample points were collected using a stratified random sampling method to ensure adequate representation across six land use/land cover (LULC) classes: (1) fodder maize; (2) other crops; (3) forest land; (4) urban and built-up areas; (5) paddy field; (6) water body. These labeled samples were divided into 70% for training and 30% for validation and applied consistently across all classification datasets.
Training samples were collected and used to train the classification models for all datasets in the LULC classification process. Five land use/land cover (LULC) classes were defined based on field surveys and high-resolution imagery interpretation: (1) fodder maize; (2) other crops; (3) built-up areas; (4) water bodies; (5) bare land.
A total of 1000 sample points were randomly selected and labeled, with 70% used for training and 30% for validation. The points were stratified across classes to ensure reasonable representation; however, due to the spatial distribution of land types, the number of points per class was not exactly equal. Efforts were made to balance the dataset as much as possible, particularly ensuring sufficient representation of the target class (fodder maize).
The same training and validation set was used consistently across all datasets to ensure comparability between models.
S3. Land Use and Land Cover Classification
All eleven datasets were classified using machine learning algorithms, including Random Forest (RF), Support Vector Machine (SVM), Naïve Bayes (NB), and Classification and Regression Trees (CART), implemented via the open-source Google Earth Engine (GEE) platform. LULC was categorized into six classes: Maize, Urban and built-up land, Forest land, Water body, Paddy field, and Field crop, resulting in a total of 44 classification outputs.
The selection of classifiers was based on their widespread usage and proven performance in remote sensing-based land cover classification. RF and SVM are widely recognized for their robustness and high accuracy, while Naïve Bayes and CART were included for comparison across different algorithmic paradigms. Although simpler algorithms such as k-nearest neighbor (KNN) and minimum distance (MIND) can be effective in some contexts, they were not included in this study due to their relatively high sensitivity to noisy data, class imbalance, and high-dimensional feature spaces. These algorithms will be considered for comparison in future work.
All classification models in this study were implemented using default hyperparameters available in the Google Earth Engine (GEE) platform. The Random Forest (RF) model used 100 trees, with a minimum leaf population of 1 and all features considered per split. The Support Vector Machine (SVM) classifier was configured with an RBF kernel, gamma = 0.5, and cost parameter C = 1. Naïve Bayes (NB) was implemented as a Gaussian classifier without configurable parameters. For the Classification and Regression Tree (CART), the minimum leaf population was set to 1, and no maximum node depth was defined. These default settings were chosen due to their general-purpose applicability and were found to produce satisfactory results in preliminary tests. However, future work may explore hyperparameter optimization for further performance enhancement.
S4. Accuracy Assessment
S4.1 Ground Truth Data Collection
Field-verified ground truth data were collected through field surveys and high-resolution imagery interpretation. A total of 665 reference points were obtained across the study area, covering all six LULC classes. These points were selected using a stratified random sampling strategy to ensure spatial representation and class balance.
The geographic coordinates of each reference point were recorded using a Garmin eTrex 10 handheld GPS device. On-site photographs were also taken using an iPhone 16 pro camera to assist in the interpretation of land use and land cover types.
For accuracy assessment, 70% of the points were used for training and 30% (193 points) were reserved for validation. Validation points were spatially distributed throughout the study area to minimize geographic bias.
S4.2 Assessment of Optimal Classification Methods and Datasets
The classification results were validated against ground truth data. Accuracy was assessed using (1) Overall Accuracy and (2) Kappa coefficient of agreement (Equations (1) and (2)). Subsequently, the classification methods and datasets were compared based on overall accuracy and Kappa coefficient to identify the optimal approach for LULC classification. For maize cultivation areas, conditional Kappa coefficients were used to evaluate class-specific accuracy (Equation (4)).
o v e r a l l   a c c u r a c y = i = 1 k n i i N
K h a t   c o e f f i c i e n t   o f   a g r e e m e n t = N i = 1 k n i i i = 1 k n i + × n + i N 2 i = 1 k n i + × n + i
C o n d i t i o n a l   K h a t   c o e f f i c i e n t   o f   a g r e e m e n t = N ( n i i ) n i + × n + i N ( n i + ) n i + × n + i
where k is the number of rows (land use and land cover classes), nii is the sum of the diagonal elements of the error matrix, ni+ is the sum of the ith row of the error matrix, n+i is the sum of the ith column of the error matrix, and N is the total number of validation samples.
While this study focused on overall accuracy and Kappa statistics for general performance assessment, class-specific metrics such as precision, recall, and F1-score for the maize cultivation class were not calculated. The primary reason was to maintain consistency with previous studies using similar LULC classification frameworks. Nevertheless, we acknowledge that these metrics can provide more comprehensive insights into classification effectiveness for the maize class. We intend to include these class-level evaluations in future studies for deeper analysis and model improvement.

3. Results

3.1. Accurate Classification of Maize Cultivation Using Google Earth Engine and Machine Learning

The classification of fodder maize cultivation areas in Mueang District, Nakhon Ratchasima Province was conducted using the Google Earth Engine (GEE) platform in combination with four machine learning algorithms: Support Vector Machine (SVM), Random Forest (RF), Naïve Bayes (NB), and Classification and Regression Trees (CART). Eleven datasets were tested, each comprising different combinations of Sentinel-2 spectral bands (3, 4, 8), vegetation and water indices (NDVI, NDBI, MNDWI), and topographic features (slope and elevation).
Among these, Dataset 11—consisting of bands 3, 4, 8, NDVI, MNDWI, NDBI, slope, and elevation—produced the highest classification accuracy. The SVM classifier yielded the best overall performance, achieving an overall accuracy of 92.5% and a Kappa coefficient of 0.89. Class-specific accuracy for fodder maize was particularly strong, with a conditional Kappa value exceeding 0.90. These results highlight the advantages of integrating spectral, biophysical, and topographic features for accurate land use and land cover (LULC) classification in heterogeneous agricultural landscapes.
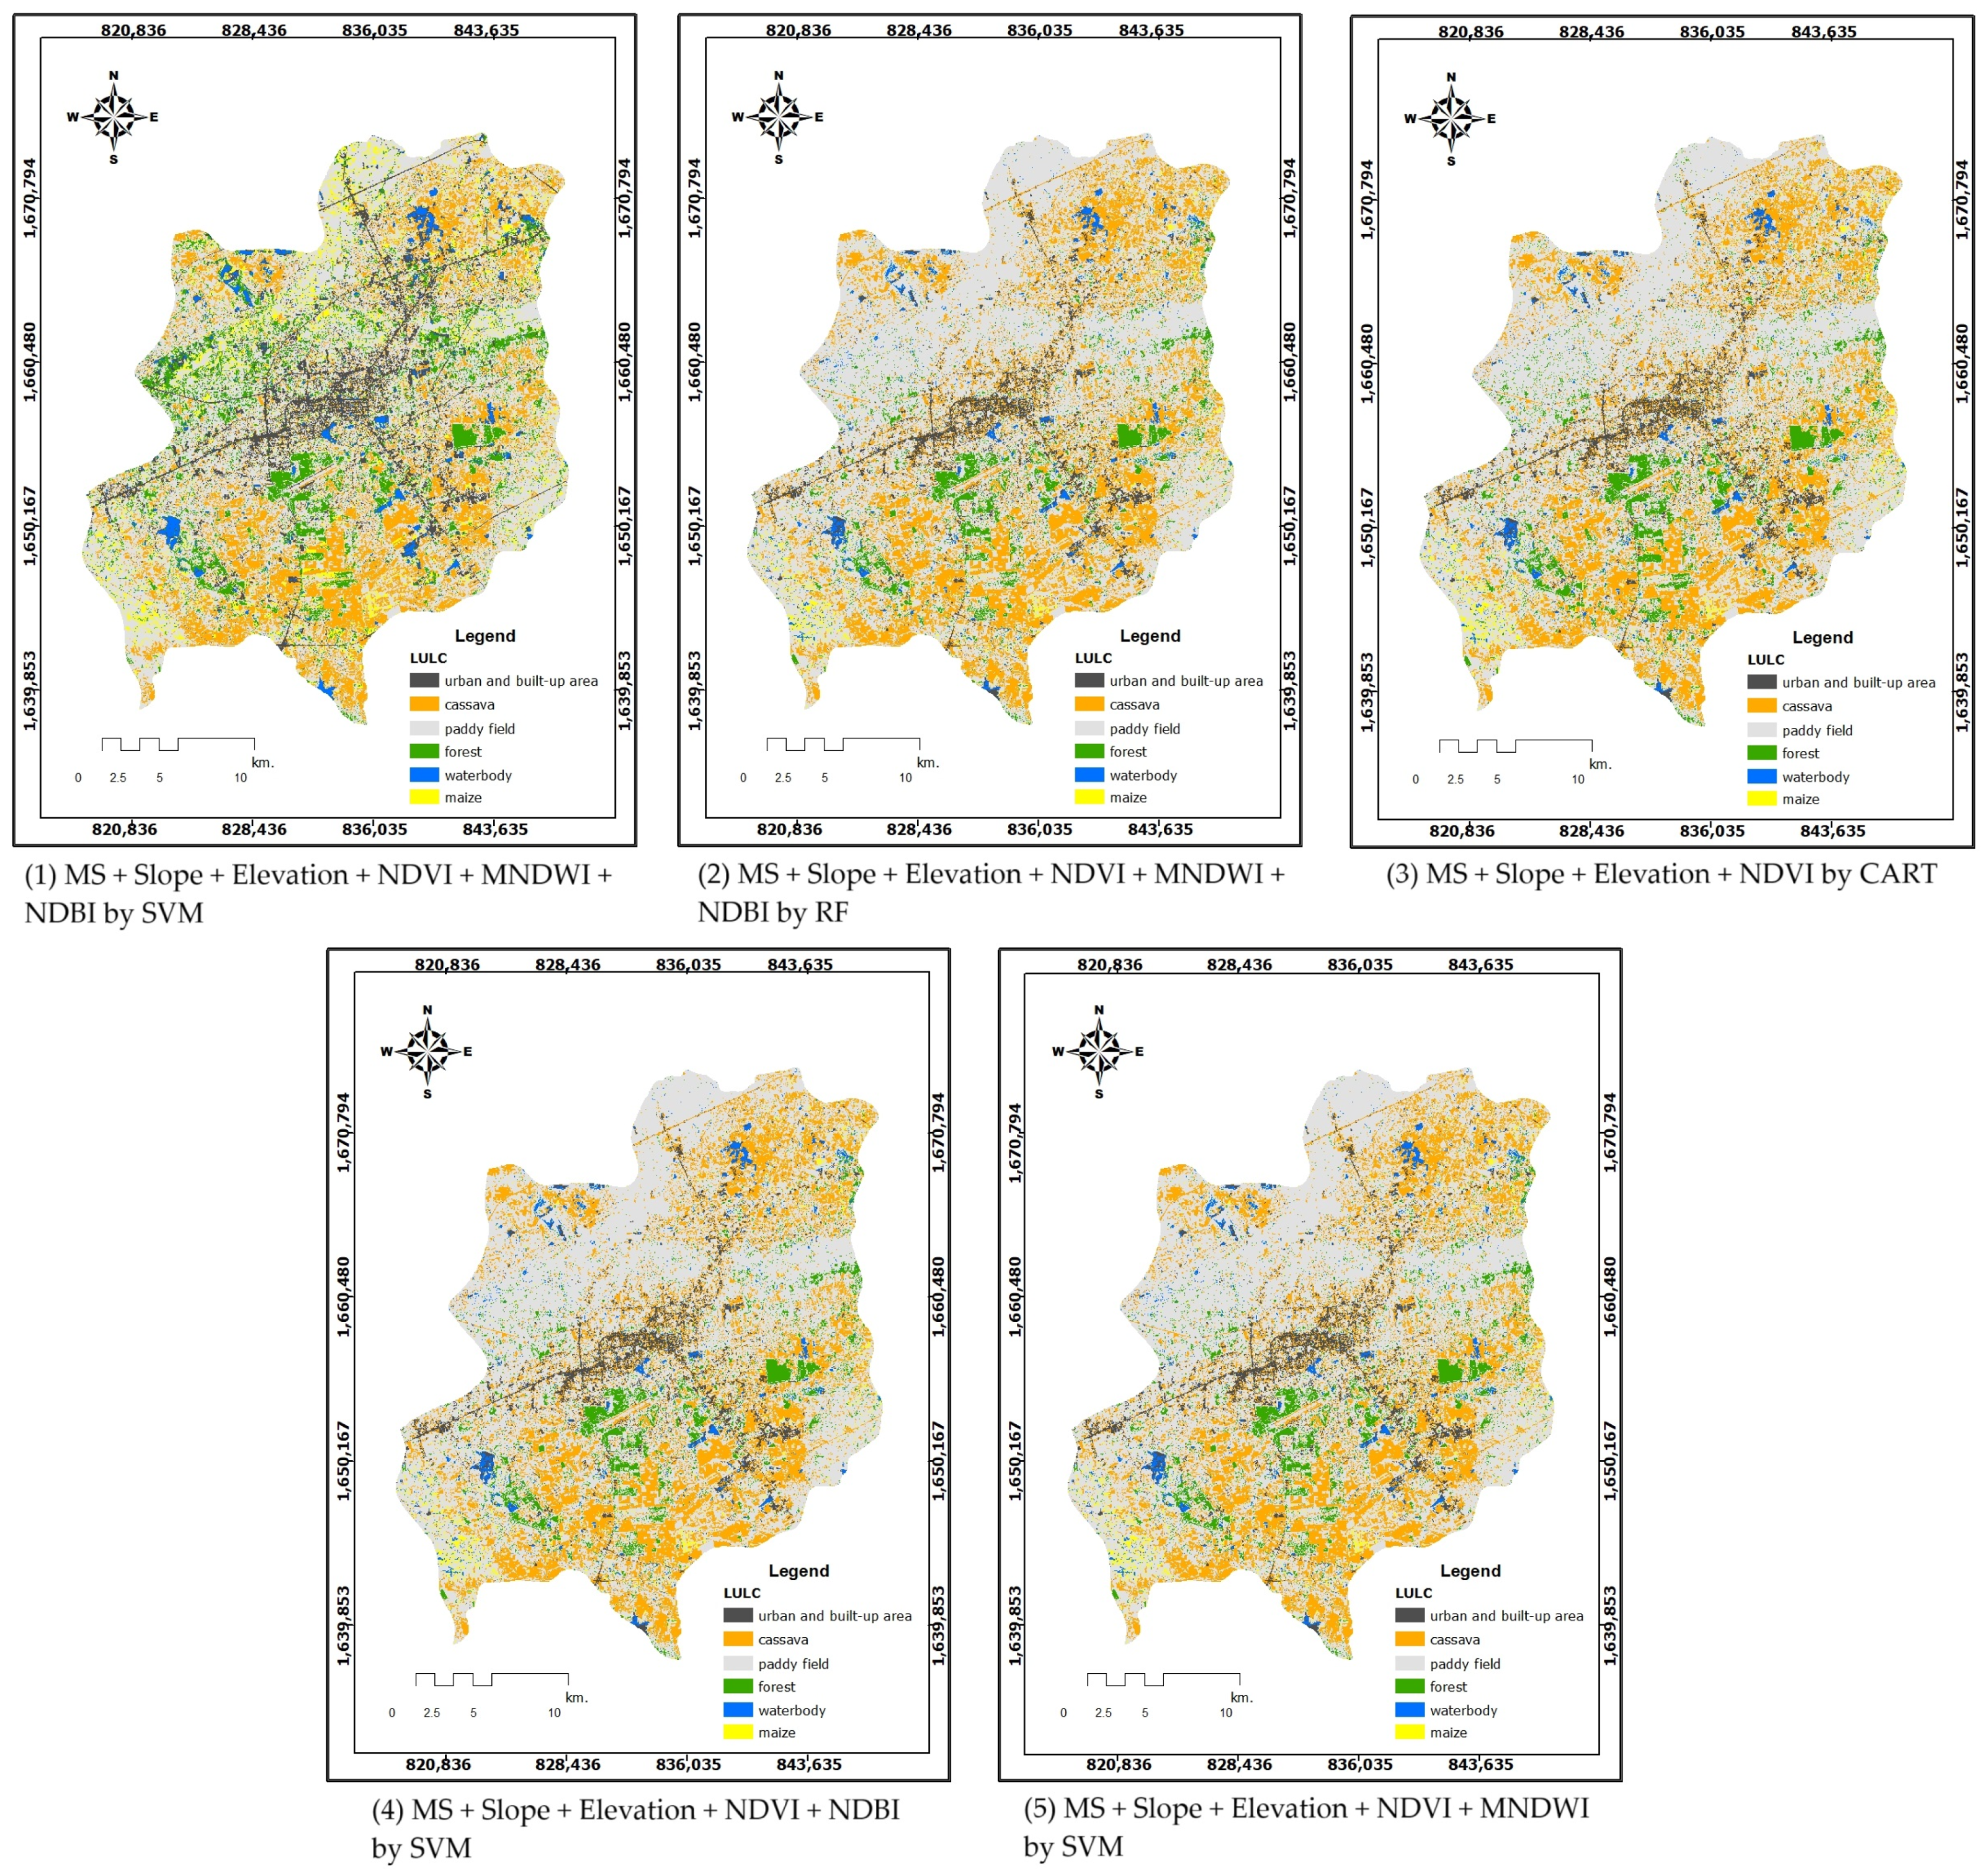
The spatial distribution of fodder maize fields and other land use categories is presented in Figure 3, which presents the classification results derived from the top five datasets and classifiers with the highest overall accuracy. The map clearly shows distinct patterns of maize cultivation and other land types across the study area, supporting the efficacy of the proposed classification approach.

3.2. Accuracy Assessment of Land Use and Land Cover Classification

Accuracy assessment was conducted using 193 validation points reserved from the original dataset. The points were selected through stratified random sampling to represent all LULC classes and geographic zones of the study area.
The classification results from the eleven datasets and four machine learning models (44 scenarios in total) were validated using confusion matrices. Overall Accuracy (OA) and Kappa Coefficient (Kappa) were computed according to Equations (4) and (5). In addition to quantitative evaluation, visual inspections were conducted using RGB composites overlaid with classification outputs in the GEE environment to qualitatively assess classification quality and identify spatial misclassifications.
While statistical metrics provide a summary of model performance, additional visual inspection was performed to better understand misclassifications. Figure 3 presents a side-by-side comparison of an RGB composite image and the corresponding classification result for the optimal scenario (SVM using Dataset 11). This comparison helps to visually assess spatial consistency and identify areas of confusion between land classes, particularly for fodder maize and adjacent crop types.
Table 1 presents the accuracy assessment results used to determine the most suitable dataset and machine learning algorithm for classifying maize cultivation areas and other land use and land cover (LULC) types. A total of eleven datasets were constructed by integrating Sentinel-2 spectral reflectance bands with various biophysical variables, including slope, elevation, NDVI, NDBI, and MNDWI. Each dataset was classified using four supervised machine learning algorithms—Random Forest (RF), Support Vector Machine (SVM), Naïve Bayes (NB), and Classification and Regression Trees (CART)—resulting in 44 classification scenarios.
While these 44 classification scenarios reflect systematic combinations of spectral bands and biophysical indices, the study did not aim to exhaustively explore all possible feature permutations. Instead, the selected feature sets were constructed based on domain knowledge, practical relevance to agricultural landscapes, and computational feasibility. This approach allowed for a balanced evaluation of commonly used indices (e.g., NDVI, MNDWI, NDBI) and topographic variables (slope and elevation), which are known to influence classification accuracy. Nonetheless, we acknowledge that alternative strategies such as data-driven feature selection, principal component analysis (PCA), or model-based importance ranking could further optimize feature combinations. These methods will be considered in future research to refine classification performance and generalizability.
Among all scenarios, Dataset 11 classified with the SVM algorithm yielded the highest performance, achieving an overall accuracy of 97.41% and a Kappa coefficient of 96.97%, indicating a strong agreement with the ground truth data. This combination was thus identified as the optimal model for LULC classification in the study area. Following closely were Dataset 11 with RF, which achieved an overall accuracy of 96.89% and a Kappa value of 96.35%, and Dataset 7 with CART, which attained an overall accuracy of 96.37% and a Kappa coefficient of 95.75%. The comparative performance of these top-performing scenarios is also illustrated in Figure 4.
Table 2 summarizes the classification results of land use and land cover (LULC) types derived from the optimal classification scenario—Dataset 11 using the Support Vector Machine (SVM) algorithm. The classified LULC types in the study area include six categories: urban and built-up areas, cassava fields, paddy fields, forest areas, water bodies, and maize cultivation areas.
Among these classes, paddy fields (PF) represent the largest land cover type, covering approximately 422.20 square kilometers (42,220 hectares or 263,875 rai), accounting for 55.9% of the total study area. This is followed by cassava (CA), covering about 141.05 square kilometers (14,105 hectares or 88,156 rai), and urban and built-up areas (UR), with 76.86 square kilometers (7686 hectares or 48,037 rai). Maize cultivation areas (MA) account for 39.78 square kilometers (3978 hectares or 24,863 rai), representing approximately 5.27% of the study area. Forest land (FO) and water bodies (WA) cover 57.82% square kilometers (5782 hectares or 36,138 rai) and 17.85 square kilometers (1785 hectares or 11,156 rai), respectively.
These results indicate the distribution and extent of different land use categories in Mueang District, Nakhon Ratchasima Province, and highlight the relatively limited area under maize cultivation, which underscores the importance of spatial planning to optimize agricultural productivity and sustainability in the region.
Table 3 presents the accuracy assessment results for the classification of maize cultivation and other land use and land cover (LULC) types using the Support Vector Machine (SVM) algorithm applied to Dataset 11, which integrated spectral and biophysical variables. The classification yielded an overall accuracy of 97.41% and a Kappa coefficient of 96.97%, reflecting a high level of agreement between the classified outputs and ground truth data, and confirming the excellent performance of the model.
Additionally, the conditional Kappa coefficients for all LULC classes—representing producer’s accuracy—attained values of 100.00%, indicating that all actual instances of each class were correctly identified by the classifier. Likewise, the user’s accuracy, represented by the conditional Kappa values for each predicted class, also reached 100.00%, as summarized in Table 4. These results highlight the robustness and reliability of the SVM classifier when used in conjunction with a comprehensive set of spectral and biophysical variables for land use mapping.
Based on the evaluation of the most suitable datasets for classifying individual land use and land cover (LULC) types within maize cultivation areas using various classification algorithms, the analysis incorporated the conditional Kappa coefficients of agreement for each LULC class across all 11 datasets and 44 classification scenarios, as detailed in Table 4. The findings reveal that Dataset 11, when classified using the Support Vector Machine (SVM) algorithm, demonstrated the highest classification performance for maize cultivation. Specifically, both the producer’s accuracy and user’s accuracy for the maize class achieved 100.00%, confirming the superior reliability and precision of this classification approach in identifying maize cultivation areas.

4. Discussion

This study confirms that Support Vector Machine (SVM) and Random Forest (RF) algorithms generally outperform simpler classifiers for land use and land cover (LULC) mapping. The results are consistent with previous studies that reported high classification accuracies using SVM and RF for satellite-based LULC analysis [14,15]. Other research has also found that SVM and RF consistently outperformed Decision Tree and Naïve Bayes classifiers when applied to Landsat-8 and Sentinel-2 imagery for crop classification [18], and that the integration of time-series imagery with RF improved classification performance [19].
The spatial distribution of fodder maize cultivation areas identified in this study provides detailed insights that may differ from existing agricultural statistics, suggesting that remote sensing-based approaches can complement or enhance traditional data collection methods. Despite the high accuracy, periodic field validation remains essential to ensure temporal consistency.
Among the algorithms tested, RF and SVM showed superior performance, likely due to their ability to handle high-dimensional feature spaces and capture complex relationships among variables. In contrast, NB and CART yielded lower accuracy, which may result from their stronger reliance on statistical assumptions and limited capacity to separate overlapping spectral classes. The addition of vegetation indices and topographic features such as NDVI, slope, and elevation improved class separability, especially in heterogeneous landscapes.
Dataset 11, which incorporated all available spectral bands and biophysical variables, achieved the highest accuracy across all algorithms. This highlights the benefit of multi-variable integration, which enhances the distinction between land cover types with similar spectral characteristics.
These findings suggest that the integration of Sentinel-2 imagery and biophysical features using advanced machine learning methods within the GEE platform can serve as a reliable and scalable approach to support sustainable land use planning and agricultural monitoring. This methodology can be adapted to different regions and crop types and offers valuable tools for decision-makers involved in precision agriculture and resource management.
The performance of each algorithm was also influenced by the characteristics of the LULC classes. For instance, paddy fields exhibited high MNDWI values during the early growing season, while maize fields showed strong NDVI signals at peak vegetative stages. Urban and built-up areas were effectively identified using NDBI, and forested regions were distinguishable due to consistently high NDVI and distinct topographic features. The superior accuracy of Dataset 11 can be attributed to its inclusion of both spectral and biophysical variables, which enhanced the differentiation of classes, particularly in complex peri-urban landscapes. These findings demonstrate the added value of combining spectral reflectance with ancillary variables for improving classification precision in heterogeneous agricultural environments.

5. Conclusions

This study demonstrates the high efficacy of integrating Google Earth Engine (GEE) with machine learning algorithms for accurately classifying fodder maize cultivation areas in Mueang District, Nakhon Ratchasima Province, Thailand. By utilizing Sentinel-2 multispectral imagery in conjunction with biophysical variables—such as slope, elevation, NDVI, NDBI, and MNDWI—eleven datasets were developed and assessed using four supervised classification algorithms: Random Forest (RF), Support Vector Machine (SVM), Naïve Bayes (NB), and Classification and Regression Trees (CART).
Among the 44 classification scenarios, Dataset 11 combined with the SVM algorithm produced the highest accuracy, achieving 97.41% overall accuracy and a Kappa coefficient of 96.97%.Notably, fodder maize was classified with 100.00% accuracy in both producer’s and user’s metrics, indicating a highly reliable identification of maize fields even within complex urban and peri-urban agricultural landscapes.
The findings underscore the effectiveness of using a GEE-based machine learning framework to support spatially explicit, high-resolution crop monitoring. This approach offers a reproducible and scalable solution for decision-makers seeking to enhance precision in agricultural planning, particularly in regions facing land use fragmentation. By improving the spatial understanding of fodder maize distribution, the methodology contributes directly to more sustainable land use management and agricultural resource optimization.

6. Recommendations

To enhance the model’s generalizability and applicability, future research should extend the study to other geographic contexts with varied environmental conditions, such as mountainous areas, coastal zones, or irrigated farming regions. This will help assess the robustness and adaptability of the classification framework across diverse landscapes.
The incorporation of time-series analysis is recommended to capture seasonal variations in cropping patterns and monitor dynamic agricultural processes, particularly during periods of climatic stress such as droughts or excessive rainfall.
To further refine classification accuracy and spatial resolution, comparative studies utilizing alternative satellite imagery sources—such as Landsat-8, PlanetScope, or unmanned aerial vehicles (UAVs)—should be conducted. These comparisons will provide insights into the trade-offs between data availability, spatial resolution, and processing complexity.

Author Contributions

Conceptualization: S.P. (Sasikarn Plaiklang); Methodology: S.P. (Sasikarn Plaiklang), S.P. (Supattra Puttinaovarat), P.M. and W.M.; Validation: S.P. (Sasikarn Plaiklang) and S.P. (Supattra Puttinaovarat); Investigation: S.P. (Sasikarn Plaiklang) and S.P. (Supattra Puttinaovarat); Formal Analysis: S.P. (Sasikarn Plaiklang) and S.P. (Supattra Puttinaovarat); Writing—Original Draft Preparation: S.P. (Sasikarn Plaiklang) and S.P. (Supattra Puttinaovarat); Writing—Review and Editing: S.P. (Sasikarn Plaiklang), S.P. (Supattra Puttinaovarat), P.M. and W.M.; Visualization: S.P. (Sasikarn Plaiklang) and S.P. (Supattra Puttinaovarat); Project Administration: S.P. (Sasikarn Plaiklang). All authors have read and agreed to the published version of the manuscript.

Funding

The research project was funded by Rajamangala University of Technology Isan under the research grant agreement No. NKR2567INC023.

Data Availability Statement

Data are available on request to the authors.

Acknowledgments

The authors express their gratitude to Google Inc., USGS, and GISTDA for providing the remotely sensed data utilized in this study.

Conflicts of Interest

The authors declare no conflicts of interest.

References

  1. Shiferaw, B.; Prasanna, B.M.; Hellin, J.; Bänziger, M. Crops that Feed the World 6: Past Successes and Future Challenges to the Role Played by Maize in Global Food Security. Food Secur. 2011, 3, 307–327. [Google Scholar] [CrossRef]
  2. Godfray, H.C.J.; Beddington, J.R.; Crute, I.R.; Haddad, L.; Lawrence, D.; Muir, J.F.; Pretty, J.; Robinson, S.; Thomas, S.M.; Toulmin, C. Food Security: The Challenge of Feeding 9 Billion People. Science 2010, 327, 812–818. [Google Scholar] [CrossRef] [PubMed]
  3. Ray, D.K.; Mueller, N.D.; West, P.C.; Foley, J.A. Yield Trends Are Insufficient to Double Global Crop Production by 2050. PLoS ONE 2013, 8, e66428. [Google Scholar] [CrossRef] [PubMed]
  4. Agronomy Research Institute and Renewable Energy Plants, Department of Agriculture. 2024. Available online: https://www.doa.go.th/fcri/wp-content/uploads/2024/12/%E0%B8%AA%E0%B8%96%E0%B8%B2%E0%B8%99%E0%B8%81%E0%B8%B2%E0%B8%A3%E0%B8%93%E0%B9%8C%E0%B8%9E%E0%B8%B7%E0%B8%8A-101067.pdf (accessed on 1 July 2025).
  5. Poramacom, N. Maize Production, Prices and Related Policy in Thailand. Br. J. Arts. Soc. Sci. 2013, 11, 174–185. [Google Scholar]
  6. Ekasingh, B.; Sungkapitux, C.; Kitchaicharoen, J.; Suebpongsang, P. Maize in Thailand: Production Systems, Constraints, and Research Priorities; CIMMYT: Texcoco, Mexico, 2004. Available online: https://ageconsearch.umn.edu/record/7649/files/mp04ek01.pdf (accessed on 25 April 2025).
  7. Office of the Permanent Secretary for Ministry of Agriculture and Cooperatives. Nakhon Ratchasima Province. 2019. Available online: https://www.opsmoac.go.th/nakhonratchasima-dwl-files-421091791863 (accessed on 1 July 2025).
  8. Tharanukul, P.; Surat, S.; Khaephimai, C.; Khongrit, N.; Mungjomklang, S.; Israngkul Na Ayudhya, P. Testing Technologies to Cost Reduction Maize Production by Biofertilizer (PGPR-1) of Nakhon Ratchasima Province. 2021. Available online: https://www.doa.go.th/plan/wp-content/uploads/2023/07/331.3.pdf (accessed on 1 July 2025).
  9. Aryaguna, P.A.; Danoedoro, P. Comparison Effectiveness of Pixel-Based Classification and Object-Based Classification Using High Resolution Image in Floristic Composition Mapping (Study Case: Gunung Tidar, Magelang City). In Proceedings of the IOP Conference Series: Earth and Environmental Science, Bristol, UK, 17–19 November 2016; IOP Publishing: Bristol, UK, 2016; Volume 47, p. 012042. [Google Scholar]
  10. Song, K.; Bian, Y.; Wang, D.; Li, R.; Wu, K.; Liu, H.; Qin, C.; Hu, J.; Xiao, L. Advances and challenges of single-pixel imaging based on deep learning. Laser Photonics Rev. 2024, 19, 2401397. [Google Scholar] [CrossRef]
  11. Singh, M.; Tyagi, K.D. Pixel-Based Classification for Landsat 8 OLI Multispectral Satellite Images Using Deep Learning Neural Network. Remote Sens. Appl. Soc. Environ. 2021, 24, 100645. [Google Scholar] [CrossRef]
  12. Goel, E.; Abhilasha, E. Random Forest: A Review. Int. J. Adv. Res. Comput. Sci. Softw. Eng. 2017, 7, 251–257. [Google Scholar] [CrossRef]
  13. Maxwell, A.E.; Warner, T.A.; Fang, F. Implementation of machine-learning classification in remote sensing: An applied review. Int. J. Remote Sens. 2018, 39, 2784–2817. [Google Scholar] [CrossRef]
  14. Khan, S.; Bhardwaj, A.; Sakthivel, M. Accuracy Assessment of Land Use Land Cover Classification Using Machine Learning Classifiers in Google Earth Engine: A Case Study of Jammu District. In Proceedings of the ISPRS TC IV Mid-Term Symposium “Spatial Information to Empower the Metaverse”, Fremantle, Australia, 22–25 October 2024; Volume 48, pp. 1682–1750. [Google Scholar]
  15. Neetu; Ray, S.S. Exploring Machine Learning Classification Algorithms for Crop Classification Using Sentinel-2 Data. Int. Arch. Photogramm. Remote Sens. Spat. Inf. Sci. 2019, 42, 573–578. [Google Scholar] [CrossRef]
  16. Blind, K.; Böhm, M.; Grzegorzewska, P.; Katz, A.; Muto, S.; Pätsch, S.; Schubert, T. The Impact of Open Source Software and Hardware on Technological Independence, Competitiveness and Innovation in the EU Economy; Final Study Report; European Commission: Brussels, Belgium, 2021. [Google Scholar] [CrossRef]
  17. Phongphan, J.; Jiraphat, B.; Propran, B.; Yaowaret, J.; Piyachai, C. Guidelines for the Application of Google Earth Engine for Monitoring and Evaluating Natural Disaster Damage. In Proceedings of the 26th National Civil Engineering Conference, Online Conference, 23–25 June 2021. [Google Scholar]
  18. Shelestov, A.; Lavreniuk, M.; Kussul, N.; Novikov, A.; Skakun, S. Exploring Google Earth Engine Platform for Big Data Processing: Classification of Multi-Temporal Satellite Imagery for Crop Mapping. Front. Earth Sci. 2017, 5, 232994. [Google Scholar] [CrossRef]
  19. Xie, S.; Liu, L.; Zhang, X.; Yang, J.; Chen, X.; Gao, Y. Automatic Land-Cover Mapping Using Landsat Time-Series Data Based on Google Earth Engine. Remote Sens. 2019, 11, 3023. [Google Scholar] [CrossRef]
  20. Intarat, K. Land Use Classification in Nakhon Nayok Province Using Machine Learning Algorithms and Sentinel-2 Image. Burapha Sci. J. 2022, 27, 1153–1171. [Google Scholar]
  21. Rouse, J.W.; Haas, R.H.; Schell, J.A.; Deering, D.W. Monitoring vegetation systems in the Great Plains with ERTS. Third NASA Earth Resour. Technol. Satell. Symp. 1974, 1, 309–317. [Google Scholar]
  22. Gao, B.-C. NDWI—A normalized difference water index for remote sensing of vegetation liquid water from space. Remote Sens. Environ. 1996, 58, 257–266. [Google Scholar] [CrossRef]
  23. Zha, Y.; Gao, J.; Ni, S. Use of normalized difference built-up index in automatically mapping urban areas from TM imagery. Int. J. Remote Sens. 2003, 24, 583–594. [Google Scholar] [CrossRef]
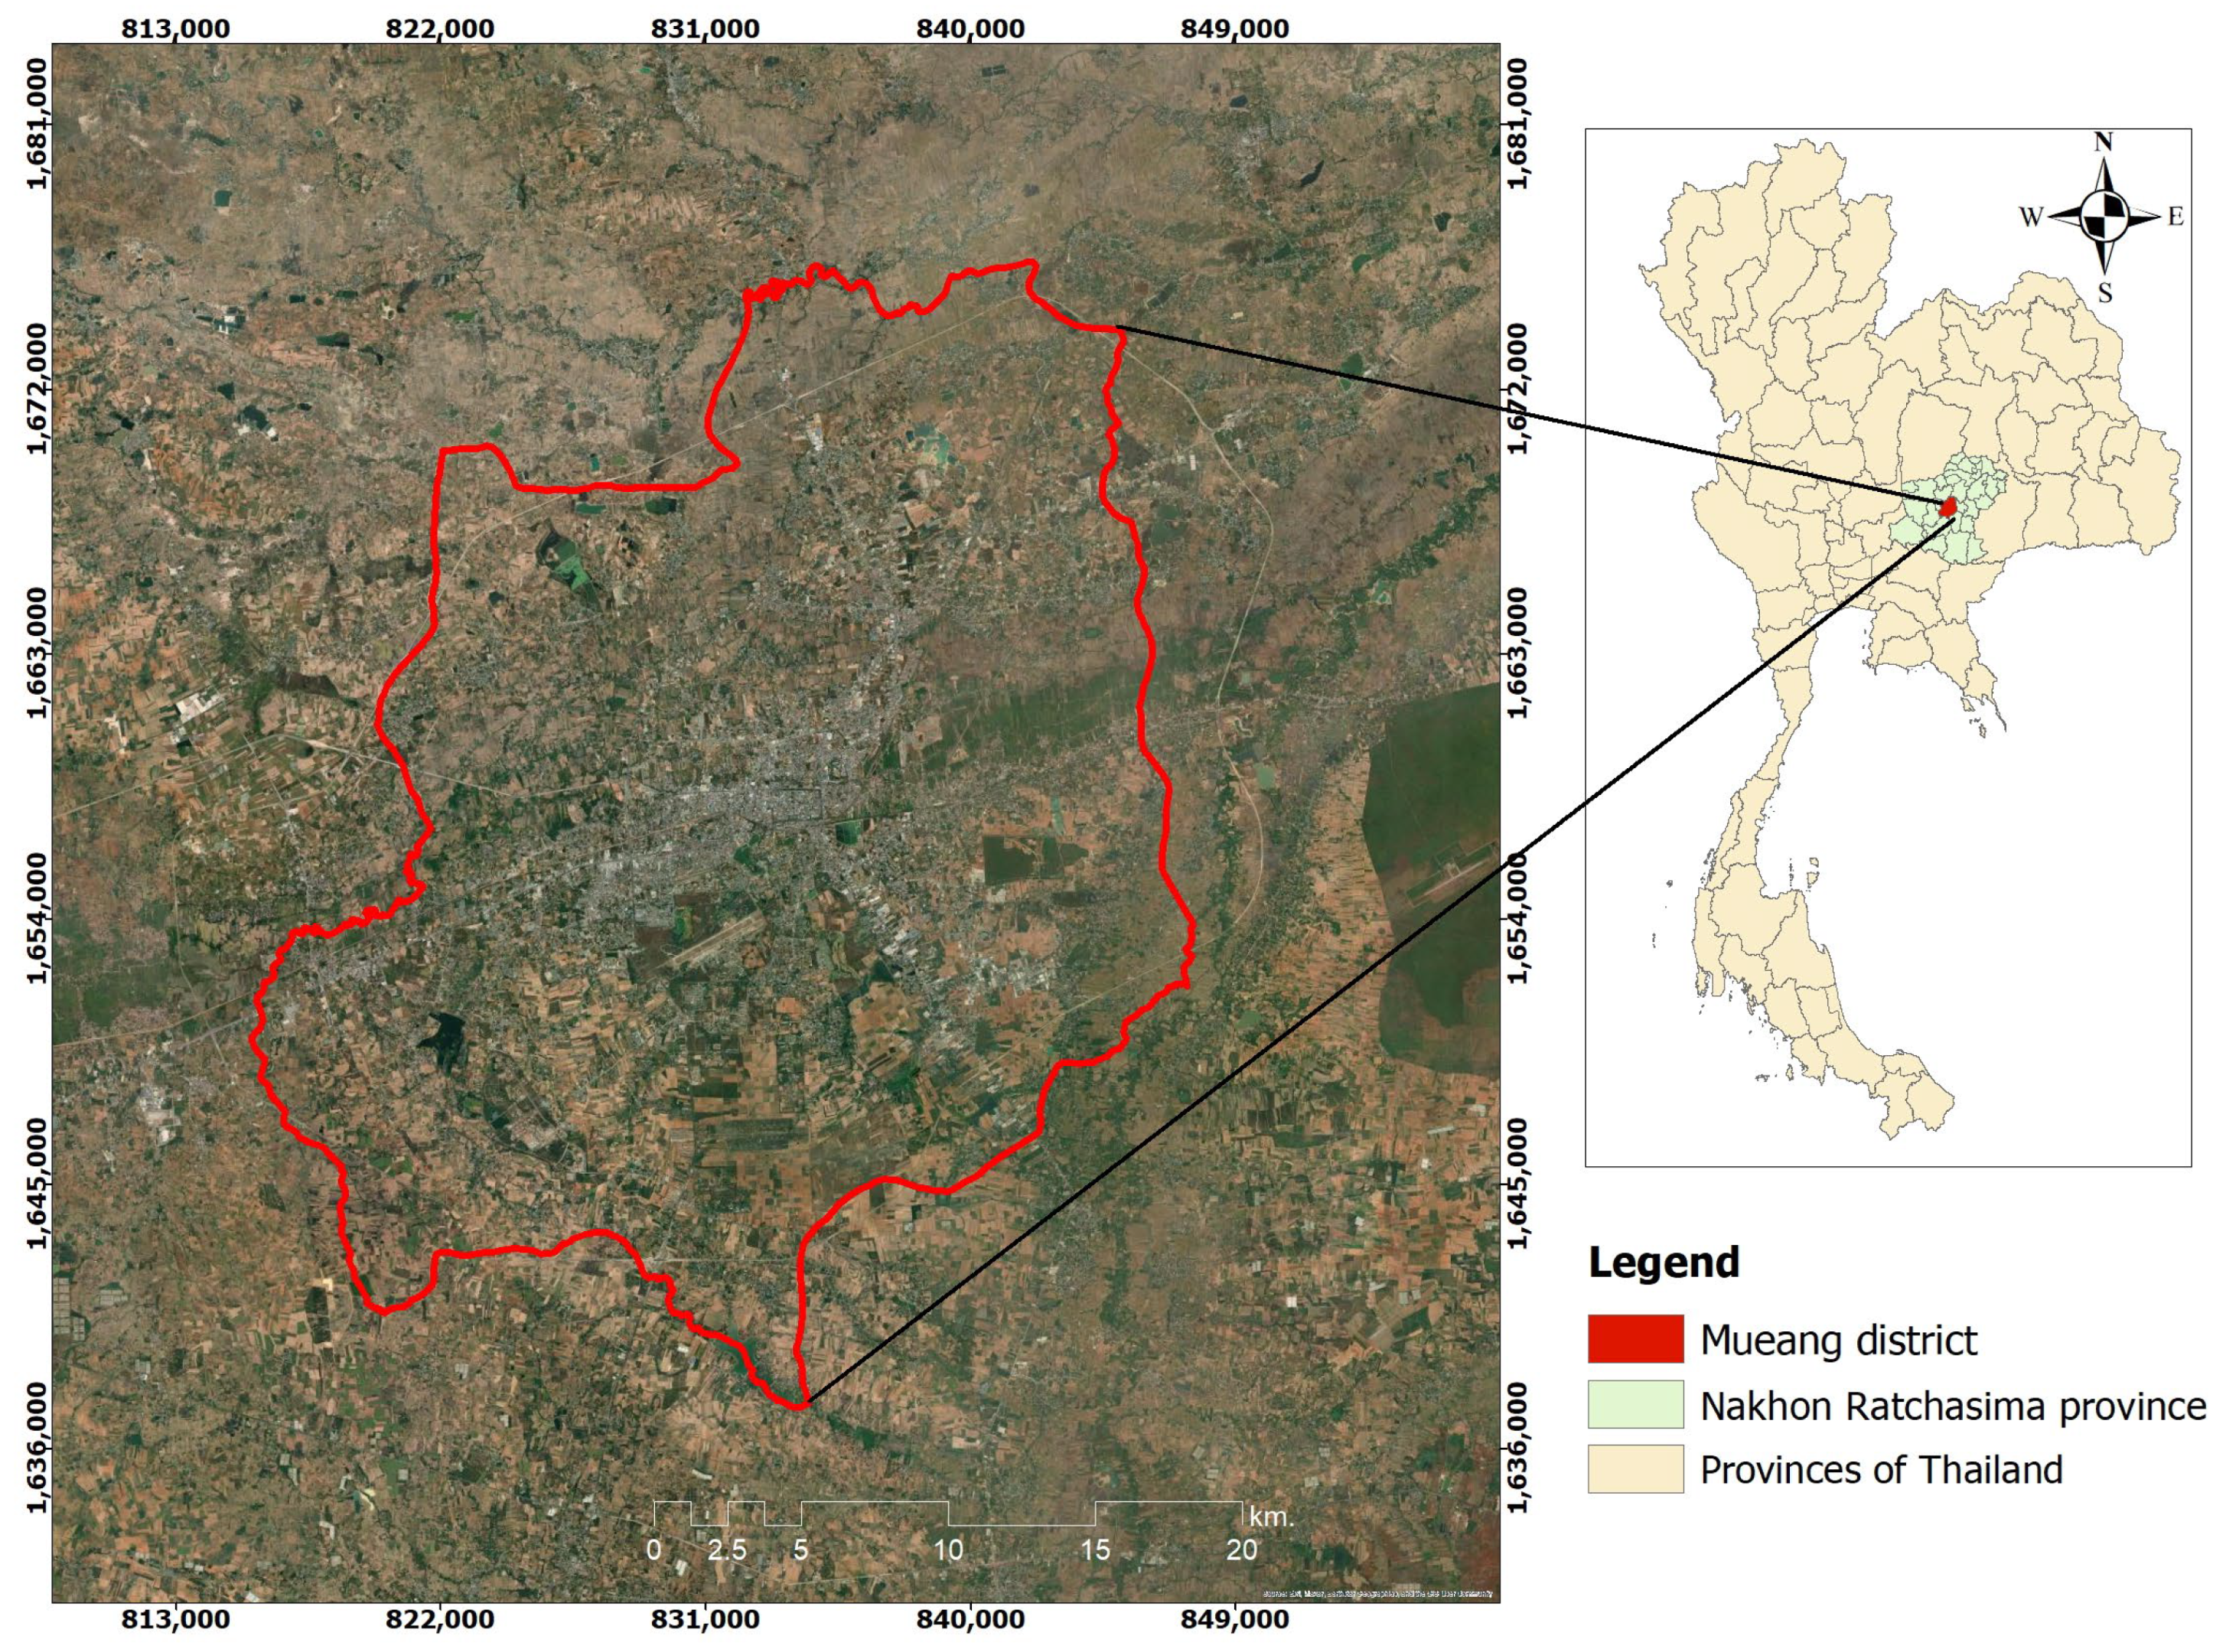
Figure 1. Study Area.
Agriengineering 07 00302 g001
Figure 2. The flowchart of the research methodology.
Agriengineering 07 00302 g002
Figure 3. The land use and land cover classification results obtained from the top five datasets and classifiers with the highest overall accuracy are presented.
Agriengineering 07 00302 g003
Figure 4. The land use and land cover classification results obtained using the SVM algorithm on Dataset 11.
Agriengineering 07 00302 g004
Table 1. Accuracy assessment results of land use and land cover classification.
DatasetBands (B3, B4, B8)SlopeElevationNDVIMNDWINDBISVMRFCARTNB
OA k ^ OA k ^ OA k ^ OA k ^
1 87.5685.2786.5384.1889.6487.8178.2474.30
2 89.1287.2192.2390.8491.1989.6478.2474.10
3 91.7190.2391.1989.7191.1989.6577.2073.05
4 92.2390.8694.8293.9495.8595.1277.2073.13
5 93.2692.0995.8595.1093.2692.0380.8377.33
6 91.1989.5594.3093.2792.2390.7683.4280.25
7 94.3093.3295.3494.5496.3795.7576.6872.62
8 95.8595.1494.3093.3592.2390.9176.6872.51
9 95.8594.9496.3795.7392.2390.6088.0885.43
10 95.8595.1594.3093.3195.8595.1480.3176.86
1197.4196.9796.8996.3595.3494.5179.7976.19
Note: OA = Overall Accuracy, k ^ = Kappa Coefficient.
Table 2. The classification results of maize cultivation areas and other LULC types.
ClassLand Use and Land Cover TypesArea (sq.km.)Area (rai)Area (Hectares)
1Urban and built-up area (UR)76.8648,037.507686.00
2Cassava (CA)141.0588,156.2514,105.00
3Paddy field (PF)422.20263,875.0042,220.00
4Forest (FO)57.8236,137.505782.00
5Waterbody (WA)17.8511,156.251785.00
6Maize (MA)39.7824,862.503978.00
Total755.56472,225.0075,556.00
Table 3. Error Matrix, Overall Accuracy, and Kappa Coefficient for Dataset 11 Classified Using SVM.
Classified DataReference DataTotalOA
URCAPF1PF2PF3FOWA1WA2MA
UR150000000015100.00
CA04210000004397.67
PF1001300000013100.00
PF2000390000039100.00
PF300012300002495.83
FO00200170001989.47
WA10000007007100.00
WA2000100070887.50
MA000000002525100.00
Total1542164123177725193
PA100.00100.0081.2595.12100.00100.00100.00100.00100.00
Overall accuracy = 97.41%
Kappa coefficient = 96.97%
Table 4. Conditional kappa coefficients of agreement for each land use and land cover class of maize cultivation using various classification methods.
DatasetSVMRFCARTNB
C o n . O A C o n . P A C o n . O A C o n . P A C o n . O A C o n . P A C o n . O A C o n . P A
182.9873.5959.9078.1987.0887.0869.4955.40
279.2482.6787.4787.4794.7881.9478.3452.67
386.3090.4386.2186.2195.3283.5982.6661.38
494.5985.3686.2186.2195.3283.5985.7066.65
595.0695.0690.1994.8490.1390.1394.8267.04
682.9890.7083.0895.1687.1691.0678.2171.94
791.1191.1191.1695.3895.58100.0084.2469.61
895.0390.5495.0390.5495.0390.54100.0060.17
9100.0091.22100.0091.49100.0091.2290.8190.81
1094.90100.0095.4095.40100.0095.5890.3565.19
11100.00100.00100.0091.49100.0091.4990.3565.19
Disclaimer/Publisher’s Note: The statements, opinions and data contained in all publications are solely those of the individual author(s) and contributor(s) and not of MDPI and/or the editor(s). MDPI and/or the editor(s) disclaim responsibility for any injury to people or property resulting from any ideas, methods, instructions or products referred to in the content.