Article

Segmentation of Porous Structure in Carbonate Rocks with Applications in Agricultural Soil Management: A Hybrid Method Based on the UNet Network and Kriging Geostatistical Techniques

by
Maxwell Pires Silva
1,*,†,
Italo Francyles Santos da Silva
1,*,†,
Alan de Carvalho Araújo
1,†,
João Dallyson Sousa de Almeida
1,†,
Anselmo Cardoso de Paiva
1,†,
Aristófanes Corrêa Silva
1,† and
Deane Roehl
2,†
1
Applied Computing Group (NCA), Federal University of Maranhão, Maranhão 65085-580, Brazil
2
Tecgraf Institute, Pontifical Catholic University of Rio de Janeiro, Rio de Janeiro 22453-900, Brazil
*
Authors to whom correspondence should be addressed.
These authors contributed equally to this work.
AgriEngineering 2025, 7(9), 294; https://doi.org/10.3390/agriengineering7090294
Submission received: 16 July 2025 / Revised: 29 August 2025 / Accepted: 5 September 2025 / Published: 10 September 2025

Abstract

In the context of soil management, the porous structure present in these systems plays a relevant role due to its capacity to store and transport water, nutrients, gases, and provide root fixation. A detailed and precise analysis of these structures can assist specialists in determining specific agricultural solutions and management practices for each soil, depending on the characteristics of its porous structure. In this regard, this study presents a hybrid method for segmenting porous structures in micro computed tomography (micro CT) images of carbonate rocks, with a focus on applications in agricultural soil analysis and management. Initially, preprocessing steps such as Contrast Limited Adaptive Histogram Equalization (CLAHE) and histogram specification are applied in order to improve image contrast and uniformity. Subsequently, a UNet convolutional neural network is employed to identify pore contours, followed by the application of two geostatistical approaches, ordinary kriging and Universal Kriging, with the purpose of completing segmentation through the interpolation of unclassified regions. The proposed approach was evaluated using the dataset “16 Brazilian Pre Salt Carbonates”, which includes high-resolution micro CT images. The results show that the integration of UNet with ordinary kriging achieved superior performance, with 79.2% IoU, 93.3% precision, 81.7% recall, and 87.1% F1 Score. This method enables detailed analyses of pore distribution and the porous structure of soils and rocks, supporting a better understanding of inherent characteristics such as permeability, porosity, and nutrient retention in soil, thus contributing to more assisted agricultural planning and more efficient soil use strategies.

1. Introduction

Carbonate rocks represent approximately 15.2% of the continental surface free of ice [1]. They are predominantly formed in shallow marine environments through the chemical precipitation of calcium carbonate or the accumulation of calcareous organism remains.
These rocks play a fundamental role in various geological and industrial processes. Composed mainly of minerals such as calcite (CaCO3) and dolomite (CaMg(CO3)2), they form large reservoirs of oil and gas and also serve as important aquifers in several regions worldwide, being responsible for about 25% of the global groundwater supply [1]. Their porous structure and variable permeability make them an essential object of study for geoscience and reservoir engineering [2].
In addition to improving soil fertility, Chent et al. [3] demonstrate that carbonate rocks also have implications for agriculture, especially in regions where soils are deficient in essential minerals for plant growth. For example, soils derived from carbonate rocks may be richer in calcium and magnesium, which can be beneficial for various agricultural crops. Furthermore, the transformation of carbonate rocks into soils involves the release of other minerals such as magnesium, which is vital for plant growth, along with other essential nutrients. This release of minerals contributes to soil fertility, influencing its capacity for nutrient retention and its physical structure, such as porosity and density.
The study of soil pore structure, including its connectivity, is of great importance to several economic sectors such as agriculture, soil recovery, and the oil industry. These structures play a key role in determining soil characteristics associated with important ecological functions, including the transport and retention of water and nutrients, gas exchange with the environment, and providing information on the storage capacity of energy resources [4,5]. Additionally, characteristics such as porosity and permeability of rocks and soils directly influence agricultural planning, treatment, and cultivation practices [6], reinforcing the importance of obtaining these data.
Moreover, the accurate characterization of porous structures in rocks and soils is fundamental for understanding fluid transport processes, permeability, and particle retention. Recent studies have highlighted the relevance of fluid particle interactions in porous media and their impact on hydraulic conductivity. For instance, ref. [7] employed a coupled Lattice Boltzmann and Discrete Element (LBM DEM) method to investigate slurry infiltration and clogging mechanisms in soils, showing that particle size distribution and hydraulic pressure thresholds play a crucial role in pore blockage and reopening. Such results emphasize the importance of methods capable of accurately assessing pore structures to support subsequent analyses of connectivity, porosity, and flow.
In this context, due to the high heterogeneity of soils, computed tomography (CT) has emerged as a powerful tool to perform non destructive analyses of soil and rock samples. Computed tomography, particularly X ray microtomography (micro CT), allows for detailed visualization of internal structures at high spatial resolution. The main advantage of micro CT is its ability to provide detailed information without the need for destructive sample preparation, thereby preserving the integrity of the sample for further analyses.
In addition, the combination of micro CT with advanced computational techniques has shown great potential in the analysis and modeling of carbonate rocks, enabling a deeper understanding of their petrophysical and geomechanical properties [8]. The ability to observe in detail the porous structure of rocks and simulate how fluids interact with these structures opens new perspectives for the exploration and management of natural resources, as well as for a better understanding of the geological processes that shape these rocks over time [9].
From this perspective, in the field of image analysis, segmentation is a fundamental process used to divide an image into different regions or segments, based on specific pixel characteristics such as color, intensity, or texture. The main objective of segmentation is to identify and isolate the relevant parts of an image, facilitating the analysis or extraction of meaningful information [10].
In this sense, image segmentation emerges as an important tool in the analysis of geological structures, being a crucial step to isolate and identify internal features of rocks or soils, such as pore networks, fractures, or different types of minerals. Segmentation techniques are employed to create three dimensional models of samples, allowing for a more detailed analysis of their properties, such as porosity and permeability [11].
However, traditional segmentation methods such as thresholding and region growing algorithms may present limitations when dealing with the structural complexity of soil images. In this regard, deep learning approaches have gained significant attention, especially convolutional neural networks (CNNs) such as the UNet architecture, due to their ability to segment complex patterns with high precision [12].
UNet, originally developed for biomedical segmentation, was designed for semantic segmentation, that is, to classify each pixel of an image into a given category. Its main strength is the ability to accurately segment small and complex structures, even in datasets with few annotated images. However, studies such as that by Bressan et al. [13] indicate that these methods may face challenges related to inconsistency, noise, and poorly defined regions in segmentations. On the other hand, kriging [14], conceived by the South African mining engineer Danie Gerhardus Krige in the 1950s, was aimed at improving the estimation of ore grades in deposits by reducing uncertainties in spatial predictions. His pioneering methods laid the foundation of modern geostatistics.
The study by Wang and Hongsheng [15], for example, proposed a deep learning based workflow using UNet++ for the segmentation of digital rock images obtained through computed tomography. To improve segmentation accuracy, they employed indicator kriging based on entropy masks (IK EBM). In this context, however, kriging was applied with the objective of creating high quality training datasets, serving as a reference for supervised models and also for correcting blurring effects, which are common in tomography images. At the end of the study, the performance of IK EBM was evaluated against traditional segmentation methods, showing superior results in detecting small targets and defining boundaries.
Thus, considering the scarcity of works that integrate machine learning and kriging as a fundamental part of segmentation, this article presents a method for the segmentation of porous structures in micro CT. The method employs a UNet neural network for edge segmentation, followed by different types of kriging applied individually to achieve final segmentation, thereby allowing a comparison between them. This contrasts with the approach of [15], which employed kriging only for refinement of the final segmentation.
In this context, considering the use of kriging in segmentation tasks and the remaining challenges in neural network based segmentations, the proposed method presents the following contributions: (1) a two dimensional segmentation method for pore structures in soil and rock microtomography; (2) a method based on the combination of machine learning and geostatistical interpolation (kriging); (3) a comparative analysis of results obtained with two types of kriging: ordinary and universal.
This study is structured as follows: Section 2 presents the materials and proposed method, Section 3 presents the results and discusses their implications, and finally, Section 4 provides the conclusion of this work.

2. Proposed Method and Materials

The proposed method consists of two stages: preprocessing and segmentation. In the preprocessing stage, the Contrast Limited Adaptive Histogram Equalization (CLAHE) filter is applied, followed by histogram specification, and finally resizing. Once the images are prepared, in the second stage the UNet network is used to segment the edges of the regions of interest (pores). At the end, segmentation is finalized separately with each kriging method, ordinary kriging and Universal Kriging, for comparison purposes. Figure 1 schematically represents this process.

2.1. Dataset

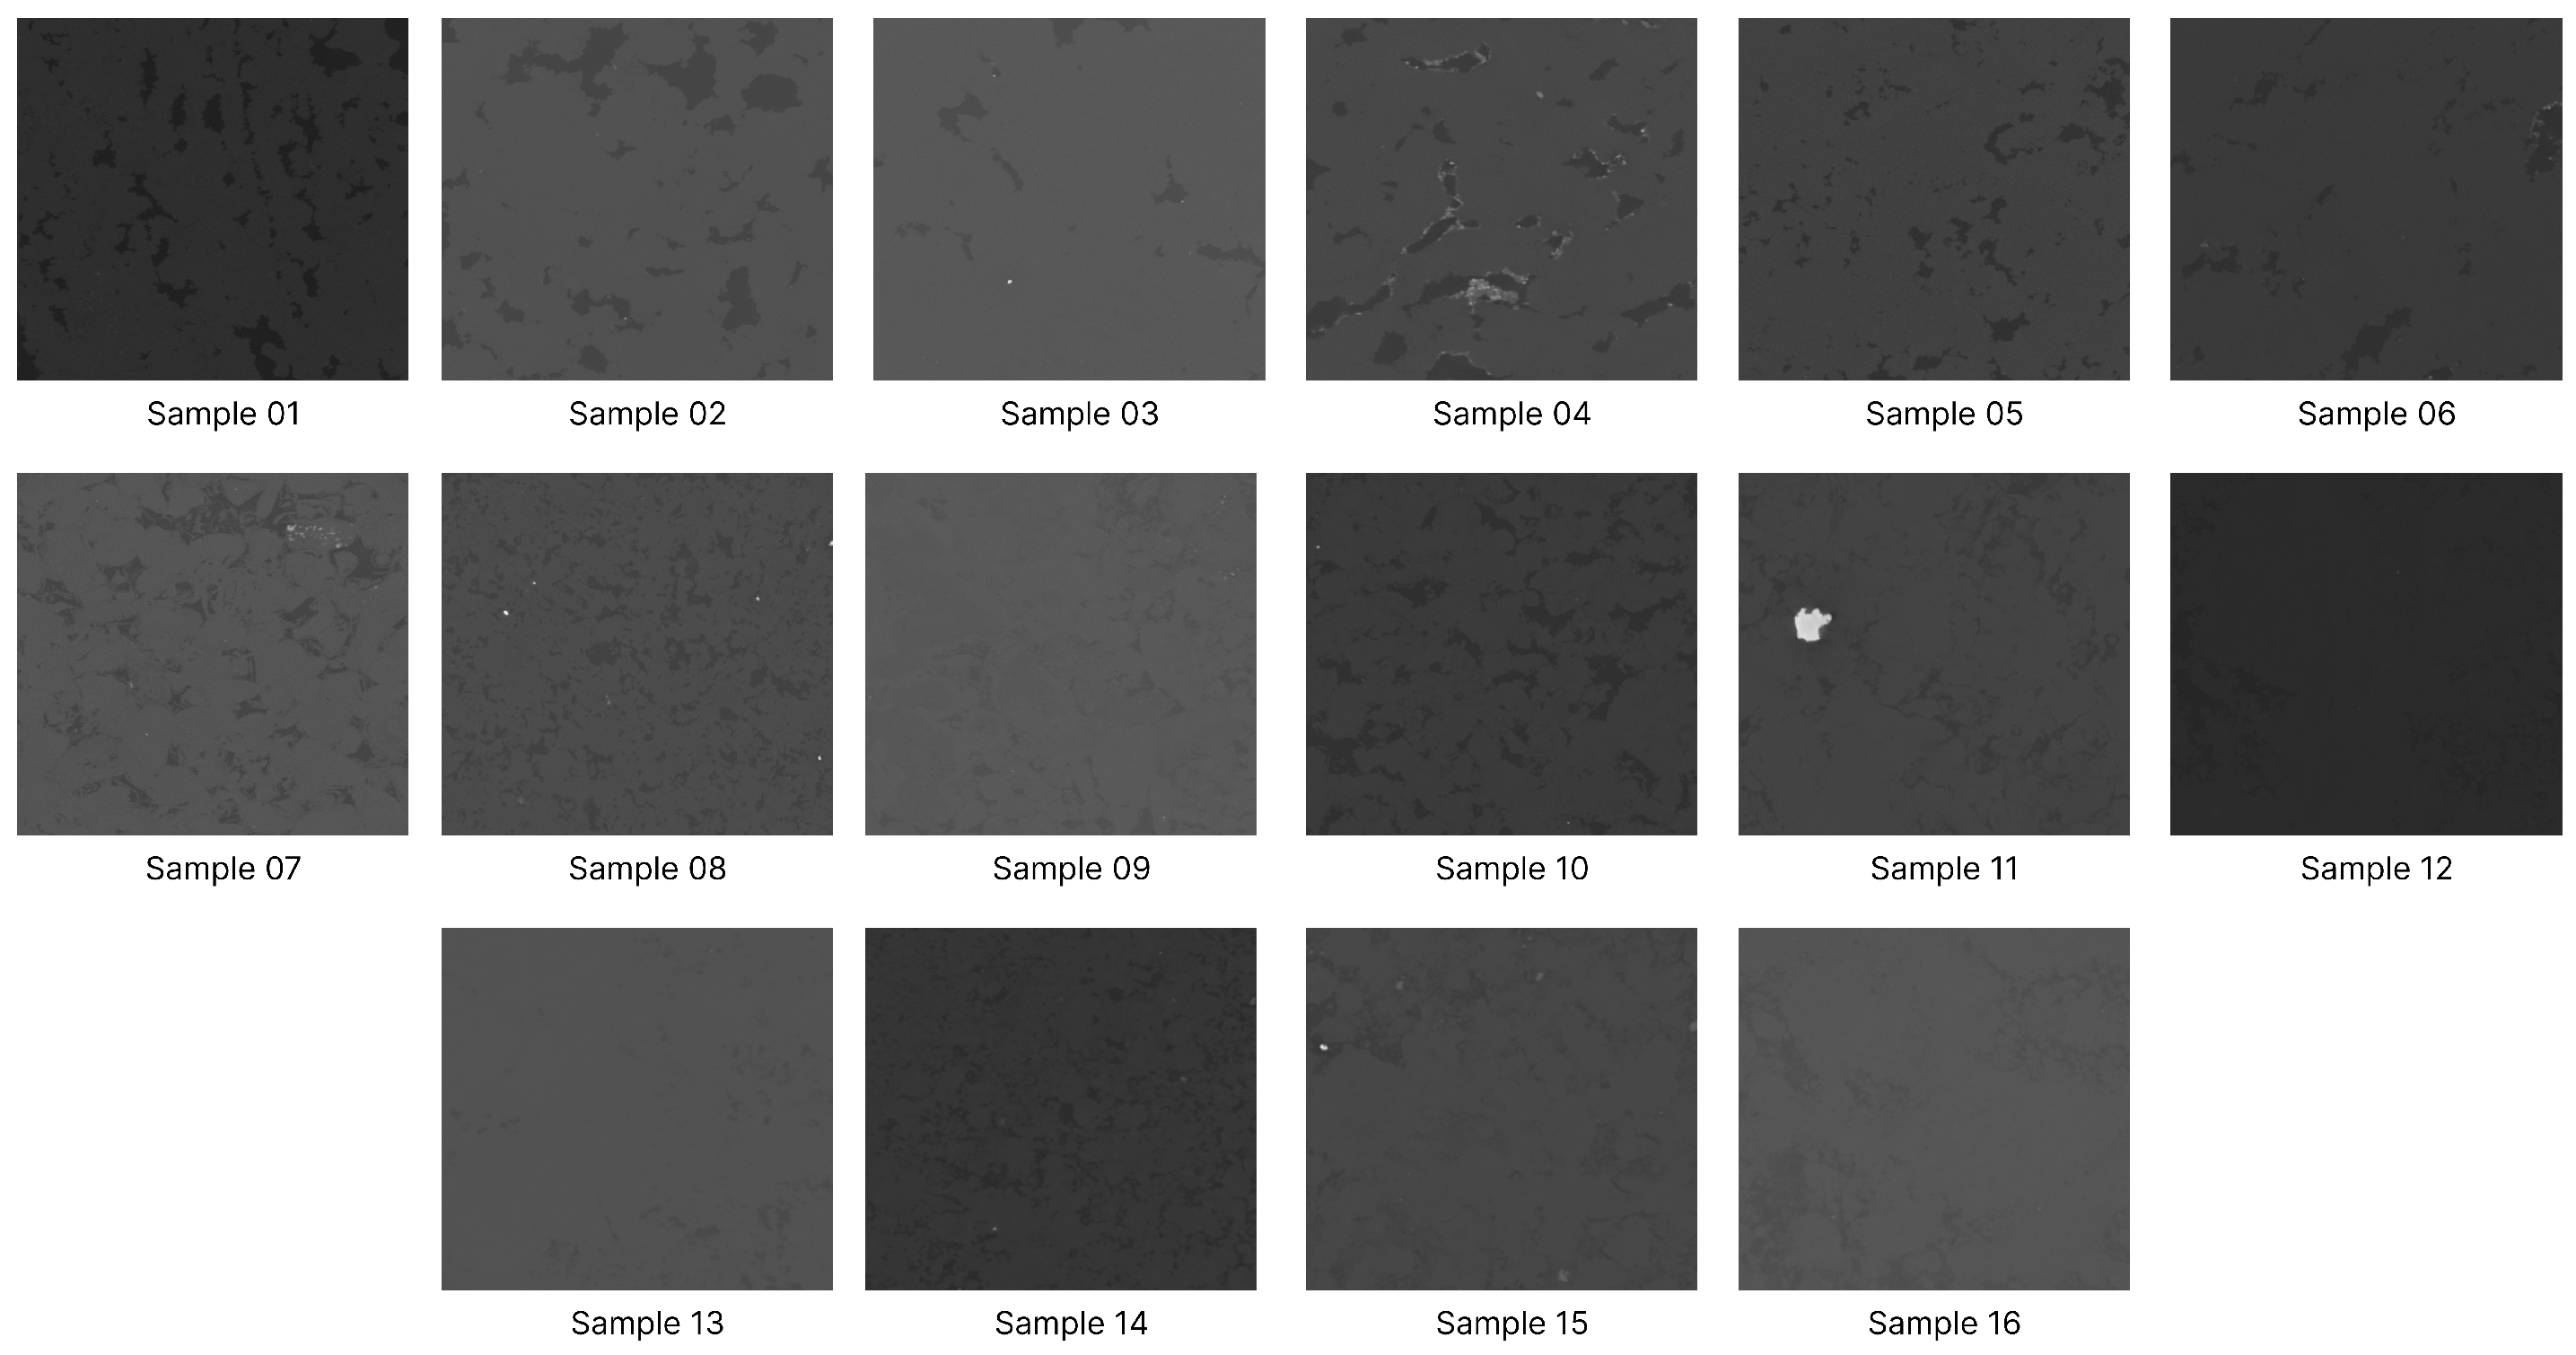
For the evaluation and validation of the proposed method, the dataset [16] entitled “16 Brazilian Pre Salt Carbonates: Multi Resolution Micro CT Images” was selected. The choice was motivated by the strong similarity between the porous structures of carbonate rocks and those found in soils. This dataset is a detailed collection of micro computed tomography (micro CT) images of 16 carbonate rock samples from the Brazilian pre salt region. The first slice of each sample is illustrated in Figure 2. Each sample contains on average 1100 micro CT slice images, obtained from petroleum and gas rich geological formations located in the Santos Basin, one of the most important offshore exploration areas in Brazil. The images are provided directly from the dataset in grayscale and have undergone processing, artifact reduction filtering, registration, and cropping.
In addition, the dataset includes segmented images generated by the Otsu and Watershed methods, enabling a detailed analysis of the sample characteristics. The dataset provides two versions of images for each sample: one with high resolution and another with low resolution. For analysis and validation of the method, only the high resolution images were used (Figure 2), since they are more detailed and contain more information about the rock. Therefore, they are extremely useful for investigating diagenetic processes that affect rocks over time, such as cementation and mineral dissolution. These images have an average resolution of 1140 × 1200 pixels. For this reason, resizing was performed to standardize the resolutions. The images also allow three dimensional visualization of the internal texture and structure of the rocks, facilitating the analysis of mineral distribution, fractures, and heterogeneities.

2.2. Preprocessing

Image preprocessing is a crucial step in computer vision and image processing systems, aiming to enhance image quality to facilitate subsequent analyses. The preprocessing techniques evaluated and used were CLAHE [17] and histogram specification [10] (in this order). These methods are already widely applied to improve contrast and the visibility of details in digital images [18,19], particularly in microtomography images of rocks where these aspects are essential for the evaluation of their characteristics.

2.2.1. CLAHE

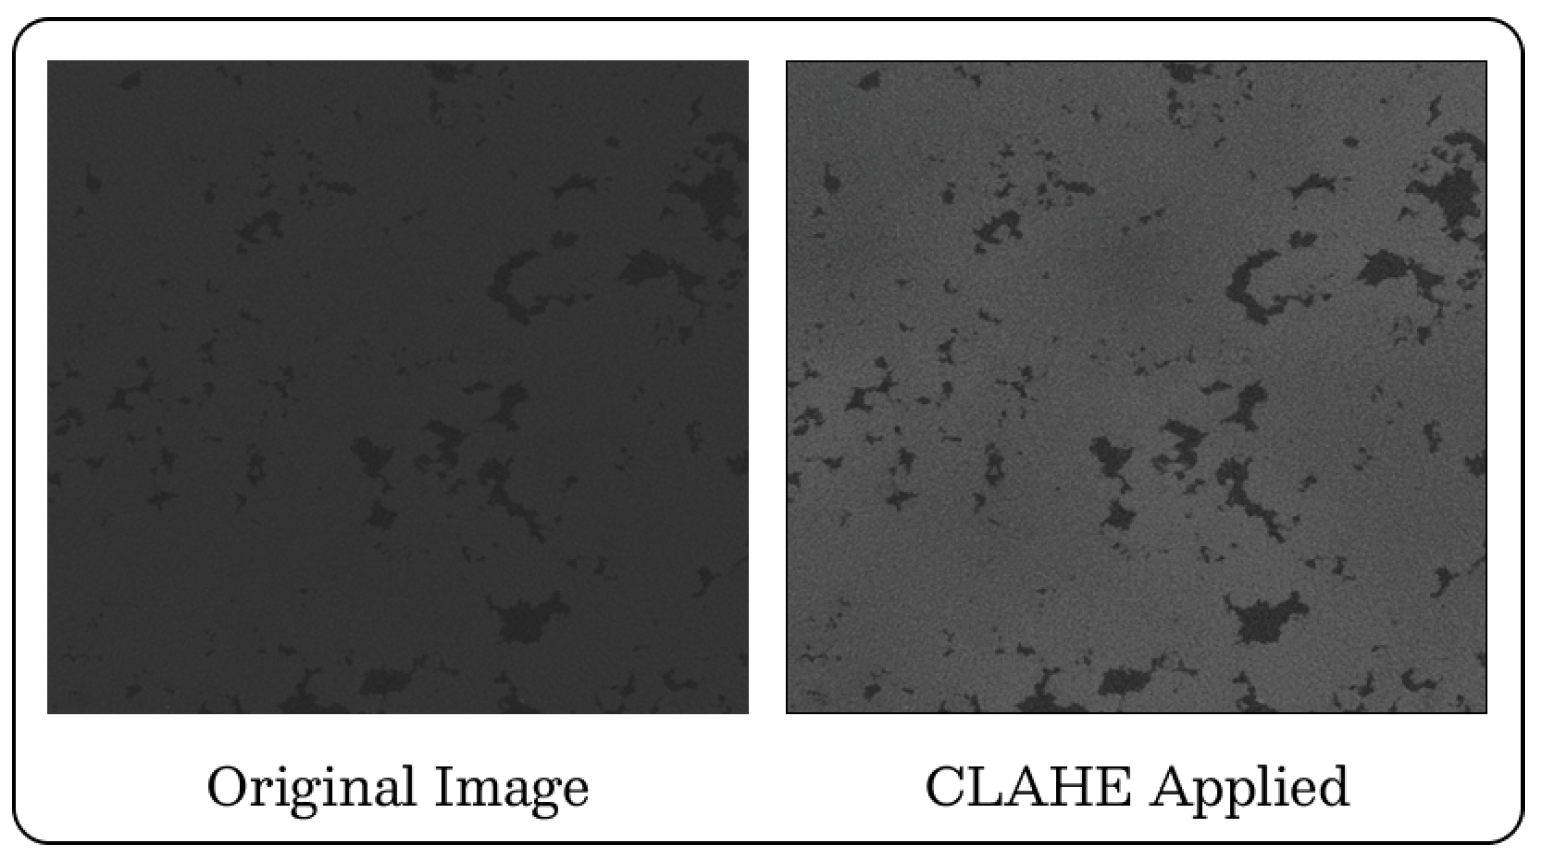
The CLAHE technique was developed to overcome the limitations of global equalization methods. Unlike traditional equalization, CLAHE divides the image into small regions called tiles and applies histogram equalization independently to each of them. After local equalization, the tiles are recombined through bilinear interpolation to avoid abrupt discontinuities between regions [20]. In the proposed method, the first preprocessing step is the application of CLAHE, as shown in Figure 3.

2.2.2. Histogram Specification

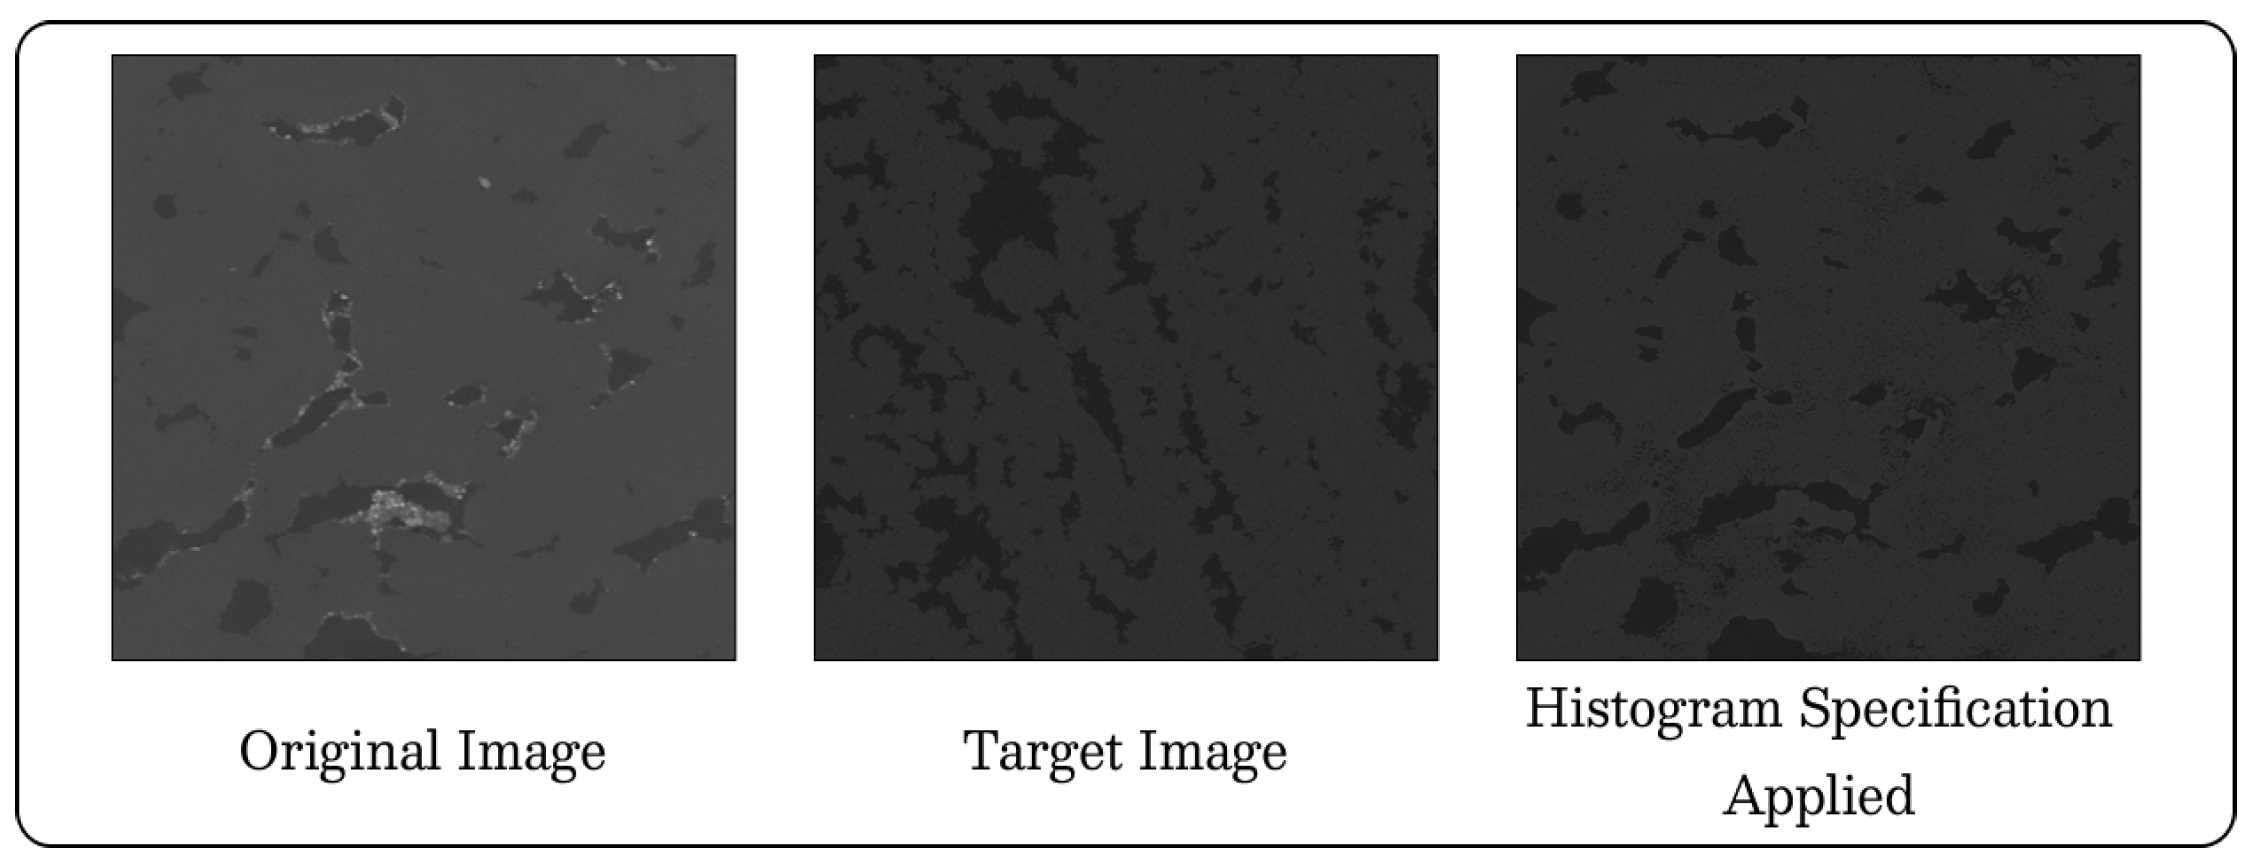
Histogram specification is a technique that transforms the pixel intensity levels of an image so that its histogram approximates a desired reference histogram. Unlike histogram equalization, which aims to achieve a uniform distribution of intensity levels, histogram specification allows the shaping of the intensity distribution to meet specific contrast or appearance requirements. The process involves mapping the intensity levels of the original image to new values so that the resulting histogram matches the target histogram [21]. In the proposed method, the second preprocessing step is the application of histogram specification, as illustrated in Figure 4.
At the end, in order to match the input resolution required by the UNet neural network, the resulting images were resized to 512 × 512 pixels. Despite the resizing, no significant loss or severe distortions occurred, since the average resolution was already close to a square resolution [1:1].

2.3. Segmentation

2.3.1. UNet

The UNet neural network [12] has the ability to segment images even with a reduced dataset, using a symmetric architecture with skip connections. It stands out in several areas, such as medical image segmentation, geospatial mapping, object detection in aerial images, and real time image segmentation. The UNet architecture has a symmetric “U” shape, composed of two main parts: encoder and decoder.
The encoder functions as a traditional CNN, progressively extracting features through convolutional layers and downsampling operations (using max pooling). Each stage of the encoder consists of two 3 × 3 convolutions, followed by ReLU as the activation function, and a 2 × 2 max pooling layer, which reduces the spatial dimension by half. With this approach, the network captures high level patterns, reducing the image size while maintaining important semantic information.
The decoder reconstructs the segmented image through upsampling and convolutions, gradually increasing the image resolution. Each stage of the decoder includes an upsampling operation that doubles the image resolution, 3 × 3 convolutions followed by ReLU to refine features, and skip connections to recover spatial information lost in the encoder. Skip connections are fundamental to improve segmentation performance, as they help preserve fine details from the original image.
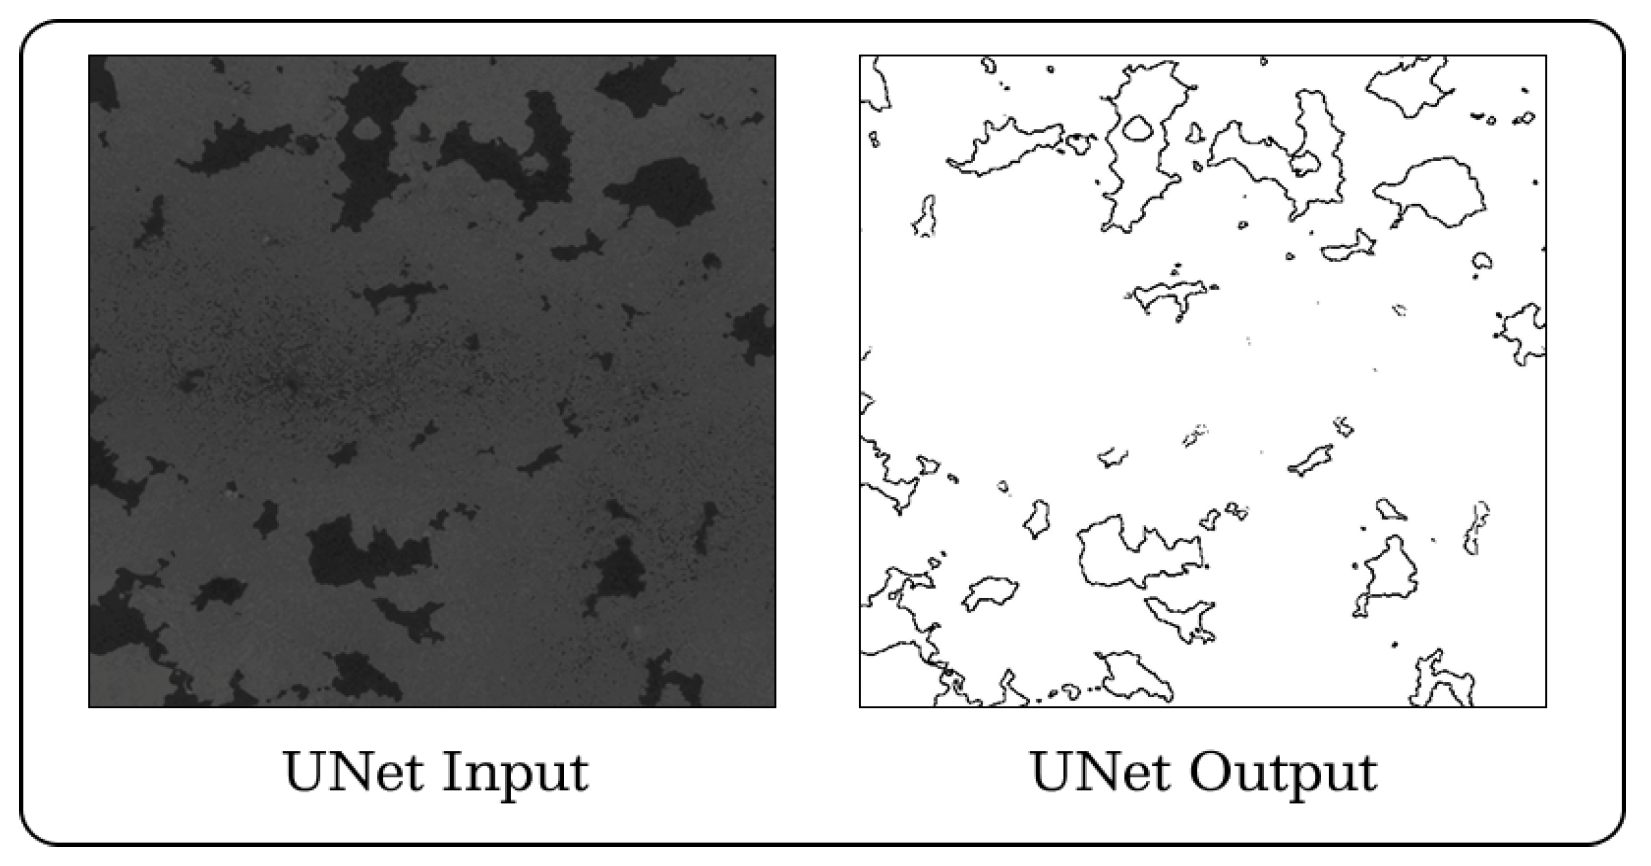
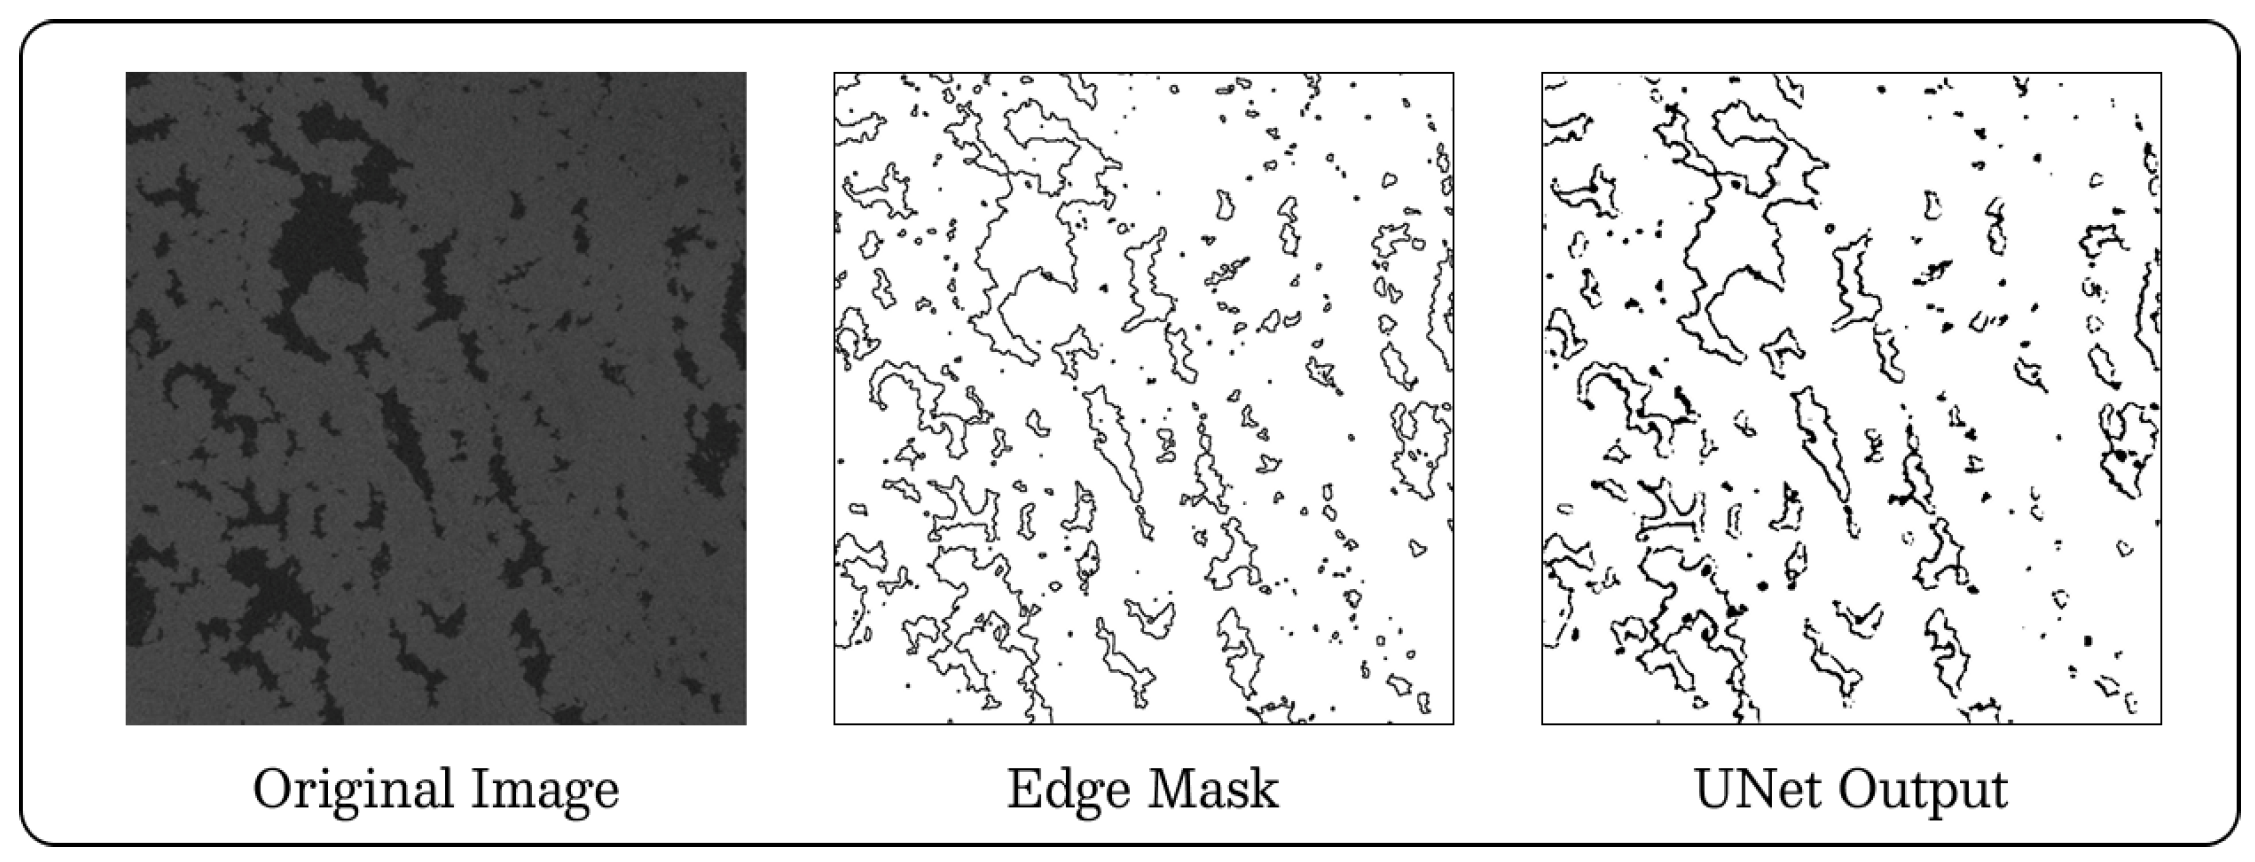
In this work, the UNet network was used as an edge detector, segmenting the edges of the regions of interest, that is, the regions corresponding to pores or empty spaces within the rock. It was chosen over traditional methods such as Canny [22] and Sobel [23] due to its ability to generalize edge segmentation for different types of rocks, which could not be achieved using traditional methods. An example of input and output is illustrated in Figure 5.

2.3.2. Ordinary Kriging and Universal Kriging

Kriging is a statistical interpolation method widely used in geostatistics to estimate values of a variable at unsampled locations based on known values from neighboring points. Initially developed by the South African engineer Daniel G. Krige and later formalized by the French mathematician Georges Matheron in the 1960s, kriging has become an essential tool in fields such as mining, agriculture, and hydrology [24].
Kriging assumes that nearby values tend to be more similar than distant ones, meaning there is a spatial correlation in the analyzed variable. This correlation is described by the variogram, a mathematical function that expresses the semivariance between pairs of points as a function of the distance separating them [25].
Mathematically, kriging is considered the Best Linear Unbiased Estimator (BLUE), as it minimizes the variance of the estimation error and does not present systematic bias [14]. In addition, kriging takes into account the anisotropy of the studied phenomenon, allowing for the modeling of directional variations in spatial dependence.
Cressie and Noel [26] discuss universal kriging in the context of spatial interpolation techniques, which are used to estimate values at unsampled locations based on sampled data. The authors explain the modeling of data with a trend and the application of ordinary kriging to interpolate the residuals of that trend.
The main distinction made by [26] between ordinary kriging and Universal Kriging is the presence of a trend in the data model. In ordinary kriging, it is assumed that the data are stationary, meaning that the mean is constant across space. In contrast, in universal kriging, the mean of the data is not constant and is modeled as a trend function.
The estimator of ordinary kriging Z O K * ( u 0 ) is defined by [27]:
Z O K * ( u 0 ) = i = 1 n λ i O K ( u 0 ) · Z ( u i )
where λ i O K ( u 0 ) are the weights assigned to each reference data point Z ( u i ) .
To ensure that the estimator is unbiased, the following condition must be satisfied:
E   [ Z O K * ( u 0 )     Z ( u 0 ) ] = 0
The variance of the ordinary kriging estimate is given by:
Var [ Z O K * ( u 0 ) ] = E ( Z O K * ( u 0 ) Z ( u 0 ) ) 2
= 2 i = 1 n λ i O K ( u 0 ) γ ( u i u 0 ) i = 1 n j = 1 n λ i O K ( u 0 ) λ j O K ( u 0 ) γ ( u i u j )
where γ ( u i u j ) represents the variogram values between the data points, and γ ( u i u 0 ) represents the variogram values between the data and the point of interest u 0 .
To minimize the estimation variance, while respecting the constraint that the sum of the weights equals 1, the ordinary kriging system is solved as:
i = 1 n λ i O K ( u 0 ) γ ( u i u j ) + μ ( u 0 ) = γ ( u i u 0 ) , j = 1 , . . . , n
The variance of ordinary kriging σ O K 2 ( u 0 ) is then defined as:
σ O K 2 ( u 0 ) = i = 1 n λ i O K ( u 0 ) γ ( u i u 0 ) + μ ( u 0 )
The weights λ i O K are calculated in order to minimize the variance of the estimation error, taking into account the spatial correlation among neighboring points. This correlation is defined by the variogram, which describes how the values vary with distance.
Universal Kriging, in turn, models the regionalized variable as [26]:
Z ( s ) = m ( s ) + ε ( s )
The estimator at point s 0 is given by [26]:
Z ^ ( s 0 ) = i = 1 n λ i Z ( s i )
The unbiasedness and variance minimization conditions are [26]:
E [ Z ^ ( s 0 ) Z ( s 0 ) ] = 0 , σ K 2 = Var Z ^ ( s 0 ) Z ( s 0 ) min
The drift is modeled as a linear combination of known functions
m ( s ) = j = 0 p β j f j ( s )
The Universal Kriging system is given by [26]:
j = 1 n λ j C ( s i , s j ) + k = 0 p μ k f k ( s i ) = C ( s i , s 0 ) , i = 1 , , n j = 1 n λ j f k ( s j ) = f k ( s 0 ) , k = 0 , , p
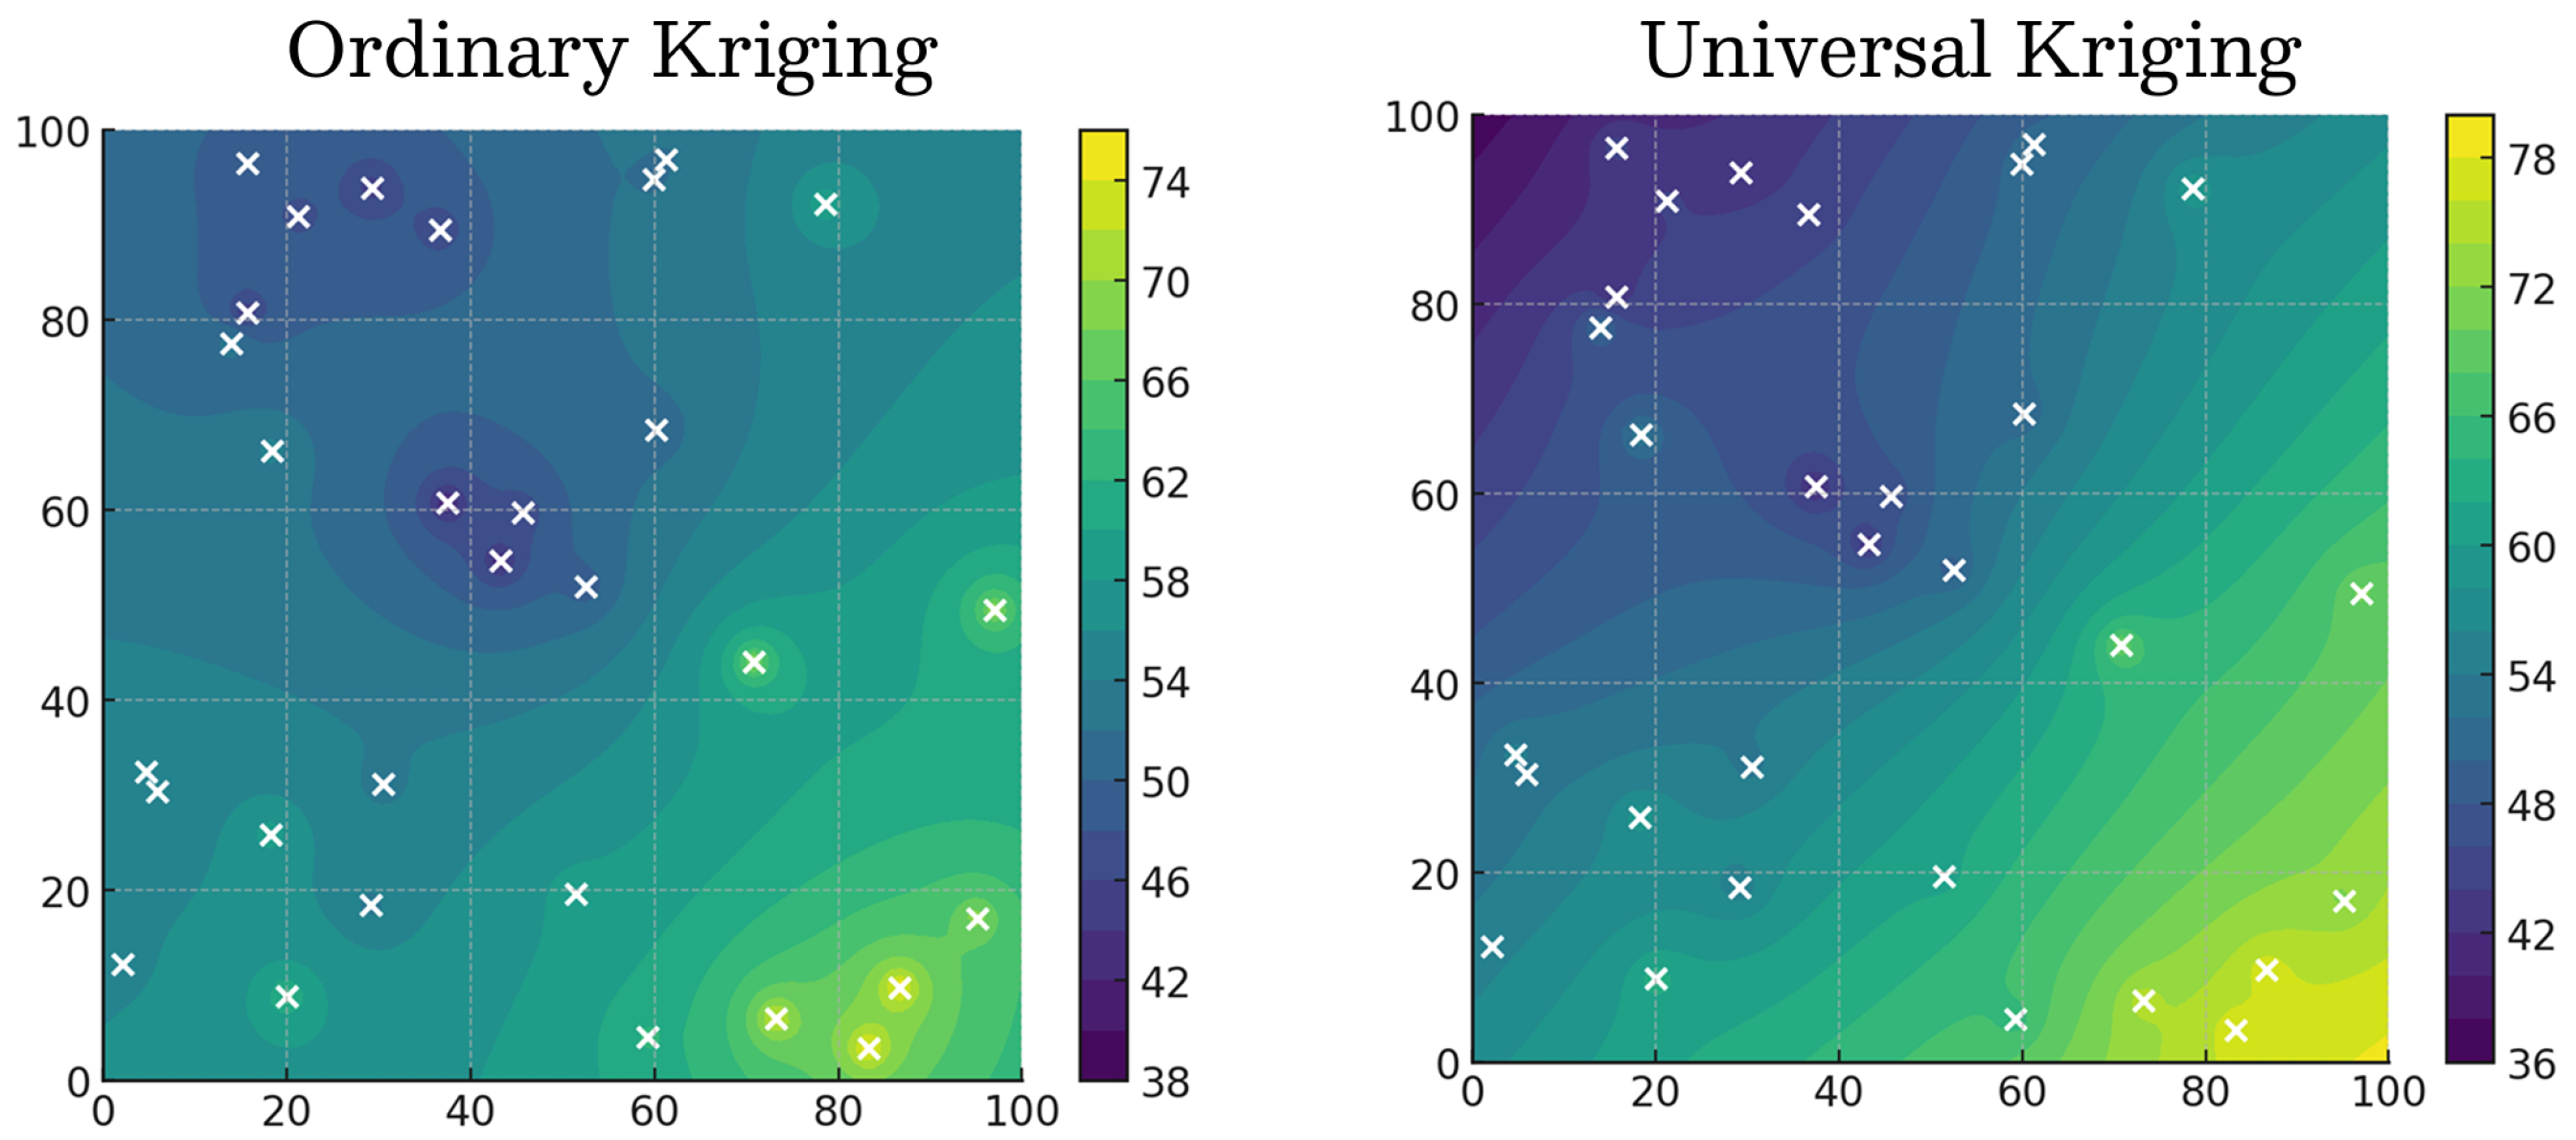
The differences between ordinary kriging and Universal Kriging interpolation can be observed in the example of Figure 6. In this example, the points marked with x are the known points, and all other unknown points on the map are estimated based on the known ones. It can be observed that ordinary kriging is focused on local trends, whereas universal kriging presents a global trend of values.
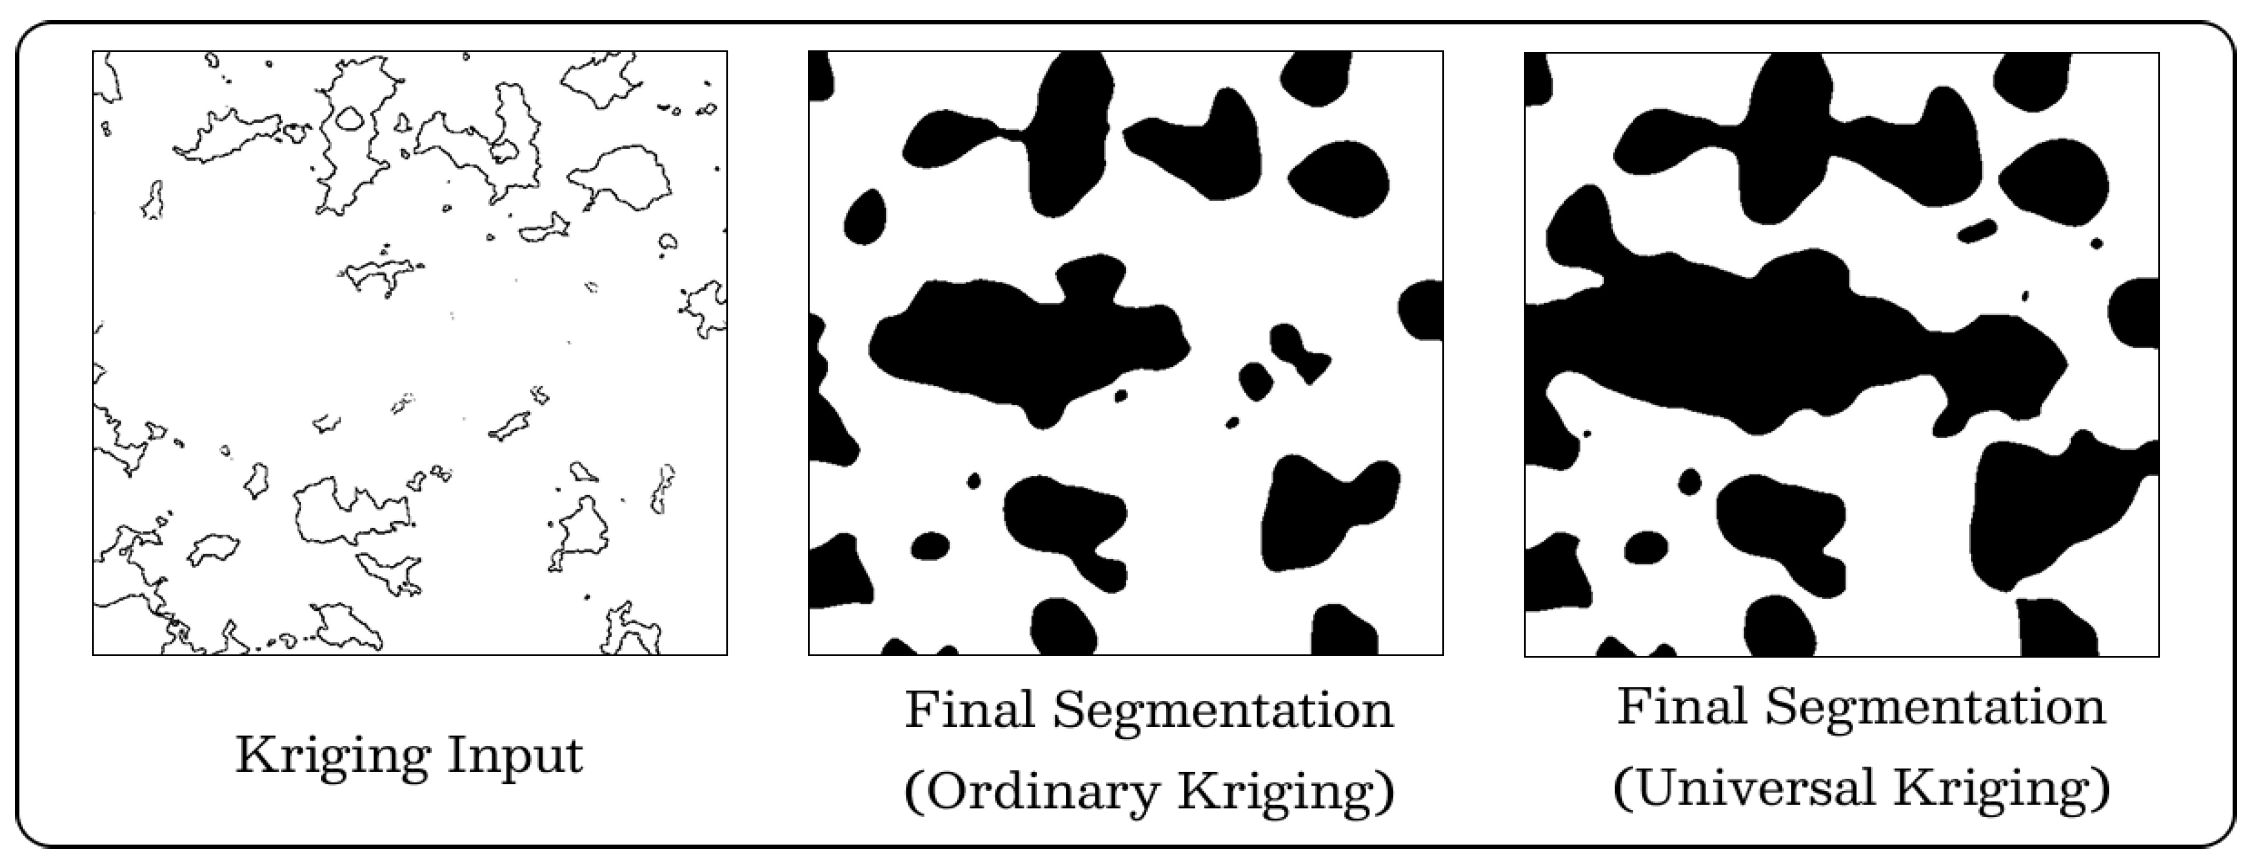
In the proposed method, the kriging step is responsible for deciding among the unmarked pixels (white pixels), resulting from the UNet output, which will remain white (rock) and which will be black (pore). The black pixels act as the sampled points in kriging, that is, those already cataloged, and from them new regions are classified as pores or rock. In this way, through kriging (Ordinary and Universal), each applied separately, the final segmentation of the image is produced, allowing a comparison between the two types of kriging, as illustrated in Figure 7. It is worth noting that for ordinary kriging a probability threshold is required, which will be used to decide whether a pixel is classified as pore or not. This threshold will be discussed in more detail in Section 3.

3. Experiments and Results

This section provides detailed information about the experiments conducted, including data partitioning, computational environment configuration, and the libraries employed. In addition, the results obtained through the proposed approaches are presented.
For the edge segmentation stage with UNet, the dataset was divided into four different subsets in order to perform cross validation. The first subset consisted of samples 01, 07, 08, and 09. The second consisted of samples 02, 10, 11, and 12. The third included samples 03, 04, 13, and 14. The fourth consisted of samples 05, 06, 15, and 16. Due to the computational environment (amount of available memory), which will be explained later, only 16% of the total number of images from each sample were selected to build the subsets described. Thus, the experiments were conducted using cross validation and considering only the high resolution version of the samples.
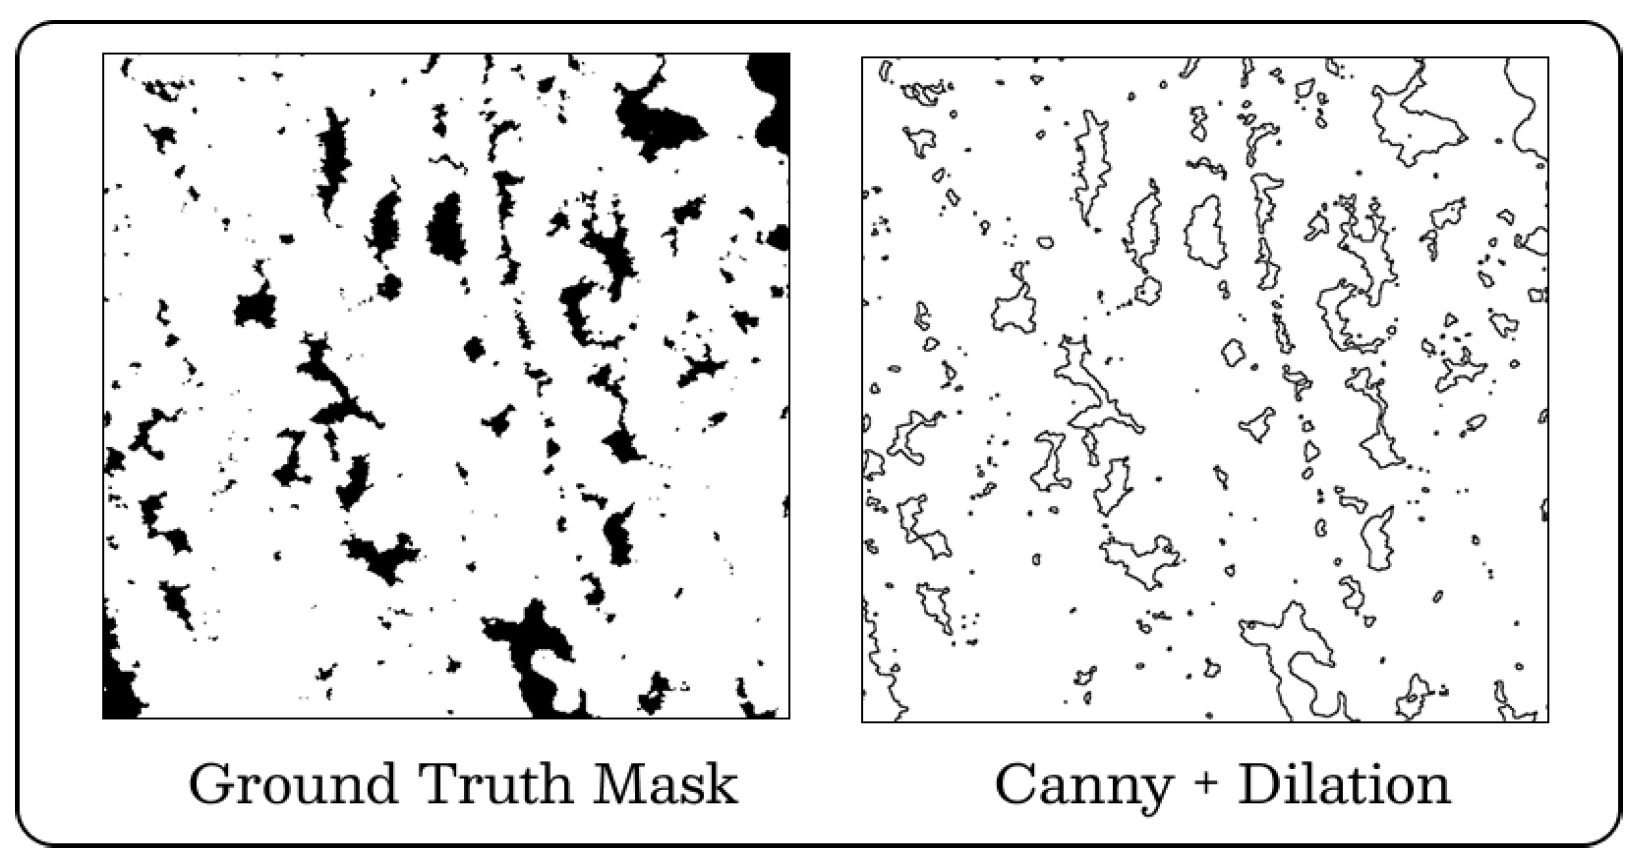
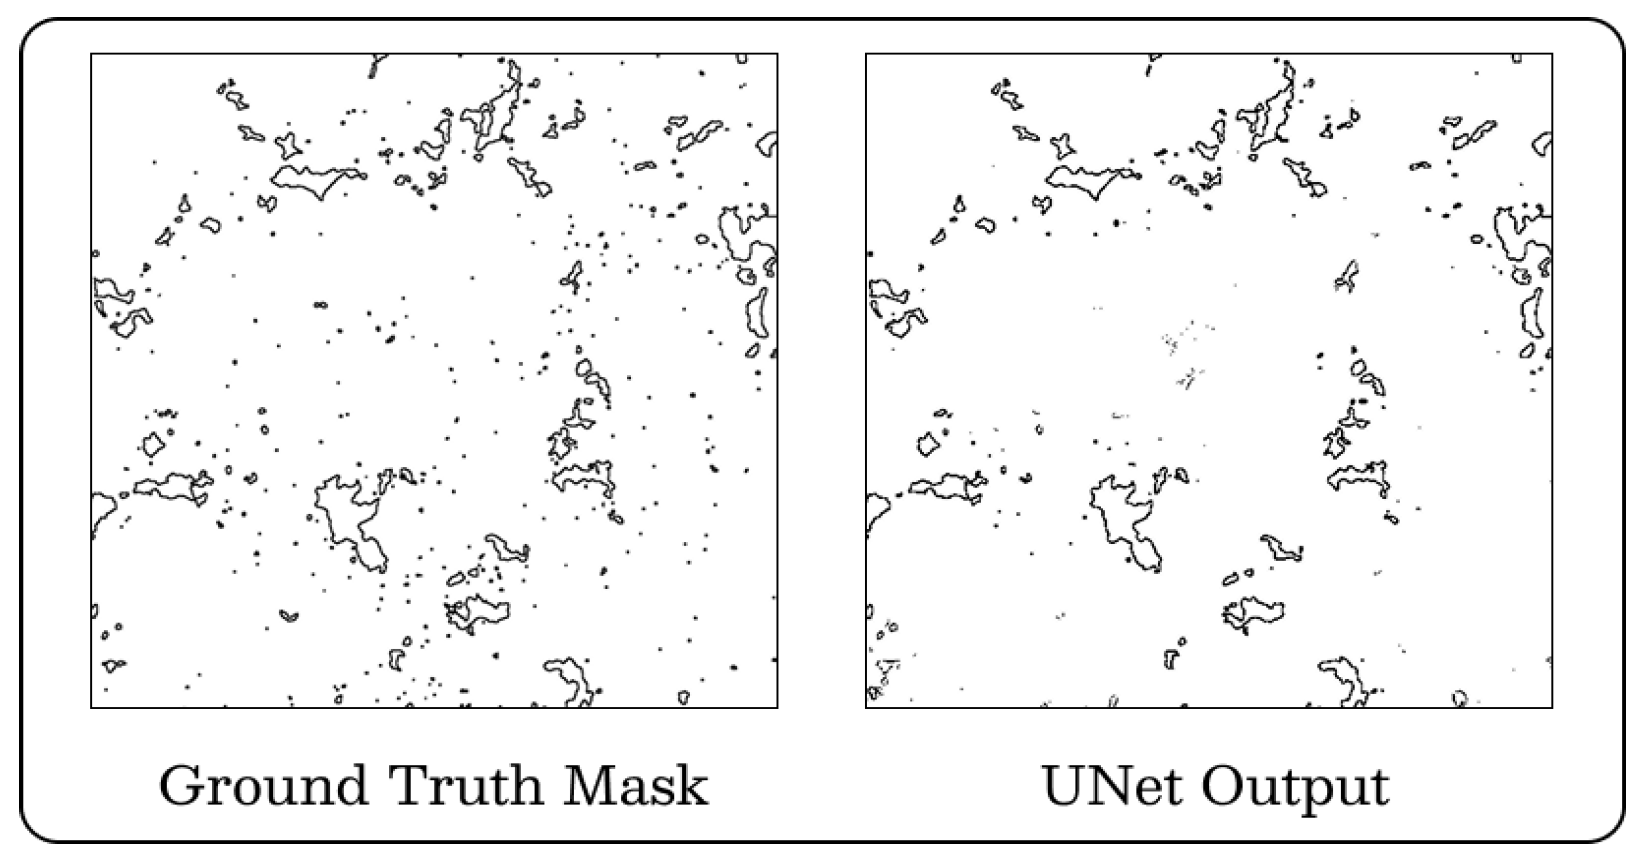
The original dataset contains the final segmentation of each slice of the sample. However, the masks required for this experiment must include only the edges of the regions to be segmented. In this case, new masks were generated for each sample (containing only the edges) from the original masks, using a process that applied the Canny filter [22] together with dilation in order to detect and highlight the edges. Figure 8 illustrates this procedure. From this point, with the preprocessed images and the edge only masks, it was possible to train and evaluate the UNet.
The hyperparameters used for the UNet network were: batch size of 8, Adam optimizer with a learning rate of 0.0001, and dice loss as the loss function. Training was performed on the Kaggle platform for 25 epochs using the GPU available for free: GPU T4x.
In addition, the techniques EarlyStopping, with patience of 5 epochs, and ReduceLROnPlateau, with factor 0.1 and patience of 5 epochs, were used to avoid or reduce overfitting. The implementation was developed in Python (version 3.10.12) together with the Keras library (version 3.5.0).
The kriging step was implemented using Python (version 3.12.5) and the Pytorch library (version 2.4.1) together with Cuda (version 11.8), and was processed on an NVIDIA GeForce GTX 1080 Ti GPU. During this procedure, only for ordinary kriging, it is necessary to impose a probability threshold, which influences the pixel classification decision, whether it will be classified as pore or as rock. Two probability thresholds were used: 50% and 60%. In the experiments, these values proved to be the most suitable, since thresholds above 60% resulted in complete segmentation (image entirely in black), while thresholds below 50% produced no segmentation (image entirely in white). Therefore, 50% and 60% are the boundary values for our experiments. For universal kriging, a linear trend function was used.

3.1. Results of Edge Segmentation with UNet

The metrics chosen to evaluate the performance of the method were: Intersection over Union (IoU), Precision (PRC), recall (REC), and F1-Score [28], with emphasis on IoU, since it measures the overlap between the predicted segmentation mask and the ground truth (original segmentation), in this case, the edges generated with Canny and dilation. Two experiments were conducted, each with a different preprocessing applied to the dataset images. The first was carried out applying only the CLAHE preprocessing, and its results are shown in Table 1. In this first experiment, the metrics were insufficient, with UNet segmenting only the edges of some slices from sample 1. Considering this behavior, it was proposed to perform histogram specification on the entire dataset based on the best image (Figure 9), that is, the one with the best metrics obtained in the first experiment with CLAHE. This image achieved the following metrics: 97% F1-Score, 97% Precision, 94% IoU, and 97% recall.
In the second experiment, applying histogram specification first and then CLAHE, the network did not perform as well, although the metrics improved compared to using only CLAHE. When applying CLAHE first and then histogram specification (using slice 1009 from sample 1 as the reference image), the network achieved the best and now promising results regarding edge segmentation (Table 1), with all metrics above 94% and precision standing out as the highest metric. The network segmented all test images, regardless of the sample, which demonstrates that the preprocessing steps of CLAHE followed by histogram specification were essential for the results obtained. An example of the segmentation performed on slice 51 of sample 5 by UNet can be observed in Figure 10, where it can be verified that only small and more isolated points were not segmented. The metrics for this slice were: 98.52% Precision, 99.07% Recall, 98.72% F1-Score, and 97.62% IoU.

3.2. Final Segmentation Results

The kriging stage received the edge segmentations performed by the UNet network with the combination (CLAHE + histogram specification) and, by applying ordinary and universal kriging, the final segmentation of the images was obtained. The results are presented in Table 2.
In the final stage, the probability threshold of 60% was much superior to that of 50%, providing better segmentation. This is probably due to the fact that the 60% threshold is more selective, since only pixels with more than 60% probability of being rock are classified as rock. However, the recall of ordinary kriging with a 60% threshold is lower than its precision, which means more false negatives, and as shown in Figure 11 and Figure 12, as the threshold increases, porosity also increases, making false negatives (rock classified as pore) more present. Thus, it can be observed that the 60% probability threshold is more accurate in performing the final segmentation than the 50% threshold, despite the higher presence of false negatives. Examples of segmentations generated by the thresholds of 50% and 60% can be seen in Figure 11 and Figure 12, corresponding to samples 6 and 3.
Universal kriging, on the other hand, presents some limitations compared to ordinary kriging, especially in the task of image segmentation. When the image or the segmented region does not present significant spatial variations in terms of mean (for example, in images with uniformly distributed backgrounds or repetitive textures), as in our case, ordinary kriging outperforms universal kriging, as evidenced by the higher IoU, recall, and F1-Score metrics (more than 15 percentage points difference in each of these metrics). In addition, ordinary kriging is faster (on average twice as fast as universal kriging), which makes it useful in contexts where computational efficiency is a priority, such as in real time image segmentation systems. This occurs because ordinary kriging focuses on specific points of the image, while universal kriging is based on a broader context, considering a larger portion of the image at each iteration. Finally, when there is no obvious spatial trend structure in the data, ordinary kriging can be more effective and save computational resources, which reinforces the use of this type of kriging for the segmentation task in comparison to universal kriging.

4. Conclusions and Future Works

In this work, the combination of the UNet network with two types of kriging, ordinary and universal, was explored for the segmentation of microtomography images of carbonate rocks. Recent studies show that carbonate rocks present porous structures that, when subjected to weathering processes, originate soils with physical and chemical characteristics similar to those found in agricultural environments [29]. This structural similarity justifies the use of carbonate rocks as a reference for porosity and permeability analyses applied to sustainable soil management. The experiments demonstrated that the UNet network was efficient in detecting the edges of the internal structures of the rocks, while ordinary and universal kriging were responsible for the final segmentation, reducing uncertainties and refining pixel classification. The results also indicate that the hybrid approach (machine learning and geostatistical interpolation) is promising for the segmentation task, particularly ordinary kriging, providing more accurate and reliable segmentations, reaching 81% IoU, 95% precision, 84% recall, and 89% F1-Score. Furthermore, segmentation is only the first step toward a detailed analysis of soils and rocks, since from segmentation it is possible to calculate and estimate important properties of these resources, such as porosity, permeability, and tortuosity.
As future works, other approaches are suggested, such as the investigation of different trend functions for the use of universal kriging, since only the linear trend function was used in this study, as well as other variogram functions for ordinary kriging, given that only the exponential variogram function was applied. Moreover, considering the degree of complexity and detail in the microtomography images used in this study, which are high resolution images, it is suggested to employ the low resolution version of the dataset in order to evaluate the impact that lower resolution has on the segmentation results. Finally, other geospatial interpolation methods in combination with UNet are welcome, since this work addresses two geostatistical methods (ordinary and universal kriging), as well as the application of other neural network architectures as feature extractors for segmentation, such as EfficientNet, ResNet, and YOLO, which may improve the edge segmentation stage.

Author Contributions

Conceptualization, M.P.S., I.F.S.d.S., A.d.C.A., J.D.S.d.A., A.C.S., A.C.d.P. and D.R.; Methodology, M.P.S.; Software, M.P.S., I.F.S.d.S. and A.d.C.A.; Writing—Original Draft, M.P.S.; Investigation, M.P.S.; Resources, D.R.; Supervision, I.F.S.d.S., J.D.S.d.A., A.C.S., A.C.d.P. and D.R.; Funding acquisition, J.D.S.d.A., A.C.S., A.C.d.P. and D.R. All authors have read and agreed to the published version of the manuscript.

Funding

This research was funded by the Brazilian fomenting agencies Coordenação de Aperfeiçoamento de Pessoal de Nível Superior (CAPES), Conselho Nacional de Desenvolvimento Científico e Tecnológico (CNPq), and Fundação de Amparo à Pesquisa Desenvolvimento Científico e Tecnológico do Maranhão (FAPEMA), grant number Finance Code 001, 443157/2023-5, 88887.679966/2022-00, and BPD-03248/24.

Data Availability Statement

The 16 Brazilian Pre-Salt Rock Carbonates is openly available at https://digitalporousmedia.org/published-datasets/ (accessed on 4 September 2025).

Acknowledgments

The authors acknowledge the Institute of Technical-Scientific Software Development of PUC-Rio (Tecgraf/PUC-Rio) for data resources and linebreak technical support.

Conflicts of Interest

The authors declare no conflicts of interest.

References

  1. Goldscheider, N.; Chen, Z.; Auler, A.S.; Bakalowicz, M.; Broda, S.; Drew, D.; Hartmann, J.; Jiang, G.; Moosdorf, N.; Stevanovic, Z.; et al. Global distribution of carbonate rocks and karst water resources. Hydrogeol. J. 2020, 28, 1661–1677. [Google Scholar] [CrossRef]
  2. Tucker, M.E.; Wright, V.P. Carbonate Sedimentology; John Wiley & Sons: Hoboken, NJ, USA, 2009. [Google Scholar]
  3. Chen, Q.; Zhang, P.; Hu, Z.; Li, S.; Zhang, Y.; Hu, L.; Zhou, L.; Lin, B.; Li, X. Soil organic carbon and geochemical characteristics on different rocks and their significance for carbon cycles. Front. Environ. Sci. 2022, 9, 784868. [Google Scholar] [CrossRef]
  4. Houston, A.N.; Otten, W.; Falconer, R.; Monga, O.; Baveye, P.C.; Hapca, S.M. Quantification of the pore size distribution of soils: Assessment of existing software using tomographic and synthetic 3D images. Geoderma 2017, 299, 73–82. [Google Scholar] [CrossRef]
  5. Ivonin, D.; Kalnin, T.; Grachev, E.; Shein, E. Quantitative analysis of pore space structure in dry and wet soil by integral geometry methods. Geosciences 2020, 10, 365. [Google Scholar] [CrossRef]
  6. Wang, N.; Zhang, T. Soil pore structure and its research methods: A review. Soil Water Res. 2024, 19, 1–24. [Google Scholar] [CrossRef]
  7. Zhang, X.; Huang, T.; Ge, Z.; Man, T.; Huppert, H.E. Infiltration characteristics of slurries in porous media based on the coupled Lattice-Boltzmann discrete element method. Comput. Geotech. 2025, 177, 106865. [Google Scholar] [CrossRef]
  8. Mahdi, Z.A.; Farman, G.M. A review on models for evaluating rock petrophysical properties. Iraqi J. Chem. Pet. Eng. 2023, 24, 125–136. [Google Scholar] [CrossRef]
  9. Yang, Y.; Hakim, S.; Bruns, S.; Rogowska, M.; Boehnert, S.; Hammel, J.; Stipp, S.; Sørensen, H. Direct observation of coupled geochemical and geomechanical impacts on chalk microstructure evolution under elevated CO2 pressure. ACS Earth Space Chem. 2018, 2, 618–633. [Google Scholar] [CrossRef]
  10. Gonzalez, R.C. Digital Image Processing; Pearson education india, 2009. [Google Scholar]
  11. Jia, L.; Chen, M.; Jin, Y. 3D imaging of fractures in carbonate rocks using X-ray computed tomography technology. Carbonates Evaporites 2013, 29, 147–153. [Google Scholar] [CrossRef]
  12. Ronneberger, O.; Fischer, P.; Brox, T. U-net: Convolutional networks for biomedical image segmentation. In Proceedings of the Medical Image Computing and Computer-Assisted Intervention–MICCAI 2015: 18th International Conference, Munich, Germany, 5–9 October 2015; proceedings, part III 18. Springer: Berlin/Heidelberg, Germany, 2015; pp. 234–241. [Google Scholar]
  13. Bressan, P.O.; Junior, J.M.; Martins, J.A.C.; Gonçalves, D.N.; Freitas, D.M.; Osco, L.P.; Silva, J.d.A.; Luo, Z.; Li, J.; Garcia, R.C.; et al. Semantic segmentation with labeling uncertainty and class imbalance. arXiv 2021, arXiv:2102.04566. [Google Scholar] [CrossRef]
  14. Krige, D.G. A statistical approach to some basic mine valuation problems on the Witwatersrand. J. South. Afr. Inst. Min. Metall. 1951, 52, 119–139. [Google Scholar]
  15. Wang, H. Application of Machine Learning and Deep Learning Methods in Geological Carbon Sequestration Across Multiple Spatial Scales. 2022. Available online: https://vtechworks.lib.vt.edu/items/c0fc3745-99b6-465a-881b-de15d08f2a99 (accessed on 4 September 2025).
  16. Vidal, A.; Menezes dos Anjos, C.E.; Medeiros, L.; Surmas, R.; Neta, A.; Evsukoff, A.; Vargas, J. 16 Brazilian Pre-Salt Carbonates: Multi-Resolution Micro-CT Images. 2025. Available online: https://www.doi.org/10.17612/xr50-s717 (accessed on 4 September 2025). [CrossRef]
  17. Zuiderveld, K. Contrast limited adaptive histogram equalization. In Graphics Gems IV; 1994; pp. 474–485. [Google Scholar]
  18. Khan, F.F.; Kim, J.H.; Park, C.S.; Kim, J.I.; Kwon, G.R. A Resource-Efficient 3D U-Net for Hippocampus Segmentation Using CLAHE and SCE-3DWT Techniques. IEEE Access 2025, 13, 3. [Google Scholar] [CrossRef]
  19. Moreira, J.M.M.; de Almeida, J.D.S.; Junior, G.B.; de Paiva, A.C. Detecçao de glaucoma usando redes em cápsula. In Proceedings of the Simpósio Brasileiro de Computação Aplicada à Saúde (SBCAS). SBC, online, 15–18 June 2021; pp. 188–199. [Google Scholar]
  20. Stimper, V.; Bauer, S.; Ernstorfer, R.; Schölkopf, B.; Xian, R.P. Multidimensional contrast limited adaptive histogram equalization. IEEE Access 2019, 7, 165437–165447. [Google Scholar] [CrossRef]
  21. Avanaki, A. Exact histogram specification optimized for structural similarity. arXiv 2008, arXiv:0901.0065. [Google Scholar] [CrossRef]
  22. Xu, Z.; Baojie, X.; Guoxin, W. Canny edge detection based on Open CV. In Proceedings of the 2017 13th IEEE international conference on electronic measurement & instruments (ICEMI), Yangzhou, China, 20–23 October 2017; pp. 53–56. [Google Scholar]
  23. Sobel, I. An isotropic 3 × 3 image gradient operater. In Machine Vision for Three-Dimensional Scenes; Elsevier: Amsterdam, The Netherlands, 1990; pp. 376–379. [Google Scholar]
  24. Chilès, J.P.; Desassis, N. Fifty years of kriging. In Handbook of Mathematical Geosciences: Fifty Years of IAMG; Springer International Publishing: Cham, Swtizerland, 2018; pp. 589–612. [Google Scholar]
  25. Matheron, G. Principles of geostatistics. Econ. Geol. 1963, 58, 1246–1266. [Google Scholar] [CrossRef]
  26. Cressie, N. Statistics for Spatial Data; John Wiley & Sons: Hoboken, NJ, USA, 2015. [Google Scholar]
  27. Pyrcz, M.J.; Deutsch, C.V. Geostatistical Reservoir Modeling; Oxford University Press: Oxford, UK, 2014. [Google Scholar]
  28. Cheng, B.; Girshick, R.; Dollár, P.; Berg, A.C.; Kirillov, A. Boundary IoU: Improving object-centric image segmentation evaluation. In Proceedings of the IEEE/CVF Conference on Computer Vision and Pattern Recognition, Nashville, TN, USA, 20–25 June 2021; pp. 15334–15342. [Google Scholar]
  29. Junior, C.R.P.; da Silva, R.C.; da Silva Neto, E.C.; de Azevedo, A.C.; do Nascimento, C.W.R.; Fontana, A.; de Souza Júnior, V.S.; dos Anjos, L.H.C.; Pereira, M.G. Influence of carbonate rocks on soil properties in the humid tropical climate of atlantic forest, Rio de Janeiro–Brazil. J. South Am. Earth Sci. 2021, 112, 103582. [Google Scholar] [CrossRef]
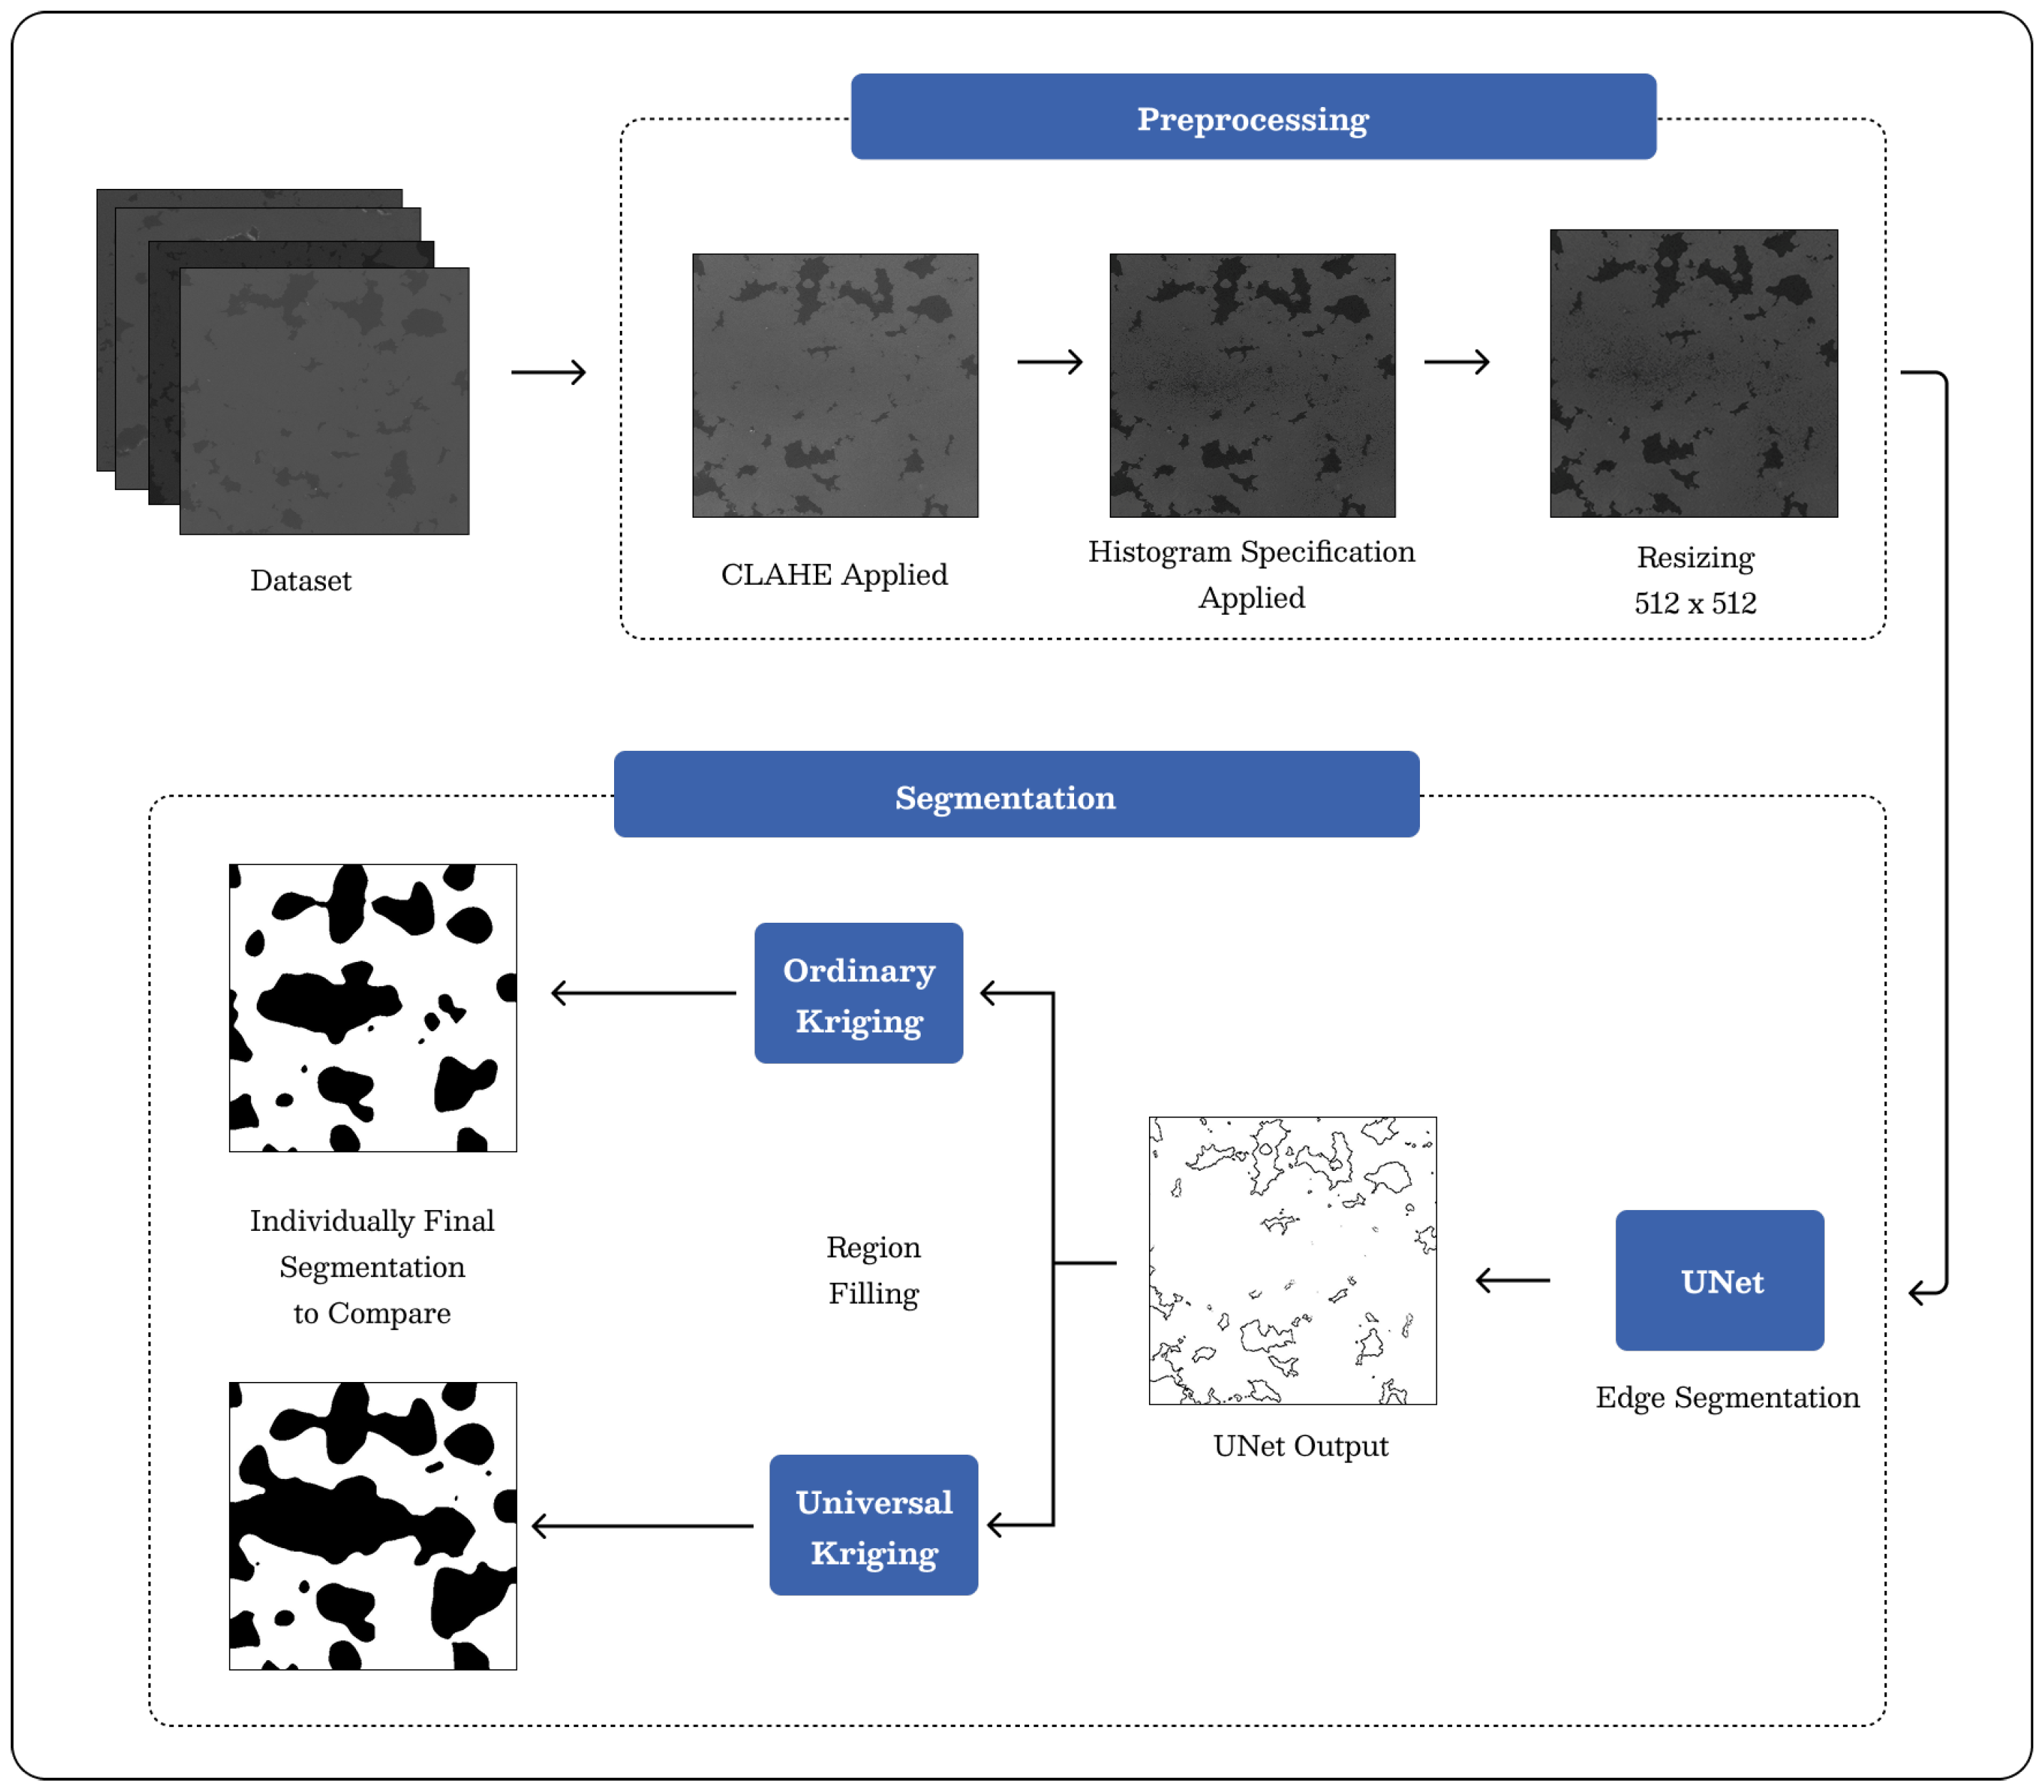
Figure 1. Proposed Method.
Agriengineering 07 00294 g001
Figure 2. Dataset—Sample Examples.
Agriengineering 07 00294 g002
Figure 3. CLAHE Application.
Agriengineering 07 00294 g003
Figure 4. Histogram Specification Application.
Agriengineering 07 00294 g004
Figure 5. Unet Input and Output.
Agriengineering 07 00294 g005
Figure 6. Example of Ordinary and Universal Kriging.
Agriengineering 07 00294 g006
Figure 7. Kriging-Final Segmentation.
Agriengineering 07 00294 g007
Figure 8. Canny and Dilation Application.
Agriengineering 07 00294 g008
Figure 9. Best Image–Sample 1–Slice 1009.
Agriengineering 07 00294 g009
Figure 10. Edge Segmentation with UNet–Sample 06–Slice 51.
Agriengineering 07 00294 g010
Figure 11. Final Segmentation–Slice 51–Sample 6.
Agriengineering 07 00294 g011
Figure 12. Final Segmentation–Slice 375–Sample 3.
Agriengineering 07 00294 g012
Table 1. UNet Edge Segmentation Metrics.
Preprocessing IoUPrecisionRecallF1-Score
CLAHE0.056 ± 0.013 0.055 ± 0.015 0.049 ± 0.009 0.029 ± 0.017
Specification + CLAHE0.5723 ± 0.012 0.4528 ± 0.014 0.4426± 0.018 0.4476 ± 0.017
CLAHE + Specification 0.9429 ± 0.022 0.9689 ± 0.034 0.9532 ± 0.023 0.9609 ± 0.021
Table 2. Final Segmentation Metrics.
Ordinary Kriging (Thresholds)IoUPRCRECF1-Score
50% 0.127 ± 0.042 0.761 ± 0.031 0.101 ± 0.025 0.047 ± 0.045
60% 0.792 ± 0.023 0.933 ± 0.036 0.817 ± 0.028 0.871 ± 0.012
Universal Kriging 0.616 ± 0.018 0.954 ± 0.028 0.596 ± 0.036 0.733 ± 0.043
Disclaimer/Publisher’s Note: The statements, opinions and data contained in all publications are solely those of the individual author(s) and contributor(s) and not of MDPI and/or the editor(s). MDPI and/or the editor(s) disclaim responsibility for any injury to people or property resulting from any ideas, methods, instructions or products referred to in the content.