1. Introduction
Modern agricultural systems increasingly rely on automated classification technologies to optimize production efficiency, improve quality control measures, and maximize economic value throughout the supply chain. These classification tasks can be broadly categorized into three fundamental domains: (1) crop classification, which allows precise monitoring of land use and supports decision making in precision agriculture systems; (2) tree classification, which facilitates advanced orchard management practices and contributes to biodiversity assessment; and (3) fruit quality classification, which plays a central role in automated harvesting systems, quality assurance protocols, and market value optimization strategies. The evolution of image classification techniques in agriculture has progressed remarkably from basic thresholding methods to sophisticated deep learning architectures such as convolutional neural networks (CNNs) [
1], reflecting both the growing complexity of agricultural image data and the increasing demand for accurate, robust, and computationally efficient classification systems across the agri-food sector.
The first approaches to automated fruit image classification primarily used thresholding techniques and fundamental image processing algorithms. These methods typically relied on manually extracted features including color characteristics, texture patterns, and geometric shape descriptors. For example, Ali et al. [
2] implemented a combination of color histogram analysis and HSV color space thresholding to discriminate between different stages of maturity and disease presence in citrus fruits, achieving moderate classification precision while demonstrating a notable sensitivity to illumination variations and background noise interference. Williem et al. [
3] further investigated these limitations, particularly emphasizing the challenges of thresholding-based methods in real field conditions characterized by variable lighting and frequent occlusions. Additional studies by Tripathi et al. and Zemmour et al. [
4,
5] explored more advanced thresholding techniques including the Otsu method and adaptive thresholding algorithms for fruit segmentation tasks, reporting average accuracy levels around 65% while identifying persistent challenges related to shadow effects and complex background clutter. Although these thresholding methods maintain certain advantages in terms of algorithmic simplicity and low computational requirements [
6,
7], their fundamental limitations render them generally unsuitable for deployment in complex, real-world agricultural environments requiring robust performance.
The development of more powerful computational resources enabled the introduction of unsupervised learning methodologies for fruit detection and segmentation tasks, eliminating the requirement for extensively labeled training datasets. Techniques such as K-means clustering and Hough transform algorithms [
8,
9] demonstrated the ability to provide initial fruit segmentation results, but struggled significantly with common agricultural challenges, including overlapping fruits and heterogeneous background conditions, ultimately constraining classification accuracy to the 65-75% range. Dubey et al. [
10] implemented a K-means clustering approach combined with edge detection for citrus fruit segmentation, achieving approximately 70% accuracy while encountering substantial difficulties with partially occluded fruits. Similarly, Febrinanto et al. [
11] applied spectral clustering techniques for the extraction of fruit regions but observed considerable performance inconsistency under varying illumination conditions. Other unsupervised approaches, including mean shift clustering and Gaussian mixture models [
12,
13], were investigated with moderate success, though these methods generally lacked the precision and reliability required for high-accuracy classification tasks despite their advantage of not requiring labeled training data.
The emergence of supervised machine learning techniques represented a significant advancement in agricultural classification capabilities. Algorithms including support vector machines (SVMs), random forests, and decision trees were systematically applied to hand-engineered features extracted from fruit images. Xie et al. [
14] provided a comprehensive review of these classical approaches, noting that SVM-based classifiers consistently achieved accuracy levels between 75–85% in standardized citrus datasets. Aherwadi et al. [
15] specifically used SVM classifiers with carefully designed texture and color features for the classification of citrus disease, attaining 82% precision under controlled conditions. Dang et al. [
16] conducted extensive experiments with various combination of characteristics for the classification of citrus, reporting 80% precision alongside detailed analysis of significance of characteristics. Alternative approaches utilizing decision trees and k-nearest neighbors (KNN) algorithms were explored by Ramadhani et al. [
17] and Rajesh et al. [
18], demonstrating accuracy ranges of 75–83% across different fruit classification tasks. However, these supervised methods universally required substantial effort in encoding of characteristics and exhibited limited generalization when applied to diverse large-scale agricultural datasets [
19,
20], which prompted the need for more advanced solutions.
The revolutionary breakthrough in agricultural image classification arrived with the advent of deep learning, particularly convolutional neural networks (CNNs), which autonomously learn hierarchical feature representations directly from raw image data. Sangeetha et al. [
21] demonstrated the transformative potential of CNNs through their implementation of LeNet-5 for agricultural image recognition tasks. Subsequent developments saw the successful application of advanced CNN architectures, including ResNet [
22], VGG [
23] and EfficientNet [
24] to citrus fruit classification problems, consistently delivering superior performance compared to traditional methods. Mima et al. [
25] achieved 86% classification accuracy on a challenging custom citrus fruit dataset using ResNet50, significantly outperforming conventional machine learning approaches. Shah et al. [
26] further pushed performance boundaries by developing a modified ResNet50 architecture for rice blast disease detection, establishing new benchmarks through the strategic application of deep learning and transfer learning techniques. The field has also witnessed innovative hybrid architectures that combine CNNs with complementary technologies; for example, Khattak et al. [
27] implemented a sophisticated CNN-LSTM framework for the identification of citrus disease that achieved exceptional precision 95% by effectively capturing spatial and temporal characteristics. Recent advancements continue to emerge, including Wang et al.’s [
28] improved YOLOv8 architecture for fruit classification and Dewi et al.’s [
29] novel system integrating deep learning with neural architecture search (NAS) principles. Specialized applications have also benefited from these developments, as demonstrated by Gamani et al. [
30] comprehensive evaluation of YOLOv8 for strawberry segmentation and Sapkota et al. [
31] systematic comparison of multiple variants of YOLO for fruitlet detection in complex orchard environments.
In the specific domain of citrus disease recognition, Chen et al. [
32] made significant contributions through their implementation of a weakly supervised DenseNet approach, based on the foundational DenseNet architecture originally developed by Huang et al. [
33]. The effectiveness of DenseNet-based solutions for the classification of citrus diseases has been further substantiated through rigorous testing and validation [
34], confirming their robustness for agricultural applications. Transfer learning methodologies have similarly proven invaluable for fruit classification tasks, as thoroughly reviewed by Wang and Li [
35], enabling effective adaptation of the model in diverse agricultural contexts. For quality assessment applications, the integration of multispectral imaging with CNN architectures [
36] has shown particular promise. Zhang et al. [
37] and Liu et al. [
38] have demonstrated impressive results through innovative combinations of hyperspectral imaging and texture feature analysis, respectively.
The agricultural computer vision landscape is now on the threshold of another potential transformation with the emergence of transformer-based architectures [
39,
40], which offer fundamentally different approaches to visual pattern recognition through self-attention mechanisms and global context modeling. Although these architectures have shown remarkable success in general computer vision tasks, their application to agricultural classification problems remains relatively underexplored compared to established CNN approaches, presenting both challenges and opportunities for future research.
Moreover, our quality classification criteria for citrus fruits were established following international standards from the USDA and UNECE FFV-14 guidelines [
41], focusing on measurable characteristics including surface defects, color uniformity, and morphological regularity. Our team annotated the dataset using these standardized parameters, ensuring alignment with commercial quality assessment practices while maintaining consistency across growing regions and varieties.
Despite these considerable advances, critical challenges persist in agricultural classification systems, particularly regarding specificity (the ability to distinguish subtle quality differences), processing speed (for real-time field applications), and data efficiency (to reduce annotation requirements). These limitations motivate our investigation into transformer-based approaches that combine the strengths of modern attention mechanisms with practical agricultural constraints. In this paper, we present a citrus fruit quality classification framework based on an optimized Vision Transformer (ViT) architecture [
42]. The model is fine-tuned on a labeled dataset comprising three quality classes of citrus fruits, effectively capturing visual patterns related to surface defects, shape irregularities, and color variations. In addition to the core classification task, we integrate a large language model (LLM) component [
43] that generates concise and human-readable diagnostic reports based on the predictions of the model. This approach aims to support stakeholders throughout the citrus supply chain, such as farmers, processors, and distributors, by offering an interpretable and efficient solution for automated quality classification. The entire system is designed for practical deployment, with a focus on maintaining accuracy, interpretability, and computational efficiency.
2. Materials and Methods
2.1. Data
The dataset used in this study was carefully collected and curated by our research team. Fruit samples were obtained from multiple sources and production environments to ensure a heterogeneous and representative dataset, and were selected to cover several citrus varieties (e.g., oranges, lemons and limes) and a range of color and maturity stages (green, yellow, orange). The compiled dataset has been made publicly available on Kaggle (
https://www.kaggle.com/datasets/moussaid/citrus-quality-classification, accessed on 5 August 2025).). ALso, all samples were manually annotated by domain experts according to a predefined labelling protocol. Experts assessed each fruit for visible defects (e.g., bruising, lesions, discoloration), overall external quality and maturity stage, and assigned it to one of three quality classes: bad quality, medium quality, and good quality.
To improve label reliability, each image was independently reviewed by two experts, and disagreements were resolved through joint review and consensus. In addition, a quality control test was performed to verify image label consistency and remove ambiguous or low-quality images from the final set.
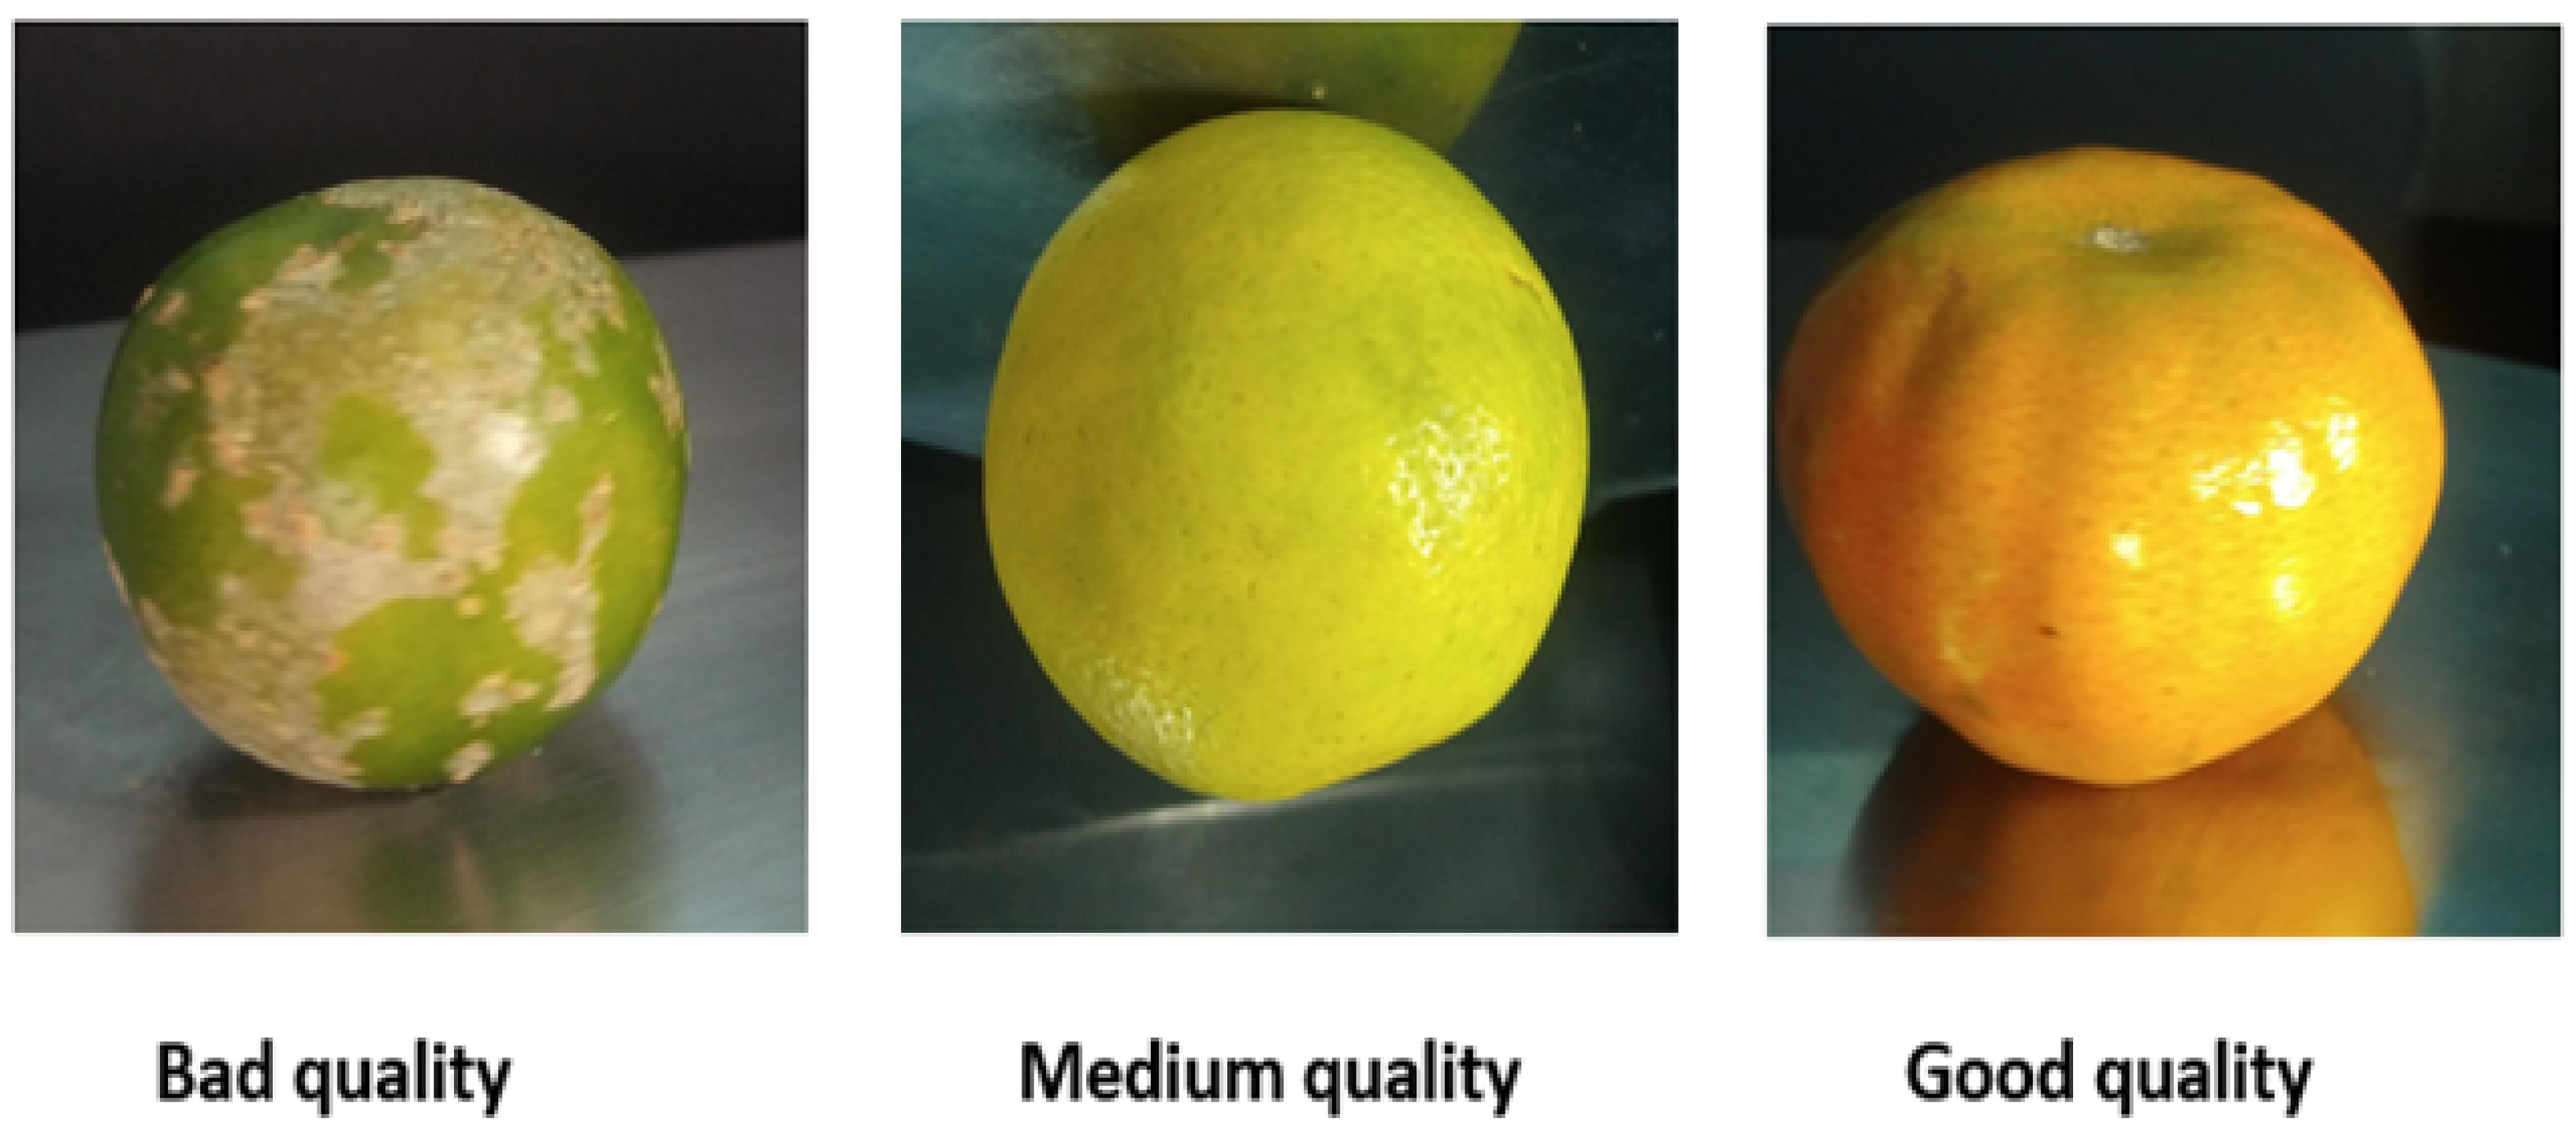
Figure 1 shows representative examples from each quality class. This careful sampling and expert labelling strategy was adopted to capture the natural variability of commercial citrus production and to provide a robust ground truth for model training and evaluation.
To ensure robust evaluation and fair sampling, the dataset was carefully split into two separate files: a training set and a test set. This split was performed to maintain good class balance and representative sampling in both subsets.
Figure 2 provides a joint overview of the class distribution in the training and test sets, as well as the general composition of the data. The bar charts show the number of images per class in both splits, while the pie chart illustrates the percentage of each quality class in the total dataset. This balanced and well-structured split supports reliable training and unbiased performance evaluation of classification models.
By constructing and labeling our own dataset, we ensured control over data quality, class balance, and annotation accuracy. The diversity of data in fruit types, varieties, and visual conditions makes it suitable to evaluate the robustness and generalizability of citrus quality classification models.
2.2. Vision Transformer (ViT)
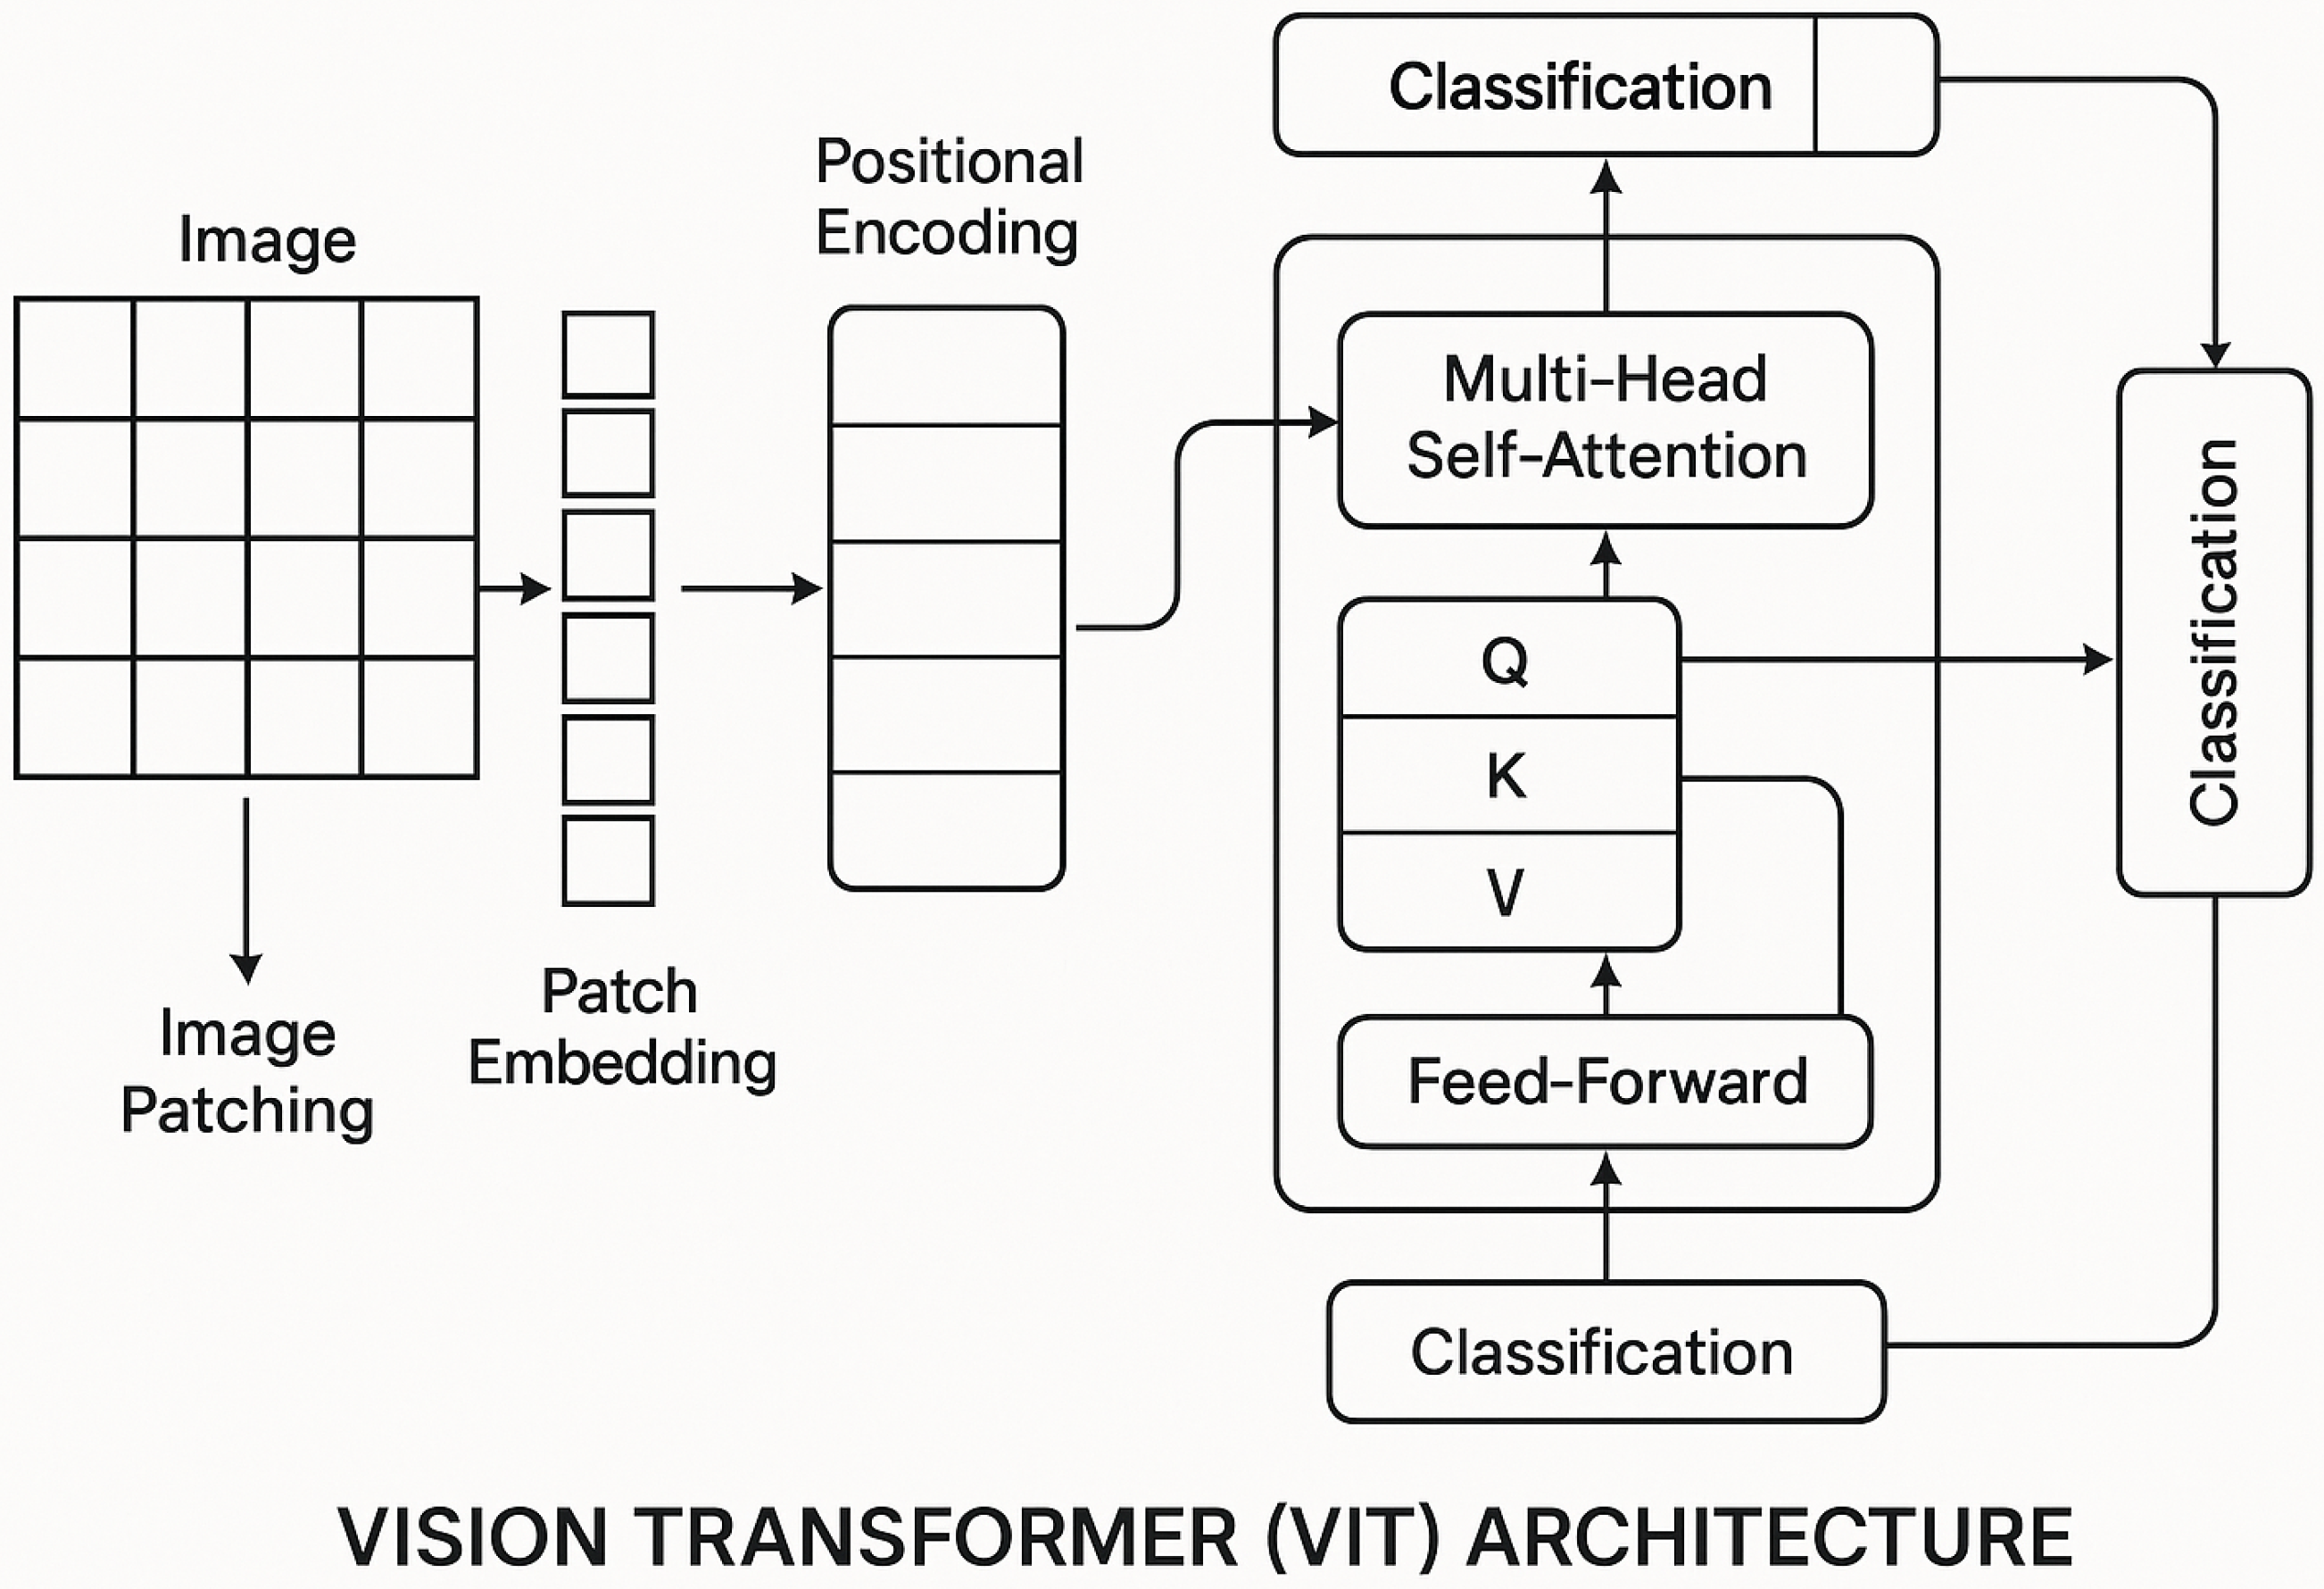
Vision Transformers (ViTs) have introduced a new paradigm in computer vision by adapting the Transformer architecture, originally designed for natural language processing, to image analysis. Unlike Convolutional Neural Networks (CNNs) that rely on convolutional filters to extract local features, ViTs treat an image as a sequence of fixed-size patches and employ self-attention mechanisms to capture both local and global dependencies across the entire image.
The process starts by splitting an input image of size
(height, width, channels) into
N non-overlapping patches of size
, where
Each patch is flattened into a vector of length
and projected linearly into an embedding space of dimension
D:
where
is the embedding matrix of the patch that can be learned and
is the positional encoding vector added to retain the spatial information lost during flattening.
A special learnable classification token
is prepended to the sequence of patch embeddings, forming the input sequence:
This sequence is passed through a stack of transformer encoder layers. Each encoder layer consists of two main components: a multi-head self-attention (MSA) mechanism and a position-wise feed-forward network (FFN), both wrapped with residual connections and layer normalization.
The core of the Transformer is the scaled dot-product self-attention mechanism, which operates on three matrices: Queries
Q, Keys
K, and Values
V. These matrices are computed by linear projections of the input
X:
where
are learnable projection matrices, and
is the dimension of queries and keys.
The attention output is calculated as:
where the softmax function normalizes the scaled dot products to produce attention weights, allowing the model to weigh the importance of each patch relative to others and capture global contextual relationships.
Multihead self-attention extends this mechanism by splitting the embedding into
h parallel heads, each with its own set of projection matrices, and concatenating their outputs:
where each head is calculated as in Equation (
5), and
is a learned output projection matrix.
Following the MSA, the position-wise feedforward network applies two linear transformations separated by a non-linear activation (typically GELU):
where
and
are learnable parameters.
After passing through multiple encoder layers, the output corresponding to the classification token
is used as a global representation of the image and fed into a classification head (usually a linear layer) to produce the final prediction [
44].
Vision Transformers (
Figure 3) offer several advantages over CNNs: they explicitly model long-range dependencies via self-attention, can handle variable input sizes with minimal architectural changes, and avoid inductive biases such as locality and translation equivariance, enabling more flexible feature learning. However, ViTs generally require large-scale datasets for effective training due to their reduced inductive bias compared to CNNs.
In our implementation, we employ the ViT-Base model with patch size vit_base_patch16_224 available through the timm library, initialized with ImageNet pretrained weights to leverage transfer learning. The model’s classification head is adapted to output three classes corresponding to fruit quality labels (good, medium, bad). Training is performed on a GPU-enabled environment using the AdamW optimizer with a learning rate of and cross-entropy loss. We trained the model for 5 epochs, achieving progressive accuracy improvements as monitored by the training loop. Input images are resized to pixels to match the model’s expected input dimensions. This setup ensures efficient fine-tuning while capturing global contextual features through multi-head self-attention layers inherent to the ViT architecture.
2.3. Large Language Models (LLMs)
Large Language Models (LLMs) are advanced neural networks designed to understand, generate, and manipulate human language by learning statistical patterns from massive text corpora. At their core, LLMs rely on the Transformer architecture, which uses self-attention mechanisms to model relationships between tokens in a sequence, enabling the capture of both short- and long-range dependencies.
LLMs process input text by first tokenizing it into discrete units called tokens, which can be words, subwords, or characters. Each token is then assigned to a high-dimensional embedding vector , which encodes semantic information. The fundamental operation in LLMs is the self-attention mechanism, which computes contextualized representations of tokens by relating each token to every other token in the sequence.
Some of the most well-known LLMs include OpenAI’s GPT series (GPT-3, GPT-4), Google’s PaLM and T5, and Anthropic’s Claude [
45]. These models are trained on vast datasets containing billions of tokens and have billions to trillions of parameters. They excel in various tasks such as text generation, summarization, translation, question answering, and code synthesis.
LLMs are also capable of in-context learning, where they adapt their output based on a few-shot examples provided within the input prompt, without explicit retraining. This emerging ability allows flexible task adaptation, making them powerful tools for natural language understanding and generation.
In summary, LLMs leverage the Transformer self-attention mechanism to build context-sensitive representations of language, enabling them to perform complex reasoning and generate coherent, contextually relevant text.
2.4. Our Approach
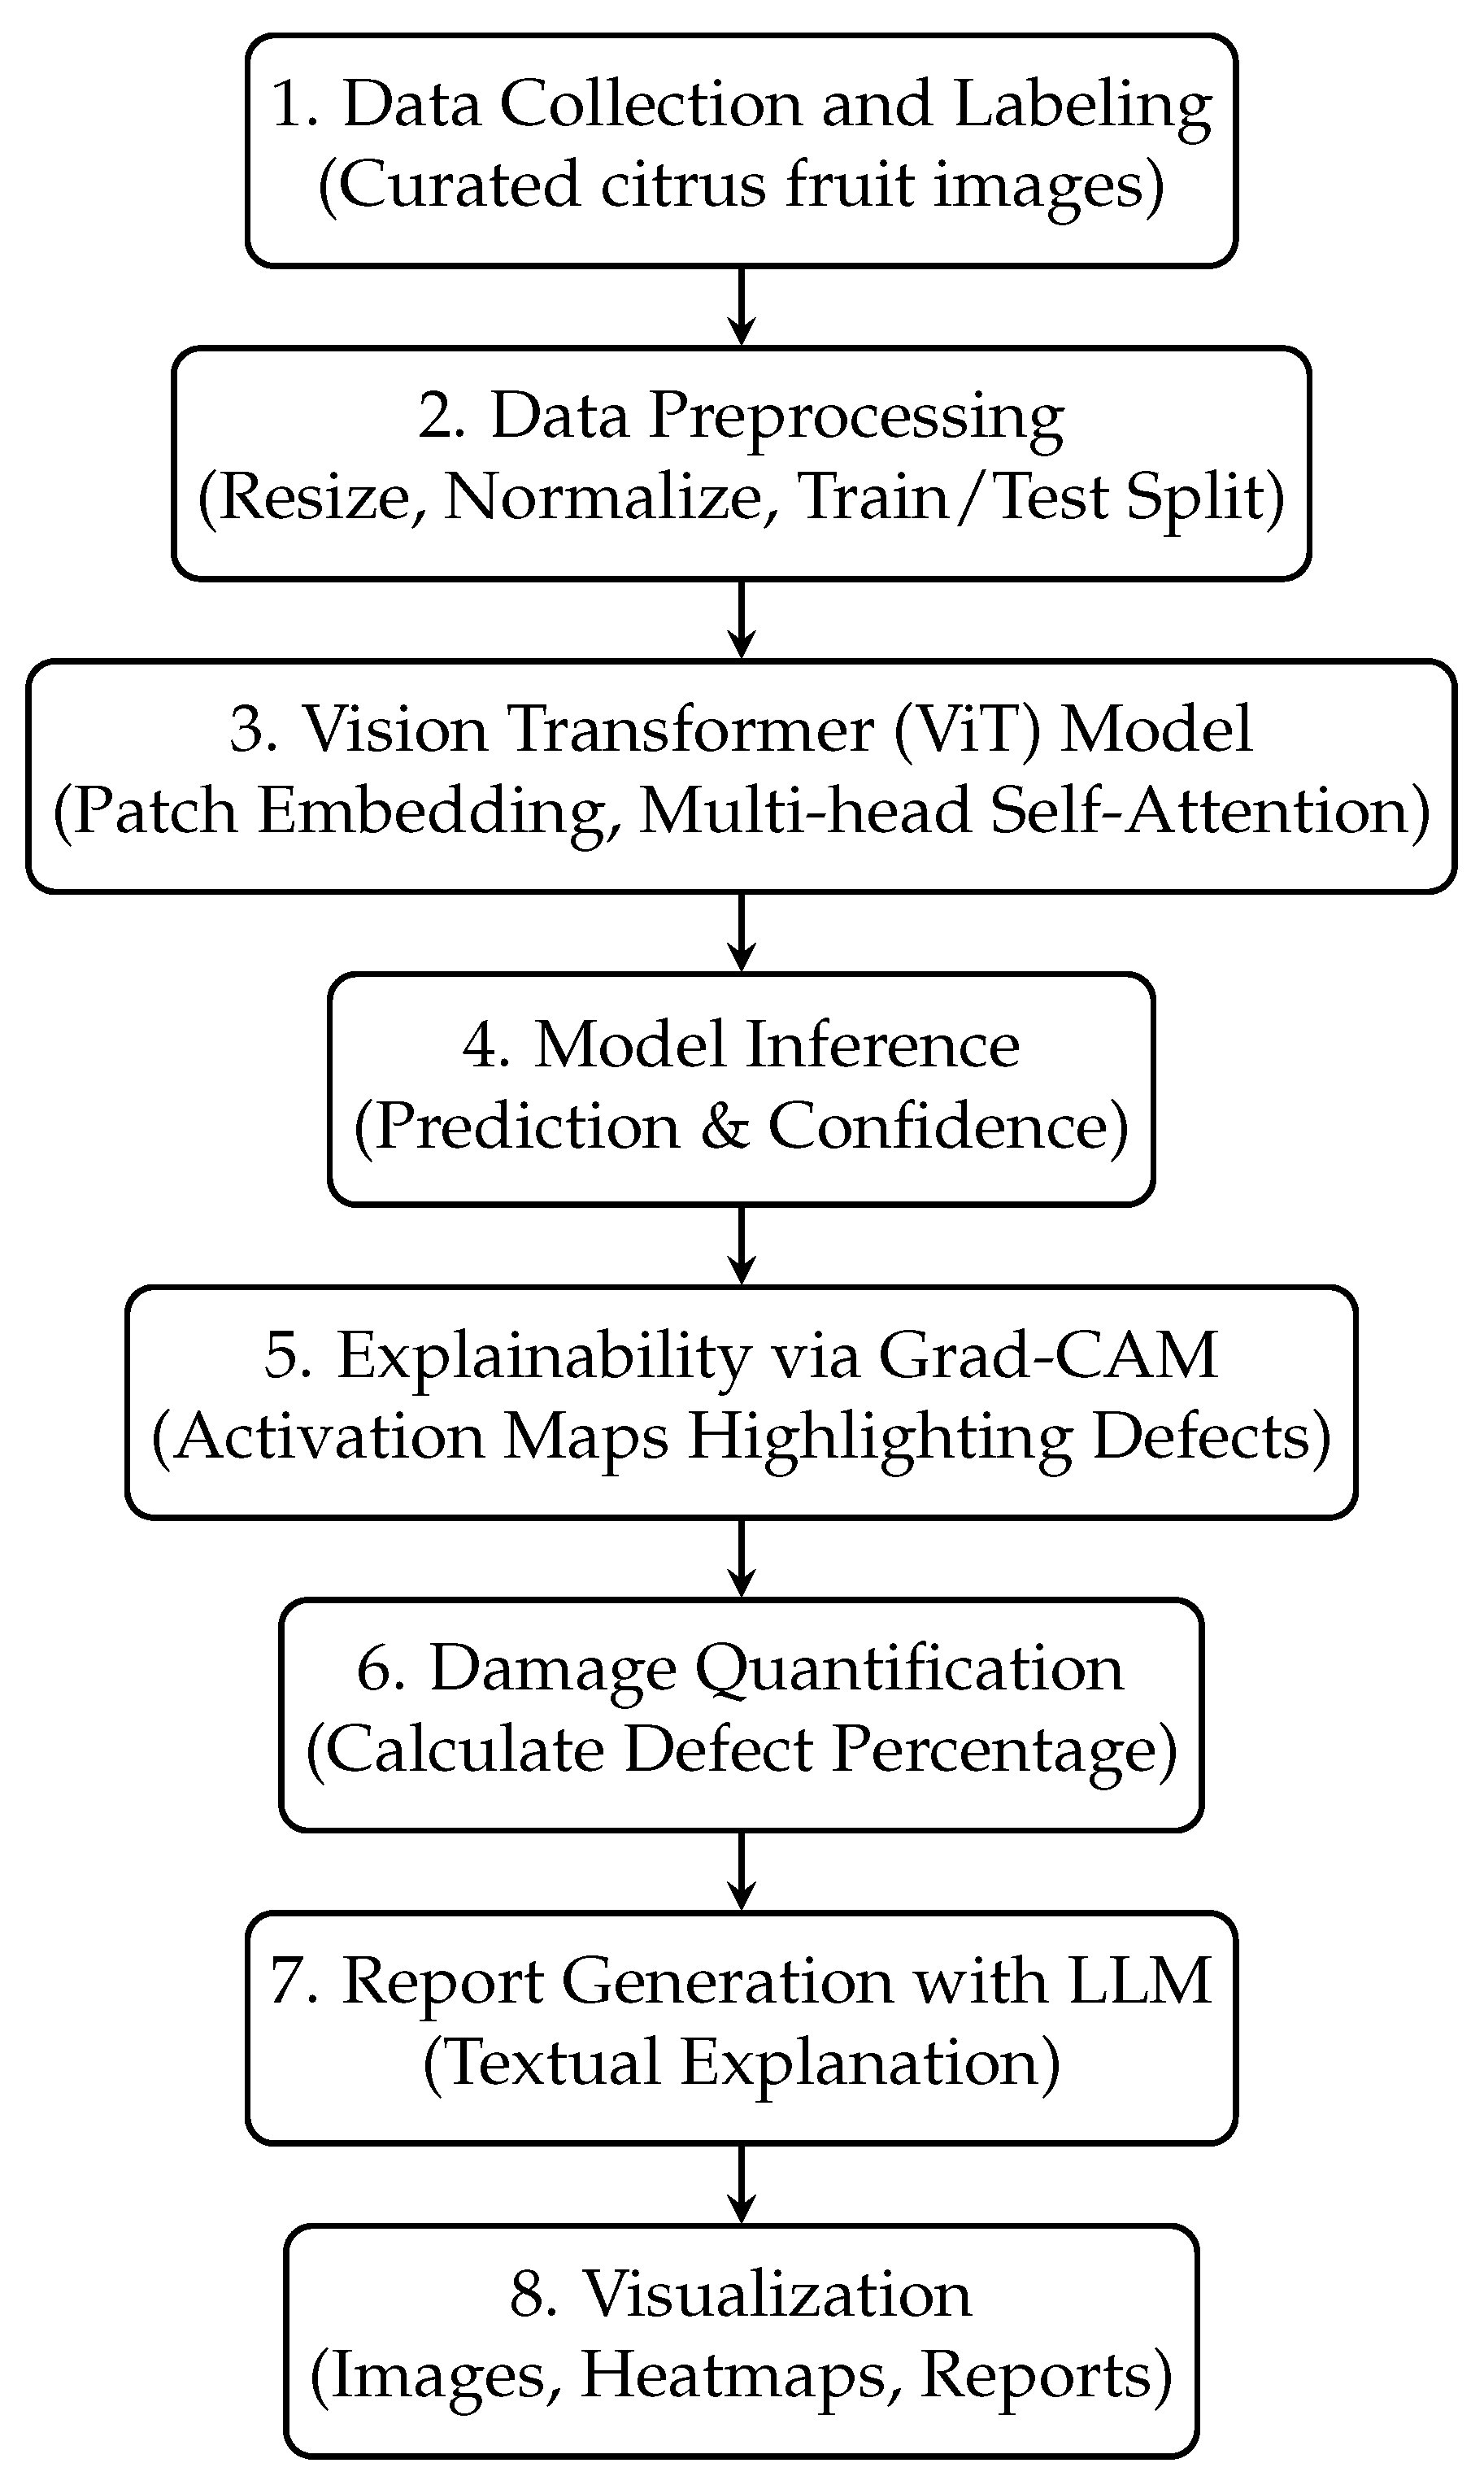
Our approach integrates a ViT model for citrus fruit quality classification with a Large Language Model (LLM) to generate interpretable textual reports. The workflow is carefully designed to ensure accurate predictions and meaningful explanations, as illustrated in
Figure 4.
In summary, the pipeline starts with data collection and labeling, followed by preprocessing to prepare images for the ViT model. The ViT performs classification by processing image patches through multihead self-attention layers, capturing global context. The model outputs predictions and confidence scores, which are then interpreted using Grad-CAM to generate activation maps that highlight the regions that influence the decision. These maps are analyzed to quantify the extent of damage or defects on the fruit surface. Finally, an LLM generates a human-readable report based on the classification and damage metrics, and all results are visualized for user interpretation.
This modular approach leverages ViT’s powerful feature extraction and global attention capabilities, alongside the natural language generation of LLM, resulting in a complete, interpretable system for assessing the quality of citrus fruits.
3. Results and Discussion
3.1. ViT Classification Results
The performance of the Vision Transformer model for the classification of citrus fruit quality was evaluated in the test dataset. The main evaluation metrics include accuracy, precision, recall, and the F1 score, which are derived from the confusion matrix. The confusion matrix is a fundamental tool in classification analysis, providing a summary of prediction results by comparing actual and predicted classes. It is defined in Formula (
8).
where
is the count of samples with the true label
i and the predicted label
j,
is the true class,
is the predicted class for sample
k,
N is the total number of samples and
is the indicator function.
The general accuracy is given by Formula (
9).
where the numerator is the sum of correctly classified samples (diagonal elements), and the denominator is the total number of samples [
28].
The ViT model achieved a high test accuracy of 98.29% on the citrus quality classification task. The detailed classification report showing if
Table 1:
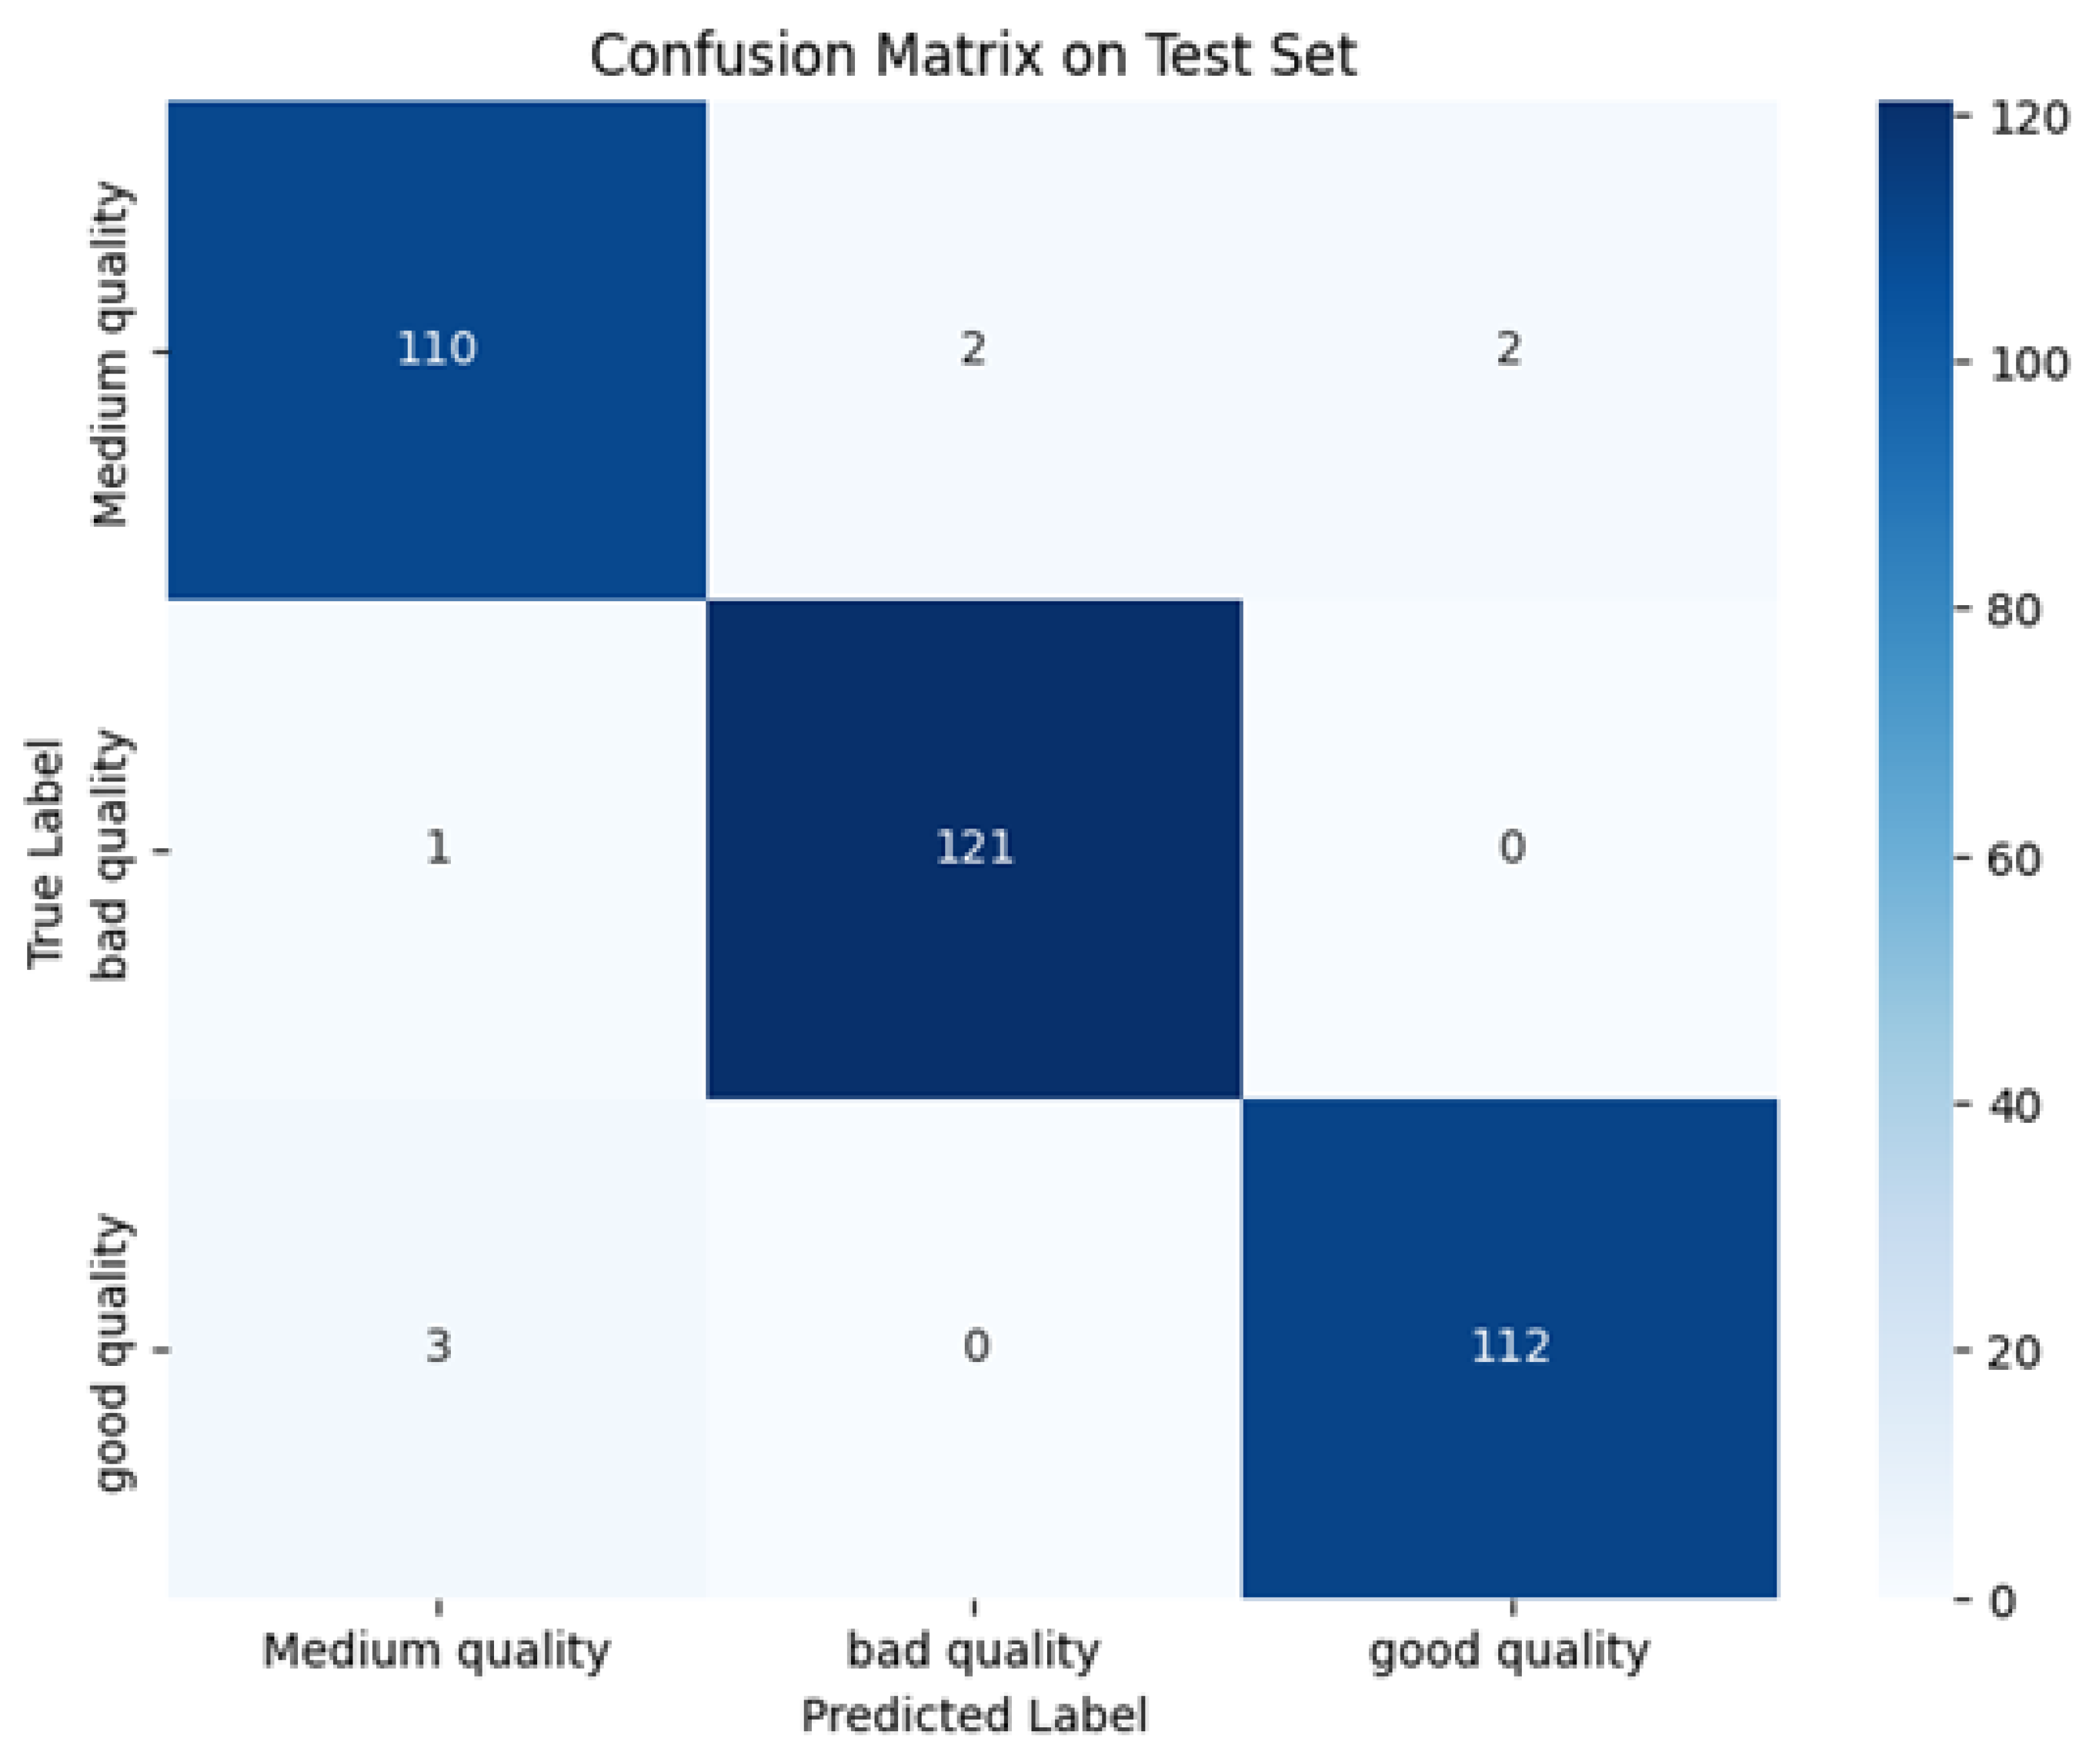
This strong performance is further illustrated by the confusion matrix (
Figure 5), which shows that the vast majority of samples are correctly classified, with only a few misclassifications between adjacent quality classes.
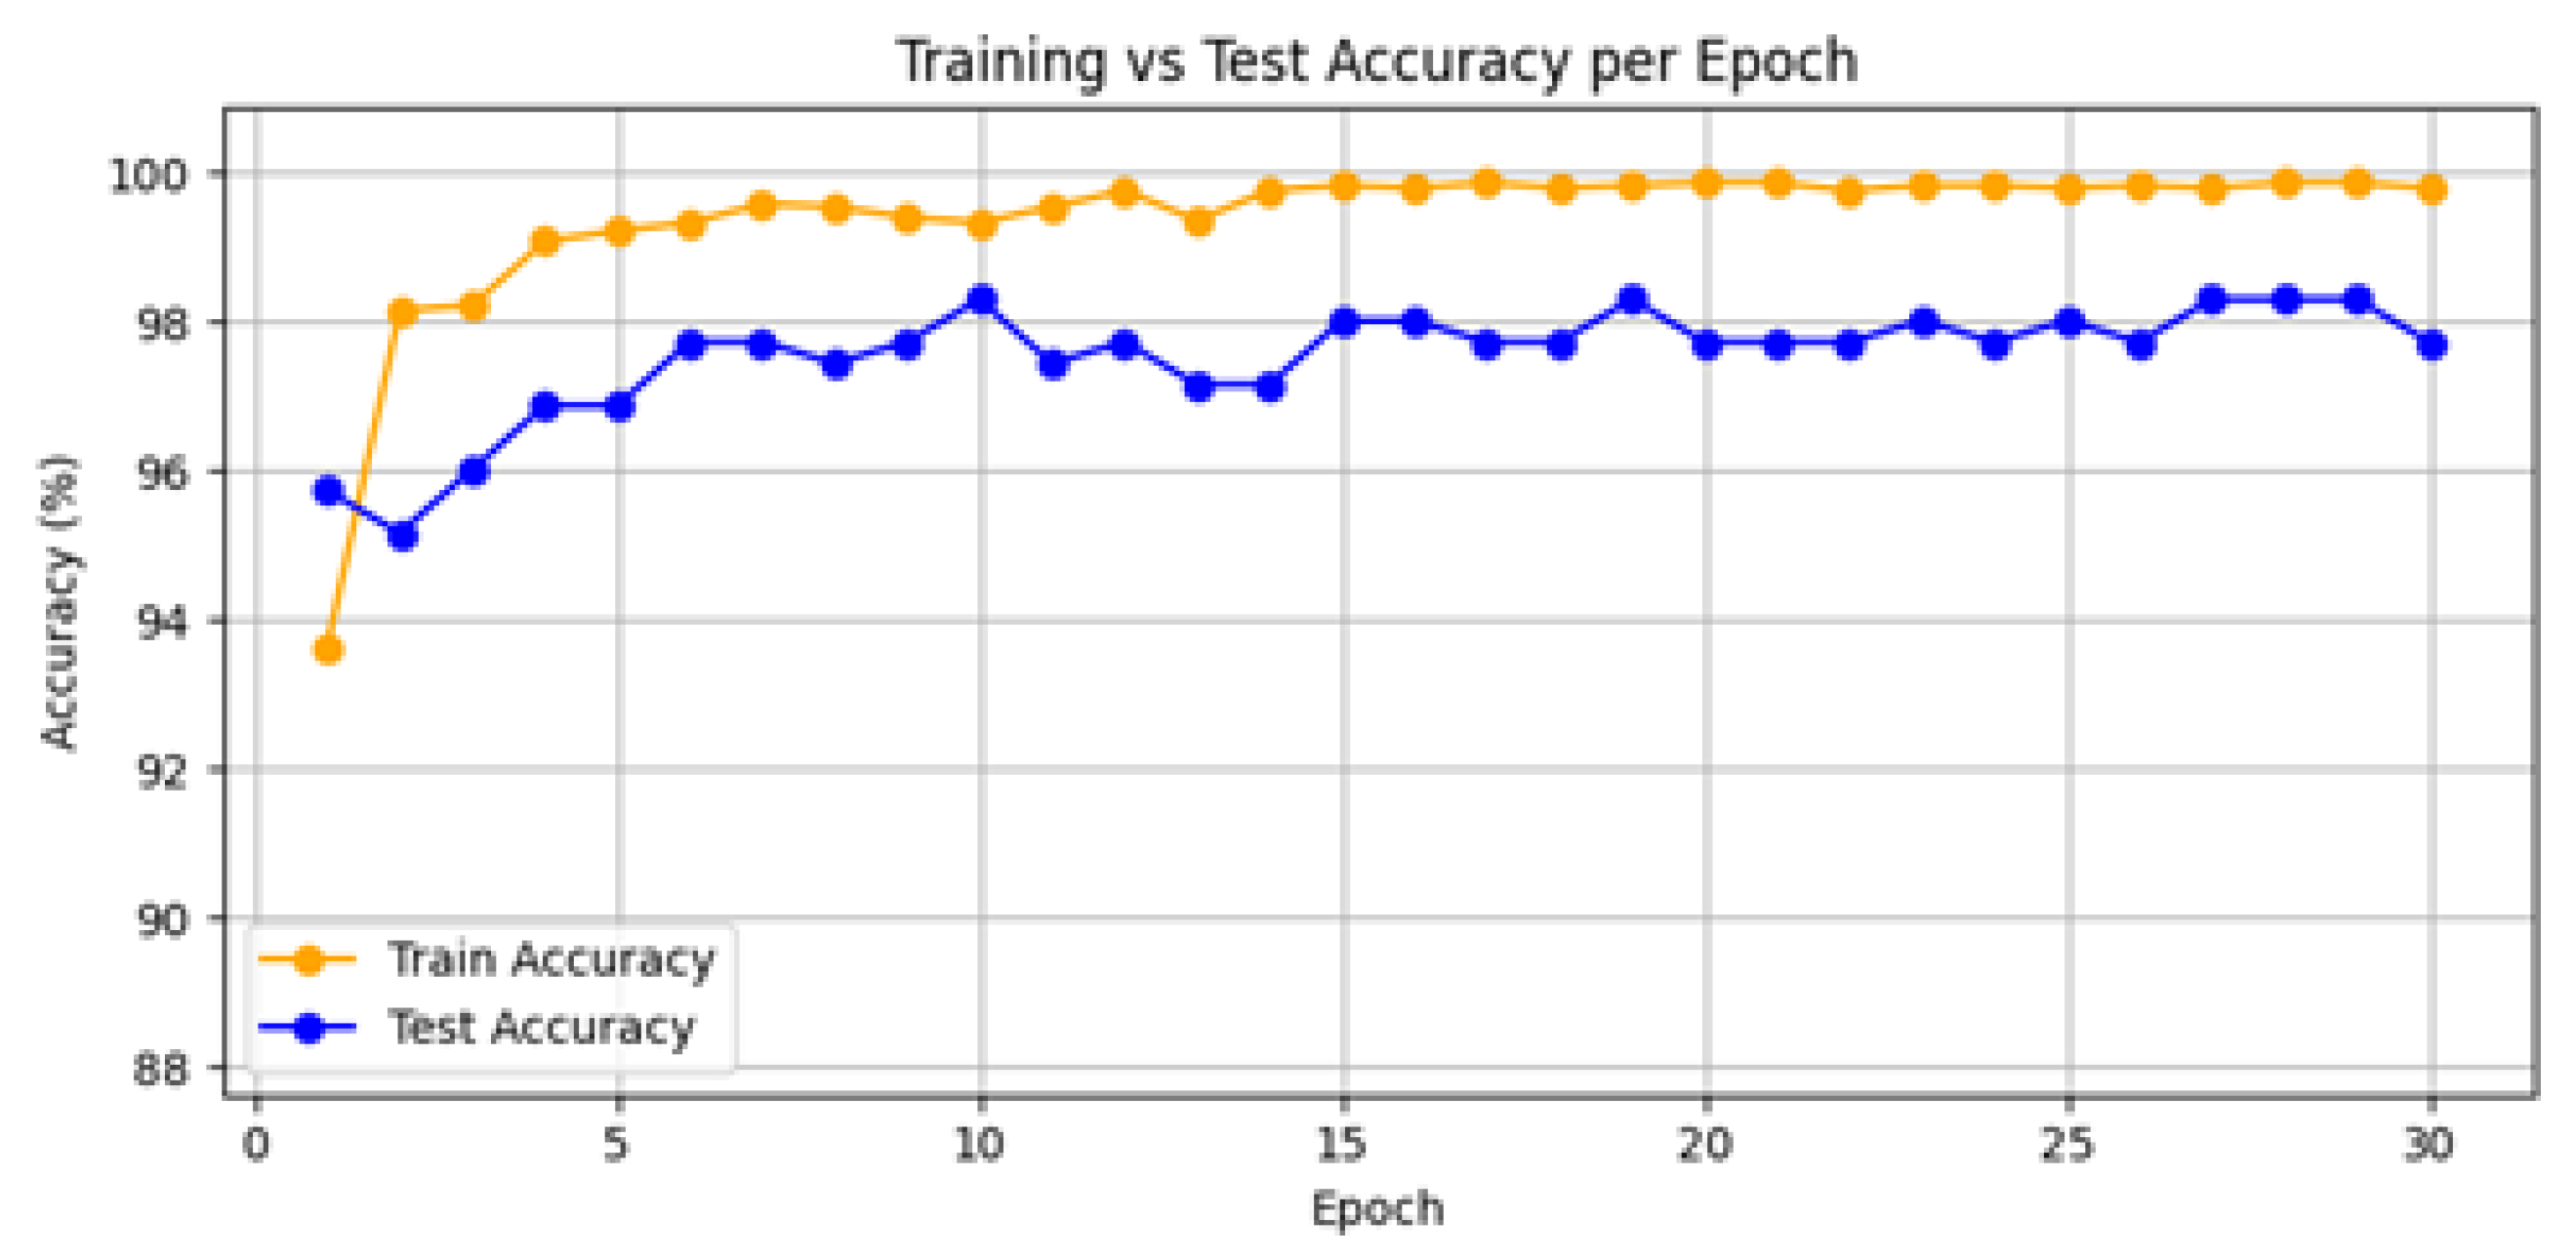
The training process of the model demonstrated good convergence and stable performance across 30 epochs, as illustrated in
Figure 6. Training accuracy improved from 93.63% in the first epoch to 99. 79% in the final epoch, while test accuracy consistently increased from 95. 73% to 98. 29%, reaching its peak at epoch 28. In particular, the test accuracy stabilized above 97% after epoch 3, indicating robust generalization despite the high training accuracy of the model. Minor fluctuations in test accuracy (e.g., 97.15% at epoch 13) suggest the model’s resilience to overfitting, attributed to the ViT’s self-attention mechanism and the balanced dataset. This convergence behavior validates the effectiveness of fine-tuning the pre-trained ViT architecture for the classification of citrus quality.
To better understand the model’s performance,
Figure 7 displays random samples from each fruit quality class as classified by the ViT model. Each row corresponds to a different class: medium quality (top), bad quality (middle), and good quality (bottom).
The visual results confirm that the ViT model is capable of distinguishing between subtle differences in fruit appearance. Medium quality fruits typically show minor imperfections or uneven color, while bad quality fruits exhibit clear signs of disease, blemishes, or significant surface defects. Good quality fruits are characterized by uniform color, smooth surface, and absence of visible defects. The few observed misclassifications generally occur between medium and adjacent classes, which is expected given the subjective nature of some visual quality criteria.
The high precision, recall, and F1 scores in all classes demonstrate the robustness and generalizability of the ViT model in heterogeneous citrus data. The model’s ability to handle diverse varieties, colors, and quality conditions is evident in both quantitative metrics and qualitative visualizations. These results validate the effectiveness of Vision Transformers for real-world agricultural quality assessment tasks.
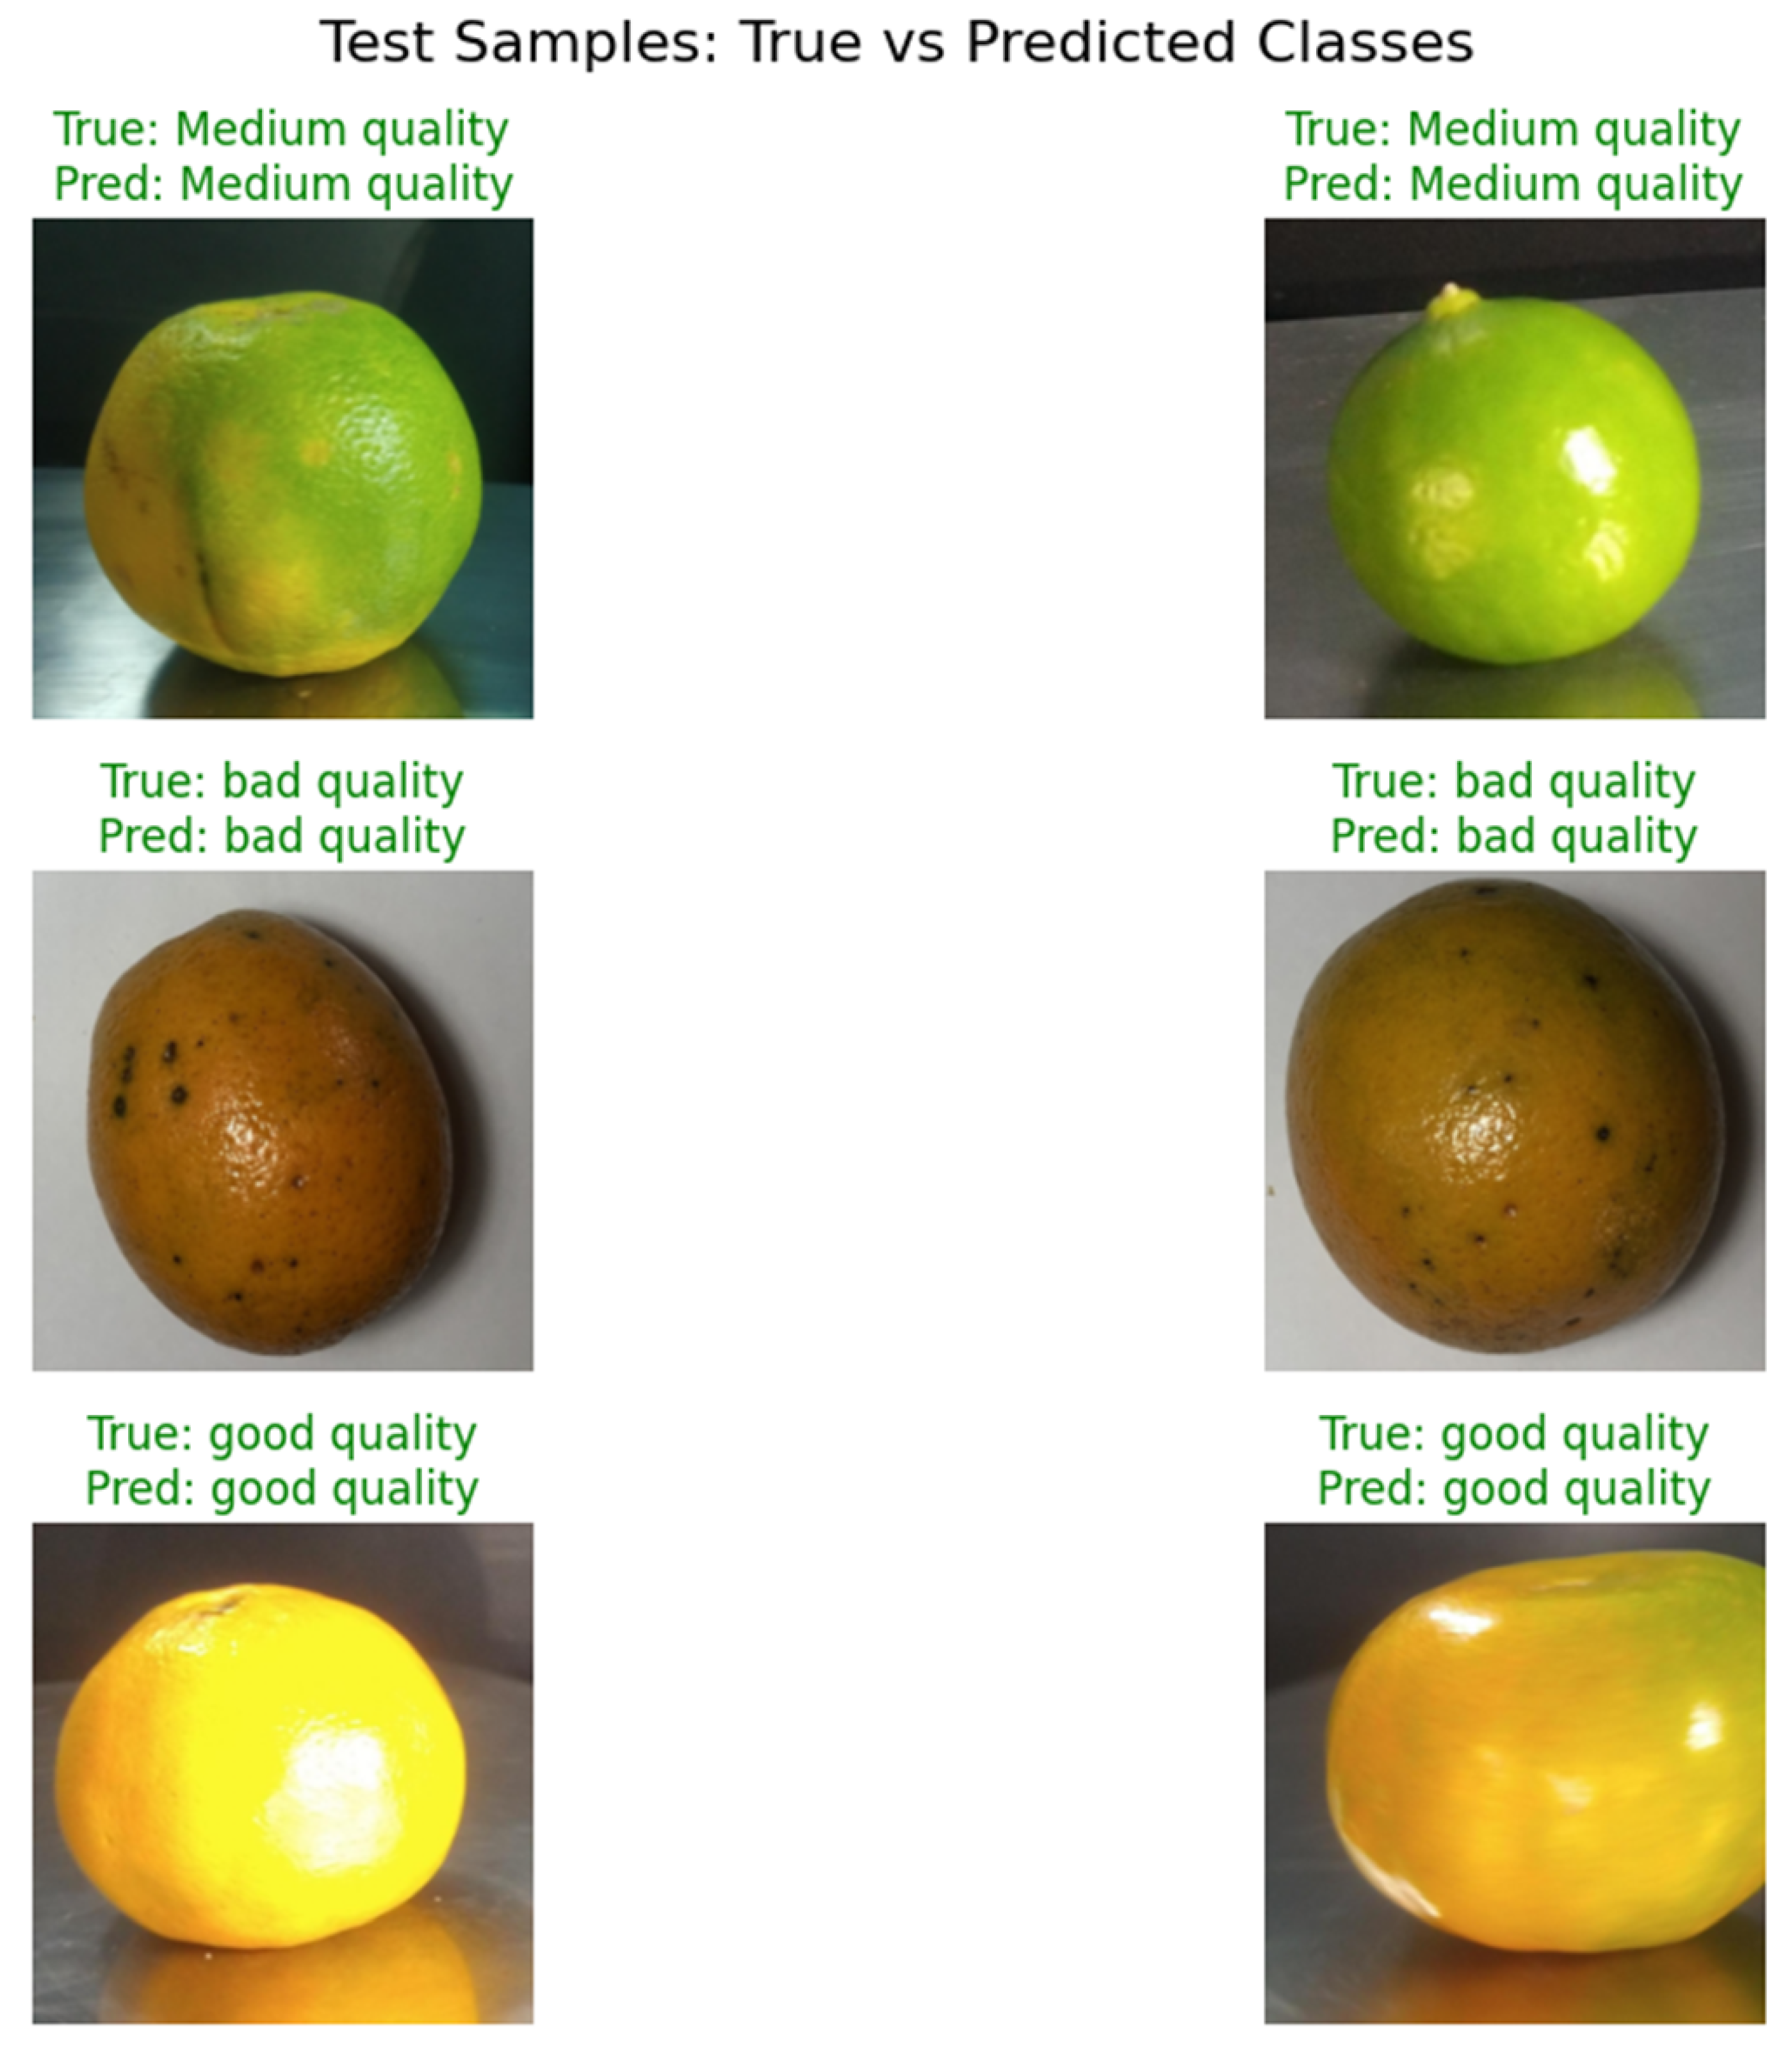
After finalizing the training and validation of our model on the curated citrus dataset, we sought to assess its robustness and practical applicability in real-world scenarios. To this end, we conducted an additional experiment by deploying the trained model on a new set of citrus fruit images that were entirely independent of the original dataset. This real-time test simulates the deployment of the model in operational environments, where it is exposed to novel samples with potentially unseen variations in fruit type, color, lighting, and background. Six new images of citrus fruits were carefully selected, ensuring diversity in variety and quality. These images were not part of the training or test splits and represent true out-of-distribution data. The model was used to predict the quality class for each sample and the results were visualized by displaying both the true (manually labeled) and predicted classes. For each class (bad, medium, and good quality), two representative samples were evaluated.
The results, illustrated in
Figure 8, demonstrate the strong generalizability of the ViT model. The six external citrus samples were correctly classified, as indicated by the green titles in the figure. The model distinguished between subtle differences in fruit appearance, such as color uniformity, surface texture, and visible defects, which are critical to quality assessment.
This successful real-time evaluation highlights several key points:
Generalization: The model maintained high accuracy even when exposed to new data previously unseen, confirming its robustness and practical utility.
Interpretability: The clear visual correspondence between true and predicted classes provides confidence in the reliability of the model for end-users.
Practical Readiness: Such performance on external samples supports the model’s deployment potential for automated citrus quality control in real agricultural or industrial settings.
3.2. Grad-CAM Attention Visualization Across Citrus Quality Classes
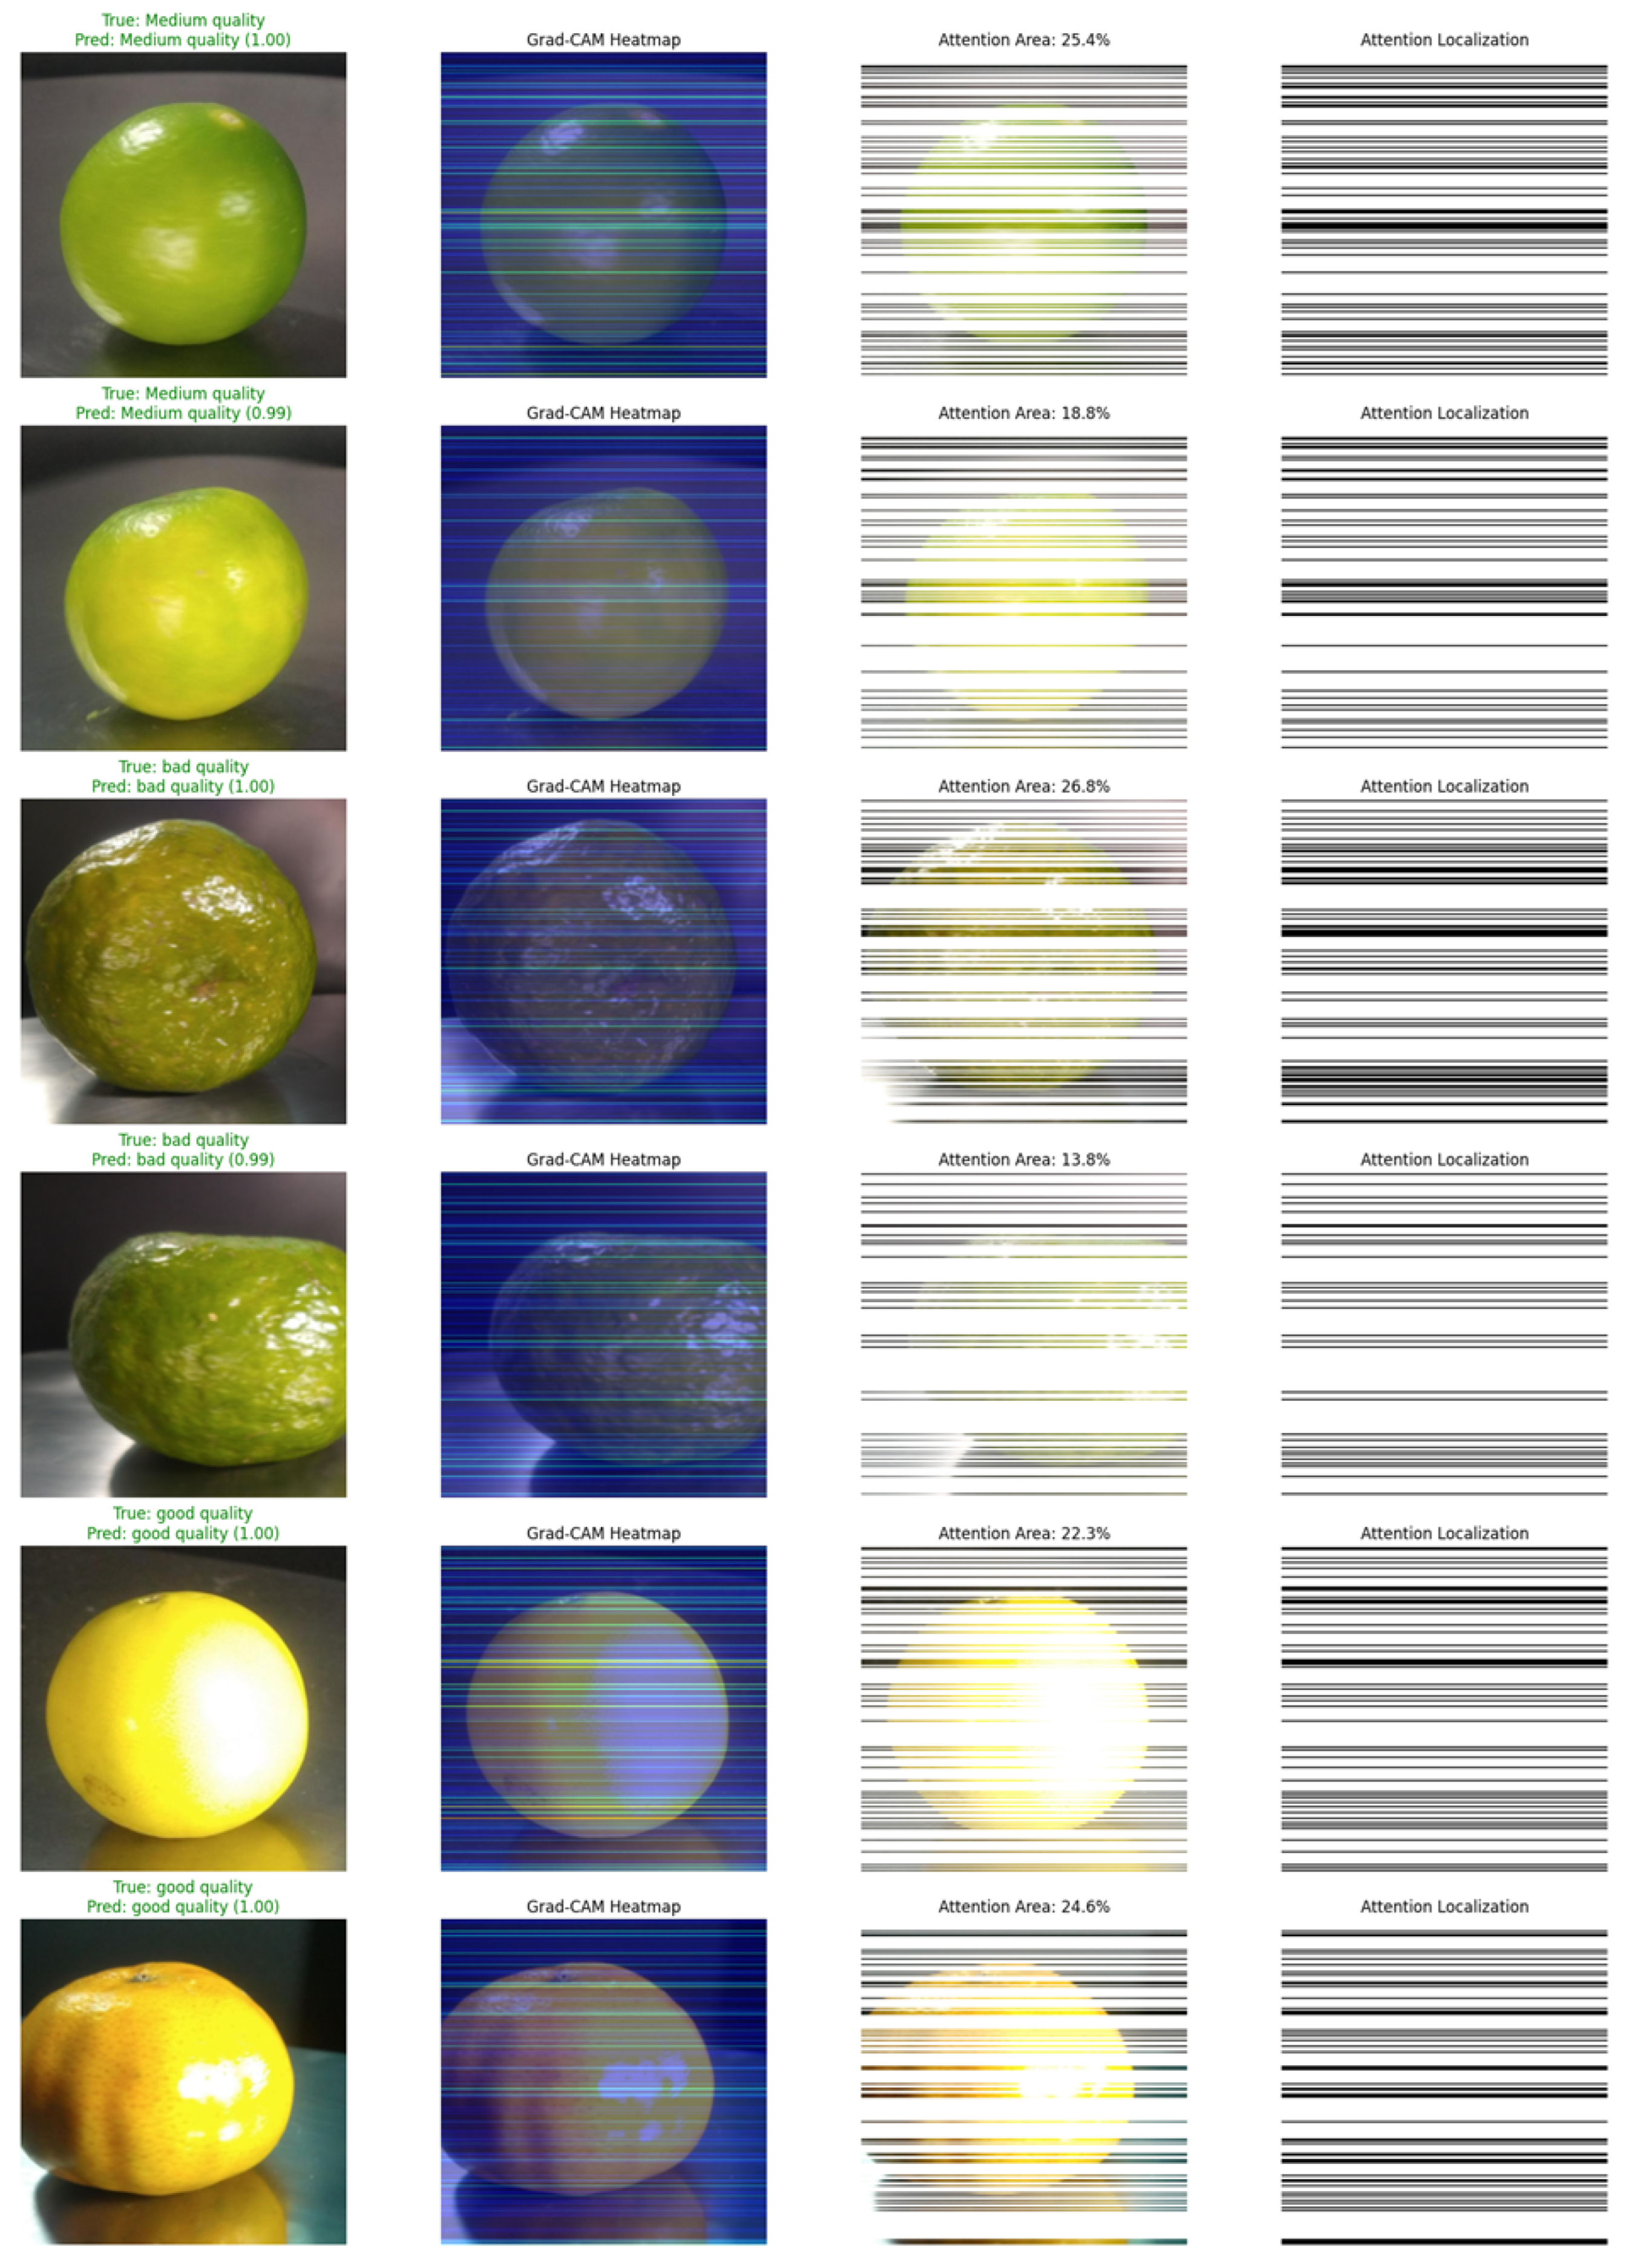
To enhance the interpretability of the ViT-based citrus quality classification model, we employ Gradient-weighted Class Activation Mapping (Grad-CAM) to visualize the regions of the fruit images that the model focuses on when making predictions. Grad-CAM generates class-specific attention maps by computing the gradients of the target class score concerning feature maps of a chosen transformer block in the ViT. These gradients are globally averaged to obtain importance weights for each neuron, which are then combined with the feature maps to produce a heatmap highlighting the areas most influential for the model’s decision. This process allows us to understand which parts of an image the model considers relevant to classify the fruit as good, medium, or bad quality.
Figure 9 shows six representative citrus fruit samples from the test dataset, with two examples per class. Grad-CAM heat maps are overlaid to illustrate the regions that contribute the most to the predicted class.
The green overlays (black color in the last two columns) indicate areas with high activation in the Grad-CAM maps, reflecting regions that the model emphasizes during classification. These visualizations provide an intuitive explanation of the model’s decision-making process by revealing the image regions that drive the predictions. The intensity of attention is computed by thresholding the normalized Grad-CAM map to create a binary mask and calculating the fraction of pixels above the threshold. It is important to note that these values indicate model focus rather than any measurable physical property of the fruit.
By comparing attention across good, medium, and bad quality fruits in a side-by-side layout, the visualizations demonstrate how the model differentially allocates focus depending on the class. This supports transparency and trust in practical deployment scenarios.
In summary, the ViT-based citrus quality classification system demonstrates high accuracy on correctly classified test samples and offers clear interpretability through Grad-CAM visualizations. The six-sample figure illustrates how the model allocates attention differently across fruit quality classes, providing insight into the internal reasoning behind its predictions. While attention percentages are shown for illustrative purposes, they should not be interpreted as quantitative measurements of fruit properties. These visualizations complement standard performance metrics by elucidating the model’s decision process and increasing confidence in its practical application.
3.3. Large Language Model for Explainable Citrus Classification
The integration of a LLM into our citrus quality assessment pipeline adds a crucial layer of interpretability and user trust. Unlike traditional classification systems that simply output a predicted label, our approach uses a carefully optimized LLM to generate concise, human-readable reports that explain the rationale behind each prediction while maintaining computational efficiency for edge deployment.
We used Microsoft’s Phi-3-mini model, a 3.8 billion parameter transformer specifically designed for resource-constrained environments, achieving inference speeds of 42 tokens/second with only 1.8 GB memory footprint through 4-bit quantization and optimized attention mechanisms [
46]. The LLM receives structured inputs from our Vision Transformer pipeline, including: (1) the predicted quality class (good/medium/bad), (2) confidence score (0–1 range), and (3) quantified damage percentage calculated from Grad-CAM activation maps. These inputs are processed through 32 transformer layers with sliding window attention (4096 token context) and rotary positional embeddings (RoPE), generating reports that maintain agricultural domain specificity through systematic prompt engineering. Mathematically, this process is formalized as a conditional language generation task:
where
represents the learned parameters of our fine-tuned Phi-3-mini model, and the prompt
P combines fixed agricultural reporting templates and dynamic classification data. This architecture enables the model to produce coherent, contextually relevant explanations while operating entirely on-device-a critical requirement for field deployments where cloud connectivity may be unreliable. Our implementation achieves an average report generation latency of 0.3 s with a power consumption of under 3.2 W at full utilization, making it practical for integration with mobile inspection systems and existing grading lines.
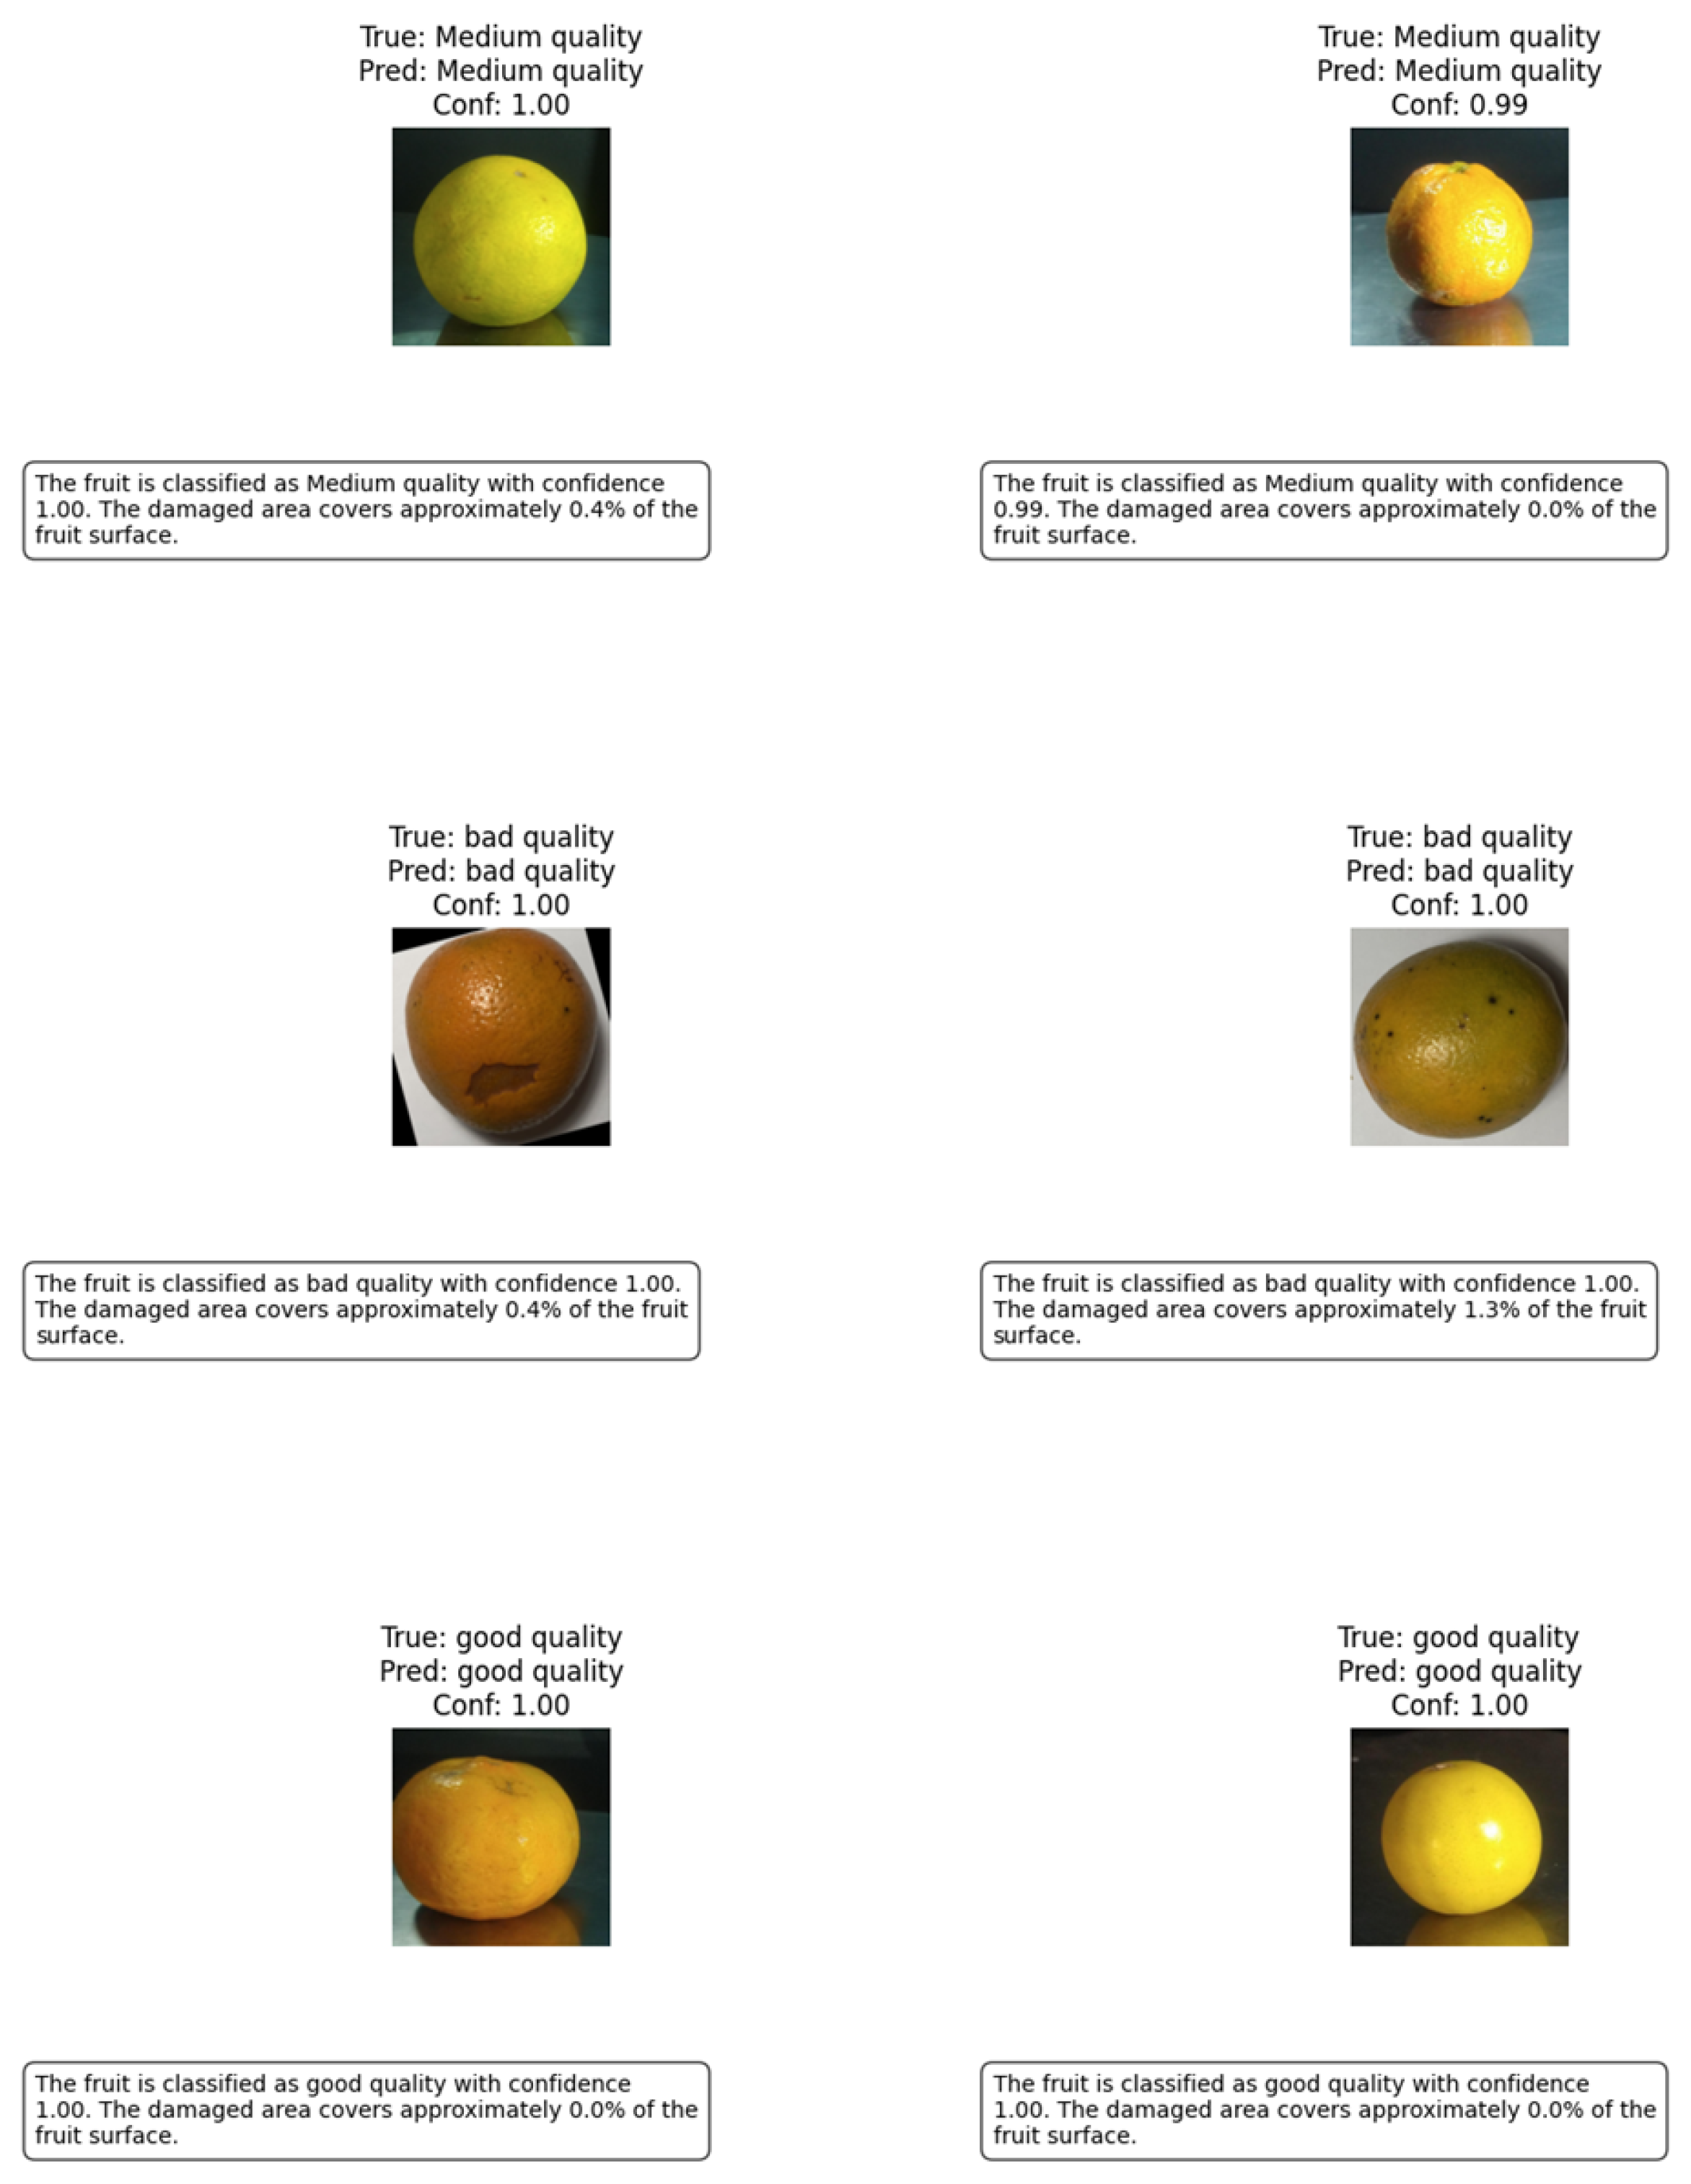
Figure 10 demonstrates the system’s output across six representative samples, showing how the LLM generates reports that accurately reflect both the classification decision and its visual justification. Each report combines three key elements: (1) a clear quality assessment statement, (2) the confidence level of the model, and (3) specific references to the defect characteristics visible in the Grad-CAM visualizations.
For instance, for good quality fruits, one example with 100% confidence and 0.0% attention coverage is reported by the LLM as exhibiting excellent visual characteristics, suitable for premium fresh markets. Another good quality sample with 100% confidence and 0.0% attention coverage highlights minor cosmetic variations while still being recommended for premium sale.
For medium quality fruits, one sample with 1.00 confidence and 0.4% attention coverage is described by the LLM as having minor imperfections, recommending processing or careful market placement. Another medium-quality fruit with 0.99 confidence and 0.0% attention coverage is similarly explained, emphasizing subtle surface irregularities.
For bad quality fruits, one fruit with 1.00 confidence and 0.4% attention coverage is flagged by the LLM as having visible defects and unsuitable for fresh markets. Another bad-quality fruit with 1.00 confidence and 1.3% attention coverage is similarly reported, highlighting more prominent attention regions corresponding to defects.
These textual examples illustrate that the LLM translates the raw model outputs—predicted class, confidence scores, and Grad-CAM attention maps—into clear, actionable insights. Even for fruits with similar predicted classes, differences in attention distribution produce nuanced, class-specific explanations, demonstrating the added value of the LLM beyond a simple label output.
These results demonstrate how this approach addresses key challenges in agricultural AI systems. First, the standardized reporting format reduces ambiguity while maintaining necessary technical details-each report consistently includes the predicted class, confidence level, and quantified damage assessment. Second, the tight integration with visual explainability methods (Grad-CAM) allows the LLM to reference specific defect characteristics, such as the damaged part. Third, the system maintains practical deployment characteristics, and all processing occurs locally on edge devices without requiring cloud connectivity or specialized hardware.
In summary, our implementation of a lightweight LLM transforms the Vision Transformer’s raw classifications into actionable agricultural insights while maintaining stringent requirements for edge deployment. By combining precise technical reporting with efficient operation, the system bridges the gap between complex computer vision outputs and practical decision-making in citrus production and processing. This approach not only improves transparency in automated quality assessment but also demonstrates how modern language models can be optimized for specialized agricultural applications without compromising performance or usability.
4. Conclusions
To conclude, the integration of Vision Transformer (ViT) and Large Language Model (LLM) technologies in our citrus quality assessment system represents a significant advancement toward practical, real-time fruit quality evaluation. The powerful image understanding capabilities of the ViT enable highly accurate classification of citrus fruits across various varieties and quality levels, while the LLM provides clear and concise explanations that make the system’s decisions transparent and trustworthy. This combination not only improves classification accuracy but also addresses a critical need for interpretability in automated quality control, which is especially important in agricultural and industrial contexts such as field inspections and juice processing plants. The portability and efficiency of the LLM ensure that the entire pipeline can operate with modest computational requirements, as demonstrated by our Kaggle notebook implementation using GPU acceleration. While current validation was performed in this controlled environment, the system’s design principles-including model quantization and architectural optimizations-suggest strong potential for future edge device deployment in agricultural settings. The ease of use, low latency, and modularity of the system facilitate seamless integration into existing workflows, enabling rapid adoption and scalability. By providing reliable predictions alongside understandable reports, the system empowers stakeholders to make informed decisions quickly, reducing reliance on manual inspection and minimizing waste.
It is important to note that the ViT model constitutes the primary decision-making component of our pipeline and has been comprehensively validated using standard classification metrics as well as out-of-distribution testing. The LLM module serves as an auxiliary interpretability tool that generates textual explanations based on ViT predictions and damage quantification. While we provide qualitative examples demonstrating the usefulness of these explanations, quantitative validation of the LLM’s contribution to interpretability remains future work.
Ultimately, this work demonstrates that advanced AI models such as ViT and LLM can be effectively combined to create robust, interpretable, and deployable solutions that meet the demands of real-world agricultural environments. The real-time performance and user-friendly design of the system make it a valuable tool to improve quality control of citrus fruits, from the orchard to the juice processing line, contributing to enhanced product quality, operational efficiency, and sustainability.
