1. Introduction
Accurate fruit yield prediction allows farmers to optimize harvesting, storage, marketing, transportation, and sales, thereby improving resource management and facilitating informed decision-making [
1,
2,
3,
4]. Traditionally, yield estimation has been performed manually by fruit growers and horticultural scientists, who count and weigh samples from a few randomly selected areas to extrapolate the total yield for entire orchards or larger regions [
3,
5]. However, these manual processes are labor-intensive, time-consuming, and costly. They are also prone to significant errors and variability due to differences among individual trees and diverse orchard environmental conditions [
5,
6,
7]. Consequently, manual methods often lack accuracy and reliability, complicating farmers’ ability to effectively predict yields and plan subsequent actions [
1,
3]. These challenges highlight the need for intelligent fruit yield estimation systems that enhance both the accuracy and efficiency of yield predictions in agricultural practices [
1,
2,
3,
6].
Recent advances in deep learning (DL) have shifted yield estimation from labor-intensive manual methods to automated approaches based on deep learning models [
1,
2,
3,
5,
6,
8,
9,
10,
11,
12]. Deep learning-based fruit yield estimation systems offer significant advantages, including nondestructive, image-based measurements, high accuracy, and robust performance across diverse environmental conditions. These capabilities can substantially enhance agricultural productivity and resource management efficiency. As a result, farmers can plan harvesting, storage, transportation, and marketing activities more systematically, address labor shortages, and improve the sustainability and profitability of the agricultural industry by integrating automation technologies such as robotic harvesting [
2,
3,
10,
13].
The fundamental concept of orchard yield estimation is to count all visible fruits in a single image and estimate the final yield based on the total number of fruits detected across all captured images [
5]. In this process, we focused on fruit-load estimation, which involves counting the fruits visible in tree images. The core technology for fruit-load estimation is the accurate detection of individual fruit locations for precise counting. Typically, the fruit-load estimation process using RGB images involves capturing images on one or both sides of tree rows, accurately detecting the fruits, and counting them. The total fruit count is obtained by summing all individual detections.
Maheswari et al. [
10] employed a semantic segmentation model called U-Net to detect and localize guava fruits in orchards for yield estimation. Koirala et al. [
6] used images collected at night with LED lighting panels and an RGB camera, applying the MangoYOLO model for fruit detection and the Xception_count model for direct fruit count prediction via CNN-based regression. Koirala et al. [
11] developed the MangoYOLO model, a real-time fruit detection system based on the YOLOv3 architecture that utilizes nighttime data. The motivation for using nighttime data is that artificial lighting ensures consistent illumination, stabilizes image quality, and enhances the distinction between fruits and background, thus improving object detection performance. While both studies employed nighttime imaging with artificial lighting to enhance fruit-background contrast and stabilize illumination, they share limitations such as increased operational cost, limited scalability for large-scale deployment, and persistent challenges in accurately estimating heavily occluded fruits. Behera et al. [
14] employed a Faster R-CNN with a modified Intersection over Union (MIoU) to improve detection accuracy for mangoes, pomegranates, tomatoes, apples, and oranges. Gao et al. [
12] proposed a method for detecting fruits on multiclass plant structures in orchards with fruit wall tree architectures based on Faster R-CNN. In this study, fruits were categorized into four classes according to occlusion conditions relevant to robotic harvesting: non-occluded, leaf-occluded, branch/stem-occluded, and fruit-occluded. Kestur et al. [
7] introduced MangoNet, a CNN-based semantic segmentation model that detects mangoes in RGB images. MacEachern et al. [
15] utilized six YOLO-based models to classify the ripening stages of wild blueberries into three color stages (green, red, and blue) and two maturity levels (unripe and ripe). Zhang et al. [
16] developed a real-time strawberry detection system based on YOLOv4 (tiny) and its customized variant deployed on an embedded device (Jetson Nano). Recently, Xiao et al. [
17] proposed a YOLOv8-based model for detecting the location and ripeness stages of apples and pears. Similarly, Yang et al. [
18] suggested a tomato detection method based on an enhanced YOLOv8 architecture that incorporated depthwise separable convolutions and a dual-path attention gate module.
When using image sequences, fruit tracking across frames can be performed to merge fruit counts from multiple views and avoid double counting [
2,
6,
9,
13]. Häni et al. [
13] employed U-Net for fruit detection and counting, combining affine tracking with incremental structure-from-motion (SfM) to track apples and prevent duplicate counting. Xia et al. [
19] applied CenterNet for fruit detection in sequential images and utilized a patch-matching model based on the Kuhn-Munkres algorithm to eliminate duplicate detections for oranges and apples, thereby estimating fruit yield. Villacrés et al. [
9] experimented with fast R-CNN and YOLOv5 as fruit detection methods, evaluating various tracking and counting techniques, including the Kalman filter, kernelized correlation filter, multihypothesis tracking, simple online real-time tracking (SORT), and DeepSORT.
Steinbrener et al. [
20] applied CNNs pretrained on RGB images to classify hyperspectral images of fruits and vegetables. In real-world outdoor farm environments, a single-sensor modality often fails to provide sufficient information for detecting target fruits due to extensive illumination variation, partial occlusion, and diverse appearances. This underscores the necessity of using multimodal fruit detection systems, where different types of sensors can offer complementary information about various aspects of fruits [
21]. It is also possible to count fruits by utilizing auxiliary channels beyond RGB, although this approach requires additional expensive devices. Zhang et al. [
4] proposed a method for fruit counting and yield estimation mapping by converting RGB images into HSV and Lab color spaces, splitting them into H, S, V, and L *, a *, b * components, and applying the Hough transformation algorithm.
Although previous DL approaches for fruit detection have demonstrated significant success, they share a common limitation: models trained and developed for specific fruit types and conditions cannot be readily extended to different orchards or various fruit species [
1]. These DL models are typically trained on datasets containing single fruit species. Consequently, they face limitations when applied to estimate the fruit load in different orchard environments or with other fruit species. While such specialized models perform exceptionally well in designated tasks, they often encounter challenges when deployed in new scenarios involving diverse orchard conditions or fruit types, highlighting their limited generalization ability [
1].
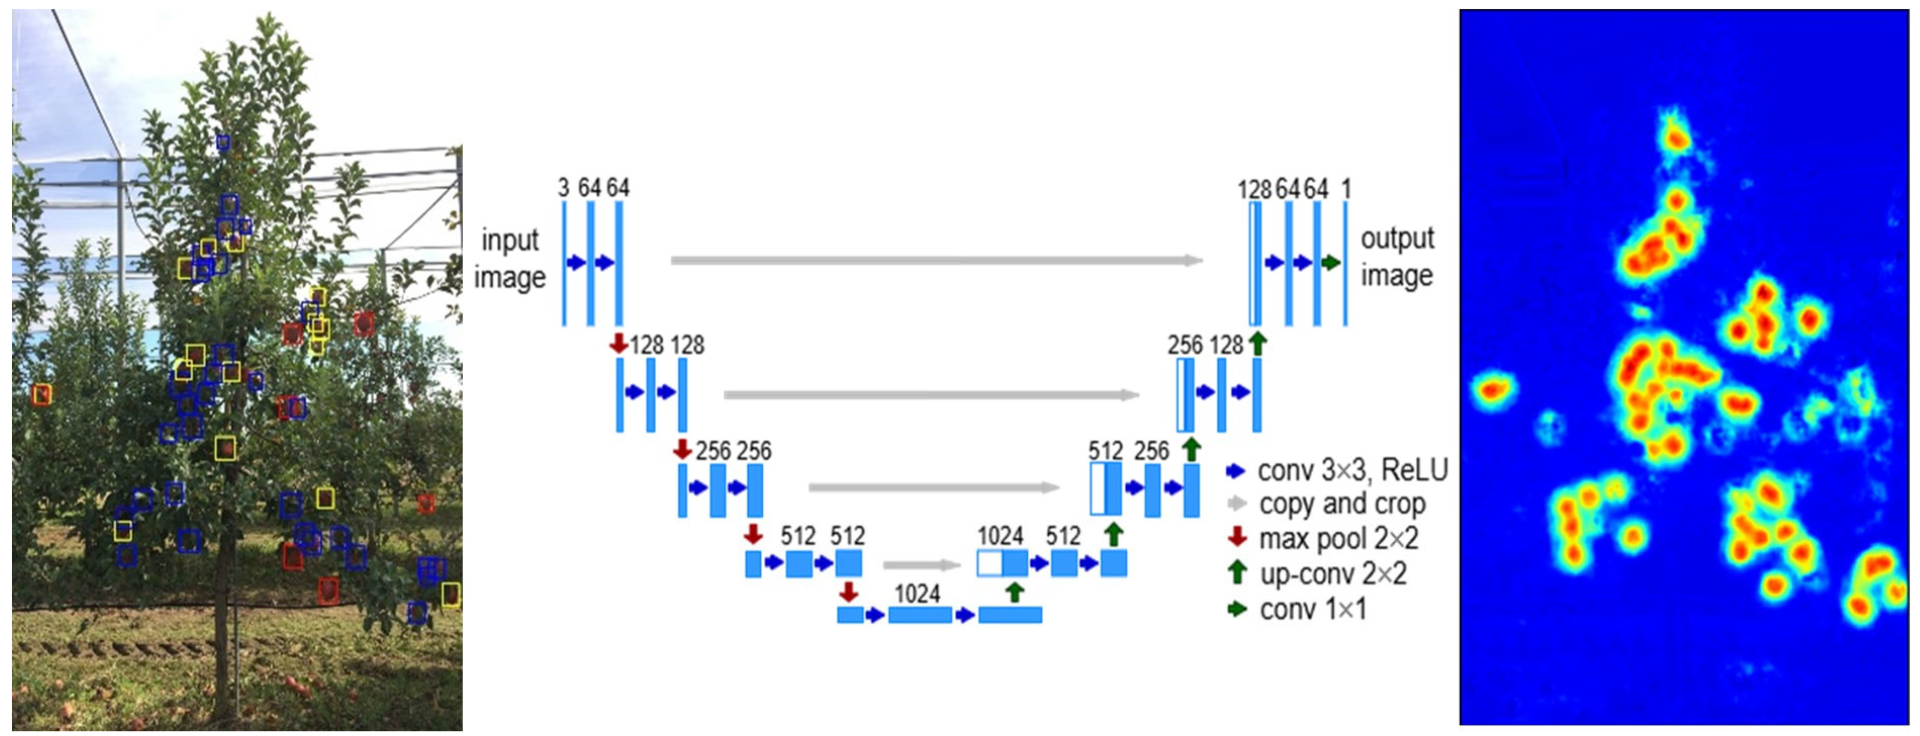
We focused on building a single model using datasets from different orchards and various fruit species to perform multi-species fruit-load estimation. Tree fruit-load estimation relies not on evaluating the total number of fruits per tree but on counting the number of visible fruits in the captured images. To evaluate multi-species fruit-load estimation, we employed YOLOv8, RT-DETR [
22], Faster R-CNN, and U-Net-based heatmap regression (HR) methods. The primary objective of this study was to develop a generalized DL framework for multi-species fruit-load estimation using datasets collected from diverse orchard environments. The secondary objective was to train four representative models—YOLOv8, RT-DETR, Faster R-CNN, and a U-Net-based HR model—on the multi-species fruit dataset MetaFruit. The trained models were evaluated using external test datasets to assess their robustness and generalizability across different fruit species and orchards.
3. Experimental Results
3.1. Dataset and Training Settings
We conducted experiments by splitting the MetaFruit dataset, which consists of 4248 images, into 2718 training images, 680 validation images, and 850 test images. We trained separate models for each fruit category in the MetaFruit dataset and performed comparative experiments. Supplementary testing was conducted using the NIHS-JBNU and Peach datasets. For the U-Net-based RGBH heatmap regression (HR) model, training was implemented using PyTorch 2.5.1 on four NVIDIA GeForce RTX 2080 Ti GPUs, with AdamW as the optimizer, for a total of 50 epochs. The batch size was set to 4, and the loss function used was mean squared error loss (MSELoss). The AdamW optimizer was employed with an initial learning rate of 1 × 10⁻⁴ and a weight decay of 1 × 10⁻⁵. For the U-Net-based RGBH HR model, training was carried out using four-channel input images (R, G, B, and H) with shapes of (4, height, width). The data augmentation pipeline included Gaussian blur, color jittering (adjustments to hue, saturation, brightness, and contrast), and random geometric transformations such as rotation, horizontal flipping, and vertical flipping. All images were normalized using the ImageNet mean and standard deviation values.
For the YOLOv8 model, we used pretrained weights (yolov8s.pt) trained on the COCO dataset and fine-tuned the model on the MetaFruit dataset. The model was trained using the default YOLOv8 configuration with an SGD optimizer, an initial learning rate of 0.01, momentum of 0.937, weight decay of 5 × 10⁻⁴, and a batch size of 16.
Training was conducted for 50 epochs with the input images resized to 640 × 640 pixels. The default YOLOv8 data augmentation pipeline, which includes mosaic augmentation, HSV shifts, scaling, and flipping, was applied. Automatic mixed precision (AMP) was used to accelerate training and reduce memory usage.
Figure 5 shows the learning curves of the YOLOv8 model trained on the MetaFruit dataset. The top row illustrates the training losses, including box regression loss, classification loss, and distribution focal loss, along with the precision and recall trends. The bottom row presents the corresponding validation losses and evaluation metrics, including mAP@0.5 and mAP@[0.5:0.95]. All loss values steadily decreased over the course of training, while the precision, recall, and mAP scores consistently increased, indicating stable convergence and improved detection performance without signs of overfitting.
3.2. Results
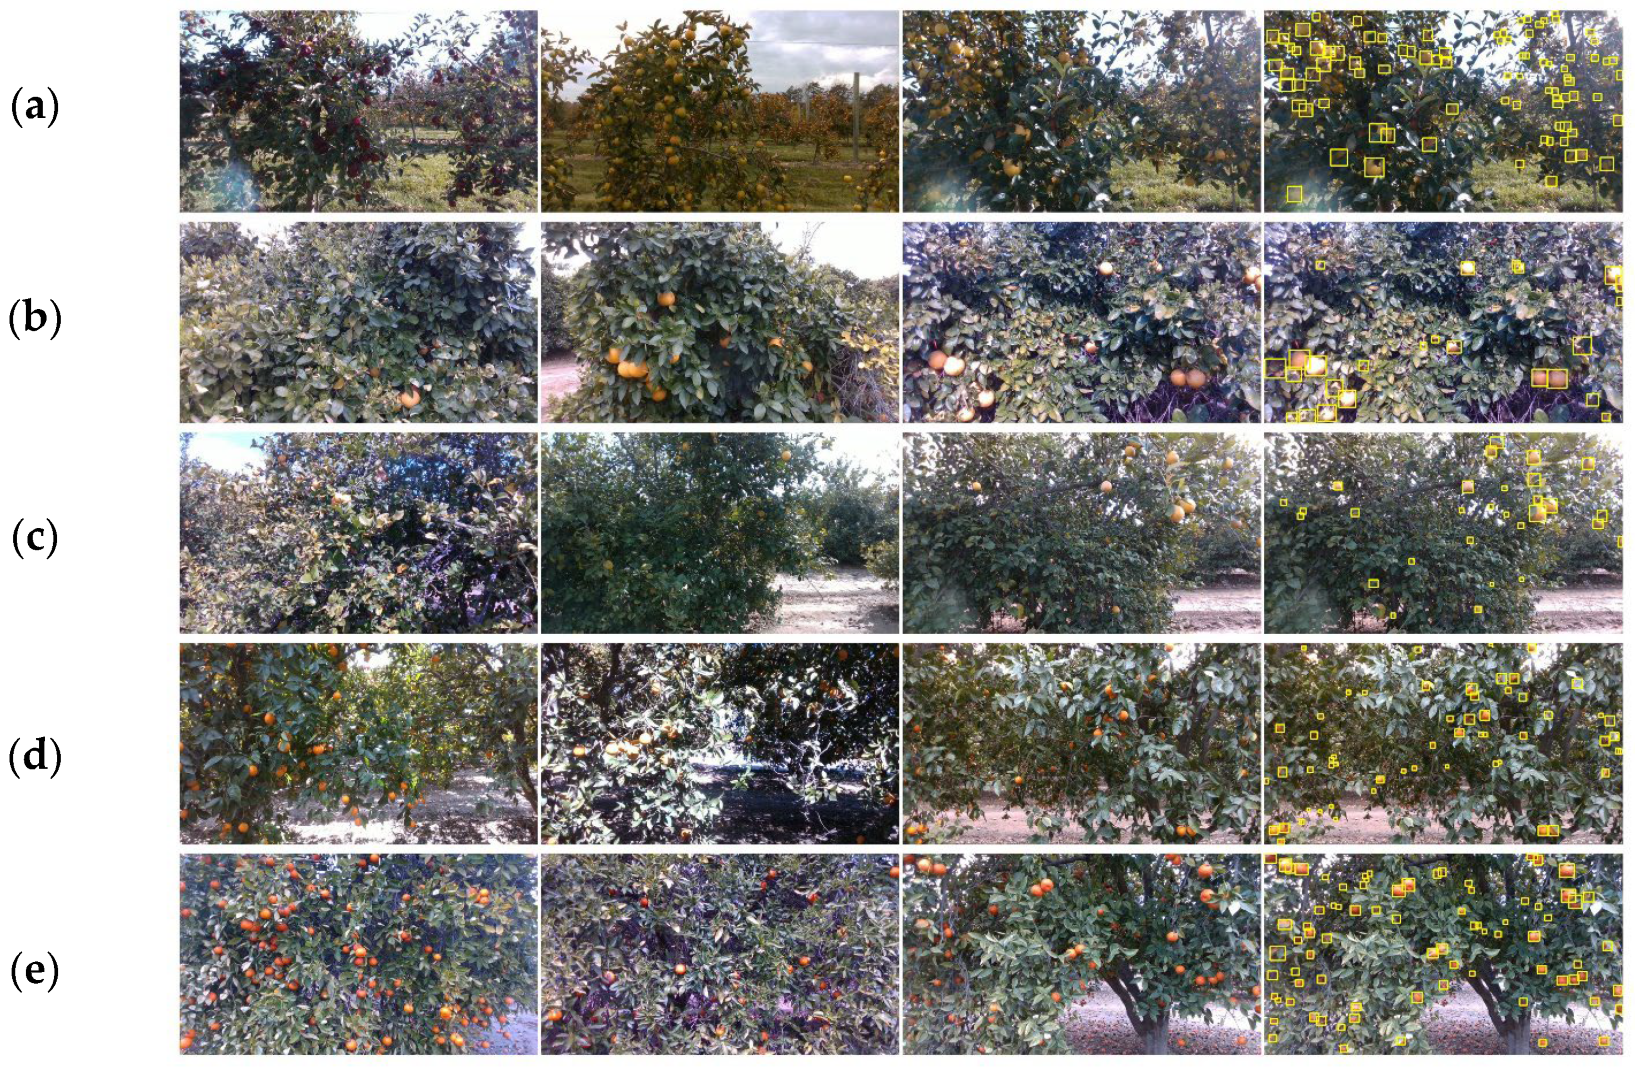
Overall, the MetaFruit dataset exhibited a balanced distribution of apples, oranges, lemons, and tangerines, each with a similar number of images, while grapefruits were represented by 490 images. Tangerines were particularly well represented, with 1062 images and 85,785 labeled instances, resulting in an average of 81 bounding boxes per image. The average number of bounding boxes per image reflects the fruit density captured within the images, while the average instance size provides insights into the physical dimensions of the objects. In particular, smaller instance sizes are associated with increased difficulty in accurate detection. Although the lemon class did not have the highest average number of bounding boxes per image, it had the smallest average instance size.
We used the YOLOv8 model with pretrained weights (yolov8s.pt) from the COCO dataset and fine-tuned it on the MetaFruit dataset. The Faster R-CNN model, based on the architecture of Faster R-CNN with ResNet-50 and FPN, was fine-tuned using COCO-pretrained weights. Similarly, RT-DETR was fine-tuned with COCO-pretrained weights. The U-Net-based heatmap regression model did not utilize any pretrained weights.
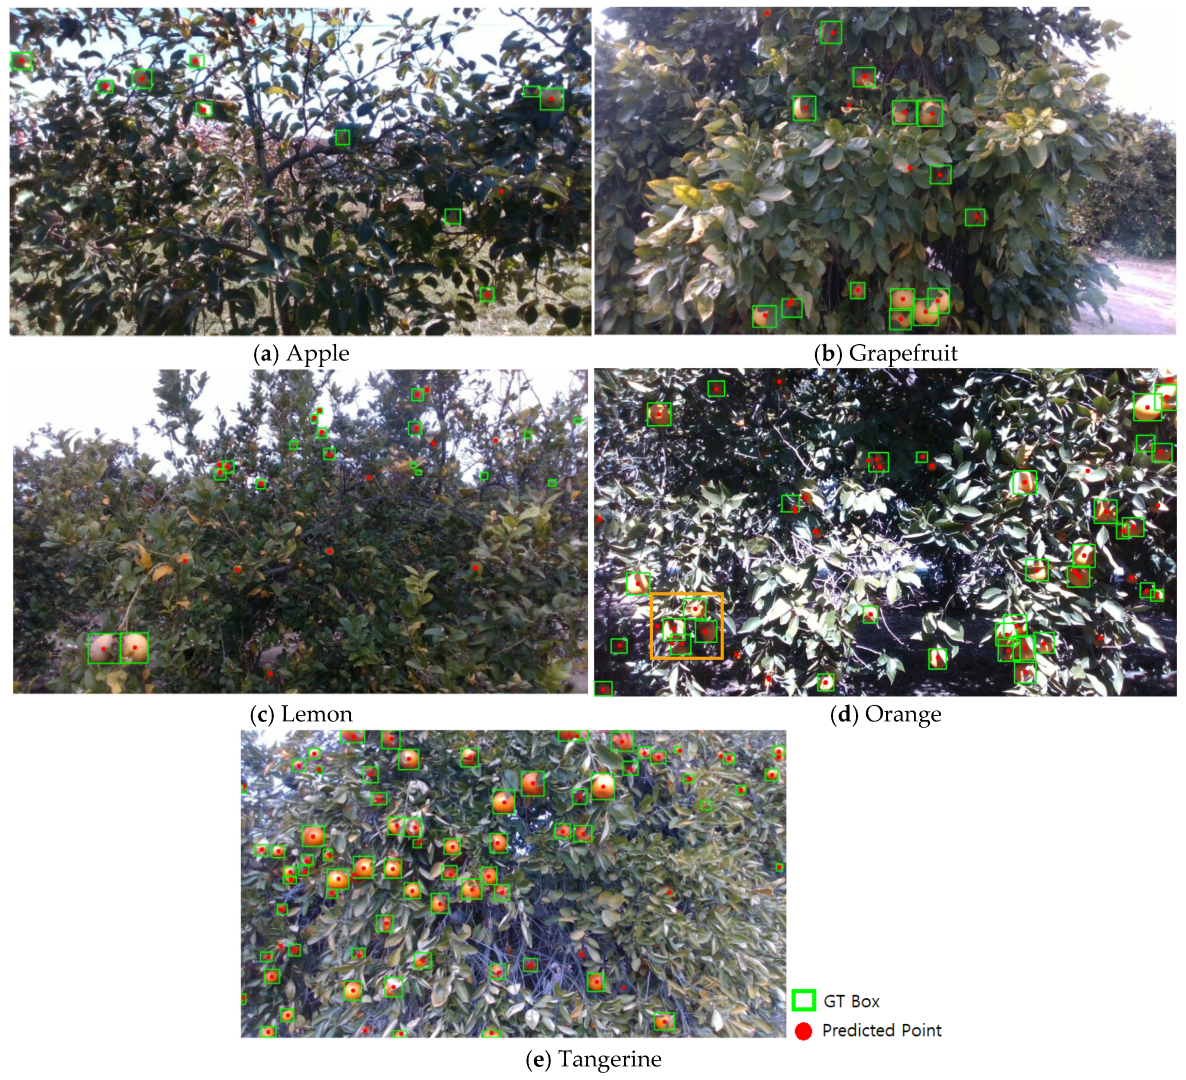
Table 4 presents a comparison of the center-point detection performance of the YOLOv8, RT-DETR, Faster R-CNN, and U-Net-based HR models. Additionally, we experimented with U-Net-based RGB(H, S, HS) heatmap regression models by concatenating the hue (H), saturation (S), and hue and saturation (HS) channels from the HSB color space with RGB channels. Specifically, the U-Net-based RGBH HR model uses the hue channel concatenated with the RGB channels as input. Likewise, the RGBS model incorporates the saturation channel with RGB, while the RGBHS model uses both the hue and saturation channels concatenated with the RGB channels as inputs. To enhance the model’s robustness under varying lighting and background conditions, we extended the RGB input by including the hue and saturation channels from the HSV color space. HSV is known for its resilience to illumination changes and effectiveness in color-based object detection. In particular, the hue channel captures color-specific features that are independent of brightness, enabling better fruit-background separation. Although the average numerical difference was small, the RGBH model demonstrated more consistent and stable detection performance across diverse scenarios, especially in low-light or cluttered environments. The experimental results showed that YOLOv8 achieved the highest F1-score, followed by the U-Net-based RGBH HR model. Among all the models, YOLOv8 achieved the highest F1-score (0.8366), demonstrating a good balance between precision and recall.
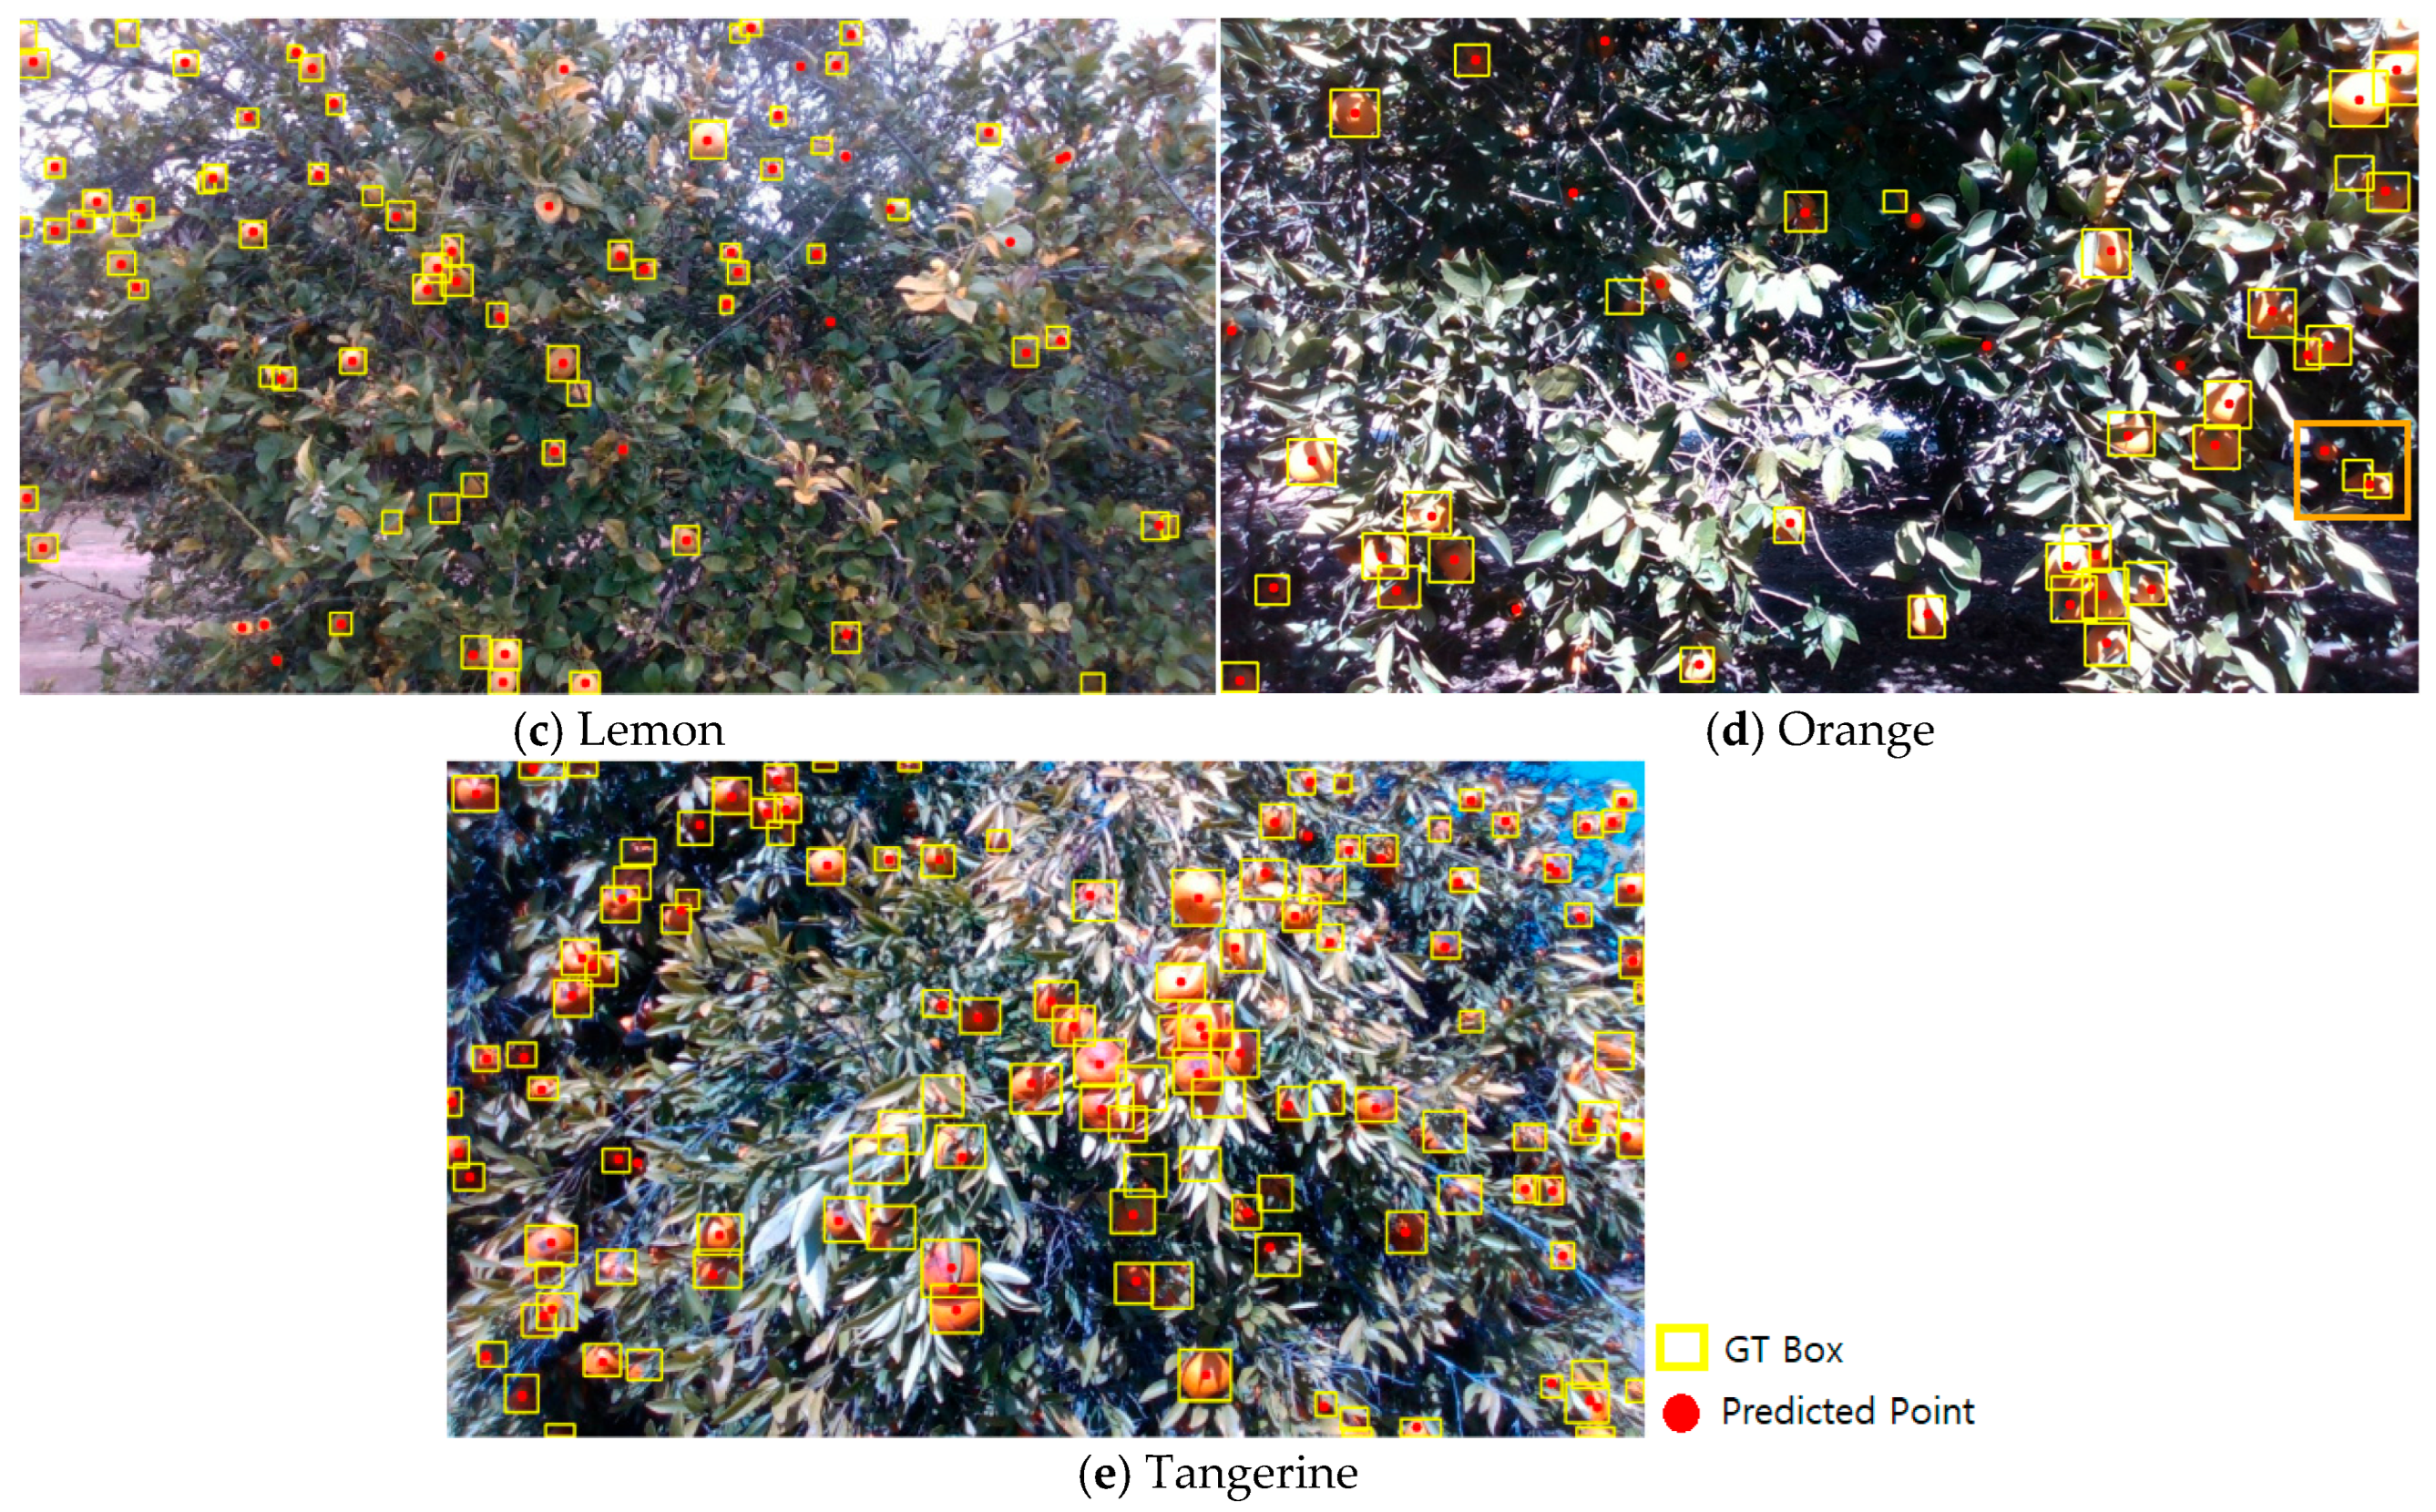
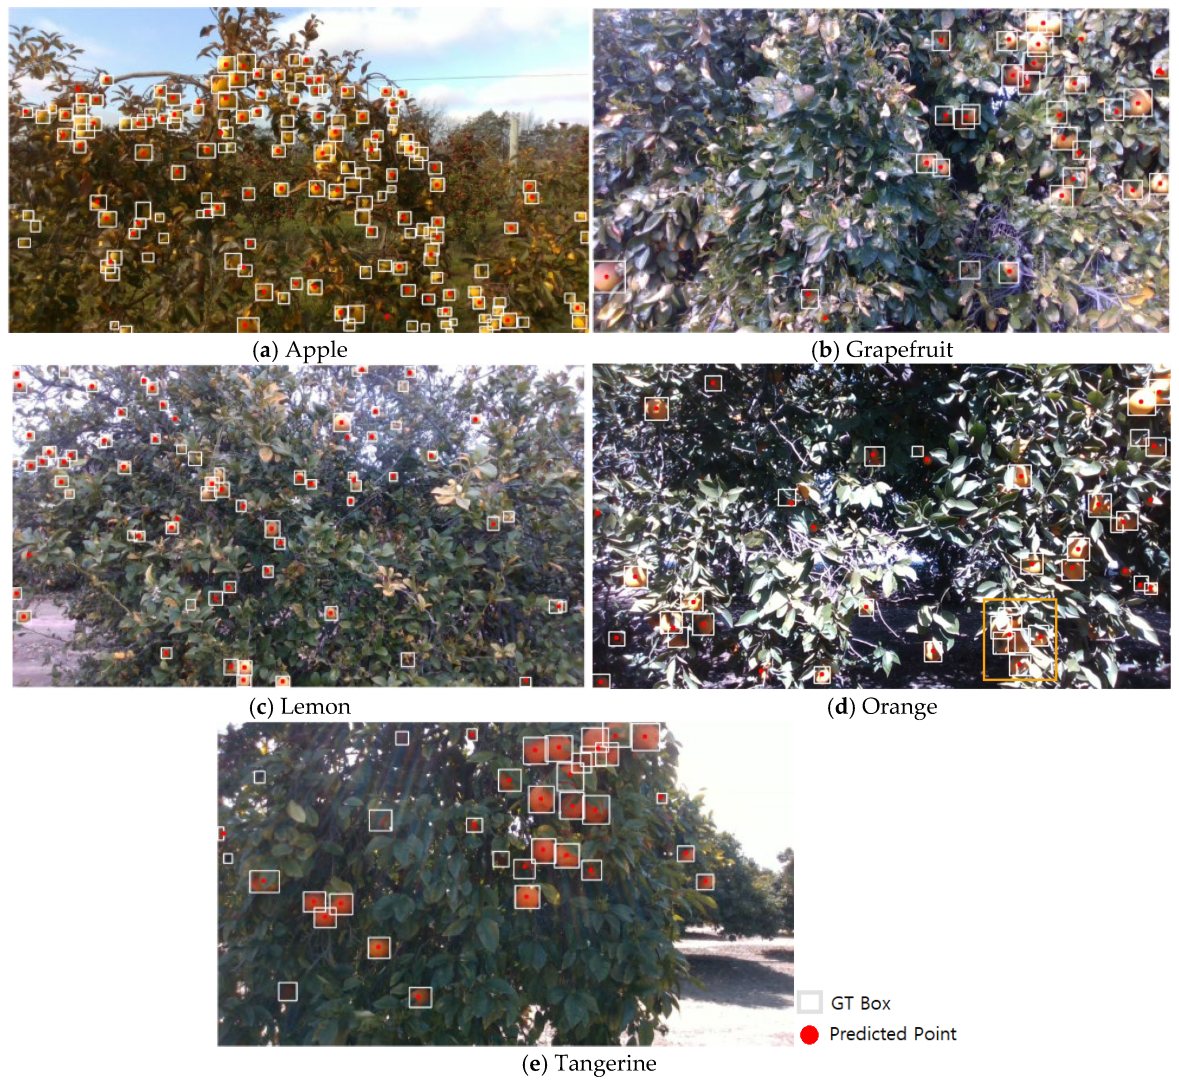
Qualitative examples of fruit center localization results for YOLOv8, RT-DETR, Faster R-CNN, and U-Net-based HR models on the MetaFruit dataset are shown in
Figure 6,
Figure 7,
Figure 8 and
Figure 9.
The orange boxes in
Figure 6d,
Figure 7d,
Figure 8d and
Figure 9d illustrate representative center-point detection failure cases for each model. These highlight model-specific limitations, such as YOLOv8′s poor performance in handling occluded instances, RT-DETR’s sensitivity to small fruits in low-contrast environments, the U-Net-based HR model’s tendency to mislocalize centers in complex scenes, and Faster R-CNN’s difficulty in accurately detecting small or densely clustered fruits due to occluded region proposals.
We created a separate single-species model for each of the five fruits in the MetaFruit dataset—apple, orange, lemon, grapefruit, and tangerine—and evaluated their individual performances.
Table 5 presents the performance of the single-species models trained separately for each fruit in the MetaFruit dataset. The YOLOv8 model consistently achieved high F1-scores across all fruit categories, particularly for tangerines and grapefruits, indicating strong generalization and robustness. In contrast, the U-Net-based RGBH HR models exhibited more variable performances, showing strong results for tangerines but relatively low F1-scores for grapefruits and lemons. A comparison with the dataset statistics in
Table 1 reveals that model performance is significantly affected by both the number of training images and object density (i.e., the average number of boxes per image). Tangerines, with the highest number of instances and image counts, yielded the best F1-scores for both models. Conversely, grapefruits, with the lowest image and instance counts, showed a sharp drop in performance for the U-Net-based model, whereas YOLOv8 maintained high accuracy. Although lemons had a sufficient number of images, their smaller average instance size likely contributed to lower F1-scores, particularly for the U-Net-based model. Overall, these results suggest that YOLOv8 is more robust to class imbalances and sparse data, whereas the U-Net-based model performs better when trained using dense and abundant data.
The NIHHS-JBNU dataset annotates apples based on their visibility in the images. Across 199 orchard images, 13,260 apples were annotated using bounding boxes. Only 21% of the apples were classified as having good visibility, 33% as fair, and 46% as poor, indicating that most apples exhibited limited visibility. The average size of the apple instances was approximately 98 × 97 pixels in images captured with Cam1, and about 74 × 74 pixels in images captured with Cam2. The proportion of single instances relative to the total image area was extremely small, accounting for only 0.048% and 0.069% of the Cam1 and Cam2 images, respectively. This suggests that apples occupy a very small physical area within the images, increasing the difficulty of accurate detection.
The dataset comprised 125 RGB images depicting peach trees bearing fruit, each accompanied by corresponding ground-truth annotations in the form of masks (for instance, segmentation). It also includes 1077 peach fruit objects, with an average of eight peaches per image. There are 80 tree-focused and 45 fruit-bunch-focused images, with averages of 12.0 and 2.7 peach objects per image, respectively. As shown in
Table 6, the center-point detection performance is the lowest for the Peach dataset. This dataset consists of both tree-centered and fruit-bunch-focused images, as illustrated by the peach image example in
Figure 3. Notably, the detection performance was lower for fruit-bunch-focused images.
The YOLOv8 model was trained on a subset of the MetaFruit dataset, which comprises five fruit types. Consequently, its performance decreased when evaluated on external datasets such as NIHHS-JBNU and Peach, which exhibit differences in fruit appearance, background complexity, and environmental conditions. Similar decreases in the F1-score were observed across other models, indicating a general domain gap. We believe this issue can be addressed in future work by training models on more diverse and species-rich datasets to improve generalization to unseen conditions.
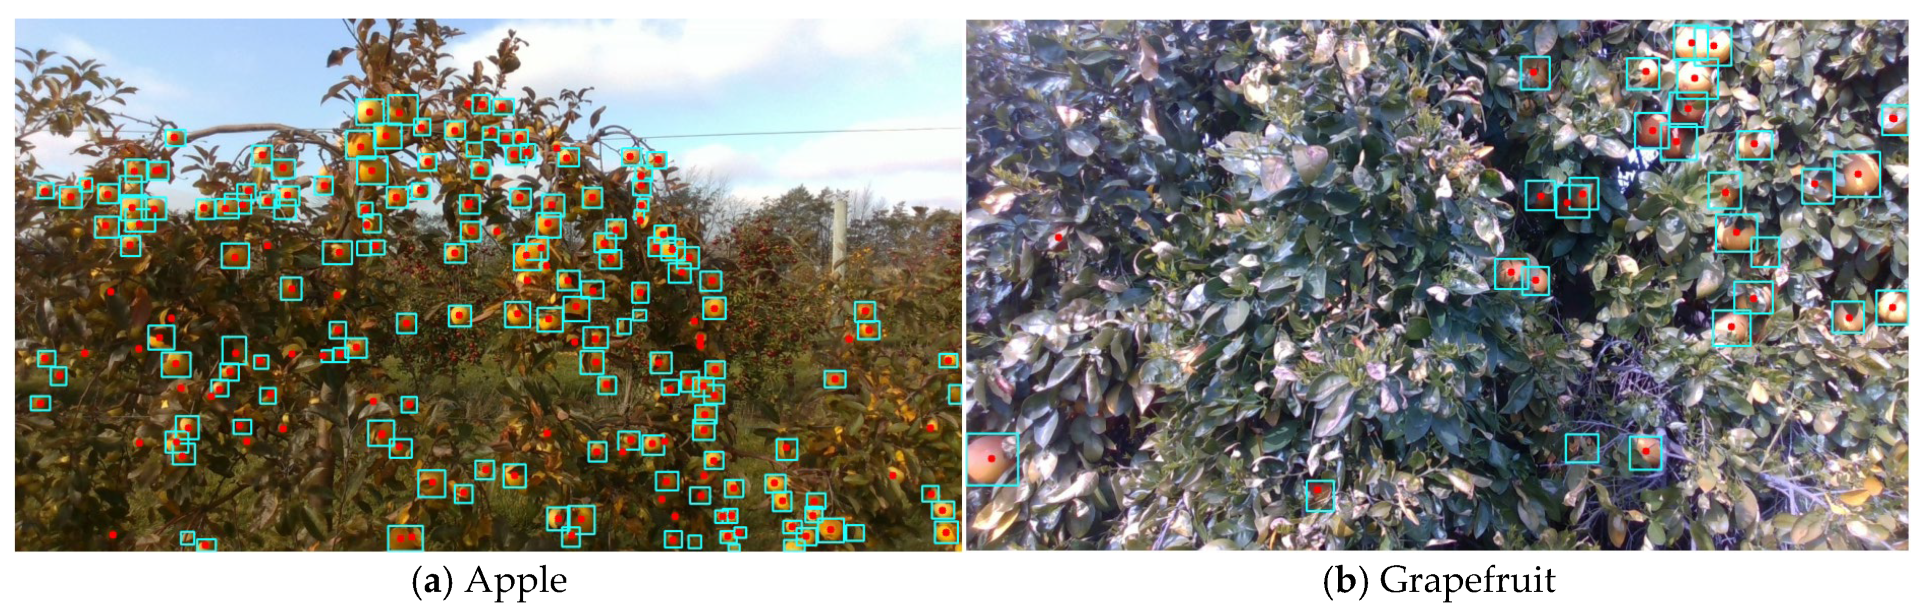
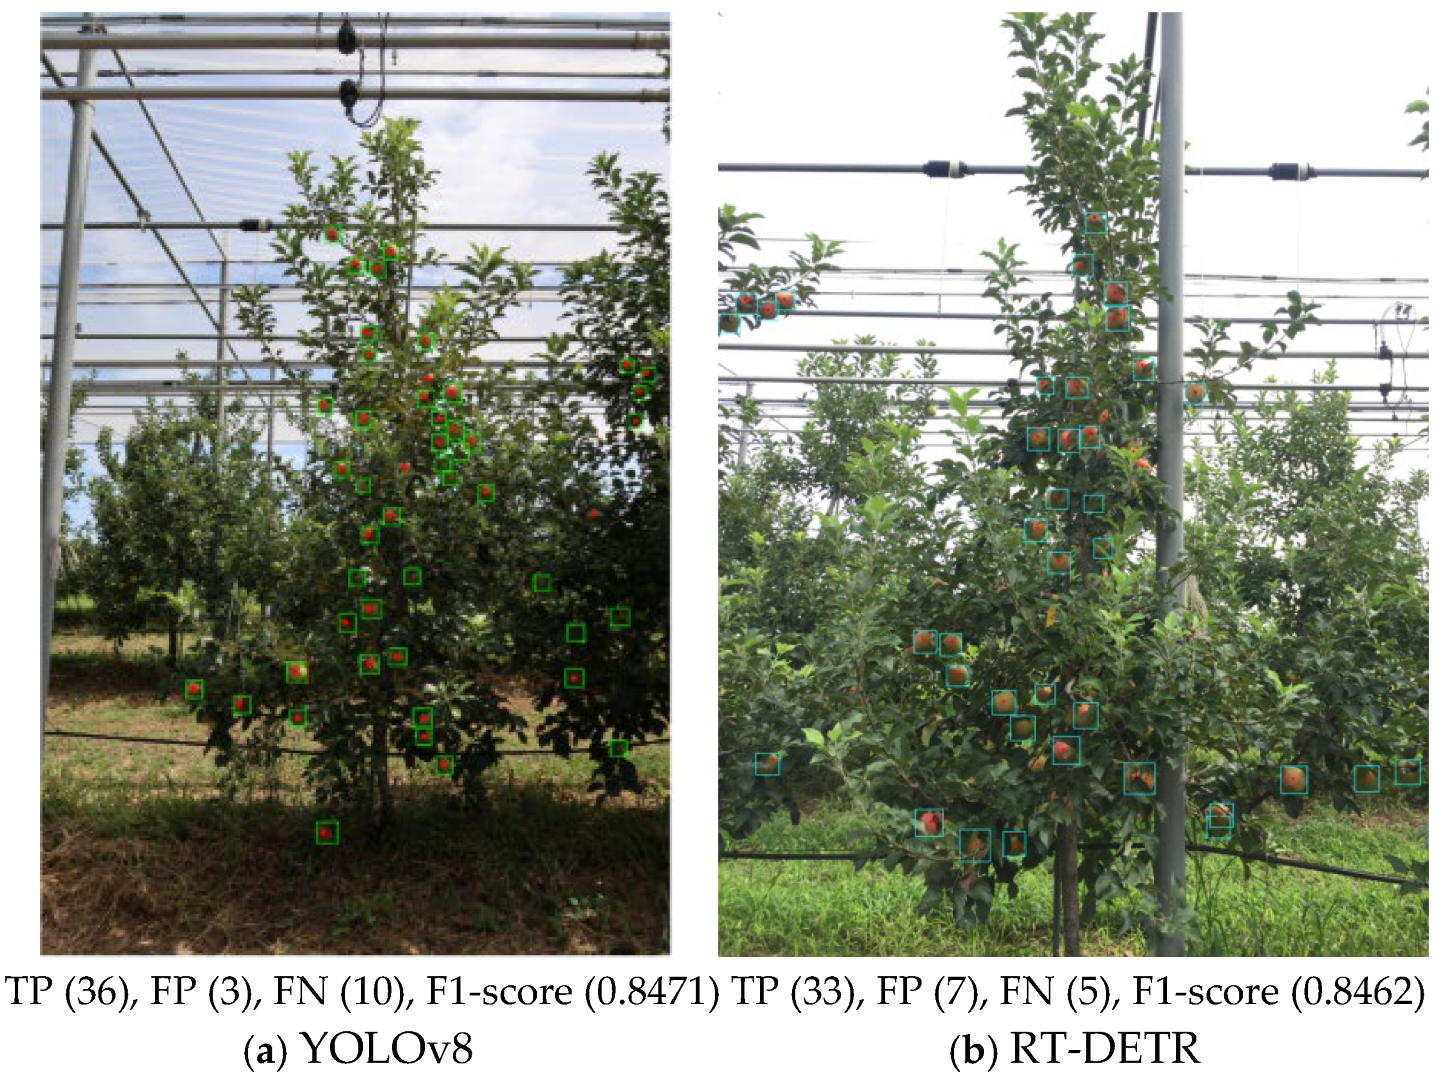
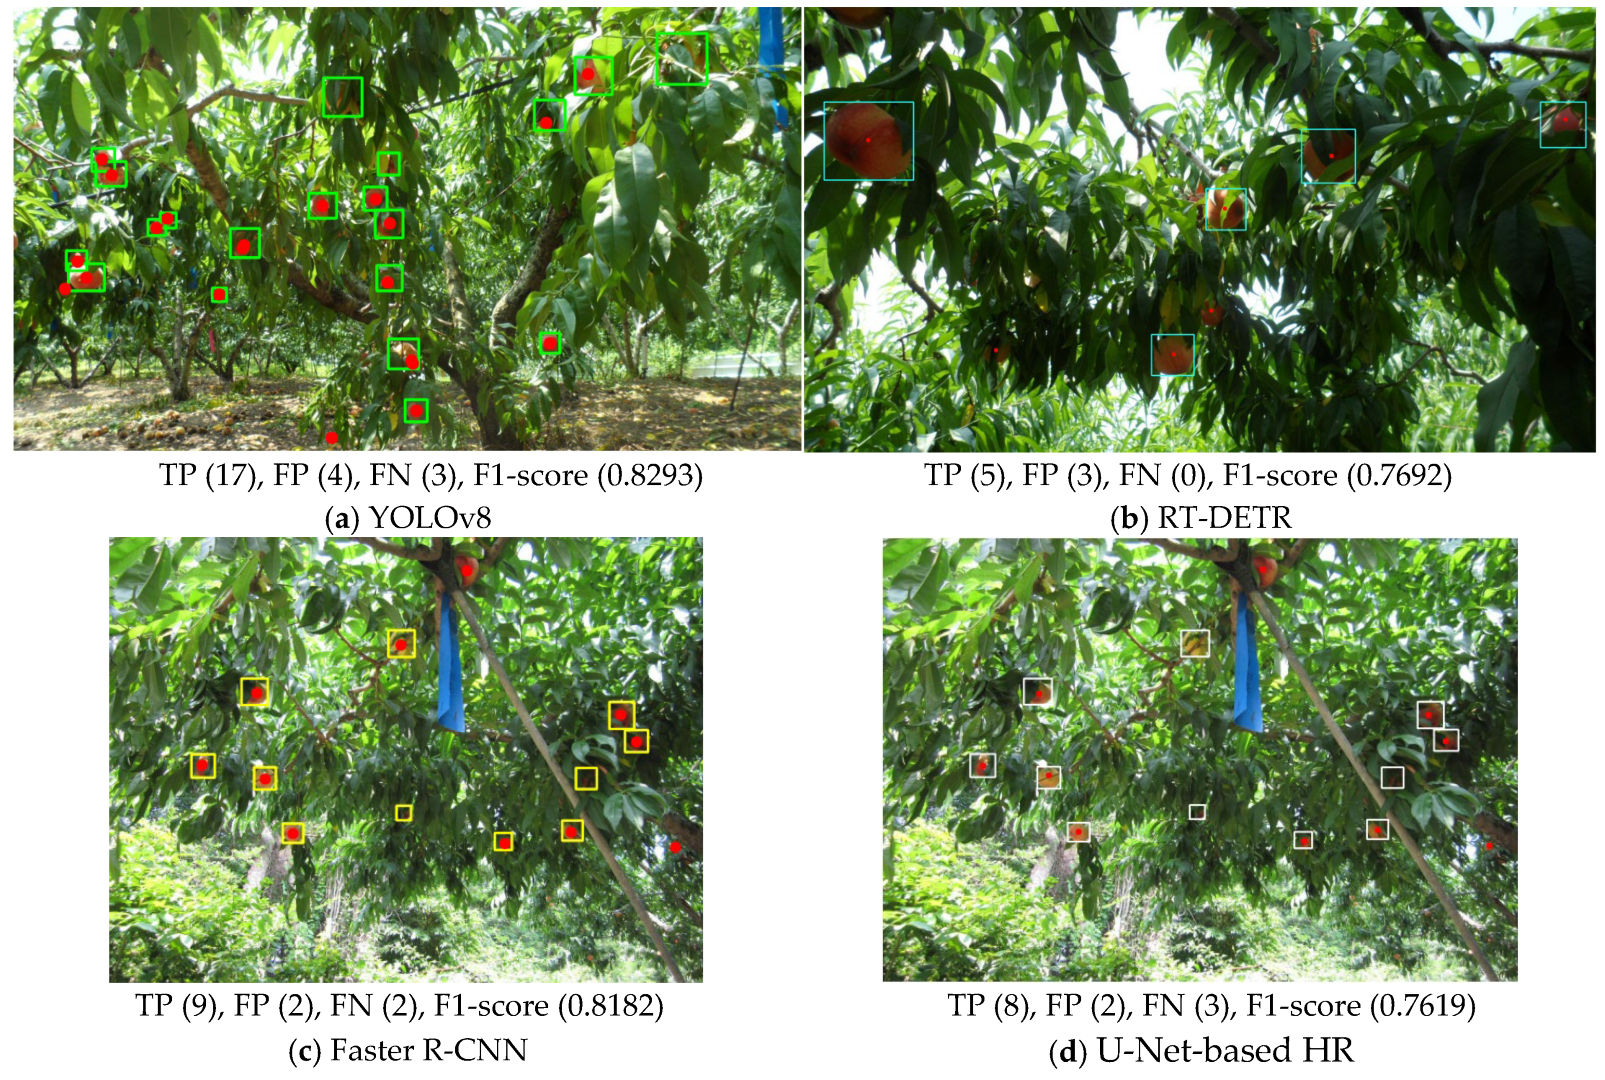
Qualitative examples of fruit center localization results for YOLOv8, RT-DETR, Faster R-CNN, and U-Net-based HR models on the NIHHS-JBNU and Peach datasets are shown in
Figure 10 and
Figure 11. TP, FP, FN, and F1-score are shown below each figure.
4. Discussion
In this study, we evaluated the performance of four DL approaches—YOLOv8, RT-DETR, Faster R-CNN, and U-Net-based heatmap regression—for multi-species fruit-load estimation across diverse orchard environments. The experimental results demonstrated that all models successfully detected and counted fruits with reasonable accuracy. However, each model exhibited distinct strengths and weaknesses depending on the complexity of the orchard environment and the diversity of fruit species. YOLOv8, which features an anchor-free and lightweight architecture, achieved competitive precision and recall while maintaining a high inference speed, making it highly suitable for real-time applications such as robotic harvesting. Specifically, YOLOv8 achieved an average inference time of 0.0119 s per image, compared to 0.0363 s for RT-DETR and 0.0826 s for Faster R-CNN. This performance difference reflects the lightweight, one-stage design of YOLOv8 in contrast to the two-stage detection pipeline of Faster R-CNN, which, while more accurate in complex scenes, is computationally more expensive.
RT-DETR, a real-time transformer-based detector, also achieved strong detection performance with efficient computation due to its encoder-free architecture and lightweight transformer decoder. Although slightly slower than YOLOv8, RT-DETR provided a good balance between accuracy and speed and demonstrated strong generalization across various orchard settings. Faster R-CNN, with its two-stage detection mechanism and robust region proposal strategy, exhibited superior detection accuracy in complex environments characterized by occlusion and high fruit density. U-Net-based HR offers a flexible alternative for localizing fruit centers without requiring traditional bounding-box annotations; however, it shows slightly lower accuracy than detection-based methods, particularly in highly cluttered scenes. This indicates that further research is needed to improve methods for identifying center points from predicted heatmaps.
In cases of heavy occlusion or severe fruit clustering, the RGBH HR and RT-DETR models exhibited superior robustness. HR does not require explicit bounding-box boundaries, enabling better center-point detection of overlapping fruits. Similarly, RT-DETR’s query-based transformer architecture effectively handles partial occlusions and spatial ambiguity by leveraging global context. When fruits are small or densely packed (e.g., tangerines and cherries), RGBH HR offers high spatial precision due to its pixel-level prediction, whereas RT-DETR maintains detection consistency without relying on rigid anchor-based proposals. In contrast, YOLOv8 and Faster R-CNN are more suitable for daytime orchard scenes where the fruits are larger, well-separated, and clearly visible. These models provide fast inference and accurate bounding boxes but are more susceptible to performance degradation in clustered or occluded settings.
Evaluation of the MetaFruit, NIHHS-JBNU, and Peach datasets confirmed that models trained on multi-species datasets can generalize effectively across different fruit types and orchard conditions, validating the potential of integrated DL models for diverse agricultural scenarios. This study had several limitations. First, challenges remain in improving the model’s ability to accurately detect heavily occluded fruits and densely clustered fruit instances while maintaining consistent detection across various fruit growth stages. Second, the model was primarily trained and evaluated using high-resolution RGB images without incorporating additional modalities, such as depth or hyperspectral data, which could potentially enhance performance under occlusion and varying illumination conditions. Third, the evaluation was limited to still images, whereas real-world agricultural environments often require robust detection performance in dynamic or video-based settings.


