Article

Carbon Footprint of Crop Rotation Systems and Mitigation Options for Net Zeroing Greenhouse Gas Balance in Farms of Central Brazil

by
Eduardo Barretto de Figueiredo
Centro de Ciências Agrárias, Departament of Rural Development, Federal University of São Carlos (UFSCar), Rodovia Anhanguera km 174, Araras 13600-970, São Paulo, Brazil
AgriEngineering 2025, 7(8), 258; https://doi.org/10.3390/agriengineering7080258
Submission received: 20 May 2025 / Revised: 23 July 2025 / Accepted: 4 August 2025 / Published: 11 August 2025

Abstract

Different crop production scenarios and crop rotation systems should be investigated with lower greenhouse gas (GHG) intensity levels, with it being possible to reach net-zero GHG emissions from grain production farms. This study was divided into three stages—the development of spreadsheets for data acquisition for each crop rotation, calculations of GHG emissions based on IPCC methodologies and specific regional emission factors, and an analysis of the main emissions and sinks sources we evaluated, including the potential for soil and biomass carbon (C) sequestration to offset agricultural emissions. The system C footprints were 2413, 2209, and 2096 kg CO2eq ha−1 for farms K, M, and G, respectively, demanding estimated C sequestration (soil or biomass) rates of 657, 602, and 571 kg C ha−1 year−1 to offset all emissions of agricultural phases. Mitigating practices can reduce GHG emissions, but compensation via sequestration (soil or biomass C) shall be required to achieve zero GHG emissions. Reserving approximately 10–15% of the farm’s total agricultural production area to plant native trees or eucalyptus in marginal areas or even introducing crop–livestock–forest integration or crop–forest integration systems can offset the GHG emissions of the entire agricultural production phase, considering the potential for soil and biomass C sequestration, showing that it is a feasible option for producing C credit from the agricultural sector.

1. Introduction

The agriculture, forestry, and other land uses (AFOLU, managed land) sector, on average, accounted for 13–21% of global total anthropogenic greenhouse gas (GHG) emissions in the period of 2010–2019 (IPCC, 2022). Overall, the AFOLU sector accounts for 22% of the total global GHG emissions, and in several regions—including Africa, Latin America, and Southeast Asia—it is the single largest emitting sector, which is also significantly affected itself by climate change [1]. At the same time, managed and natural terrestrial ecosystems are carbon sinks, absorbing around one third of anthropogenic CO2 emissions. The estimated anthropogenic net CO2 emissions from AFOLU (based on book-keeping models) resulted in a net source of +5.9 ± 4.1 Gt CO2 yr−1 between 2010 and 2019, with an unclear trend. Based on FAOSTAT and national GHG inventories, the net CO2 emissions from AFOLU were 0.0 to +0.8 Gt CO2 yr−1 over the same period [1].
Food systems are responsible for 31% of global GHG emissions, contributing to global warming being projected to reach 2 °C by 2100. Simultaneously, more than 700 million people experience hunger, driven by the intersecting challenges of food insecurity and climate change. Agreement across scientific disciplines is widespread that food systems transformations for climate mitigation are urgently needed [2]. The global trade of agricultural products more than doubled between 2000 and 2015, rising from USD 600 billion to over USD 1.3 trillion, and it is projected to increase further soon [3]. The increase in the commercialization of Brazilian food, fibers, and biofuels has resulted in increases in GHG emissions reported at all stages of the production chain. In the case of soybean production, these impacts involve the agricultural, transport, and grain processing phases, which are little known in terms of their GHG emissions [4].
The assessment of soybean GHG intensity is complex, and the results can vary widely due to several factors, such as the uncertainty of soil emissions [5] (in particular nitrous oxide (N2O) and carbon dioxide (CO2) emissions) due to land use change [6]; the diversity of soil management practices (e.g., tillage, reduced tillage, no tillage), material inputs, locations, and yields [7]; the different distances and types of soybean transport methods in question [8]; and the contribution of emissions from deforestation associated with a specific crop C footprint.
A long-term temporal analysis of GHG emissions associated with deforestation has not been addressed carefully in previous research studies, since part of the CO2 emitted by humans remains in the atmosphere for centuries to millennia [9]. The adjustment time of CO2 in the atmosphere is determined from the rates of removal of carbon by a range of processes, with time scales ranging from months to hundreds of thousands of years. As a result, 15 to 40% of an emitted CO2 pulse will remain in the atmosphere for longer than 1000 years, 10 to 25% will remain for about ten thousand years, and the rest will be removed over several hundred thousand years [9].
Reducing emissions of CO2—the most important greenhouse gas emitted by human activities—would slow down the rate of increase in the atmospheric CO2 concentration. However, atmospheric concentrations would only begin to decrease when net emissions approach zero and most or all CO2 emitted into the atmosphere each year is removed by natural and human processes [9]. Therefore, GHG emissions from land use change (LUC) and different crop production scenarios and crop rotation systems should be investigated and new crop production scenarios with lower GHG intensity levels should be proposed.
Several protocols and models for calculating GHG emissions and the carbon footprint (Cf) in agriculture and livestock systems have been adopted with different methodologies. The life cycle analysis (LCA) methodology is one of the methodologies applied to quantify the environmental impacts of products or processes from “cradle to grave”. However, LCA results are generally context-dependent and have poor spatial and temporal resolutions [4]. Hence, all methodological and scientific bases developed for the calculations of this study were based on the methodologies compiled, organized, and presented by the Intergovernmental Panel on Climate Change (IPCC), Guidelines for National Greenhouse Gas Inventories [10,11]. Several research methods were developed to adapt and apply the IPCC methodologies [10,11] to estimate emissions, removals, and the C footprint in agricultural systems [12,13,14,15,16].
In 2023, Brazil’s gross GHG emissions were 2.3 billion tons of carbon dioxide equivalent (GtCO2eq), measured in global warming potential according to the 5th Assessment Report (AR5) of the IPCC, from the UN Climate Panel. This represents a 12% reduction compared to 2022, when the country emitted 2.6 billion tons [17]. Emissions from the agricultural sector in Brazil in 2023 were once again, and for the fourth year in a row, the highest in the historical series, surpassing the previous year’s record, with a total of 631.2 million tons of CO2eq (GWP AR5) [17]. This is an increase of 2.2% compared to 2022 (617.8 million tons). Depending on the management practices and production systems adopted, the agricultural sector could be responsible for larger or lower GHG emissions intensity, highlighting that Brazil’s good management practices (ABC, Low Carbon Agriculture Program), has contributed to the increase areas of no-till crop systems, with crop rotations and introduction of trees in integrated systems, where those production areas have become to mitigation systems where soil and biomass C can contribute for the improvement of GHG emission balance and higher crop and animal productivity [18].
The hypothesis of this study is that it is possible to reach a net-zero GHG emission from grains production farms while the objective of this research was to estimate GHG emissions from three commercial production farms of grains in Goias State, central Brazil, based on factual data according to agricultural phase production (inputs consumption and crops productivity). Here we included inside and outside farm-gate emissions, emission from electricity use as well from soybean transported seed processing plant (UBS) for crop season 2020–2021. Finally, based on the emissions profile, it was possible to discuss and propose mitigation practices and alternatives for emission reduction either in the agricultural phase by replacing inputs, or considering soil and biomass C accumulation to zero GHG emission balance.

2. Material and Methods

This study was carried out applying accurate production data from three production farms having contrasting scenarios of crop rotations for soybeans seed production, considering three phases until the UBS (soybean seed processing plant): (a) agricultural (soybean and respective crop rotations systems), (b) soybean transport until the UBS and, (c) UBS. The reference period used was one (01) year crop season (1 October 2020 to 30 September 2021), which can be a first baseline scenario to better understand emission intensity and for further actions to reduce or offset emissions, which is expected worldwide. Data collected for the three farms evaluated, including crop sequence, crop yields, inputs use and detailed field operations, were obtained directly from the administrative sector of each farm, verified multiple times, and documented. Thus, the study sequence was divided into three stages: (01) development of a spreadsheet for the acquisition and organization of primary data related to the productive systems of soybean, respective crop rotations and identification of each GHG emission source and respective gases (CO2, CH4 and N2O) from inputs applied inside the farm-gate and emissions from production processes (industrial phase of inputs) for each farm (Table 1); (02) calculations of GHG emissions were based on IPCC [10,11] methodologies and specific regional and updated emission factors for all emission sources contemplated in the phases described above and, (03) analysis of the main emissions and sinks sources evaluated, including the potential for soil and biomass C sequestration, suggesting mitigating strategies that could be adopted to improve the GHG balance associated with agricultural production phase or even to reach a net-zero GHG emission farm.
The individual data collected for each of the three farms to perform the GHG inventories are presented in Table 2, as well as their respective sources of GHG emissions in stage 1 of the project, emphasizing that the amount of limestone and diesel plus gasoline for administrative sector considered in the estimations were partitioned by the area of each crop in rotation, including fallow (Figure 1).
In the second stage of this study, IPCC updated methodologies [10,11] were applied to estimate GHG emissions. For this, three main gases of the enhanced greenhouse effect, CO2, CH4 and N2O, were considered, adopting the global warming potentials of 1, 25 and 298, respectively, for a time horizon of 100 years in the atmosphere [19]. The emission sources considered in this study are presented in Table 1. To calculate GHG emissions associated with electricity consumption, emission factors from Brazilian national electricity grid were used, with reference year of 1 October 2020 to 30 September 2021, [20] and for diesel and gasoline, national emission factors were applied [21].
The methodology used to calculate N2O emissions from N fertilizer follows IPCC [10,11]. Emission factors used were disaggregated for wet climate conditions, 0.016 kg N2O-N kg−1 N, for direct N2O emissions (EF1), 0.014 kg N2O-N kg−1 N for indirect N2O emissions by volatilization (EF4, Wet climate) and 0.011 kg N2O-N kg−1 N (EF5) for leaching and runoff of applied N [11], with FracGasf (Volatilization from synthetic fertilizer, kg NH3-N+NOx-N kg N applied−1), of 0.15, 0.08, 0.01, 0.05 for urea, ammonium-based, nitrate-based and ammonium-nitrate-based, respectively.
The total N2O emissions associated with N released from crop residues include direct and indirect emissions due to N mineralized from crop residue decomposition [10]. The amount of N from crop residues returned to soil was estimated based on average crop yields (on a dry matter basis), default factors for the ratios of above/below ground residue yield and the N content of the residue returned to the soil [10].
The emission factors applied in this study for the calculation of GHG emissions from the production of nitrogen, phosphorus and potassium fertilizers were 3.97 kg CO2eq kg−1 N, 1.3 kg CO2eq kg−1 P2O5 and 0.71 kg CO2eq kg−1 K2O [22], which correspond to the emission factors used in the EBAMM and GREET models. Estimates of GHG emissions due to the use of fossil fuel in this study assumed CO2, CH4 and N2O gases. The emission factors applied were those suggested by Air Pollution Control Program for Auto Engines)/CETESB-Brazil, in association with IBAMA (Brazilian Institute of the Environment), considering the types of fuel and vehicles. To calculate these emission factors, vehicles were considered as off-road and machinery, with 74,100 kg CO2 TJ−1 (TJ = Terajoule), 4.15 kg CH4 TJ−1 and 28.6 kg N2O TJ−1, respectively. The GHG emissions related to diesel extraction and distribution were considered as 3.87g C MJ−1 per liter of diesel [22].

3. Results and Discussion

Our approach allows to derive the emission profile associated with agricultural systems including soybean and crop rotations for each farm evaluated, as well as to identify the main emission sources along the phases until the soybean seed processing plant (UBS) as a boundary limit, proposing and discussing strategies for replacement of emission sources with lower emission intensity and the potential for soil and biomass C sequestration to offset emissions from crop production and the feasibility to reach a free C farm in central Brazil.
The reduction in GHG emissions through sustainable management of ecosystems is regarded as a key component in strategies for achieving the goal of reducing the effects of global warming, such as increased risk of droughts and flooding [23], whereas agricultural land, forests and wetlands have become increasingly prominent as land-use types that have the potential to store additional C in soils and biomass, thereby decreasing atmospheric CO2 concentration and helping to mitigate climate change [24].

3.1. GHG Emission from Soybean Seed Production

Emission of Soybean Seed Production: Agricultural Phase, Seed Transport and Seed Processing Phase

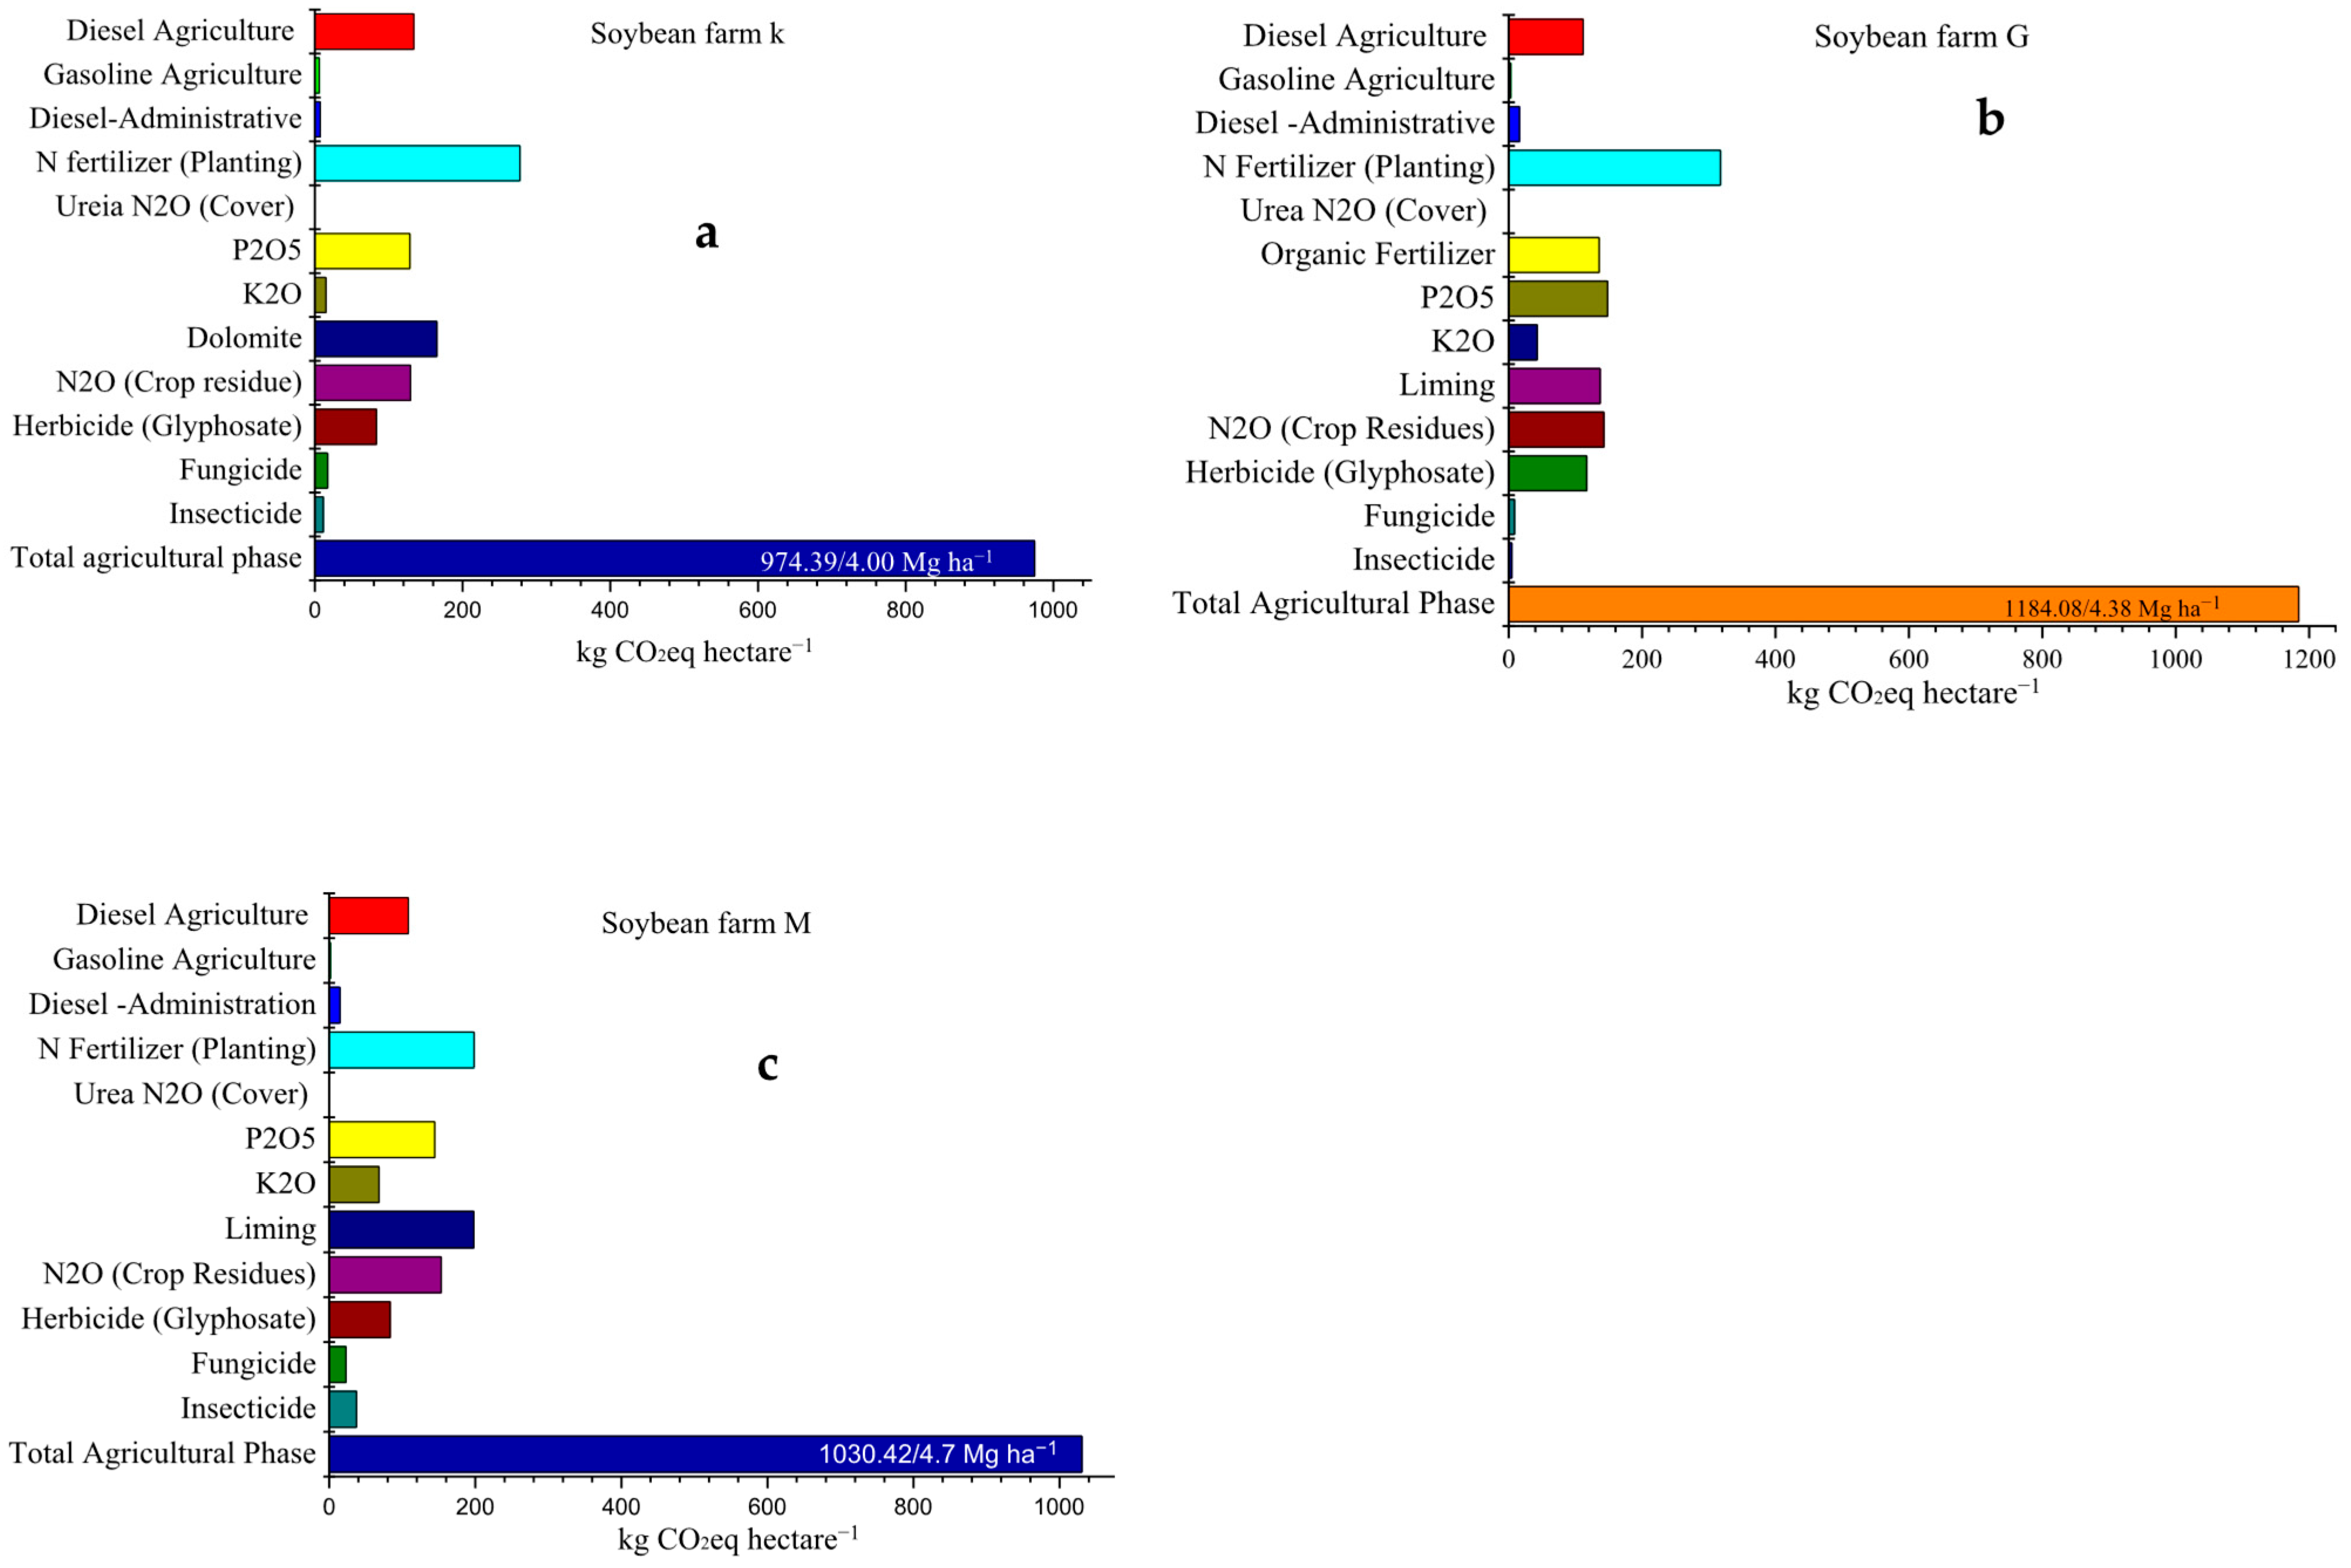
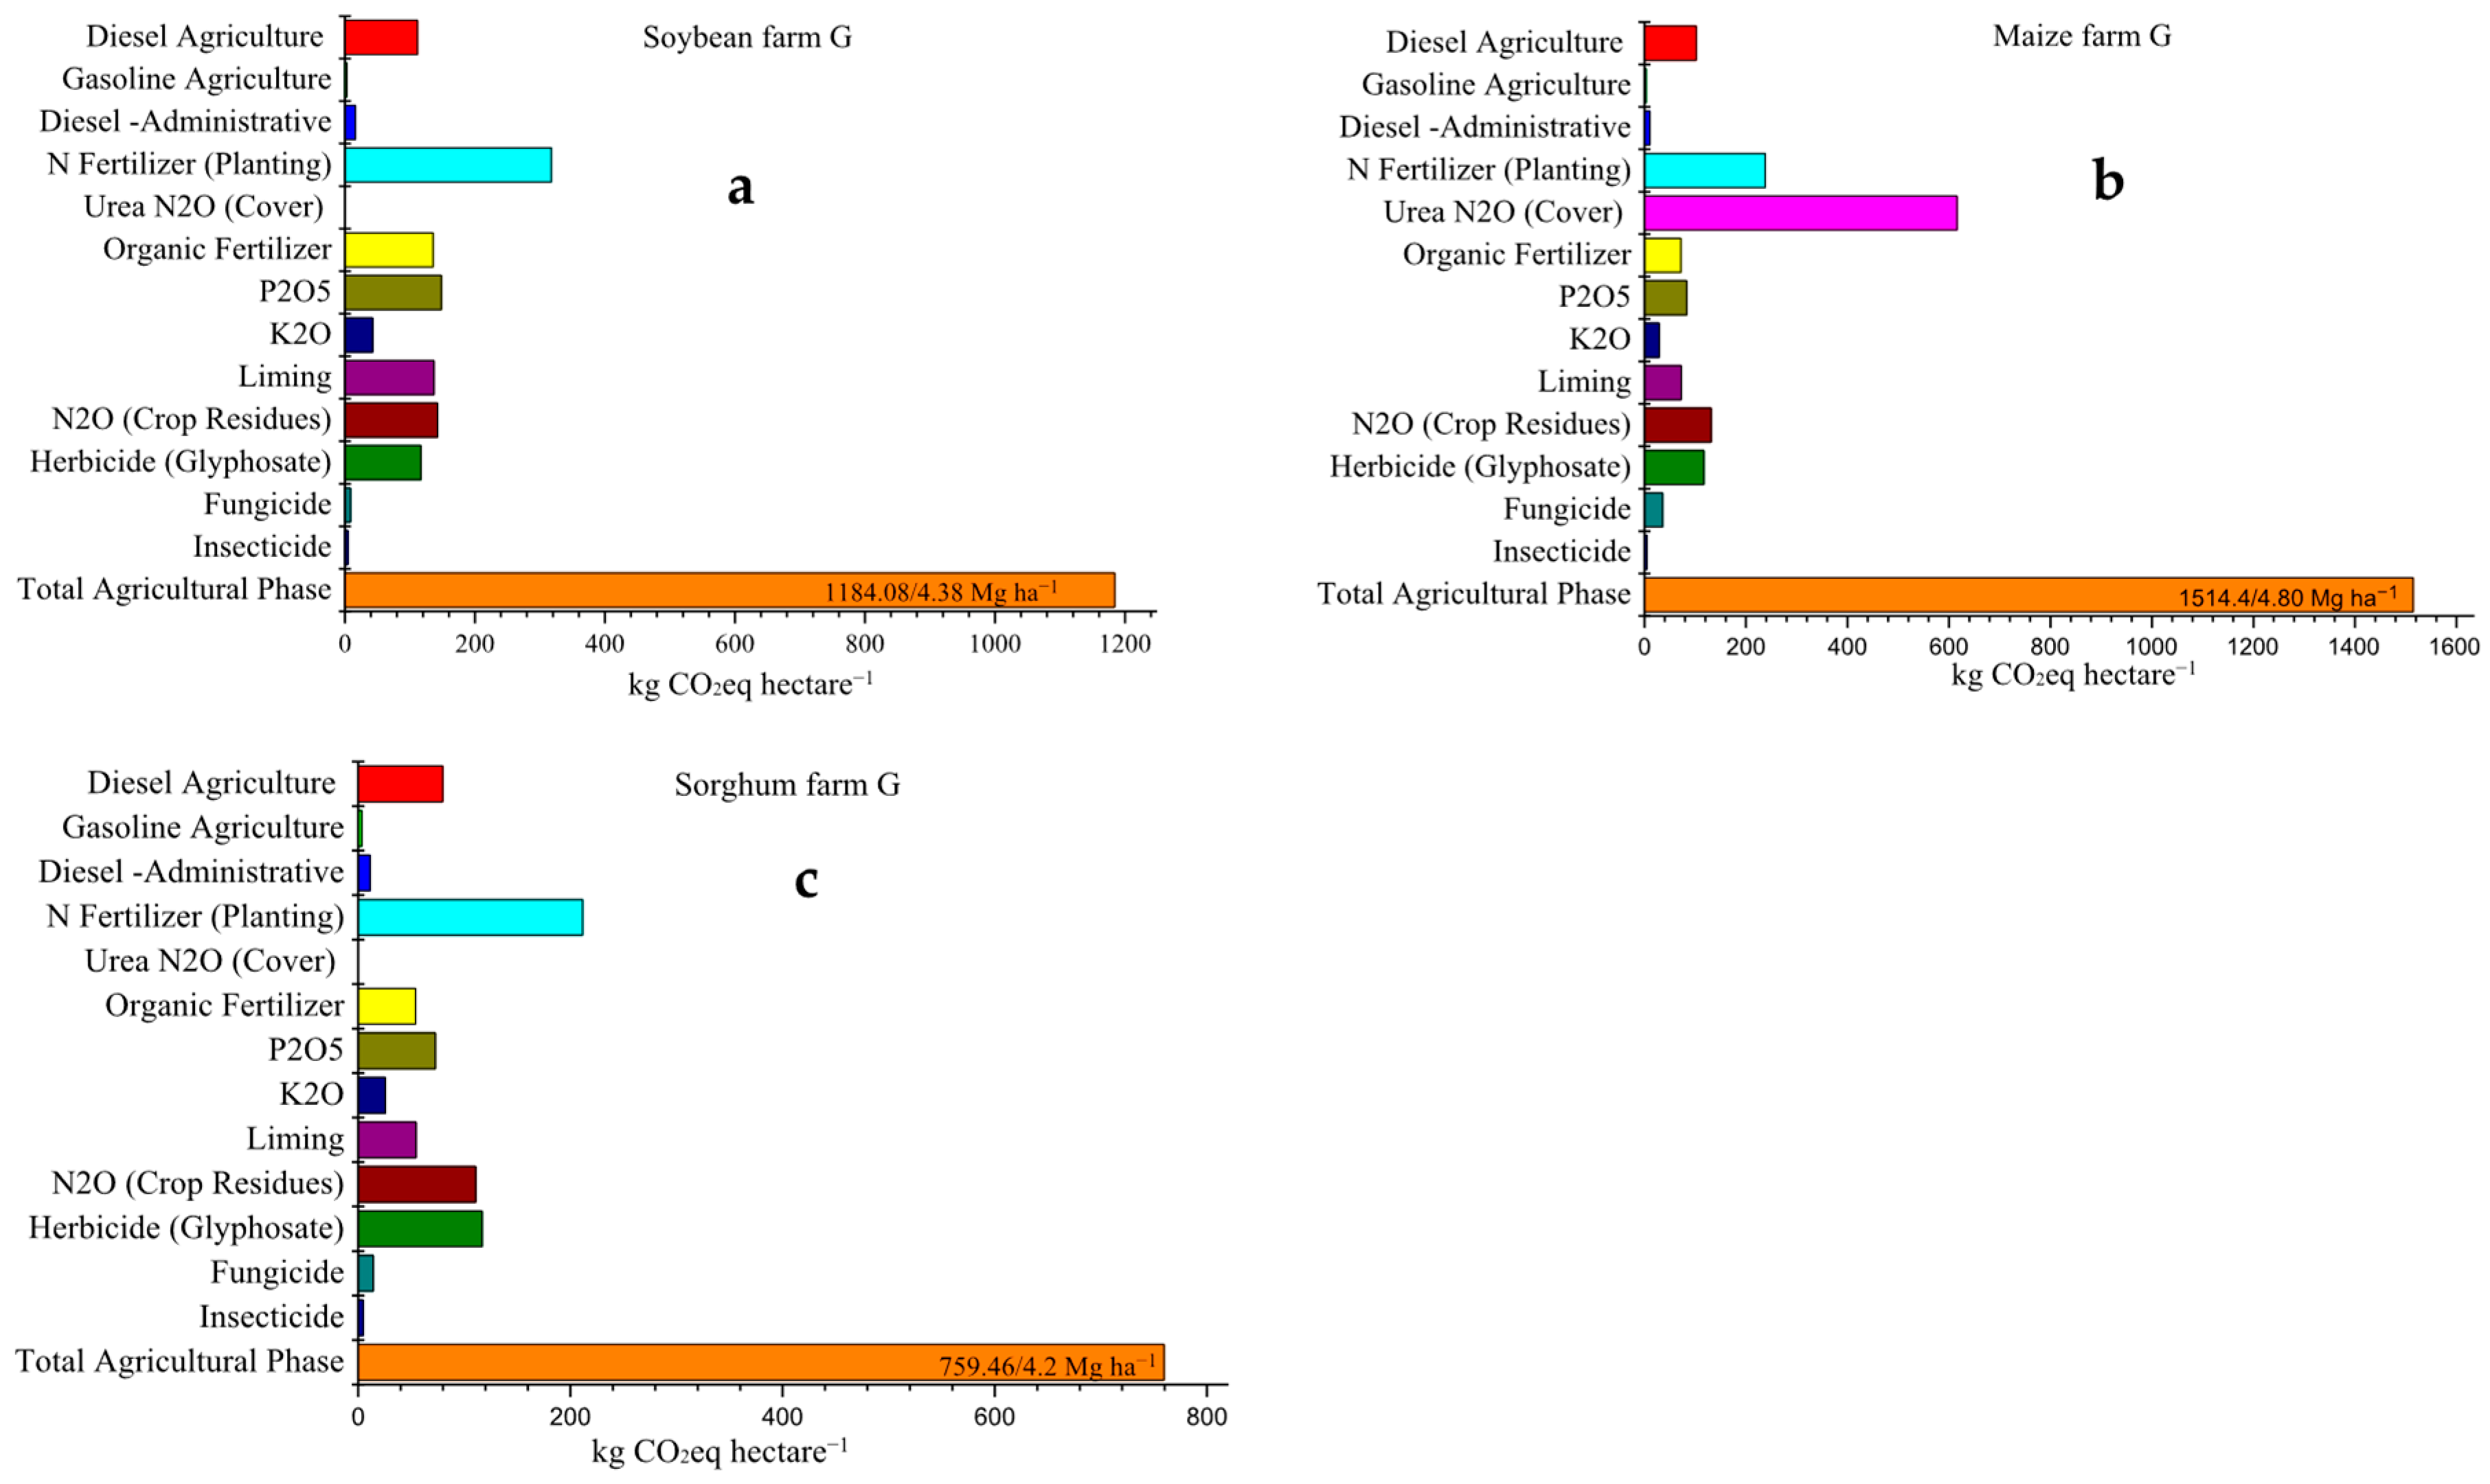
The profiles of each emission source associated with the agricultural phase of soybean production from the three studied farms K, M and G are presented in Figure 2. Similar emission profiles can be observed for the three farms evaluated, with higher emissions associated with the use of N synthetic fertilizers, followed by lime, diesel from agricultural operations and N2O from crop residues, emphasizing that the amount of lime considered in the calculations was allocated by the area of each crop in rotation and considering lime application frequency, including fallow, as well as the consumption of diesel and gasoline for the crop administrative area (Figure 2). On the other hand, the lowest emissions were related to administrative diesel use, K2O fertilizer, fungicides and insecticides (Figure 2), which do not contribute to emissions inside the farmgate during use and application.
The so-called carbon footprint for the agricultural phase related to soybean seed production in those farms is derived by the ratio between total GHG emissions (Mg CO2eq ha−1 year−1) by soybean productivity (Mg of seeds ha−1 year−1). Thus, crop Cf is influenced not only by the quantity and intensity of inputs applied and the specific sequence of crop rotations or fallow periods, but also significantly by soybean (or crop) yield, which is highly sensitive to interannual weather variability and crop management. This highlights the importance of conducting repeated assessments across multiple crop seasons to account for climatic fluctuations and to evaluate the resource use efficiency associated with different crop rotation systems.
Hence, the Cf for soybean seed production from agricultural phase presented in this study showed the lowest value from farm M with 219.2 kg CO2eq Mg−1 of soybean, followed by farm K and G with 243.6 and 269.1 kg CO2eq Mg−1 of soybeans, respectively. This difference from 219 to 270 kg CO2eq Mg−1 (from farm M to G) is related to diesel use and other inputs (e.g., synthetic fertilizers) as well as soybean productivity, which can vary by contrasting farm to farm. We also notice that smaller soybean Cf was observed in farm M, with higher percentage of fallow area, despite its higher soybean yield (4.7 Mg ha−1), observed in comparison with other farms with 4.0 and 4.38 Mg ha−1, from farms K and G, respectively. Additionally, higher intensity of GHG emissions from soybean seed production occurred in the agricultural phase with 93.2% of the total, 1.4% in the transport phase and 14.1% in the UBS for farm K.
Mapping the carbon emissions embodied in soybean exports from Brazil in a metanalysis a study [4] considered emissions from deforestation areas, the agricultural phase of production, domestic and maritime transport of exports, and industrial processing of soybeans, taking into account those emissions related to the use of N, P and K fertilizers, lime and diesel, and the amount of fertilizers based on the average of inputs application for crop. These authors presented values ranging from 130 to 29,470.00 kg CO2eq per Mg of soybean produced, with an average for Brazil of 640 ± 1.40 kg CO2eq per Mg of soybean. For instance, to quantify diesel emissions, authors presented values of average consumption in liters per hectare considered for the states of Goiás, Mato Grosso, Rio Grande do Sul and Santa Catarina states [4], while in our study, we considered the values informed by the farmers (administrative office) in liters per hectare individually for each operation performed in each crop cycle and with a higher level of detail, once each data point has been checked several times directly with administrative office and documented, for each farm.
For emissions related only to the agricultural phase, authors presented literature values for the soybean Cf ranging from 190 to 390 kg of CO2eq per Mg of soybean and values close to 280 kg of CO2eq per Mg of soybeans for the state of Goiás [4], similar values presented in our study for the three farms evaluated and located in the same state, from 219 to 270 kg of CO2eq Mg−1 of soybean. The same authors showed that the European Union (EU) has the highest Cf per unit of imported soybean-eq. (770 kg Mg−1), while China (along with Hong Kong and Taiwan) has a Cf of 670 kg Mg−1.
Applying innovative method for harmonized comparisons of soybean production between farms assessed in different studies, rather than collecting results, another study collected Life Cycle Inventories (LCIs) of 19 studies, 126 farms and then calculated the global warming potential (GWP) of each farm from six countries [25]. These authors showed average country-level GWP from soybean farming ranging from 0.27 to 0.94 kg CO2eq kg−1 of soybean. The map highlights notable differences in the average GWP across key soy-producing countries. The average GWP for farms in Argentina was 0.27 kg CO2eq kg−1, for Brazil was 0.53 kg CO2eq kg−1, for China was 0.64 kg CO2eq kg−1, for the United States was kg CO2eq kg−1, for Italy 1.13 kg CO2eq kg−1, and for Iran 1.53 kg CO2eq kg−1 of soybean, while in our study we found for soybean from three farms 0.22, 0.24 and 0.27 kg CO2eq kg−1 of soybean.
In our study, the Cf associated with the transport phase of soybean seeds were estimated at 3.54; 6.29 and 7.08 kg CO2eq per Mg (of soybean) for farms K, M and G, respectively. This variation is due to different distances from each farm to the UBS (Figure 1) and is directly related to diesel consumption and the trucks’ load capacity.
According to the diesel consumption and soybean transportation data presented by those farms, farm K presented the best efficiency in the transportation of soybean seeds, with 1.11 L of diesel Mg−1 of soybeans transported to the UBS, followed by farm M with 1.97 and farm G with 2.22 L of diesel Mg−1 of soybeans transported. A better analysis and evaluation of these parameters can contribute to improve the operational efficiency of the transport fleet of soybean seeds and could reduce the GHG emissions related with transport phase by increasing the load capacity of the trucks, improvement of related fuel consumption efficiency (liters of a fuel consumed km−1 Mg−1 of soybean transported), or even replacing fossil diesel by another renewable fuel such as biodiesel.
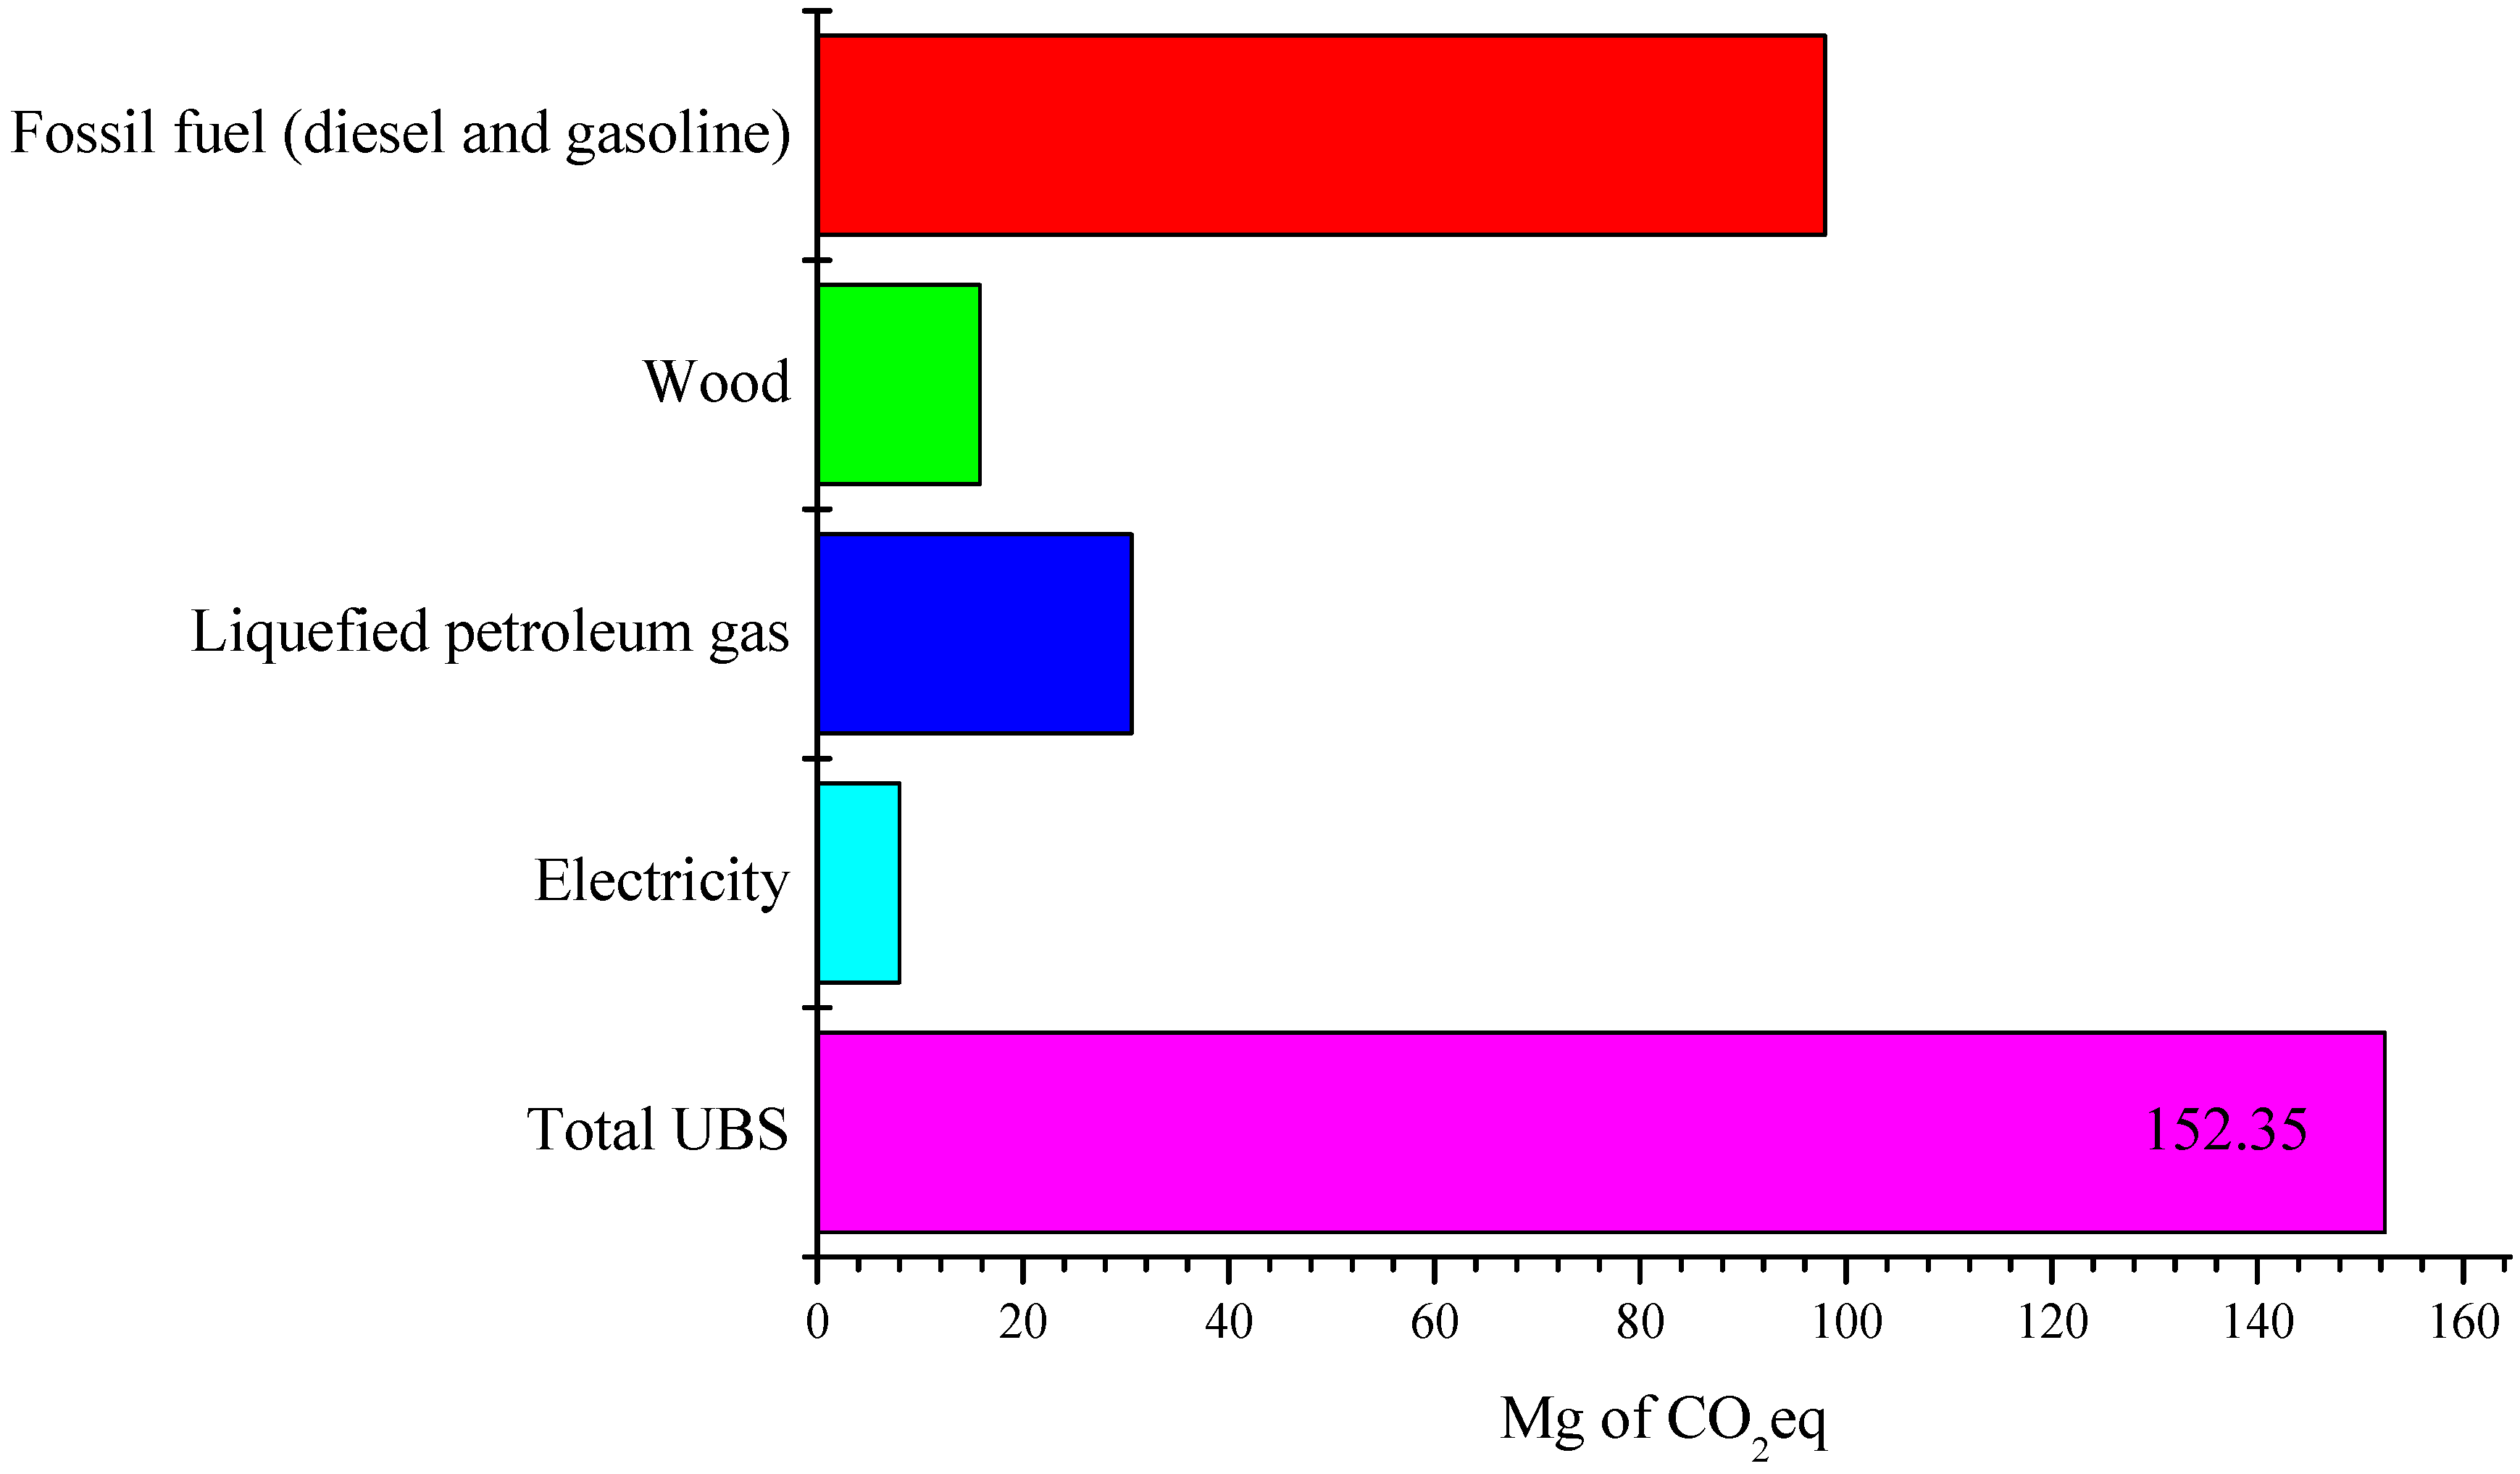
The total volume of processed soybean seeds was 10,800 Mg coming from the three farms in the soybean seed processing phase at the UBS during crop season 2020/2021 evaluated. By splitting the UBS emission sources, we identified that the highest emissions were due to the fossil fuel use for the administrative area and employee transport, which gasoline corresponding to 54% and diesel 46% of total for this phase, respectively (Figure 3). The second-largest emissions at UBS were due to LPG (liquefied petroleum gas) use, for seed drying, followed by firewood and electricity.
Only CH4 and N2O gases were considered in the case of GHG emissions due to the firewood burn for soybean seed drying as those came to renewable wood reforestation and the CO2 emissions are neutral once counterbalanced by photosynthesis cycle. On the other hand, in the case of LPG, emissions of CO2, CH4 and N2O were accounted for, as this is a fossil fuel source. The Cf for the UBS phase for 10,800 Mg of soybean seed processed was 14.1 Mg CO2eq Mg−1 of soybean processed.
Considering UBS emission sources, the lowest emissions were due to the use of electricity for seed drying and storage since Brazilian electricity matrix is relatively clean mostly based on renewable sources (84% of renewables in 2023) [26], when comparing with world matrix with 27% of renewables. Hence, further mitigation in GHG emissions at UBS would be achieved by replacing fossil fuels for renewable fuel like biodiesel or ethanol and even replacing LPG with renewable electricity source as photovoltaic system in the seed drying process.
It is important to emphasize that, considering the three phases for soybean seed processing until the limit of UBS, the agricultural phase corresponds to the largest amount of the total emissions, with 93.2%, in farm K, followed by transport phase with 1.4% and UBS 5.4%.

3.2. GHG Emission and C Footprint of Soybean and Crops in Rotations—The Agricultural System Analysis for Farms K, M and G

Results of GHG emission from these three farms K, M and G evaluated in our study considered GHG emission of agricultural inputs from production phase, transport and emissions from the use of these inputs into the farm-gate.
It is very important to highlight that, for the possibility of soil C sequestration be accounted for reduce or even neutralize GHG emission balance per area basis (ha) from crop production systems, all emissions from all crops in rotation shall be accounted, once the crop residues inputs (C input) as well as related emissions derive not only from one crop but all crops in rotation, which means that it is required to calculate the GHG emission for each crop in rotation or present the system C footprint analysis (kg CO2eq ha−1).
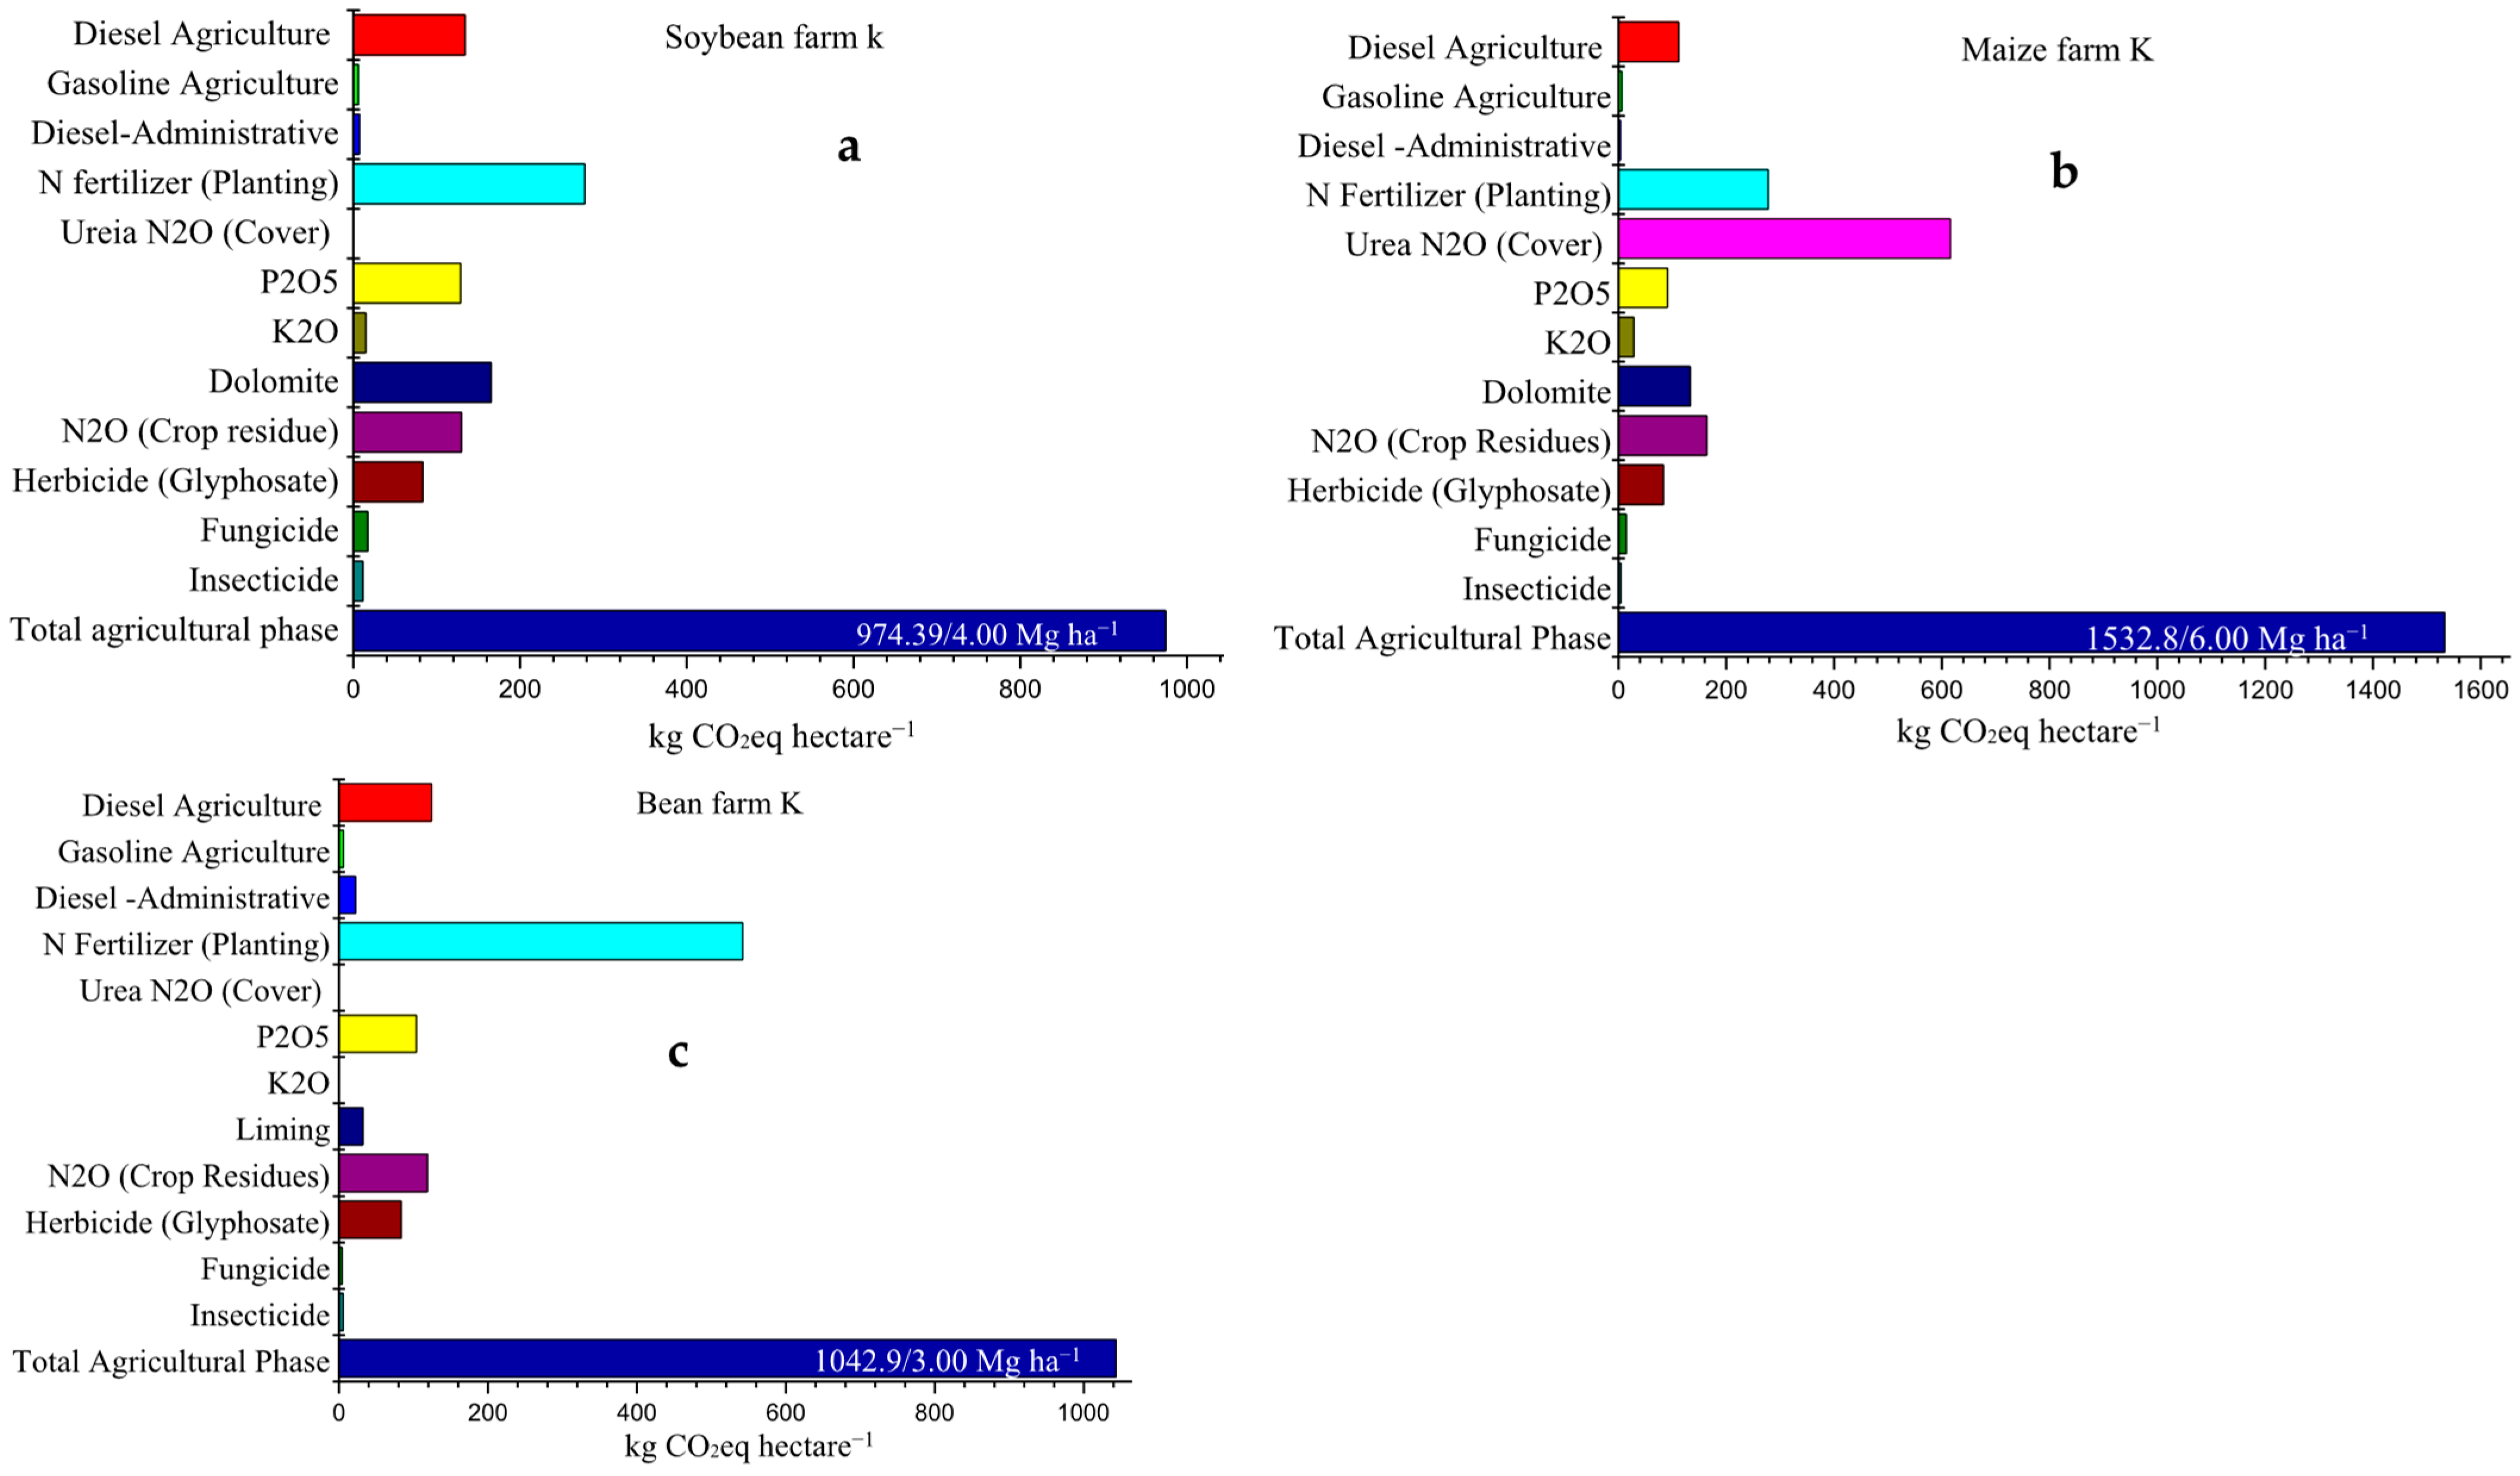
For each of the three farms evaluated in this study, the GHG emissions of the whole agricultural production system were also assessed, considering all crops in rotation and fallow (Figure 1). Figure 4 presents the profile of GHG emissions for farm K, as well as the total emission for agricultural phase for each of the crops in rotation individually: soybean, maize, and bean.
Considering the CO2eq emission per hectare for each agricultural crop, as well as the planted area of soybean and crop rotations in the Farm K scenario, it was possible to estimate the total GHG emission for each crop in rotation per hectare in the agricultural year considered in this study, identifying the contribution of each emission sources and thus, present possible options to reduce related emissions or replace the use of associated supplies (Figure 4).
In the case of Farm K, the system C footprint of 2413 kg CO2eq ha−1 was estimated considering all crops in rotations (01 year), accounting each crop GHG emissions and respective areas growth in the same year-base, i.e., soybean as main crop with 974.4 kg CO2eq × 446 ha, resulting in a total emission of 434,582 kg CO2 eq; bean as second crop with 1042.9 kg CO2eq × 86 ha, resulting a total 89,689 kg CO2eq and maize crop in rotation with 1533 kg CO2eq × 360 ha resulting a total emission of 551,880 kg CO2eq. Thus, the total emission from all crops in rotation (ha basis) was 1,076,151 kg CO2eq for a total area of 446 ha, resulting in a system C footprint of 2413 kg CO2eq ha−1 from K (Figure 5, Table 3).
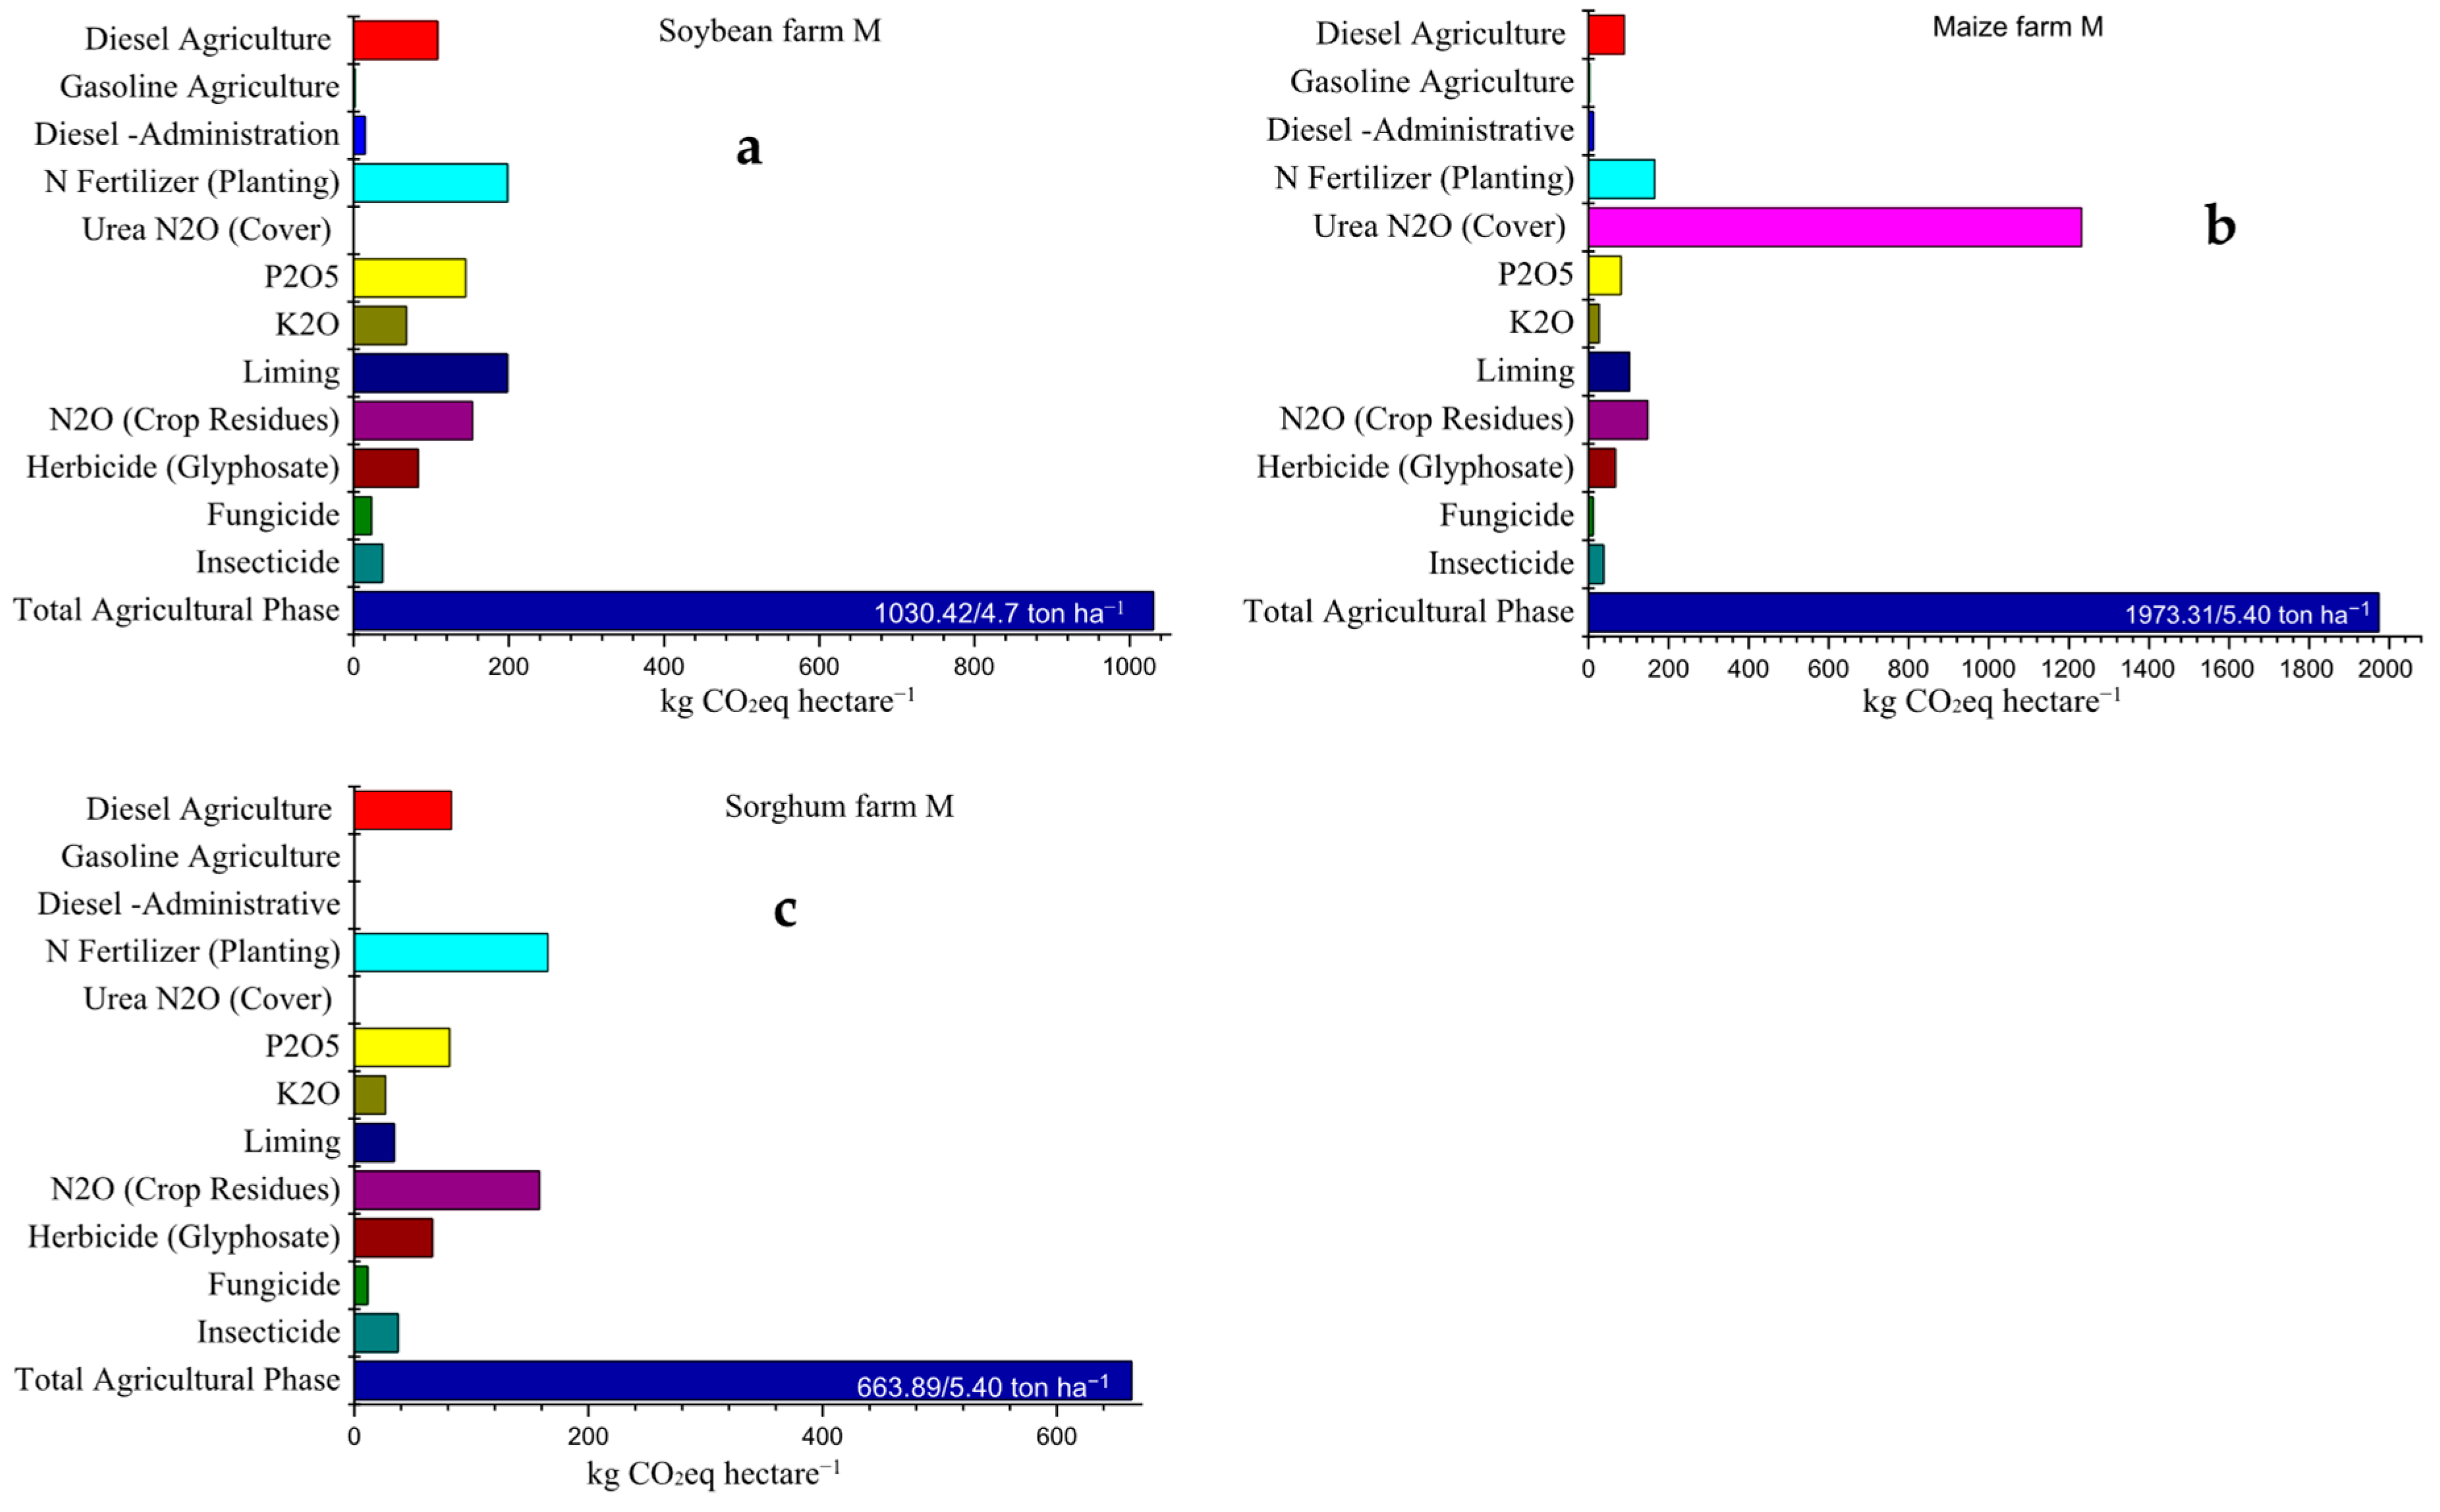
The profile of GHG emissions of each crop and the system C footprint from farms M (Figure 6) and G (Figure 7) were also accounted and, in the same way, it was possible to estimate the total emissions of these farms crop rotation systems with values of 2209 and 2096 kg CO2eq ha−1, for farms M and G, respectively (Figure 5).
For the crop rotation system of farm M with soybean, maize and sorghum, the highest emission per crop was observed for maize with 1973 kg CO2eq ha−1 with crop yield of 5.40 Mg ha−1, resulting a maize Cf of 365.4 kg CO2eq Mg−1 of grain, mainly due the use of urea, followed by soybean crop with 1030 kg CO2eq ha−1, crop yield of 4.70 Mg ha−1 and soybean Cf of 219.2 kg CO2eq Mg−1 of grain (Table 3). Bradyrhizobium spp. inoculation of soybean gives a remarkable economic and environmental advantage to soybean because it results in atmospheric nitrogen (N2) fixation [27], which nitrogen fixation rates in soybean reaching 372 kg ha−1, according to field trails based on 15N isotope analysis [28], which can be a very significant practice to reduce N synthetic fertilizer use and reducing related N2O emissions.
Assessing Cf in China for several crops production using national statistical data, authors showed for soybean 221 kg CO2eq ha−1 and 0.1 kg CO2eq kg−1 of soybean [29], similar values comparing with our study (Table 3), despite average soybean yield in China was considered as 2.22 Mg ha−1, around half of soybean yield in our three farms with 4.00, 4.70 and 4.40 Mg ha−1. For maize Cf, the same authors presented 781 kg CO2eq ha−1 and 0.12 kg CO2eq kg−1 [29], lower Cf values comparing with our study for maize with 0.255, 0.365 and 0.315 for farms K, M and G, respectively; in this case, lower maize yield in our study (6000, 5400 and 4800 kg ha−1) can explain its higher Cf once maize crop was planted as second crop in the same crop season after main soybean crop.
Among all crops evaluated (soybean, maize, sorghum and bean) for farms K, M and G, the highest GHG emissions were observed for maize planting in farm M with 1973 kg CO2eq ha−1 year−1, followed by farms K and G with 1533 and 1514 kg CO2eq ha−1 year−1, respectively (Table 3). Observing the profile of maize emissions from the three farms evaluated (Figure 4, Figure 6 and Figure 7), we can note that higher emissions in all three farms were related to N synthetic fertilizers application, mainly urea application during cover fertilization phase. Azospirillum spp. application to promote plant growth in maize, improve biological nitrogen fixation (BNF), root development by the synthesis of phytohormones, and enhancement of membrane activity. Inoculation trials were initially set to supply a starter dose (at planting) of 24 kg ha−1 of N, reaching yields of 4000 kg ha−1 in maize crops. In addition to N starter, inoculation with Azospirillum brasilense supplying 45 kg ha−1 of N as cover fertilization resulted in yields of 6000 kg ha−1, increasing to 8000 kg ha−1 after the application of 67.5 kg ha−1 of N as cover fertilization [30], being a very important strategy to be improved, supporting a reduction in N use from synthetic fertilizers in maize crop and related N2O emissions.
In the case of crop rotation for farm G with a sequence of soybean, maize and sorghum, higher GHG emission per crop was also observed to maize with 1514.4 kg CO2eq ha−1, and a Cf of 315.5 kg CO2eq Mg−1 of grain (Table 3), also due to the high use of N synthetic fertilizer as urea and ammonium sulfate sources (Figure 7).
Lower GHG emission from farm G crop rotation system was observed for sorghum crop with 759.5 kg CO2eq ha−1, and lower Cf of 180.9 kg CO2eq Mg−1 of grain (Table 3), being the crop that showed the lowest GHG emission and related crop Cf from farms M and G, probably due to the lower use of inputs as N fertilizers, despite higher use of diesel and herbicides (Figure 7).

4. GHG Mitigation Options for Soybean and Respective Crop Rotations

4.1. Emission Reduction from Fertilizers Use

Considering farm K and all three crops in rotation, an amount of 21, 66 and 41 kg N ha−1 for soybean, maize and bean, respectively was applied as synthetic fertilizer source. Some options are possible and could be suggested to reduce the GHG balance in soybean and crop rotation systems. According to data informed by the company, a total annual amount of 128, 102 and 178 kg ha−1 of N, P and K was applied for the three crops in rotation for farm K in one year crop cycle (soybean, maize and bean).
A first possibility would be the replacement of synthetic fertilizers used in the agricultural phase by bovine or poultry manure. Therefore, our estimates show that to replace the total N from synthetic fertilizer used in theses crops during the one-year period of the project (128 kg N), it would be necessary to apply 8.5 Mgs of bovine manure (1.5% N), providing to the soil the same amount of 128 kg of N, 102 kg of P2O5 (1.2%) and 170 kg of K2O (2%).
Also considering estimates for additional GHG emission from diesel, transport and application of bovine manure in the field (8.5 Mg), as well as its N2O emission to replace synthetic fertilizers application, it would be possible to reduce the system C footprint of farm K from 2413 to 1884 kg CO2eq ha−1, mainly based on offsetting emission of N synthetic fertilizers production and transport phase. Thus, there would be a reduction in the need to sequester-offset C in the soil or even from biomass C from trees to neutralize emissions from the agricultural system in farm K from 658 (2413/44 × 12) to 513 (1884/44 × 12) kg C ha−1 year−1. Another study [29] showed that, for wheat, maize and soybean, N fertilizer contributed 0.80, 0.81 and 0.74, respectively, to the total Cf and, if use of N fertilizers was reduced by 30%, the corresponding reduction in Cf could be 6.53, 24.34 and 25.52% for rice, wheat and maize production, respectively.
Once, manure from animal production to replace synthetic fertilizers is not available near crop production areas, or not economically feasible to be applied in large areas, a second mitigation option to reduce the C footprint of agricultural systems would be the replacement of synthetic fertilizers by the practice of crop rotation with nitrogen-fixing species, which is possible as a crop rotation for large areas in a scale of 20% of total crop production area each year.
Biological N fixation (BNF) associated with soybean and N legacy effects contribute to reduced demand for synthetic N fertilizer in soybean-based rotations, decreasing N leaching, ammonia volatilization, N2O and CO2 emissions. Despite scientific advances and improved understanding of implications associated with soybean cropping, several research gaps persist, including how to improve soybean yields as part of contemporary crop rotations, identification of optimal synthetic N inputs that maximize yields while minimizing GHG emissions [31].
Evaluating effects on sugarcane crop yield, C and N storage in the central-south Brazil under rotation with legume (Crotalaria sp.), authors showed that soil N stocks increased 410 and 80 kg ha within 0.0–0.4 m layer, highlighting the essential role of rotation with Crotalaria sp. within the sugarcane renewal period as strategy to increase soil N content [32]. Better N content under such management was observed even after three crop seasons. The most well-known benefits of rotation system with Crotalaria sp. are N fixation into the soil, however, crotalaria’s root system can also reduce N loses either decreasing N leaching out for deeper soil layers or mitigating N loses within runoff.
For instance, crotalaria (Crotalaria juncea L.) planting in rotation can fix and provide to the soil after a crushing, approximately 350 kg of N ha−1 [33], being possible to reduce or even replace the use of N, P and K in subsequent crops. Highlighting that new studies are needed to determine the amount of N, P and K that can be reduced or replaced in the subsequent crops, due to rotation with crotalaria, or the nutrient credit, especially in the years following the crotalaria or other nitrogen-fixing species planting.
According to the Practical Guide to Cover Plants [33], Crotalaria Júncea L. can provide to the soil 03–05 Mg ha−1 of residue dry matter and, after straw decomposition an average of 350 kg of N ha−1, 35 kg of P2O5 and 200 kg of K2O, reducing the need for fertilizer use (Farm K) and dropping the system’s C footprint from 2413 kg CO2eq ha−1 to 1820 kg CO2eq ha−1 by replacing N synthetic fertilizer. Thus, in this scenario, the required amount of C sequestration (soil or trees biomass) to neutralize emissions from the whole crop rotation system (one year) in farm K would be reduced from 638 to 496 kg C ha−1 yr−1.
Evaluating economic value of biological nitrogen fixation in soybean crops in Brazil applying methodological advances via mathematical models to verify the economic value of ecosystem services from biological nitrogen fixation (BNF), inoculation with Bradyrhizobium spp. and coinoculation with Azospirillum brasilense of the soybean crop, and mitigation of greenhouse gases by BNF, results showed that, the economic value resulting from replacement of N fertilizer (urea) by BNF in the 2019–2020 crop season was estimated at 15.2 billion USD [34].
Aiming to investigate the effects of distinct cover crop species grown sole or as intercrops between soybean harvest and wheat sowing on the yields and profitability of a soybean–wheat production system in southern Brazil [35], the authors concluded that, maize + oilseed radish, oilseed radish, slender leaf rattlebox, maize, pearl millet, and pearl millet + oilseed radish produced the highest soybean yields (4050, 3996, 3915, 3904, 3884, and 3849 kg ha−1, respectively) and, the profits obtained from soybean–wheat production were higher with the cultivation of maize + oilseed radish, oilseed radish, and slender leaf rattlebox (USD 700, 687, and 662 ha−1) than with fallow (USD 642 ha−1).
A third possibility for considering the potential of reducing GHG emissions from crop systems (inside the farm gate) is not frequently considered and discussed in the literature. Based on our analysis, scenarios (Farm K) and applied methodologies, investigating the profile of GHG emissions for the agricultural systems, emission from the production phase of inputs used for the crops is approximately 37% of the total (Fertilizers, diesel, herbicides, fungicides and insecticides) and 63% occurs due to the use or application of these inputs into the farmgate (Figure 8).
For setting operational boundaries, a company must determine its organizational boundaries in terms of the operations that it owns or controls, and this involves identifying emissions associated with its operations, categorizing them as direct and indirect emissions, and choosing the scope of GHG accounting and reporting [36]. Aiming to identify direct and indirect emission sources, improve transparency, and provide utility for different types of organizations and different types of climate policies and business goals, three “scopes” (scope 1, scope 2, and scope 3) are defined for GHG accounting and reporting purposes [36], being scope 1 direct GHG emissions that occur from sources that are owned or controlled by the company, scope 2 GHG emissions from the generation of purchased electricity consumed by the company and scope 3, an optional reporting category that allows for the treatment of all other indirect emissions, a consequence of the activities of the company, but occur from sources not owned or controlled by the company, for example, extraction and production of purchased materials; transportation of purchased fuels.
The operational boundary (scope 1, scope 2, scope 3) shall be decided at the corporate level after setting the organizational boundary [36] and, in the case of our study, we are proposing that farmers can have the option to report GHG emissions that occurs inside the farm-gate, or scope 1 only, once emissions from scope 3 are responsibility of companies that for instance produce their products and should account and be responsible for their own emissions, avoiding likewise double counting.
Normally, when buying inputs, the agricultural producer can be responsible for emissions that occur in the industrial production and transport phase of these inputs used inside the farmgate, but these emissions do not occur at the time of use or application. Once buying agricultural inputs from companies responsible for their own GHG emissions of production and transport phase, the agricultural production systems could have their C footprint reduced by around 37%.
Figure 8a,b present a comparison between two scenarios in the agricultural phase, total emissions associated with input production, transport and application in the field (Figure 8a) and emissions only from application/use in the field (Figure 8b, red bars). Therefore, establishing and discounting 37% of emissions from production phase, soybean emissions in farm K could be reduced from 974.4 to 608.8 kg CO2eq ha−1, a very significant reduction, greater than those previously discussed. Once companies that produce agricultural inputs can be responsible for their emissions that occur in the industrial phase, the farmers could choose to purchase inputs with a smaller C footprint embedded, supporting the emissions responsibility fairer and agricultural production more sustainable.
Evaluating GHG emissions from global production and use of nitrogen synthetic fertilizers in agriculture [37], authors estimated global GHG emissions due to synthetic N fertilizer manufacture, transportation, and field use in agricultural systems, showing that the synthetic N fertilizer supply chain was responsible for estimated emissions of 1.13 GtCO2eq in 2018, representing 10.6% of agricultural emissions and 2.1% of global GHG emissions, with synthetic N fertilizers production accounting for 38.8% of total synthetic N fertilizers-associated emissions, while field emissions accounted for 58.6% and transportation accounted for the remaining 2.6%, similar values presented in this study for all inputs used for agricultural production, with 37.5% of GHG associated-emissions related to the production phase and 62.5% directly related to application of inputs inside the farm-gate (Figure 8).

4.2. Pathways to Offset Emissions from Agricultural Production

4.2.1. Soil C Sequestration

Soil organic carbon (SOC) is dynamic in time and space and is continuously built up but also continuously decomposed and mineralized [23]. Observed changes in SOC stocks are thus mostly the consequence of two major fluxes: the fraction of net primary production entering the soil, for example litter and, the respiration flux releasing C from the soil [38]. The net balance changes over time as a result of temporal variations in these two fluxes depending on various drivers. If the net C balance is positive soil takes up C. If soil C is increased relative to initial SOC because of reducing atmospheric carbon (e.g., via photosynthetic pathways), C sequestration is achieved [23].
Once emissions of all crops in rotation with soybeans were estimated for the three farms evaluated in this study (crop rotation system), it was possible to estimate the potential of soil C sequestration required to offset or even neutralize all GHG emissions from the agricultural production phase including soybean and all crops in rotation. As the emissions of crop rotation systems for farms K, M, and G were estimated as 2413.0, 2209.0, and 2292.0 kg CO2eq ha−1 (01 year), respectively, annual soil C sequestration rates of 638, 602, and 625 kg C ha−1 year−1, respectively, would be required to neutralize emissions from agricultural production phase for this one year-period.
Presenting options for soil carbon sequestration for sustaining agricultural production and improving the environment, a research study showed that Brazil can be a particular reference, through conversion to an appropriate land use and adoption of recommended management practices (RMPs), with gross rates of SOC sequestration through adoption of RMPs ranging from 0.40 to 0.80 Mg−1 ha−1 year−1 for cool and humid regions and 0.10 to 0.20 Mg−1 ha−1 year−1 for dry and warm climates [39].
For the case of Brazilian Cerrado in Brazil, the same region as our study location, the authors presented rates for soil C sequestration under no-till in sandy clay loam Oxisol of 0.30 Mg C ha−1 year−1 and in the clayey Oxisol by 0.60 Mg C ha−1 year−1 which is around 1100 and 2200 and Kg CO2 ha−1 year−1, respectively, removed from the atmosphere [40]. Another study showed that C accumulation rate in the conversion of rice with conventional tillage into soybean under NT in Brazilian Cerrado was 0.38 Mg ha−1 year−1 or 1393.33 kg CO2 ha−1 year−1 [41]. In a review for soil carbon accumulation due to the management change of major Brazilian agricultural activities, authors showed similar values for soil C accumulation in annual crops (soybean, maize and crop rotations), at depths of 0–30 cm (20% of the studies) and 0–20 cm (70% of the studies), with the same mean soil C accumulation rates of 0.41 ± 0.06 Mg C ha−1 year−1 (equivalent to 1503.3 kg CO2 ha−1 year−1) for both, sand and clay soils [42].
Assessing on-farm GHG emissions and soil carbon stocks of a soybean-maize system areas with native vegetation (NV) and two other areas cultivated with soybean under no-till practices with different conversion times (2–5 years) and more than 10 years, authors showed that, despite the reductions in soil C stocks under soybean-maize systems relative to native vegetation, previous studies suggest that, by applying best management practices (e.g., cover crops, green manure, crop rotations) over multiple years (>15 years, especially in clayey soils) [43], soil C stocks could attain values similar to the original ones under NV [41,44,45]. Additionally, authors showed that the oldest area, with 23 years of cultivation, presented a soil C stock increase compared to the native Cerrado soil of 17% [44].
In a review for crop, livestock, and forestry integration systems to reconcile soil health, food production, and climate change mitigation in the Brazilian Cerrado, a study showed that soil C accumulation fully offsets soil N2O emissions, underscoring the feasibility of using the integrated crop–livestock and crop–livestock–forestry systems for decreasing the C footprint of agricultural commodities in the Brazilian Cerrado region [46]. Investigating soil carbon and nitrogen stocks and the quality of soil organic matter under silvopastoral systems in the Brazilian Cerrado, the authors concluded that integrated production systems contributed to increasing soil C with low rates of CO2 emissions due to substrate diversity for microbial population growth and soil activity, reflecting an increase in nutrient cycling efficiency and maintenance of N stocks [47].
Therefore, adopting RMP in the conditions of Brazil agriculture in Cerrado region, it is technically feasible based on scientific research that soil C sequestration can offset part of GHG emissions related to grains agricultural production for a limited time. We emphasize that the annual soil C accumulation or sequestration rates depend on several factors such as the soil type, climate variability, management and soil tillage applied, soil texture, sequence of crop rotations, time of adoption and maintenance of soil covering. The IPCC methodologies [10] estimate an average period until saturation for soil C accumulation of around 20 years after the adoption of no-tillage system with implementation of crop rotation and thus, after soil C saturation, the only possible C pool to offset GHG emission from agricultural areas is the biomass C pool.

4.2.2. Biomass C Sequestration to Offset GHG Emissions

The United Nations Framework Convention on Climate Change (UNFCCC) defines C sequestration as the process of removing C from the atmosphere (CO2-C) and depositing it in a long-lived reservoir [48,49]. Eucalyptus wood can be used as a raw material for generating renewable energy, replacing fossil sources, thus contributing to mitigating climate forces [50], and can also be used as a strategy for obtaining long-lived reservoirs such as corrals, fences, doors, windows, and construction activities [14].
One of the most efficient ways to sequester C-CO2 from the atmosphere is through photosynthesis in tree biomass. Data from the literature show that planting trees with 80 native species in the Atlantic Forest was able to sequester 5.2 Mg C ha−1 year−1 [51], while planting eucalyptus in monoculture with a density of 1666 plants per hectare can sequester a rate of 7.2 Mg C ha−1 year−1 [10,52], and areas of CLFIS (Crop Livestock Forest Integration System) can, at the same time, in addition to produce grains and other products, sequester 4.75 Mg C ha−1 yr−1 in eucalyptus biomass [14].
Additionally, a study in which trees and crops are cultivated in rotation, succession, or in association with pastures accumulated 64.5 Mg C ha−1 in tree biomass by eight years after system implementation, resulting 8.06 Mg C ha−1 year−1 or 29.55 Mg CO2 ha−1 year−1, considering the wood used for the lumber-mill scenario [53]. In other study, when trees C accumulation rates were considered, the potential of GHG emission mitigation by C sequestration (soil +trees) was 19.89 (Mg CO2 ha−1 year−1) to crop-livestock-forestry system and 18.97 (Mg CO2 ha−1 year−1) to livestock-forestry system, concluding that integrated systems with trees is an important strategy to improve the GHG mitigation [54]. For the Amazon biome, a study for crop–livestock–forestry systems as a strategy for mitigating GHG emissions and enhancing the sustainability of forage-based livestock concluded that integrated systems presented a negative net C balance, with the greatest sequestration observed in systems with the forestry component, demonstrating that integrated forage-based livestock systems are promise in GHG mitigation and C sequestration [55].
Thus, for a crop area of 446 ha (farm K, 01 year), a total emission of 1,076,151 kg CO2eq was estimated with crops soybeans, corn, and beans, representing a system C footprint of 2413 kg CO2eq ha−1. Therefore, to offset all emissions from the agricultural phase it would be necessary around 61.5 hectares of CLFIS (17.41 Mg CO2 ha−1 yr−1) or 40.5 hectares of eucalyptus in monoculture (26.4 Mg CO2 ha−1 yr−1), respectively. We point out that these planting areas with eucalyptus trees would be responsible for neutralizing the entire agricultural production phase of 446 ha for a period of 10 years (estimated cutting age), being necessary that after cutting, eucalyptus wood should be used to replace, for example, fossil coal in steel mills or be used as a long-live-pool, or used for the lumber-mill [50].
Assessing the economic performance of an Integrated Crop-Livestock and an Integrated Crop-Livestock-Forest system at farm level comparing their results with the most representative agricultural production systems used in the Cerrado and Amazon in Brazil, the integrated systems showed better economic long-term results (i.e., similar payback, even with major investment, and higher profitability index), compared with extensive livestock economic results and, moreover, the environmental analysis highlighted the huge potential of integrated systems to reduce pressure on natural forests and to decrease GHG emissions from agricultural sector, which are issues of global relevance [56].
The findings of our study provide scientifically grounded strategies to mitigate GHG emissions in the grain production sector, offering valuable insights to guide public policy and support the effective implementation of Brazil’s Low-Carbon Agriculture Plan (ABC+ Plan) for the 2020–2030 period. The plan targets a reduction of 1.1 billion tons of CO2eq emissions through the adoption of sustainable agricultural practices across 72.68 million hectares, while concurrently strengthening the sector’s resilience to climate change [57]. The adoption of well-established technologies—such as the restoration and conversion of degraded pastures (30 Mha) or the transition from intensive cropping systems (12.5 Mha) to no-tillage practices with crop rotation systems—can promote the transfer of atmospheric CO2 into soil organic matter, contributing to mitigation targets of 113.7 Mt CO2eq and 12.1 Mt CO2eq, respectively, by 2030. Additionally, the implementation of Crop-Livestock-Forest Integration Systems in an estimated planting area of 10 Mha could sequester 34.1 Mt CO2 from the atmosphere, agroforestry systems 37.9 Mt CO2, and planted forests in 4 Mha with 510.0 Mt CO2 [57].
Launched by the Brazilian federal government on 1 July 2025, the 2025/2026 Harvest Plan allocated approximately BRL 516.2 billion to support commercial agriculture [58]. While the plan includes initiatives to enhance rural safety and sustainability, it lacks a strategic focus on financial mechanisms to promote the widespread adoption of proven low-carbon agricultural and livestock technologies. Strengthening investments specifically directed toward the ABC+ Plan is critical to achieving GHG mitigation targets and fostering a transition toward more climate-resilient and sustainable production systems.

5. Conclusions

Possible strategies to offset GHG emissions from agricultural production areas should account for the total emissions associated with entire crop rotation systems, rather than focusing on individual crops, since the potential of soil carbon sequestration is closely linked to the quantity of residue inputs generated by all crops in rotation, which require high amounts of dolomitic lime and nitrogen fertilizers and, according to our results, represent the major sources of GHG emissions in the agricultural production phase.
Mitigating practices can reduce GHG emissions, especially in the agricultural production phase, such as replacing synthetic fertilizers with organic fertilizers and introducing crop rotation with nitrogen-fixing species, but compensation via sequestration (soil or biomass C) shall be required to zero GHG emissions from soybean seed production and respective crops rotations.
Our study indicate that by reserving approximately 10–15% of the farm’s total agricultural production area to planting native trees or eucalyptus in marginal areas or even introducing Crop-Livestock-Forest Integration or Crop-Forest Integration systems, it would be possible to offset the GHG emissions of the entire agricultural production phase, considering emissions of soybean and their crop rotations, through C sequestration in trees biomass, for a period of approximately 10 years of grain cultivation, once the Native Forest Reserve area is in accordance with National law for each biome.
The adoption of crop rotation systems with no-till and better management practices in addition with trees in Integrated Systems or even in forest plantation as C compensation area should be implemented through repeated measures over time of soil and biomass C sequestration rates in long-term, which values shall be adjusted along the years for each farm, soil and climate classification, showing to be a feasible option for nature based solutions to reach C credit from agricultural sector, contributing to reduce negative effects of the Climate Change and supporting the sustainable development goals as responsible consumption, production and climate action.

Funding

This research received no external funding.

Conflicts of Interest

The authors declare no conflict of interest.

References

  1. Nabuurs, G.-J.; Mrabet, R.; Hatab, A.A.; Bustamante, M.; Clark, H.; Havlík, P.; House, J.; Mbow, C.; Ninan, K.N.; Popp, A.; et al. Agriculture, Forestry and Other Land Uses (AFOLU). In IPCC, 2022: Climate Change 2022: Mitigation of Climate Change. Contribution of Working Group III to the Sixth Assessment Report of the Intergovernmental Panel on Climate Change; Shukla, P.R., Skea, J., Slade, R., Al Khourdajie, A., van Diemen, R., McCollum, D., Pathak, M., Some, S., Vyas, P., Fradera, R., Eds.; Cambridge University Press: Cambridge, UK; New York, NY, USA, 2022. [Google Scholar] [CrossRef]
  2. Future Earth; The Earth League; WCRP. 10 New Insights in Climate Science 2023/2024. Stockholm. 2023. Available online: https://10insightsclimate.science/wp-content/uploads/2023/12/10NICS-2023-Report_digital.pdf (accessed on 5 May 2025).
  3. FAO. The State of Agricultural Commodity Markets 2015–2016. Trade and Food Security: Achieving a Better Balance Between National Priorities and the Collective Good; Food and Agriculture Organization: Rome, Italy, 2015. [Google Scholar]
  4. Escobar, N.; Tizado, E.J.; zu Ermgassen, E.K.H.J.; Löfgren, P.; Börner, J.; Godar, J. Spatially-explicit footprints of agricultural commodities: Mapping carbon emissions embodied in Brazil’s soy exports. Glob. Environ. Chang. 2020, 62, 102067. [Google Scholar] [CrossRef]
  5. Smeets, E.M.W.; Bouwmanw, L.F.; Stehfest, E.; van Vuuren, D.P.; Posthuma, A. Contribution of N2O to the greenhouse gas balance of first-generation biofuels. Glob. Chang. Biol. 2009, 15, 1–23. [Google Scholar] [CrossRef]
  6. Kendall, A.; Chang, B. Estimating life cycle greenhouse gas emissions from corn–ethanol: A critical review of current U.S. practices. J. Clean. Prod. 2009, 17, 1175–1182. [Google Scholar] [CrossRef]
  7. Kim, S.; Dale, B.E. Regional variations in greenhouse gas emissions of biobased products in the United States—Corn-based ethanol and soybean oil. Int. J. Life Cycle Assess. 2009, 14, 540–546. [Google Scholar] [CrossRef]
  8. Castanheira, É.G.; Freire, F. Greenhouse gas assessment of soybean production: Implications of land use change and different cultivation systems. J. Clean. Prod. 2013, 54, 49–60. [Google Scholar] [CrossRef]
  9. Arias, P.A.; Bellouin, N.; Coppola, E.; Jones, R.G.; Krinner, G.; Marotzk, J.; Naik, V.; Palmer, M.D.; Plattner, G.-K.; Rogelj, J.; et al. Technical Summary. In Climate Change 2021: The Physical Science Basis. Contribution of Working Group I to the Sixth Assessment Report of the Intergovernmental Panel on Climate Change; Masson-Delmotte, V., Zhai, P., Pirani, A., Connors, S.L., Péan, C., Berger, S., Caud, N., Chen, Y., Goldfarb, L., Gomis, M.I., et al., Eds.; Cambridge University Press: Cambridge, UK; New York, NY, USA, 2021; pp. 33–144. [Google Scholar] [CrossRef]
  10. IPCC. Guidelines for National Greenhouse Gas Inventories. In IPCC National Greenhouse Gas Inventories Programme; EgglesMg, S., Buendia, L., Miwa, K., Ngara, T., Tanabe, K., Eds.; Forest Land; Institute for Global Environmental Strategies (IGES): Hayama, Japan, 2006; Chapter 4; p. 664. Available online: https://www.ipcc-nggip.iges.or.jp/public/2006gl/pdf/4_Volume4/V4_04_Ch4_Forest_Land.pdf (accessed on 10 April 2024).
  11. IPCC. Refinement to the 2006 IPCC Guidelines for National Greenhouse Gas Inventories. 2019. Available online: https://www.ipcc.ch/report/2019-refinement-to-the-2006-ipcc-guidelines-for-national-greenhouse-gas-inventories/ (accessed on 5 June 2024).
  12. de Figueiredo, E.B.; Panosso, A.R.; Romão, R.; La Scala, N., Jr. Research Greenhouse gas emission associated with sugar production in southern Brazil. Carbon Balance Manag. 2010, 5, 3. [Google Scholar] [CrossRef] [PubMed]
  13. de Figueiredo, E.B.; La Scala, N., Jr. Greenhouse gas balance due to the conversion of sugarcane areas from burned to green harvest in Brazil. Agric. Ecosyst. Environ. 2011, 141, 77–85. [Google Scholar] [CrossRef]
  14. de Figueiredo, E.B.; Jayasundara, S.; Bordonal, R.d.O.; Berchielli, T.T.; Reis, R.A.; Wagner-Riddle, C.; La Scala, N., Jr. Greenhouse gas balance and carbon footprint of beef cattle in three contrasting pasture-management systems in Brazil. J. Clean. Prod. 2017, 142, 420–431. [Google Scholar] [CrossRef]
  15. Bordonal, R.d.O.; Lal, R.; Aguiar, D.A.; de Figueiredo, E.B.; Perillo, L.I.; Adami, M.; Rudorff, B.F.T.; La Scala, N. Greenhouse gas balance from cultivation and direct land use change of recently established sugarcane (Saccharum officinarum) plantation in south-central Brazil. Renew. Sustain. Energy Rev. 2015, 52, 547–556. [Google Scholar] [CrossRef]
  16. Perillo, L.I.; Bordonal, R.D.O.; De Figueiredo, E.B.; Moitinho, M.R.; Aguiar, D.A.; Rudorff, B.F.T.; Panosso, A.R.; La Scala, N. Avoiding burning practice and its consequences on the greenhouse gas emission in sugarcane areas southern Brazil. Environ. Sci. Pollut. Res. 2022, 29, 719–730. [Google Scholar] [CrossRef]
  17. SEEG. Sistema de Estimativas de Emissões e Remoções de Gases de Efeito Estufa. 2024. Available online: https://seeg.eco.br/relatorios/ (accessed on 20 November 2024).
  18. Gov.br. Brazilian Ministry of Agriculture and Livestock. Low Carbon Agriculture Plan 2025. Available online: https://www.gov.br/agricultura/pt-br/assuntos/sustentabilidade/planoabc-abcmais/abc/metas-do-abc (accessed on 18 June 2025).
  19. IPCC. Climate Change 2007: The Physical Science Basis. Contribution of Working Group I to the Fourth Assessment Report of the Intergovernmental Panel on Climate Change; Solomon, S., Qin, D., Manning, M., Chen, Z., Marquis, M., Averyt, K.B., Tignor, M., Miller, H.L., Eds.; Cambridge University Press: Cambridge, UK, 2007. [Google Scholar]
  20. MCTI. Emissões Corporativas. Ministério da Ciência, Tecnologia e İnovação, Brazil. 2019. Available online: https://www.gov.br/mcti/pt-br/acompanhe-o-mcti/sirene/dados-e-ferramentas/fatores-de-emissao (accessed on 15 February 2024).
  21. CETESB. Emissões Veiculares no Estado de São Paulo. 2014. Available online: https://repositorio.cetesb.sp.gov.br/handle/123456789/2878 (accessed on 15 February 2024).
  22. Macedo, I.C.; Seabra, J.E.; Silva, J.E.A.R. Greenhouse gases emissions in the production and use of ethanol from sugarcane in Brazil: The 2005/2006 averages and a prediction for 2020. Biomass Bioenergy 2008, 32, 582–595. [Google Scholar] [CrossRef]
  23. Don, A.; Seidel, F.; Leifeld, J.; Kätterer, T.; Martin, M.; Pellerin, S.; Emde, D.; Seitz, D.; Chenu, C. Carbon sequestration in soils and climate change mitigation—Definitions and pitfalls. Glob. Chang. Biol. 2024, 30, e16983. [Google Scholar] [CrossRef]
  24. Griscom, B.W.; Adams, J.; Ellis, P.W.; Houghton, R.A.; Lomax, G.; Miteva, D.A.; Schlesinger, W.H.; Shoch, D.; Siikamäki, J.V.; Smith, P.; et al. Natural climate solutions. Proc. Natl. Acad. Sci. USA 2017, 114, 11645–11650. [Google Scholar] [CrossRef]
  25. Lucić, R.; Raposo, M.; Chervinska, A.; Domingos, T.; Teixeira, R.F. Global Greenhouse Gas Emissions and Land Use Impacts of Soybean Production: Systematic Review and Analysis. Sustainability 2025, 17, 3396. [Google Scholar] [CrossRef]
  26. EPE. Empresa de Pesquisa Energética. 2024. Available online: https://www.epe.gov.br/sites-pt/publicacoes-dados-abertos/publicacoes/PublicacoesArquivos/publicacao-819/topico-723/BEN2024.pdf (accessed on 15 October 2024).
  27. Barbosa, J.Z.; Hungria, M.; Sena, J.V.S.; Poggere, G.; dos Reis, A.R.; Corrêa, R.S. Meta-analysis reveals benefits of co-inoculation of soybean with Azospirillum brasilense and Bradyrhizobium spp. in Brazil. Appl. Soil Ecol. 2021, 163, 103913. [Google Scholar] [CrossRef]
  28. Ciampitti, I.A.; Salvagiotti, F. New insights into soybean biological nitrogen fixation. Agron. J. 2018, 110, 1185–1196. [Google Scholar] [CrossRef]
  29. Cheng, K.; Yan, M.; Nayak, D.; Pan, G.X.; Smith, P.; Zheng, J.F.; Zheng, J.W. Carbon footprint of crop production in China: An analysis of National Statistics data. J. Agric. Sci. 2014, 153, 422–431. [Google Scholar] [CrossRef]
  30. Barbosa, J.Z.; Roberto, L.A.; Hungria, M.; Corrêa, R.S.; Magri, E.; Correia, T.D. Meta-analysis of maize responses to Azospirillum brasilense inoculation in Brazil: Benefits and lessons to improve inoculation efficiency. Appl. Soil Ecol. 2022, 170, 104276. [Google Scholar] [CrossRef]
  31. Yang, Y.; Zou, J.; Huang, W.; Olesen, J.E.; Li, W.; Rees, R.M.; Harrison, M.T.; Feng, B.; Feng, Y.; Chen, F.; et al. Drivers of soybean-based rotations synergistically increase crop productivity and reduce GHG emissions. Agric. Ecosyst. Environ. 2024, 372, 109094. [Google Scholar] [CrossRef]
  32. Bohórquez-Sánchez, C.E.; de Castro, S.A.Q.; Carvalho, J.L.N.; Tenelli, S.; Ferraz-Almeida, R.; Sermarini, R.A.; Otto, R. Legume growth and straw retention in sugarcane fields: Effects on crop yield, C and N storage in the central-south Brazil. Agric. Ecosyst. Environ. 2023, 347, 108374. [Google Scholar] [CrossRef]
  33. Cherubim, M.R. Guia Prático de Plantas de Cobertura: Espécies, Manejo e İmpacto na Saúde do Solo. 2022. Available online: https://www.livrosabertos.abcd.usp.br/portaldelivrosUSP/catalog/book/1340 (accessed on 23 April 2025).
  34. Telles, T.S.; Nogueira, M.A.; Hungria, M. Economic Value of Biological Nitrogen Fixation in Soybean Crops in Brazil. Environ. Technol. Innov. 2023, 31, 103158. [Google Scholar] [CrossRef]
  35. Debiasi, H.; Franchini, J.C.; Coelho, A.E.; Balbinot Junior, A.A. Cover Crops Increase the Yield and Profitability of Soybean–Wheat Cropping Systems in Southern Brazil. Int. J. Plant Prod. 2025, 19, 183–195. [Google Scholar] [CrossRef]
  36. GHG Protocol. The Greenhouse Gas Protocol: A Corporate Accounting and Reporting Standard, Revised Edition; World Resources Institute and World Business Council for Sustainable Development: Washington, DC, USA, 2004; ISBN 1-56973-568-9. Available online: https://ghgprotocol.org/corporate-standard (accessed on 1 June 2025).
  37. Menegat, S.; Ledo, A.; Tirado, R. Greenhouse Gas Emissions from Global Production and Use of Nitrogen Synthetic Fertilisers in Agriculture. Sci. Rep. 2022, 12, 14490. [Google Scholar] [CrossRef]
  38. Bondeau, A.; Smith, P.C.; Zaehle, S.; Scharphoff, S.; Lucht, W.; Cramer, W.; Gerten, D.; Lotze-Campen, H.; Müller, C.; Reichstein, M.; et al. Modelling the role of agriculture for the 20th century global terrestrial carbon balance. Glob. Chang. Biol. 2007, 13, 679–706. [Google Scholar] [CrossRef]
  39. Lal, R. Soil Carbon Sequestration for Sustaining Agricultural Production and Improving the Environment with Particular Reference to Brazil. J. Sustain. Agric. 2005, 26, 23–42. [Google Scholar] [CrossRef]
  40. Bayer, C.; Martin-Neto, L.; Mielniczuk, J.; Pavinato, A.; Dieckow, J. Carbon sequestration in two Brazilian Cerrado soils under no-till. Soil Tillage Res. 2006, 86, 237–245. [Google Scholar] [CrossRef]
  41. Carvalho, L.N.; Cerri, C.E.P.; Feigl, B.J.; Píccolo, M.C.; Godinho, V.P.; Cerri, C.C. Carbon Sequestration in Agricultural Soils in the Cerrado Region of the Brazilian Amazon. Soil Tillage Res. 2009, 103, 342–349. [Google Scholar] [CrossRef]
  42. La Scala Junior, N.; De Figueiredo, E.B.; Panosso, A.R. A review on soil carbon accumulation due to the management change of major Brazilian agricultural activities. Braz. J. Biol. 2012, 72, 775–785. [Google Scholar] [CrossRef]
  43. Cerri, C.E.P.; Damian, J.M.; Alves, P.A.; Cerri, D.G.P.; Cherubin, M.R. On-farm greenhouse gas emissions and soil carbon stocks of a soybean-maize system. Nutr. Cycl. Agroecosyst. 2024, 128, 309–324. [Google Scholar] [CrossRef]
  44. Miranda, E.; Carmo, J.; Couto, E.; Camargo, P. Long-Term Changes in Soil Carbon Stocks in the Brazilian Cerrado Under Commercial Soybean. Land Degrad. Dev. 2016, 27, 1586–1594. [Google Scholar] [CrossRef]
  45. Dias, F.P.M.; Leandro, W.M.; Fernandes, P.M.; Xavier, F.A.Z. Impact of short-term land-use change on soil organic carbon dynamics in transitional agro-ecosystems: A case study in the Brazilian Cerrado. Carbon Manag. 2022, 13, 238–248. [Google Scholar] [CrossRef]
  46. Oliveira, D.M.S.; Freitas, D.A.F.; Cherubin, M.R.; Cerri, C.E.P. Crop, livestock, and forestry integration to reconcile soil health, food production, and climate change mitigation in the Brazilian Cerrado: A review. Geoderma Reg. 2024, 37, e00796. [Google Scholar] [CrossRef]
  47. Almeida, L.L.S.; Frazão, L.A.; Lessa, T.A.M.; Fernandes, L.A.; Veloso, A.L.C.; Lana, A.M.Q.; de Souza, I.A.; Pegoraro, R.F.; Ferreira, E.A. Soil Carbon and Nitrogen Stocks and the Quality of Soil Organic Matter under Silvopastoral Systems in the Brazilian Cerrado. Soil Tillage Res. 2021, 205, 104785. [Google Scholar] [CrossRef]
  48. UNFCCC. Views on the Range of Topics and Other Relevant Information Relating to Reducing Emissions from Deforestation in Developing Countries. Submissions from Parties. United Nations Framework Convention on Climate Change. 2007. Available online: http://unfccc.int/resource/docs/2007/sbsta/eng/misc03.pdf (accessed on 21 May 2022).
  49. UNFCCC. Views on Land Use, Land-Use Change and Forestry Issues Referred to in Decision 2/CMP.7, Paragraphs 5–7. Submissions from Parties and Admitted Observer Organizations 12–18. United Nations Framework Convention on Climate Change. 2013. Available online: http://go.nature.com/hLAtTN (accessed on 18 December 2022).
  50. IPCC. Climate Change 2014: Mitigation of Climate Change. Contribution of Working Group III to the Fifth Assessment Report of the Intergovernmental Panel on Climate Change; Smith, P., Bustamante, M., Eds.; IPCC: Geneva, Switzerland, 2014. [Google Scholar]
  51. de Melo, A.C.; Durigan, G. Carbon Sequestration by Planted Riparian Forests in Paranapanema Valley, SP, Brazil. Sci. Florest. 2006, 71, 149–154. [Google Scholar]
  52. Stape, J.L.; Binkley, D.; Ryan, M.G. Eucalyptus production and the supply, use and efficiency of use of water, light and nitrogen across a geographic gradient in Brazil. For. Ecol. Manag. 2004, 193, 17–31. [Google Scholar] [CrossRef]
  53. Pezzopane, J.R.M.; Bosi, C.; Bernardi, A.C.C.B.; Muller, M.D.; de Oliveira, P.P.A. Managing eucalyptus trees in agroforestry systems: Productivity parameters and PAR transmittance. Agric. Ecosyst. Environ. 2021, 312, 107350. [Google Scholar] [CrossRef]
  54. Oliveira, D.M.S.; Oliveira, P.P.A.; Bernardi, A.C.C.; Pezzopane, J.R.M.; Bosi, C.; Júnior, F.P.; Tadini, A.M.; Martin-Neto, L.; Rodrigues, P.H.M. Potential of integrated trees-pasture-based systems for GHG emission mitigation and improving soil carbon dynamics 824 in the Atlantic Forest biome, Southeastern of Brazil. Eur. J. Agron. 2024, 158, 127219. [Google Scholar] [CrossRef]
  55. Monteiro, A.; Barreto-Mendes, L.; Fanchone, A.; Morgavi, D.P.; Pedreira, B.C.; Magalhães, C.A.S.; Adibe, L.A.L.; Eugène, M. Crop-livestock-forestry systems as a strategy for mitigating greenhouse gas emissions and enhancing the sustainability of forage-based livestock systems in the Amazon biome. Sci. Total. Environ. 2024, 906, 167396. [Google Scholar] [CrossRef] [PubMed]
  56. Dos Reis, J.C.; Kamoi, M.Y.T.; Michetti, M.; Wruck, F.J.; de Aragão Ribeiro Rodrigues, R.; de Farias Neto, A.L. Economic and environmental impacts of integrated systems adoption in Brazilian agriculture-forest frontier. Agrofor. Syst. 2023, 97, 847–863. [Google Scholar] [CrossRef]
  57. Ministry of Agriculture, Livestock and Food Supply. Plan for Adaptation and Low Carbon Emission in Agriculture: Strategic Vision for a New Cycle—ABC+ 2020–2030; MAPA: Brasília, Brazil, 2021. Available online: https://www.gov.br/agricultura/pt-br/assuntos/sustentabilidade/planoabc-abcmais (accessed on 20 May 2025).
  58. Ministry of Agriculture, Livestock and Food Supply. Federal Government Launches 2025–2026 Harvest Plan with R$ 516.2 Billion to Boost Brazilian Agribusiness. Government of Brazil. 30 June 2025. Available online: https://www.gov.br/agricultura/pt-br/assuntos/noticias/governo-federal-lanca-plano-safra-2025-2026-com-r-516-2-bilhoes-para-impulsionar-o-agro-brasileiro (accessed on 25 June 2025).
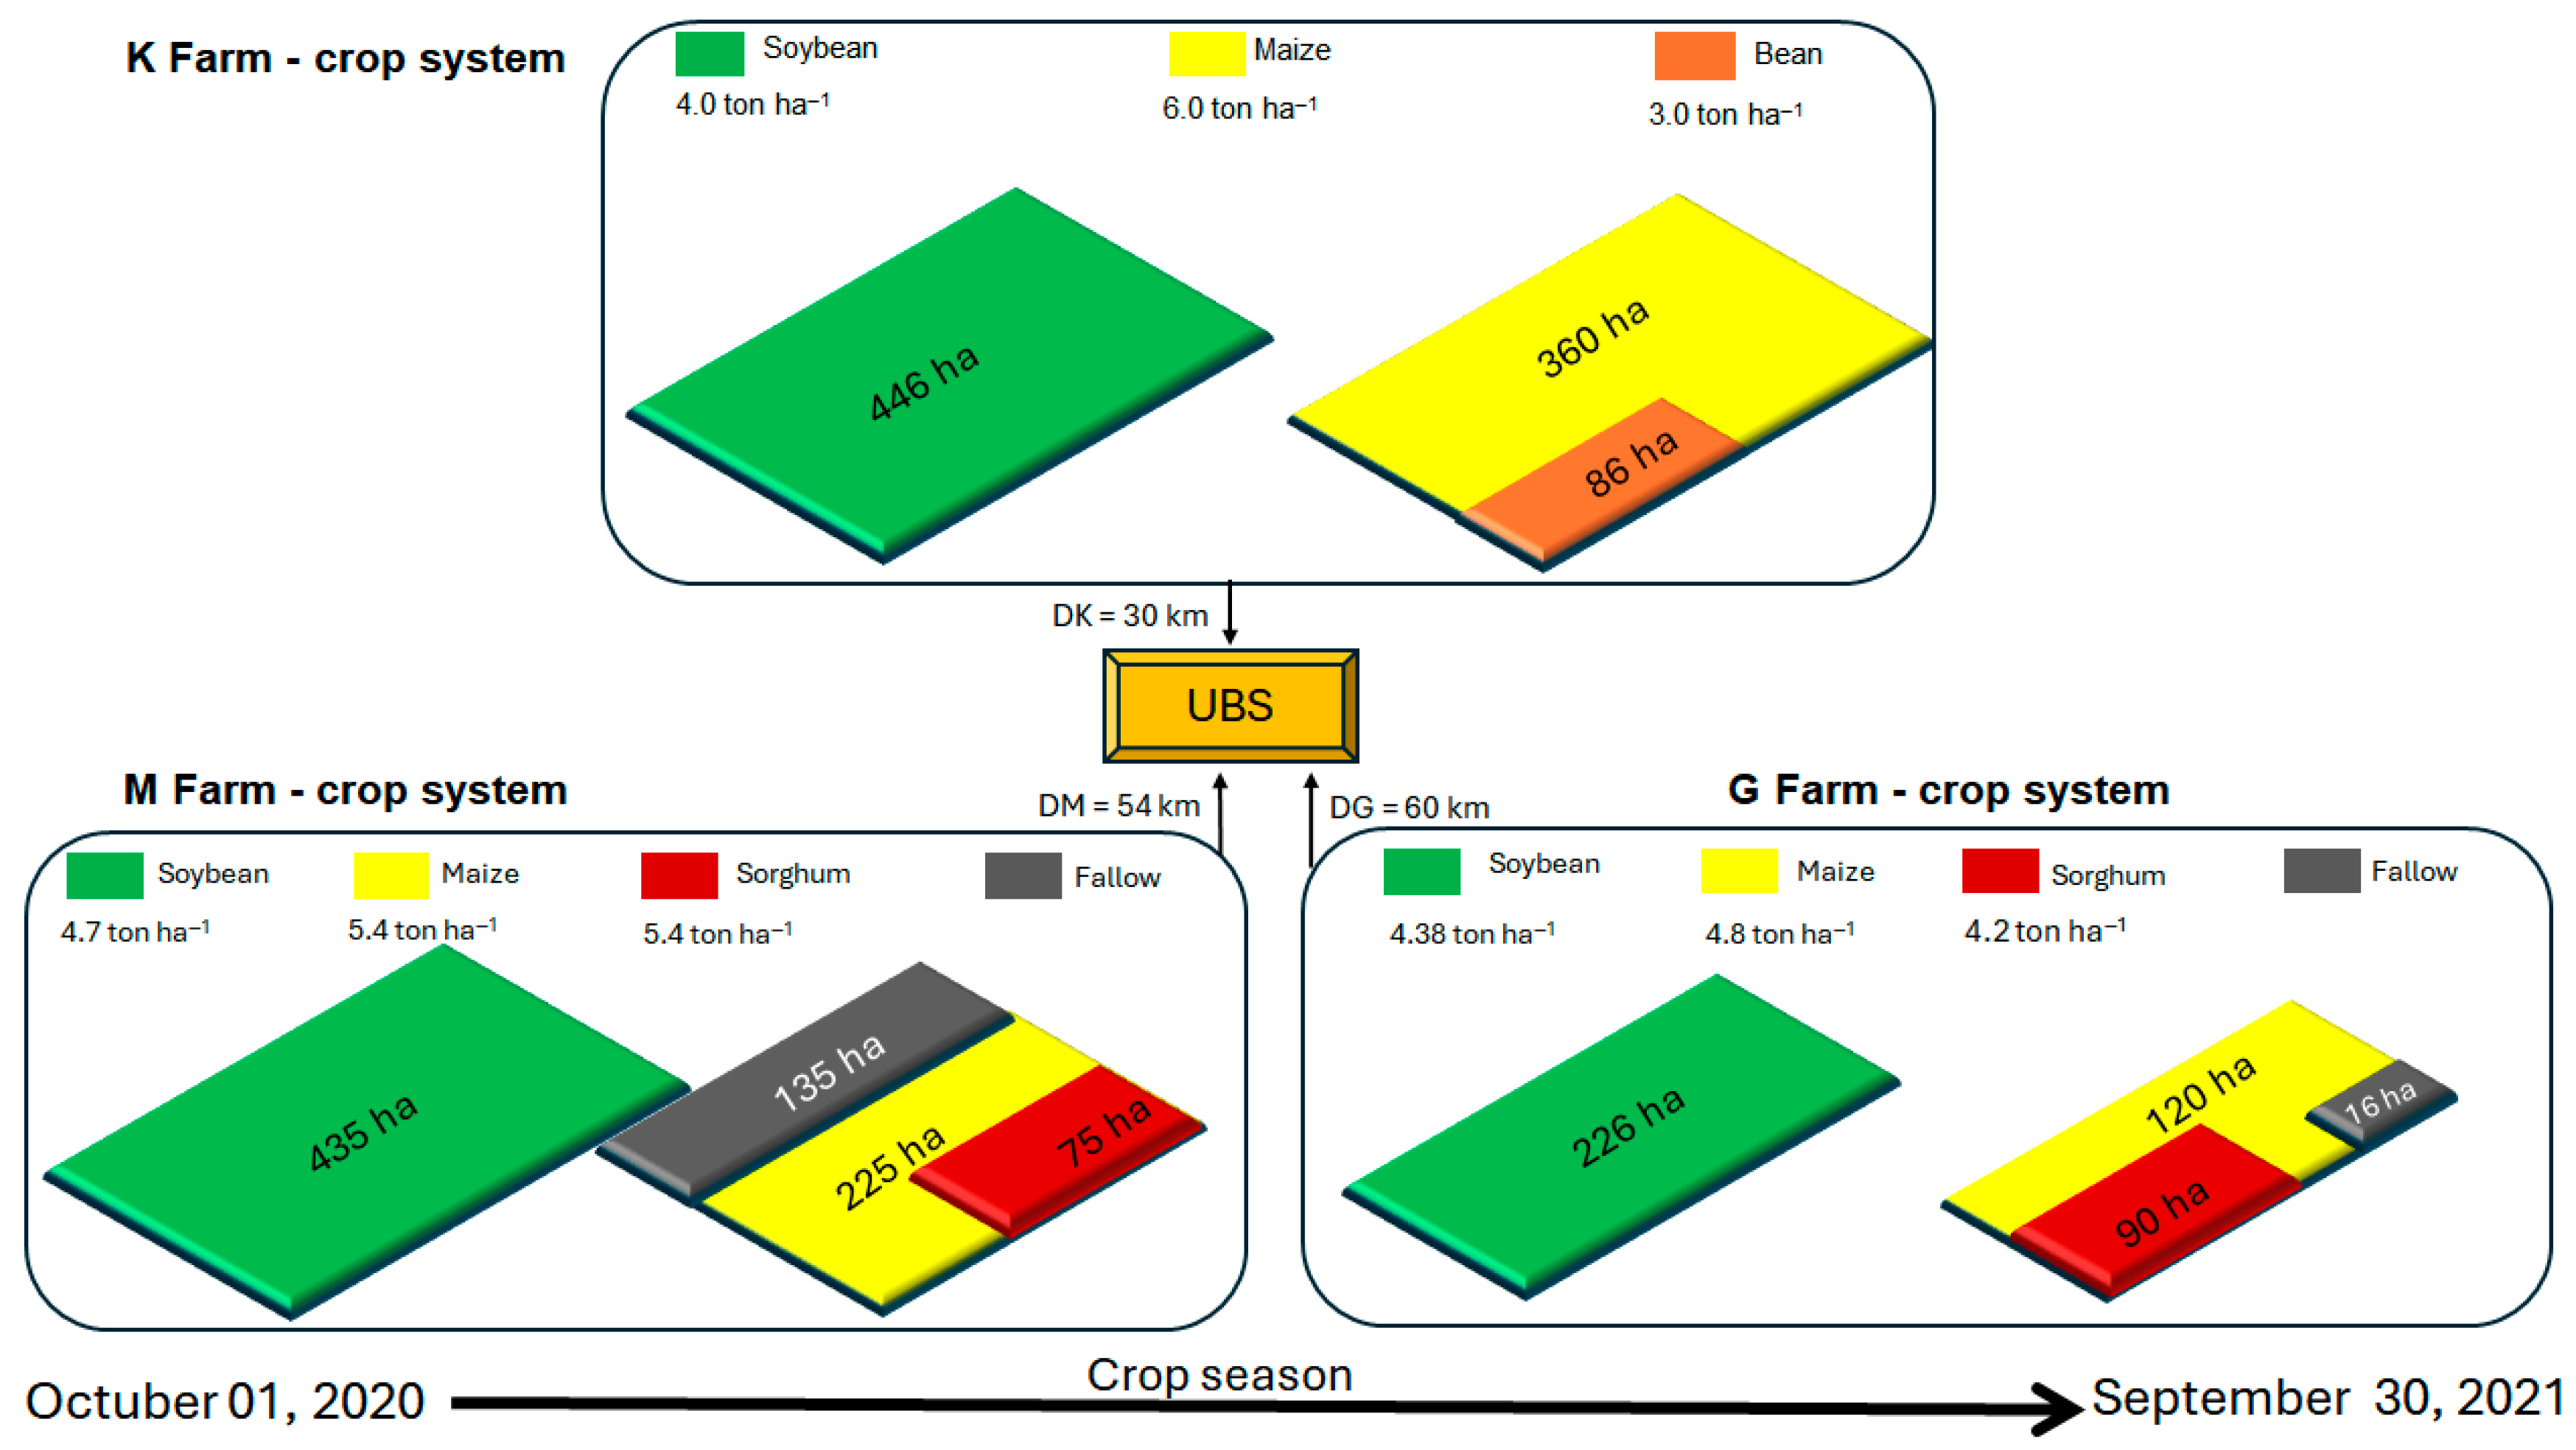
Figure 1. Schematic figures showing soybean production systems in each of the farms (K, M and G) with their main crop sequences (first crop, green square). Crop rotation systems, production areas (second crop, ha) crop yields and the distances from each farm to UBS (DK, DM, DG in km).
Agriengineering 07 00258 g001
Figure 2. Soybean GHG emissions profile for each emission source (kg CO2eq ha−1) from agricultural production phase for the three evaluated farms ((a): K, (b): G and (c): M), total emissions for agricultural phase and soybean productivity (Mg ha−1) for each farm.
Agriengineering 07 00258 g002
Figure 3. Profile of GHG emissions and total emissions (pink bar, Mg CO2eq) for a total soybean seed processed of 10,800 Mg (UBS: Seed processing plant) for one (01) year-crop season (1 October 2020 to 30 September 2021).
Agriengineering 07 00258 g003
Figure 4. Profile of farm K GHG emissions (kg CO2eq ha−1) for the three crops in rotation (System) and the total emissions (blue bars) from the agricultural phase for each crop: (a) soybeans (first crop, 446 ha), (b) maize (second crop, 360 ha) and (c) beans (second crop, 86 ha).
Agriengineering 07 00258 g004
Figure 5. Greenhouse gas emissions (kg CO2eq ha−1) for the three farms evaluated: K, M and G with respective emissions for each crop in rotation and, the system CO2 footprint for each farm (kg CO2eq ha−1) for one (01) year-crop season (1 October 2020 to 30 September 2021).
Agriengineering 07 00258 g005
Figure 6. Profile of farm M GHG emissions (kg CO2eq ha−1) for the three crops in rotation (System) and the total emission (blue bars) from the agricultural phase for each crop: (a) soybeans (first crop, 435 ha), (b) maize (second crop, 225 ha) and (c) sorghum (second crop, 75 ha) and a fallow area with 135 ha.
Agriengineering 07 00258 g006
Figure 7. Profile of farm G GHG emissions (kg CO2eq ha−1) for the three crops in rotation (System) and the total emission (orange bars) from the agricultural phase for each crop: (a) soybeans (first crop, 226 ha), (b) maize (second crop, 120 ha) and (c) beans (second crop, 90 ha) and a fallow area with 16 ha.
Agriengineering 07 00258 g007
Figure 8. (a) Profile of emissions sources from soybean production from farm K (emission from production, transport and use of inputs), and (b) profile of emissions from the same farm K separating emissions from the production and transport phase of inputs (green bars) from emissions of the use or application into the farm gate (red).
Agriengineering 07 00258 g008
Table 1. Emission sources and respective greenhouse gases (GHG) emissions for soybean seed production (agricultural sector, soybean seed transport and UBS, seed processing plant). Phases considered the production of soybean seeds and respective crop rotations for 03 farms in the 2020/21 harvest season (1 October 2020 to 30 September 2021).
SectorEmission sources
Agriculture
Diesel and gasoline from agricultural operations and labor transport
CO2
CH4
N2O
Direct and indirect emissions from N2O
-N Synthetic fertilizer
-N from organic composts
-N from agricultural residues
-Emissions from herbicides, fungicides and insecticides
Transports
Diesel emission from farms until UBS
CO2
CH4
N2O
UBS
(Seed processing plant)
Emission from Liquefied Petroleum Gas (LPG))
Emission from electricity use
Firewood burning emission—soybean drying
Diesel and gasoline from labors transport
Table 2. Parameters and inputs for soybean seed production, for farms K, M and G. (Period of 1 year—1 October 2020, to 30 September 2021).
Parameters and Inputs Farm KFarm MFarm G
UnitsAmountAmountAmount
Production area (Soybean) Hectares446435226
Total production (grains—soybean)Mg17842036989.8
Soybean ProductionBags (60 kg)29,73333,93316,496
ProductivityBags 60 kg ha−166.77873
FertilizersFormula07.33.0705.37.0011.52.00
kg300300220
N fertilizer kg N ha−1211524.2
P2O5kg ha−199111114.4
K2Okg ha−1219660
Pesticides (active ingredient)kg or L a.i. ha−1
Glyphosatekg2.52.03.5
Insecticide
L ha−1MetoxyfenozideBifenthrin/carbosulfanAcetamiprid/bifenthrin
0.60.50.25
FungicidesL ha−1Pyraclostrobin/fluxapiroxidPyraclostrobin/fluxapiroxidPicoxystrobin/benzovindiflupyr
1.20.40.6
Lime (dolomitic)Mg ha−10.7500.4500.288
Diesel (Agricultural phase)L ha−1393435
Diesel (Administrative)L100020001150
Gasoline (Transport—home to farm)L2000280250
Diesel (Grain transport—farm to UBS *)L198240181650
* UBS: Soybean seed processing plant.
Table 3. Sequence of crop rotation system for each farm, K, M and G, respective crop yield (Mg ha−1), area planted (ha), crop/fallow GHG emissions (kg CO2eq ha−1 year−1), crop Cf (carbon footprint, kg CO2eq Mg−1 of grain) for each crop, system Cf for each farm and respective rotation system (kg CO2eq ha−1 year−1) and estimated amount of C (soil or biomass) to offset each crop system GHG emissions (Kg C year−1).
Crop Rotation SystemsCrop YieldAreaCrop/Fallow EmissionCrop Cf System CfC to Offset Emissions
Farm K (Soybean)4.00446974.4243.62413657.4
Farm K (Maize)6.003601532.9255.5
Farm K (Bean)3.00861042.6347.6
Farm M (Soybean)4.704351030.4219.22209601.9
Farm M (Sorghum)5.40225663.9 122.9
Farm M (Maize))5.401351973.3365.4
Farm M (Fallow) 75663.9-
Farm G (Soybean)4.402261184.1269.12096571.1
Farm G (Sorghum)4.2090759.6180.9
Farm G (Maize)4.801201514.4315.5
Farm G (Fallow) 16155.5-
Disclaimer/Publisher’s Note: The statements, opinions and data contained in all publications are solely those of the individual author(s) and contributor(s) and not of MDPI and/or the editor(s). MDPI and/or the editor(s) disclaim responsibility for any injury to people or property resulting from any ideas, methods, instructions or products referred to in the content.