Abstract
Indoor horticulture requires a substantial quantity of electricity to meet crops extended photoperiodic requirements for optimal photosynthetic rate. Simultaneously, global electricity costs have grown dramatically in recent years, endangering the sustainability and profitability of indoor vertical farms and/or modern greenhouses that use artificial lighting systems to accelerate crop development and growth. This study investigates the growth rate and physiological development of cherry tomato plants cultivated in a pilot indoor vertical farm at the Agricultural University of Athens’ Laboratory of Farm Structures (AUA) under continuous and disruptive lighting. The leaf physiological traits from multiple photoperiodic stress treatments were analyzed and utilized to estimate the plant’s tolerance rate under varied illumination conditions. Four different photoperiodic treatments were examined and compared, firstly plants grew under 14 h of continuous light (C-14L10D/control), secondly plants grew under a normalized photoperiod of 14 h with intermittent light intervals of 10 min of light followed by 50 min of dark (NI-14L10D/stress), the third treatment where plants grew under 14 h of a load-shifted energy demand response intermittent lighting schedule (LSI-14L10D/stress) and finally plants grew under 13 h photoperiod following of a load-shifted energy demand response intermittent lighting schedule (LSI-13L11D/stress). Plants were subjected also under two different light spectra for all the treatments, specifically WHITE and Blue/Red/Far-red light composition. The aim was to develop flexible, energy-efficient lighting protocols that maintain crop productivity while reducing electricity consumption in indoor settings. Results indicated that short periods of disruptive light did not negatively impact physiological responses, and plants exhibited tolerance to abiotic stress induced by intermittent lighting. Post-harvest data indicated that intermittent lighting regimes maintained or enhanced growth compared to continuous lighting, with spectral composition further influencing productivity. Plants under LSI-14L10D and B/R/FR spectra produced up to 93 g fresh fruit per plant and 30.4 g dry mass, while consuming up to 16 kWh less energy than continuous lighting—highlighting the potential of flexible lighting strategies for improved energy-use efficiency.
1. Introduction
Vertical farming is an innovative and sustainable agricultural system that enables plant growth in indoor, fully isolated, climate-controlled and automated indoor. These systems utilize advanced technologies to enhance automation and improve resource-use efficiency. In vertical farms (VFs) crops grow under carefully selected and highly precise conditions that support optimal growth and year-round production [1]. The use of hydroponic techniques in indoor environments reduces water consumption by 70–95%, maximizes land-use efficiency, lowers the carbon footprint of crops by eliminating food miles (and the associated emissions from transportation and storage), and boosts yields by 76–116%, delivering fresh, nutrient-rich produce to urban and peri-urban populations [2,3].
Light is a fundamental factor in plant growth and development, primarily due to its role in driving photosynthesis. For plants to respond optimally to light radiation, it is essential to understand their reactions across three key dimensions: light quality (spectrum), light intensity (photosynthetically active radiation, PAR), and light duration (photoperiod). A precise understanding of these parameters can help reduce energy demand, especially considering that lighting accounts for approximately 40% of total production costs in vertical farms, with 70–80% of energy consumption attributed to lighting systems [4]. Optimizing these variables allows for improved energy and light-use efficiency without compromising crop yield or quality.
The entire life cycle of plants is shaped by fluctuations in the light environment. Plants perceive these changes and adjust key physiological functions accordingly, including seed germination, stomatal opening for gas exchange, and the initiation of flowering [5].The critical photoperiod is the threshold at which light duration shifts from non-inductive to inductive for plant development, particularly flowering. This threshold varies widely among species and even among cultivars of the same species. Based on photoperiodic responses, plants are categorized as long-day, short-day, or day-neutral. Long-day plants flower when exposed to light durations exceeding their critical photoperiod, while short-day plants flower under shorter durations. In contrast, day-neutral plants initiate flowering independently of photoperiod, relying instead on other factors such as temperature or growth stage [6]. In controlled environments like indoor vertical farms, selecting the appropriate photoperiod is crucial to balancing energy use and plant productivity. Lighting schedules must provide sufficient exposure to promote growth while minimizing energy consumption [7]. Photoperiodism significantly influences plant productivity and quality at various growth stages [8,9,10]. Matthijs et al. (1996) [11] observed that prolonged periods of darkness during the day tend to reduce plant growth. However, under intermittent lighting, a reduction in total light flux appears to affect growth less severely than an equivalent reduction under continuous lighting. Disruptive lighting, which involves short bursts of light at set intervals, is designed to optimize the saturation of photochemical processes during each cycle. This strategy may help better define the balance between photochemical and non-photochemical reactions, improving energy efficiency without impairing photosynthetic function.
A previous study by Avgoustaki (2021) [10] showed that basil plants grown under a reduced photoperiod of 14 h (compared to the 16-h optimal) exhibited no visible differences in growth or development. However, despite favorable plant performance, electricity prices do not remain consistently low throughout the day, making it challenging for growers to optimize energy use. This motivated the current study, which investigates cherry tomato plants—a highly suitable crop for indoor vertical farming—under continuous lighting (14 h), intermittent lighting with a normalized pattern, a load-shifted intermittent scheme, and a reduced photoperiod (13 h). Additionally, the study evaluates how different light spectra (WHITE vs. B/R/FR) affect plant development, growth rate, and biomass production in relation to energy demand.
Plant growth is closely linked to the amount of light reaching the leaves [12]. Light consists of various wavelengths within the electromagnetic spectrum. During photosynthesis, plants primarily utilize the visible portion of the spectrum (400–700 nm), known as photosynthetically active radiation (PAR) [13]. Shorter wavelengths (blue) are more effective during early growth stages, while longer wavelengths (red) support later developmental phases. Blue (~400 nm) and red (~700 nm) light are the most efficient for activating chlorophyll and driving energy production, whereas green light is absorbed less effectively [14]. Infrared light (700–800 nm) is also noteworthy. In some species requiring extended photoperiods, flowering is enhanced when red and infrared light are combined, compared to red light alone [14].
In nature, the Earth’s rotation causes the regular alternation of day and night, which regulates several key plant functions as previously discussed. In controlled environments such as vertical farms (VFs), photoperiod is decoupled from natural daylight cycles and instead controlled by the grower, who can tailor lighting schedules based on crop requirements. One such approach is interrupted lighting, which divides the typical 24-h cycle into shorter light and dark intervals [4,15,16].
Previous studies [4,10] have shown that plants cultivated in indoor environments can maintain productivity and growth under reduced and intermittent photoperiods. Specifically, no significant differences in growth or development were observed between basil plants grown under continuous 16-h lighting and those grown under an intermittent 14-h regime, including a load-shifted energy demand response pattern. Despite these promising results, there remains a need for intelligent energy systems that offer flexible, low-cost electricity during daytime hours—enabling growers to schedule lighting operations during more economical time blocks. This motivated our investigation into how plants respond to intermittent lighting systems aligned with low electricity demand and pricing periods, such as those observed in countries like Denmark, Iceland, and Germany. In this study, we measured key physiological and environmental parameters—including chlorophyll content, photosynthetic and transpiration rates, stomatal conductance, and light exposure—from germination to harvest in cherry tomato plants. Ultimately, this research aims to propose a demand-responsive lighting strategy for countries with fluctuating electricity markets—shifting operations to off-peak hours to significantly reduce the energy costs of vertical farms without compromising plant growth.
2. Materials and Methods
2.1. Experimental Setup
The experiment was conducted inside the pilot vertical farm of the Laboratory of Farm Structures at the Agricultural University of Athens. The pilot vertical farm was installed inside a 40 ft (≈30 m2) container-sized cube with external dimensions of 12 m (L) × 2.44 m (W) × 3 m (H). The farm was equipped with 4 growing towers (T1, T2, T3 and T4) with 2 growing layers (L1, L2) per tower. All growing towers were equipped with a close loop Ebb & Flow hydroponic system (Figure 1).
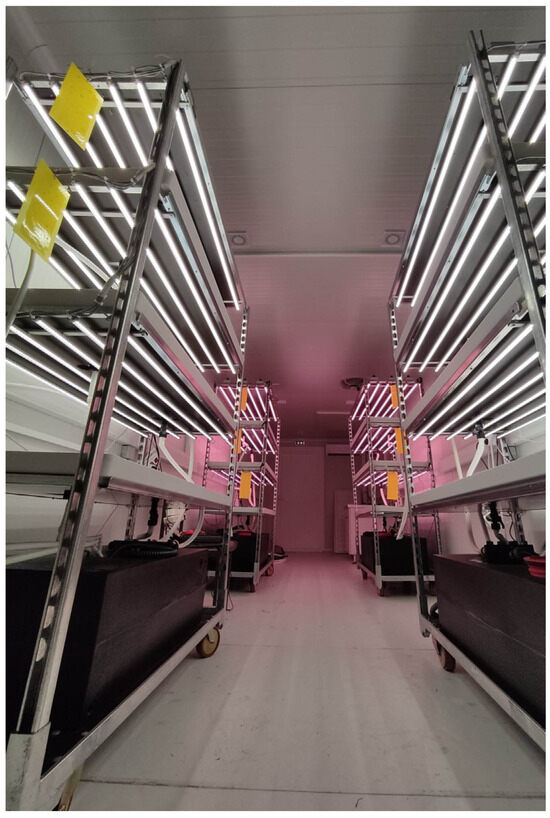
Figure 1.
Interior of the vertical farm facility showing the 4 towers with the two different LED spectra (WHITE and B/R/FR).
Both T1 and T2 were equipped with 12 WHITE LED lamps each (6 in each layer) (Figure 2a). Additionally, T3 and T4 were equipped with 12 Blue–Red–Far Red (B/R/FR) LED spectra combination (Figure 2b). Figure 2 shows the spectral performance of the different LED types. The LED lamps (Vegeled, Colasse, Belgium) of each layer were dimmable to the required light intensity while the photoperiod was able to be controlled automatically with a smart plugging system. Each LED lamp had the following dimensions, 141 × 22 cm with energy demand at 23–24 W/m. DLI (DLI. Daily Light Integral in mol/m2s)) was maintained at 11.5 μmol/m2/day for all towers and all layers.
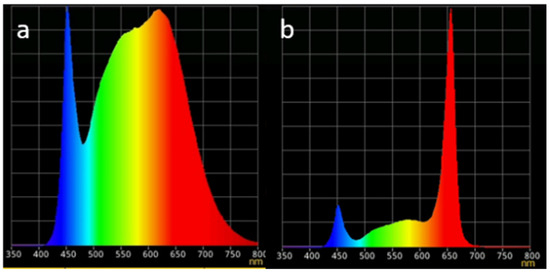
Figure 2.
LED light treatments. (a) White, (b) B/R/FR spectra reflectance combination. X axis: wavelength (in nanometers), Y axis: Reflectance %.
Cherry tomato plants (Timy Tim) were selected for this study, as they are leafy greenery with a small height (rosette formation), small growth cycle high nutritional value, high yield production and high purchase value that makes it a great choice for cultivation inside vertical farms. The planting density in each layer was 10 × 10 cm resulting in 24 plants per layer and 0.76 m2 of growing area per layer (31.5 plants/m2). In each layer, seedling plants of 2 weeks were transplanted with their growing substrate which was selected to be rockwool in this study. The measurements began seven days after transplant, where the plants had developed three pairs of true leaves each. The nutrient solution was applied to plants was retrieved from the online platform NUTRISENSE DSS (https://nutrisense.online, accessed on 25 October 2024) [17]) with pH 5.6 and electrical conductivity (EC) 2.6 dS/m.
According to international literature (Demers & Gosselin, 2002) [18], cherry tomato performs better under long photoperiod and more specifically under 14 h of light followed by 10 h of dark on a daily basis. However, in vertical farms that use solely artificial lighting for providing light to the crops, high photoperiodic demand equals important operational costs that could lead to higher risk for the farms, and often, unprofitable cases of reduced energy use efficiency. Table 1 and Figure 3 summarize and illustrate respectively the different DLI treatments applied in each layer of all towers.

Table 1.
Lighting conditions applied in all four growing towers per layer.
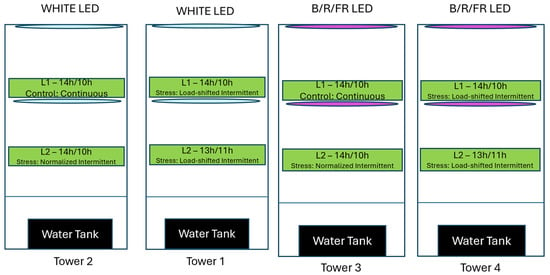
Figure 3.
The four different towers and the different treatments applied in each layer. Every treatment applied in each layer is described analytically in each green box.
The climate conditions inside the indoor vertical farm were maintained for the air temperature of the indoor environment at 25 °C during the light period and at 22 °C during the dark period. The relative humidity was maintained at 50–55% and the atmospheric CO2 at 500–600 ppm. The experiment lasted for 50 days and after the completion of daily data collection, plants were harvested and evaluated with post-harvest measurements that included plants’ size (length in cm), Leaf Area (LA in cm2), Fresh Weight (in g) and Dry Weight (in g) of leaves and fruits.
The total biomass of the plants in each treatment for both different spectra combinations was estimated by the following equation:
where, the growing area was 0.745 m2 within each of the harvested plots. The biomass was measured in g/m2.
Fresh Biomassfruit = Fresh massfruit (g)/growing area (m2)
Dry Biomasfruit = Dry massfruit (g)/growing area (m2)
2.2. Sensors and Data Collection
Cherry tomato plants belong to the category of neutral-day plants, i.e., to grow optimally, these plant flowers regardless of the length of the period of light they are exposed to. Previous literature (Beaman et al., 2009) [19] has noted that the optimal photoperiod for tomato plants is 14 h of light. However, in vertical farms, which only use artificial light sources, this increases the operational costs, leading to higher risk and, often, unprofitable cases. For this reason and to explore the possibilities that fluctuating electricity prices can offer, the total photoperiod of 14 h was divided into smaller light intervals of 10 min (that fit in the electricity pricing scheme of Nordpool market that changes every 15 min in a daily basis). In a study conducted by Avgoustaki et al. (2020) [4], the effects of intermittent lighting (IL) on basil crop both in quality and quantity level were presented. The study, which evaluated the characteristics of basil plants under 16 h of continuous light and 14 h of intermittent light, respectively, showed significant differences of the photosynthetic rate after 19 days of IL application, while the rest of the physiological indices (chlorophyll, stomatal conductance) showed no significant differences. The IL pattern used in the previous research was normalized under ideal conditions with alternating light-dark periods; specifically, three cycles per day consisting of four hours of continuous light followed by four hours of IL with ten-minute light cycles per hour (I14L10D). The purpose of the present research was to examine many different intermittent lighting schedules and assess the impact that has on plants’ growth and development rate as also to their production volume. The upper goal of this study is to examine if disruptive lighting schedules could minimize the energy footprint of indoor cultivation with LEDs by shifting the energy demand response and develop a more flexible lighting scheme by using a dynamic light provision linked to the fluctuating electricity prices in the Nord Pool market. Based on this, we proceeded to analyze the daily fluctuations in electricity prices in Denmark and concluded that the most expensive hours of electricity usage are between 7 a.m. and 10 p.m., including a drop in electricity prices between approximately 1 p.m. and 5 p.m. [20,21]. With this in mind, we designed an additional IL treatment that mimicked the actual fluctuations in electricity prices (I14L10Dshifted). For the actual experiment that was conducted we assumed that the pricing scheme (both in the intermittent lighting and the load-shifted lighting schemes) was identical every day and was running based on that model created and not on the actual hour to hour prices. Finally, we wanted to further reduce the electricity demand of the farm and examine the growth rate of plants under reduced and load-shifted energy demand response, thus we applied an extra treatment (D) with 13 h of daily photoperiod and Figure 4 below illustrates the light treatment used in each layer.
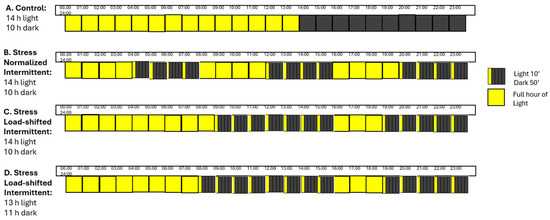
Figure 4.
Light schedules per chamber: [A] Control (C-14L10D) with 14 h light/10 h dark; [B] Stress (NI-14L10D) with 4 h light/4 h dark + 10 min light/h; [C] Stress (LSI-14L10D) with 9 h light/7 h dark + 10 min light/h, then 3 h light/5 h dark + 10 min light/h; [D] Stress (LSI-13L11D) with 7 h light/8 h dark + 10 min light/h, then 3 h light/5 h dark + 10 min light/h.
Measurements of chlorophyll content (CCI. Chlorophyll Content Index) were collected every day from the sample plants (young and fully developed leaves) from each layer of all four growing towers with a portable chlorophyll sensor (CCM–200 plus, OPTI-Sciences, Inc., Hudson, NH, USA). Data was collected every day in multiple hourly sessions in order to reflect plants’ reactions under different lighting schemes. Specifically, plants were monitored for CCI the following timeline: 09:00, 10:00, 11:00, 12:00, 13:00, 14:00, 15:00. All these hourly measurements were selected to compare plants’ CCI under continuous and intermittent lighting and its evolvement on a daily basis including during vegetative, flowering and fruiting phase of plants. Measurements lasted for 50 days in total.
Light intensity was measured both manually and automatically with the portable spectroradiometer uSpectrum (UPRteck/LI-COR) and the pyranometer devices from Apogee Instruments, INC. (SI-400, Logan, UT, USA) that were installed in each layer, respectively. The weights of fresh matter and dry matter of the shoots and the fruits were determined after counting the number of leaves and measuring the surface area with the Li-3100 Area Meter (Li-COR Inc., Lincoln, NE, USA).
Air temperature, Relative Humidity, CO2, and light radiation in every tower as also in every layer per tower. To calibrate the air temperature (Tair in °C), the relative humidity (RH%), and the CO2 concentration inside the vertical farm, a climate sensor (DeltaOHM, Pradua, Italy) was placed inside the growing area in the middle of the container, which automatically logged data every ten minutes. Light radiation was measured with pyranometer sensors (SQ-615-SS, Apogee Instruments Ltd., Logan, UT, USA) that were placed in every layer of all the towers. We used the logged average values of Tair and RH% to calculate the air vapor pressure deficit (VPD) values. To measure the leaf temperature of the cherry tomato plants (Tleaf in °C), we used thermocouples (chromel-constantan, type E) in each layer attached to the surface area of young, fully developed leaves. The measurements were performed at ten-minute intervals, and the data logger recorded the average values of the intervals. To measure the temperature of the hydroponic substrate and the electric conductivity (EC), we used the WET-2 Sensor from Delta-T devices (UK) with the sensor error ± 10 mS*m−1. The data loggers connected to the above sensors in the chamber were GP2 and GP1 and data were downloaded in a daily basis.
Finally, to measure the input of the electrical energy in each layer of every tower, we used the PEL103 power-energy logger (Chauvin Arnoux, West Yorkshire, UK).
2.3. Statistical Analysis
Data were subjected to a one-way analysis of variance (ANOVA) followed by Bonferroni’s multiple comparison test, and LSD post hoc analysis test. The analyses were performed using SPSS for Windows (IBM Statistics for Macintosh, version 25.0). For the statistical analysis, one-way ANOVA was performed on each of the 4 different treatments (C-14L10D, NI-14L10D, LSI-14L10D, LSI-13L11D for White and B/R/FR lamps). Twenty measurements were collected every day from the 24 plants of each layer randomly, for the chlorophyll content measurements. Data from all the physiological parameters studied of the plants were measured daily for 50 days until the end of the experiment.
3. Results
This chapter shows the results from the collected data on various physiological parameters that were examined during the experimental period for the cherry tomato plants.
3.1. Statistical Analysis of Chlorophyll Content Under WHITE LED
To identify statistical differences in terms of the total chlorophyll content (CCI_tot) between the four photoperiodical treatments, the C-14L10D (M = 26.53, SD = 4.4) was compared with NI-14L10D (M = 26.35, SD = 2.5), with LSI-14L10D (M = 25.25, SD = 2.2) and LSI-13L11D (M = 15.72, SD = 3.8) with N = 50. Continuously, one-was ANOVA was used to examine statistically significant differences among treatments. One-was ANOVA showed that the mean values of the treatments C-14L10D, NI-14L10D and LSI-14L0D were statistically significant higher compere to the treatment LSI-13L11D with F (3, 196) = 119.511, p < 0.001. All the other treatments showed no statistically significant differences between groups (Figure 5).
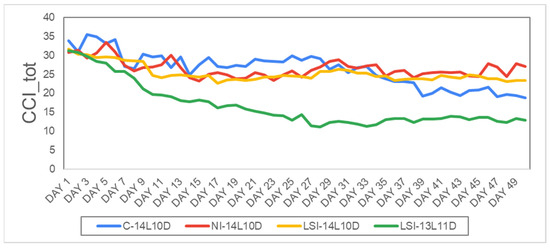
Figure 5.
Average daily evolution of the total chlorophyll content under WHITE LED during the whole experimental period, CCI_tot (in CCI), i.e., C-14L10D (blue line) and stressed plants, i.e., NI-14L10D (red line), LSI-14L10D (yellow line) and LSI-13L11D (green line). Days 1–50.
As mentioned in the methodology section, we measured the chlorophyll content every day and seven times a day from 9 a.m. to 3 p.m. The measurements made during the intermittent treatment took place during the ten-minute light intervals and with limited radiation (for the LSI-13L11D treatment. In the three stress treatments (NI-14L10D, LSI-14L10D and LSI-13L11D), we also measured the chlorophyll content at the end of each continuous light treatment, where the plants had sufficient time to receive, absorb, and process more light radiation and convert the electrical energy into chemical energy. Therefore, we decided to perform a statistical analysis on the chlorophyll content during the ten-minute and continuous light intervals.
The C-14L10D treatment CCI_10-min with (M = 25.9, SD = 4.8) for the ten-minute measurements of the chlorophyll content (CCI_10-min) was compared with the corresponding measurements of the treatment NI-14L10D (M = 25.04, SD = 3.5), the LSI-14L10D treatment (M = 24.13, SD = 2) and the LSI-13L11D (M = 16.3, SD = 7) with N = 50 in all the four samples. A one-way ANOVA was conducted for each of the four groups, showing a statistically significant lower LSI-13L11D compared to the other three treatments that presented no significant differences between ethe groups at F (3, 196) = 43.201, p < 0.001. These results suggest that disruptive lighting, when applied for ten minutes under 14 h of daily photoperiod, has no negative impact on plant growth rate (Figure 6a).
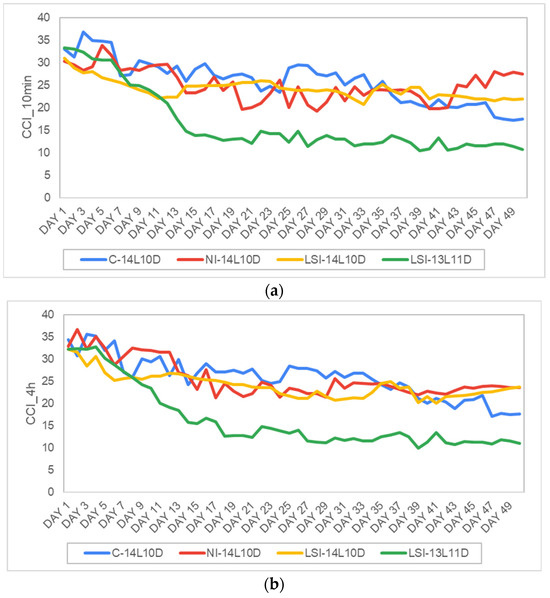
Figure 6.
Average daily evolution of (a) the chlorophyll content during the ten minutes light period CCI_10 min (in CCI), and (b) the chlorophyll content during the 4-h light period CCI_4 h (CCI) for control plants, i.e., C-14L10D (the blue line) and stressed plants, i.e., NI-14L10D (the red line), LSI-14L10D (the yellow line) and LSI-13L11D (the green line). Days 1–50.
Subsequently, we conducted a comparison between the mean values of the CCI under continuous time intervals. Specifically, the NI-14L10D treatment with the three continuous light periods lasted four hours each, while for the LSI-14L10D treatment, the first continuous light period lasted nine hours and the second period lasted three hours and finally, for the LSI-13L11D the continuous light lasted 7 h and the second period lasted three hours. For practical reasons, we refer to this as a ‘4-h’ light period for all stress treatments (CCI_4h). One-way ANOVA was used to compare the 4-h time intervals in the C-14L10D treatment (M = 25.85, SD = 4.5, N = 50), the NI-14L10D treatment (M = 25.64, SD = 4.1, N = 50) and the LSI-14L10D treatment (M = 24.05, SD = 2.8, N = 50) showed no statistically significant difference among the groups with F (2, 108) = 0.132, p = 0.876. However, the treatment LSI-14L10D (M = 16.22, SD = 6.9, N = 50) was statistically significantly lower compared to all the other treatments with F (3, 196) = 44.301, < 0.001 (Figure 6b).
The above results indicate that cherry tomato plants under disruptive lighting continued growing at a steady pace such as plants under continuous light. It should also be mentioned that based on results, reduced photoperiod by one hour had a negative impact on the growth rate of plants.
3.2. Statistical Analysis of Chlorophyll Content Under B/R/FR LED
Similarly, one-way ANOVA analysis was conducted between the four identical photoperiodic treatments but under the B/R/FR LED lamps. For the total chlorophyll content (CCI-tot) that was measured on the four treatments, C-14L10D (M = 28.74, SD = 1.9, N = 50), NI-14L10D (M = 28.49, SD = 1.8, N = 50), LSI-14L10D (M = 29.27, SD = 1.5, N = 50) and LSI-13L11D (M = 26.23, SD = 1.8, N = 50), one-way ANOVA showed no statistically differences between the first three treatments (C-14L10D, NI-14L10D and LSI-14L10D) and all of them are statistically significant higher compare to the treatment LSI-13L11D at F (3, 196) = 11.659, p < 0.001 (Figure 7).
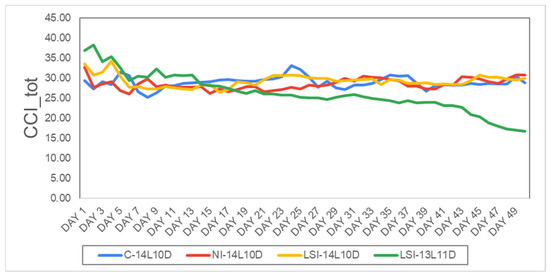
Figure 7.
Average daily evolution of the total chlorophyll content under B/R/FR LED during the whole experimental period, CCI_tot (in CCI), i.e., C-14L10D (blue line) and stressed plants, i.e., NI-14L10D (red line), LSI-14L10D (yellow line) and LSI-13L11D (green line). Days 1–50.
Additionally, the CCI_4h between the treatments C14L10D (M = 28.64, SD = 1.5, N = 50), NI-14L10D (M = 29.19, SD = 1.2, N = 50), LSI-14L10D (M = 29.91, SD = 2.2, N = 50) and the LSI-13L11D (M = 26.06, SD = 2.3, N = 50) showed statistically significant differences. Specifically, the control treatment, C-14L10D was significantly lower compared to LSI-14L10D at p < 0.17, significantly higher compared to LSI-13L11D at p < 0.001 and had no statistically significant differences compared to the treatment NI-14L10D at F (3.196) = 20.427, p = 0.302. Furthermore, the normalized intermittent treatment (NI-14L10D) showed statistically significant higher results only compared to the LSI-13L11D and no differences with all the other treatments. Finally, the reduced photoperiodic treatment LSI-13L11D was significantly lower compared to all the other treatments (Figure 8a).
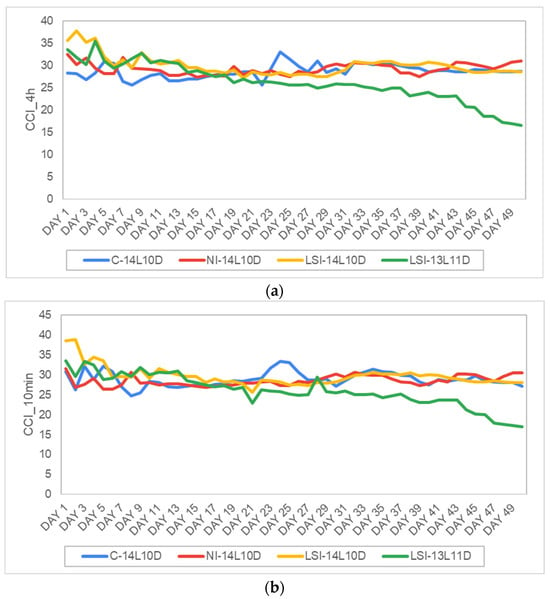
Figure 8.
Average daily evolution of (a) the chlorophyll content during the ten minutes light period CCI_10min (in CCI), and (b) the chlorophyll content during the 4-h light period CCI_4 h (CCI) for control plants, i.e., C-14L10D (the blue line) and stressed plants, i.e., NI-14L10D (the red line), LSI-14L10D (the yellow line) and LSI-13L11D (the green line). Days 1–50.
Finally, all the treatments were analyzed also under the 10 min time intervals as it was performed for the WHITE Led lamps. One-was ANOVA results showed that the treatment C-14L10D (M = 28.89, SD = 1.8, N = 50) showed no statistically significant differences compared to the other treatments, apart from the treatment LSI-13L11D (M = 25.94, SD = 4, N = 50) that was significantly lower at p < 0.001. Continuously, the treatment with the normalized intermittent radiation, NI-14L10D (M = 28.52, SD = 1.3, N = 50) was significantly lower compare to the load-shifted intermittent radiation treatment, LSI-14L10D (M = 29.68, SD = 2.4, N = 50) at p = 0.28 and significantly higher compare to the treatment LSI-13L11D at p < 0.001 (Figure 8b).
3.3. Quantity and Morphological Evaluation of Cherry Tomato Grown Under WHITE Led Lamps
The duration of the experiment was 50 days for all the four treatments (C-14L10D, NI-14L10D, LSI-14L10D and LSI-13L11D) and the two different light spectra combinations (WHITE and B/R/FR). At the end of the experiment, plants were harvested and were measured for their quantity characteristics. Specifically, leaf area (LA) measured at the end of the experiment obtained with the destructive method showed significant differences among the treatments. Control treatment C-14L10D (M = 756, SD = 37, N = 18) and the normalized intermittent treatment, NI-14L10D (M784, SD = 25, N = 18) had no significant differences with each other, while they were both significantly higher compare to the treatments LSI-14L10D (M = 434, SD = 20, N = 18) and LSI-13L11D (M = 439, SD = 37, N = 18) at p = 0.001.
Based on the results presented in Table 2, Fresh Mass of fruits showed no statistically significant differences for the first three treatments, while it was significantly lower for the treatment LSI-13L1D compared to all the other treatments. Similar results are observed for the Dry Mass of fruits were LSI-13L11D was significantly lower compared to the other treatments. No significant differences are observed for the dry mass of leaves between all the four treatments.

Table 2.
Effect of different lighting treatments (under WHITE spectrum) to morphological characteristics of cherry tomato plants. Different letters indicate statistically significant5 differences at level p ≤ 0.05.
3.4. Quantity and Morphological Evaluation of Cherry Tomato Grown Under B/R/FR Led Lamps
One-way ANOVA was conducted also for the plants under the B/R/FR lamps for the measurements that resulted after the destructive methodology that was performed. From data analysis, it is observed that the number of fruits was statistically significantly lower compared to the fruits that were collected from the plants that grew under WHITE Led lamps at t(92.086) = −2.597, p = 0.12. Additionally, plants under LSI-14L10D showed the highest results of Fresh and Dry mass of fruits under B/R/FR lamps.
Worth to mention that statistical analysis and specifically t-test, between the two different spectra was conducted to detect significant differences of the morphological characteristics of the plants. Based on analysis, plants under White Led resulted with higher values of Fresh mass of fruits (M = 87.5, SD = 45, N = 58) compared to plants under B/R/FR lamps (M = 79.3, SD = 47, N = 58) with t(112) = −0.932, p = 0.735. On the contrary, dry mass of fruits showed no statistically significant differences between the two light spectra compositions (Table 3).

Table 3.
Effect of different lighting treatments (under B/R/FR spectrum) to morphological characteristics of cherry tomato plants. Different letters indicate statistically significant5 differences at level p ≤ 0.05.
4. Discussion
This study aimed to enhance the sustainability, efficiency, and flexibility of indoor cultivation by designing and testing a more cost-effective and environmentally friendly lighting strategy capable of meeting urban demand for fresh vegetables. In particular, it focused on indoor vertical farms, which rely entirely on artificial lighting as the primary source of radiation for photosynthesis. Because of the extended daily photoperiods and high lamp intensities required, optimizing lighting schedules has a major impact on operational costs. Therefore, distributing lighting more flexibly—while maintaining yield and quality—could allow growers to better align electricity use with market demand and reduce overall expenses. To test this hypothesis, the study evaluated four distinct photoperiodic treatments and two lighting spectra using a range of physiological and morphological indicators to assess plant growth and development.
Teskey et al. (1995) [22] highlights the importance of environmental factors such as light, water, and CO2 in regulating photosynthesis, as they directly influence the rate of underlying chemical reactions. In addition to these direct factors, various physiologically active compounds and structural elements underpin the light and dark reactions of photosynthesis. These components form the photosynthetic apparatus, shaping the plant’s physical structure, the arrangement of photosynthetic organs, and the nutrients required for energy conversion. To evaluate the plants’ physiological responses to intermittent lighting, we monitored chlorophyll content daily, as chlorophyll serves as a key indicator of photosynthetic efficiency and overall plant health [23,24]. Light is a key abiotic factor influencing plant development and biomass accumulation. The efficiency with which plants capture light depends on the interaction between leaf optical properties and their physiological-biochemical characteristics. As light passes through the epicuticular layers, it interacts with the cuticle and epidermal tissues, affecting internal processes such as CO2 uptake and gas exchange. Savvas (2016) [25] emphasized the importance of photoperiodic responses, particularly in leafy crops such as tomatoes, where optimizing the light period can promote flowering and reduce vegetative shoot formation. However, as reported in the literature, tomatoes are considered day-neutral with respect to flowering, meaning that their flowering time is not directly influenced by photoperiod [26].
The ‘Tiny Tim’ cultivar (Lycopersicum esculentum var. cerasiforme) is a photophilic plant, meaning it requires a high light intensity for optimal growth [27]. Its fruits are considered high-value due to their appealing sweetness and quality [28], as well as their rich nutritional profile—including carotenoids, vitamin C, and vitamin A. Studies have also linked cherry tomato consumption to potential health benefits, such as reduced risk of cardiovascular disease and certain cancers. Consequently, the combination of flavor and antioxidant content contributes to the cultivar’s high market demand [29]. In cherry tomato cultivation, fruit production is the primary objective. Enhancing yield while maintaining high fruit quality is therefore essential.
Given the critical role of light in both the qualitative and quantitative development of plants [24], we examined their photosynthetic behavior under both continuous and intermittent lighting conditions. In previous research, Avgoustaki et al. (2020) [4] demonstrated that the duration and frequency of dark periods influence plant responses in subsequent light phases. Interestingly, plants were able to maintain photochemical output even with minimal light exposure, particularly when light was applied early during periods of high radiation. Grobbelaar et al. (1996) [30] also noted that longer dark phases do not necessarily improve photosynthetic efficiency, highlighting the need for balance in light/dark cycles. Supporting this, several studies [30,31] have shown that optimizing the timing and duration of these cycles can significantly improve plant performance. Iluz et al. (2012) [31] further observed that plants absorb the necessary radiation during light phases and continue utilizing it during subsequent dark periods. Our own results confirmed that plants under intermittent, load-shifted light maintained comparable growth rates to those under continuous light. However, a reduced photoperiod of 13 h resulted in decreased growth and development across both light spectra (see Figure 9 and Figure 10). As previously stated, photosynthetic efficiency is directly proportional to light intensity, quality (spectrum) and duration, as well as to the plants’ endogenous and exogenous rhythms. Wavelengths are sensed by specialized proteins known as photoreceptors. Photoreceptors receive light ranging in wavelength from ultraviolet to near infrared. The specific roles of UV-B photoreceptors remain unclear, but it is known that phytochromes detect red and near-infrared light [32]. Photoreceptors regulate critical plant functions such as seed germination, flowering, and shoot elongation, with several known types including phyA and phyB. Blue light is detected by three classes of UV-A photoreceptors:
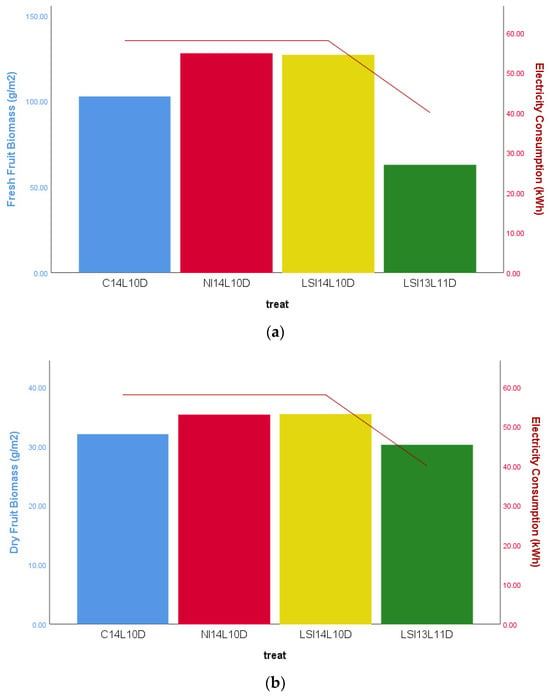
Figure 9.
Histograms of Electricity Demand on the four treatments under the WHITE Led lamps. (a) The left axis (histograms): The average Fresh Fruit Biomass (g × m−2). The right axis (line): The average electrical energy consumption to produce cherry tomato (kWh) grown under the four light treatments. (b) The left axis (histograms): The average Dry Fruit Biomass (g × m−2). The right axis (line): The average electrical energy consumption to produce cherry tomato (kWh) grown under the four light treatments. Electricity consumption was statistically significant lower under the 13L11DLSI treatment compared to the other three at p ≤ 0.005.
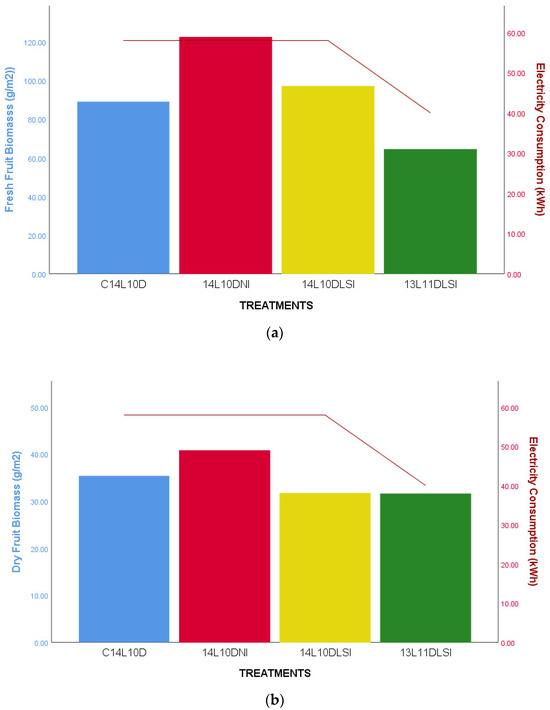
Figure 10.
Histograms of Electricity Demand on the four treatments under the B/R/FR Led lamps. (a) The left axis (histograms): The average Fresh Fruit Biomass (g × m−2). The right axis (line): The average electrical energy consumption to produce cherry tomato (kWh) grown under the four light treatments. (b) The left axis (histograms): The average Dry Fruit Biomass (g × m−2). The right axis (line): The average electrical energy consumption to produce cherry tomato (kWh) grown under the four light treatments. Electricity consumption was statistically significant lower under the 13L11DLSI treatment compared to the other three at p ≤ 0.005.
- Cryptochromes, which respond to near-UV and blue light and regulate circadian rhythm, leaf expansion, and photomorphogenesis;
- Phototropins, which control directional growth (phototropism) and stomatal opening;
- Zeitlupe proteins, which play roles in circadian rhythm regulation.
In our study, plants grown under B/R/FR light exhibited significantly enhanced leaf growth and fruit production compared to those under white light, indicating that spectrum optimization can promote desirable plant traits.
Circadian rhythms control the timing of physiological, developmental, and reproductive processes in plants, including stomatal opening and protein turnover. These rhythms adapt to environmental cues such as day length and geographic latitude. Although modifying circadian rhythms may enhance crop performance, current evidence remains limited [33]. Circadian rhythms also regulate dark-phase activity, including Rubisco efficiency and glyceraldehyde-3-phosphate (GAP) synthesis [34]. In an experiment by Fredeen et al. (1991) [35], Phaseolus vulgaris plants under continuous light retained circadian-regulated fluctuations in photosynthesis-related metabolites. Rubisco and PGA concentrations declined during perceived “night” periods, while GAP increased, suggesting that GAP may influence photosynthesis during non-saturating light exposure. When photosynthesis exceeds the plant’s phosphate recycling rate, it slows due to phosphate triose limitations—referred to as reduced “sink strength” [36]. Chlorophyll, a green pigment with a central magnesium ion, is embedded in chloroplast thylakoid membranes and plays a central role in capturing and transferring light energy during photosynthesis [23,37]. Beyond its photosynthetic function, chlorophyll serves as a reliable indicator of plant physiological status. Ratios of chlorophyll a to b reflect stress responses and nutrient availability. Under intermittent lighting, reduced Chl b levels may impair light-harvesting complex (LHC) efficiency, leading to diminished light absorption. These complexes also include carotenoids and are essential for optimal photosynthesis [10,38]. Additionally, chlorophyll fluorescence—emitted when stimulated by light—is widely used as a non-invasive tool to assess plant stress and photosynthetic performance. Previous study [39] have shown that chlorophyll accumulation in early plant growth is influenced more by total daily light radiation than by the duration of dark intervals. As previously stated, the photosynthetic rate during the disruptive photoperiod is heavily dependent on the interruption and sequencing of dark intervals. In our experiment, chlorophyll content increased under all treatments except the reduced photoperiod (LSI-13L11D), indicating that shortened dark periods support steady pigment accumulation. This phenomenon can be explained by the behavior of plants exposed to shorter dark periods of light, which grow larger photosystem units, such as large protein complexes implanted in plants’ thylakoid membranes to receive and process light radiation. Thylakoids located in short dark periods generate few but massive photosystems, while thylakoids found in extended dark periods develop modest photosystems, allowing plants to maintain the same rate of chlorophyll accumulation. Notably, photoperiod changes did not appear to disrupt circadian regulation of pigment-binding proteins involved in photosynthetic machinery formation.Lycopene and β-carotene are the dominant carotenoids in tomato fruits, contributing to photosynthesis, pollination, and stress resistance. These compounds also act as antioxidants with proven benefits for human health, including reduced risks of cardiovascular disease and cancer [40].
Knowing that lycopene does not evaporate during drying at 80 °C, [41,42], we can assume that the fruits of plants grown under the B/R/FR spectrum had a higher amount of lycopene and therefore were of higher quality. This hypothesis is also supported by (Li et al., 2021) [43], where in an experiment growing tomatoes under blue, red, white and blue/red light, they observed increased lycopene values in plants grown under the mixed spectrum.
As expected, a continuous and extended photoperiod was associated with higher biomass production. However, Figure 9 shows that under WHITE LED lighting, shifting from continuous to intermittent 14-h photoperiods did not significantly affect cherry tomato plant growth. Both 14-h intermittent lighting treatments produced similar levels of fresh and dry biomass as the continuous lighting condition. In contrast, reducing the photoperiod to 13 h (LSI-13L11D) led to a significant decline in both fresh and dry biomass. Simultaneously, energy consumption was notably lower under this shorter daily light regime. Comparable results were observed under BRFR light, with no statistically significant differences in biomass across treatments. However, the LSI-13L11D treatment consumed only 42 kWh, compared to 58 kWh in the 14-h treatments—indicating notable energy savings. These findings suggest that while reduced lighting can conserve energy, it may compromise productivity, highlighting the importance of balancing photoperiod duration with energy efficiency.
Notably, previous cost–benefit research on load-shifted intermittent lighting for basil plants [44] highlighted the importance of identifying the inertia point—defined as the tolerance period during which leafy crops can withstand light interruptions without performance loss. Accurately determining this point can significantly reduce the operational costs of indoor vertical farms. Specifically, the proposed demand-shifting strategy achieved annual lighting-related electricity savings ranging from 16% to 26%, demonstrating substantial cost reductions. In regions with fluctuating electricity prices, such approaches not only lower procurement costs but also contribute to grid capacity balancing. By integrating demand response strategies, indoor farms gain operational flexibility, reduce unnecessary energy generation, and contribute to a smarter urban energy–food ecosystem. This enables a new, multidimensional business model that aligns indoor vertical farming with energy grid requirements under a holistic sustainability framework.
5. Conclusions
This study evaluated the effectiveness of intermittent and load-shifted lighting schedules in improving the energy-use efficiency of indoor vertical farming systems, while preserving the growth and productivity of cherry tomato (Solanum lycopersicum) plants. Four lighting regimes—continuous, normalized intermittent, load-shifted intermittent, and reduced load-shifted—were assessed under two spectral compositions: broad-spectrum white (WHITE) and a combination of blue, red, and far-red (B/R/FR) LEDs. Their impact on key physiological and morphological parameters was systematically analyzed. The results demonstrate that disruptive lighting patterns—particularly the load-shifted intermittent regime with a 14-h photoperiod (LSI-14L10D)—did not compromise overall plant growth compared to the conventional continuous lighting condition (C-14L10D). On the contrary, several physiological traits, including chlorophyll concentration and biomass accumulation, were either maintained or enhanced under these flexible lighting protocols. However, reducing the photoperiod to 13 h (LSI-13L11D) resulted in a marked decline in plant growth, fruit yield, and chlorophyll content, suggesting that dropping below the species-specific critical photoperiod can negatively affect plant performance.
Furthermore, the combination of B/R/FR spectra with intermittent lighting improved traits such as leaf area and fresh biomass, underscoring the role of spectral composition in optimizing photosynthetic responses. Importantly, the study highlights that aligning lighting schedules with real-time electricity pricing can reduce operational energy costs without sacrificing crop performance—thus advancing the economic and environmental sustainability of indoor vertical farming.
In conclusion: the findings provide compelling evidence that intelligently designed, adaptive lighting strategies—particularly those aligned with real-time energy market dynamics—represent a viable pathway toward resilient and resource-efficient controlled environment agriculture. Future work should focus on further optimizing light spectra, duration, and intensity to better match the circadian and metabolic rhythms of various crops.
Author Contributions
Conceptualization, D.D.A.; methodology, D.D.A.; software, D.D.A.; validation, D.D.A.; formal analysis, D.D.A.; investigation, V.V., K.A. and S.K.; resources, T.B.; data curation, D.D.A.; writing—original draft preparation, D.D.A., V.V., K.A. and S.K.; writing—review and editing, D.D.A.; visualization, D.D.A.; supervision, D.D.A. and T.B.; project administration, D.D.A. All authors have read and agreed to the published version of the manuscript.
Funding
This research received no external funding.
Data Availability Statement
Data available on request due to restrictions.
Acknowledgments
We would like to thank Georgia Ntatsi, Department of Crop Science, Laboratory of Vegetable Crops, Agricultural University of Athens, for facilitating access to the laboratory for the post-harvest measurements.
Conflicts of Interest
The authors declare no conflicts of interest.
References
- Despommier, D. The Vertical Farm. Feeding the World in the 21st Century; St. Martin’s Press: New York, NY, USA, 2010; ISBN 978-0-312-61069-2. [Google Scholar]
- Barbosa, G.L.; Gadelha, F.D.A.; Kublik, N.; Proctor, A.; Reichelm, L.; Weissinger, E.; Wohlleb, G.M.; Halden, R.U. Comparison of land, water, and Energy requirements of lettuce grown using hydroponic vs. conventional agricultural methods. Int. J. Environ. Res. Public Health 2015, 12, 6879–6891. [Google Scholar] [CrossRef] [PubMed]
- Snir, A.; Nadel, D.; Groman-Yaroslavski, I.; Melamed, Y.; Sternberg, M.; Bar-Yosef, O.; Weiss, E. The origin of cultivation and proto-weeds, long before Neolithic farming. PLoS ONE 2015, 10, Article e0131422. [Google Scholar] [CrossRef] [PubMed]
- Avgoustaki, D.D.; Li, J.; Xydis, T. Basil plants grown under intermittent light stress in a small-scale indoor environment: Introducing energy demand reduction intelligent technologies. Food Control 2020, 118, 107389. [Google Scholar] [CrossRef]
- Kami, C.; Lorrain, S.; Hornitschek, P.; Fankhauser, C. Light-regulated plant growth and development. In Current Topics in Developmental Biology; Timmermans, M.C.P., Ed.; Academic Press: San Diego, CA, USA, 2010; Volume 91, pp. 29–66. [Google Scholar] [CrossRef]
- Jackson, S.D. Plant responses to photoperiod. New Phytol. 2009, 181, 517–531. [Google Scholar] [CrossRef] [PubMed]
- Nájera, C.; Gallegos-Cedillo, V.M.; Ros, M.; Pascual, J.A. Role of spectrum-light on productivity and plant quality over vertical farming systems: Bibliometric analysis. Horticulturae 2023, 9, 63. [Google Scholar] [CrossRef]
- Adams, S.R.; Langton, F.A. Photoperiod and plant growth: A review. J. Hortic. Sci. Biotechnol. 2005, 80, 2–10. [Google Scholar] [CrossRef]
- Touliatos, D.; Dodd, I.C.; McAinsh, M. Vertical farming increases yield per unit area compared to conventional horizontal hydroponics. Food Energy Secur. 2016, 5, 184–191. [Google Scholar] [CrossRef] [PubMed]
- Avgoustaki, D.D.; Bartzanas, T.; Xydis, G. Minimising the energy footprint of indoor food production while maintaining a high growth rate: Introducing disruptive cultivation protocols. Food Control 2021, 130, 108290. [Google Scholar] [CrossRef]
- Matthijs, H.C.P.; Balke, H.; Van Hes, U.M.; Kroon, B.M.A.; Mur, L.R.; Binot, R.A. Application of light-emitting diodes in bioreactors: Flashing light effects and energy economy in algal culture (chlorella pyrenoidosa). Biotechnol. Bioeng. 1996, 50, 98–107. [Google Scholar] [CrossRef]
- Kaiser, E.; Kusuma, P.; Vialet-Chabrand, S.; Folta, K.; Liu, Y.; Poorter, H.; Woning, N.; Shrestha, S.; Ciarreta, A.; van Brenk, J.; et al. Vertical farming goes dynamic: Optimizing resource use efficiency, product quality, and energy costs. Front. Sci. 2024, 2, 1411259. [Google Scholar] [CrossRef]
- Ross, J.; Sulev, M. Sources of errors in measurements of PAR. Agric. For. Meteorol. 2000, 100, 103–125. [Google Scholar] [CrossRef]
- Morella, P.; Lambán, M.P.; Royo, J.; Sánchez, J.C. Vertical Farming Monitoring: How Does It Work and How Much Does It Cost? Sensors 2023, 23, 3502. [Google Scholar] [CrossRef] [PubMed]
- Liu, X.; Xu, Y.; Wang, Y.; Yang, Q.; Li, Q. Rerouting artificial light for efficient crops production: A review of lighting strategy in PFALs. Agronomy 2022, 12, 1021. [Google Scholar] [CrossRef]
- Chen, X.; Yang, Q. Effects of intermittent light exposure with red and blue light emitting diodes on growth and carbohydrate accumulation of lettuce. Sci. Hortic. 2018, 234, 220–226. [Google Scholar] [CrossRef]
- Savvas, D.; Drakatos, S.; Panagiotakis, I.; Ntatsi, G. NUTRISENSE: A new online portal to calculate nutrient solutions and optimize fertilization of greenhouse crops grown hydroponically. Acta Hortic. 2021, 1320, 149–156. [Google Scholar] [CrossRef]
- Demers, D.A.; Gosselin, A. Growing greenhouse tomato and sweet pepper under supplemental lighting: Optimal photoperiod, negative effects of long photoperiod and their causes. Acta Hortic. 2002, 580, 83–88. [Google Scholar] [CrossRef]
- Beaman, A.R.; Gladon, R.J.; Schrader, J.A. Sweet Basil Requires an Irradiance of 500 μ mol·m−2·s−1 for Greatest Edible Biomass Production. Am. Soc. Hortic. Sci. 2009, 44, 64–67. [Google Scholar] [CrossRef]
- Energinet. Sustainable Energy Together—Annual Report 2016; Energinet: Erritsø, Denmark, 2017. [Google Scholar]
- Karabiber, O.A.; Xydis, G. Electricity Price Forecasting in the Danish Day-Ahead Market Using the TBATS, ANN and ARIMA Methods. Energies 2019, 12, 928. [Google Scholar] [CrossRef]
- Teskey, R.O.; Sherrif, D.W.; Hollinger, D.Y.; Thomas, R.B. External and Internal Factors Regulating Photosynthesis. In Resource Physiology of Conifers; Academic Press: San Diego, CA, USA, 1995; Chapter 4; pp. 105–140. [Google Scholar] [CrossRef]
- Tanaka, A.; Tanaka, R. Chlorophyll metabolism. Curr. Opin. Plant Biol. 2006, 9, 248–255. [Google Scholar] [CrossRef] [PubMed]
- Gonçalves, J.F.C.; dos Santos, J.U.M.; da Silva, E.A. Evaluation of a portable chlorophyll meter to estimate chlorophyll concentrations in leaves of tropical wood species from Amazonian forest. Hoehnea 2008, 5, 185–188. [Google Scholar] [CrossRef][Green Version]
- Savvas, D. General Vegetable Growing (in Greek); Pedio: Athens, Greece, 2016; Chapter 4. [Google Scholar]
- Mizoguchi, T.; Niinuma, K.; Yoshida, R. Day-neutral response of photoperiodic flowering in tomatoes: Possible implications based on recent molecular genetics of Arabidopsis and rice. Plant Biotechnol. 2007, 24, 83–86. [Google Scholar] [CrossRef]
- Son, K.; Kim, E.; Oh, M. Growth and Development of Cherry Tomato Seedlings Grown under Various Combined Ratios of Red to Blue LED Lights and Fruit Yield and Quality after Transplanting. Prot. Hortic. Plant Fact. 2018, 27, 54–63. [Google Scholar] [CrossRef]
- Rahul, S.; Rahman, M.M.; Rakibuzzaman, M.; Islam, M.N.; Uddin, A.F.M.J. Study on growth and yield characteristics of twelve cherry tomato lines. J. Biosci. Agric. Res. 2018, 17, 1403–1409. [Google Scholar] [CrossRef][Green Version]
- Raffo, A.; Leonardi, C.; Fogliano, V.; Ambrosino, P.; Salucci, M.; Gennaro, L.; Bugianesi, R.; Giuffrida, F.; Quaglia, G. Nutritional value of cherry tomatoes (Lycopersicon esculentumCV. Naomi F1) harvested at different ripening stages. J. Agric. Food Chem. 2002, 50, 6550–6556. [Google Scholar] [CrossRef] [PubMed]
- Grobbelaar, J.U.; Nedbal, L.; Tichý, V. Influence of high frequency light/dark fluctuations on photosynthetic characteristics of microalgae photoacclimated to different light intensities and implications for mass algal cultivation. J. Appl. Phycol. 1996, 8, 335–343. [Google Scholar] [CrossRef]
- Iluz, D.; Alexandrovich, I.; Dubinsky, Z. The enhancement of photosynthesis by fluctuating light. Artif. Photosynth. 2012, 288, 116–133. [Google Scholar]
- Wagner, H.; Jakob, T.; Wihelm, C. Balancing the energy flow from captured light to biomass under fluctuating light conditions. New Phytol. 2005, 169, 95–108. [Google Scholar] [CrossRef] [PubMed]
- Inoue, K.; Araki, T.; Endo, M. Circadian clock during plant development. J. Plant Res. 2017, 131, 59–66. [Google Scholar] [CrossRef] [PubMed]
- De Barros Dantas, L.L.; Eldridge, B.M.; Dorling, J.; Dekeya, R.; Lynch, D.A.; Dodd, A.N. Circadian regulation of metabolism across photosynthetic organisms. Plant J. 2023, 116, 650–668. [Google Scholar] [CrossRef] [PubMed]
- Fredeen, A.L.; Hennessey, T.L.; Field, C.B. Biochemical Correlates of the Circadian Rhythm in Photosynthesis in Phaseolus vulgaris. Plant Physiol. 1991, 97, 415–419. [Google Scholar] [CrossRef] [PubMed]
- McClain, A.M.; Sharkey, T.D. Triose phosphate utilization and beyond: From photosynthesis to end product synthesis. J. Exp. Bot. 2019, 70, 1755–1766. [Google Scholar] [CrossRef] [PubMed]
- Li, Y.; Chen, M. Novel chlorophylls and new directions in photosynthesis research. Funct. Plant Biol. 2015, 42, 493. [Google Scholar] [CrossRef] [PubMed]
- Eggink, L.L.; Park, H.; Hoober, J.K. The role of chlorophyll b in photosynthesis: Hypothesis. BMC Plant Biol. 2001, 1, 1–7. [Google Scholar] [CrossRef] [PubMed]
- Tzina, G.; Argyroudi-Akoyunoglou, J.H.; Akoyunoglou, G. The effect of the dark interval in IL on thylakoid development: Photosynthetic unit formation and light harvesting protein accumulation. Photosynth. Res. 1987, 14, 241–258. [Google Scholar] [CrossRef] [PubMed]
- Lee, S.H.; Won, H.J.; Ban, S.; Choi, H.; Jung, J.H. Tomato Fruit Growth and Nutrient Accumulation in Response to Blue and Red Light Treatments during the Reproductive Growth Stage. Horticulturae 2023, 9, 1113. [Google Scholar] [CrossRef]
- Górecka, D.; Wawrzyniak, A.; Jędrusek-Golińska, A.; Dziedzic, K.; Hamułka, J.; Kowalczewski, P.Ł.; Walkowiak, J. Lycopene in tomatoes and tomato products. Open Chem. 2020, 18, 752–756. [Google Scholar] [CrossRef]
- Cox, S.E.; Stushnoff, C.; Sampson, D.A. Relationship of fruit color and light exposure to lycopene content and antioxidant properties of tomato. Can. J. Plant Sci. 2003, 83, 913–919. [Google Scholar] [CrossRef]
- Li, Y.; Liu, C.; Shi, Q.; Yang, F.; Wei, M. Mixed red and blue light promotes ripening and improves quality of tomato fruit by influencing melatonin content. Environ. Exp. Bot. 2021, 185, 104407. [Google Scholar] [CrossRef]
- Avgoustaki, D.D.; Xydis, G. Energy cost reduction by shifting electricity demand in indoor vertical farms with artificial lighting. Biosyst. Eng. 2021, 211, 219–229. [Google Scholar] [CrossRef]
Disclaimer/Publisher’s Note: The statements, opinions and data contained in all publications are solely those of the individual author(s) and contributor(s) and not of MDPI and/or the editor(s). MDPI and/or the editor(s) disclaim responsibility for any injury to people or property resulting from any ideas, methods, instructions or products referred to in the content. |
© 2025 by the authors. Licensee MDPI, Basel, Switzerland. This article is an open access article distributed under the terms and conditions of the Creative Commons Attribution (CC BY) license (https://creativecommons.org/licenses/by/4.0/).