


Automated Body Condition Scoring in Dairy Cows Using 2D Imaging and Deep Learning


 ,
,
Abstract
1. Introduction
2. Materials and Methods
2.1. Data Collection
2.1.1. Study Location and Duration
2.1.2. Subjects and Data Acquisition
- Cows’ Access to AMS: Cows voluntarily accessed the AMS between one and four times per day, where various physiological and behavioral parameters were recorded.
- BCS Reference Standard: A 3D camera system installed above the AMS served as the reference standard for BCS evaluation.
- Additional Data Recorded: The AMS automatically logs cow identification (ID), milking session timestamps, and body weights, all organized into a structured Excel database for further analysis.
2.2. Digital Tools and Camera Setup
2.2.1. Camera Specifications
- Two-Dimensional Cameras: Three Foscam G4EP PoE 4MP cameras, each equipped with 128 GB SD cards for motion-triggered image capture.
- Three-Dimensional Camera: Installed above the AMS, capturing depth-related morphological features of cows during milking.
- Data Storage and Processing: Cameras were connected to an Ethernet network, and recording schedules were configured via the Foscam mobile application.
2.2.2. Camera Placement
- 3D Camera Placement
- ○
- Mounted directly above the AMS milking unit to provide a top-down view of cows for depth-based morphological analysis.
- ○
- This 3D-based BCS evaluation served as the gold standard for validation.
- 2D Camera Placement
- ○
- Front View Camera—Positioned at the entrance of the weighing station, capturing the head and shoulder regions.
- ○
- Rear View Camera—Mounted behind the weighing scale, providing a backward perspective of the cow’s hindquarters.
- ○
- Top-Down Camera—Mounted above the weighing platform, providing a bird’s-eye view of the cow’s topline and body structure.
2.3. Image Data Processing and Annotation
- Data Collection
- ○
- Video footage and snapshots were collected daily from 8:00 a.m. to 8:00 p.m., with images taken whenever movement was detected.
- 2.
- Frame Extraction
- ○
- At the end of each milking session, a screenshot was taken of each cow standing on the weighing scale to ensure a direct link to BCS and ID records.
- 3.
- Image Sorting
- ○
- Screenshots were organized by cow ID and BCS score.
- 4.
- BCS Score Adjustment
- ○
- Scores were rounded to the nearest half or whole grade (e.g., BCS 1.7 → 1.5; BCS 2.8 → 3.0).
- Manual Annotation
- ○
- The dataset was uploaded to Roboflow using their SAM annotation tool. In some cases, the manual polygon tool was employed to assign object detection labels to front, rear, and top views.
- 2.
- Dataset Splitting
- ○
- After annotation, the dataset was divided into three sets
- ▪
- 70% Training Data—Used to train the YOLOv8 model.
- ▪
- 20% Validation Data—Used for hyperparameter tuning and overfitting prevention.
- ▪
- 10% Testing Data—Used for final model evaluation.
2.4. Object Detection Model
2.4.1. Model Architecture and Justification
- Backbone: Extracts hierarchical image features using convolutional layers, C2f blocks, and spatial pyramid pooling.
- Neck: Fuses multi-scale feature maps, optimizing object detection across different perspectives (rear, front, and top).
- Head: Generates final predictions, including bounding-box coordinates, class labels, and confidence scores.
2.4.2. Data Preprocessing and Augmentation
- Auto-orientation (standardized image alignment).
- Resize (all images resized to 640 × 640 pixels).
- Contrast and Brightness Normalization (to enhance feature visibility).
- Data Augmentation
- ○
- Cropping: 0–15% random zoom.
- ○
- Hue and Saturation Adjustments: Random variations (−6 to +6).
- ○
- Brightness: Randomly adjusted (−15% to +15%).
- ○
- Blur and Noise: Minor Gaussian blur and noise applied.
- BCS 2.5 → Class 25
- BCS 3.0 → Class 30
- BCS 3.5 → Class 35
2.4.3. Model Training and Optimization
- Pretrained Weights: Transfer learning was applied using MSCOCO weights.
- Optimizer: Adam optimizer with learning rate = 0.001.
- Training Setup
- ○
- Epochs: 50
- ○
- Batch size: 16
- ○
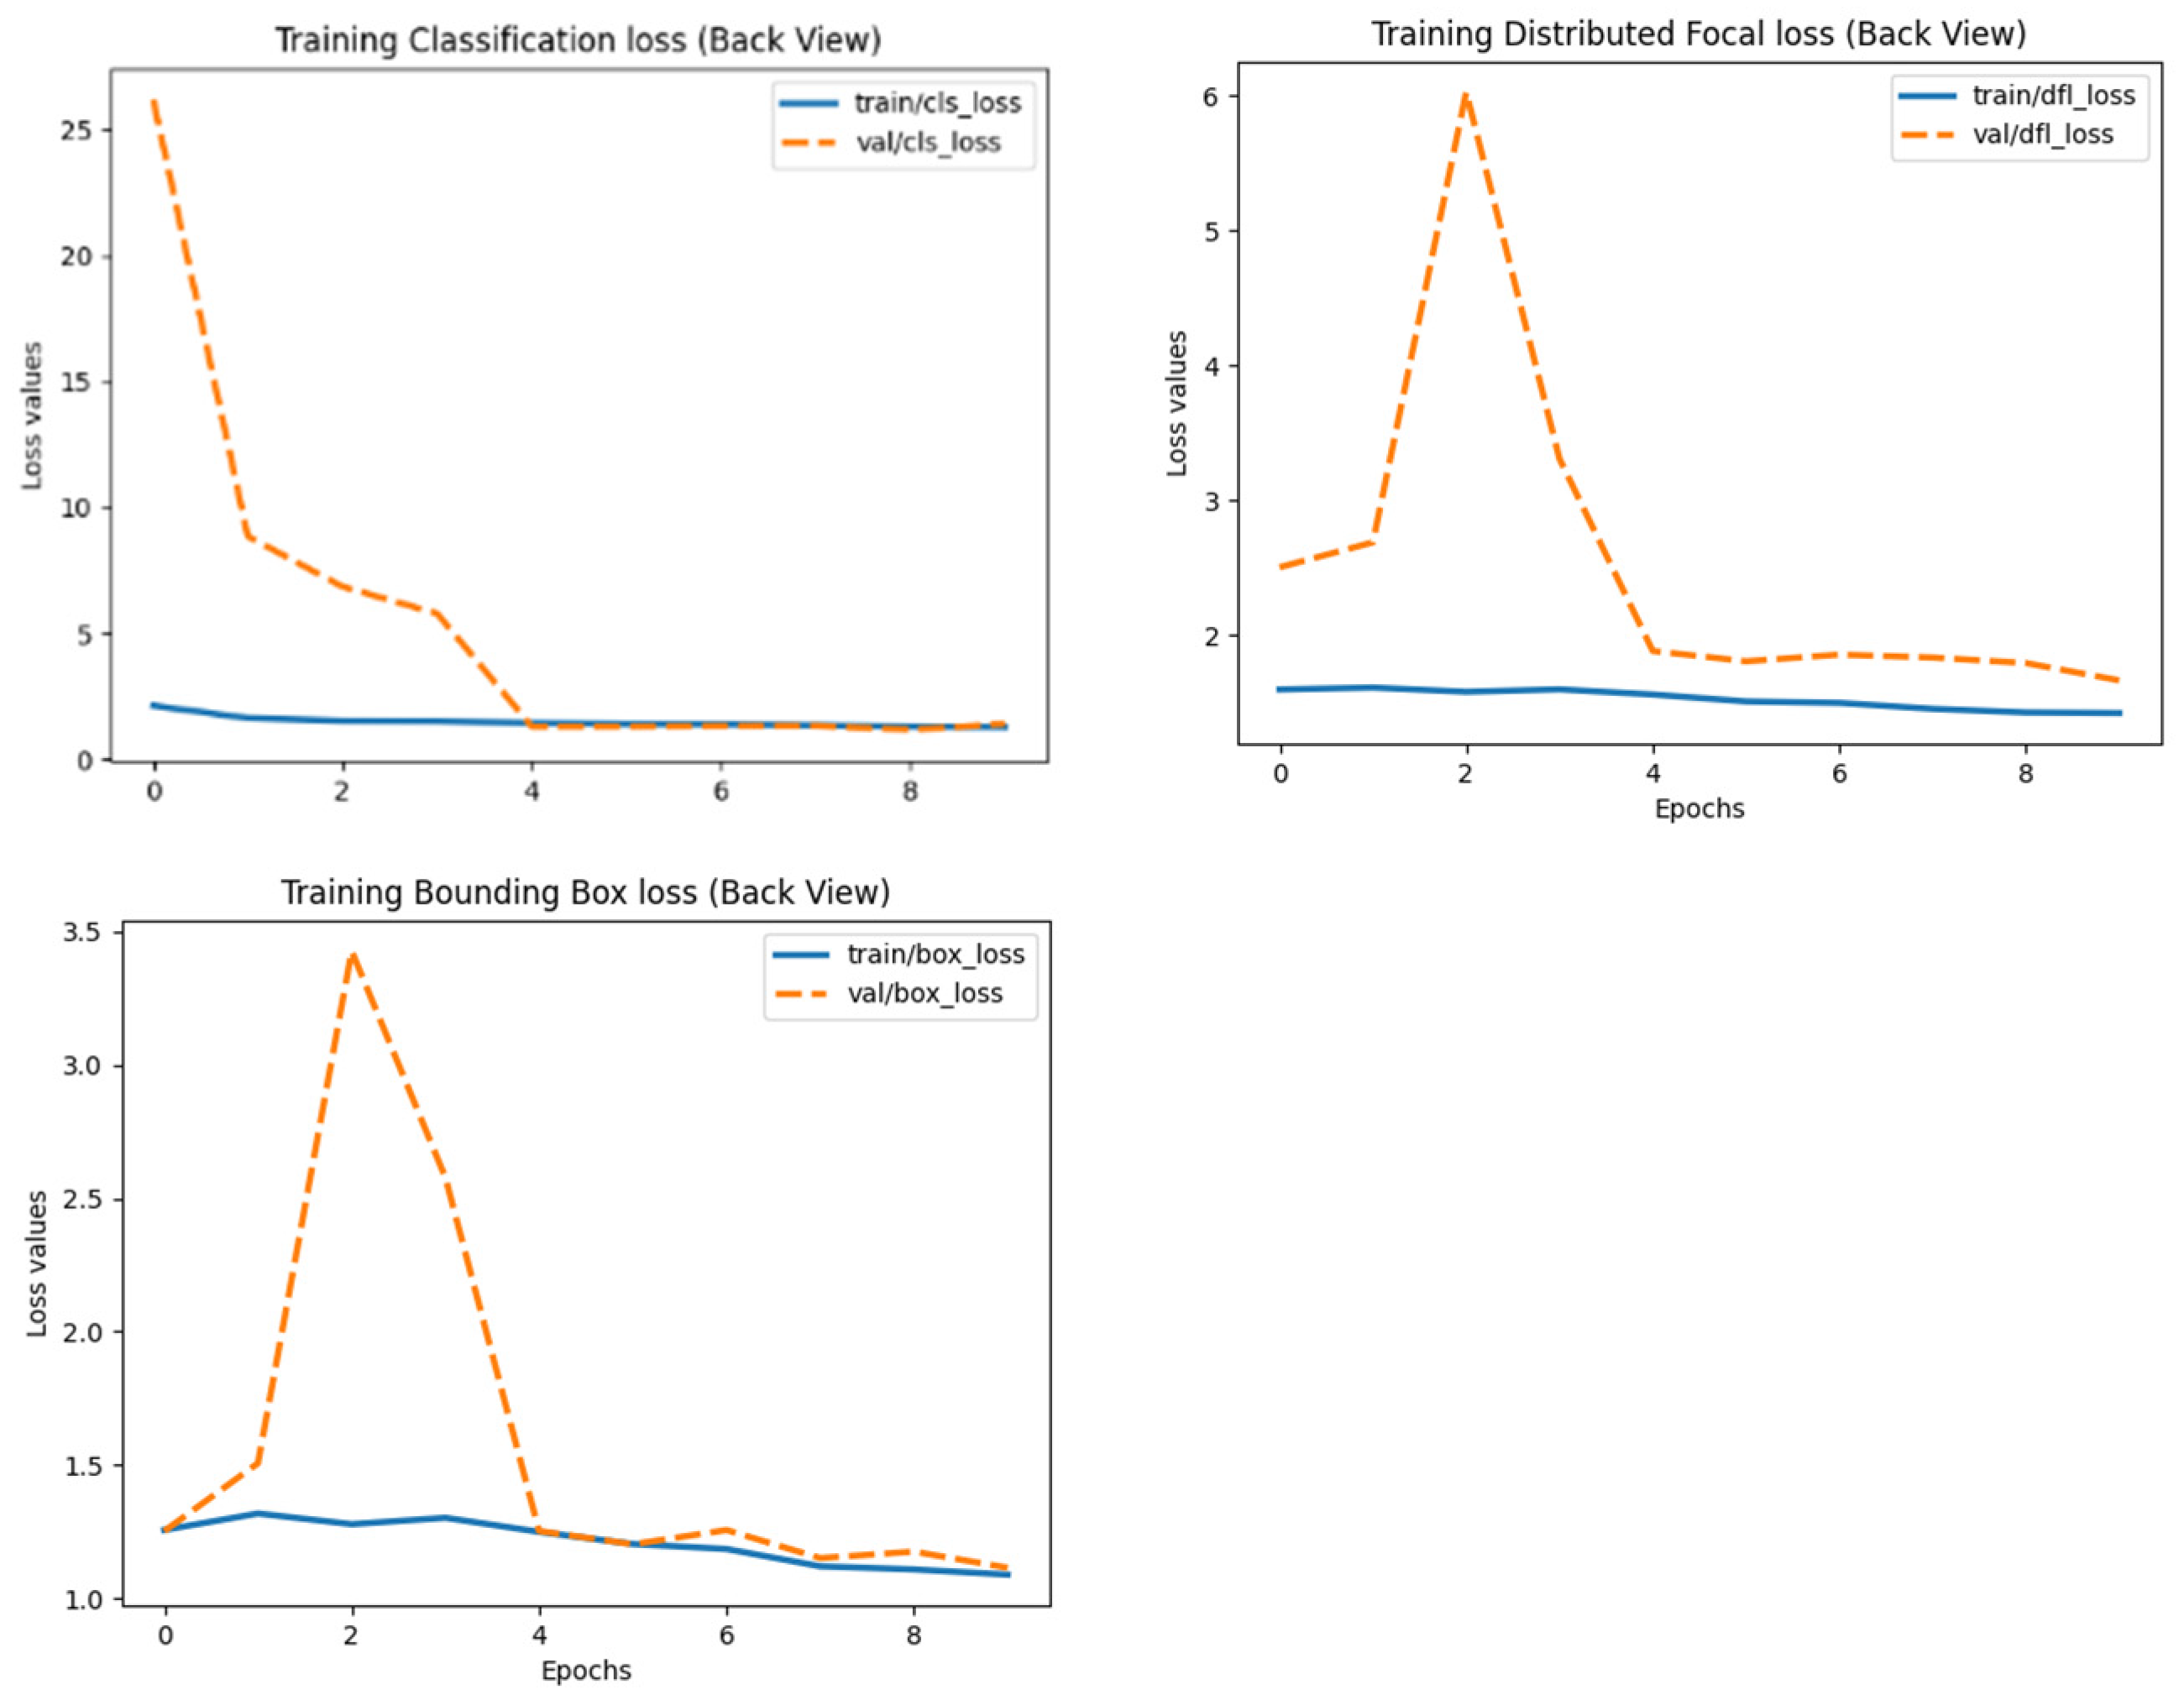
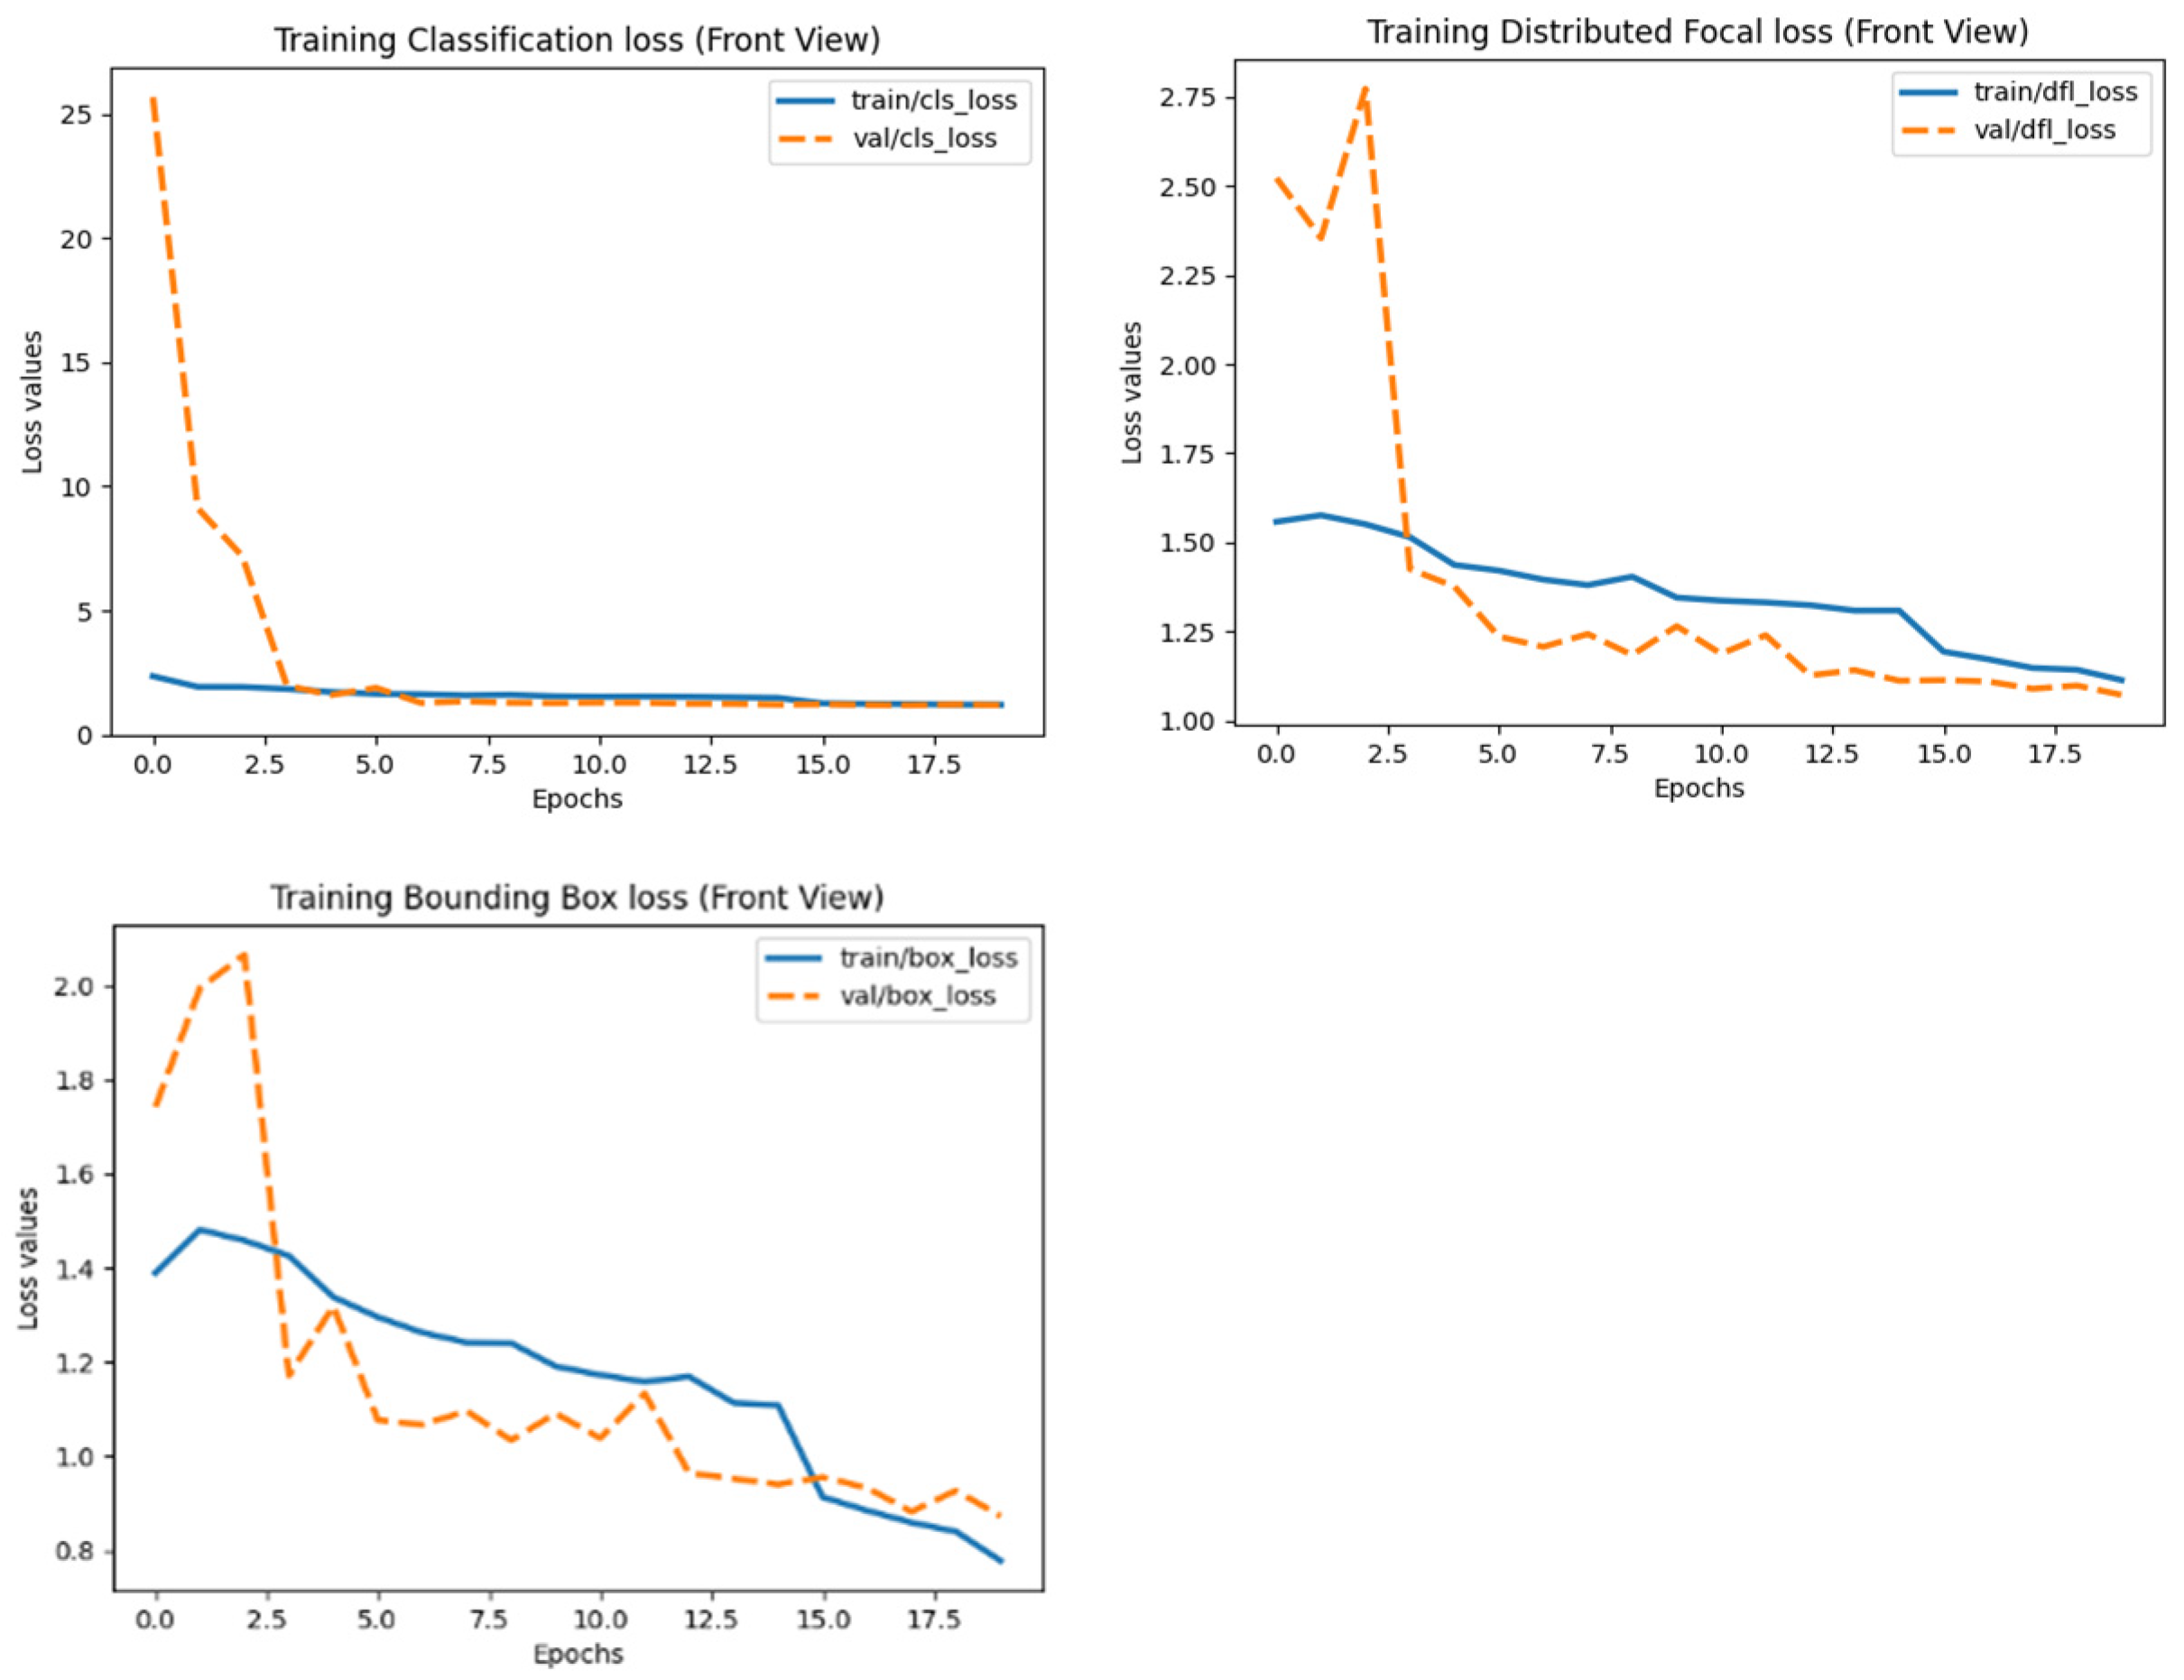
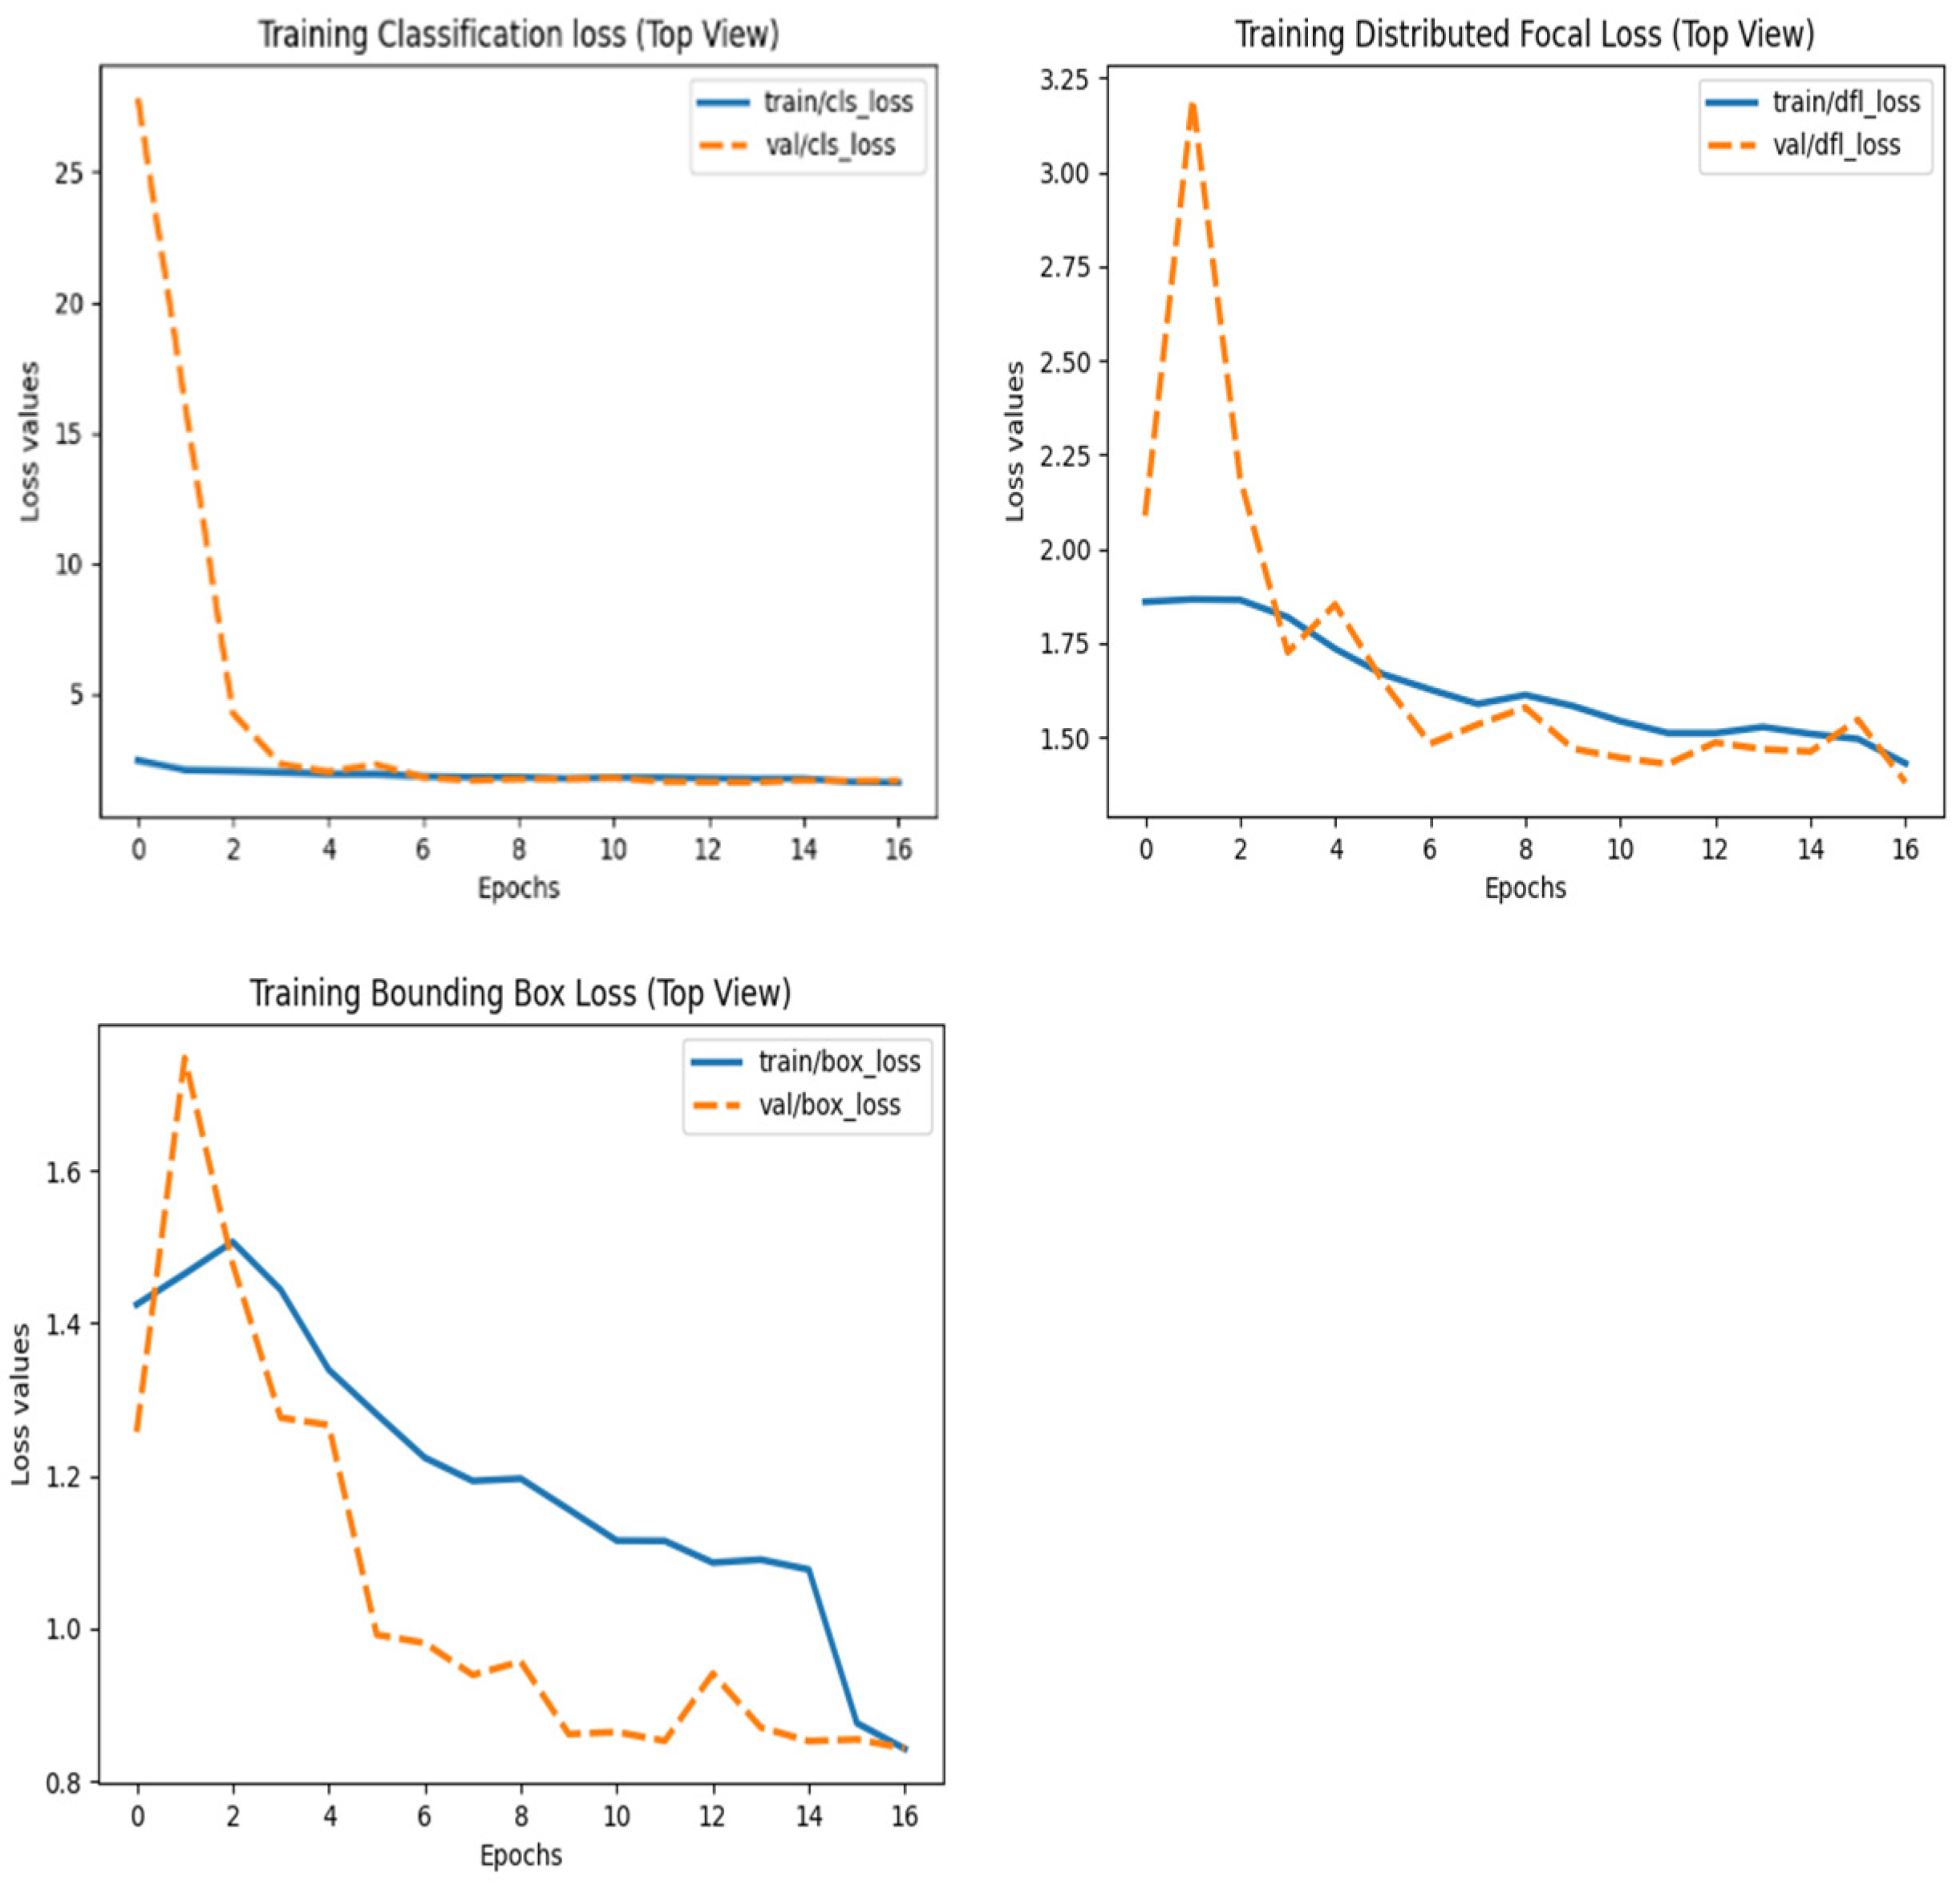
- Loss functions:
- ▪
- Bounding box (BBox) loss.
- ▪
- Classification loss.
- ▪
- Distribution Focal Loss (DFL).
2.4.4. Model Evaluation
- Mean Average Precision (mAP@0.5 and mAP@0.5–0.95).
- Precision/Recall Curves.
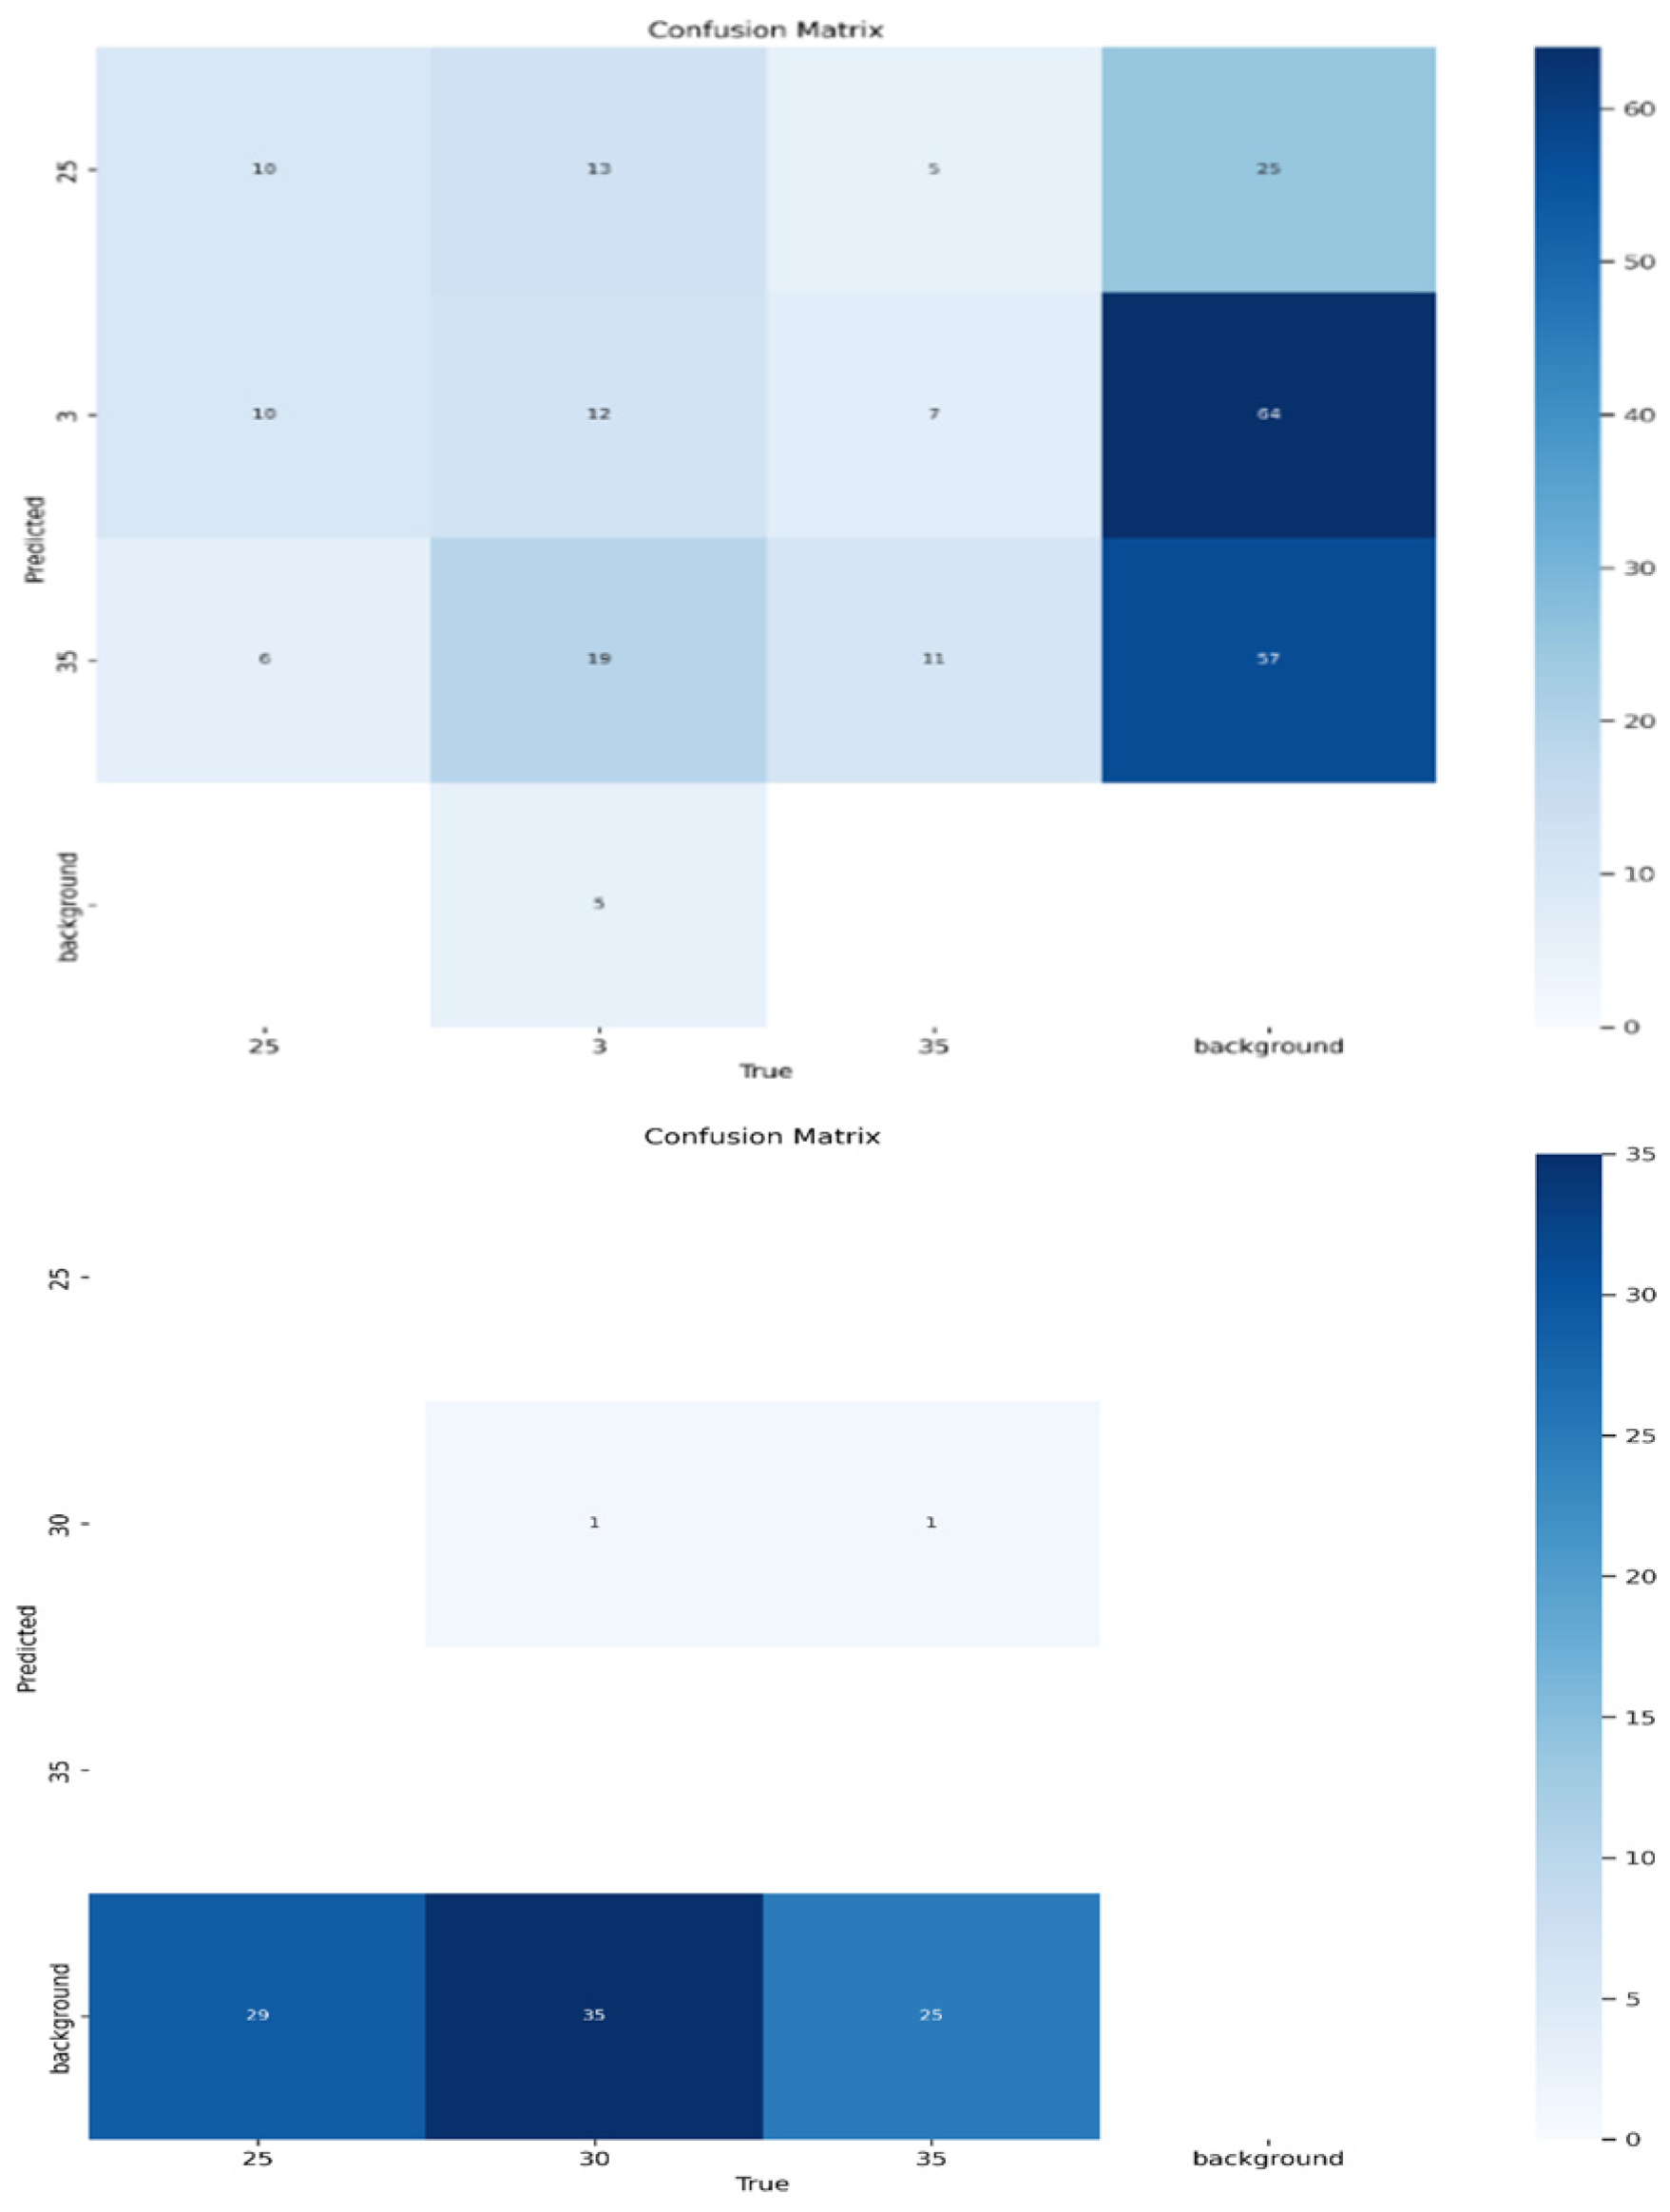
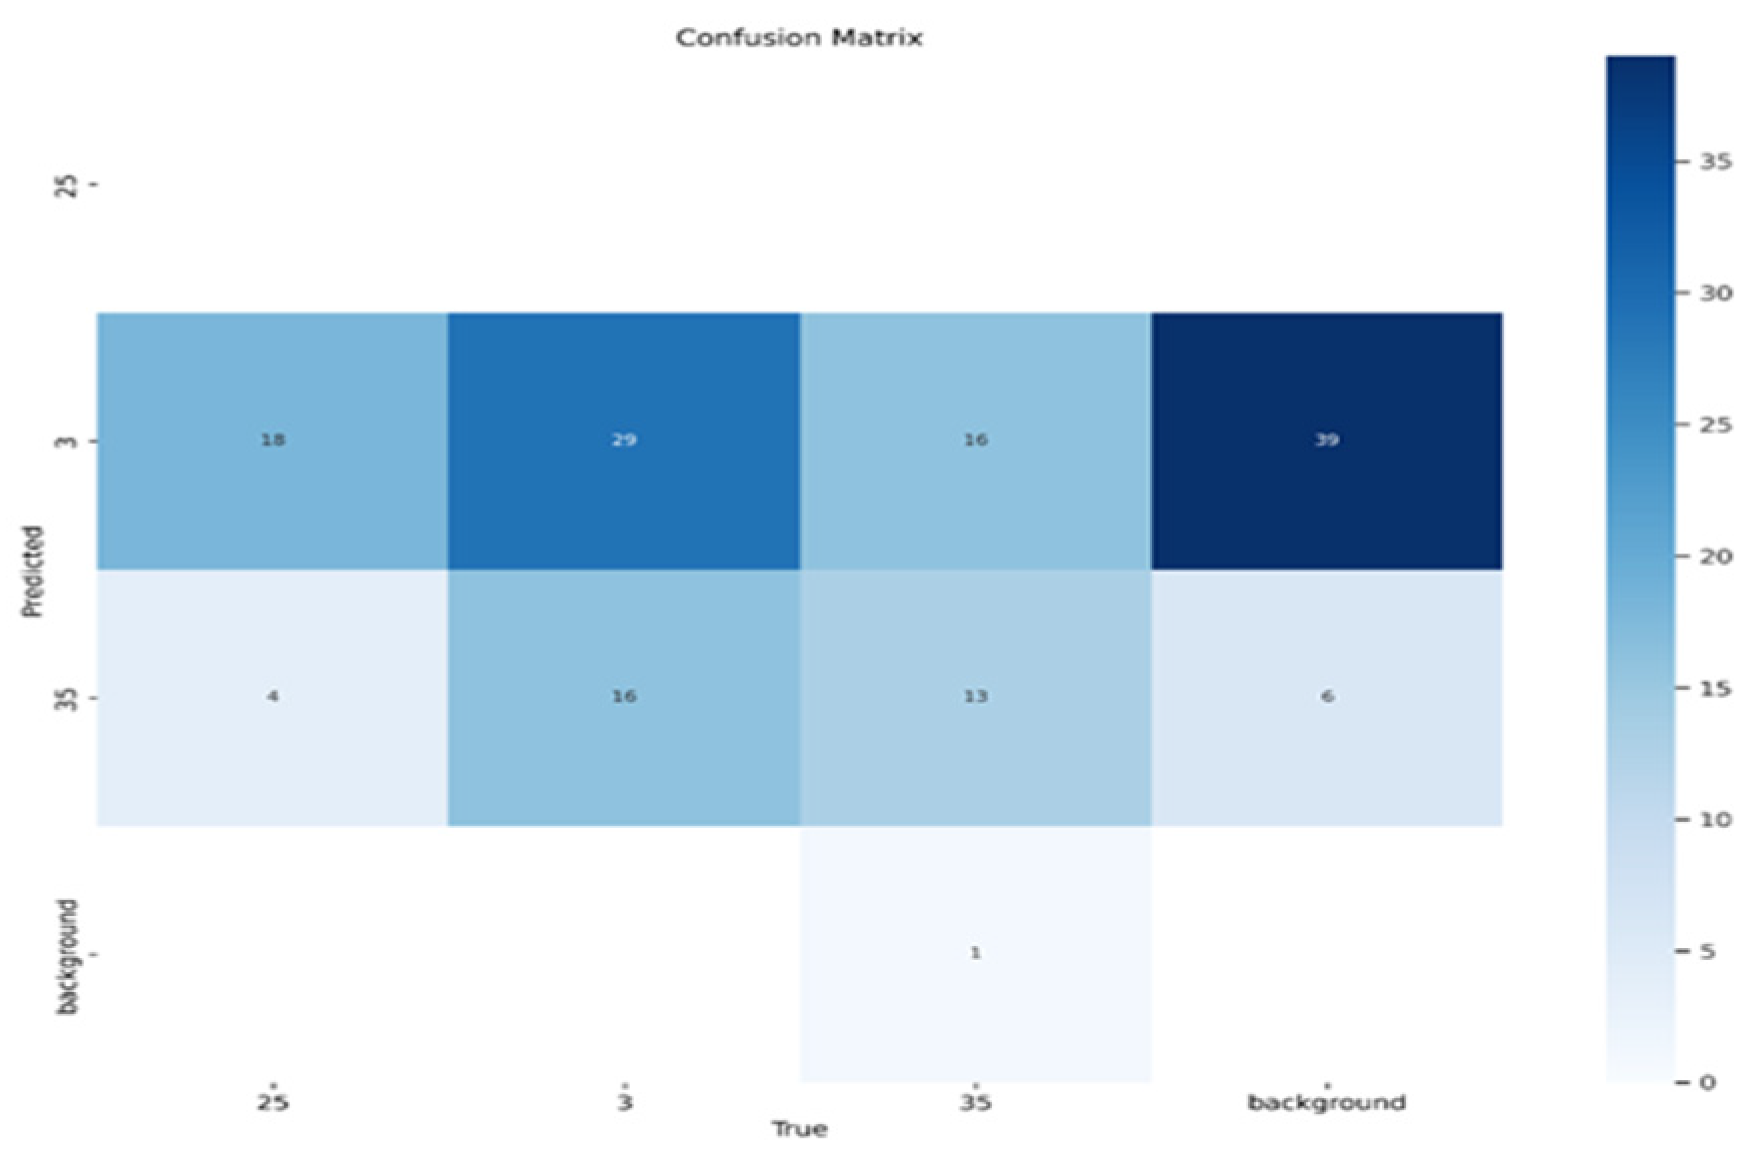
- Confusion Matrices (misclassification analysis).
- Confidence Threshold Optimization (for front, rear, and top views).
2.5. Data Analysis
3. Results
3.1. Model Performance Based on Precision/Recall Curves
3.2. Precision/Confidence Analysis
3.3. Classification Performance Based on Confusion Matrices
4. Discussion
5. Conclusions
Author Contributions
Funding
Data Availability Statement
Acknowledgments
Conflicts of Interest
Abbreviations
| AI | Artificial Intelligence |
| AMS | Automated Milking System |
| AP | Average Precision |
| BCS | Body Condition Score |
| Colab | Google Colaboratory |
| RFID | Radio-Frequency Identification |
| SD | Secure Digital (card) |
References
- Lemmens, L.; Schodl, K.; Fuerst-Waltl, B.; Schwarzenbacher, H.; Egger-Danner, C.; Linke, K.; Suntinger, M.; Phelan, M.; Mayerhofer, M.; Steininger, F.; et al. The Combined Use of Automated Milking System and Sensor Data to Improve Detection of Mild Lameness in Dairy Cattle. Animals 2023, 13, 1180. [Google Scholar] [CrossRef] [PubMed]
- Roche, J.R.; Friggens, N.C.; Kay, J.K.; Fisher, M.W.; Stafford, K.J.; Berry, D.P. Body condition score and its association with dairy cow productivity, health, and welfare. J. Dairy Sci. 2009, 92, 5769–5801. [Google Scholar] [CrossRef] [PubMed]
- Bewley, J.M. Automated Body Condition Scoring of Dairy Cattle: Technical and Economic Feasibility. Doctoral Dissertation, Purdue University, West Lafayette, IN, USA, 2008. [Google Scholar]
- Krukowski, M.; McKague, K.; Valerio, A. Limitations of manual BCS evaluation in dairy farms: A systematic review. Appl. Anim. Behav. Sci. 2021, 241, 105378. [Google Scholar] [CrossRef]
- Li, X.; Lv, C.; Wang, W.; Li, G.; Yang, L.; Yang, J. Generalized focal loss: Towards efficient representation learning for dense object detection. IEEE Trans. Pattern Anal. Mach. Intell. 2023, 45, 3139–3153. [Google Scholar] [CrossRef] [PubMed]
- López-Gatius, F.; Yániz, J.; Madriles-Helm, D. Effects of body condition score and score change on the reproductive performance of dairy cows: A meta-analysis. Theriogenology 2003, 59, 801–812. [Google Scholar] [CrossRef] [PubMed]
- Halachmi, I.; Klopčič, M.; Polak, P.; Roberts, D.J.; Bewley, J.M. Automatic assessment of dairy cow body condition score using 3D image analysis. J. Dairy Sci. 2019, 96, 8047–8059. [Google Scholar] [CrossRef]
- Mottram, T.T.F.; den Uijl, I. Health and welfare monitoring of dairy cows. In Digital Agritechnology: Applications and Future Prospects; Khan, M.I.R., Jamal, M.M., Eds.; Elsevier: Amsterdam, The Netherlands, 2022; pp. 113–142. [Google Scholar] [CrossRef]
- Simitzis, P.; Tzanidakis, C.; Tzamaloukas, O.; Sossidou, E. Contribution of Precision Livestock Farming Systems to the Improvement of Welfare Status and Productivity of Dairy Animals. Dairy 2022, 3, 12–28. [Google Scholar] [CrossRef]
- Zhao, K.; Zhang, M.; Shen, W.; Liu, X.; Ji, J.; Dai, B.; Zhang, R. Automatic body condition scoring for dairy cows based on efficient net and convex hull features of point clouds. Comput. Electron. Agric. 2023, 205, 107588. [Google Scholar] [CrossRef]
- Islam, A.; Lomax, S.; Doughty, A.; Islam, M.R.; Jay, O.; Thomson, P.; Clark, C. Automated monitoring of cattle heat stress and its mitigation. Front. Anim. Sci. 2021, 2, 737213. [Google Scholar] [CrossRef]
- Mottram, T.; den Uijl, I. Integrating AI into dairy farming: A future perspective. Anim. Sci. J. 2022, 93, 13671. [Google Scholar] [CrossRef]
- Ministry of Agriculture and Food. Regulations on the Keeping of Cattle; Norwegian Ministry of Agriculture and Food: Oslo, Norway, 2007; Available online: https://nibio.brage.unit.no/nibio-xmlui/bitstream/handle/11250/2494661/NILF-Diskusjonsnotat-2007-02.pdf?isAllowed=y&sequence=2&utm (accessed on 18 May 2025).
- Ministry of Agriculture and Food. Regulations Relating to the Use of Animals in Research; Norwegian Ministry of Agriculture and Food: Oslo, Norway, 2015; Available online: https://www.regjeringen.no/no/dokumenter/forskrift-om-bruk-av-dyr-i-forsok/id2425378/ (accessed on 18 May 2025).
- Lewis, L. Overview of the Barn and Camera Placement; Original Figure, Created by the Author During Data Collection at the Animal Research Centre; NMBU: Ås, Norway, 2024. [Google Scholar]
- Siachos, N.; Lennox, M.; Anagnostopoulos, A.; Griffiths, B.E.; Neary, J.M.; Smith, R.F.; Oikonomou, G. Development and validation of a fully automated 2-dimensional imaging system generating body condition scores for dairy cows using machine learning. J. Dairy Sci. 2024, 107, 2499–2511. [Google Scholar] [CrossRef] [PubMed]
- Van Nuffel, A.; Zwertvaegher, I.; Van Weyenberg, S.; Pastell, M.; Thorup, V.M.; Bahr, C.; Sonck, B.; Saeys, W. Lameness detection in dairy cows: Part 2. Use of sensors to automatically register changes in locomotion or behavior. Animals 2015, 5, 861–885. [Google Scholar] [CrossRef] [PubMed]
- Biscarini, F.; Nicolazzi, E.L.; Stella, A.; Boettcher, P.J.; Gandini, G. Challenges and opportunities in genetic improvement of local livestock breeds. Front. Genet. 2015, 6, 33. [Google Scholar] [CrossRef] [PubMed]
- Neethirajan, S. Transforming the adaptation physiology of farm animals through sensors. Animals 2020, 10, 1512. [Google Scholar] [CrossRef] [PubMed]
- Zheng, Z.; Wang, P.; Liu, W.; Li, J.; Ye, R.; Ren, D. Distance-IoU loss: Faster and better learning for bounding box regression. Proc. AAAI Conf. Artif. Intell. 2020, 34, 12993–13000. [Google Scholar] [CrossRef]
- Wurtz, K.; Camerlink, I.; D’Eath, R.B.; Fernández, A.P.; Norton, T.; Steibel, J.; Siegford, J.; Raboisson, D. Recording behaviour of indoor-housed farm animals automatically using machine vision technology: A systematic review. PLoS ONE 2019, 14, e0226669. [Google Scholar] [CrossRef] [PubMed]
- Yaseen, M. What is YOLOv8: An in-depth exploration of the internal features of the next-generation object detector. arXiv 2024, arXiv:2408.15857. [Google Scholar] [CrossRef]
- Summerfield, G.I.; De Freitas, A.; van Marle-Koster, E.; Myburgh, H.C. Automated Cow Body Condition Scoring Using Multiple 3D Cameras and Convolutional Neural Networks. Sensors 2023, 23, 9051. [Google Scholar] [CrossRef] [PubMed]
- Zhang, Y.; Zhang, Q.; Zhang, L.; Li, J.; Li, M.; Liu, Y.; Shi, Y. Progress of machine vision technologies in intelligent dairy farming. Appl. Sci. 2023, 13, 7052. [Google Scholar] [CrossRef]


| BCS Class | View | Test Samples | Correct | Misclassified | Precision | Recall |
|---|---|---|---|---|---|---|
| 2.5 | Back | 21 | 11 | 10 | 0.55 | 0.52 |
| 2.5 | Front | 20 | 10 | 10 | 0.50 | 0.50 |
| 2.5 | Top | 20 | 3 | 17 | 0.15 | 0.15 |
| View | BCS Class | Test Samples | Correct Predictions | Misclassifications | Precision | Recall |
|---|---|---|---|---|---|---|
| Back | 2.5 | 21 | 11 | 10 | 0.55 | 0.52 |
| 3.0 | 32 | 29 | 3 | 0.87 | 0.91 | |
| 3.5 | 18 | 13 | 5 | 0.72 | 0.72 | |
| Front | 2.5 | 20 | 10 | 10 | 0.50 | 0.50 |
| 3.0 | 30 | 24 | 6 | 0.80 | 0.80 | |
| 3.5 | 18 | 13 | 5 | 0.72 | 0.72 | |
| Top | 2.5 | 20 | 3 | 17 | 0.15 | 0.15 |
| 3.0 | 30 | 1 | 29 | 0.03 | 0.03 | |
| 3.5 | 18 | 2 | 16 | 0.11 | 0.11 |
Disclaimer/Publisher’s Note: The statements, opinions and data contained in all publications are solely those of the individual author(s) and contributor(s) and not of MDPI and/or the editor(s). MDPI and/or the editor(s) disclaim responsibility for any injury to people or property resulting from any ideas, methods, instructions or products referred to in the content. |
© 2025 by the authors. Licensee MDPI, Basel, Switzerland. This article is an open access article distributed under the terms and conditions of the Creative Commons Attribution (CC BY) license (https://creativecommons.org/licenses/by/4.0/).
Share and Cite
Lewis, R.; Kostermans, T.; Brovold, J.W.; Laique, T.; Ocepek, M. Automated Body Condition Scoring in Dairy Cows Using 2D Imaging and Deep Learning. AgriEngineering 2025, 7, 241. https://doi.org/10.3390/agriengineering7070241
Lewis R, Kostermans T, Brovold JW, Laique T, Ocepek M. Automated Body Condition Scoring in Dairy Cows Using 2D Imaging and Deep Learning. AgriEngineering. 2025; 7(7):241. https://doi.org/10.3390/agriengineering7070241
Chicago/Turabian StyleLewis, Reagan, Teun Kostermans, Jan Wilhelm Brovold, Talha Laique, and Marko Ocepek. 2025. "Automated Body Condition Scoring in Dairy Cows Using 2D Imaging and Deep Learning" AgriEngineering 7, no. 7: 241. https://doi.org/10.3390/agriengineering7070241
APA StyleLewis, R., Kostermans, T., Brovold, J. W., Laique, T., & Ocepek, M. (2025). Automated Body Condition Scoring in Dairy Cows Using 2D Imaging and Deep Learning. AgriEngineering, 7(7), 241. https://doi.org/10.3390/agriengineering7070241