
ViT-RoT: Vision Transformer-Based Robust Framework for Tomato Leaf Disease Recognition


 and
and
Abstract
1. Introduction
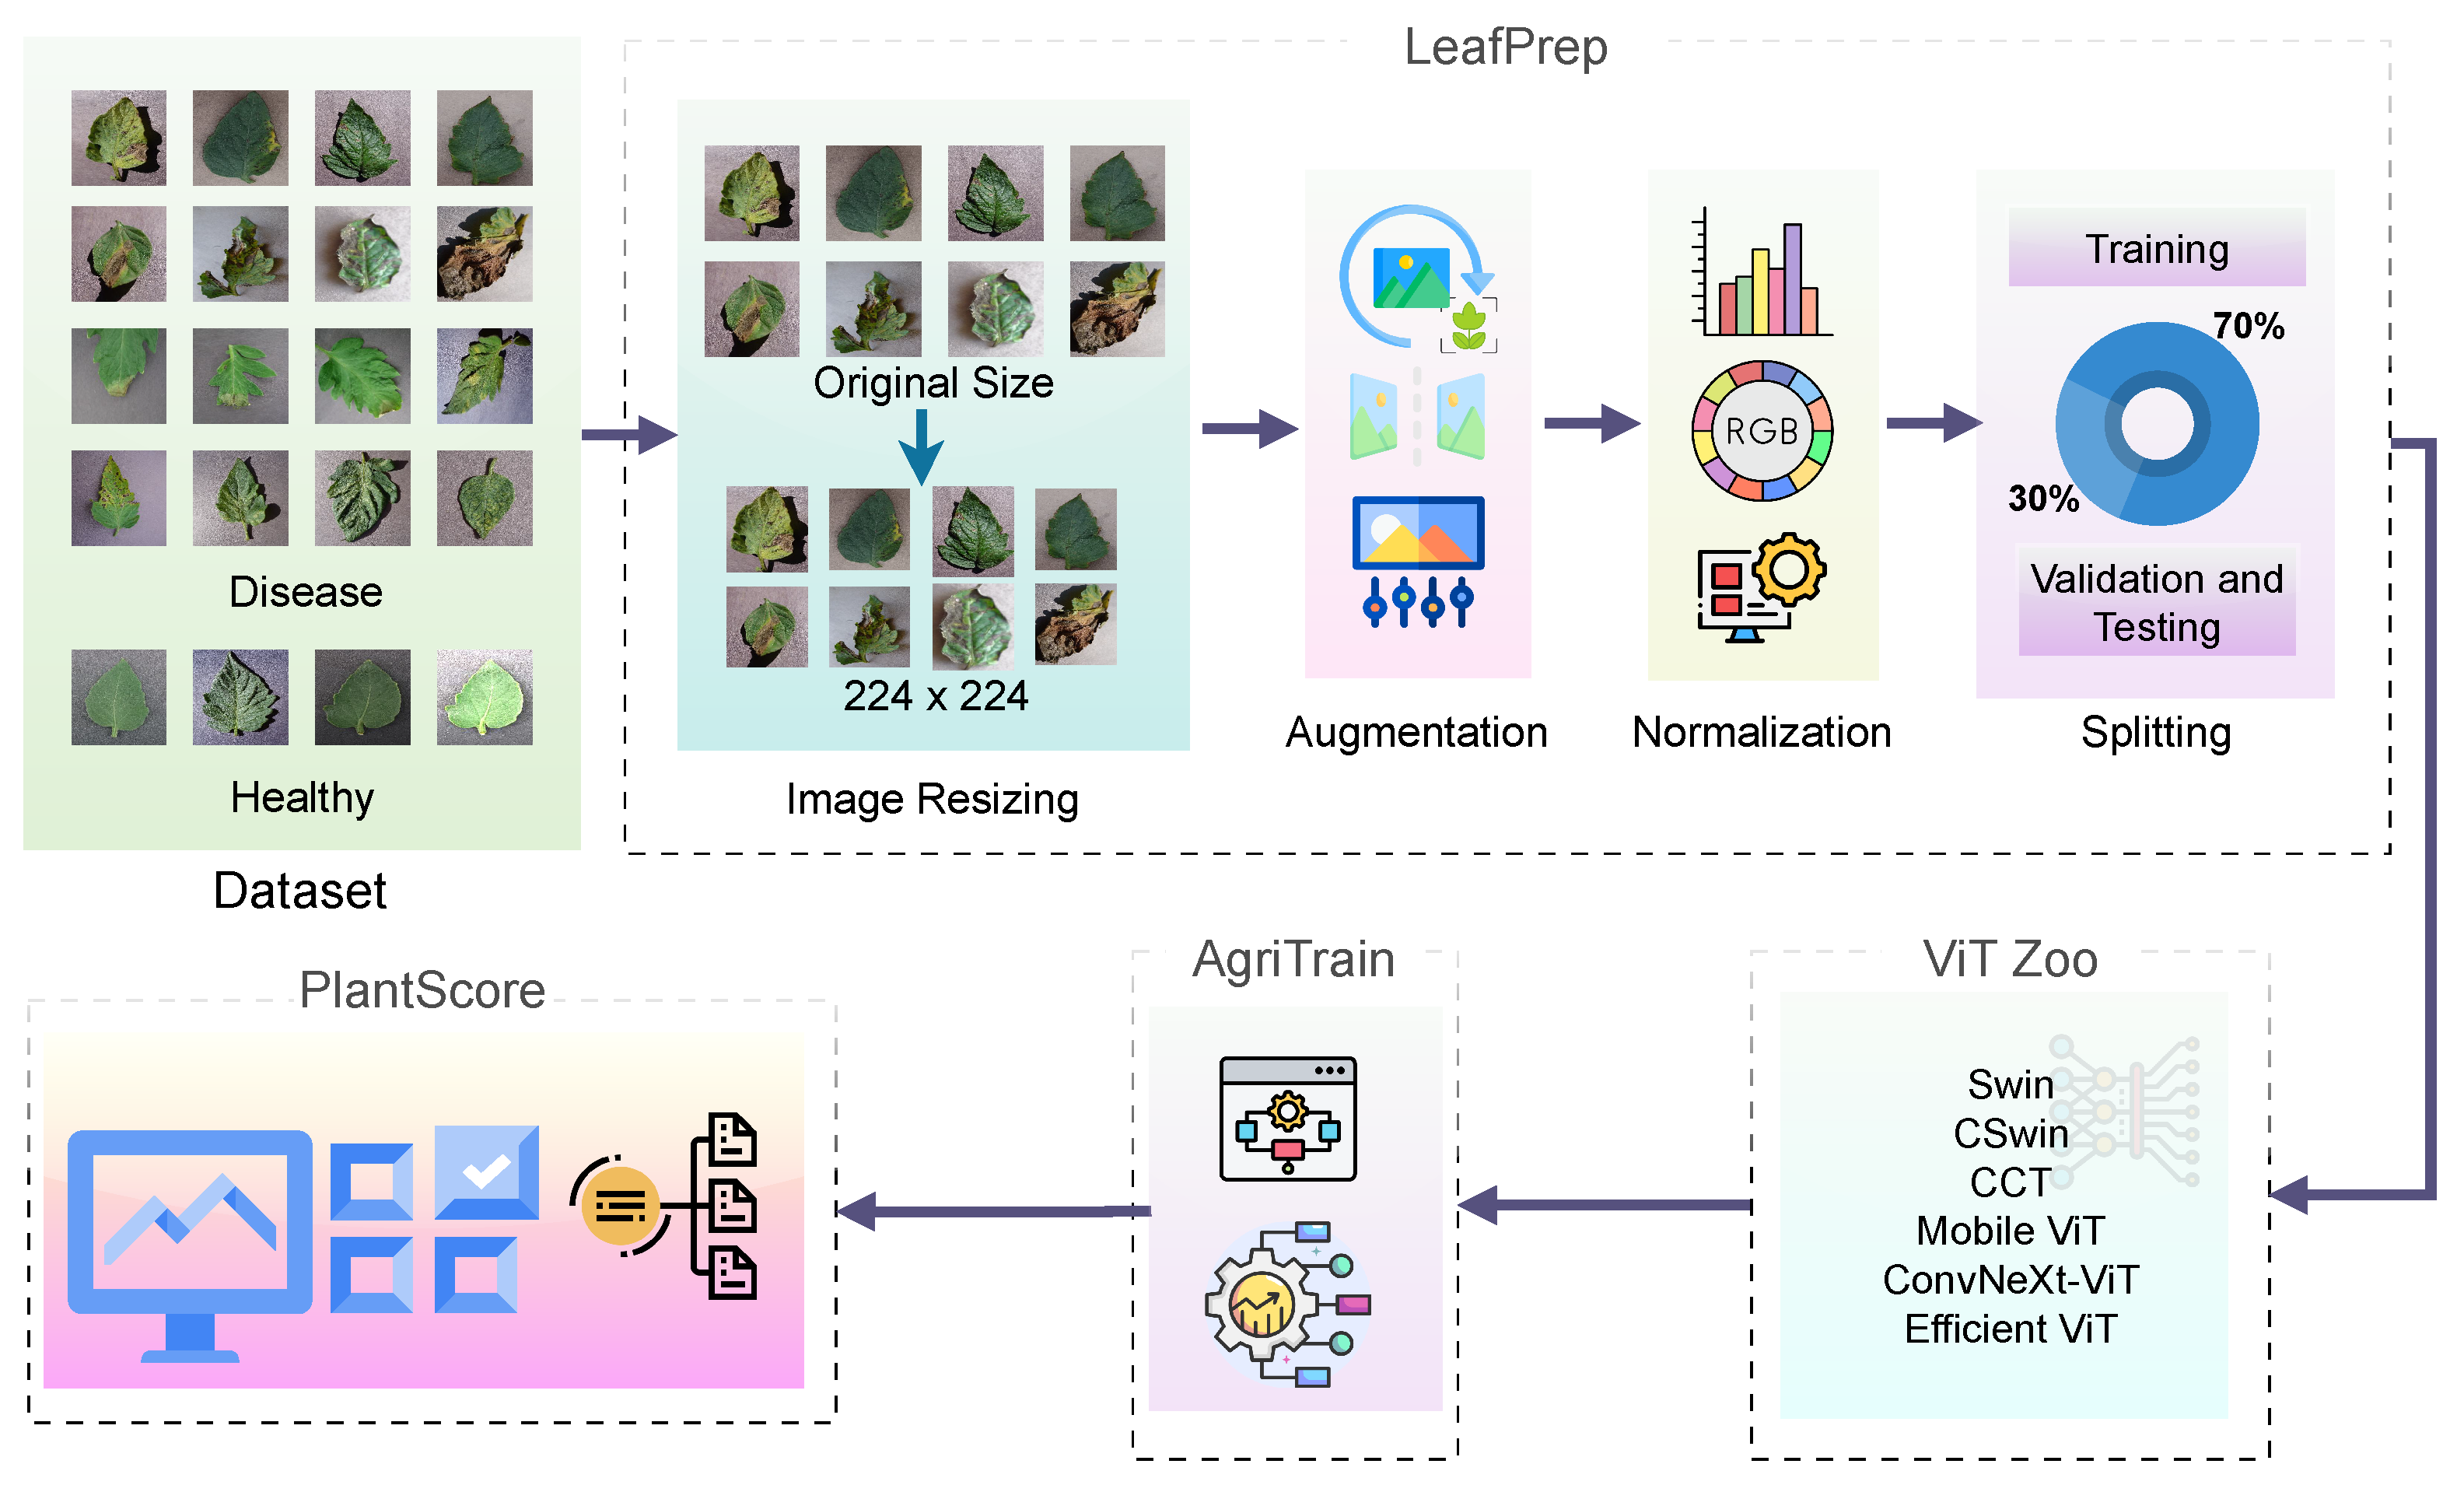
- ViT-RoT, as shown in Figure 1, a novel benchmarking framework, is introduced to systematically evaluate the performance of ViT architectures in tomato leaf disease recognition.
- A comprehensive comparative and empirical analysis of multiple state-of-the-art ViT variants is conducted under consistent experimental settings. This enables an objective evaluation of each model’s capability in recognising complex disease patterns in tomato leaf images.
- Extensive performance benchmarking is conducted on three benchmark datasets using standard evaluation metrics to comprehensively assess the classification effectiveness of each ViT variant to classify images into high-, moderate-, and low-performing ViT variants. The results demonstrate that ConvNeXt-Small and Swin-Small consistently outperform all other ViT variants in tomato disease recognition.
2. Related Work
2.1. CNN-Based Approaches
2.2. ViT-Based Approaches
3. Proposed Method
3.1. LeafPrep—Preprocessing Pipeline
- RandomHorizontalFlip: Flips the image horizontally with a probability of 0.5.
- RandomVerticalFlip: Flips the image vertically with a probability of 0.5.
- RandomRotation: Applies random rotations within a specified angle range.
- RandomResizedCrop: Randomly crops and resizes the image to enhance spatial variability.
- ColorJitter: Adjusts brightness and contrast to introduce colour variations.
- Normalise: Standardises pixel values to zero mean and unit variance.
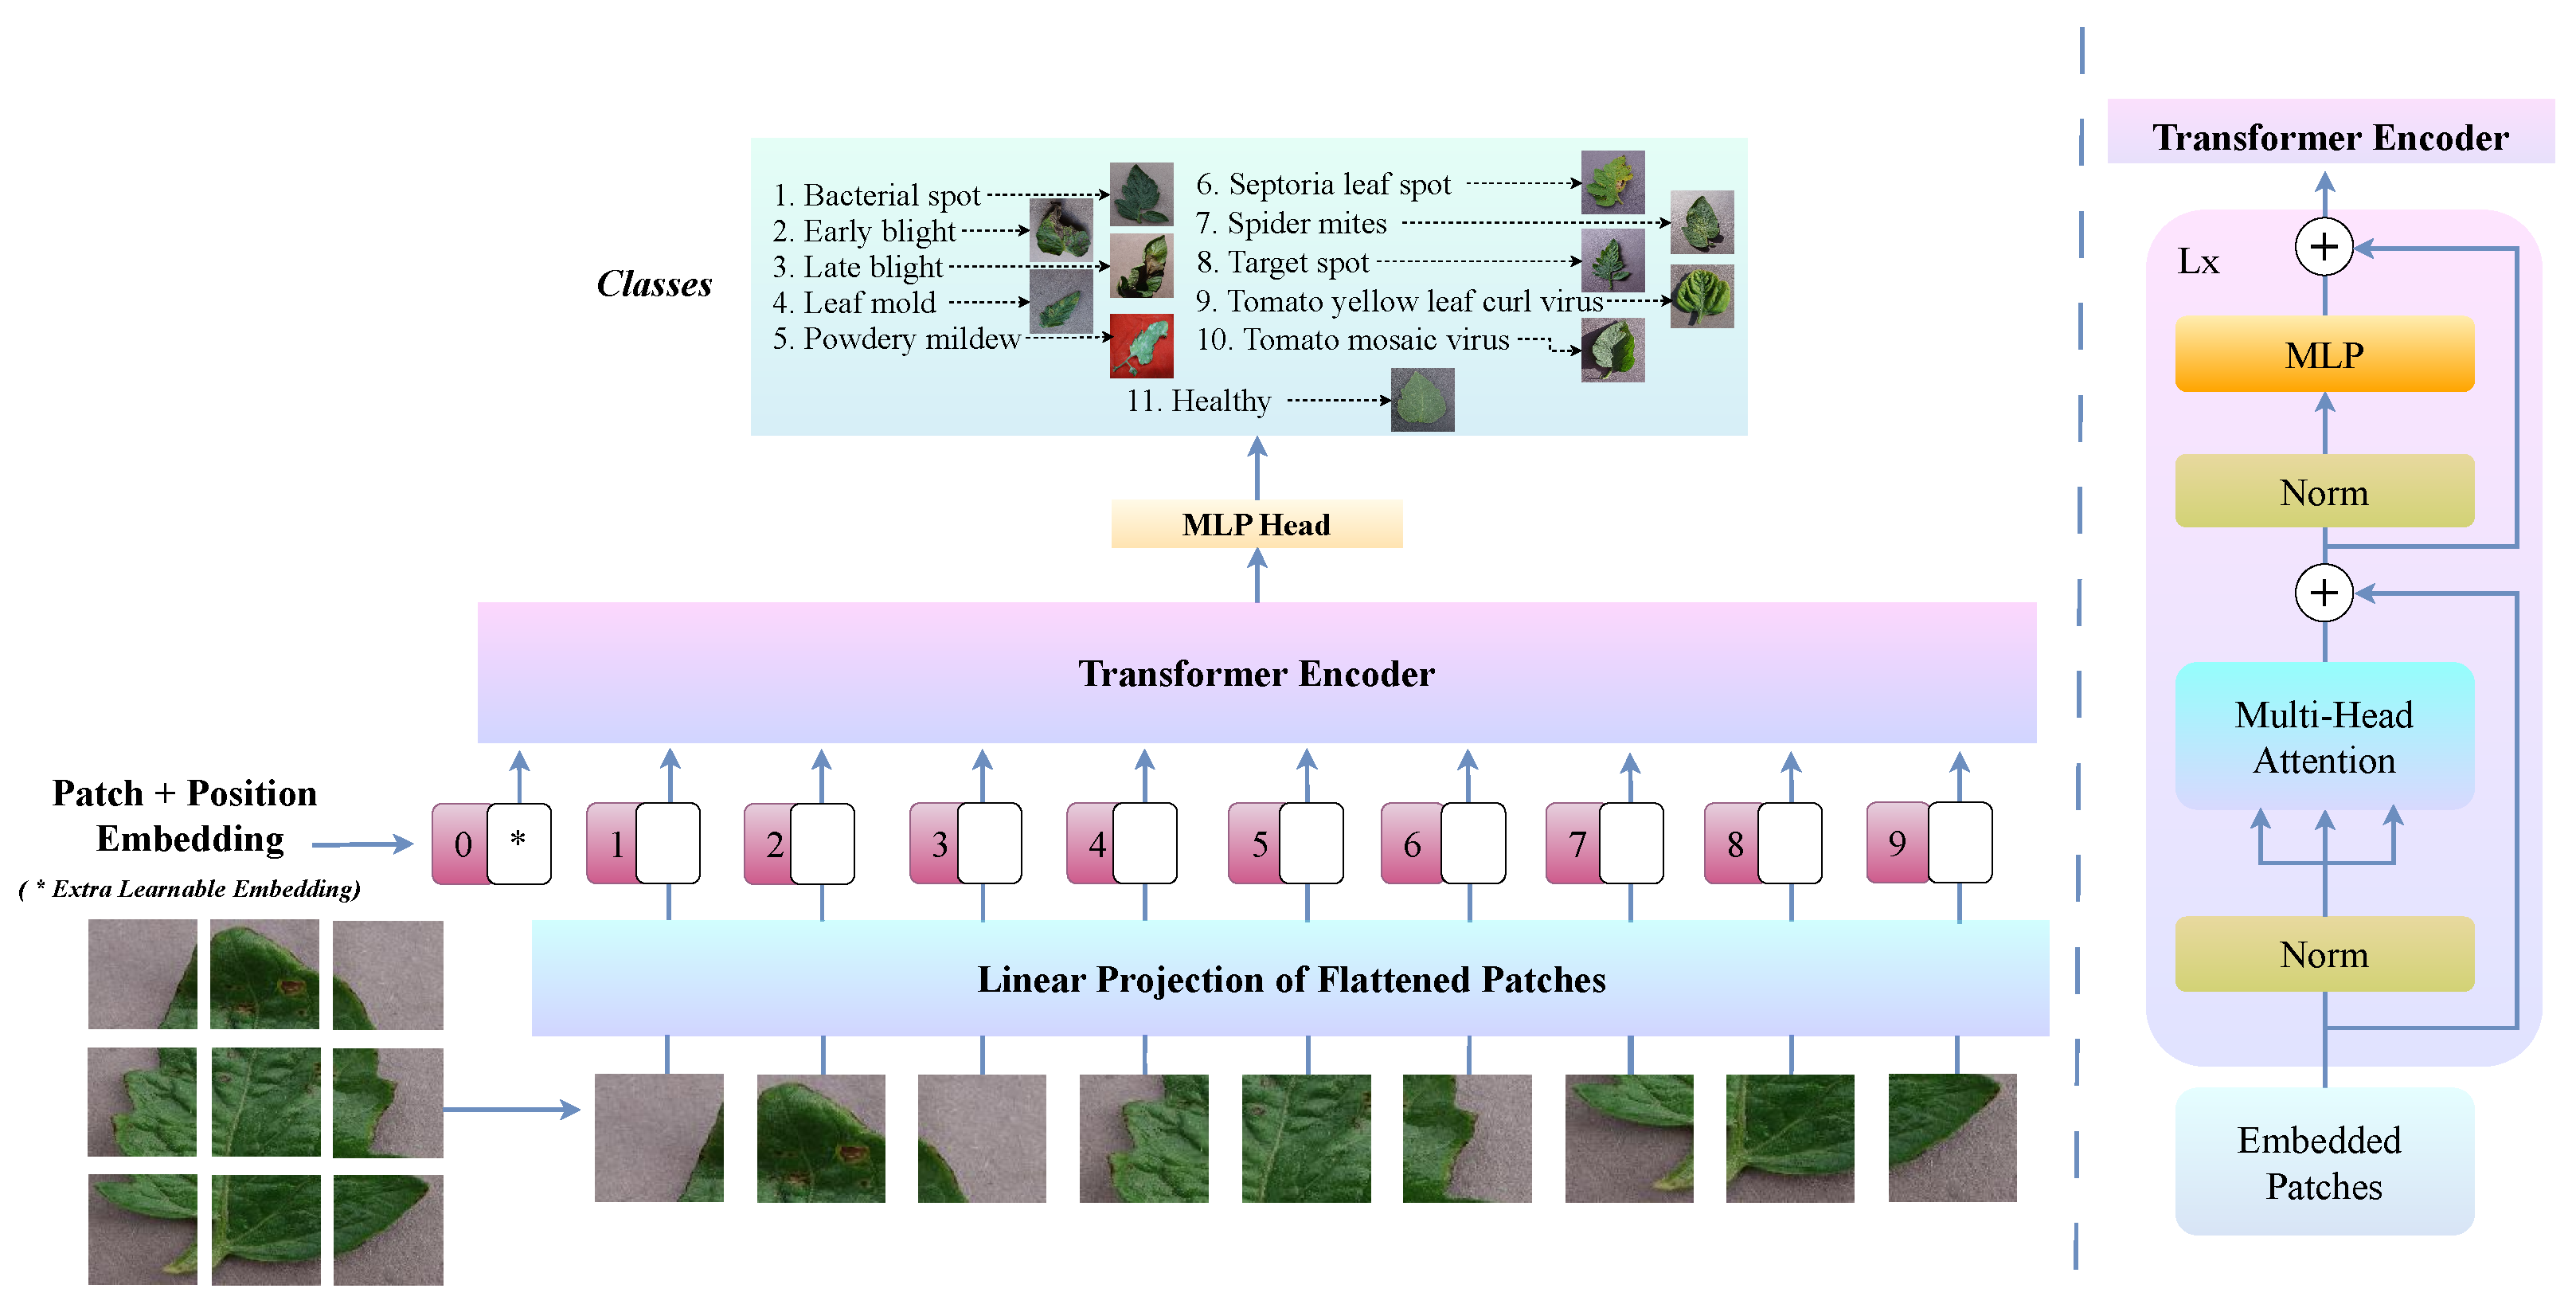
3.2. ViT Zoo—Model Variant Module
| Algorithm 1 Tomato Leaf Disease Classification using ViT |
|
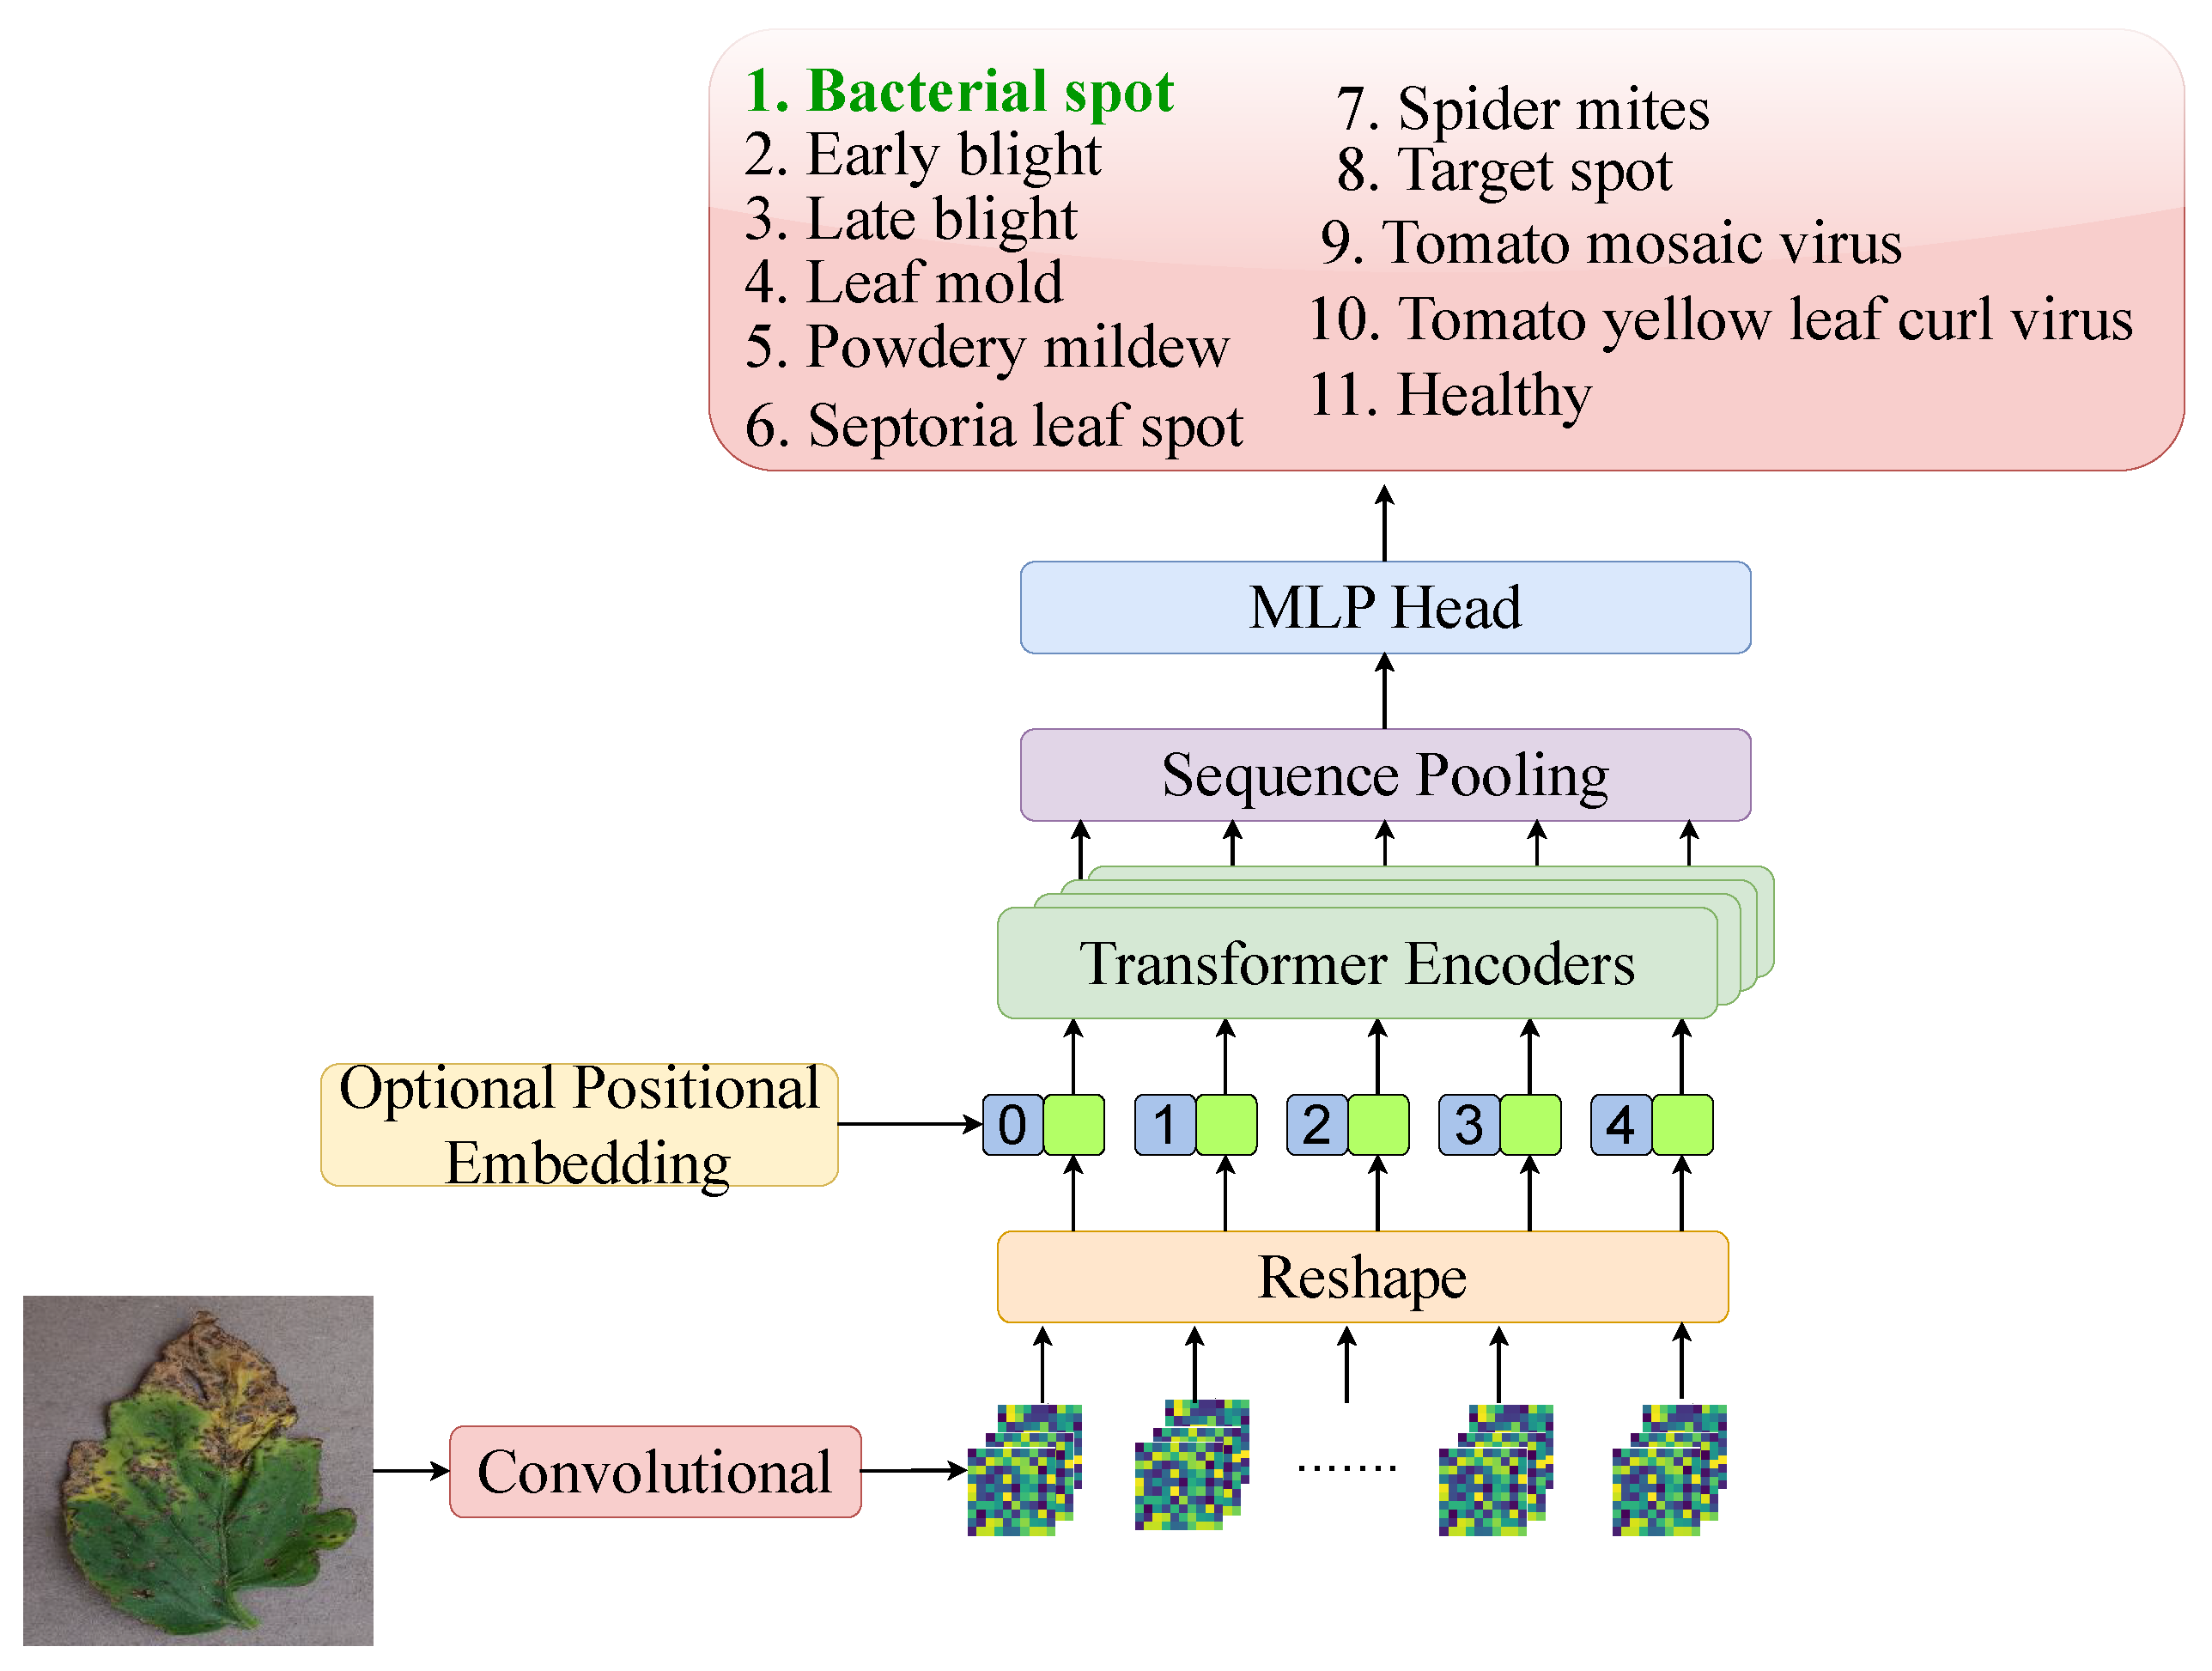
3.2.1. CCT
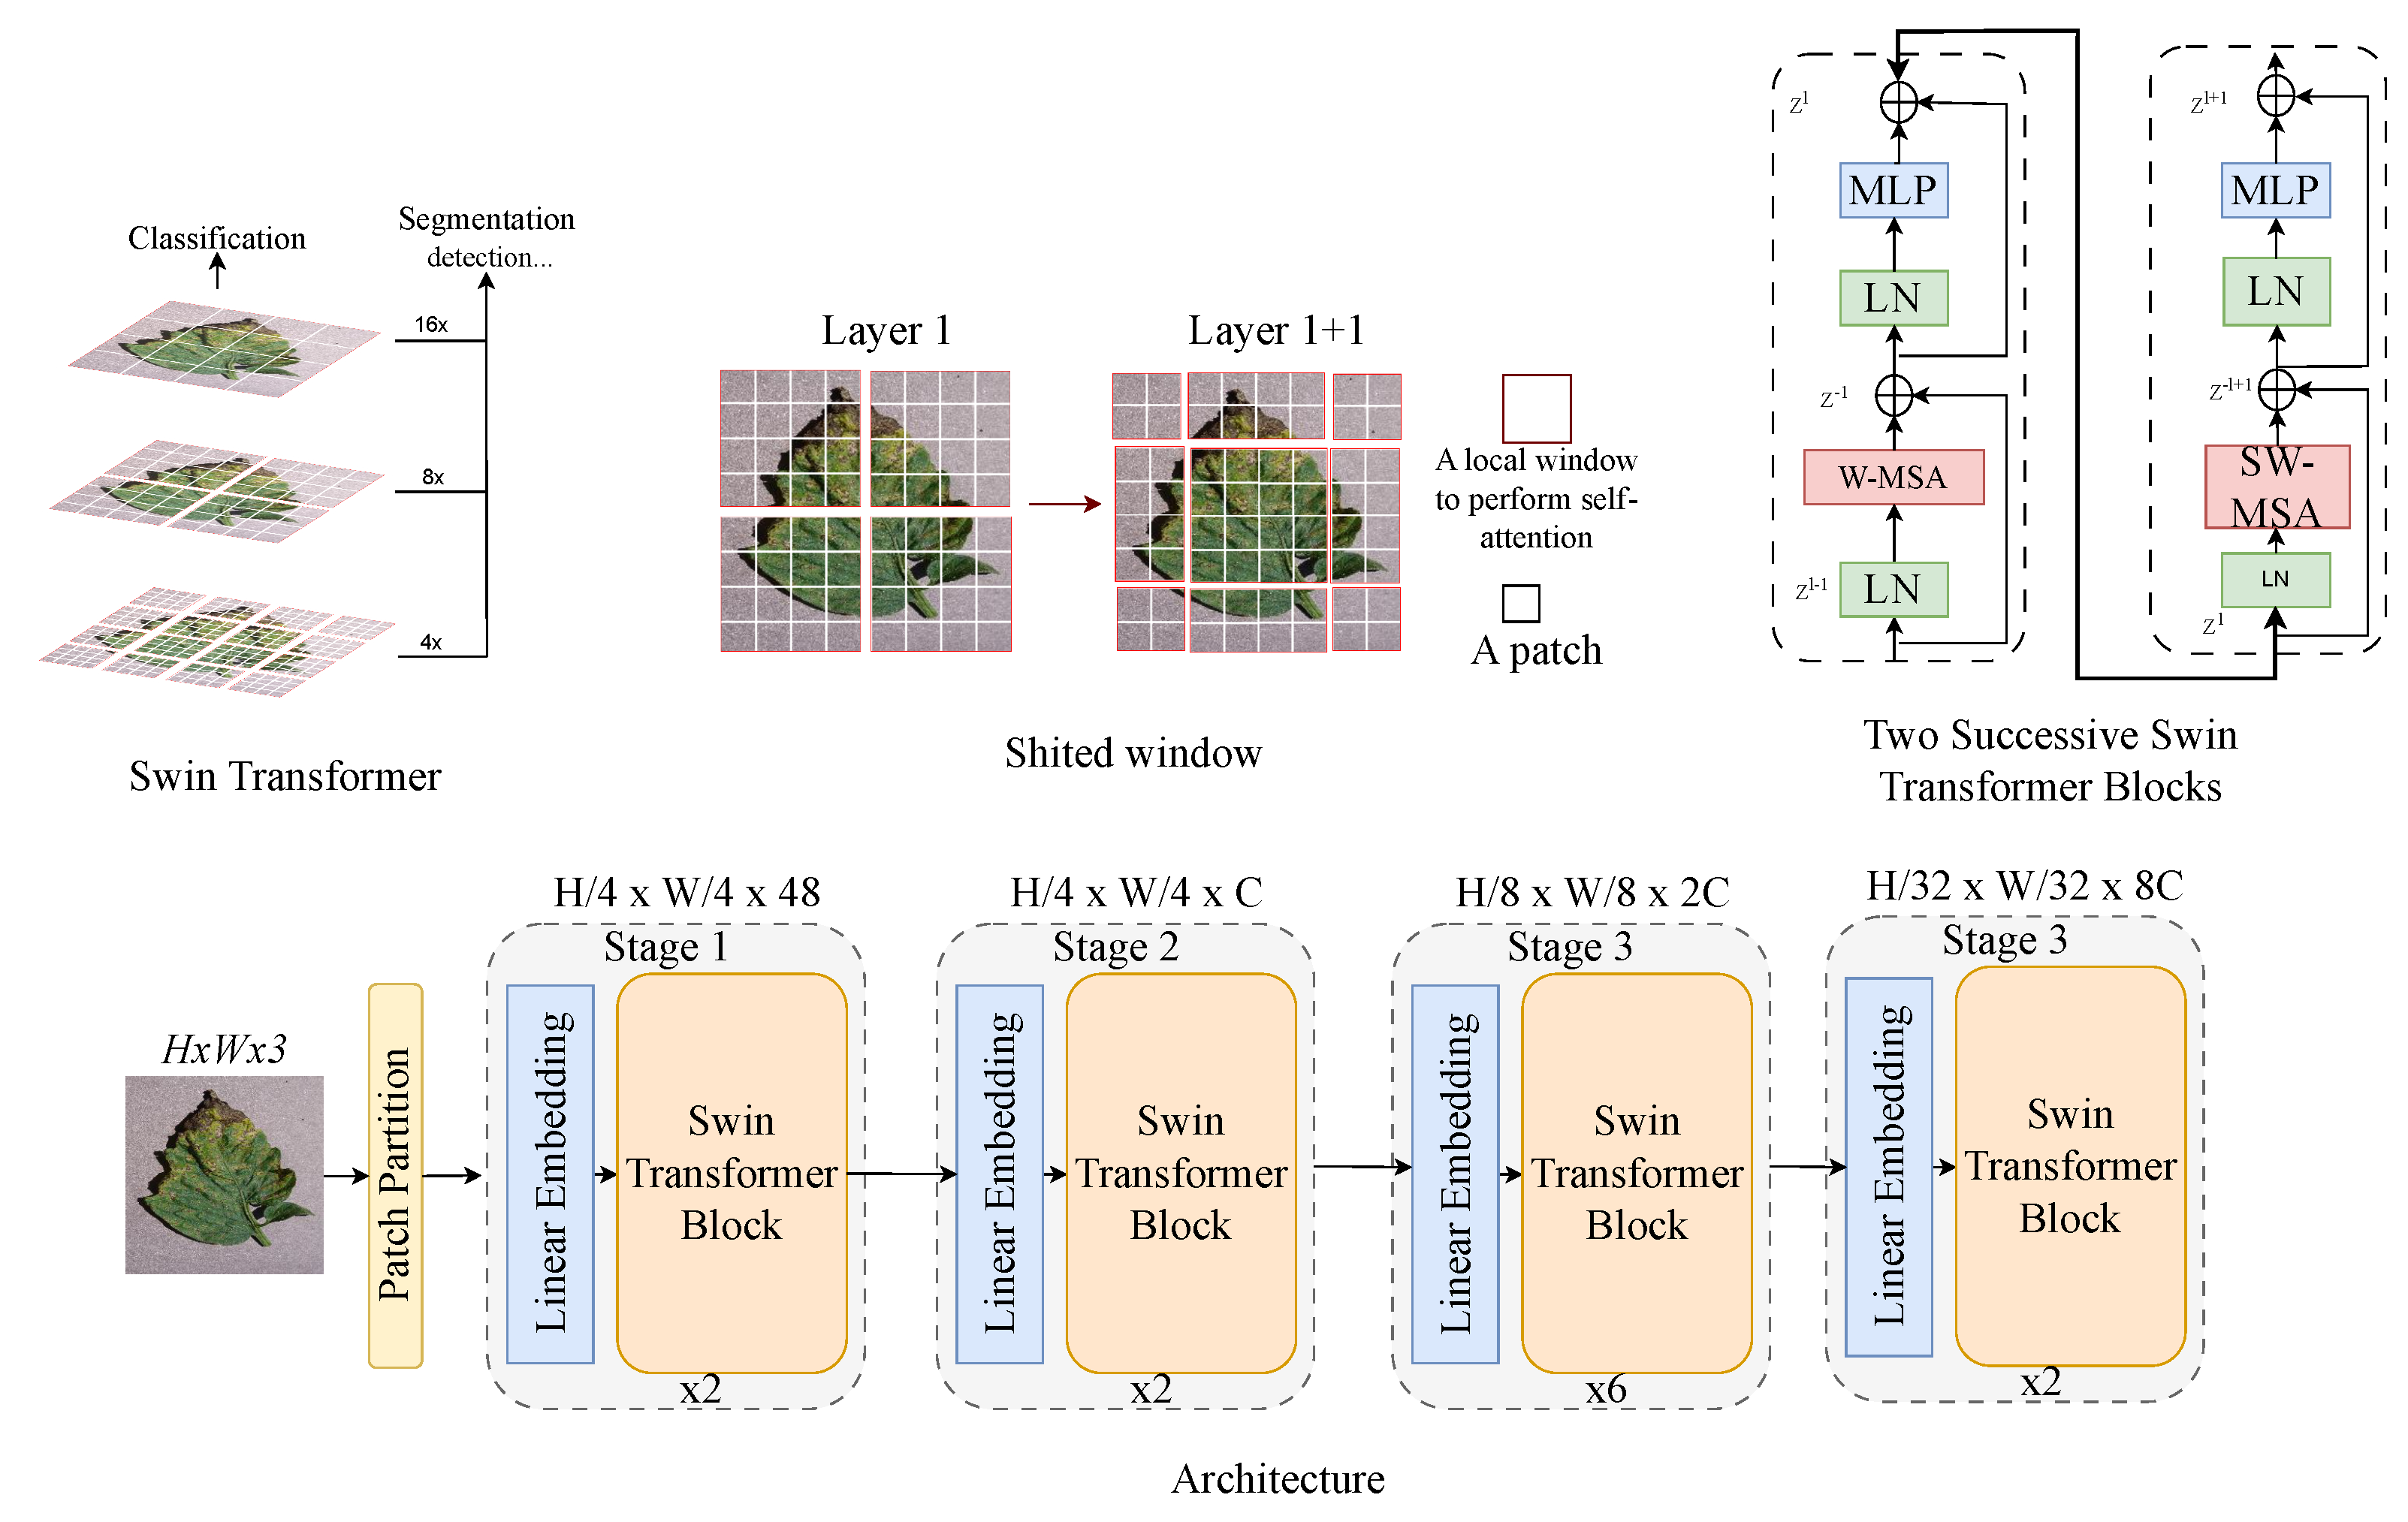
3.2.2. Swin Transformer
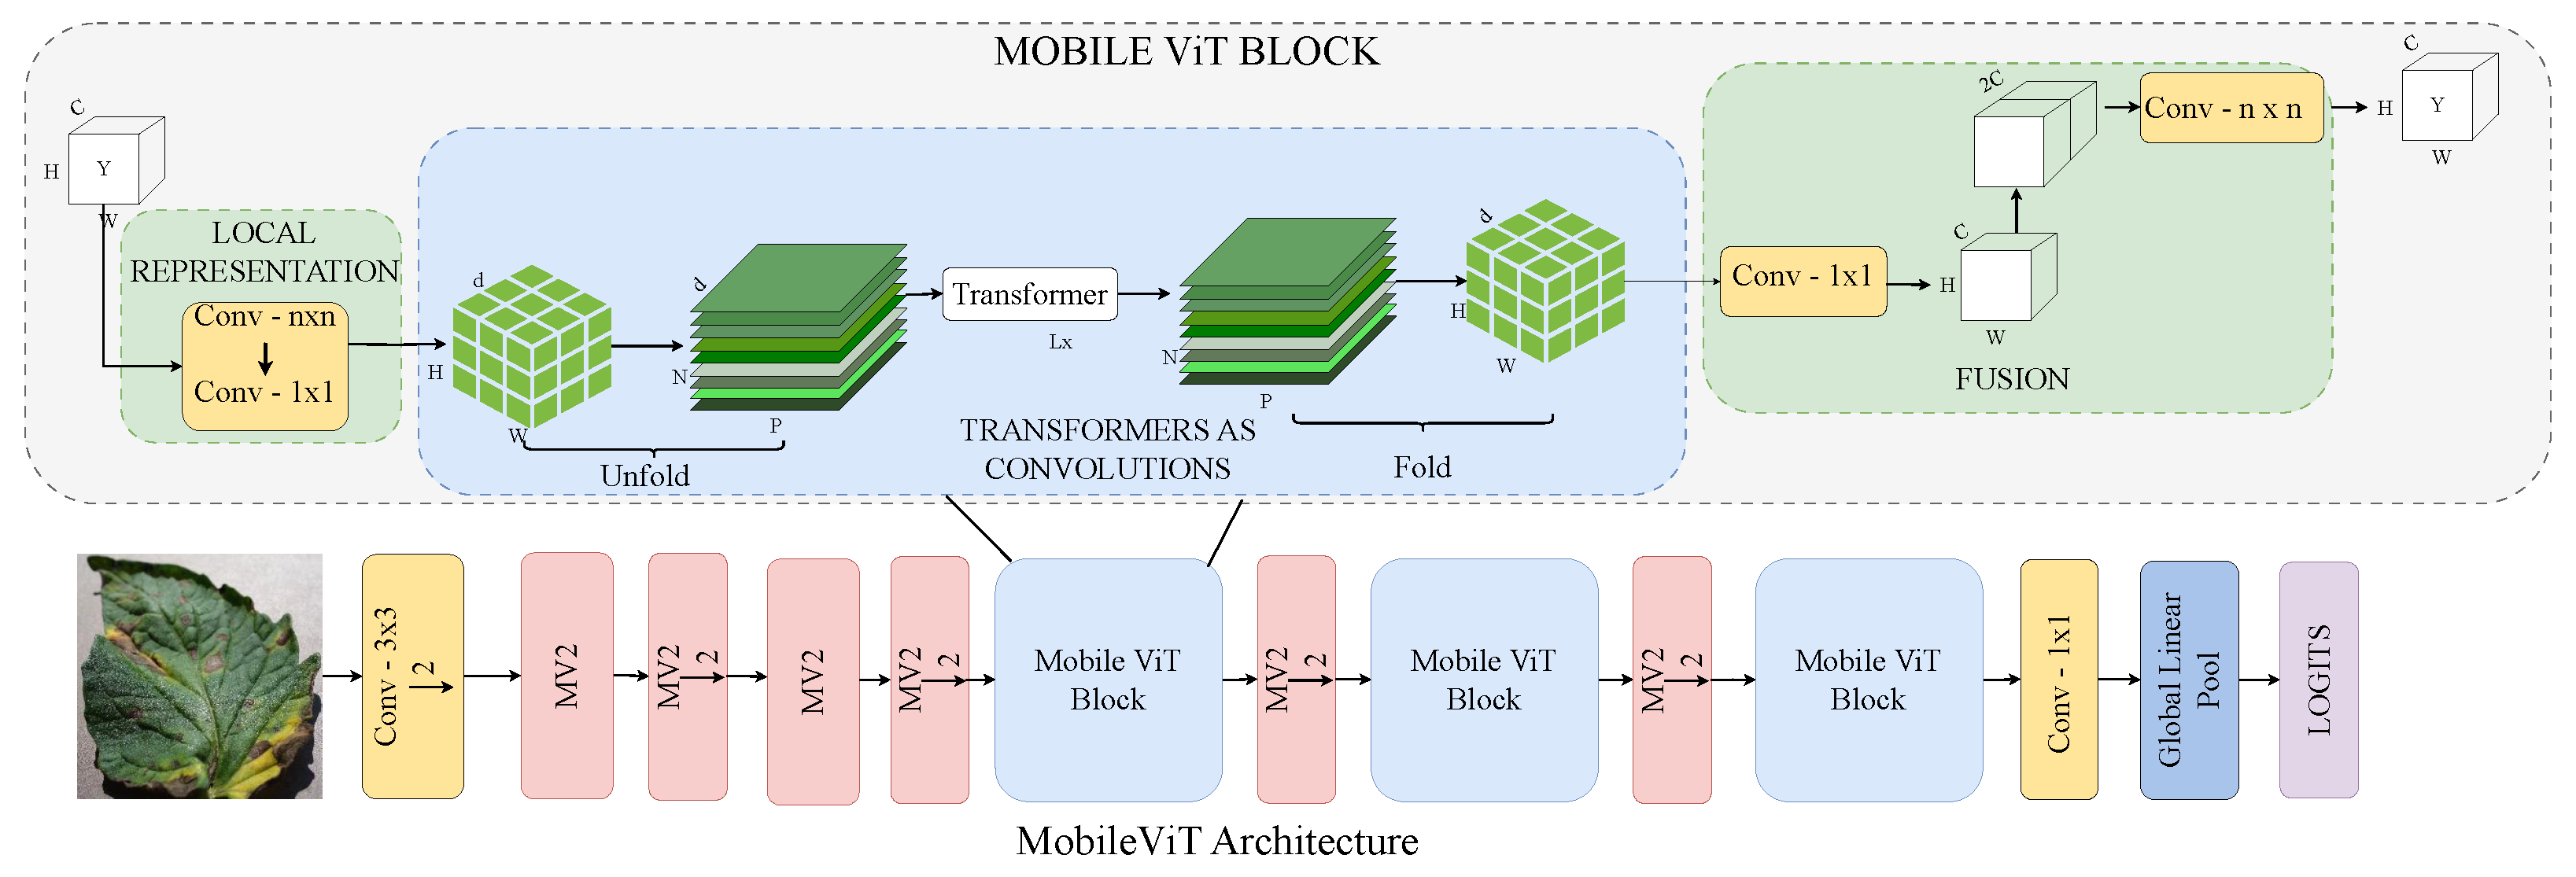
3.2.3. MobileViT
3.2.4. ConvNeXt–ViT
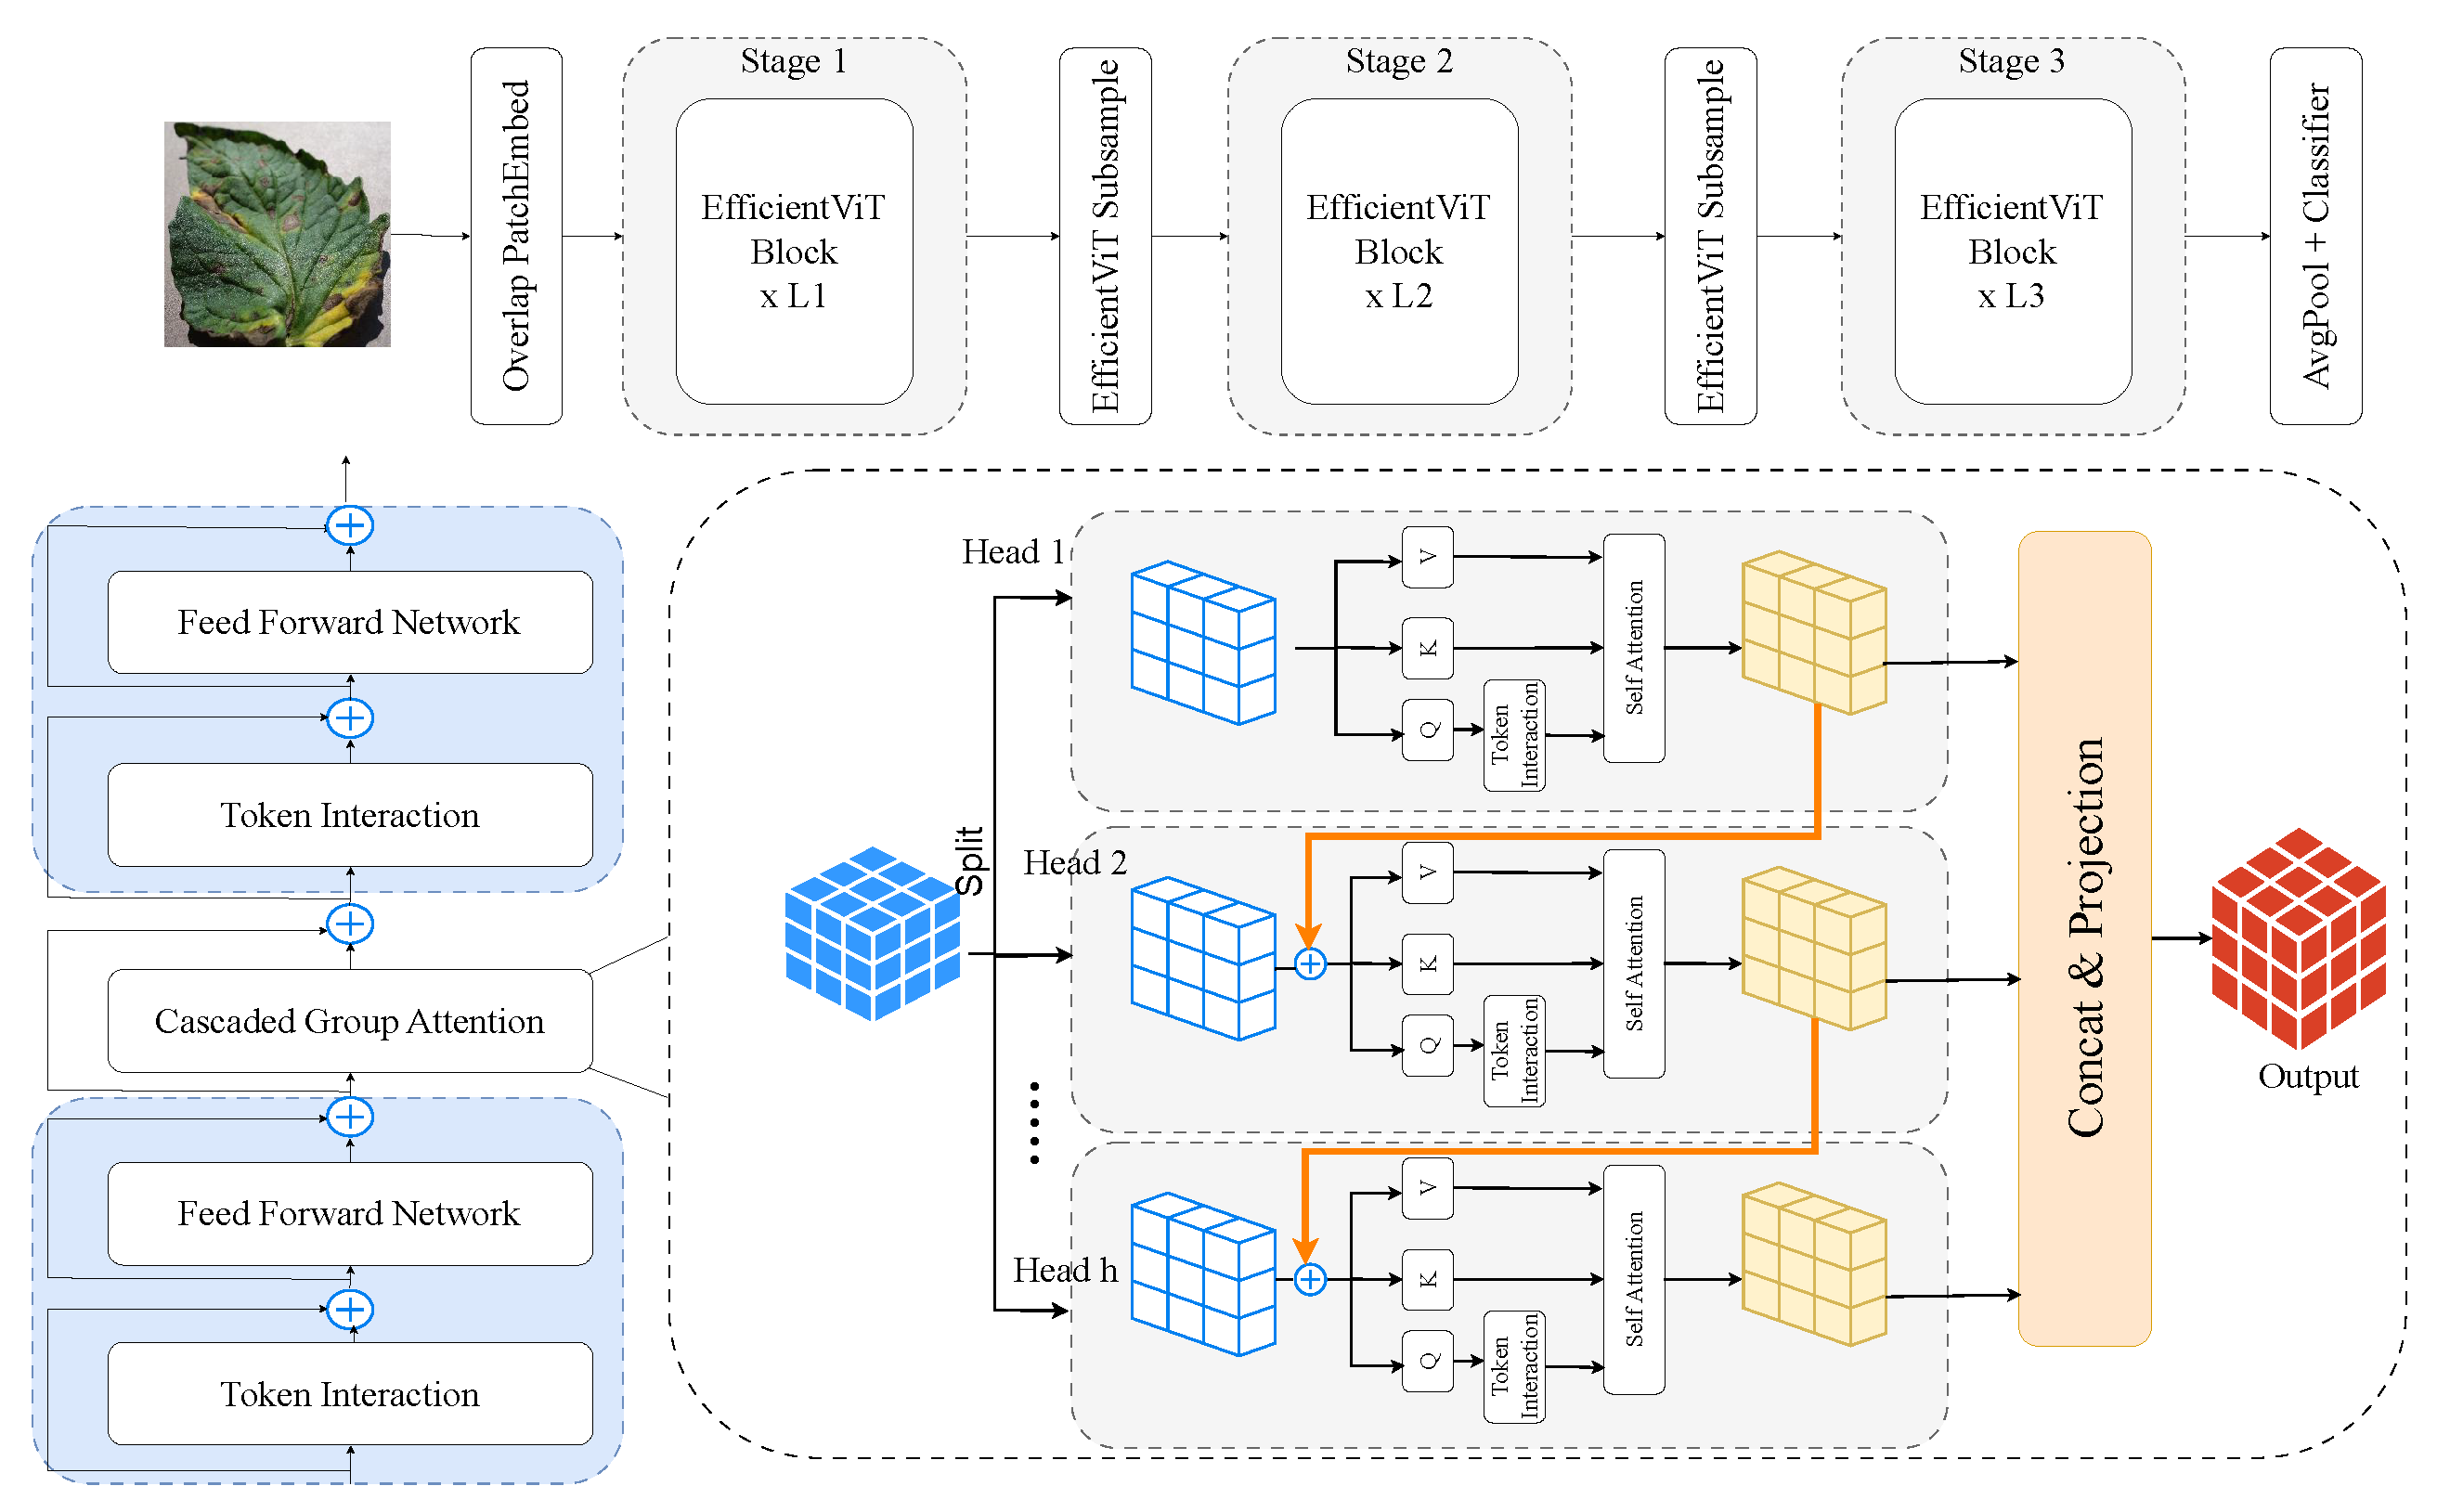
3.2.5. EfficientViT
3.3. AgriTrain—Training Strategy
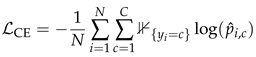
 is an indicator function that equals 1 if and 0 otherwise.
| Algorithm 2 AgriTrain—Supervised Training Strategy for ViT-RoT |
|
3.4. PlantScore—Evaluation Metrics
4. Experiments
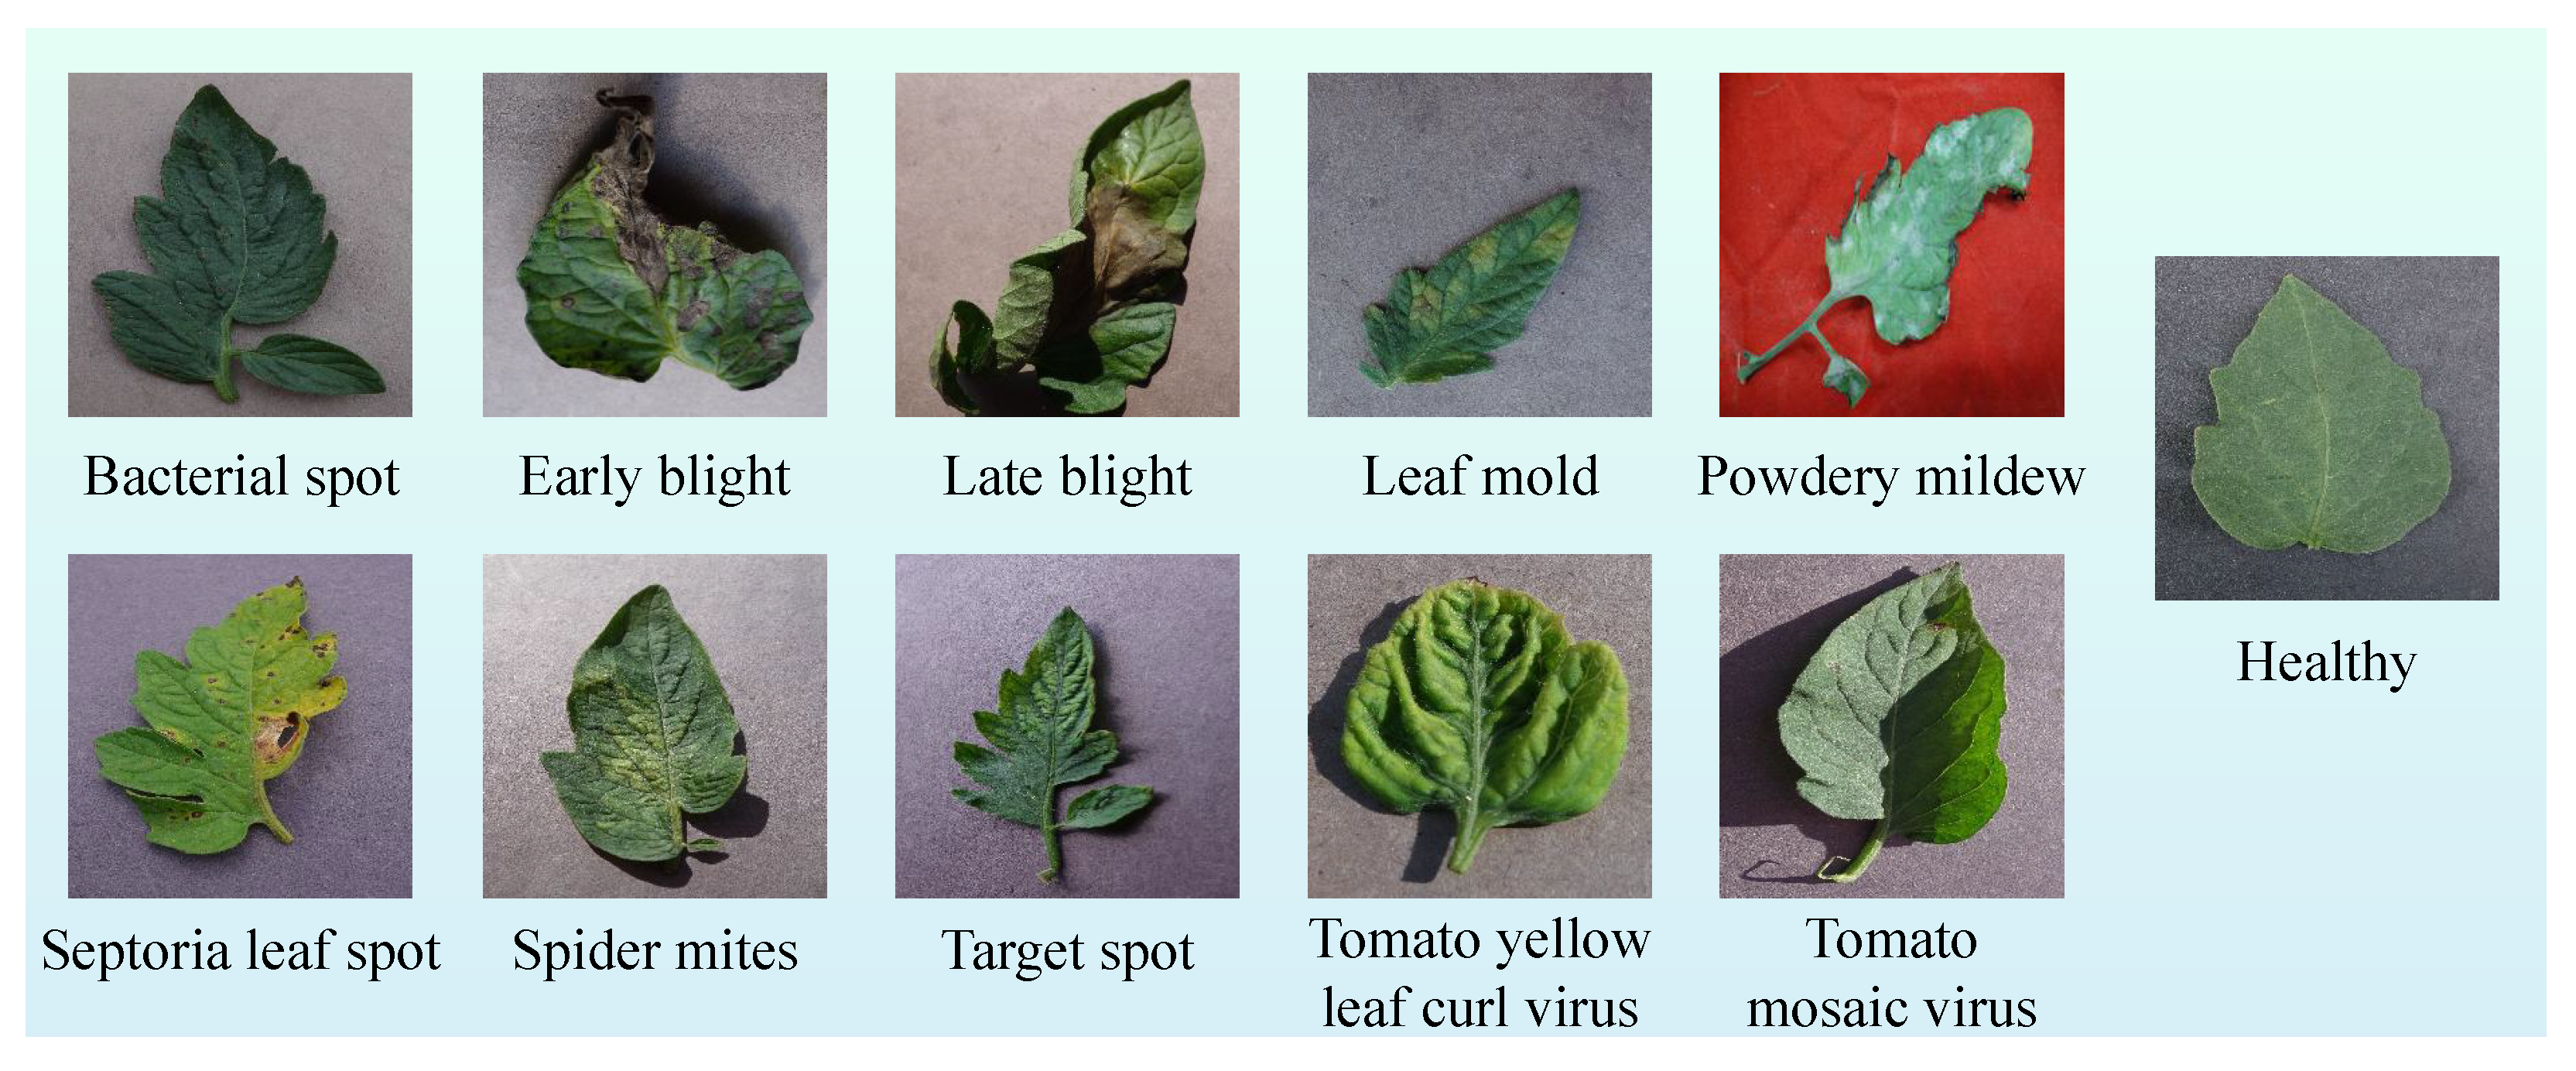
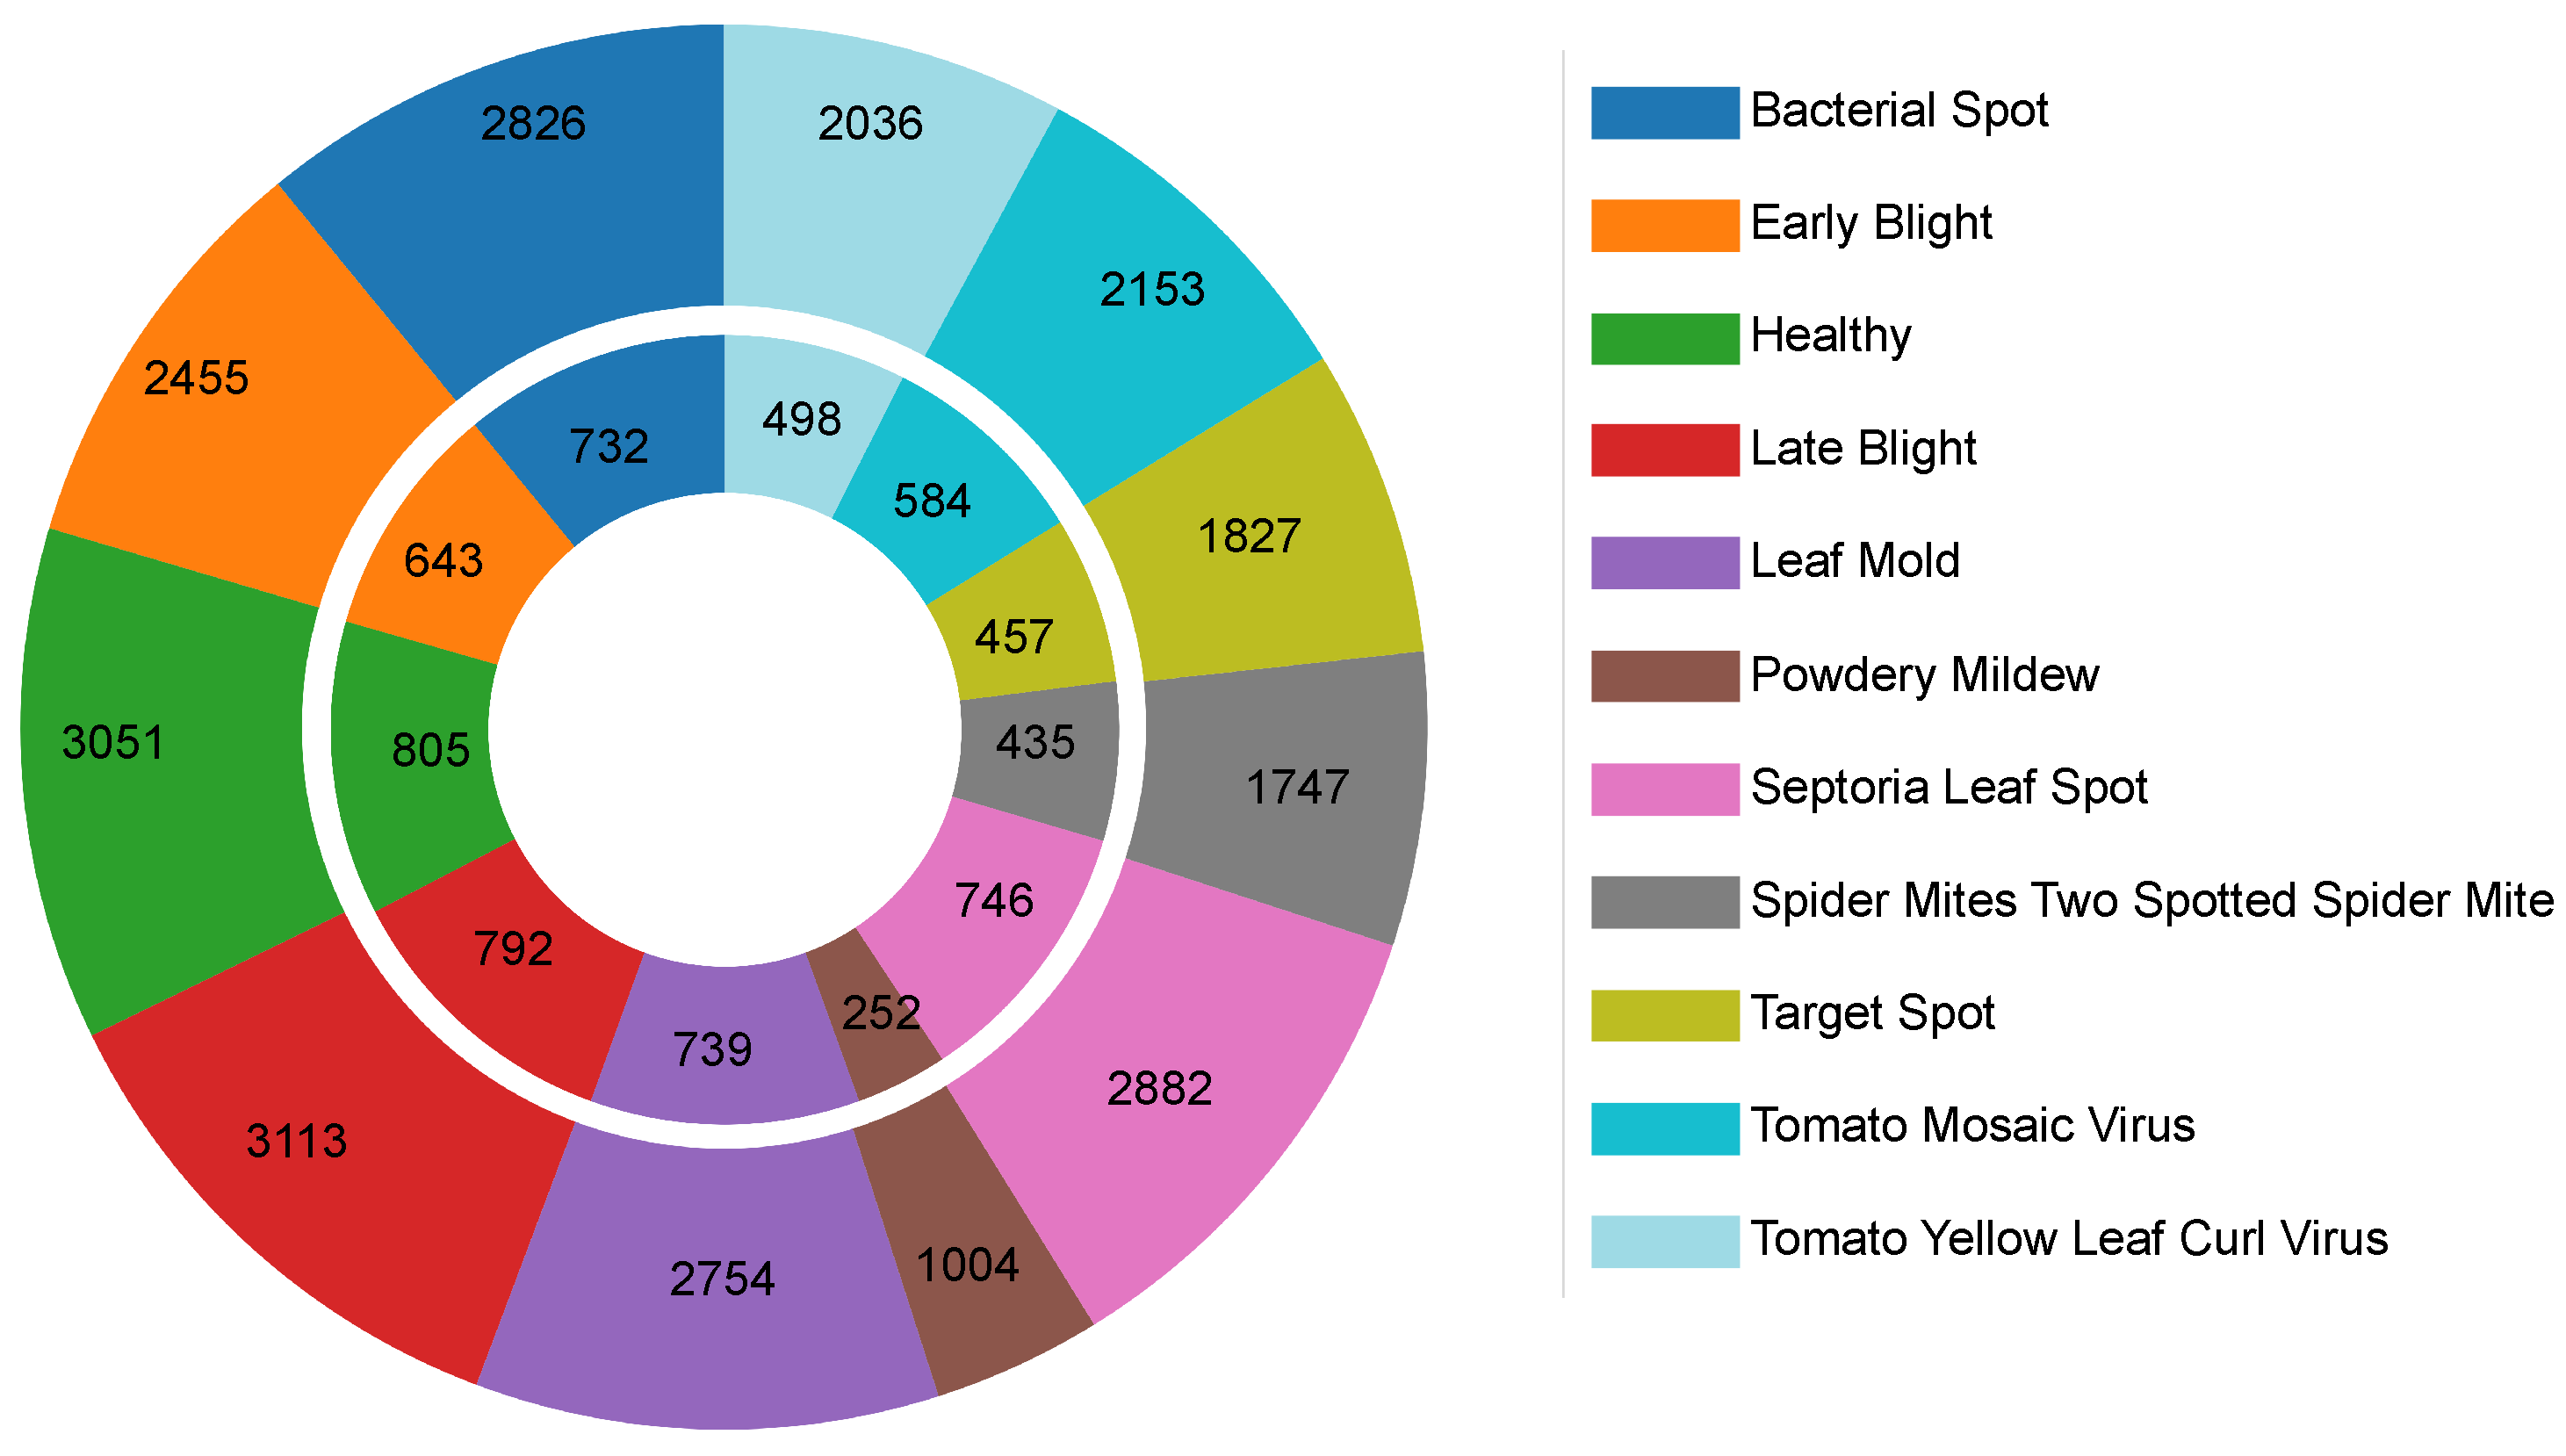
4.1. Datasets
4.2. Research Setup
4.3. Results and Discussions
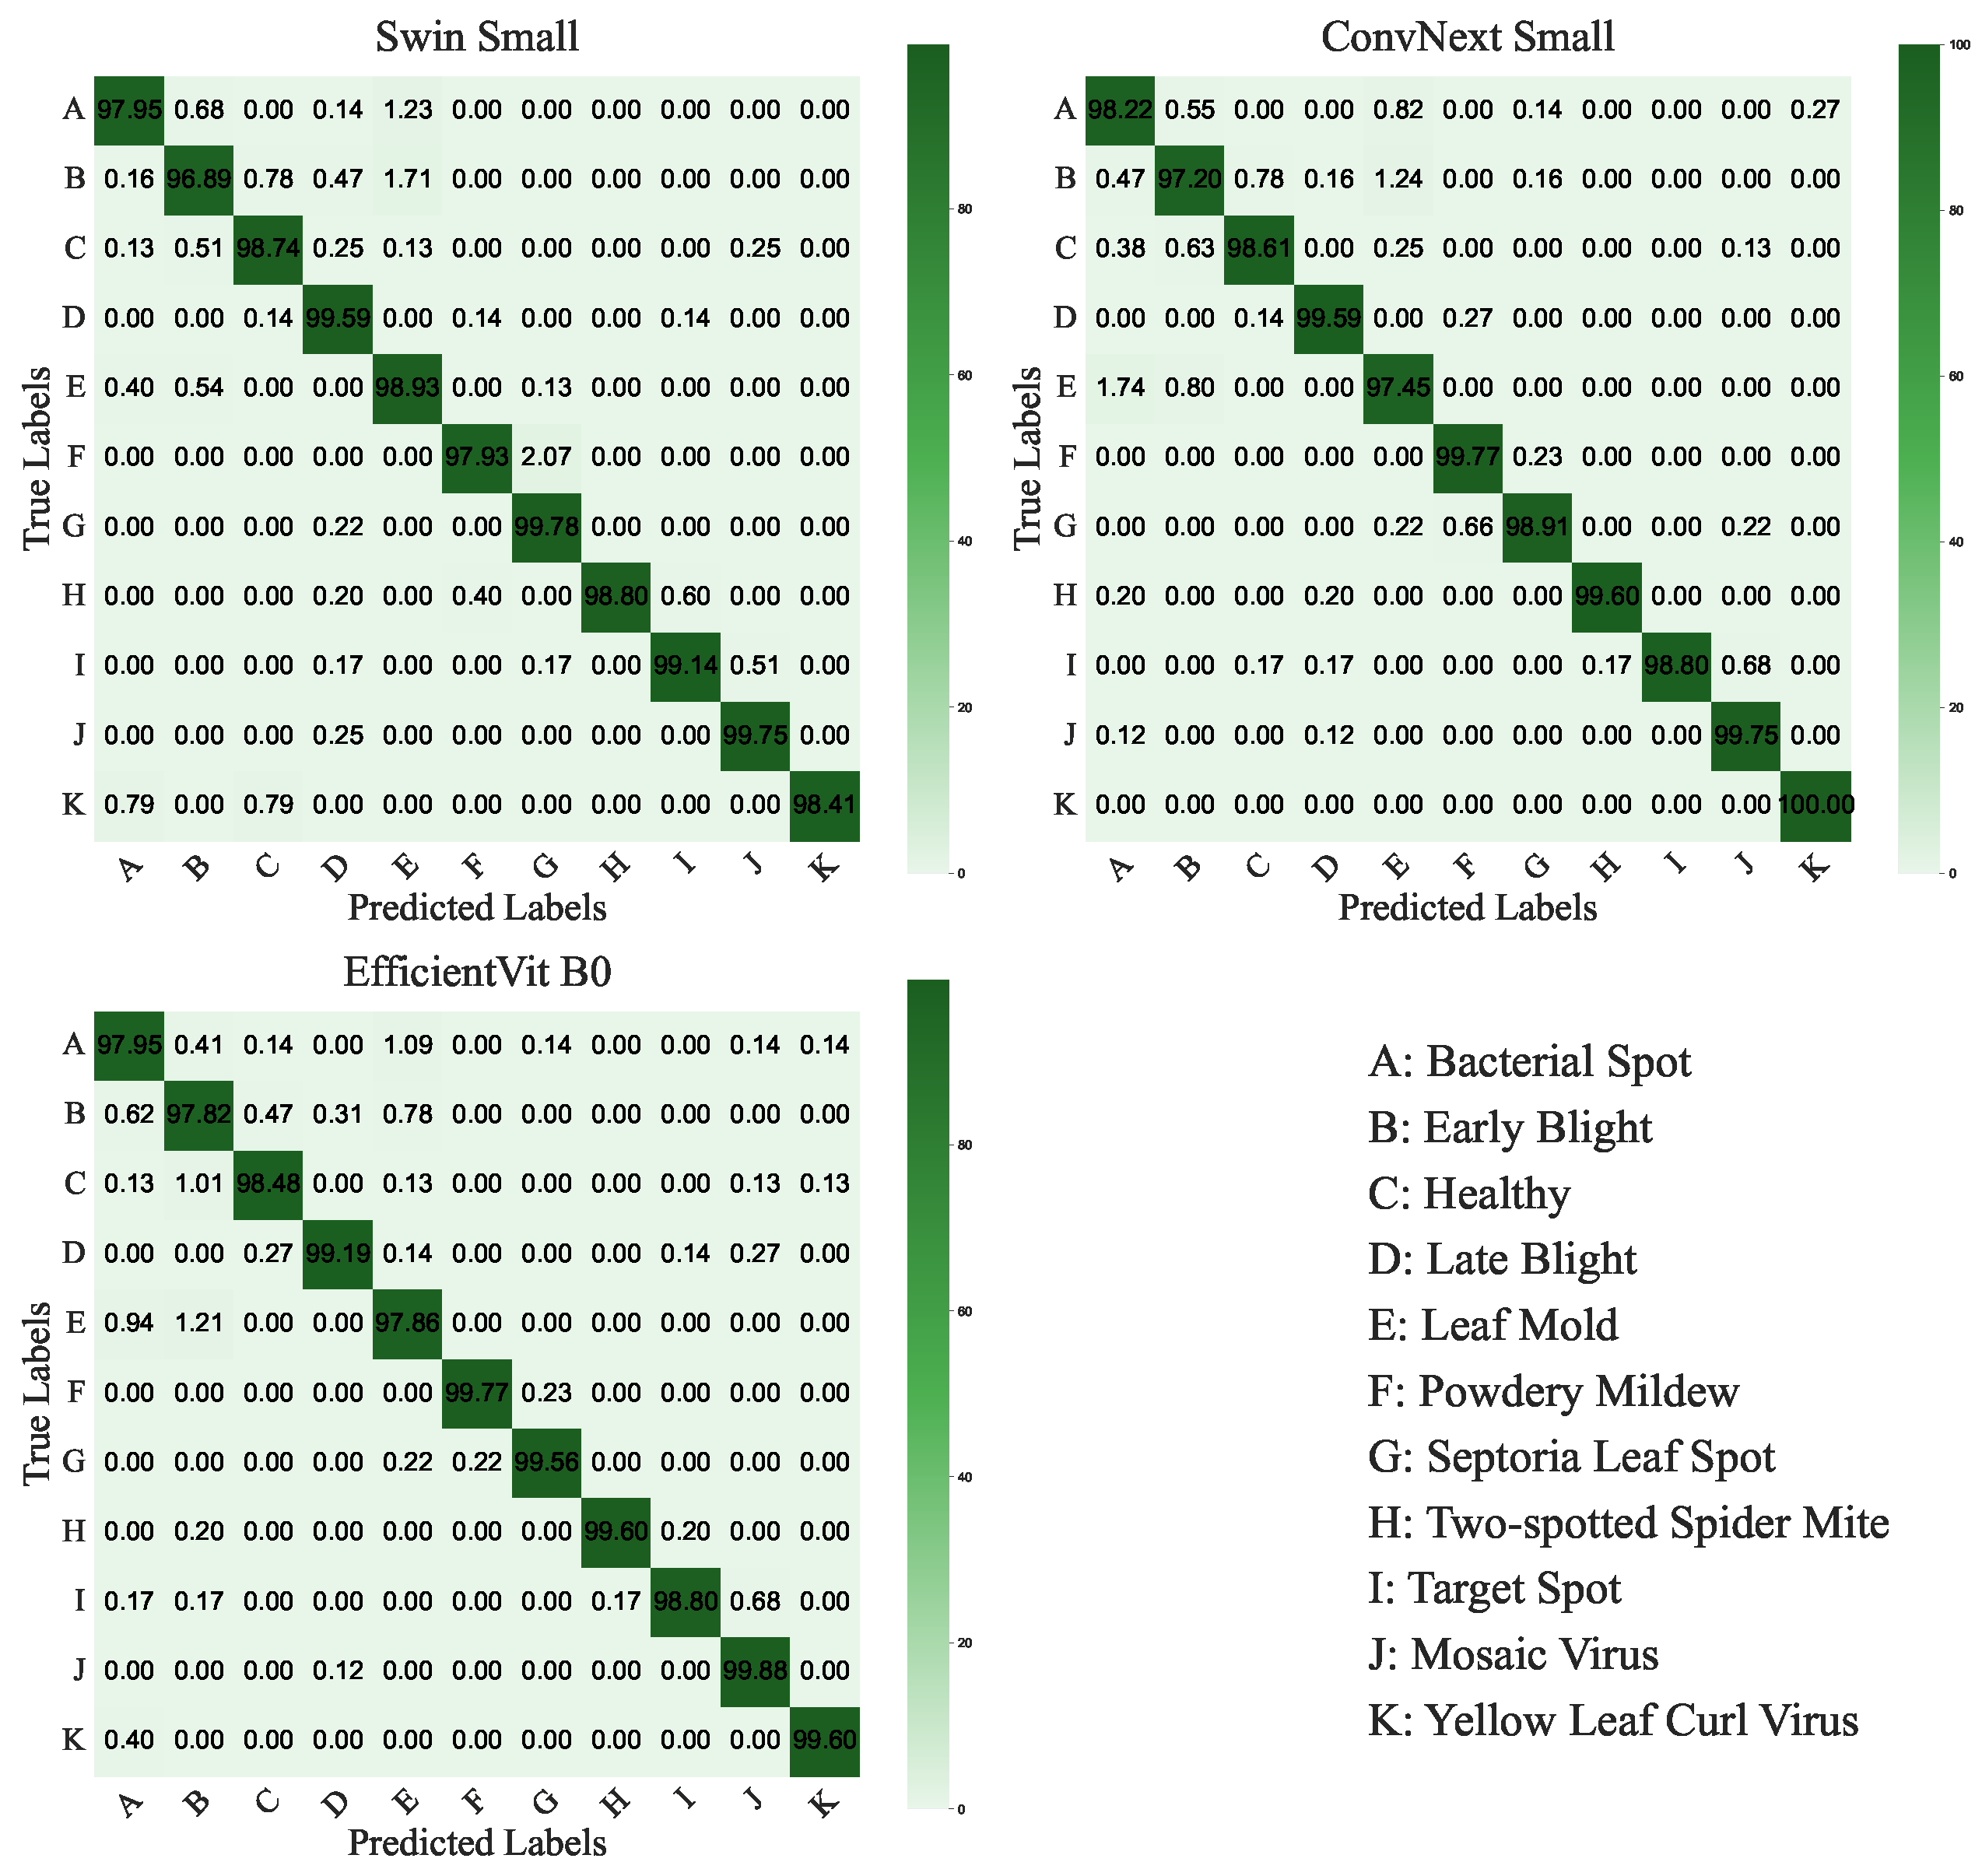
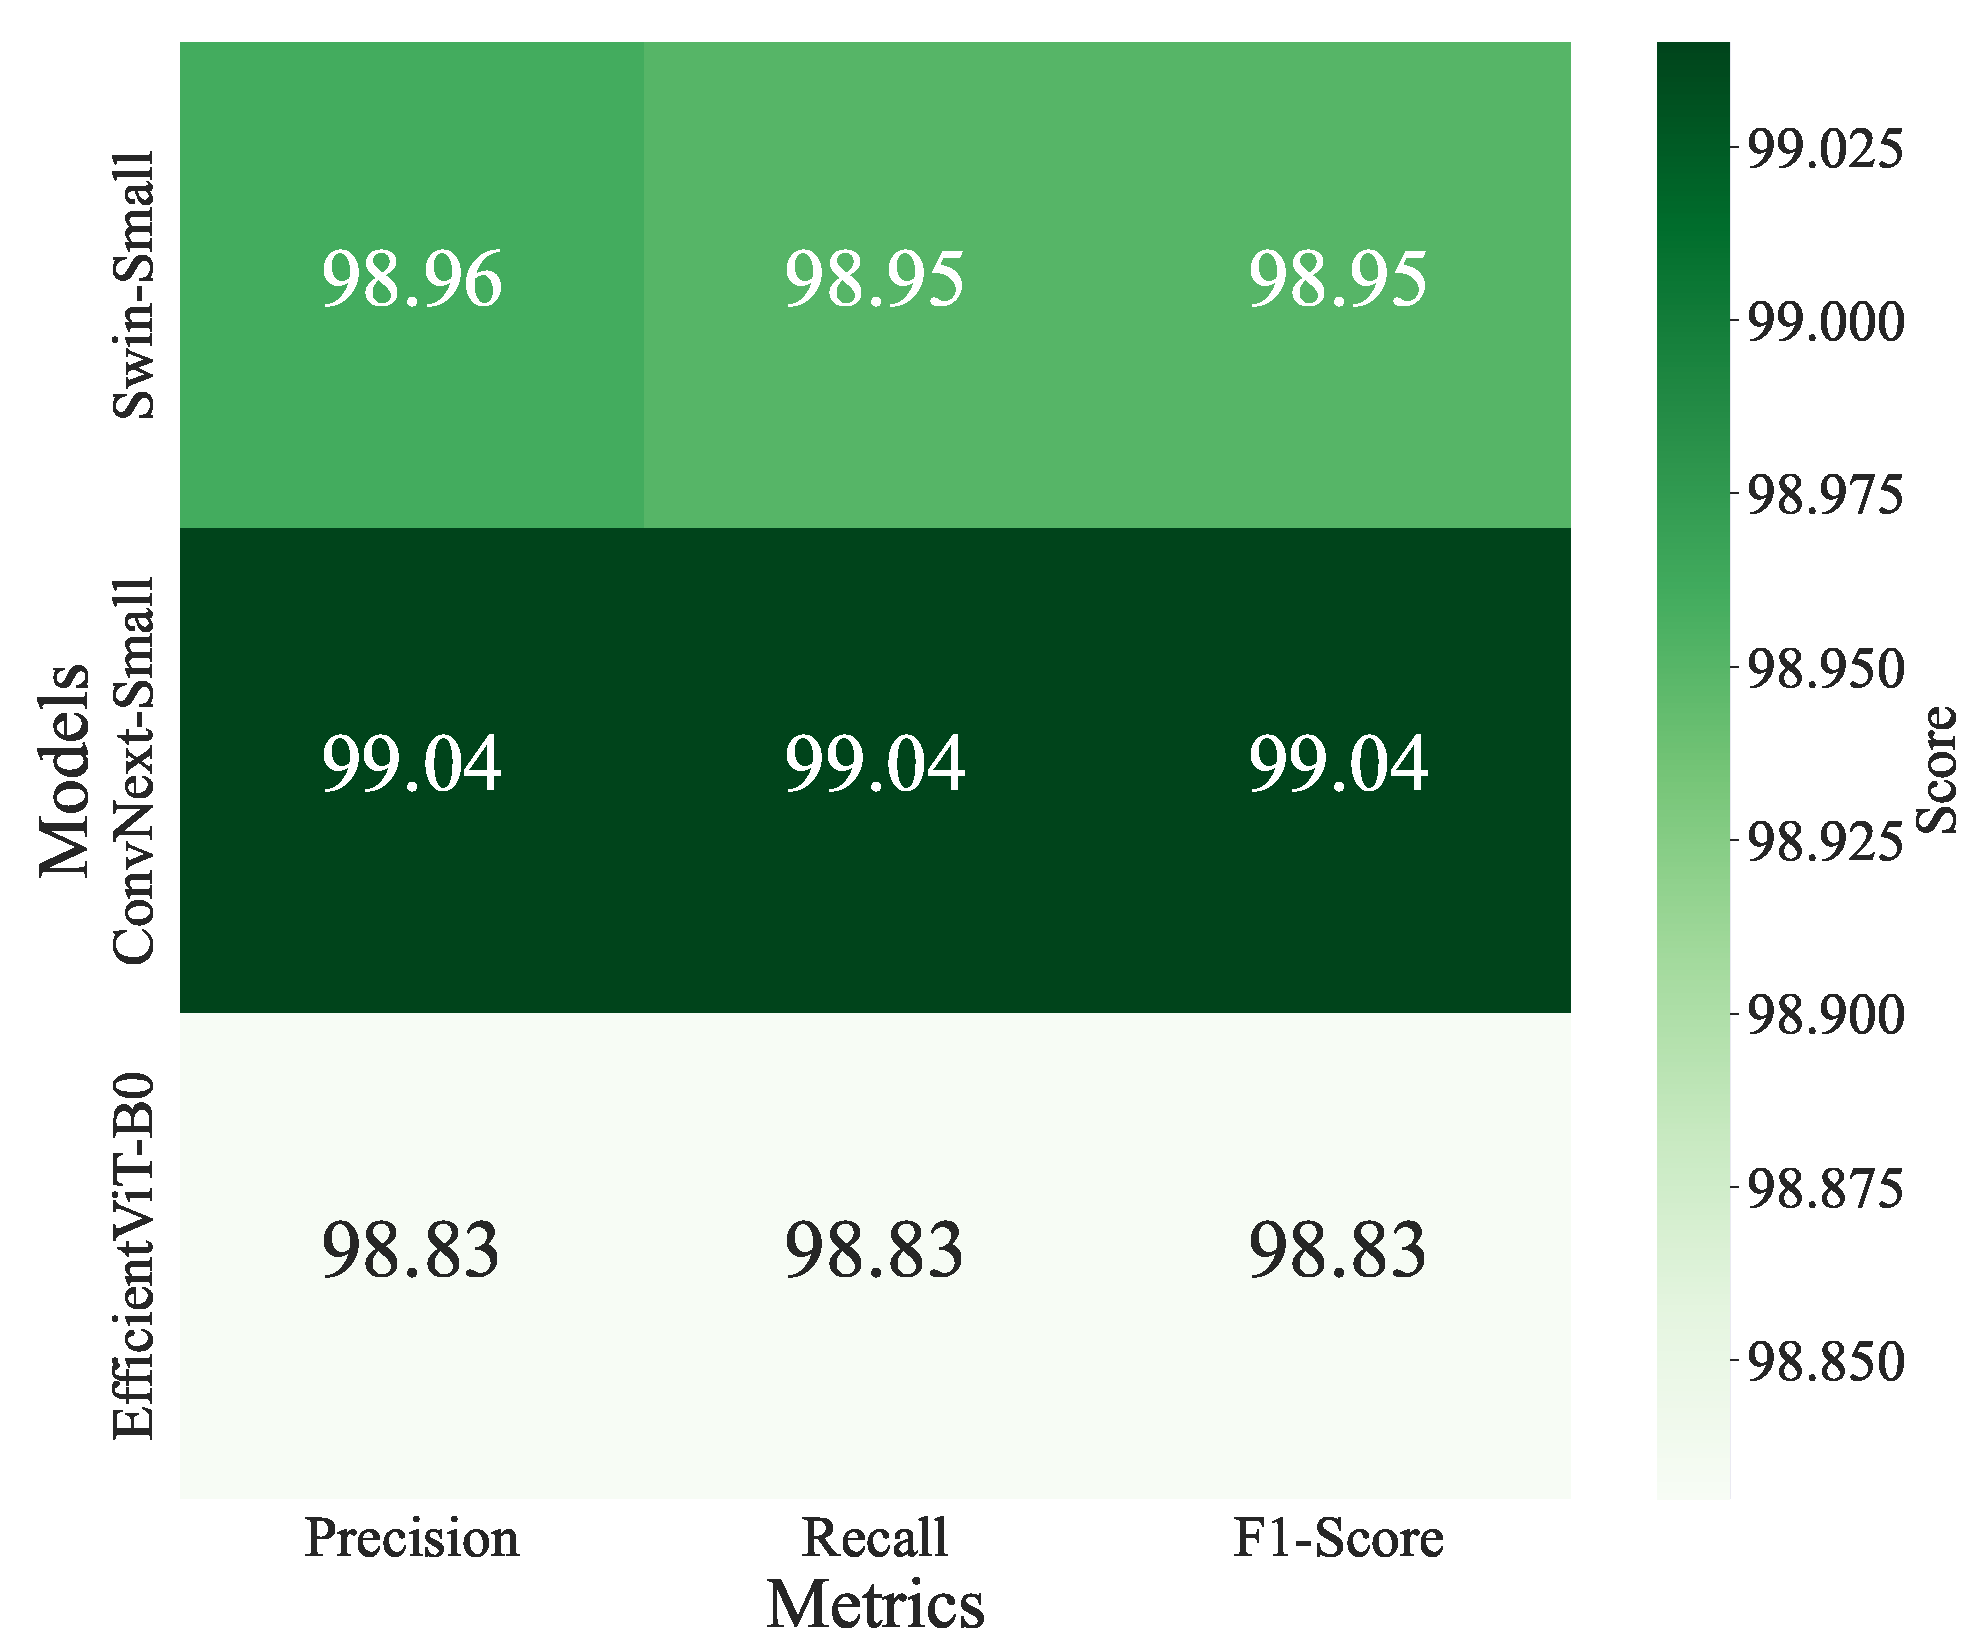
4.3.1. Top Performers
4.3.2. Moderate Performers
4.3.3. Low Performers
4.3.4. Performance Trends and Architectural Insights
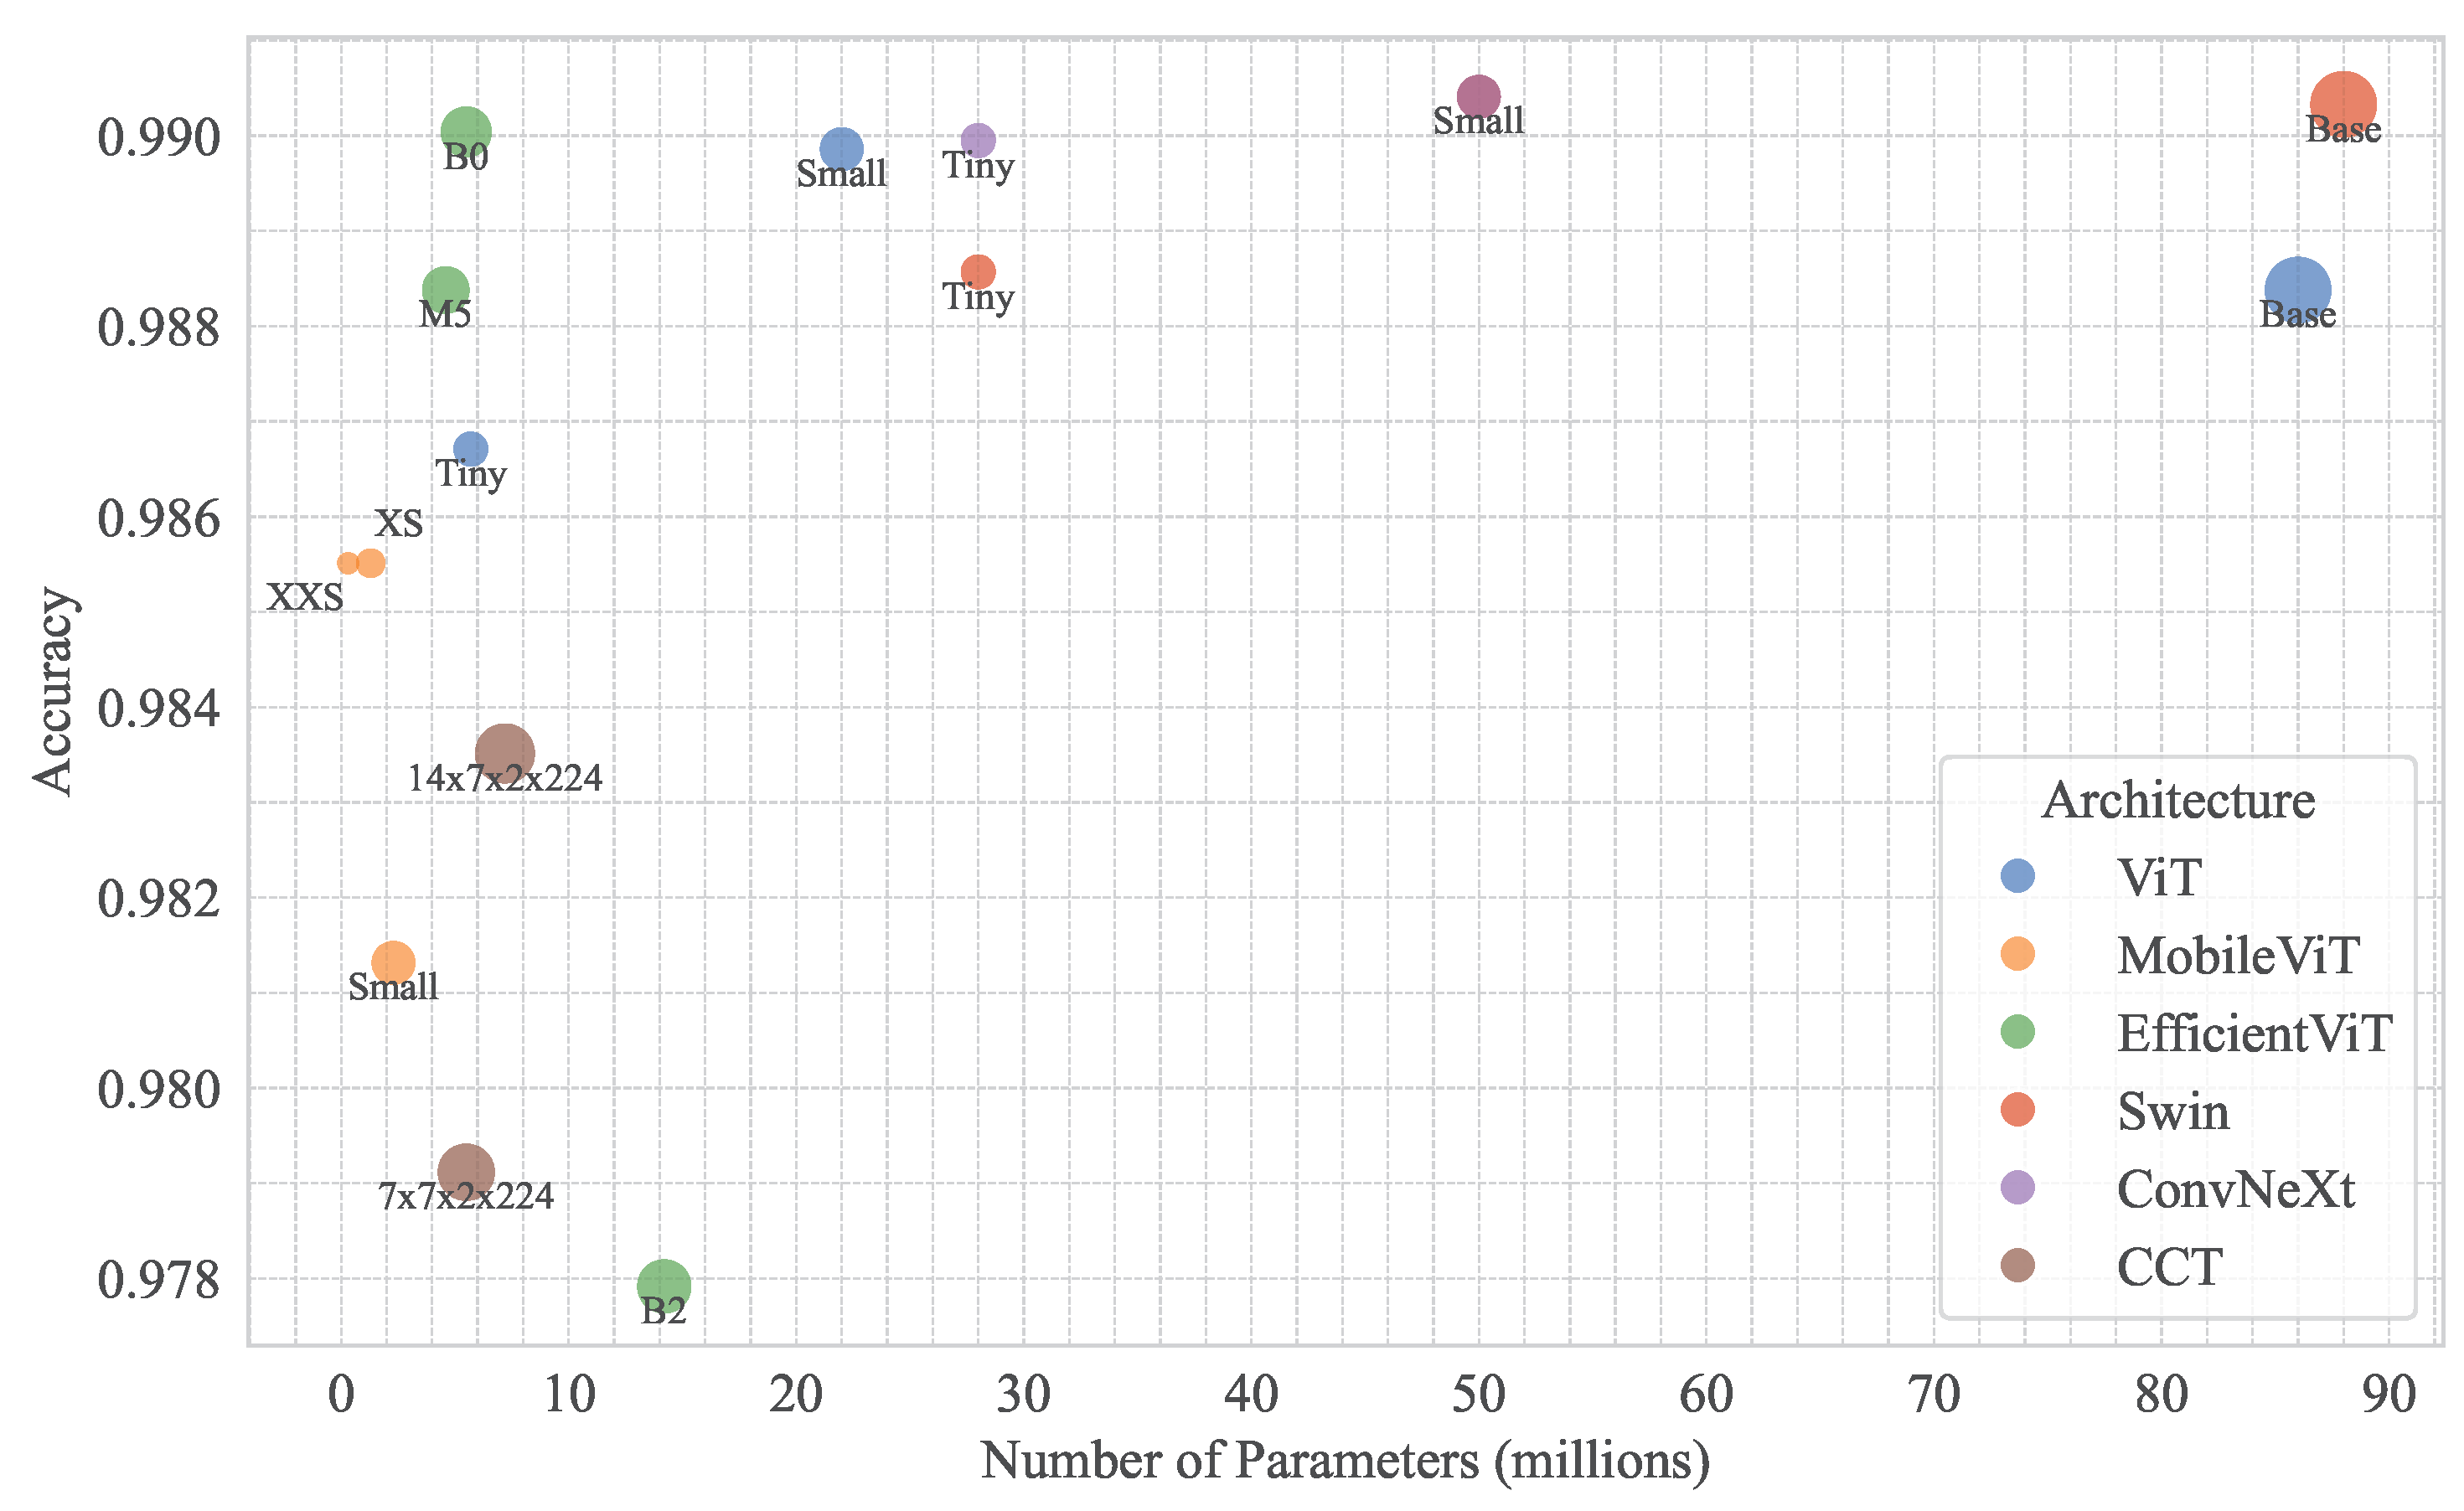
- Efficiency vs. Accuracy: Optimised models like ConvNeXt-Small, Swin-Small, and EfficientViT-B0 outperform larger models (e.g., ViT-Base), suggesting that architectural efficiency is critical for the dataset’s moderate size.
- Hierarchical Attention: Hierarchical models (ConvNeXt, Swin) consistently outperform global attention models (ViT), leveraging localised feature extraction to handle noise and class imbalance effectively. This is evident in ConvNeXt-Small and Swin-Small’s top accuracies (0.9904).
- Lightweight Models: EfficientViT-B0 (0.9900) and MobileViT-XXSmall/XSmall (0.9855) achieve high accuracies with reduced computational demands, ideal for edge deployment in agricultural diagnostics.
- Training Stability: Lower losses correlate with higher accuracies (e.g., EfficientViT-B0: 0.0427, 0.9900; ConvNeXt-Small: 0.0542, 0.9904), except for EfficientViT-B2 (0.0834, 0.9779), indicating optimisation challenges.
- ConvNeXt: ConvNeXt-Small’s top performance (0.9904) stems from its modernised convolutional design with transformer-inspired elements, excelling in noisy and imbalanced data. ConvNeXt-Tiny (98.99%) reinforces this robustness.
- Swin Transformers: Swin-Small and Swin-Base leverage hierarchical shifted window-based attention, ideal for multi-scale feature extraction in mixed image conditions. Swin-Tiny (0.9885) highlights scalability.
- EfficientViT: EfficientViT-B0’s low loss and high accuracy reflect optimised multi-scale attention. EfficientViT-B2’s lower performance suggests scaling limitations.
- ViT: ViT-Small (0.9898) outperforms ViT-Base (98.83%) due to better generalisation, as larger ViTs risk overfitting on moderate-sized datasets.
- MobileViT and CCT: MobileViT-XXSmall/XSmall offer efficiency, but MobileViT-Small (0.9813) and CCT models (0.9791–0.9835) underperform due to limited capacity or high losses.
4.3.5. Efficiency and Practical Implications
5. Conclusions
Author Contributions
Funding
Data Availability Statement
Conflicts of Interest
References
- Sundararaman, B.; Jagdev, S.; Khatri, N. Transformative role of artificial intelligence in advancing sustainable tomato (Solanum lycopersicum) disease management for global food security: A comprehensive review. Sustainability 2023, 15, 11681. [Google Scholar] [CrossRef]
- Trivedi, N.K.; Gautam, V.; Anand, A.; Aljahdali, H.M.; Villar, S.G.; Anand, D.; Goyal, N.; Kadry, S. Early detection and classification of tomato leaf disease using high-performance deep neural network. Sensors 2021, 21, 7987. [Google Scholar] [CrossRef] [PubMed]
- Thuseethan, S.; Vigneshwaran, P.; Charles, J.; Wimalasooriya, C. Siamese network-based lightweight framework for tomato leaf disease recognition. Computers 2024, 13, 323. [Google Scholar] [CrossRef]
- Jafar, A.; Bibi, N.; Naqvi, R.A.; Sadeghi-Niaraki, A.; Jeong, D. Revolutionizing agriculture with artificial intelligence: Plant disease detection methods, applications, and their limitations. Front. Plant Sci. 2024, 15, 1356260. [Google Scholar] [CrossRef]
- George, R.; Thuseethan, S.; Ragel, R.G.; Mahendrakumaran, K.; Nimishan, S.; Wimalasooriya, C.; Alazab, M. Past, present and future of deep plant leaf disease recognition: A survey. Comput. Electron. Agric. 2025, 234, 110128. [Google Scholar] [CrossRef]
- Paul, S.G.; Biswas, A.A.; Saha, A.; Zulfiker, M.S.; Ritu, N.A.; Zahan, I.; Rahman, M.; Islam, M.A. A real-time application-based convolutional neural network approach for tomato leaf disease classification. Array 2023, 19, 100313. [Google Scholar] [CrossRef]
- Islam, S.U.; Zaib, S.; Ferraioli, G.; Pascazio, V.; Schirinzi, G.; Husnain, G. Enhanced deep learning architecture for rapid and accurate tomato plant disease diagnosis. AgriEngineering 2024, 6, 375–395. [Google Scholar] [CrossRef]
- Ahmad, I.; Hamid, M.; Yousaf, S.; Shah, S.T.; Ahmad, M.O. Optimizing pretrained convolutional neural networks for tomato leaf disease detection. Complexity 2020, 2020, 8812019. [Google Scholar] [CrossRef]
- Too, E.C.; Yujian, L.; Njuki, S.; Yingchun, L. A comparative study of fine-tuning deep learning models for plant disease identification. Comput. Electron. Agric. 2019, 161, 272–279. [Google Scholar] [CrossRef]
- Tan, L.; Lu, J.; Jiang, H. Tomato leaf diseases classification based on leaf images: A comparison between classical machine learning and deep learning methods. AgriEngineering 2021, 3, 542–558. [Google Scholar] [CrossRef]
- Karande, S.; Garg, B. Performance evaluation and optimization of convolutional neural network architectures for Tomato plant disease eleven classes based on augmented leaf images dataset. Neural Comput. Appl. 2024, 36, 11919–11943. [Google Scholar] [CrossRef]
- Ahmed, A.A.; Reddy, G.H. A mobile-based system for detecting plant leaf diseases using deep learning. AgriEngineering 2021, 3, 478–493. [Google Scholar] [CrossRef]
- Nazir, T.; Iqbal, M.M.; Jabbar, S.; Hussain, A.; Albathan, M. EfficientPNet—an optimized and efficient deep learning approach for classifying disease of potato plant leaves. Agriculture 2023, 13, 841. [Google Scholar] [CrossRef]
- Ali, A.H.; Youssef, A.; Abdelal, M.; Raja, M.A. An ensemble of deep learning architectures for accurate plant disease classification. Ecol. Inform. 2024, 81, 102618. [Google Scholar] [CrossRef]
- Liu, W.; Yu, L.; Luo, J. A hybrid attention-enhanced DenseNet neural network model based on improved U-Net for rice leaf disease identification. Front. Plant Sci. 2022, 13, 922809. [Google Scholar] [CrossRef]
- Karimanzira, D. Context-Aware Tomato Leaf Disease Detection Using Deep Learning in an Operational Framework. Electronics 2025, 14, 661. [Google Scholar] [CrossRef]
- Hossain, S.; Tanzim Reza, M.; Chakrabarty, A.; Jung, Y.J. Aggregating different scales of attention on feature variants for tomato leaf disease diagnosis from image data: A transformer driven study. Sensors 2023, 23, 3751. [Google Scholar] [CrossRef]
- Jamil, S.; Jalil Piran, M.; Kwon, O.J. A comprehensive survey of transformers for computer vision. Drones 2023, 7, 287. [Google Scholar] [CrossRef]
- Maurício, J.; Domingues, I.; Bernardino, J. Comparing vision transformers and convolutional neural networks for image classification: A literature review. Appl. Sci. 2023, 13, 5521. [Google Scholar] [CrossRef]
- Parez, S.; Dilshad, N.; Alghamdi, N.S.; Alanazi, T.M.; Lee, J.W. Visual intelligence in precision agriculture: Exploring plant disease detection via efficient vision transformers. Sensors 2023, 23, 6949. [Google Scholar] [CrossRef]
- Al Mamun, A.; Ahmedt-Aristizabal, D.; Zhang, M.; Hossen, M.I.; Hayder, Z.; Awrangjeb, M. Plant Disease Detection Using Self-supervised Learning: A Systematic Review. IEEE Access 2024, 12, 171926–171943. [Google Scholar] [CrossRef]
- Alzahrani, M.S.; Alsaade, F.W. Transform and deep learning algorithms for the early detection and recognition of tomato leaf disease. Agronomy 2023, 13, 1184. [Google Scholar] [CrossRef]
- Jajja, A.I.; Abbas, A.; Khattak, H.A.; Niedbała, G.; Khalid, A.; Rauf, H.T.; Kujawa, S. Compact convolutional transformer (CCT)-Based approach for whitefly attack detection in cotton crops. Agriculture 2022, 12, 1529. [Google Scholar] [CrossRef]
- Sun, Y.; Ning, L.; Zhao, B.; Yan, J. Tomato Leaf Disease Classification by Combining EfficientNetv2 and a Swin Transformer. Appl. Sci. 2024, 14, 7472. [Google Scholar] [CrossRef]
- Zhang, M.; Lin, Z.; Tang, S.; Lin, C.; Zhang, L.; Dong, W.; Zhong, N. Dual-Attention-Enhanced MobileViT Network: A Lightweight Model for Rice Disease Identification in Field-Captured Images. Agriculture 2025, 15, 571. [Google Scholar] [CrossRef]
- Hamdi, E.B.; Hidayaturrahmana. Ensemble of pre-trained vision transformer models in plant disease classification, an efficient approach. Procedia Comput. Sci. 2024, 245, 565–573. [Google Scholar] [CrossRef]
- Tugrul, B.; Elfatimi, E.; Eryigit, R. Convolutional neural networks in detection of plant leaf diseases: A review. Agriculture 2022, 12, 1192. [Google Scholar] [CrossRef]
- Alam, T.S.; Jowthi, C.B.; Pathak, A. Comparing pre-trained models for efficient leaf disease detection: A study on custom CNN. J. Electr. Syst. Inf. Technol. 2024, 11, 12. [Google Scholar] [CrossRef]
- Thai, H.T.; Tran-Van, N.Y.; Le, K.H. Artificial cognition for early leaf disease detection using vision transformers. In Proceedings of the 2021 International Conference on Advanced Technologies for Communications (ATC), Ho Chi Minh City, Vietnam, 14–16 October 2021; IEEE: Piscataway, NJ, USA, 2021; pp. 33–38. [Google Scholar]
- Barman, U.; Sarma, P.; Rahman, M.; Deka, V.; Lahkar, S.; Sharma, V.; Saikia, M.J. Vit-SmartAgri: Vision transformer and smartphone-based plant disease detection for smart agriculture. Agronomy 2024, 14, 327. [Google Scholar] [CrossRef]
- Sharma, S.; Sharma, G.; Menghani, E. Tomato plant disease detection with pretrained CNNs: Review of performance assessment and visual presentation. In Artificial Intelligence in Medicine and Healthcare; CRC Press: Boca Raton, FL, USA, 2025; pp. 67–85. [Google Scholar]
- Maeda-Gutiérrez, V.; Galvan-Tejada, C.E.; Zanella-Calzada, L.A.; Celaya-Padilla, J.M.; Galván-Tejada, J.I.; Gamboa-Rosales, H.; Luna-Garcia, H.; Magallanes-Quintanar, R.; Guerrero Mendez, C.A.; Olvera-Olvera, C.A. Comparison of convolutional neural network architectures for classification of tomato plant diseases. Appl. Sci. 2020, 10, 1245. [Google Scholar] [CrossRef]
- Zhang, K.; Wu, Q.; Liu, A.; Meng, X. Can deep learning identify tomato leaf disease? Adv. Multimed. 2018, 2018, 6710865. [Google Scholar] [CrossRef]
- Atila, Ü.; Uçar, M.; Akyol, K.; Uçar, E. Plant leaf disease classification using EfficientNet deep learning model. Ecol. Inform. 2021, 61, 101182. [Google Scholar] [CrossRef]
- Yulita, I.N.; Amri, N.A.; Hidayat, A. Mobile application for tomato plant leaf disease detection using a dense convolutional network architecture. Computation 2023, 11, 20. [Google Scholar] [CrossRef]
- Dosovitskiy, A.; Beyer, L.; Kolesnikov, A.; Weissenborn, D.; Zhai, X.; Unterthiner, T.; Dehghani, M.; Minderer, M.; Heigold, G.; Gelly, S.; et al. An Image is Worth 16x16 Words: Transformers for Image Recognition at Scale. arXiv 2021, arXiv:2010.11929. [Google Scholar]
- Reedha, R.; Dericquebourg, E.; Canals, R.; Hafiane, A. Transformer neural network for weed and crop classification of high resolution UAV images. Remote Sens. 2022, 14, 592. [Google Scholar] [CrossRef]
- Tabbakh, A.; Barpanda, S.S. A deep features extraction model based on the transfer learning model and vision transformer “tlmvit” for plant disease classification. IEEE Access 2023, 11, 45377–45392. [Google Scholar] [CrossRef]
- Thakur, P.S.; Khanna, P.; Sheorey, T.; Ojha, A. Explainable vision transformer enabled convolutional neural network for plant disease identification: PlantXViT. arXiv 2022, arXiv:2207.07919. [Google Scholar]
- Han, Z.; Sun, J. Tomato leaf diseases recognition model based on improved MobileVit. In Proceedings of the 2024 IEEE 4th International Conference on Information Technology, Big Data and Artificial Intelligence (ICIBA), Chongqing, China, 6–8 December 2024; IEEE: Piscataway, NJ, USA, 2024; Volume 4, pp. 1205–1209. [Google Scholar]
- Tonmoy, M.R.; Hossain, M.M.; Dey, N.; Mridha, M. MobilePlantViT: A Mobile-friendly Hybrid ViT for Generalized Plant Disease Image Classification. arXiv 2025, arXiv:2503.16628. [Google Scholar]
- Mahabub, S.; Jahan, I.; Hasan, M.N.; Islam, M.S.; Akter, L.; Musfiqur, M.; Foysal, R.; Onik, M.K.R. Efficient detection of tomato leaf diseases using optimized Compact Convolutional Transformers (CCT) Model. Magna Sci. Adv. Res. Rev. 2024, 12, 39–53. [Google Scholar] [CrossRef]
- Liu, Z.; Lin, Y.; Cao, Y.; Hu, H.; Wei, Y.; Zhang, Z.; Lin, S.; Guo, B. Swin transformer: Hierarchical vision transformer using shifted windows. In Proceedings of the IEEE/CVF International Conference on Computer Vision, Montreal, QC, Canada, 10–17 October 2021; pp. 10012–10022. [Google Scholar]
- Singh, A.K.; Rao, A.; Chattopadhyay, P.; Maurya, R.; Singh, L. Effective plant disease diagnosis using Vision Transformer trained with leafy-generative adversarial network-generated images. Expert Syst. Appl. 2024, 254, 124387. [Google Scholar] [CrossRef]
- Huang, X.; Xu, D.; Chen, Y.; Zhang, Q.; Feng, P.; Ma, Y.; Dong, Q.; Yu, F. EConv-ViT: A strongly generalized apple leaf disease classification model based on the fusion of ConvNeXt and Transformer. Inf. Process. Agric. 2025, in press. [CrossRef]
- Liu, X.; Peng, H.; Zheng, N.; Yang, Y.; Hu, H.; Yuan, Y. Efficientvit: Memory efficient vision transformer with cascaded group attention. In Proceedings of the IEEE/CVF Conference on Computer Vision and Pattern Recognition, Vancouver, BC, Canada, 17–24 June 2023; pp. 14420–14430. [Google Scholar]
- Saleem, M.H.; Potgieter, J.; Arif, K.M. Tomato plant disease detection using transfer learning with C-GAN synthetic images. Comput. Electron. Agric. 2021, 187, 106279. [Google Scholar] [CrossRef]
- Haider, F.A.; Abbas, A.; Mehmood, Z. Tomato Leaf Diseases Detection Using Deep Learning Technique; IntechOpen: London, UK, 2021. [Google Scholar] [CrossRef]
- Ashwinkumar, S.; Rajagopal, S.; Aarathy, V.B.S.; Magudeeswaran, P. Detecting tomato leaf diseases by image processing through deep convolutional neural networks. Artif. Intell. Agric. 2023, 9, 100301. [Google Scholar] [CrossRef]
- Rahim, M.M.A.; Islam, M.T.; Islam, M.S. A robust deep learning approach for tomato plant leaf disease localization and classification. Sci. Rep. 2022, 12, 21498. [Google Scholar] [CrossRef]
- Ruan, B.K.; Shuai, H.H.; Cheng, W.H. Vision Transformers: State of the Art and Research Challenges. arXiv 2022. [Google Scholar] [CrossRef]


| Hyperparameter | ViT | Swin | EfficientViT | MobileViT | ConvNeXt | CCT |
|---|---|---|---|---|---|---|
| Number of Epochs | 100 | 100 | 100 | 100 | 100 | 100 |
| Batch Size | 32 | 32 | 16 | 32 | 32 | 32 |
| Learning Rate | ||||||
| Early Stopping Patience | 10 | 10 | 10 | 10 | 10 | 10 |
| Early Stopping Delta | 0 | 0 | 0 | 0 | 0 | 0 |
| Optimizer | AdamW | AdamW | AdamW | AdamW | AdamW | AdamW |
| Loss Function | CE | CE | CE | CE | CE | LS-CE |
| Image Size | 224 × 224 | 224 × 224 | 224 × 224 | 224 × 224 | 224 × 224 | 224 × 224 |
| Mixed Precision | No | No | Yes | Yes | No | Yes |
| Model | Year | Citation | Dataset | Accuracy |
|---|---|---|---|---|
| AlexNet | 2020 | [32] | PlantVillage | 98.93% |
| GoogleNet | 2020 | [32] | PlantVillage | 99.39% |
| Inception V3 | 2020 | [32] | PlantVillage | 98.65% |
| ResNet 18 | 2020 | [32] | PlantVillage | 99.06% |
| ResNet 50 | 2020 | [32] | PlantVillage | 99.15% |
| DenseNet121 | 2021 | [47] | PlantVillage | 99.51% (5-class) |
| DenseNet201 | 2021 | [48] | PlantVillage | 98.05% (10-class) |
| VGG-19 | 2023 | [49] | Not standard | 98.27% |
| MobileNet-V2 | 2023 | [49] | Not standard | 94.98% |
| ResNet-50 | 2023 | [49] | Not standard | 99.53% |
| Faster-RCNN (ResNet-34) | 2022 | [50] | PlantVillage | 99.97%, mAP 0.981 |
| ViT | 2024 | [30] | PlantVillage | 90.99% |
| Model | Epoch | Loss | Accuracy | Precision | Recall | F1-Score |
|---|---|---|---|---|---|---|
| ViT Models | ||||||
| ViT-Tiny | 17 | 0.05949 | 0.986710 | 0.986810 | 0.986710 | 0.986710 |
| ViT-Small | 14 | 0.04904 | 0.98986 | 0.98986 | 0.98986 | 0.98986 |
| ViT-Base | 11 | 0.05828 | 0.98838 | 0.98848 | 0.98838 | 0.98838 |
| MobileViT Models | ||||||
| MobileViT-XXSmall | 55 | 0.059710 | 0.985511 | 0.985711 | 0.985511 | 0.985511 |
| MobileViT-XSmall | 38 | 0.066512 | 0.985511 | 0.985512 | 0.985511 | 0.985511 |
| MobileViT-Small | 15 | 0.066111 | 0.981314 | 0.981314 | 0.981314 | 0.981314 |
| EfficientViT Models | ||||||
| EfficientViT-M5 | 48 | 0.05266 | 0.98838 | 0.98839 | 0.98838 | 0.98838 |
| EfficientViT-B0 | 19 | 0.04271 | 0.99004 | 0.99004 | 0.98995 | 0.98995 |
| EfficientViT-B2 | 44 | 0.083414 | 0.977916 | 0.977916 | 0.977916 | 0.977816 |
| Swin Transformer Models | ||||||
| Swin-Tiny | 13 | 0.05155 | 0.98857 | 0.98857 | 0.98857 | 0.98857 |
| Swin-Small | 14 | 0.069713 | 0.99041 | 0.99042 | 0.99041 | 0.99041 |
| Swin-Base | 8 | 0.04832 | 0.99033 | 0.99033 | 0.99033 | 0.99033 |
| ConvNeXt Models | ||||||
| ConvNeXt-Tiny | 5 | 0.04853 | 0.98995 | 0.99004 | 0.99004 | 0.99004 |
| ConvNeXt-Small | 10 | 0.05427 | 0.99041 | 0.99051 | 0.99041 | 0.99041 |
| CCT Models | ||||||
| CCT-7×7×2×224 | 31 | 0.159016 | 0.979115 | 0.979115 | 0.979115 | 0.979015 |
| CCT-14×7×2×224 | 21 | 0.143415 | 0.983513 | 0.983713 | 0.983513 | 0.983513 |
| Model | Params (M) | FLOPs (B) | Average Inference Time (ms) |
|---|---|---|---|
| ViT-Tiny | 5.72 | 0.91 | 8.575 |
| ViT-Small | 22.05 | 3.22 | 10.469 |
| ViT-Base | 86.57 | 12.02 | 25.566 |
| MobileViT-XXS | 1.27 | 0.25 | 3.965 |
| MobileViT-XS | 2.32 | 0.66 | 4.734 |
| MobileViT-S | 5.58 | 1.25 | 5.840 |
| EfficientViT-B0 | 3.41 | 0.10 | 5.126 |
| EfficientViT-M5 | 12.47 | 0.52 | 9.603 |
| EfficientViT-B2 | 24.33 | 1.57 | 16.337 |
| Swin-Tiny | 28.29 | 4.38 | 16.919 |
| Swin-Small | 49.61 | 8.56 | 19.583 |
| Swin-Base | 87.77 | 15.19 | 48.148 |
| ConvNext-Tiny | 28.59 | 4.48 | 18.604 |
| ConvNext-Small | 50.22 | 8.72 | 20.408 |
Disclaimer/Publisher’s Note: The statements, opinions and data contained in all publications are solely those of the individual author(s) and contributor(s) and not of MDPI and/or the editor(s). MDPI and/or the editor(s) disclaim responsibility for any injury to people or property resulting from any ideas, methods, instructions or products referred to in the content. |
© 2025 by the authors. Licensee MDPI, Basel, Switzerland. This article is an open access article distributed under the terms and conditions of the Creative Commons Attribution (CC BY) license (https://creativecommons.org/licenses/by/4.0/).
Share and Cite
Nishankar, S.; Pavindran, V.; Mithuran, T.; Nimishan, S.; Thuseethan, S.; Sebastian, Y. ViT-RoT: Vision Transformer-Based Robust Framework for Tomato Leaf Disease Recognition. AgriEngineering 2025, 7, 185. https://doi.org/10.3390/agriengineering7060185
Nishankar S, Pavindran V, Mithuran T, Nimishan S, Thuseethan S, Sebastian Y. ViT-RoT: Vision Transformer-Based Robust Framework for Tomato Leaf Disease Recognition. AgriEngineering. 2025; 7(6):185. https://doi.org/10.3390/agriengineering7060185
Chicago/Turabian StyleNishankar, Sathiyamohan, Velalagan Pavindran, Thurairatnam Mithuran, Sivaraj Nimishan, Selvarajah Thuseethan, and Yakub Sebastian. 2025. "ViT-RoT: Vision Transformer-Based Robust Framework for Tomato Leaf Disease Recognition" AgriEngineering 7, no. 6: 185. https://doi.org/10.3390/agriengineering7060185
APA StyleNishankar, S., Pavindran, V., Mithuran, T., Nimishan, S., Thuseethan, S., & Sebastian, Y. (2025). ViT-RoT: Vision Transformer-Based Robust Framework for Tomato Leaf Disease Recognition. AgriEngineering, 7(6), 185. https://doi.org/10.3390/agriengineering7060185