Article

Influence of Paddle Parameters on Particle Conveying and Mixing in an Organic Fertilizer Continuous Conveying Device

College of Mechanical and Electrical Engineering, Henan Agricultural University Zhengzhou 450002, China
*
Authors to whom correspondence should be addressed.
AgriEngineering 2025, 7(6), 184; https://doi.org/10.3390/agriengineering7060184
Submission received: 7 May 2025 / Revised: 5 June 2025 / Accepted: 6 June 2025 / Published: 10 June 2025

Abstract

:
Rural domestic waste slag is often used to prepare organic fertilizer, thereby improving the environment and saving resources. The mixing of the raw materials and fermentation bacteria is key to the preparation of organic fertilizers. In the organic fertilizer continuous conveying device designed in this study, a paddle was substituted for a screw blade for transporting the material to improve the mixing performance. A discrete element method (DEM) model was established for the device. The influences of the paddle rotational speed n and paddle angle α were studied. The simulation results showed that mixing performance was improved when the paddle angle α was 45° and the paddle rotational speed n was 75 rpm, with an RSD of 15.96%. The larger the paddle rotational speed n, the larger the average normal contact force, and the smaller the influence of the paddle angle α. In addition, the paddle rotational speed n and paddle angle α could affect the speed of the particles in all directions in the device. The trajectory of a single particle in the device was analyzed, and it was found that changing the paddle parameters could improve the path length and improve the mixing performance. The research results lay the foundation for designing reasonable paddle parameters.

1. Introduction

As an efficient and economical waste treatment process, composting is widely used at home and abroad [1,2,3]. Xu et al. [4] showed that the current commonly used composting processes include window composting, trough composting, and reactor composting. Liu et al. [5] reported on the drawbacks of traditional composting methods. Window composting and trough composting are more traditional composting technologies; they are simple to operate, and do not need to rely on mechanical devices. However, the composting is slow and typically requires 45–60 days. Experimental research has shown that the composting speed can be accelerated by forced ventilation, regular turning, and other methods. Nevertheless, these methods can lead to overflows of malodorous gases during the composting process, losses of large amounts of ammonia gas, and emissions of large amounts of nitrous oxide. In addition, these traditional composting techniques must occupy a large area of concrete, and their efficiency is significantly influenced by temperature. At around 55 °C, thermophilic bacteria reproduce most rapidly, substantially shortening the decomposition period. However, when temperatures drop below 50 °C, microbial activity diminishes, potentially causing semi-decomposed states and extending the composting process to over six months.
Liu et al. [6] suggested that reactor composting is an emerging composting technology in cooperation with the development of modern industry and shows a high potential application value. Compared with traditional composting technologies, reactor composting technology solves the problems concerning a long composting cycle, low efficiency, high odor emissions, and a large footprint through advanced technologies [7,8,9]. There are many composting reactors currently in use, as discussed by Wang, Ma, Finore, Nanda, Li et al. [10,11,12,13,14]. These mainly include vertical, drum, and stirring types. A drum-type composting device can not only realize automatic turning and aeration of the materials but can also adjust the moisture according to the requirements of the material decomposing. However, the main engine power is large, and the land utilization rate is low.
Gao et al. [15] demonstrated that artificial induction of early mixing in stratified reservoir water significantly altered bacterial community structure (dominated by Actinobacteria and Proteobacteria) and metabolic activity, with water temperature and dissolved oxygen identified as key driving factors. This approach effectively enhanced pollutant degradation efficiency and extended the aerobic cycle of the water body. Biswal et al. [16] investigated the impact of different mixing technologies (hydraulic, mechanical, pneumatic) on sulfate-reducing bacteria (SRB) community composition and granular sludge characteristics in a sulfidogenic anaerobic bioreactor, revealing that pneumatic mixing optimized microbial interactions and sludge structure, resulting in superior performance. A vertical composter uses layered fermentation and a gravity flap for turning materials. It handles large volumes but requires centralized operation. While common in use, these devices lack automation, making effective material turning challenging.
Evaluating the eligibility of a composting reactor requires studying the mixing of the particles in it. When studying the mixing of particles, a discrete element method (DEM) numerical simulation can be used to effectively represent the motions and interactions of particles [17]. Jadidi et al. [18] employed DEM simulations and experimental methods to systematically analyze the mixing performance of non-cohesive particles in a double paddle blender, offering valuable insights into the design and operation of such blenders. The results showed that compared with the V-blender agitator, the tetrapodal blender had better axial and radial mixing efficiency, a shorter mixing time, and a better mixing effect. Ebrahimi et al. [19] used a validated DEM model to analyze the characteristics of particles during the mixing process, such as the relative standard deviation (RSD) value, normal contact force, particle temperature, diffusion coefficient, and Peclet number, and found that the mixing performance of the horizontal stirring paddle mixer was affected by the impeller. The choice of the structure has a very significant influence on the mixing, and the mixing performance can be improved by changing the design of the impeller structure. Pezo et al. [20] used a DEM to simulate the movement and mixing of zeolite and quartz sand particles in horizontal single-pitch screw conveyors with different geometries, and studied the effects of the screw geometry and the particle size on particle movement trajectory, mixing time, and mixing quality. Pezo et al. [21] used a DEM to study the influences of the screw length and different types of screw designs on the performance of screw conveyor-mixer during material conveying. They showed the path trajectory of particle movement through a virtual “tracer” particle, which visually represented the movement of the particle in the device. When mixing particles in closed containers, a DEM can be used to derive the number of different particles at a specified sampling location at any time. Yaraghi et al. [22,23] conducted DEM simulation experiments to compare the mixing effects of particles in a closed container under different rotational speeds, particle loading levels, and particle loading methods. This approach could be used in multiple sets of experiments to determine the best combination for mixing. Chen et al. [24] designed a solid organic fertilizer crushing and strip-applying machine that integrates propeller blades with differential-speed double rollers. Through discrete element simulation analysis and field experiments, they optimized the parameters, significantly improving the crushing performance and uniformity of strip applications for organic fertilizer. Overall, while various mixing devices such as screw conveyors, V-blenders, and closed containers exhibit distinct performance characteristics dependent on their geometric and operational parameters, paddle systems are preferred for their structural simplicity, adaptability to different particle sizes and materials, and the ability to optimize mixing efficiency through adjustments in paddle design, rotational speed, and operational conditions. This versatility underscores their practical value in industrial and experimental applications. Singh et al. [25] reviewed methods integrating Computational Fluid Dynamics (CFD) and Cell Reaction Kinetics (CRK) models, aiming to optimize fluid mixing and cellular metabolic behavior in bioreactors, thereby advancing intelligent manufacturing and process optimization for large-scale biological processes.
In this study, the organic fertilizer continuous conveying device used a paddle instead of a screw blade to transport the materials, aiming to greatly improve the mixing time of the materials. The organic fertilizer utilized in this study was derived from post-treated rural domestic waste muck. It is important to note that not all rural domestic waste is suitable for organic fertilizer production; therefore, only the processed muck was selected for fertilizer preparation. A DEM model simulated particle motion in an organic fertilizer conveyor, validated against physical experiments. Mixing quality was evaluated using RSD. With fixed screw pitch (90 mm), three paddle angles (30°, 45°, 60°) and speeds (50, 75, 100 rpm) were tested. By varying speed and angle, optimal parameters for uniform mixing were identified through RSD comparison.

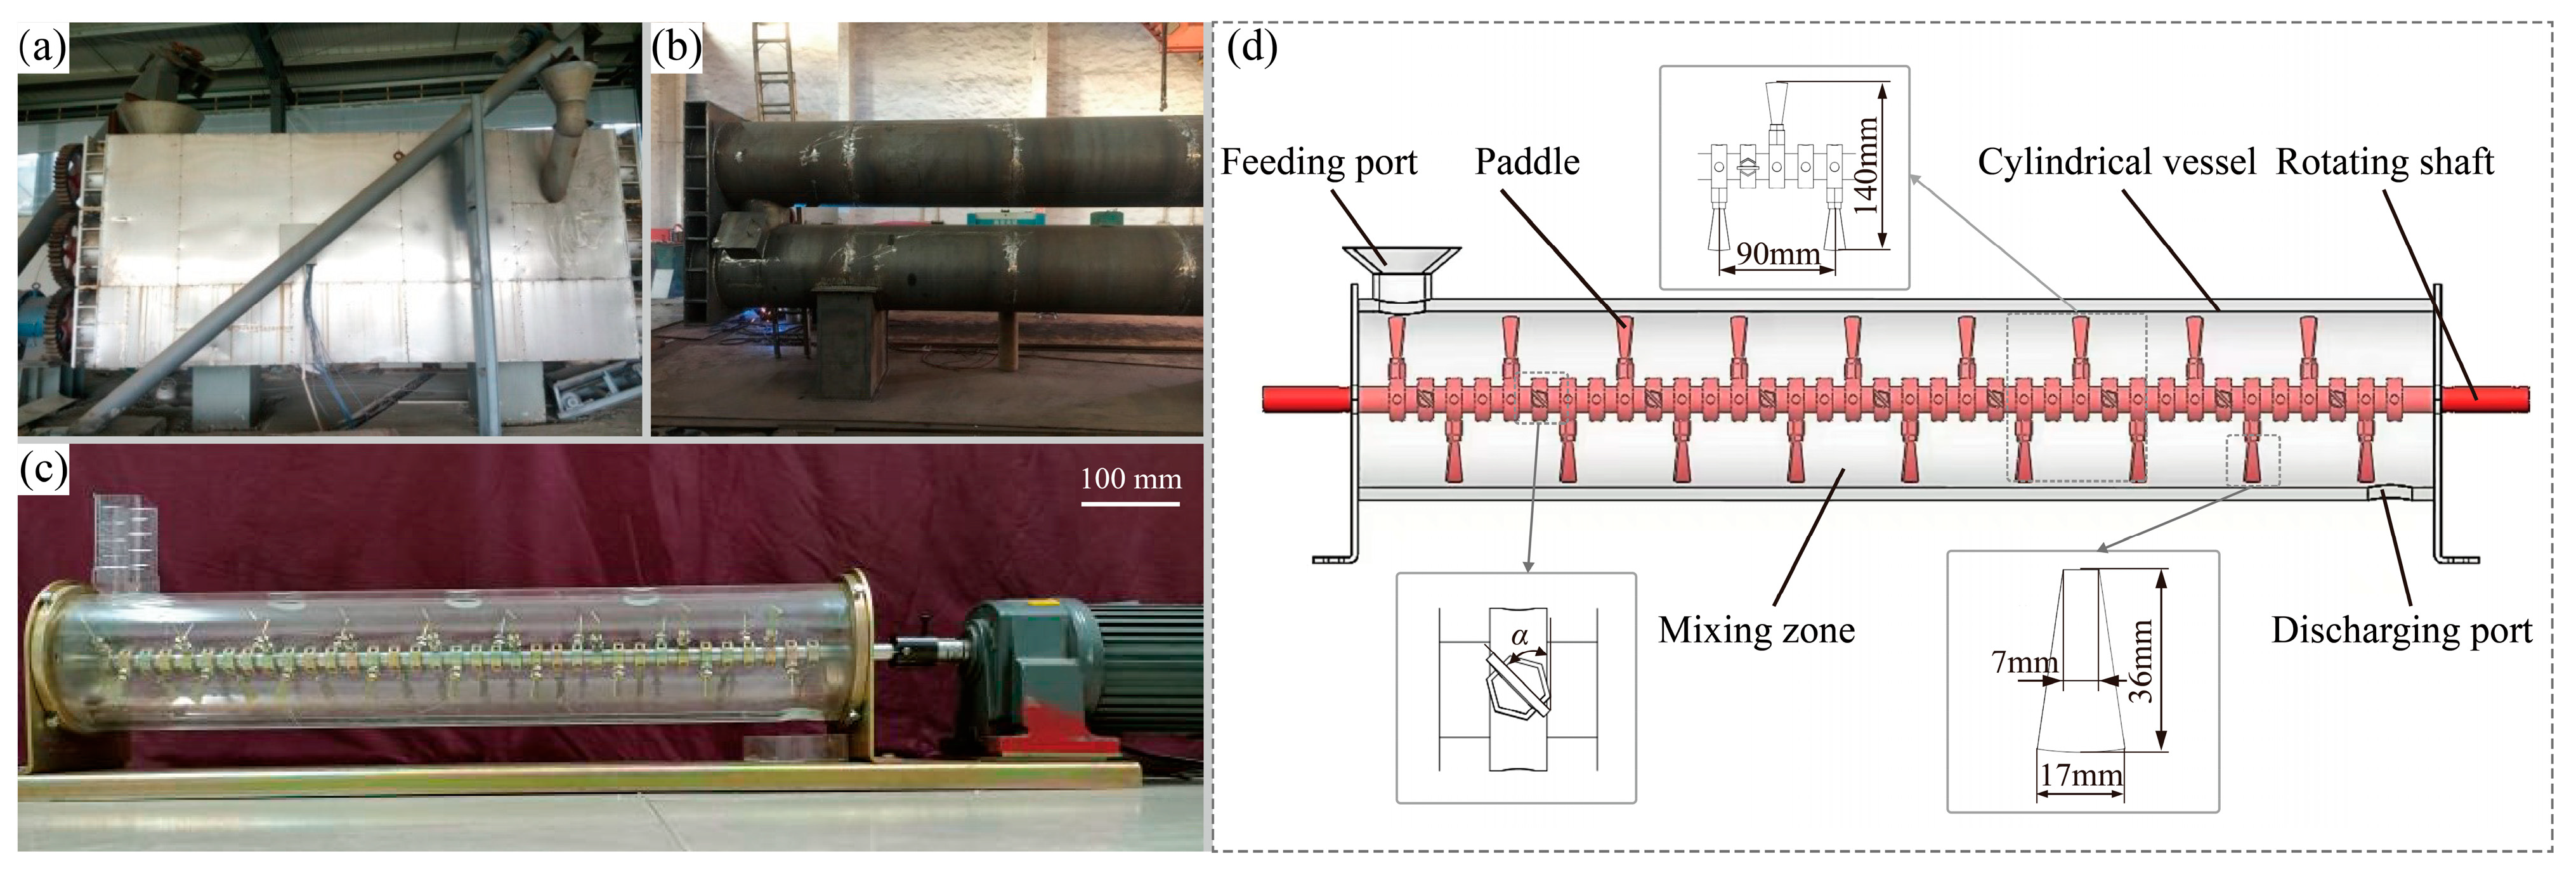
2. Working Principle and Structural Design

2.1. Geometry and Paddle Structure

As shown in Figure 1a–c, the test device consisted of three main components: a cylindrical polyvinyl chloride container with a diameter of 160 mm and length of 850 mm, a rotating shaft equipped with 36 paddles, and a motor (YVFE5 series ultra-efficient variable-frequency adjustable-speed motor by Wuxi Futian Electric Machinery Technology Co., Ltd., China) for providing power. The shaft sleeve with the paddles was installed on the rotating shaft, and the 36 paddles were helically distributed on it with a pitch of 90 mm. Notably, the paddles were attached to the shaft sleeve via bolt connections during bench testing to allow for easy disassembly and adjustment, while in actual production configurations, the paddles are permanently welded to the shaft sleeve. The rotating shaft was aligned along the center of the container. Figure 1d shows the dimensions of the paddles and the arrangement of the paddles in the original state. During the operation, the experiment was conducted at room temperature. The particles of two different colors, with weights and densities similar to those of residue obtained from processed rural household solid waste, entered the device from the left feeding port. They were mixed under the action of the paddle screw, moved to the right, and finally fell out from the discharging port.
The effects of the paddle rotational speed n and paddle angle α on the mixing performance during material conveying were studied. If the paddle rotational speed n was too high, the centrifugal force of the particles would be excessively large and the particles would be thrown outward, seriously weakening the axial movement and hindering transportation. Simultaneously, it would increase power consumption and accelerate the wear of the device. Conversely, if the paddle rotational speed n was excessively low, it would be not sufficient to satisfy the conveying capacity. Therefore, it was necessary to select a reasonable value for the paddle rotational speed n. In general, particle mixing is favorable when the paddle angle α is less than 90°. Therefore, the angular range remained between 30° and 60°, as demonstrated in previous studies [26,27,28]. The different parameter configurations for studying the effects of the paddle rotational speed n and paddle angle α on mixing performance are listed in Table 1.

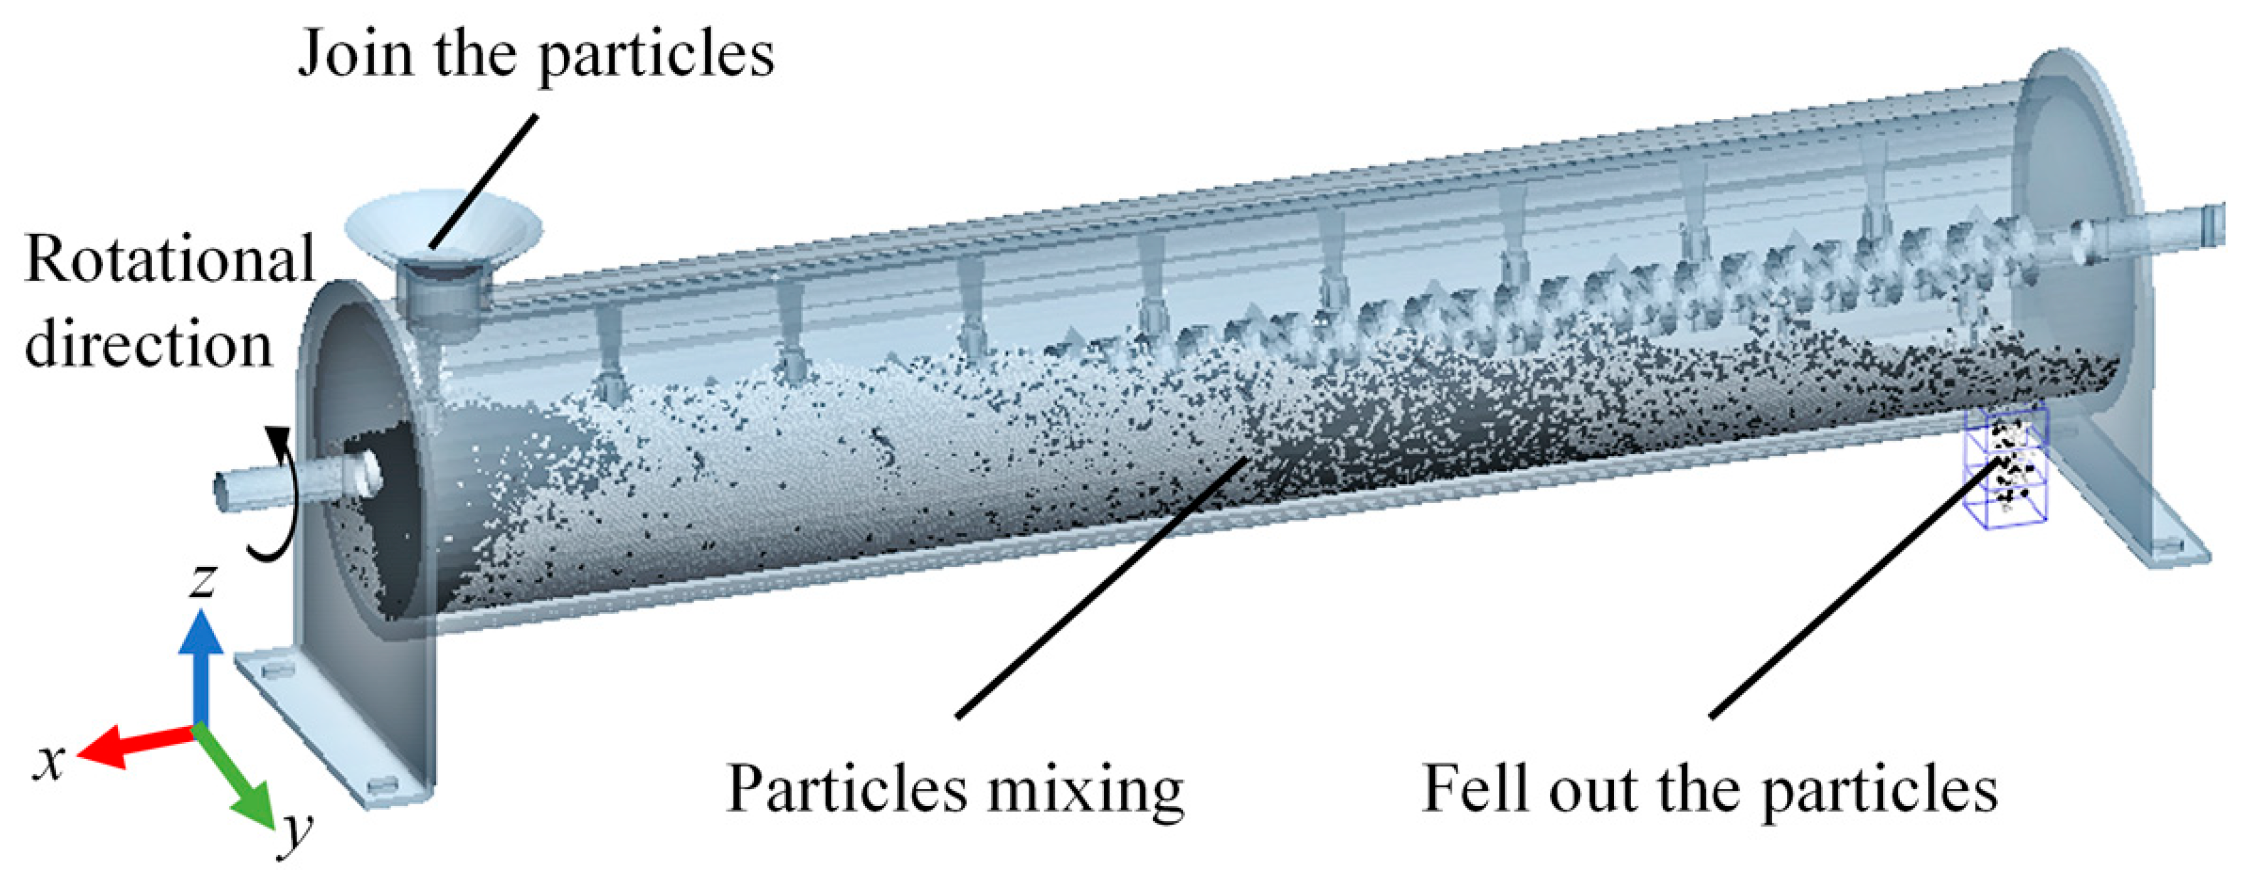
2.2. Discrete Element Method (DEM) Model and Parameters

The discrete element software “EDEM 2.6” was used to simulate the particle mixing process in the device. The contact of the particles with air was ignored and the particle surface was assumed to have no adhesion, this assumption of negligible particle–air interactions is particularly valid for muck obtained after treatment of rural life. The particle properties were considered similar to those of common crop seeds, and the Hertz–Mindlin (no-slip) contact model along with the standard rolling friction model was selected. The Hertz–Mindlin model treats inter-particle contact as a static elastic contact and obtains the relationship between the inter-particle circular contact area and elastic deformation, effectively solving the problem of particle surface contact [29,30,31]. The simulation input parameters are listed in Table 2.

2.3. DEM

As noted above, the EDEM software was used to simulate the material particle mixing process, and the influences of the paddle parameters on particle mixing were analyzed. The paddle structure in the simulation was as described in Section 2.1.
The simulation model of the paddle-type screw continuous conveying organic fertilizer device is shown in Figure 2. The structural model was constructed using SolidWorks 2016 and then imported into EDEM software. The particles were simulated using a single-sphere model. In the simulation, the paddle rotational speeds were set to 50, 75, and 100 rpm, respectively, and two types of particles were selected: dark and light. The particles were generated at a rate of 2500/s and 5000/s and fell from different positions of the feeding port on the left side of the device. The time step in this study was set to 4.77 × 10⁻⁵ s, the data-saving interval was set to 0.01 s, and the simulation cell size was set to three times the particle radius. The material particles entering the device from the feeding port were mixed in the cylinder and discharged through the discharge port.

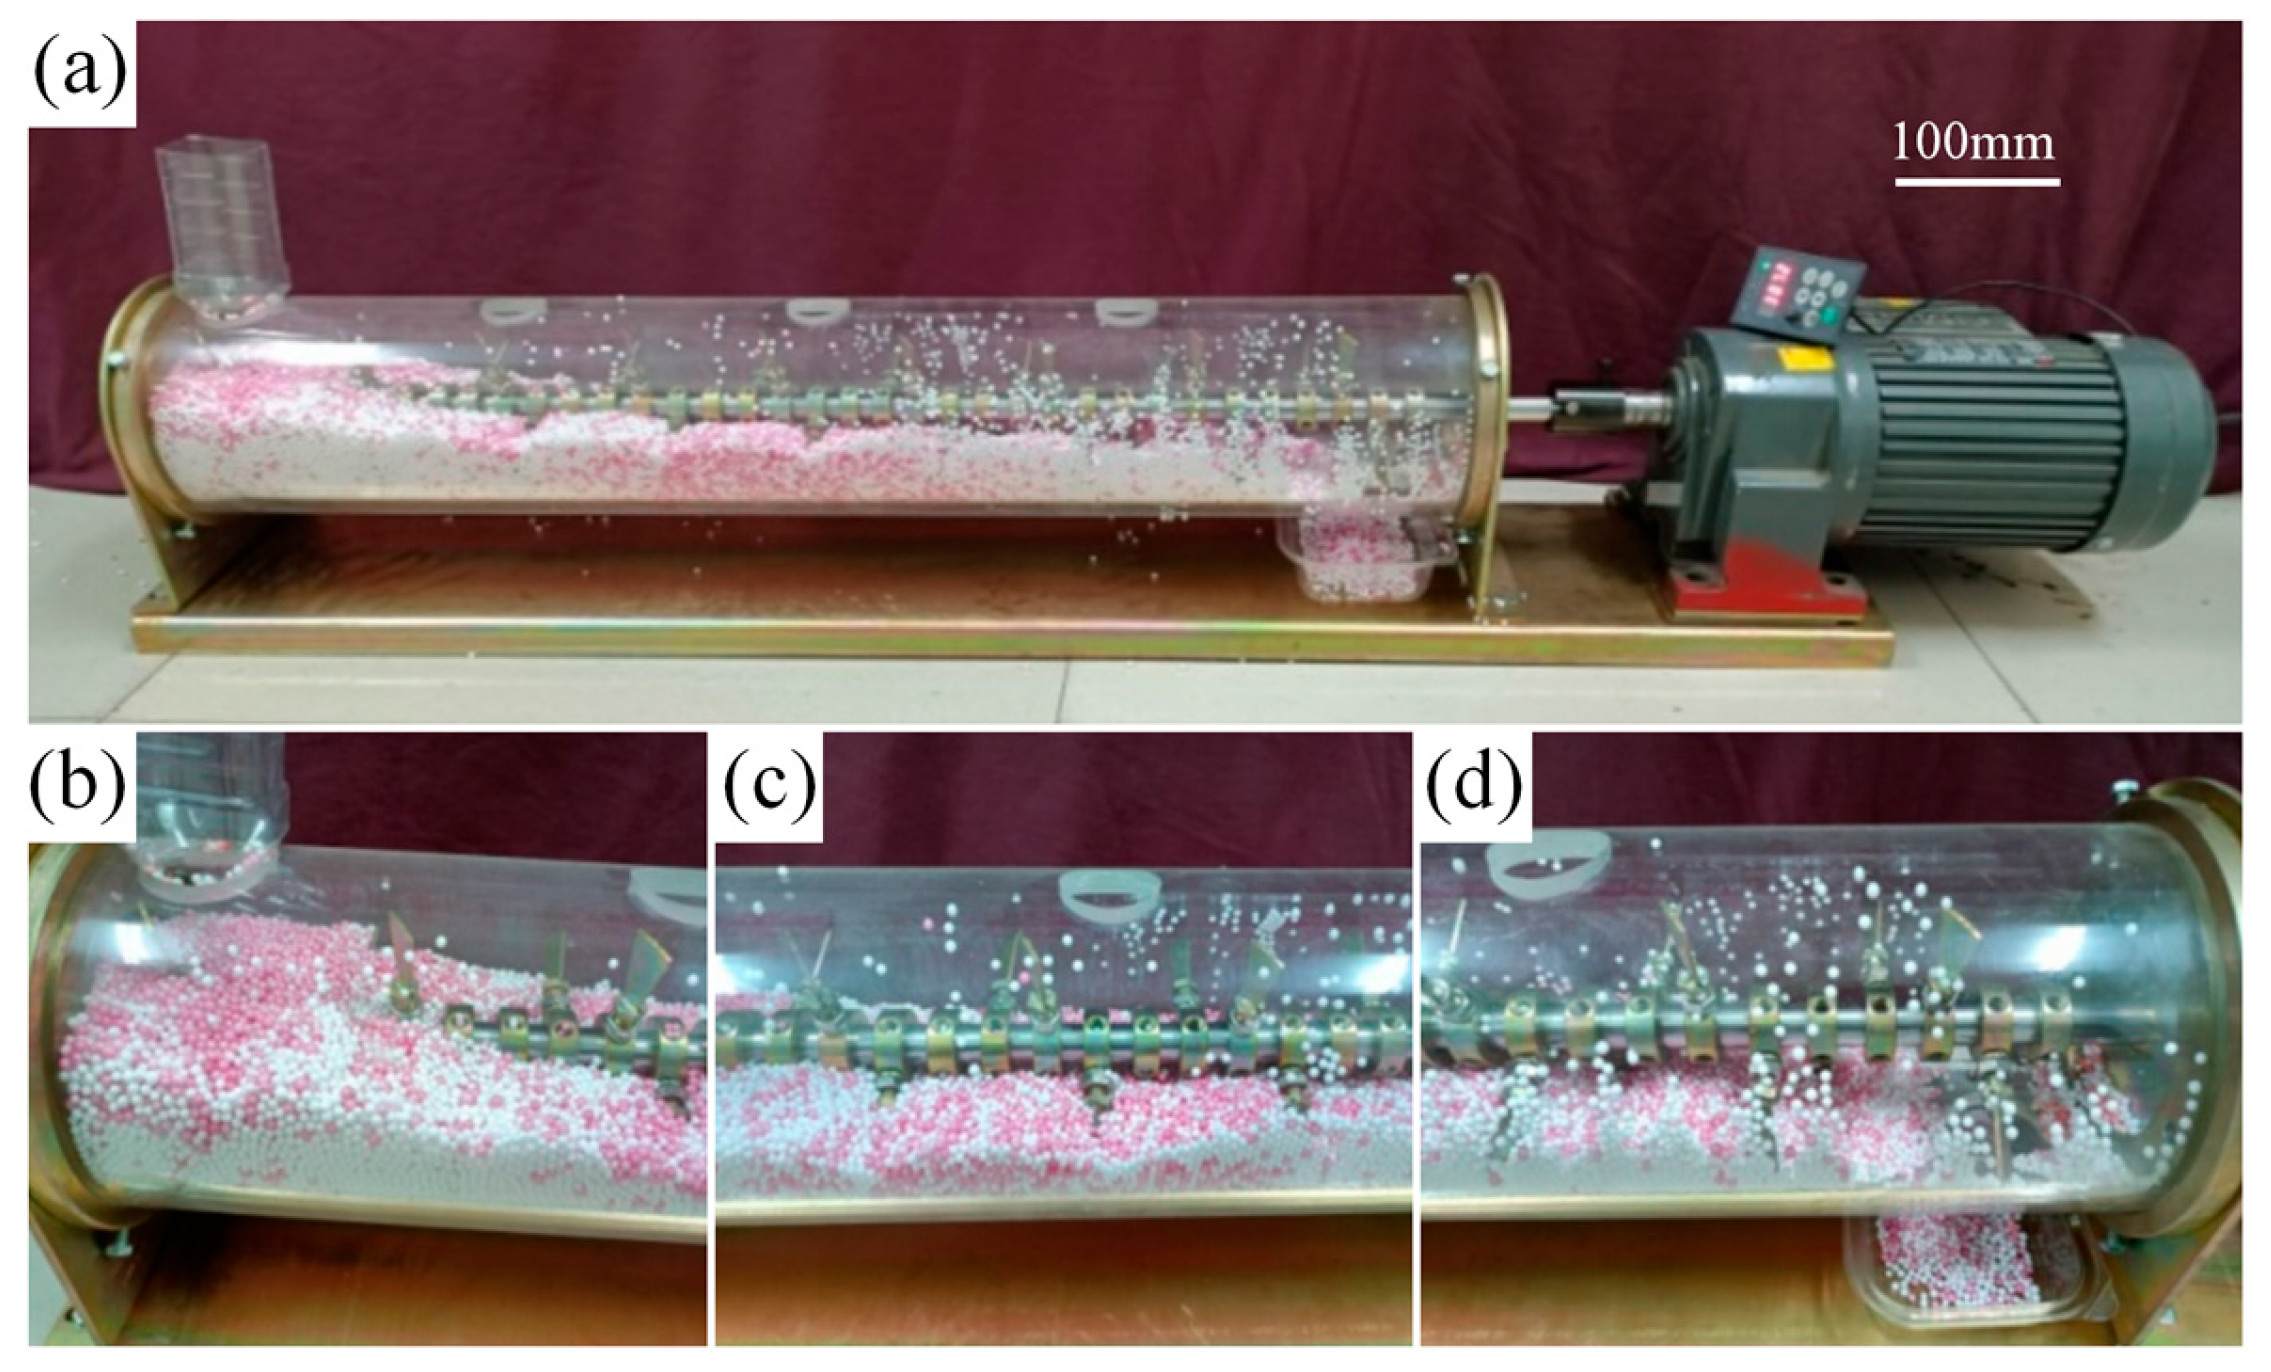
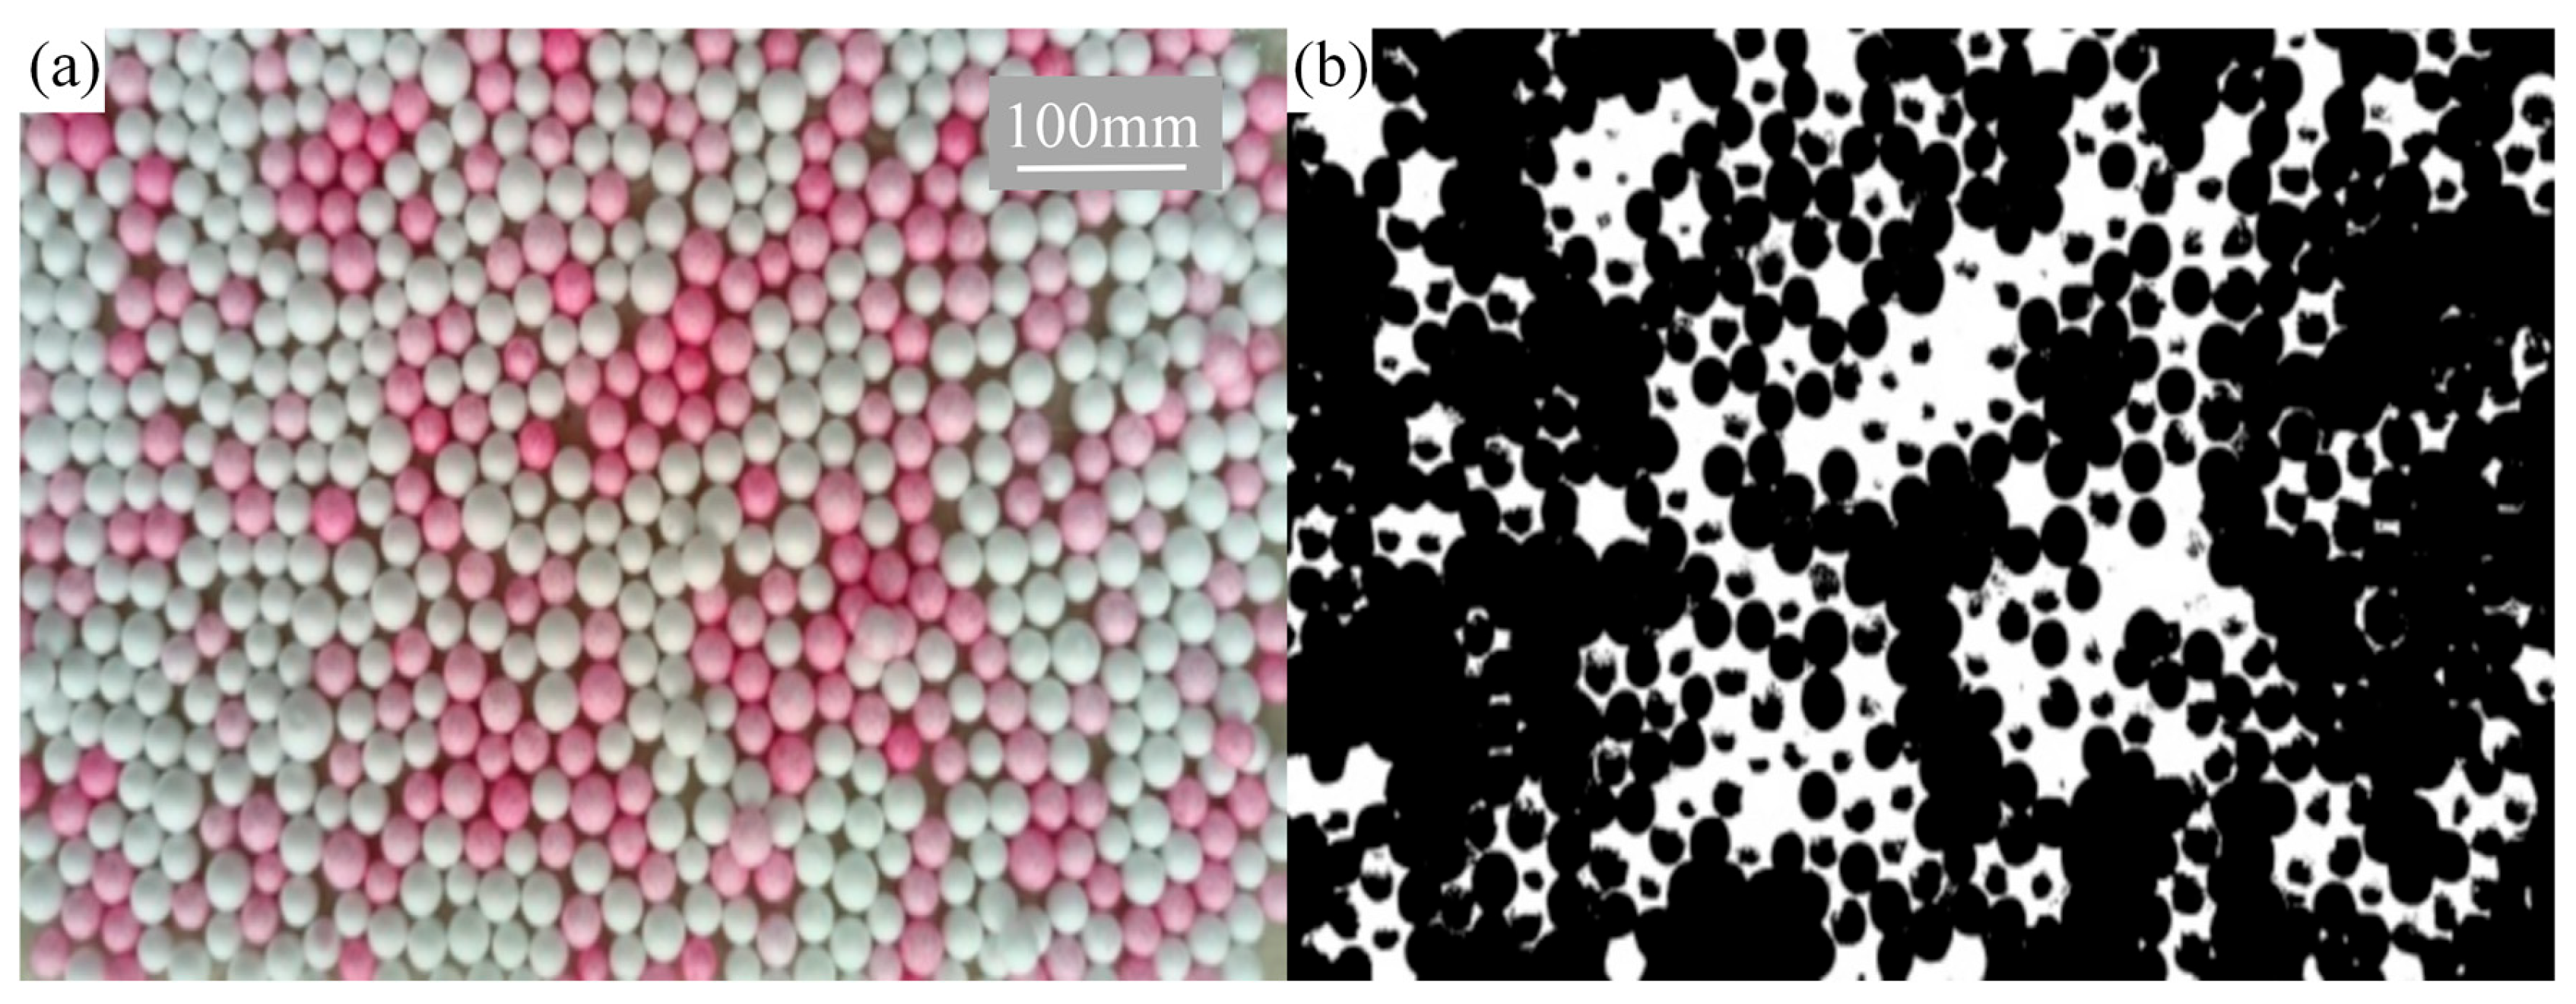
2.4. Validation of the DEM Model

The test device is shown in Figure 3a. During the test, the motor was turned on and the spindle was rotated. Two differently colored granules were prepared and poured into the device after stabilization. A container was placed at the discharge port to capture the falling particles. The paddle configuration parameters were as follows: the paddle angle α was fixed at 30°, and the paddle pitch was 90 mm. The paddle rotational speed was set to three different values: 50, 75, and 100 rpm.
Three tests were performed. As shown in Figure 3b–d, the device was powered by a variable-speed motor. Two differently colored particles entered the device from the feeding port, were mixed in the long barrel of the device, were discharged through the blanking port, and finally fell into the collection container.

2.5. Expression Method of Mixing Uniformity

The same parameters were used in all of the experiments to verify the accuracy of the simulation experiments, and the mixing performance was compared. The mixing performance in this study was evaluated by calculating the RSD value (which is often used to quantify mixing performance). The smaller the RSD value, the better the mixing performance. The calculation method for the RSD is as follows:
R S D = S x ¯ × 100 %
S = 1 N 1 i = 1 n ( x i x ¯ ) 2
In the above, S is the standard deviation of the samples collected from the entire mixing process, x ¯ is the ratio of the total number of dark particles to the total number of particles, that is, the average concentration of dark particles, N is the total number of samples collected, and x i is the concentration of dark particles in a sample. Although the RSD value obtained from the experiment cannot represent the mixing quality of the entire system, the data obtained by the DEM model are similar to those obtained when the experimental and simulation configurations are the same.

3. Results and Discussion

3.1. DEM Model Verification

The RSD value is based on a sampling technique and is sensitive to the chosen grid size. In this study, the RSD values remained unchanged when the mesh size was set to approximately five times the particle diameter. However, in physical experiments, sampling a small-cube mesh is difficult. To compare the simulation results with the physical experimental results and verify the accuracy of the DEM model, the volume of the simulated experimental grid was set to match that of the physical experiments. Therefore, three 30 × 30 × 20 mm cubic grids were set at the blanking port. After the device ran for 30 s, the particles could stably fall out of the blanking port in the range of 30~39 s. The proportion of particles adhering to the fermentation broth in each grid was counted every 1 s, and the RSD value was calculated.
According to the screw conveyor test method, a container was placed at the discharge port of the device to collect the mixed particles, and the sampling was repeated three times. To obtain the concentration of the particles adhering to the fermentation broth in the sample, the sample was distributed horizontally in the container and a camera was used to acquire an image of the sample Figure 4a. The dark particles were separated using image processing technology [26], and the concentration of the particles adhering to the fermentation broth in the sample was calculated according to the proportion of the area occupied by the dark particles Figure 4b. The RSD was calculated, and the average value was estimated three times.
The simulated and tested RSD values are shown in Figure 5. It can be observed that at different speeds, the simulated results are quite close to the physical experimental results. The maximum relative error is 4.02%. The results showed that the simulation model can be used to discuss the effects of different paddle parameters on particle mixing in a continuous conveying device for organic fertilizers.

3.2. Mixing Performance

For a more detailed study, three cubic grids with dimensions of 30 × 30 × 20 mm were set at the blanking port. When the device ran for 30 s, the particles could stably flow out from the blanking port. The RSD value was calculated every 1 s from 30~39 s and averaged. The effects of different paddle configurations on the mixing performance are shown in Figure 6.
As the paddle rotational speed n increases from 50 to 100 rpm, the RSD value decreases, indicating improved mixing performance. When the paddle angle α increases from 30° to 45°, the RSD value gradually decreases; however, when the paddle angle α increases to 60°, the RSD value increases. The mixing performance is the highest when the paddle angle α is 45°. The test results show that when the paddle angle α is 30°, the RSD value decreases with increasing paddle rotational speed n, and the decreasing trend reaches a maximum when the speed is close to 100 rpm. When the paddle angle α is 45°, the RSD decreases with an increase in the paddle rotational speed n. It decreases sharply before 75 rpm, and after 75 rpm until 100 rpm; thereafter, although it still decreases, the relative change is not large. When the paddle angle α is 60°, the RSD value decreases with an increase in the paddle rotational speed n, and the changing trend slows from 75 rpm onward. Therefore, the selection of the appropriate paddle parameters is key to improving the mixing performance of the device.

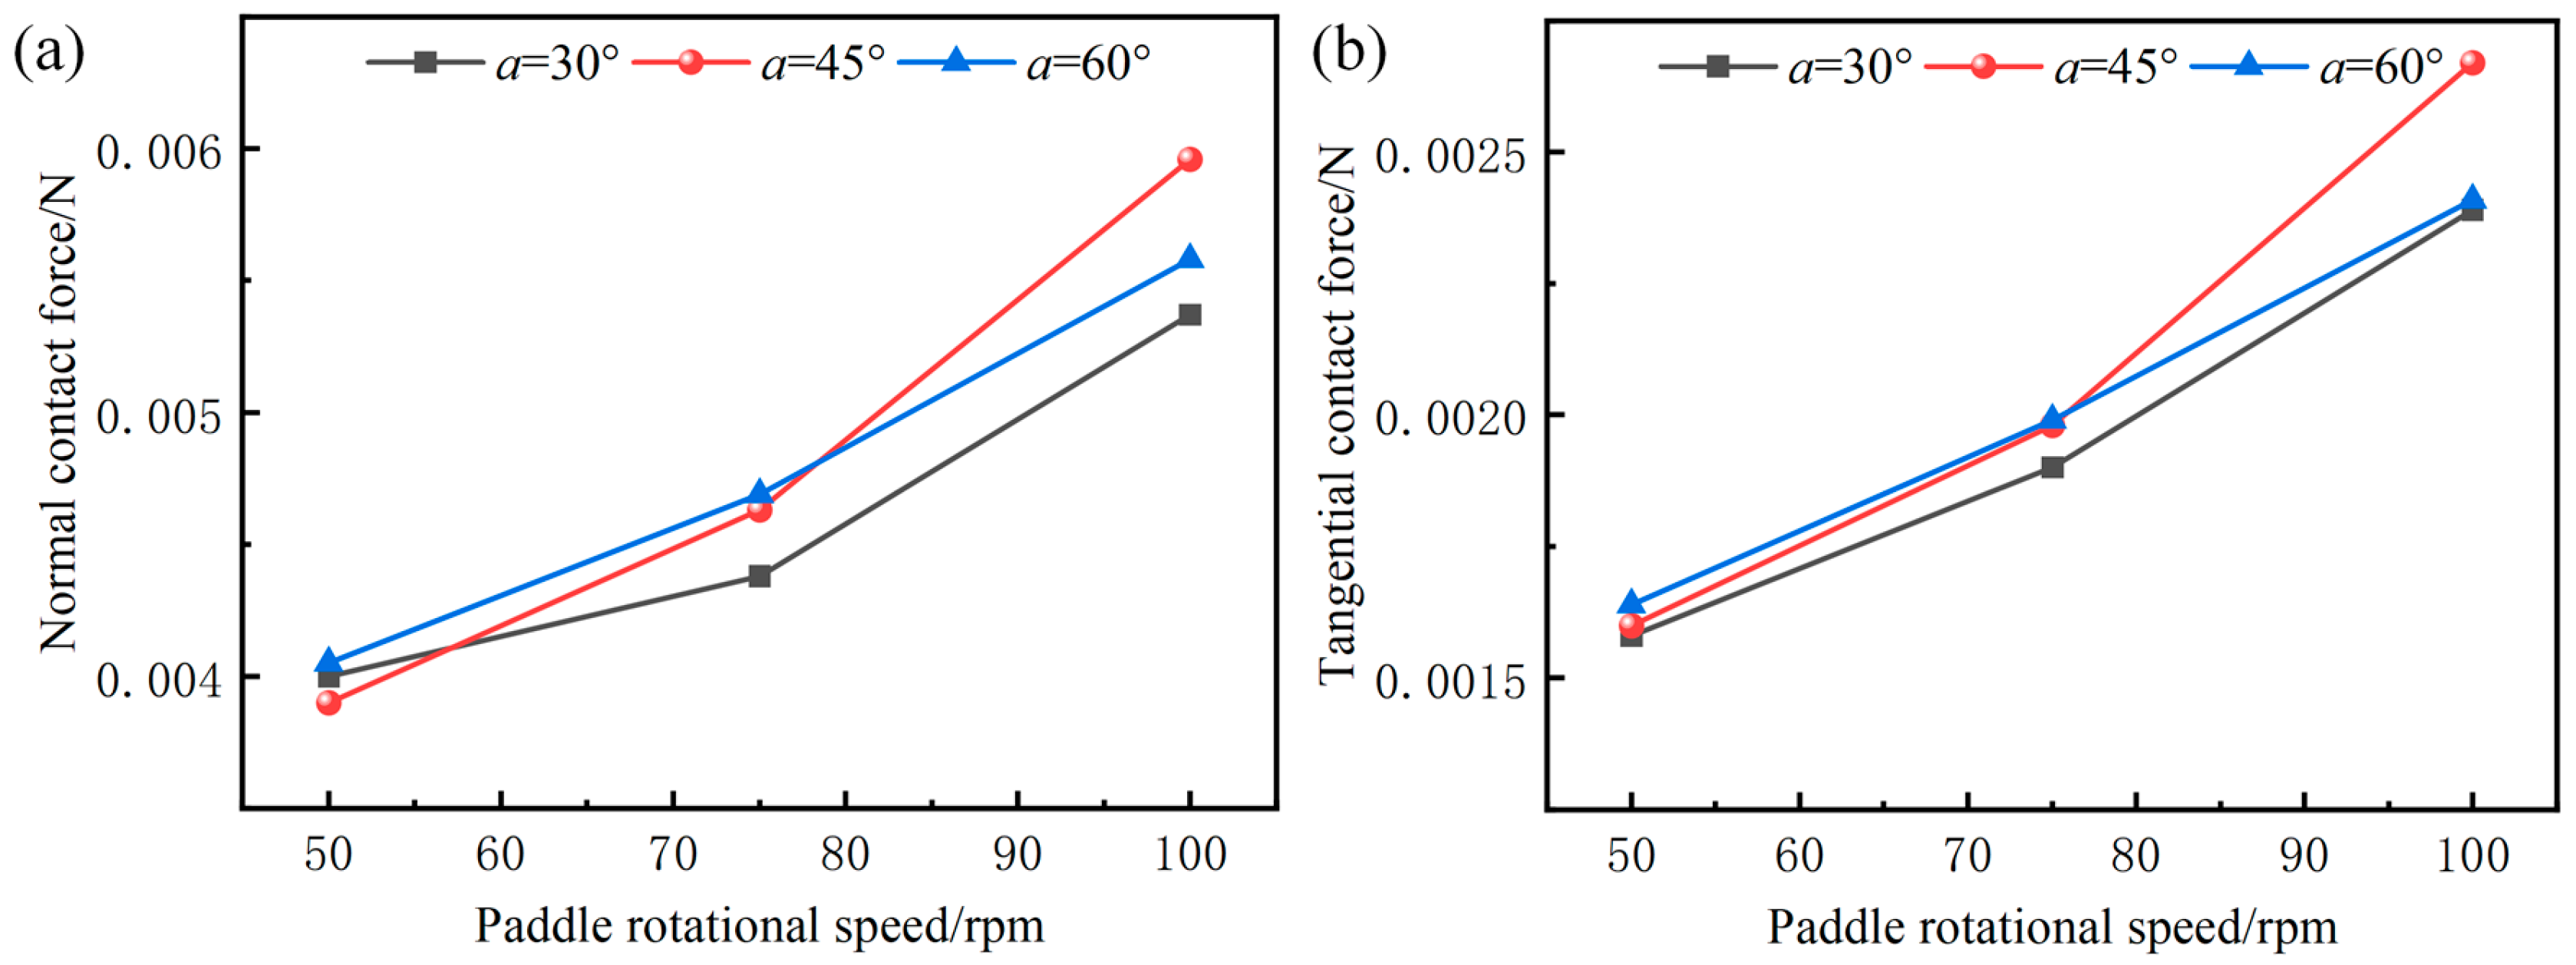
3.3. Average Contact Forces

This section analyzes the influences of the paddle on the average contact force of the particles under different paddle conditions. For all particles in the entire mixing area, the average contact force between the paddle and particle was averaged between 30~39 s, and the relevant data are shown in Figure 7.
The different paddle parameters have a greater impact on the average normal contact force between the paddle and particles, but less impact on the average tangential contact force. It can be seen from the figure that an increase in the paddle rotational speed n leads to an increase in the average normal contact force and average tangential contact force of the paddle to the particles. The larger the paddle rotational speed n, the greater the impact force and power consumption of the device. The paddle angle α has a minimal effect on the paddle-particle average normal contact force. When the paddle angle α is 45° or 60°, the influence of the paddle rotational speed n is greater than when the paddle angle α is 30°. In particular, when the paddle angle α is 45°, with an increase in the paddle rotational speed n, the average normal contact force between the paddle and particle exhibits a continuously increasing trend. The analysis results show that the paddle parameters significantly influence the average contact force. Therefore, choosing a moderate paddle rotational speed can reduce power consumption.

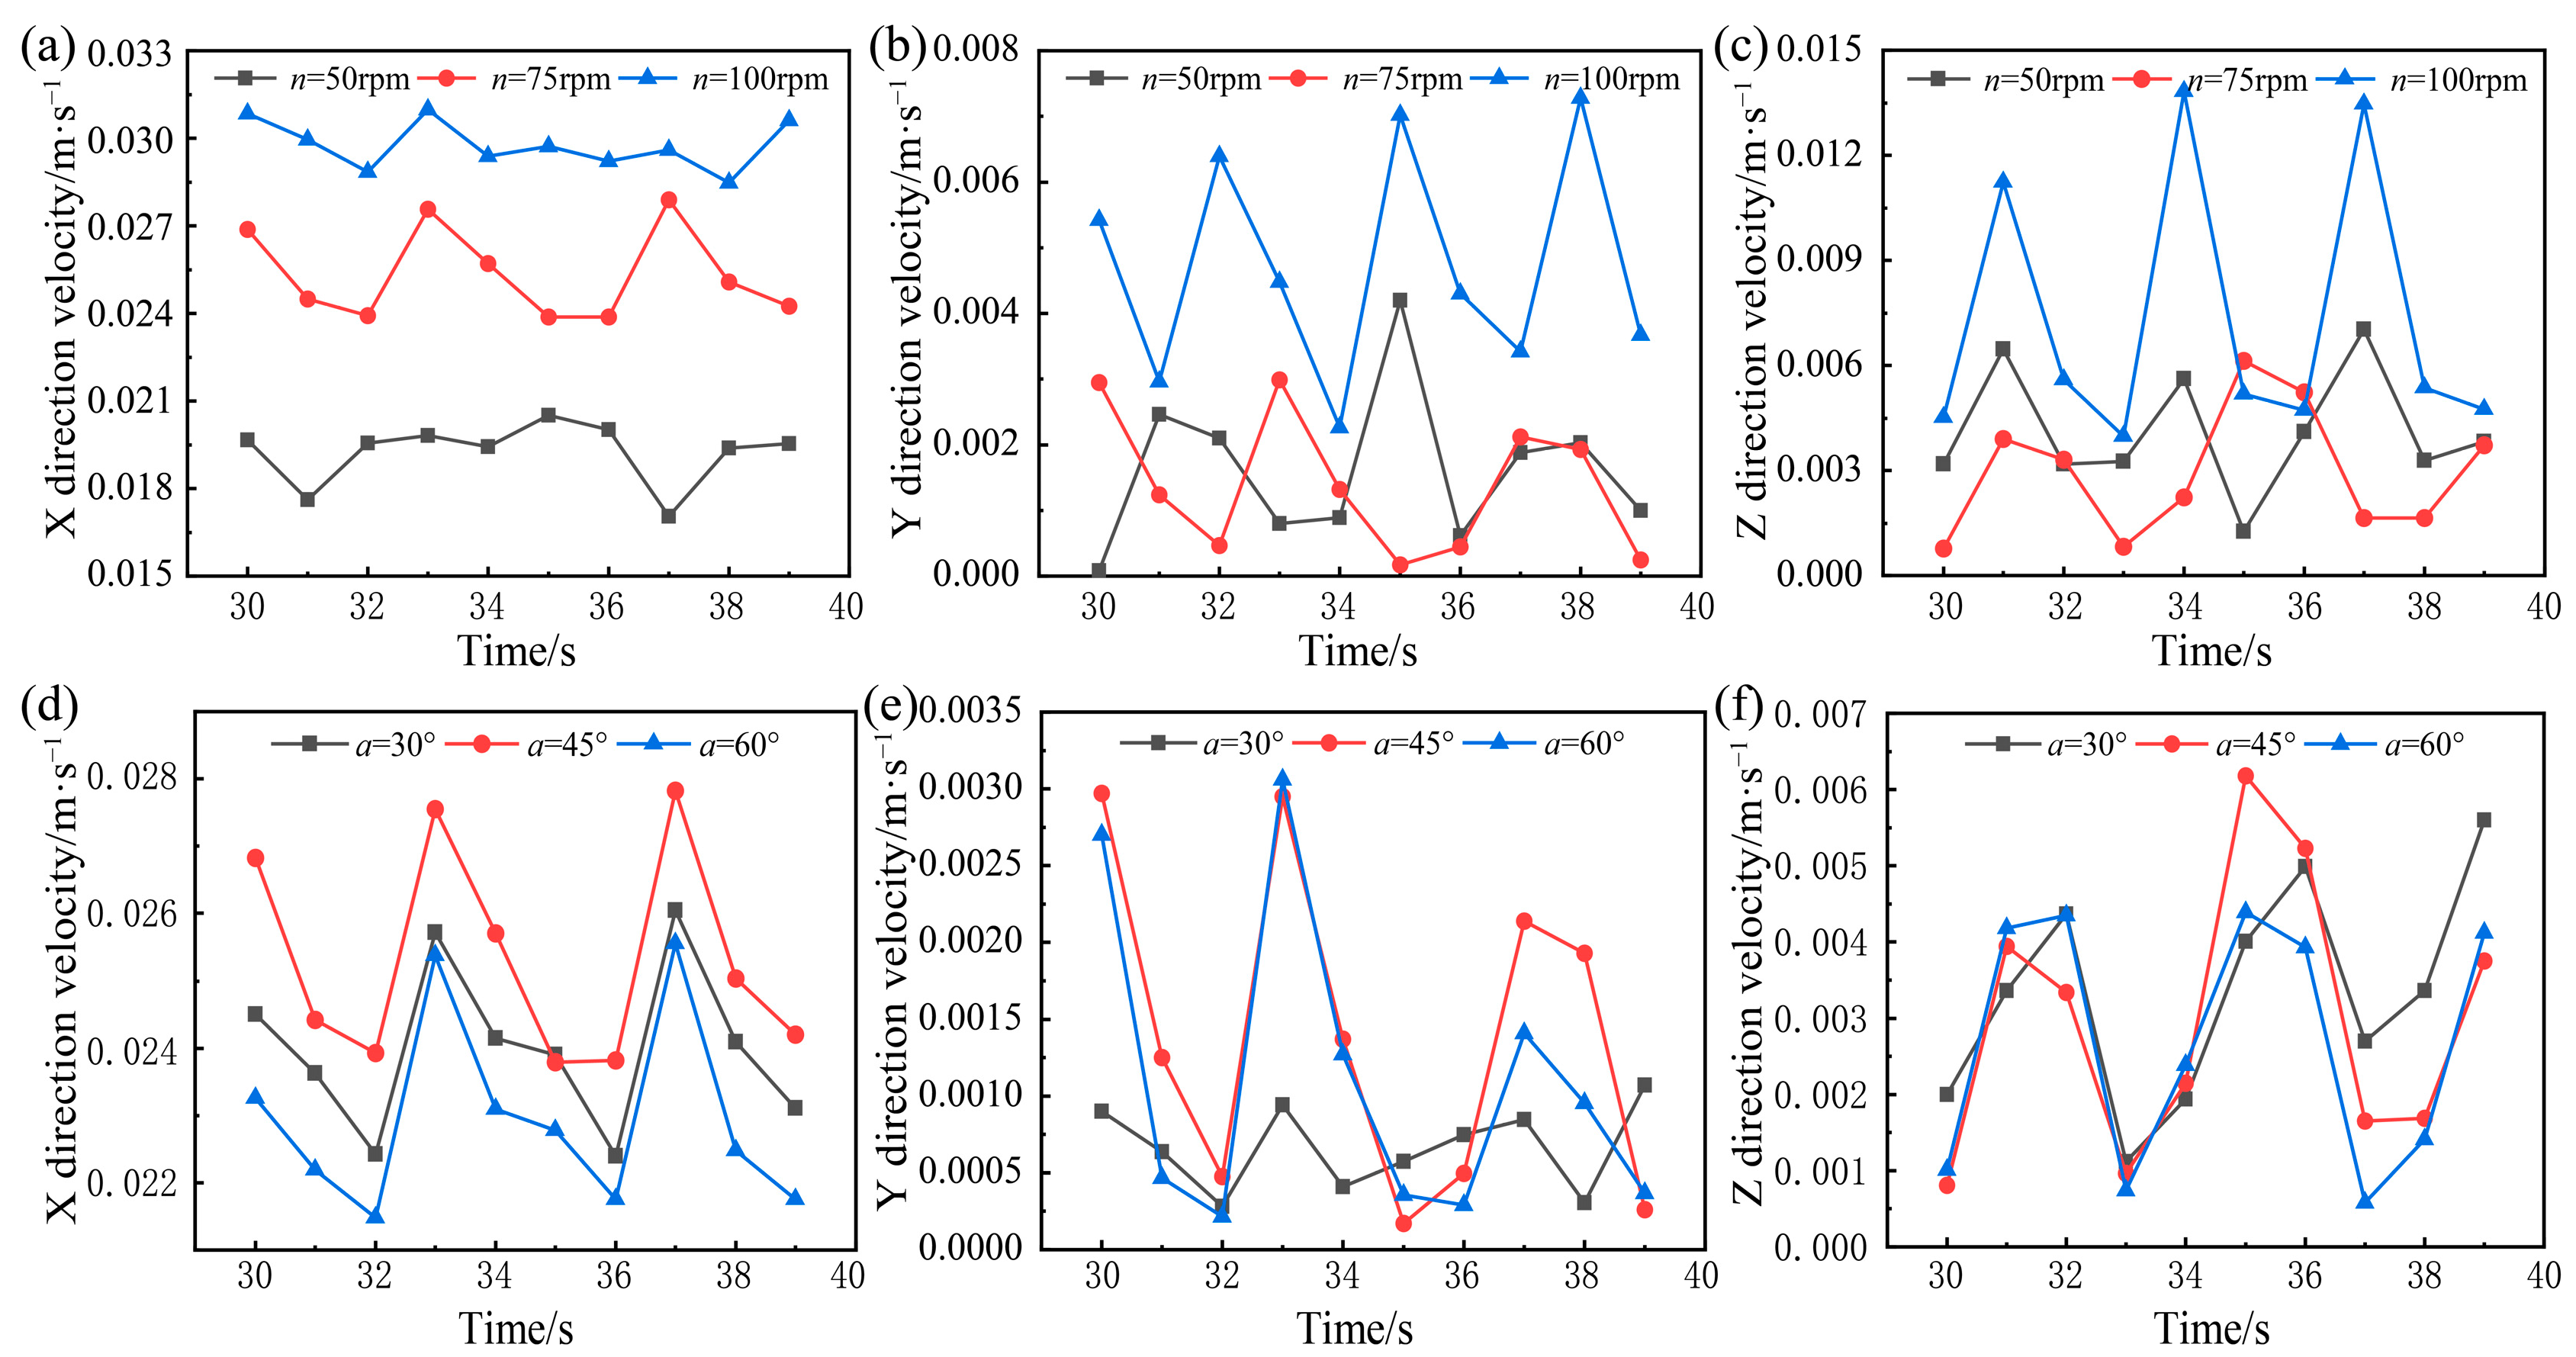
3.4. Particle Velocity

This section analyzes the effect of the paddle structure on the particle velocity. The average velocities of all particles in the X, Y, and Z directions of the entire mixing area were calculated, and their average velocities in the simulation time from 30~39 s were calculated, compared, and analyzed. The results are shown in Figure 8.
The particles move axially in the X direction, and the movement direction is basically unchanged. In contrast, circumferential movement is performed in the Y and Z directions, and the movement direction often changes, so the absolute value is taken. Figure 8a–c show that when the paddle angle is constant, the average velocity of the particles in all directions increases when the particles move in the device. Simultaneously, the average velocity change rate in the circumferential direction increases. Figure 8d–f show that when the rotational speed of the paddle is the same, an increase in the paddle angle α causes the average velocity of the particles in all directions to first increase and then decrease as the particles move in the device. Simultaneously, it can be observed that the influence of the paddle angle α on the average speed is not as obvious as that of the paddle rotational speed n. Combined with the comparison of the RSD values with different paddle parameters, one of the reasons that the paddle parameters improve the mixing performance is owing to this increase in the average particle velocity. Detailed data can be found in the Supplementary Materials.

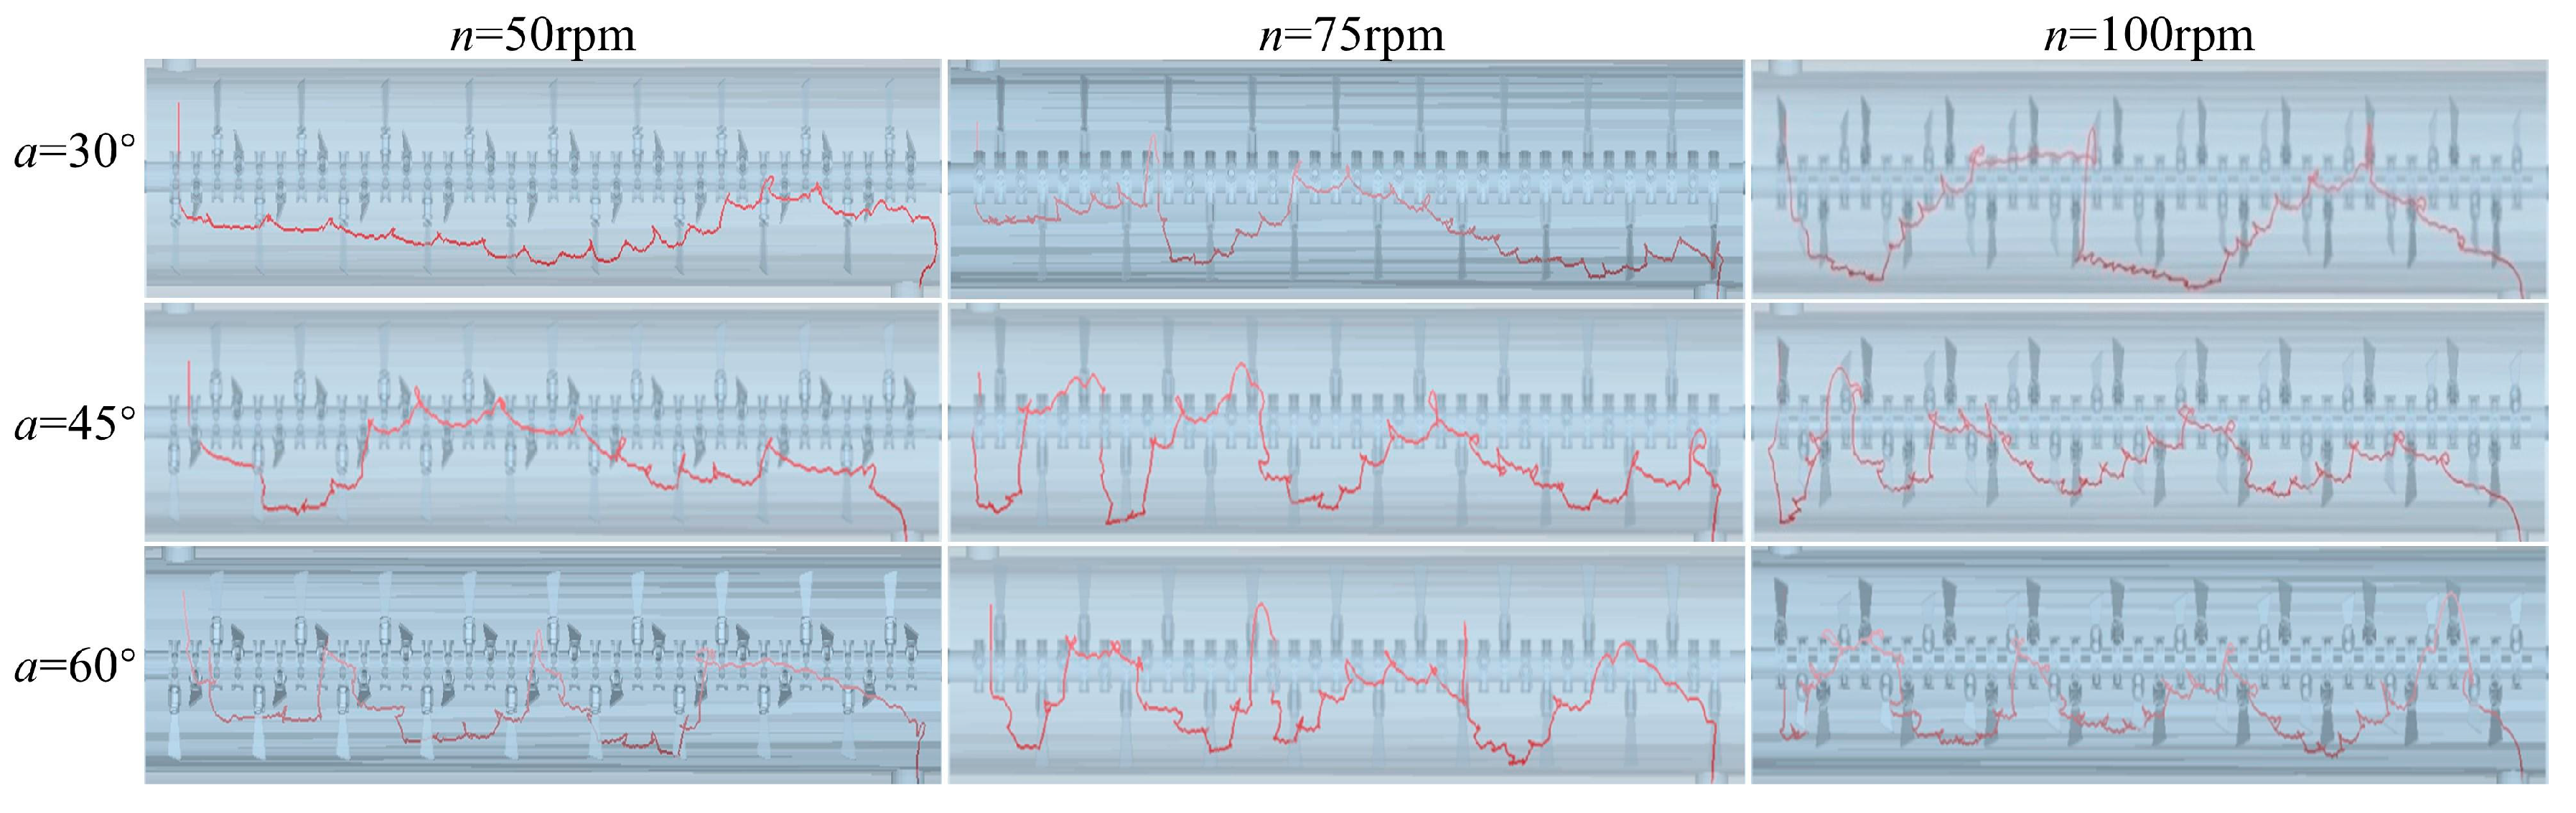
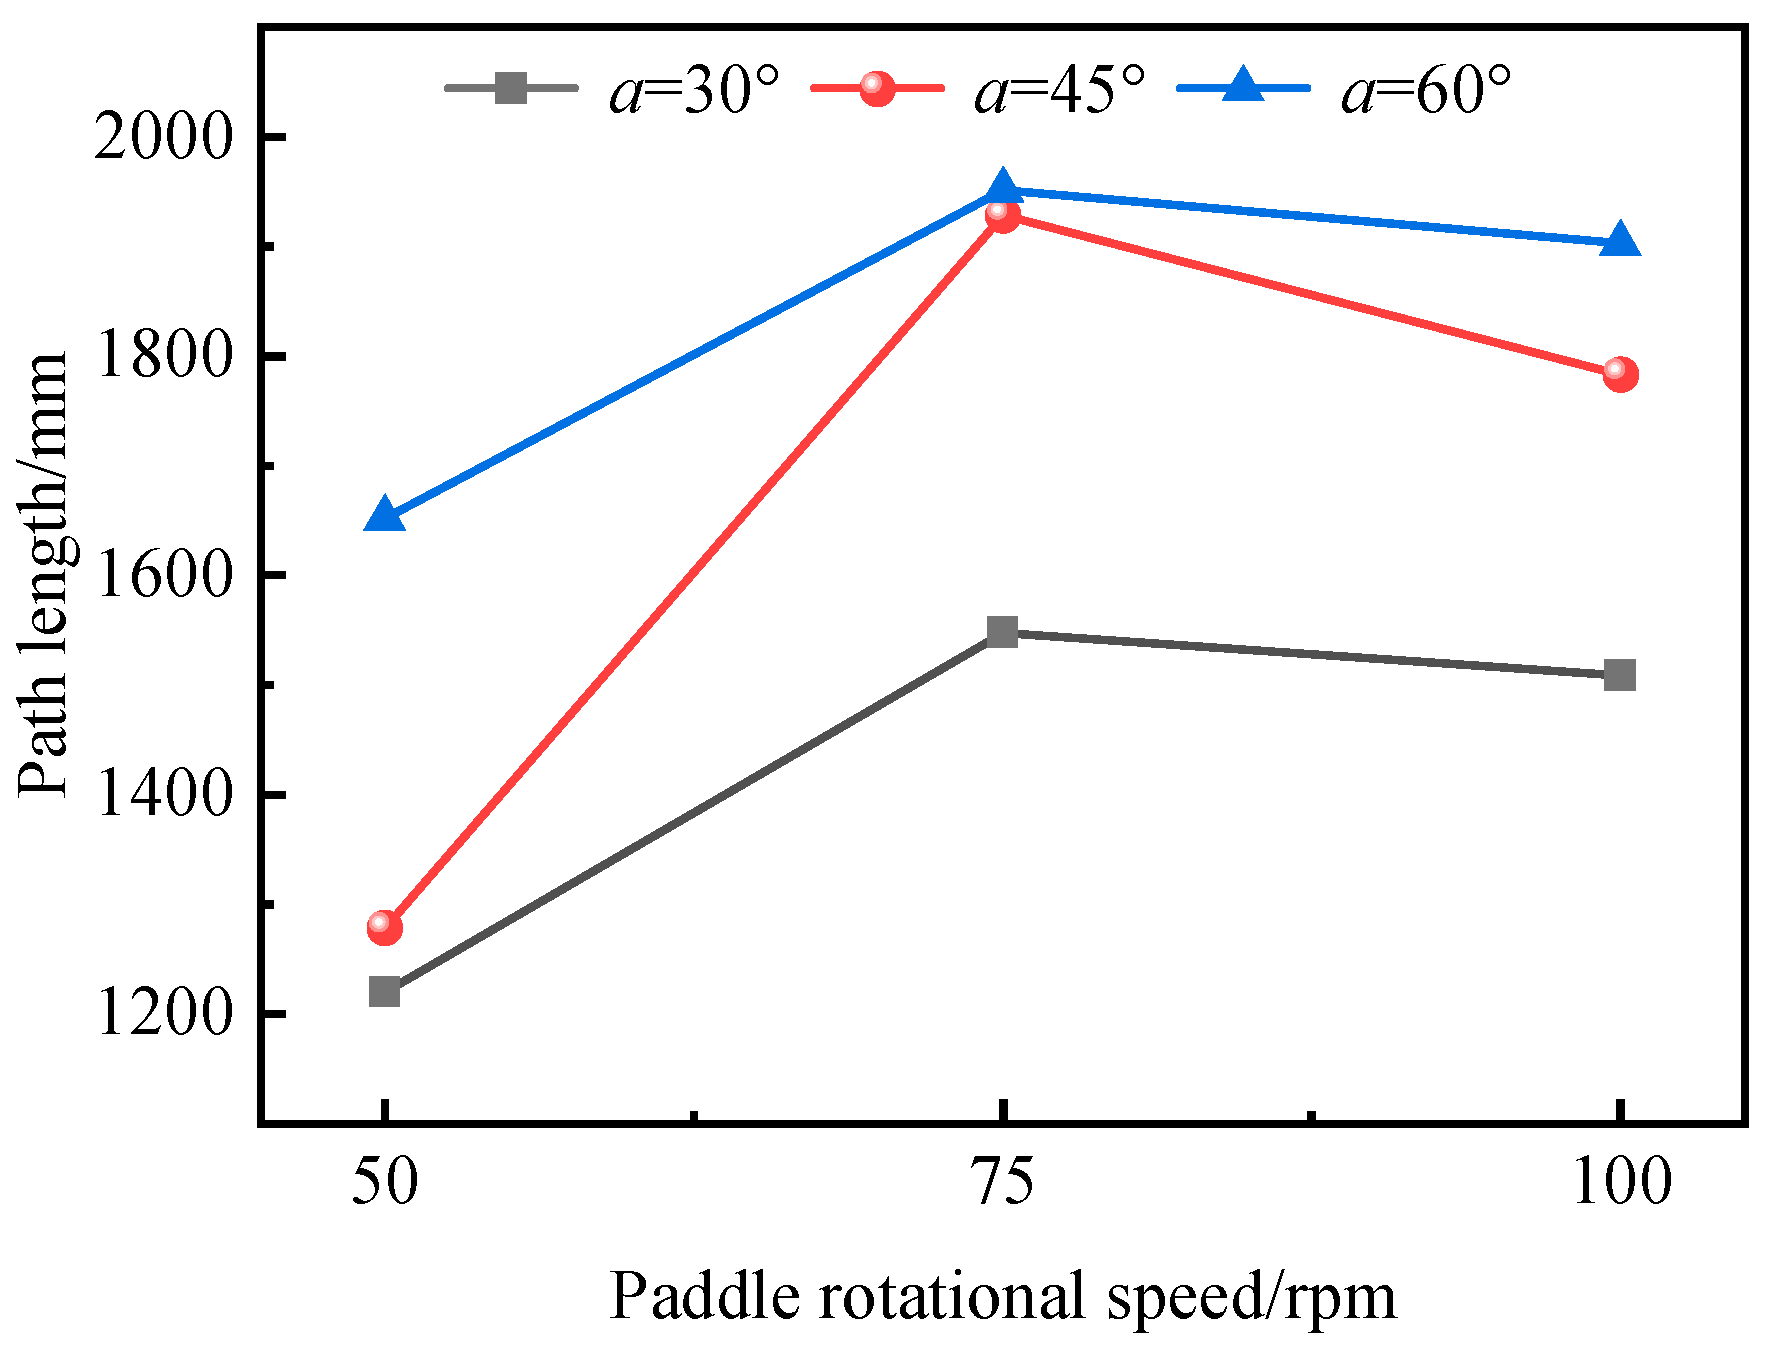
3.5. Particle Trajectory

From the initial moment, the movement and trajectory of each particle were observed during the process of the particles entering and leaving the device. The length of the obtained path for each particle was recorded during the simulation.
Figure 9 shows the particle paths for different paddle configurations. The trajectories shown were calculated using a DEM analysis and as characteristic particles. The particle path represents almost all the particle behaviors observed in the paddle screw continuous conveying device. Some special cases concerned particles that stopped moving in the DEM analysis and did not reach the exit for other reasons. A discussion of these special particles is omitted in this paper.
The EDEM software was used to display the path of a single particle, and the positional coordinates of the particle at that moment were derived to calculate its length. The resulting data are shown in Figure 10.
It can be seen that at the same rotational speed, compared with the cases of 30° and 45°, the particle path is longer at 60°. This can be explained by the fact that a large paddle angle allows the particles to perform better circumferential motion, thereby lengthening the path length. With the same angle but compared with the cases of 50 rpm and 100 rpm, the particle path is longer at 75 rpm. This is because the increase in the rotational speed not only strengthens the circumferential movement of the particles but also strengthens the axial movement, thereby affecting the path length. The increase in the paddle angle strengthens the circumferential movement of the particles and weakens the axial movement of the particles; thus, the particles are not easily transported out of the device, affecting their subsequent mixing. The increase in the paddle rotational speed strengthens the circumferential movement of the particles and intensifies the axial movement of the particles, resulting in a shorter delay of the particles in the device, possibly reducing the mixing time for the particles in the device.

4. Conclusions

This study analyzed the effects of paddle parameters on the mixing and conveying processes of particles. Whether the organic fertilizer raw materials and fermentation bacteria can be fully mixed is key to ensuring the quality of the organic fertilizer. The main idea was to use a verified DEM model to improve the mixing uniformity and mixing quality by changing the paddle rotational speed n and paddle angle α.
By comparing the RSD values of the particles with different paddle configurations, it was found that the mixing uniformity increases with an increasing paddle rotational speed n for the same mixing time. When the paddle angles α are 45° and 60°, the change rate of the mixing uniformity gradually decreases with an increase in the paddle rotational speed n. When the paddle angle α is less than 90°, the particle mixing uniformity first increases and then decreases with an increase in the angle, and the mixing is optimal at 45°.
The average contact force analysis shows that the average normal contact force between the paddle and particle is dominant. The paddle rotational speed n has a significant influence on the average normal contact force, and the paddle angle α has a small influence on the average normal contact force. The larger the paddle rotational speed n, the larger the average normal contact force. In particular, when the paddle angle α is 45° or 60°, the change in the paddle rotational speed n has a significant effect on the average normal contact force. Therefore, a reasonable selection of paddle parameters can reduce power consumption.
The average velocity of the particles in all directions shows that when the paddle angle α is 45° and paddle rotational speed n is 75 rpm, the particles have both circumferential and axial motions; these are more suitable in terms of uniform mixing and fermentation time. By displaying and calculating the particle path, it can be seen that the larger the paddle angle α, the longer the particle path in the device, However, with an increase in the paddle rotational speed n, the particle path in the device first increases and then decreases.
The research establishes a baseline for optimizing paddle parameters in organic fertilizer conveyors. However, prior studies focused on spherical particles and narrow impeller angles/speeds, limiting understanding of synergistic effects. Future work will expand to non-spherical materials, analyze energy use, and test varied impeller designs. Non-spherical particles’ shape and texture are expected to impact mixing uniformity and efficiency. For industrial use, durability factors like component wear, fatigue, and maintenance costs under continuous operation must be evaluated. Combining hydrodynamic performance, energy efficiency, and long-term reliability will help adapt lab findings to practical, large-scale bioprocessing applications.

Supplementary Materials

The following supporting information can be downloaded at: https://www.mdpi.com/article/10.3390/agriengineering7060184/s1, Figure S1: Organic fertilizer products; Figure S2: Muck used for preparing organic fertilizer; Figure S3: Schematic diagram of the power transmission system for test bench; Table S1: Components of organic fertilizers; Table S2: Average particle velocity, diffusion coefficient and Peclet number under different paddle Angle α; Table S3: Average particle velocity, diffusion coefficient and Peclet number at different paddle rotational speeds n.

Author Contributions

Conceptualization, X.Z., Y.Z. and R.Z.; methodology, X.Z., Y.Z. and R.Z.; software, X.Z., Y.Z. and Z.T.; validation, X.Z., Z.T. and P.Z.; formal analysis, X.Z., Y.Z. and R.Z.; investigation, Z.T. and P.Z.; resources, X.Z., Z.T. and P.Z.; data curation, X.Z., Z.T. and P.Z.; writing—original draft preparation, Y.Z.; writing—review and editing, X.Z., Z.T. and P.Z.; visualization, Y.C. and Y.P.; supervision, Y.C. and Y.P.; project administration, X.Z., Z.T. and P.Z.; funding acquisition, X.Z., Z.T., Y.C. and P.Z. All authors have read and agreed to the published version of the manuscript.

Funding

This research was funded by the Science and Technological Research Project in Henan Province, grant number 202102110266.

Data Availability Statement

The data presented in this study are available on request from the corresponding author.

Acknowledgments

The authors gratefully acknowledge the support of their respective institutions and the funding agencies that made this study possible. All contributions and assistance are sincerely appreciated. We thank the anonymous reviewers for their very helpful suggestions.

Conflicts of Interest

The authors declare that they have no conflicts of interest.

References

  1. Makan, A.; Fadili, A. Sustainability assessment of large-scale composting technologies using PROMETHEE method. J. Clean. Prod. 2020, 261, 121244. [Google Scholar] [CrossRef]
  2. Zheng, X.; Aborisade, M.A.; Liu, S.; Lu, S.; Oba, B.T.; Xu, X.; Cheng, X.; He, M.; Song, Y.; Ding, H. The history and prediction of composting technology: A patent mining. J. Clean. Prod. 2020, 276, 124232. [Google Scholar] [CrossRef]
  3. Wei, Y.; Wang, N.; Lin, Y.; Zhan, Y.; Ding, X.; Liu, Y.; Zhang, A.; Ding, G.; Xu, T.; Li, J. Recycling of nutrients from organic waste by advanced compost technology—A case study. Bioresour. Technol. 2021, 337, 125411. [Google Scholar] [CrossRef] [PubMed]
  4. Xu, Z.; Zhao, B.; Wang, Y.; Xiao, J.; Wang, X. Composting process and odor emission varied in windrow and trough composting system under different air humidity conditions. Bioresour. Technol. 2020, 297, 122482. [Google Scholar] [CrossRef]
  5. Liu, Z.L.; Wang, X.; Wang, F.H.; Bai, Z.H.; Chadwick, D.; Misselbrook, T.; Ma, L. The progress of composting technologies from static heap to intelligent reactor: Benefits and limitations. J. Clean. Prod. 2020, 270, 122328. [Google Scholar] [CrossRef]
  6. Liu, Z.L.; Wang, X.; Li, S.; Bai, Z.H.; Ma, L. Advanced composting technologies promotes environmental benefits and eco-efficiency: A life cycle assessment. Bioresour. Technol. 2022, 346, 126576. [Google Scholar] [CrossRef]
  7. Wang, S.F.; Wu, Y.Q. Hyperthermophilic Composting Technology for Organic Solid Waste Treatment: Recent Research Advances and Trends. Processes 2021, 9, 675. [Google Scholar] [CrossRef]
  8. Drosou, F.; Kekes, T.; Boukouvalas, C. Life Cycle Assessment of the Canned Fruits Industry: Sustainability through Waste Valorization and Implementation of Innovative Techniques. AgriEngineering 2023, 5, 395–412. [Google Scholar] [CrossRef]
  9. Abdullakasim, W.; Khongman, K.; Sukcharoenvipharat, W.; Usaborisut, P. Development and Performance Testing of a Combined Cultivating Implement and Organic Fertilizer Applicator for Sugarcane Ratooning. AgriEngineering 2025, 7, 105. [Google Scholar] [CrossRef]
  10. Wang, J.; Ren, K.L.; Zhang, L.F. Design and Testing of a Small-Scale Composting Facility for Sheep Manure Utilizing Aeration and Thermal Treatment. Agriculture 2024, 14, 2070. [Google Scholar] [CrossRef]
  11. Ma, J.; Chen, Z.; Li, J.; Liu, L.; Yang, Q.; Wan, Y.; Lu, X.; Zhang, Y.; Fei, X. Concurrent aerobic methane oxidation and biodegradation of waste in shallow layer of landfill during aeration. J. Environ. Manag. 2025, 381, 125282. [Google Scholar] [CrossRef] [PubMed]
  12. Finore, I.; Feola, A.; Russo, L.; Cattaneo, A.; Di Donato, P.; Nicolaus, B.; Poli, A.; Romano, I. Thermophilic bacteria and their thermozymes in composting processes: A review. Chem. Biol. Technol. Agric. 2023, 10, 7. [Google Scholar] [CrossRef]
  13. Nanda, S.; Berruti, F. Municipal solid waste management and landfilling technologies: A review. Environ. Chem. Lett. 2021, 19, 1433–1456. [Google Scholar] [CrossRef]
  14. Cheng, H.; Sui, B.; Meng, H.; Shen, Y.; Wang, J.; Kuang, C. Design and performance test of aerobic fermentation rotary reactor pilot plant for biogas residue. Trans. CSAE 2018, 34, 224–231. [Google Scholar] [CrossRef]
  15. Gao, Y.; Huang, T.; Li, N.; Qi, Y.; Si, F.; Yang, B. Effect of Induced Mixing on Bacterial Community Structure and Metabolic Activity in Reservoir. Environ. Sci. 2022, 43, 2624–2632. [Google Scholar] [CrossRef]
  16. Biswal, B.K.; Wang, B.; Tang, C.-J.; Chen, G.-H.; Wu, D. Elucidating the effect of mixing technologies on dynamics of microbial communities and their correlations with granular sludge properties in a high-rate sulfidogenic anaerobic bioreactor for saline wastewater treatment. Bioresour. Technol. 2020, 297, 122397. [Google Scholar] [CrossRef]
  17. Minglani, D.; Sharma, A.; Pandey, H.; Dayal, R.; Joshi, J.B.; Subramaniam, S. A review of granular flow in screw feeders and conveyors. Powder Technol. 2020, 366, 369–381. [Google Scholar] [CrossRef]
  18. Jadidi, B.; Ebrahimi, M.; Ein-Mozaffari, F.; Lohi, A. Mixing performance analysis of non-cohesive particles in a double paddle blender using DEM and experiments. Powder Technol. 2022, 397, 2693–2706. [Google Scholar] [CrossRef]
  19. Ebrahimi, M.; Yaraghi, A.; Ein-Mozaffari, F.; Lohi, A. The effect of impeller configurations on particle mixing in an agitated paddle mixer. Powder Technol. 2018, 332, 158–170. [Google Scholar] [CrossRef]
  20. Pezo, M.; Pezo, L.; Jovanovic, A.P.; Terzic, A.; Andric, L.; Loncar, B.; Kojic, P. Discrete element model of particle transport and premixing action in modified screw conveyors. Powder Technol. 2018, 336, 255–264. [Google Scholar] [CrossRef]
  21. Pezo, L.; Jovanovic, A.; Pezo, M.; Colovic, R.; Loncar, B. Modified screw conveyor-mixers—Discrete element modeling approach. Adv. Powder Technol. 2015, 26, 1391–1399. [Google Scholar] [CrossRef]
  22. Yaraghi, A.; Ebrahimi, M.; Ein-Mozaffari, F.; Lohi, A. Mixing assessment of non-cohesive particles in a paddle mixer through experiments and discrete element method (DEM). Adv. Powder Technol. 2018, 29, 2693–2706. [Google Scholar] [CrossRef]
  23. Ebrahimi, M.; Yaraghi, A.; Jadidi, B.; Ein-Mozaffari, F.; Lohi, A. Assessment of bi-disperse solid particles mixing in a horizontal paddle mixer through experiments and DEM. Powder Technol. 2021, 381, 129–140. [Google Scholar] [CrossRef]
  24. Chen, G.; Wang, Q.; Li, H.; He, J.; Lu, C.; Zhang, X. Design and experiment of solid organic fertilizer crushing and striping machines. Trans. CSAE 2023, 39, 13–24. [Google Scholar] [CrossRef]
  25. Singh, V.K.; Jiménez del Val, I.; Glassey, J.; Kavousi, F. Integration Approaches to Model Bioreactor Hydrodynamics and Cellular Kinetics for Advancing Bioprocess Optimisation. J. Bioeng. 2024, 11, 546. [Google Scholar] [CrossRef]
  26. Yuan, Q.C.; Xu, L.M.; Ma, S.; Niu, C.; Yan, C.G.; Zhao, S.J. The effect of paddle configurations on particle mixing in a soil-fertilizer continuous mixing device. Powder Technol. 2021, 391, 292–300. [Google Scholar] [CrossRef]
  27. Yang, D.Z.; Chu, X.H.; Liu, Q.P. Effect of blade geometry on the powder spreading process in additive manufacturing. Particuology 2024, 94, 345–355. [Google Scholar] [CrossRef]
  28. Jin, X.; Wang, S.; Shen, Y.S. DEM study of the effect of impeller design on mixing performance in a U-shape ribbon mixer. Adv. Powder Technol. 2022, 33, 103334. [Google Scholar] [CrossRef]
  29. Zhang, X.; Liu, Y.; Li, L.; Tong, Z.; Yang, D.; Hou, C. Design and performance experiment of multi-segment type auger in process of organic fertilizer production. Trans. CSAE 2018, 34, 49–56. [Google Scholar] [CrossRef]
  30. Dai, F.; Song, X.; Zhao, W.; Zhang, F.; Ma, H.; Ma, M. Simulative Calibration on Contact Parameters of Discrete Elements for Covering Soil on Whole Plastic Film Mulching on Double Ridges. Trans. CSAM 2019, 50, 49–56, 77. [Google Scholar] [CrossRef]
  31. Herman, A.P.; Gan, J.Q.; Zhou, Z.Y.; Yu, A.B. Discrete particle simulation for mixing of granular materials in ribbon mixers: A scale-up study. Powder Technol. 2022, 400, 117222. [Google Scholar] [CrossRef]
Figure 1. System architecture and prototype design of continuous organic fertilizer equipment. (a) Switchboard for continuous organic fertilizer production equipment; (b) Mixing mechanism of fermentation plant; (c) Experimental equipment; (d) The structure of the experimental framework.
Agriengineering 07 00184 g001
Figure 2. Model of propeller spiral continuous conveying organic fertilizer equipment.
Agriengineering 07 00184 g002
Figure 3. Mixing process of particles in the test device. (a) Configuration of test equipment, (b) Incoming part. (c) Mixing part, (d) Discharging part.
Agriengineering 07 00184 g003
Figure 4. Sampling and image processing. (a) Sampling image, (b) Effect of image processing.
Agriengineering 07 00184 g004
Figure 5. Comparison of the results of the simulation experiment and physical experiment.
Agriengineering 07 00184 g005
Figure 6. Variation in mixing uniformity with different paddle configurations.
Agriengineering 07 00184 g006
Figure 7. Influence of paddle configurations on contact force. (a) Normal contact force, (b) Tangential contact force.
Agriengineering 07 00184 g007
Figure 8. Average velocity of particles in all directions. (ac) Average velocity of particles in X, Y, and Z directions changes with different paddle rotational speeds; (df) Average velocity of particles in X, Y, and Z directions varies with different paddle angles.
Agriengineering 07 00184 g008
Figure 9. Particle path with different paddle configurations.
Agriengineering 07 00184 g009
Figure 10. Comparison of particle path length with different paddle parameters.
Agriengineering 07 00184 g010
Table 1. Different paddle configurations.
Paddle SettingRotational Speed n/rpmPaddle Angle α
15030
25045
35060
47530
57545
67560
710030
810045
910060
Table 2. Simulation parameters.
Input ParametersValue
Particle diameter/mm3
Particle density/(kg·m−3)1100
Particle Poisson’s ratio0.4
Particle shear modulus/Pa1.09 × 106
Equipment material density/(kg·m−3)7 850
Poisson ratio of equipment material0.3
Shear modulus of equipment/Pa1.01 × 1010
Coefficient of restitution between particles0.2
Coefficient of static friction between particles0.4
Coefficient of rolling friction between particles0.3
Coefficient of restitution between particles and equipment0.3
Coefficient of static friction between particles and equipment0.5
Coefficient of rolling friction between particles and equipment0.4
Time step/s4.77 × 10−5
Disclaimer/Publisher’s Note: The statements, opinions and data contained in all publications are solely those of the individual author(s) and contributor(s) and not of MDPI and/or the editor(s). MDPI and/or the editor(s) disclaim responsibility for any injury to people or property resulting from any ideas, methods, instructions or products referred to in the content.

