1. Introduction
Paddy drying is a typical high-energy consumption process in agricultural production. Energy efficiency has consistently remained a major concern for both industry and academia. Despite the steady progress of drying technologies worldwide in recent years, the uptake and application of these technologies has been disappointing, mainly due to the high energy consumption of existing equipment [
1]. In addition to technical factors such as manufacturing tolerances and improper use of drying equipment, the main reason for the excessive energy consumption is the limitations of conventional theories of steady-state heat and mass transfer in characterizing the actual drying dynamics of paddy. This theoretical inadequacy has led to insufficient scientific evidence to optimize drying protocols using hot air and to develop energy-efficient drying systems.
Porosity, defined as the ratio of void volume to total volume of granular agricultural material (e.g., wheat, paddy, corn) [
2,
3,
4], serves as a basic parameter for both the optimization of the drying system and the intelligent management of the process. This critical characteristic strongly influences the heat transfer efficiency between the drying medium and the particles and depends on several factors, including particle morphology, particle size distribution, and stellar properties. Numerous studies have been carried out in various fields to investigate the properties of porosity. Moural Salhi et al. [
5] investigated airflow patterns in drying chambers using plum-filled trays, establishing a porous media model that revealed smaller velocity differentials at 50% porosity under low airflow rates compared to high-velocity conditions. Hui Qi et al. [
6] developed a dual-porosity model grounded in Biot’s theory to analyze the correlation between seismic wave propagation and porosity in carbonate rocks. Nadia O. Oliveros et al. [
7] employed coupled numerical-experimental approaches to characterize dynamic porosity evolution during coffee bean roasting, demonstrating remarkable consistency between simulation results and empirical data. Xu et al. [
8] systematically quantified porosity variations in rapeseed cultivars using mercury intrusion porosimetry, revealing distinct moisture-dependent patterns. Li et al. [
9] developed a custom-made porosimetry apparatus to demonstrate that the porosity of wheat decreases exponentially with applied pressure and increases exponentially with moisture content. Although these pioneering studies have significantly advanced our understanding of particle systems, current porosity models rely mainly on static equilibrium assumptions, which often lead to significant inconsistencies when applied to dynamic processes. This lack of knowledge is particularly evident in the absence of a validated theoretical framework for the characterization of porosity dynamics in liquid bed systems.
The dynamic flow regime of paddy within industrial dryers induces porosity variations influenced by three principal factors: airflow velocity profiles, particle–wall interfacial interactions, and bulk volume variations. Significant discrepancies exist between static and dynamic porosity characteristics within dryer operational layers, inducing abrupt alterations in medium tortuosity, interfacial evaporation efficiency coefficients, and pneumatic resistance gradients, thereby fundamentally impacting drying kinetics, product homogeneity, energy conversion efficiency, and specific energy consumption [
10]. While substantial research efforts have focused on static porosity characterization, the dynamic porosity mechanisms in continuous-flow drying systems remain poorly understood, resulting in inadequate theoretical frameworks for optimizing industrial-scale particulate drying operations. This study presents the development of a novel experimental rig specifically designed for monitoring real-time porosity dynamics in aerated particulate beds. Systematic investigations were conducted to quantify porosity dependence on critical operational parameters including wind speed (0.4–0.8 m/s), material moisture content (14–32% w.b.), and flow velocity (0.01–0.05 m/s). A predictive model was developed through response surface methodology (RSM) optimization, with validation achieved through coupled EDEM–Fluent simulations demonstrating ±1% relative error between computational predictions and experimental measurements.
Assuming that wind speed, paddy moisture content, thickness of the paddy layer, and paddy flow rate all have significant effects on the porosity of paddy, this paper measures the dynamic porosity of paddy layer through three experimental methods (platform experiment, EDEM–Fluent coupling simulation experiment, and mathematical model), uses analysis of variance to study the significance of each factor on the change in porosity, and calculates the relative error between the true value (εr), simulation value (εs), and predicted value (εp) to verify the accuracy of the obtained porosity. This study aims to provide an analysis method of dynamic characteristic parameters and basic data of dynamic porosity change for reducing drying energy consumption, improving drying power coefficient and drying quality, and to provide a reference for the design of related drying equipment.
2. Materials and Methods
2.1. Materials
This study focuses on the variation of porosity in paddy layers under different moisture contents, airflow velocities, and flow rates. The paddy samples (
N-you No.2) were collected from the Jiulongpo District Grain Reserve Depot in Chongqing. After impurity removal through sieving, three experimental groups with controlled moisture contents (14%w.b., 23%w.b., and 32%w.b.) were prepared using artificial humidification technology. The true density values corresponding to each moisture contents, measured with an electronic balance and graduated cylinder, are listed in
Table 1.
2.2. Equipment and Methods
2.2.1. Paddy Porosity Measuring Device and Working Principle
Scholars Li and others designed a device for determining the porosity of bulk materials based on the Ergun calculation formula [
11]. This device can effectively measure the porosity of granular agricultural products in a flowing state. The porosity measurement device in this article has been further optimized based on the design by Scholar Li. The main improvements lie in the design of the valve, the enhancement of sealing performance, and ensuring the constancy of the thickness of the paddy layer.
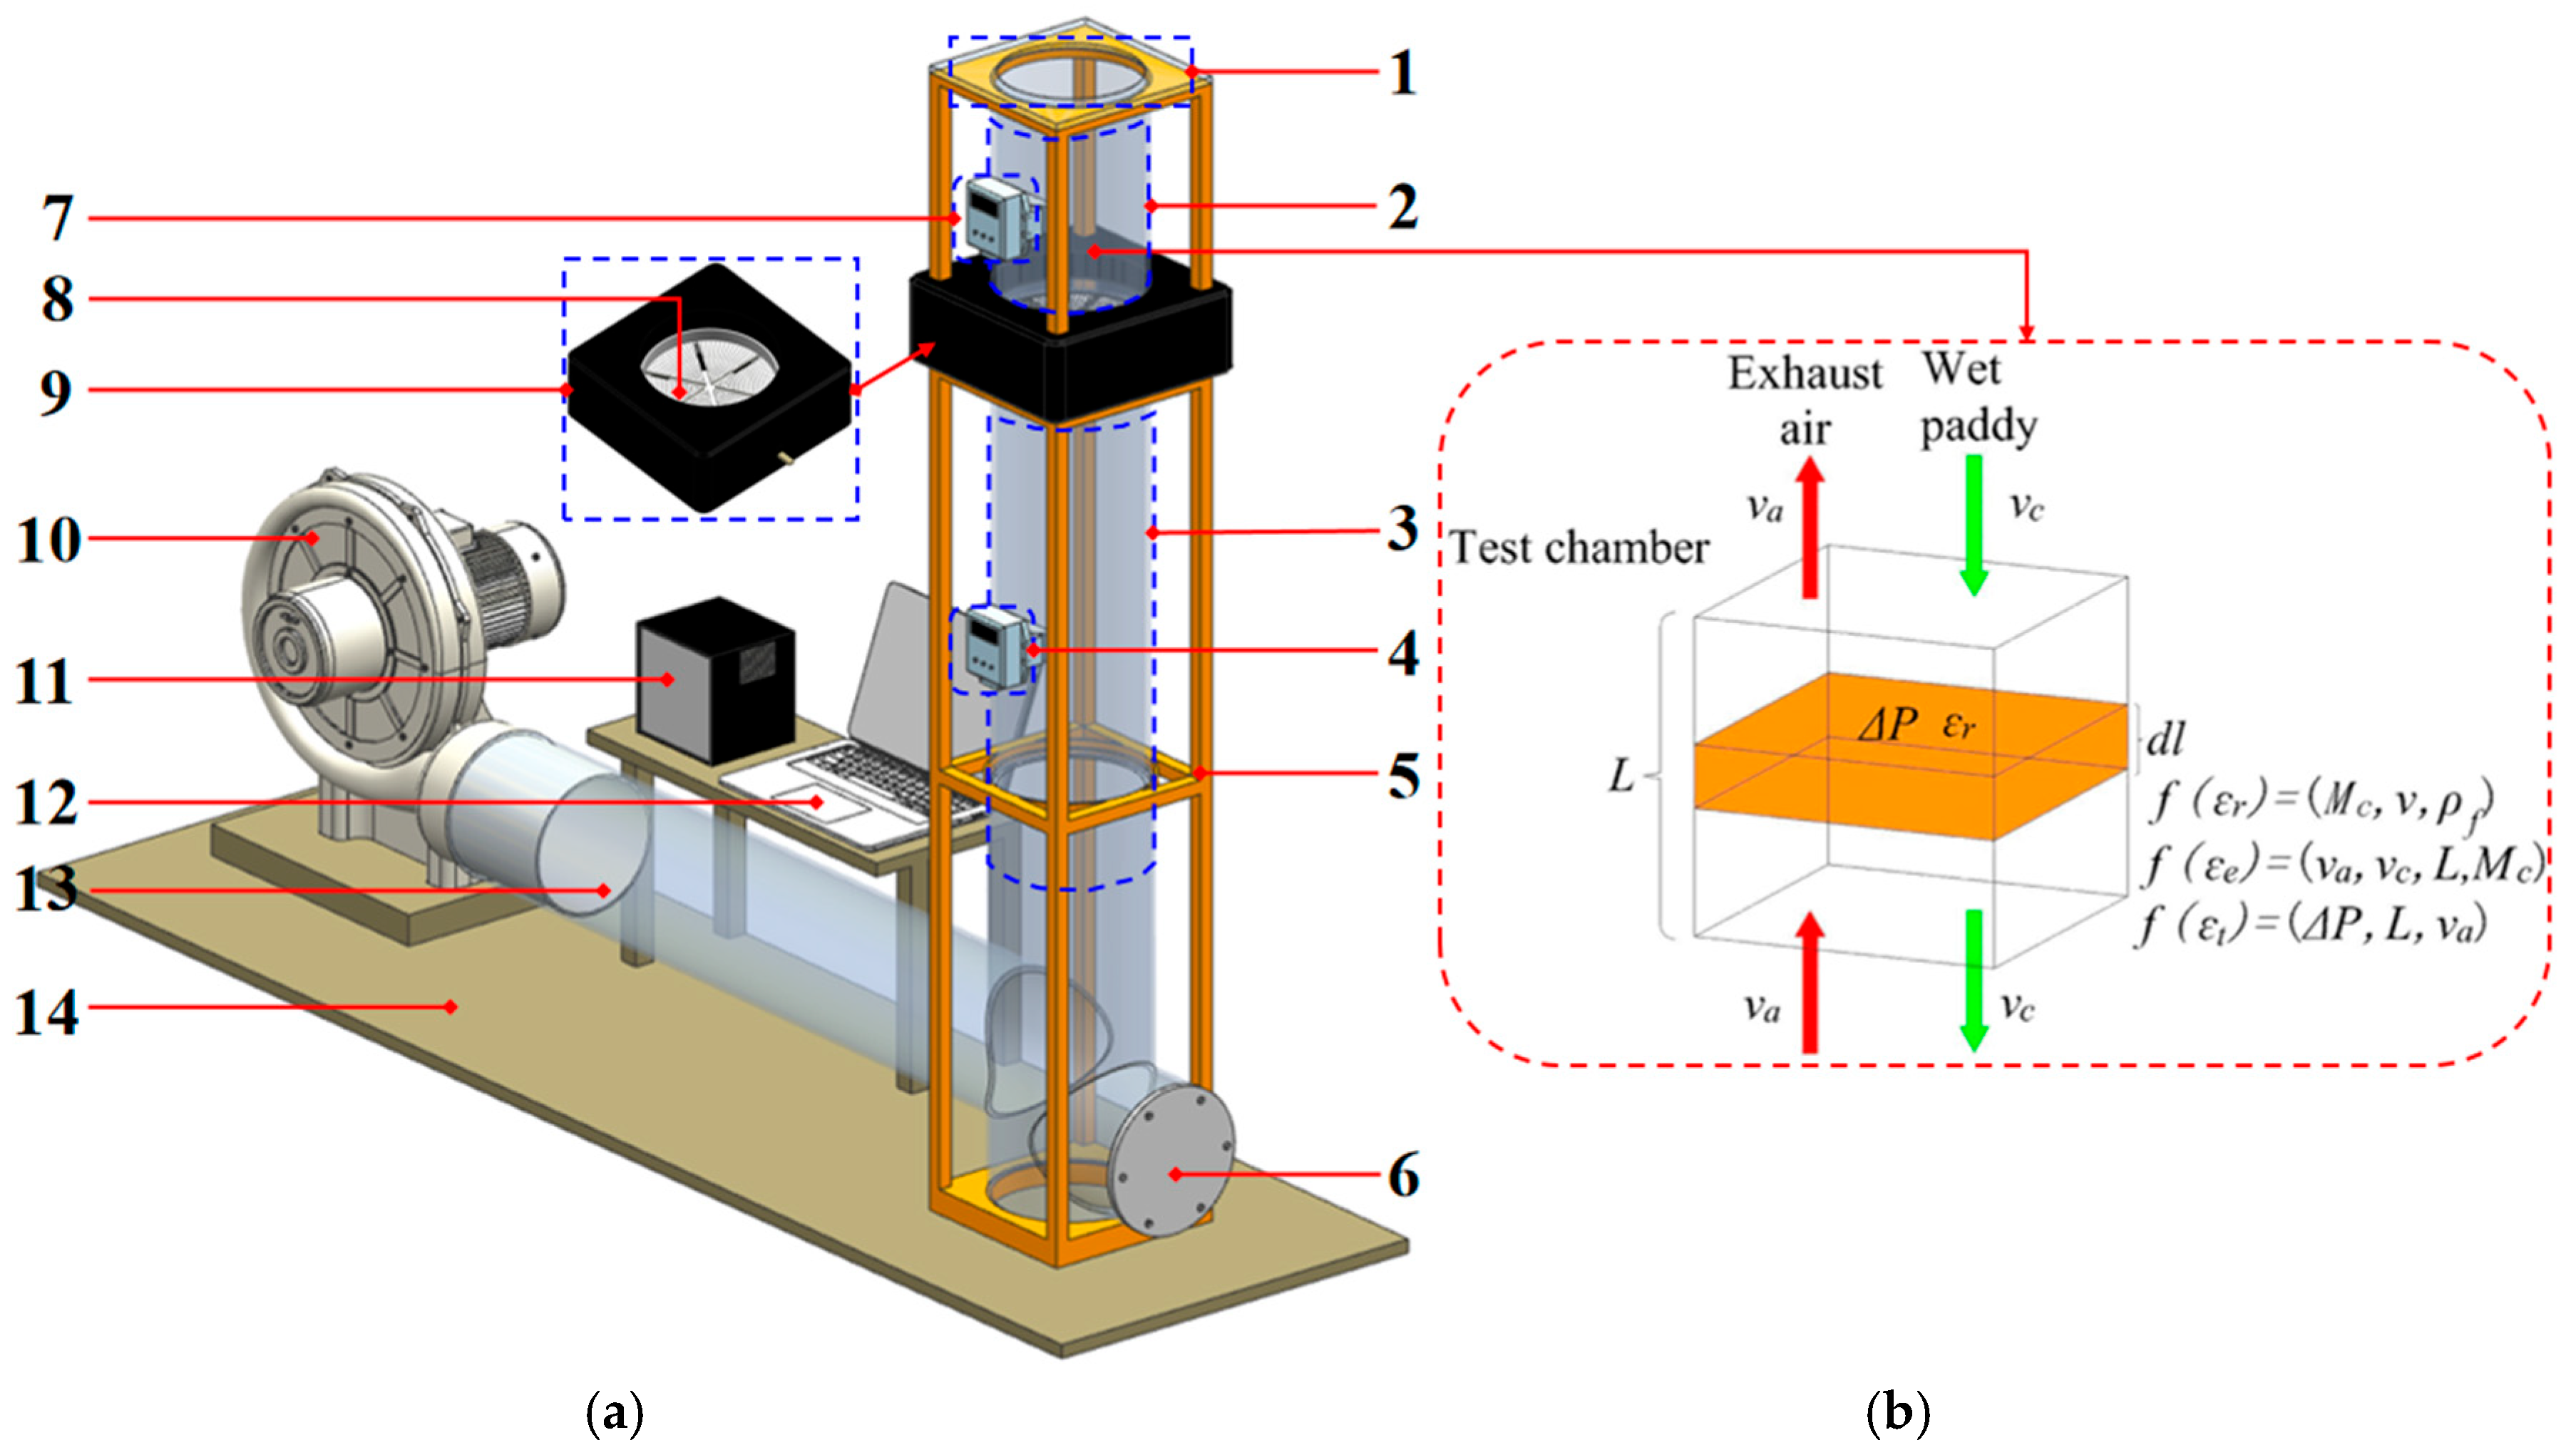
The schematic diagram of the paddy porosity measurement apparatus is illustrated in
Figure 1a, comprising a structural frame, centrifugal fan, collection chamber, measurement area, six-blade valve assembly, towing rope, and two differential pressure sensors. The structural frame serves to house the collection chamber, measurement area, and centrifugal fan assembly. A differential pressure sensor (Sensor A) is positioned above the measurement area to monitor the differential pressure across the paddy layer, while a second differential pressure sensor (Sensor B) is installed within the air–paddy interaction chamber. The measurement area is equipped with a six-blade valve assembly, whose blades are actuated by a motorized cable system to regulate paddy flow velocity.
The operational principle of the porosity measurement system is schematically demonstrated in
Figure 1b. When the paddy layer reaches specified thickness, the centrifugal fan, under precise control of a frequency converter, delivers air at predetermined velocities through the aeration ports into the air–paddy interaction chamber. Following airflow stabilization through the valve-regulated measurement area, the six-blade valve assembly modulates to establish controlled aperture dimensions, allowing for downward paddy flow into the interaction chamber. This configuration establishes countercurrent air–paddy interaction, where descending paddies and ascending airflows create dynamic equilibrium conditions. The paddy particles ultimately discharge through the porous plate into the collection chamber, with both pressure differentials being displayed on a digital readout unit.
2.2.2. Construction of Paddy Porosity Measurement Platform
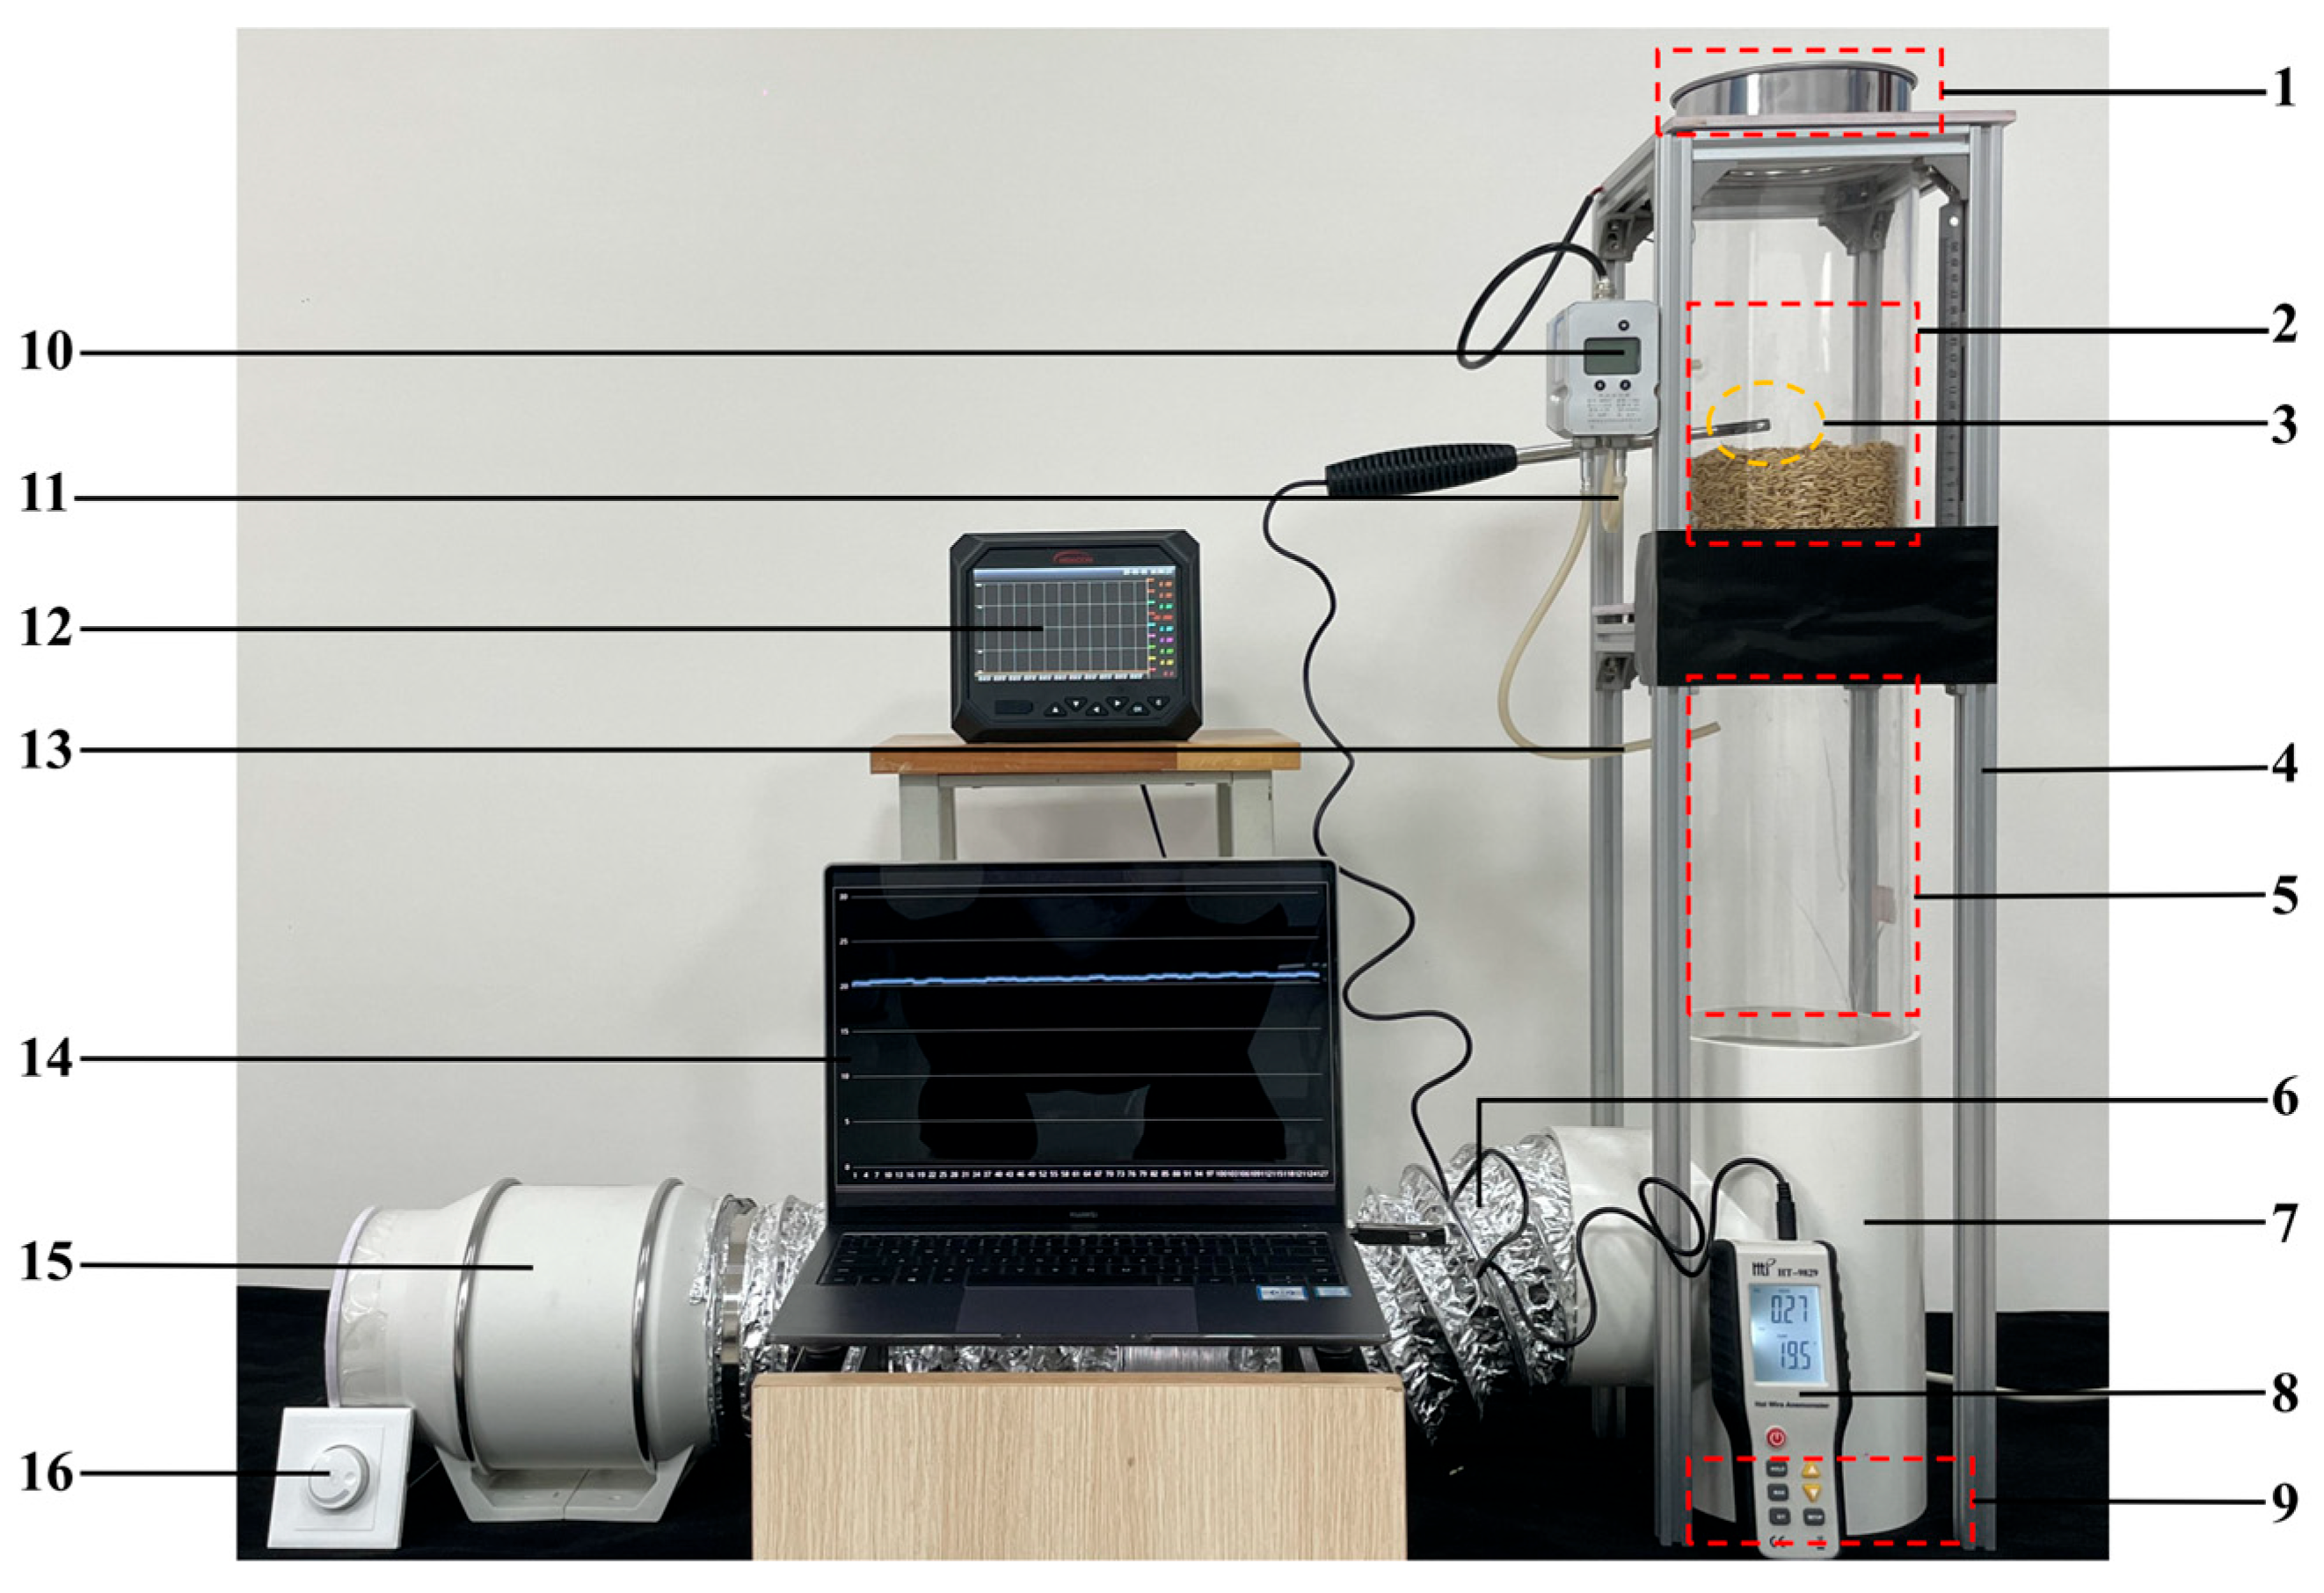
A paddy porosity measurement platform was built using materials such as profiles, acrylic pipes, and three-way PVC pipes, as shown in
Figure 2. It is composed of components such as a wind pressure sensor, centrifugal fan, a speed reducer, and ventilation pipes. The centrifugal fan can adjust the wind speed under the control of the speed reducer, and the airflow is introduced into the acrylic pipe through the ventilation pipe. The wind pressure sensor has two air holes that can be used to measure the wind pressure difference between the porosity measurement area and the air–paddy interaction chamber. Paddy is filled into the porosity measurement area of the measurement platform, and the flow velocity of the paddy in the porosity measurement area is controlled by the opening degree of the fan valve. After the paddy falls, it flows out from the outlet. During the experiment, to ensure that the thickness of the paddy in the measurement area remains constant, paddy needs to be continuously added to the measurement area. The Box–Behnken experimental scheme was implemented on the paddy porosity measurement platform, and the porosity value of the paddy was determined through theoretical calculation methods.
2.3. Theoretical Calculation of Paddy Porosity
The porosity measurement apparatus for paddy employs the Ergun equation for permeability resistance to determine flow layer porosity. The Ergun equation, a fundamental formulation in fluid dynamics, characterizes fluid flow behavior and pressure drop through packed particle beds. This governing equation is conventionally applied to quantify permeability resistance in fixed-bed configurations. In this study, the porosity of paddy was measured in the bench measurement and calculated by the Ergun permeability resistance equation [
12], and the mathematical expression is shown in Equation (1):
The 150 grains of paddy with different moisture content are randomly selected; their length, width, and height are measured with vernier calipers; and the average value is obtained and the equivalent diameter
Dp of paddy is obtained by Equation (2) [
13]. The equivalent diameter
Dp of paddy is shown in Equation (2):
Through EDEM–Fluent coupling simulation, the changes of paddy porosity under different moisture content, wind speed, layer thickness, and flow velocity were simulated. The paddy quality under corresponding conditions was obtained from discrete element software EDEM (2022 Version), and the paddy porosity under this state was obtained from Equation (3) [
14]. The equation for simulating the porosity of paddy is as follows:
In the laboratory environment, the air parameters are shown in
Table 2. In combination with Equations (1) and (2) above, the parameters in
Table 2 are calculated to obtain the porosity of paddy.
2.4. Analysis of Paddy Flow Velocity in Flowing Layer
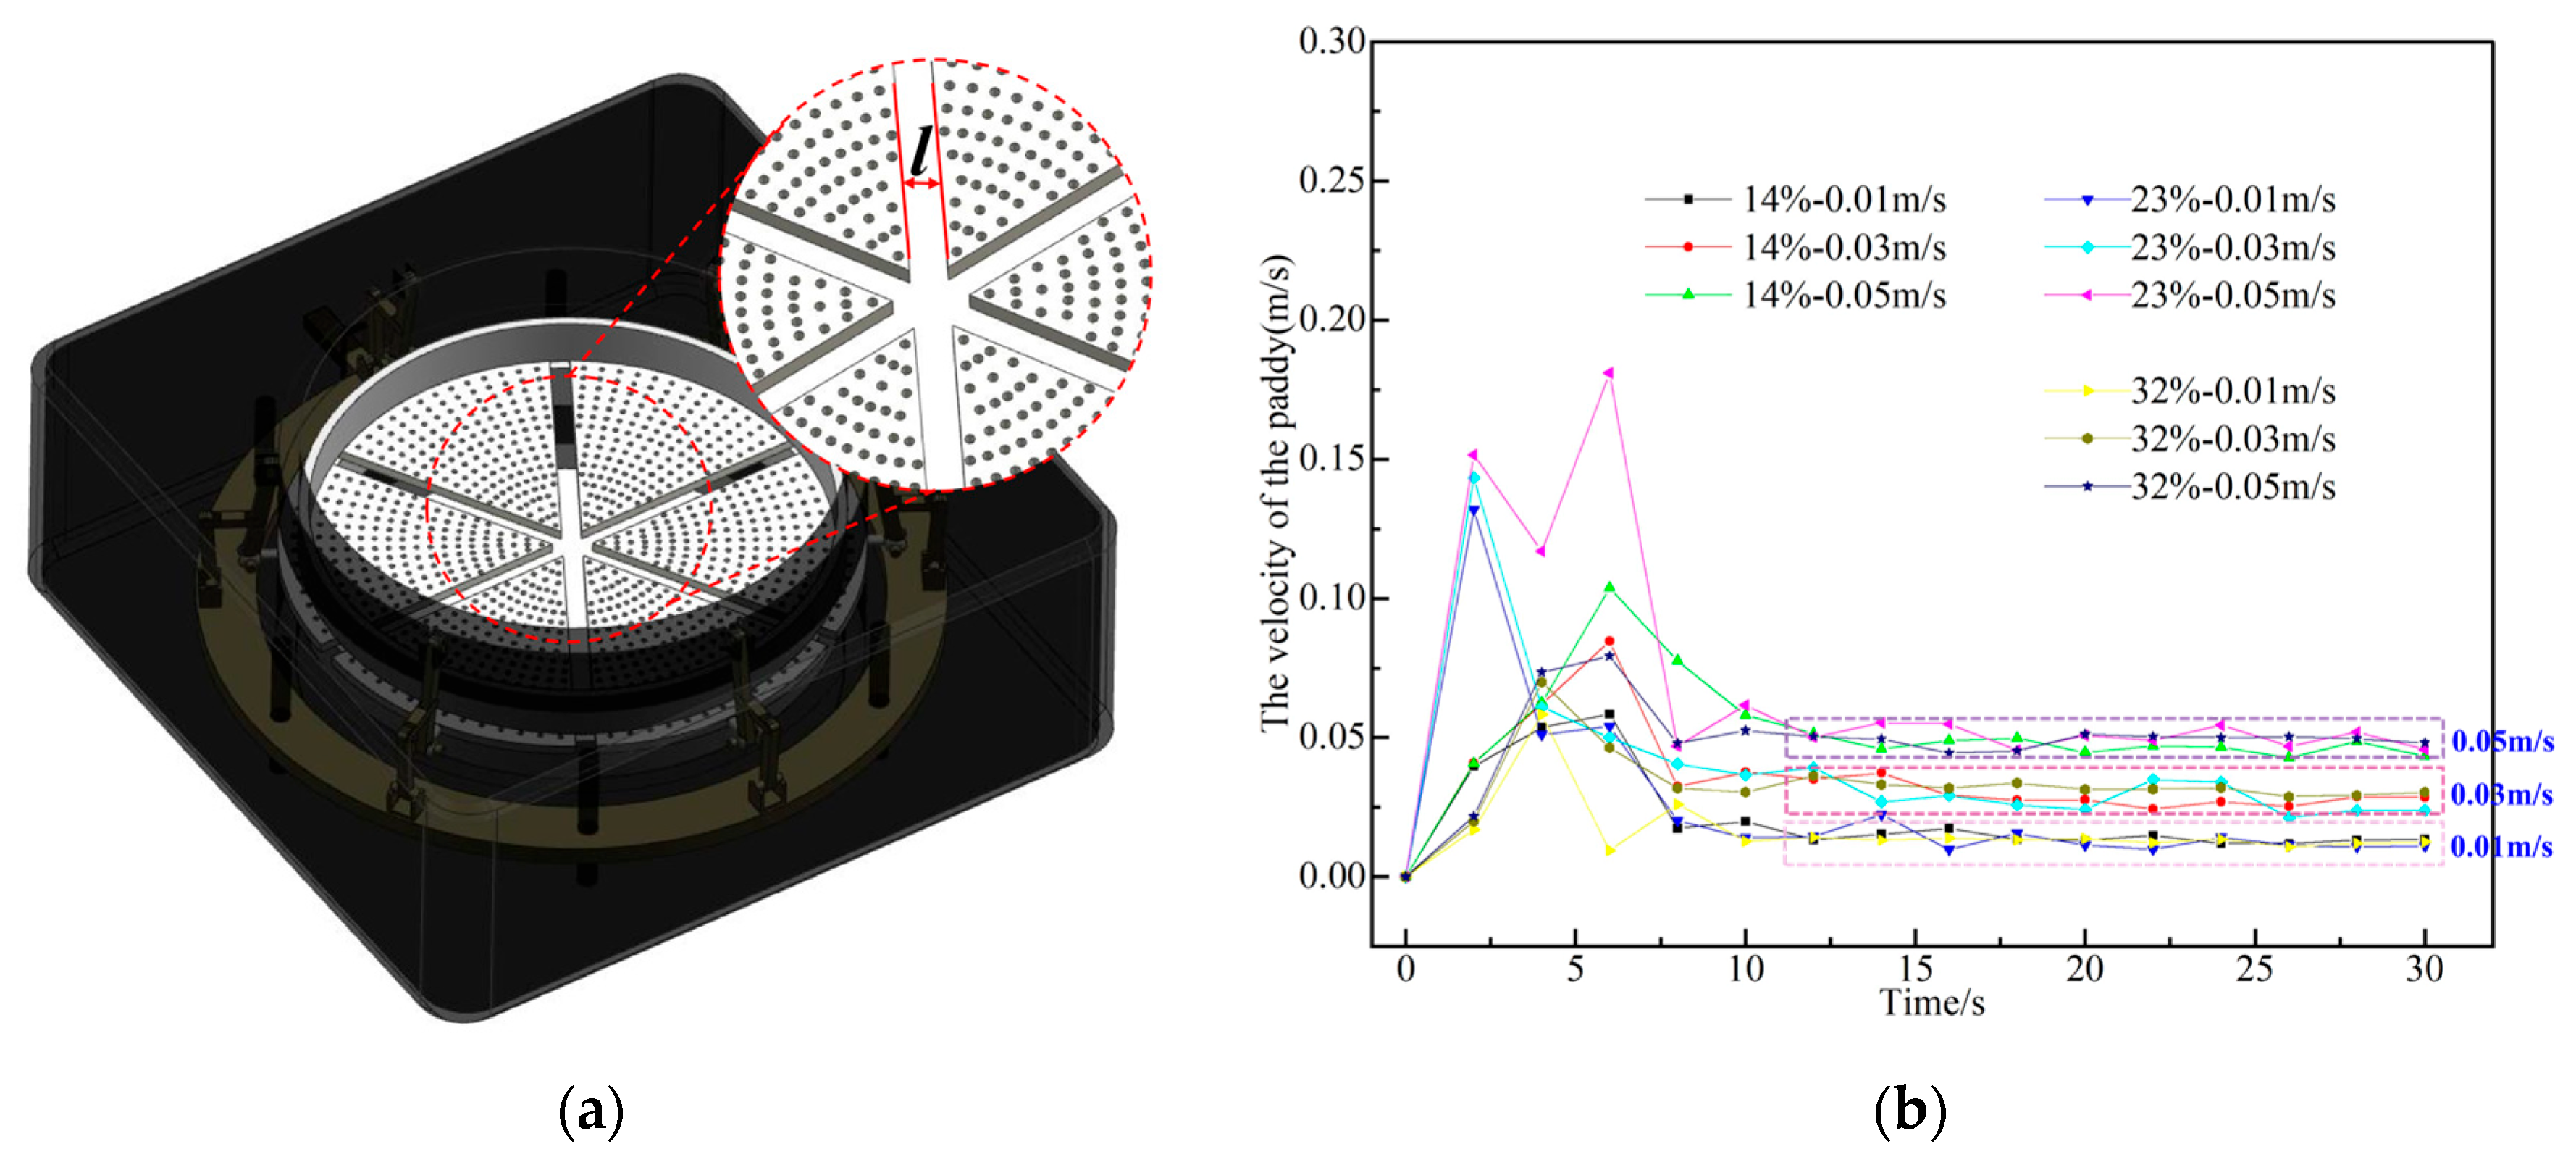
This paper mainly studies the change characteristics of the porosity during the flow of paddy. However, vertical material flow drying devices are mostly used for paddy drying in the market today, which leads to changes in the porosity of the flow layer of paddy. One of the main factors affecting its change is the velocity of paddy in the flow layer. The main factor affecting the flow velocity of paddy is the moisture content of paddy. In this paper, the relative distance of the valve is used to measure the valve opening (
l), and then the valve opening (
l) is used to adjust the flow velocity of paddy flow layer. The structure diagram of the fan valve is shown in
Figure 3a. The relationship between valve opening (
l) and paddy flow velocity was measured by the experiment of paddy porosity measurement platform. When the valve is opened, paddy particles with the same moisture content are artificially filled so that the thickness of paddy in the measurement layer remains unchanged. The paddy in the porosity measurement layer flows downward, and the quality of the falling paddy is recorded by a paperless recorder, which is brought into Equation (4) to obtain the velocity of the paddy.
According Equation (4) above, the paddy flow velocity is obtained, as shown in
Figure 3b, and significant fluctuations were observed during the initial 0–10 s period. This transient instability likely originated from the transition from static to dynamic flow conditions following fan valve activation, combined with elevated interparticle and paddy valve friction coefficients, which induced irregular motion and pronounced vibrations in the porosity measurement layer.
In contrast, during the 10–30 s interval, the paddy particle velocity within the porosity measurement layer stabilized with minimal fluctuations. The average velocity during this steady-state period was calculated. As summarized in
Table 3, valve openings corresponding to stable flow velocities of 0.01 m/s, 0.03 m/s, and 0.05 m/s were achieved for paddy with moisture contents of 14%w.b., 23%w.b., and 32%w.b., respectively.
2.5. Establish a Paddy Porosity Simulation Measurement Model
2.5.1. Establishment of Paddy Particle Model and Platform
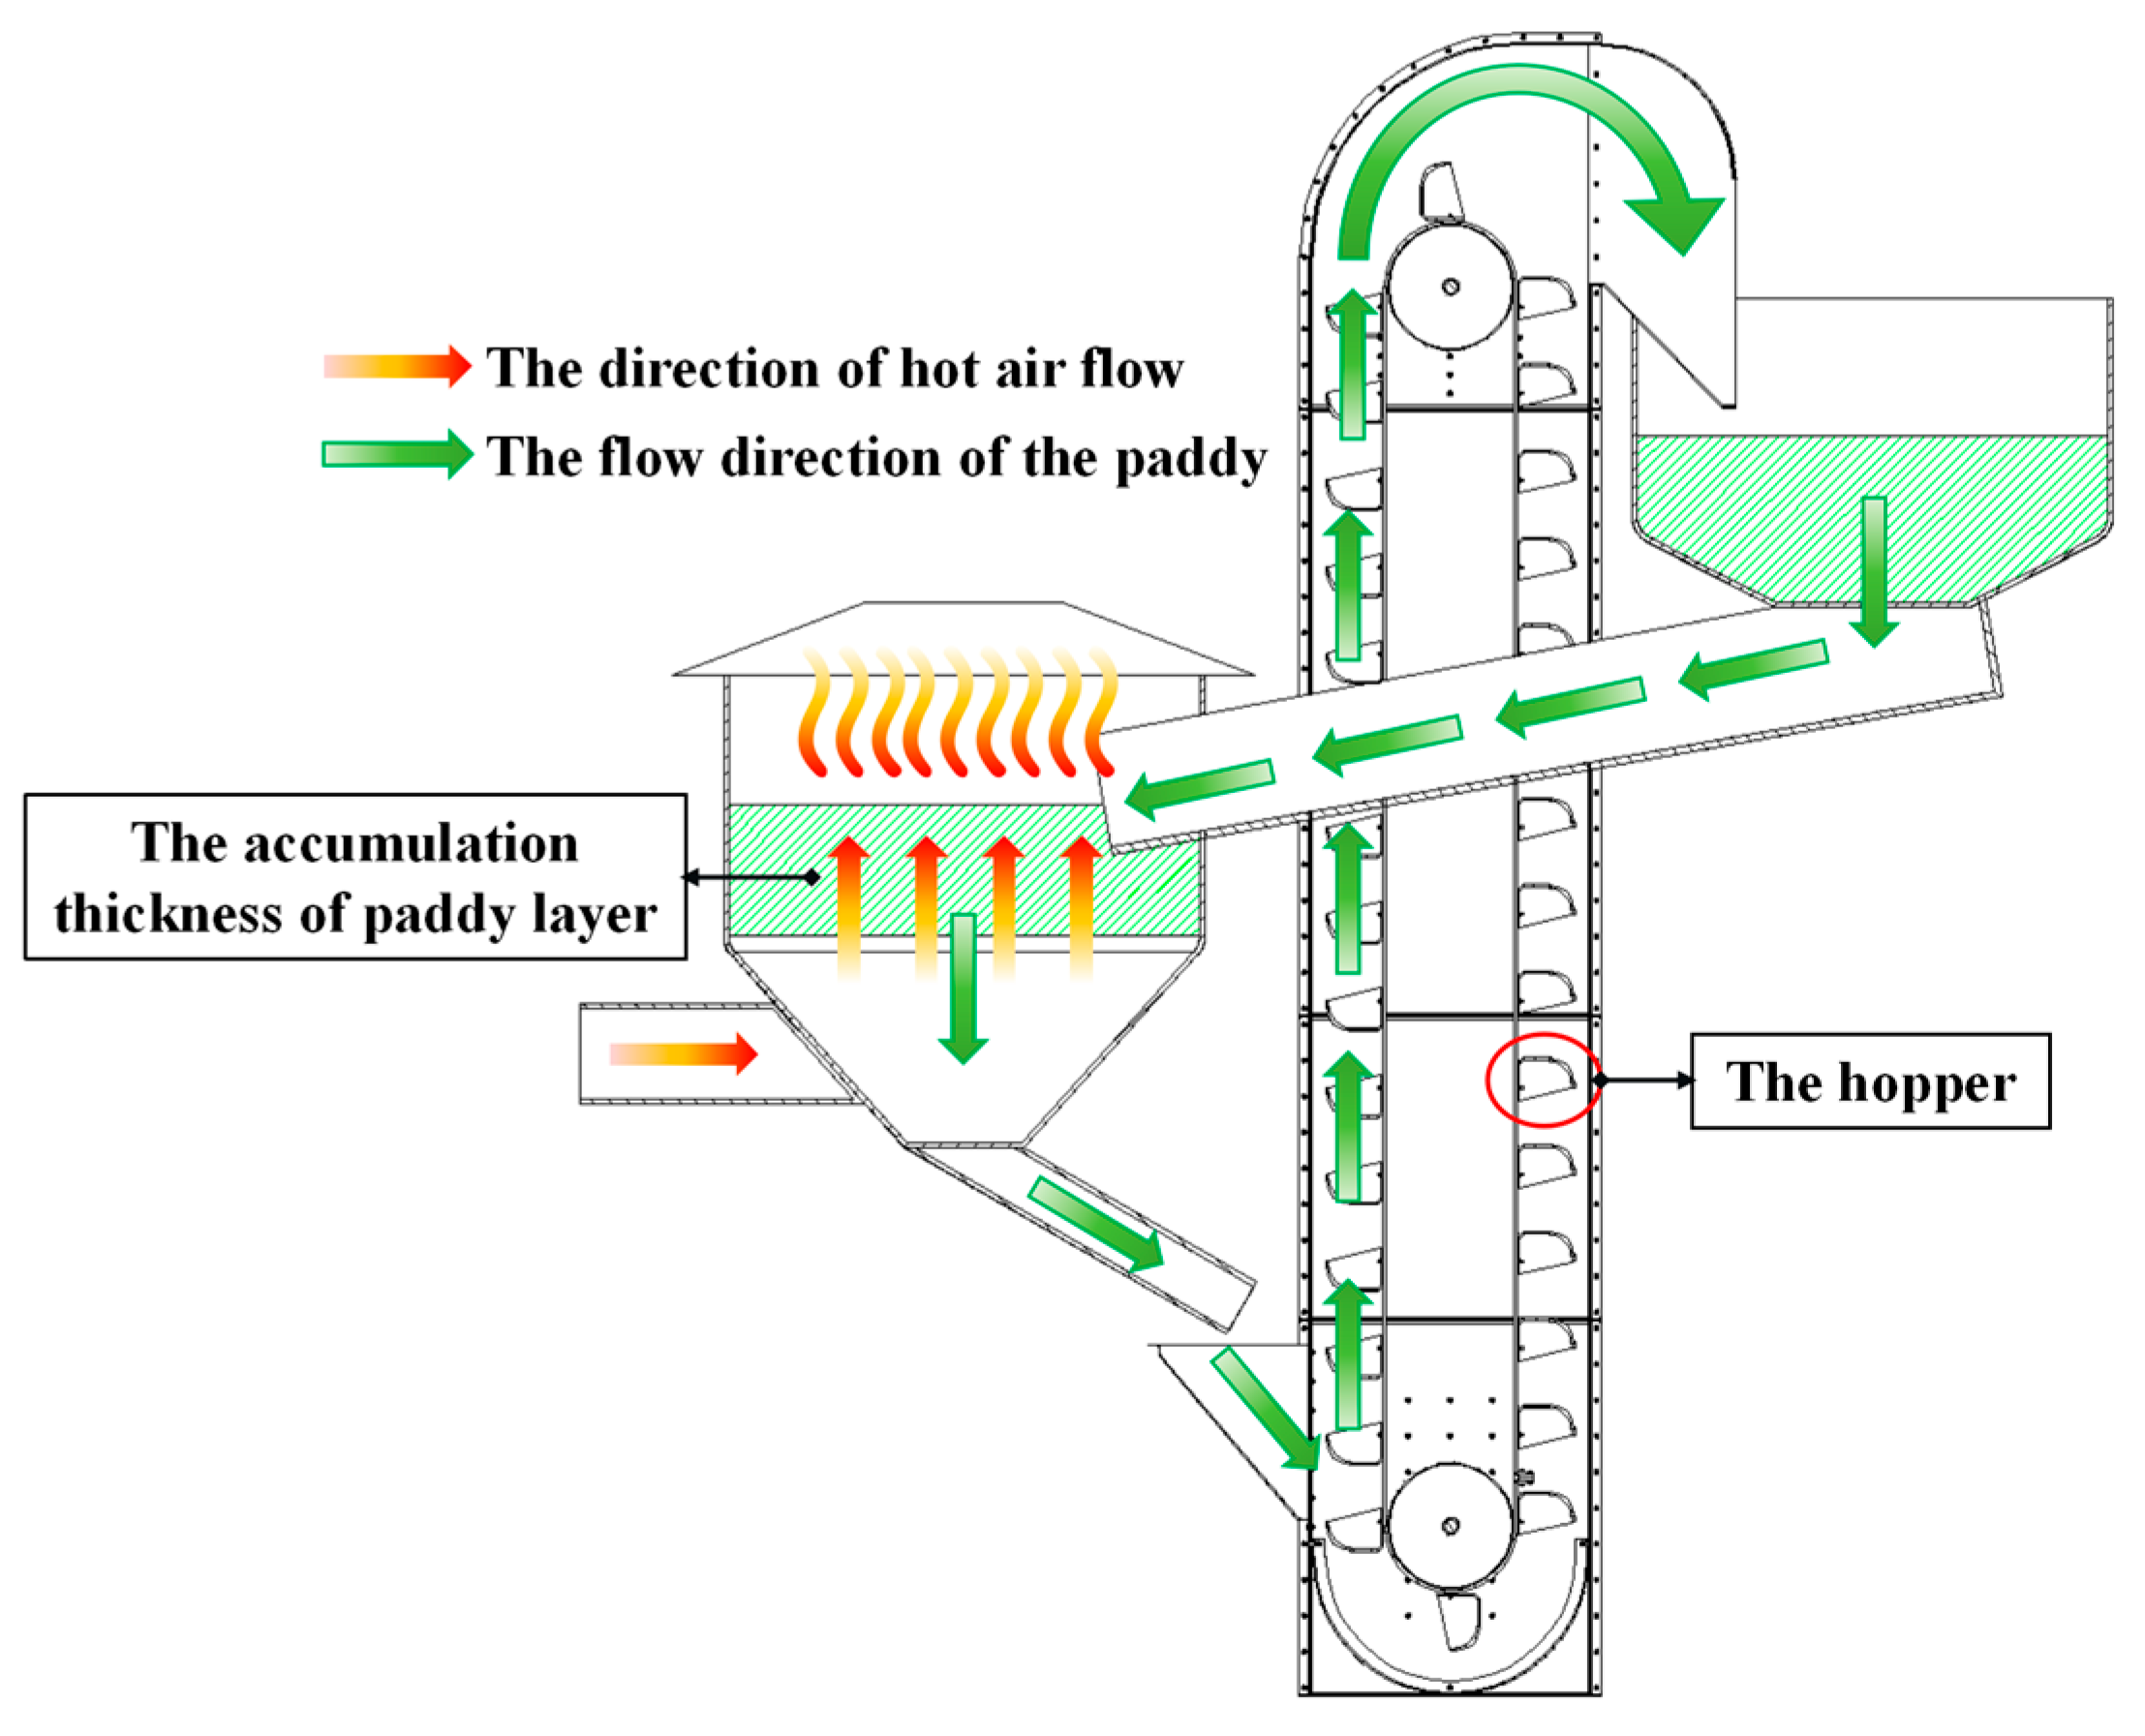
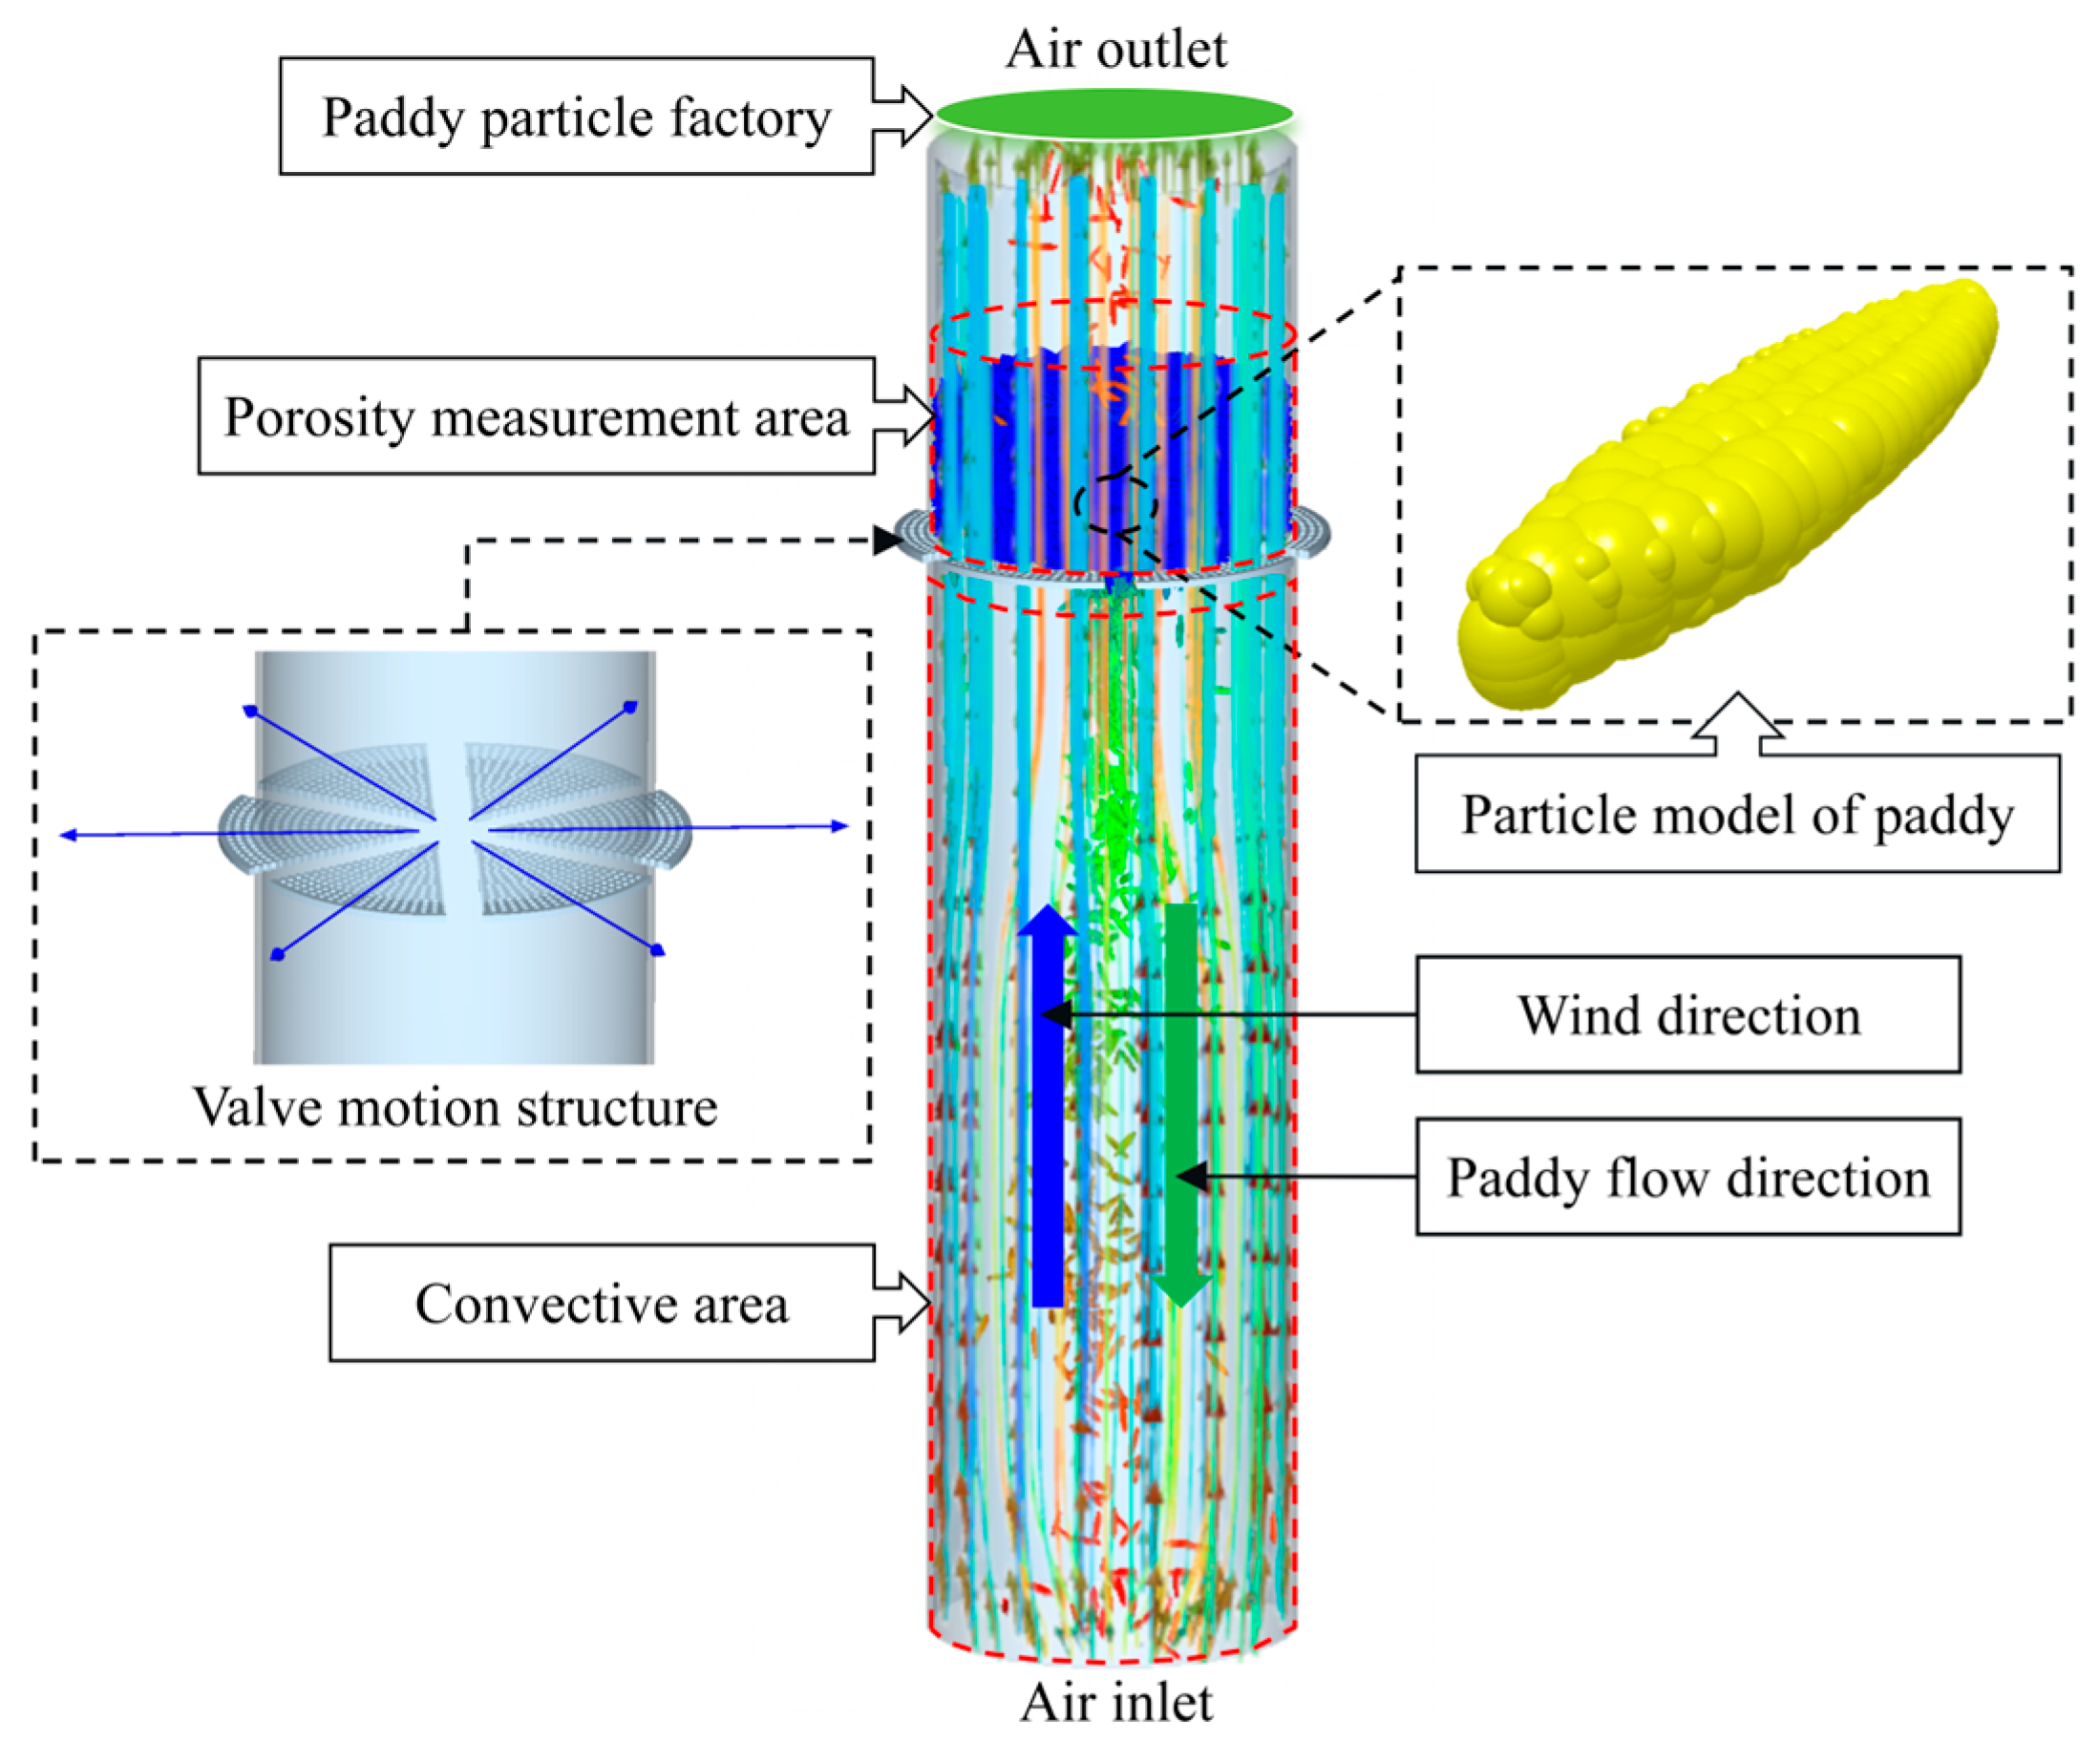
In the actual paddy drying process, circulating drying equipment is frequently employed, as depicted in
Figure 4. This type of equipment combines the functions of feeding and discharging materials. It utilizes a hoist to transfer the bottom layer of paddy within the drying chamber to the top layer, maintaining the paddy in a continuous flow state and ensuring uniformity in the drying layer thickness. Consequently, when conducting simulation modeling to measure the porosity of the paddy layer, it is necessary to establish a paddy particle generation device above the paddy layer. Continuous replenishment of paddy particles to the porosity measurement layer ensures a high degree of consistency between the simulation and the actual paddy drying process.
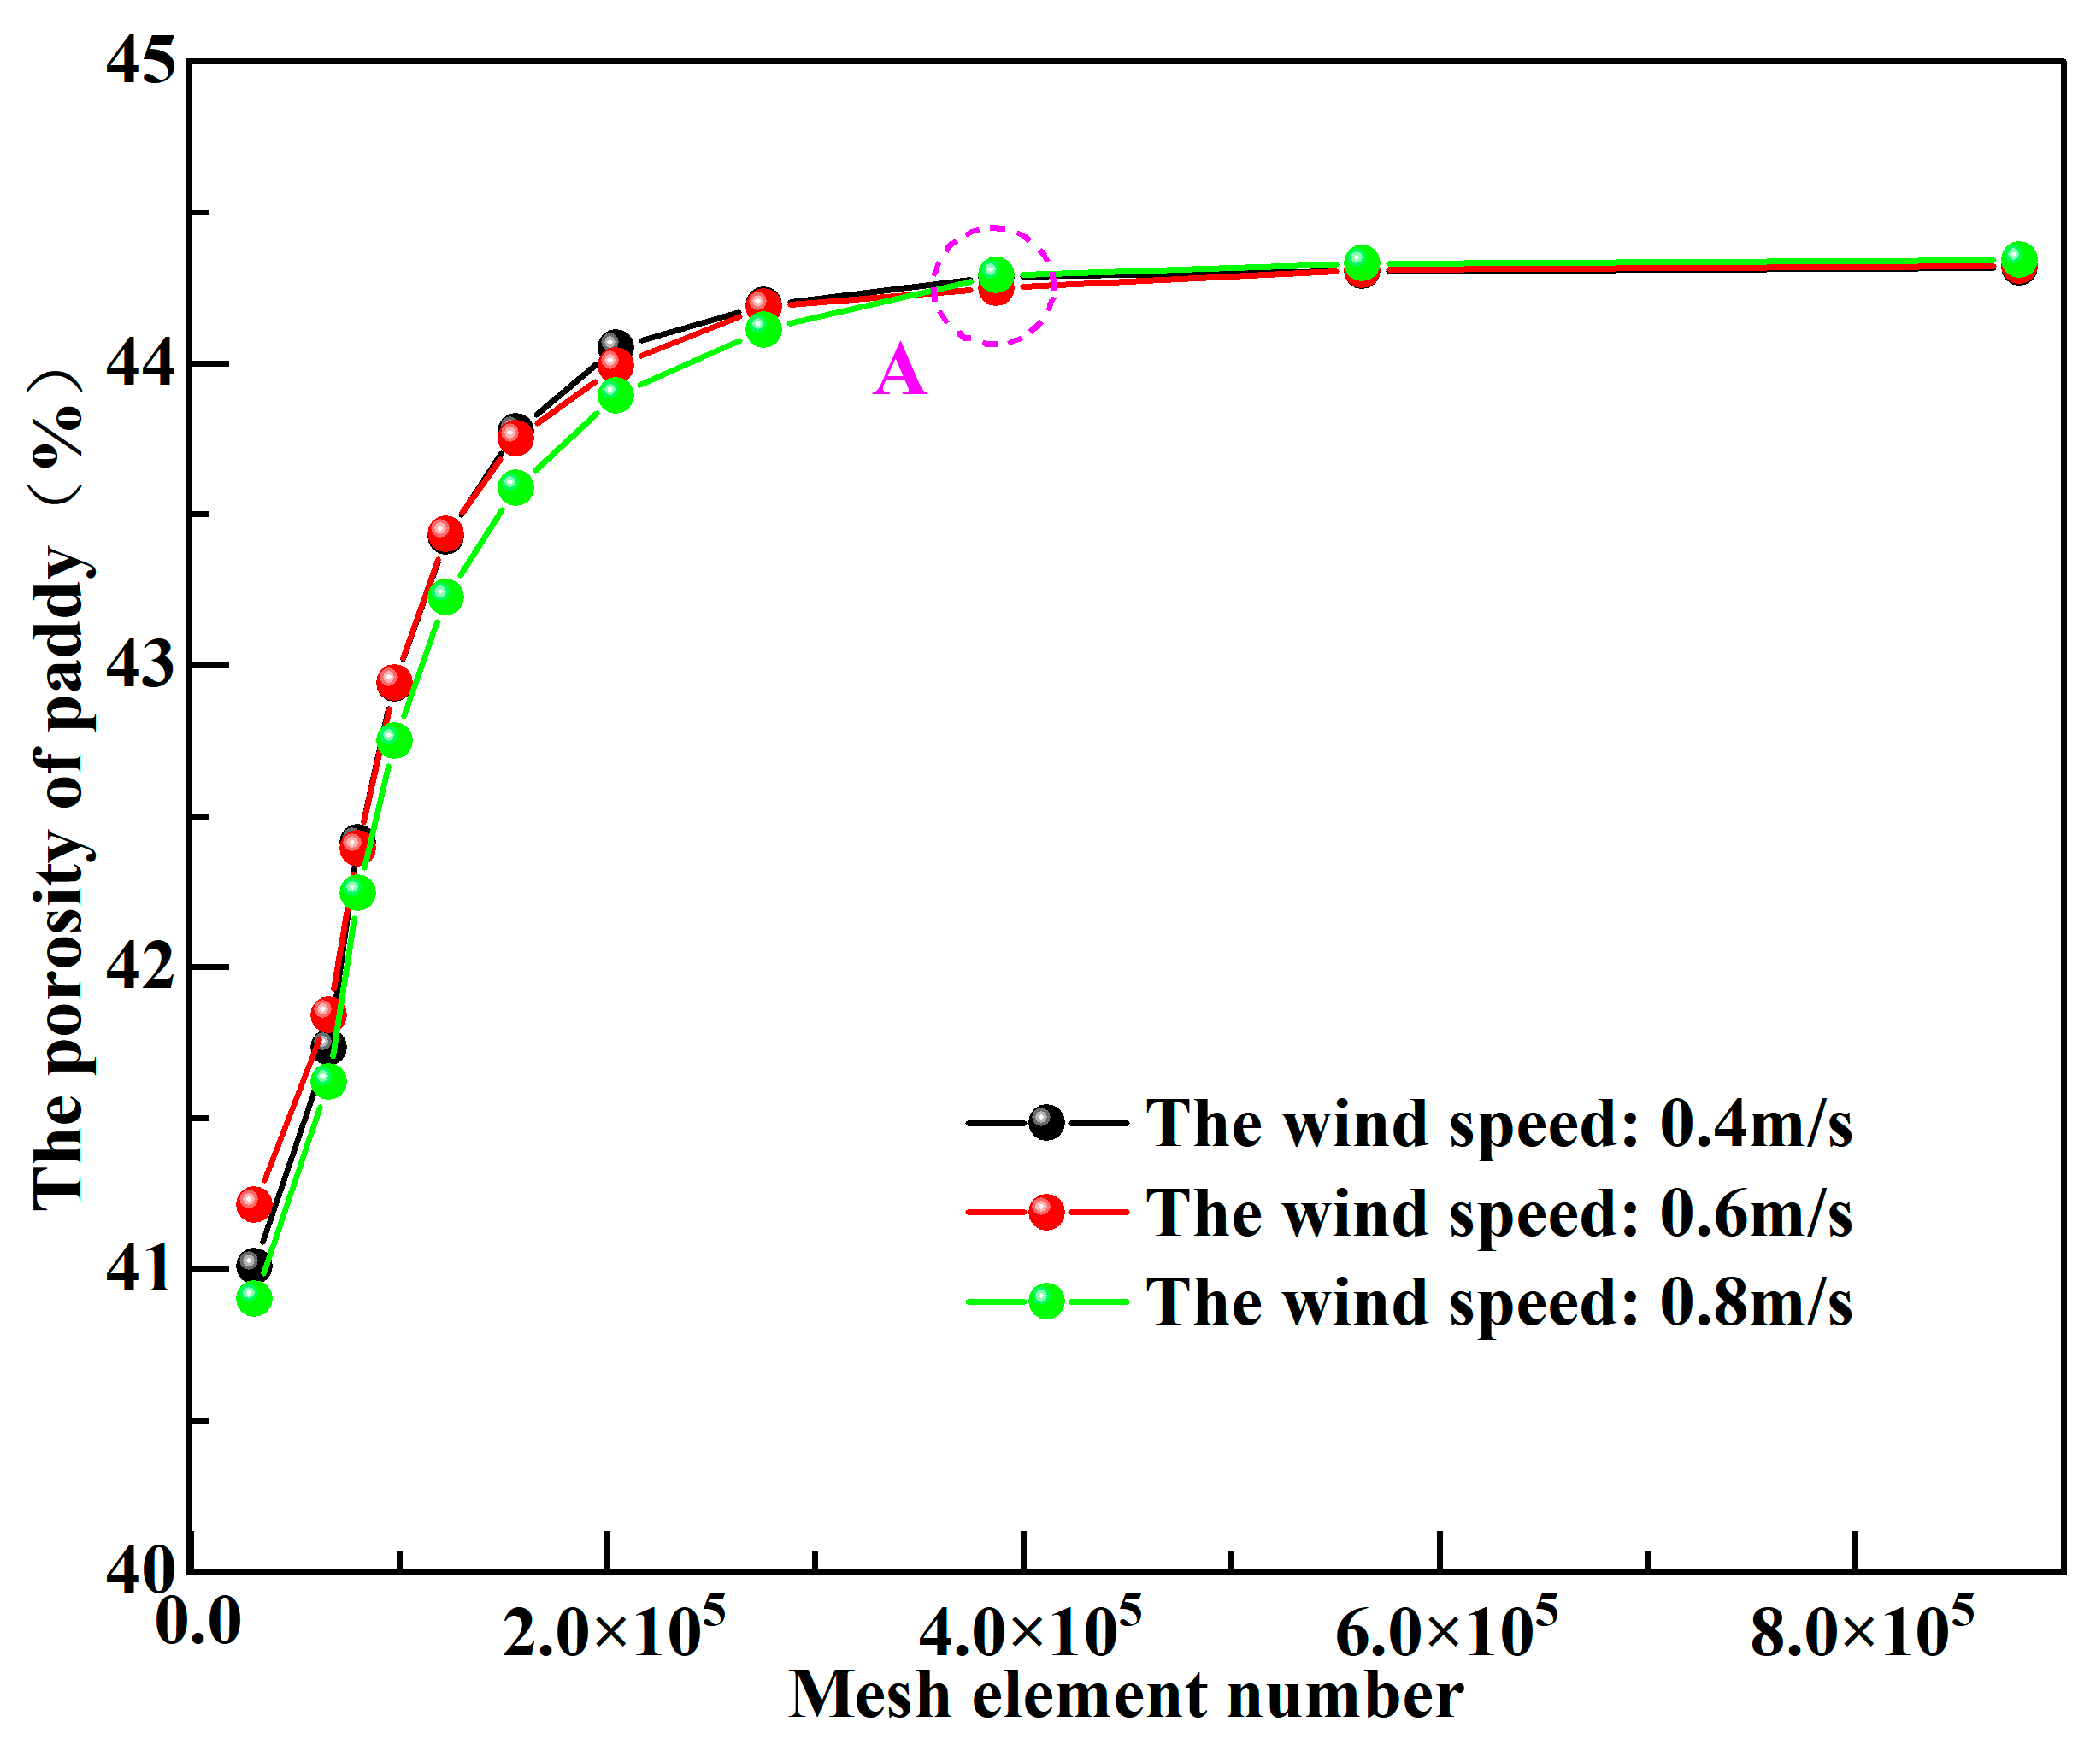
The quality of the mesh structure has a decisive impact on the accuracy of numerical simulation. Its evaluation can be based on indicators such as skewness and result stability, aiming to determine the optimal mesh structure in the simulation model and ensure the accuracy and stability of the simulated porosity values. As shown in
Figure 5, the results of the mesh independence analysis of the model structure are presented. It can be observed that after point A, the simulated porosity values of each state tend to stabilize. Therefore, the grid structure at point A is selected for simulation. The relevant evaluation values are detailed in
Table 4.
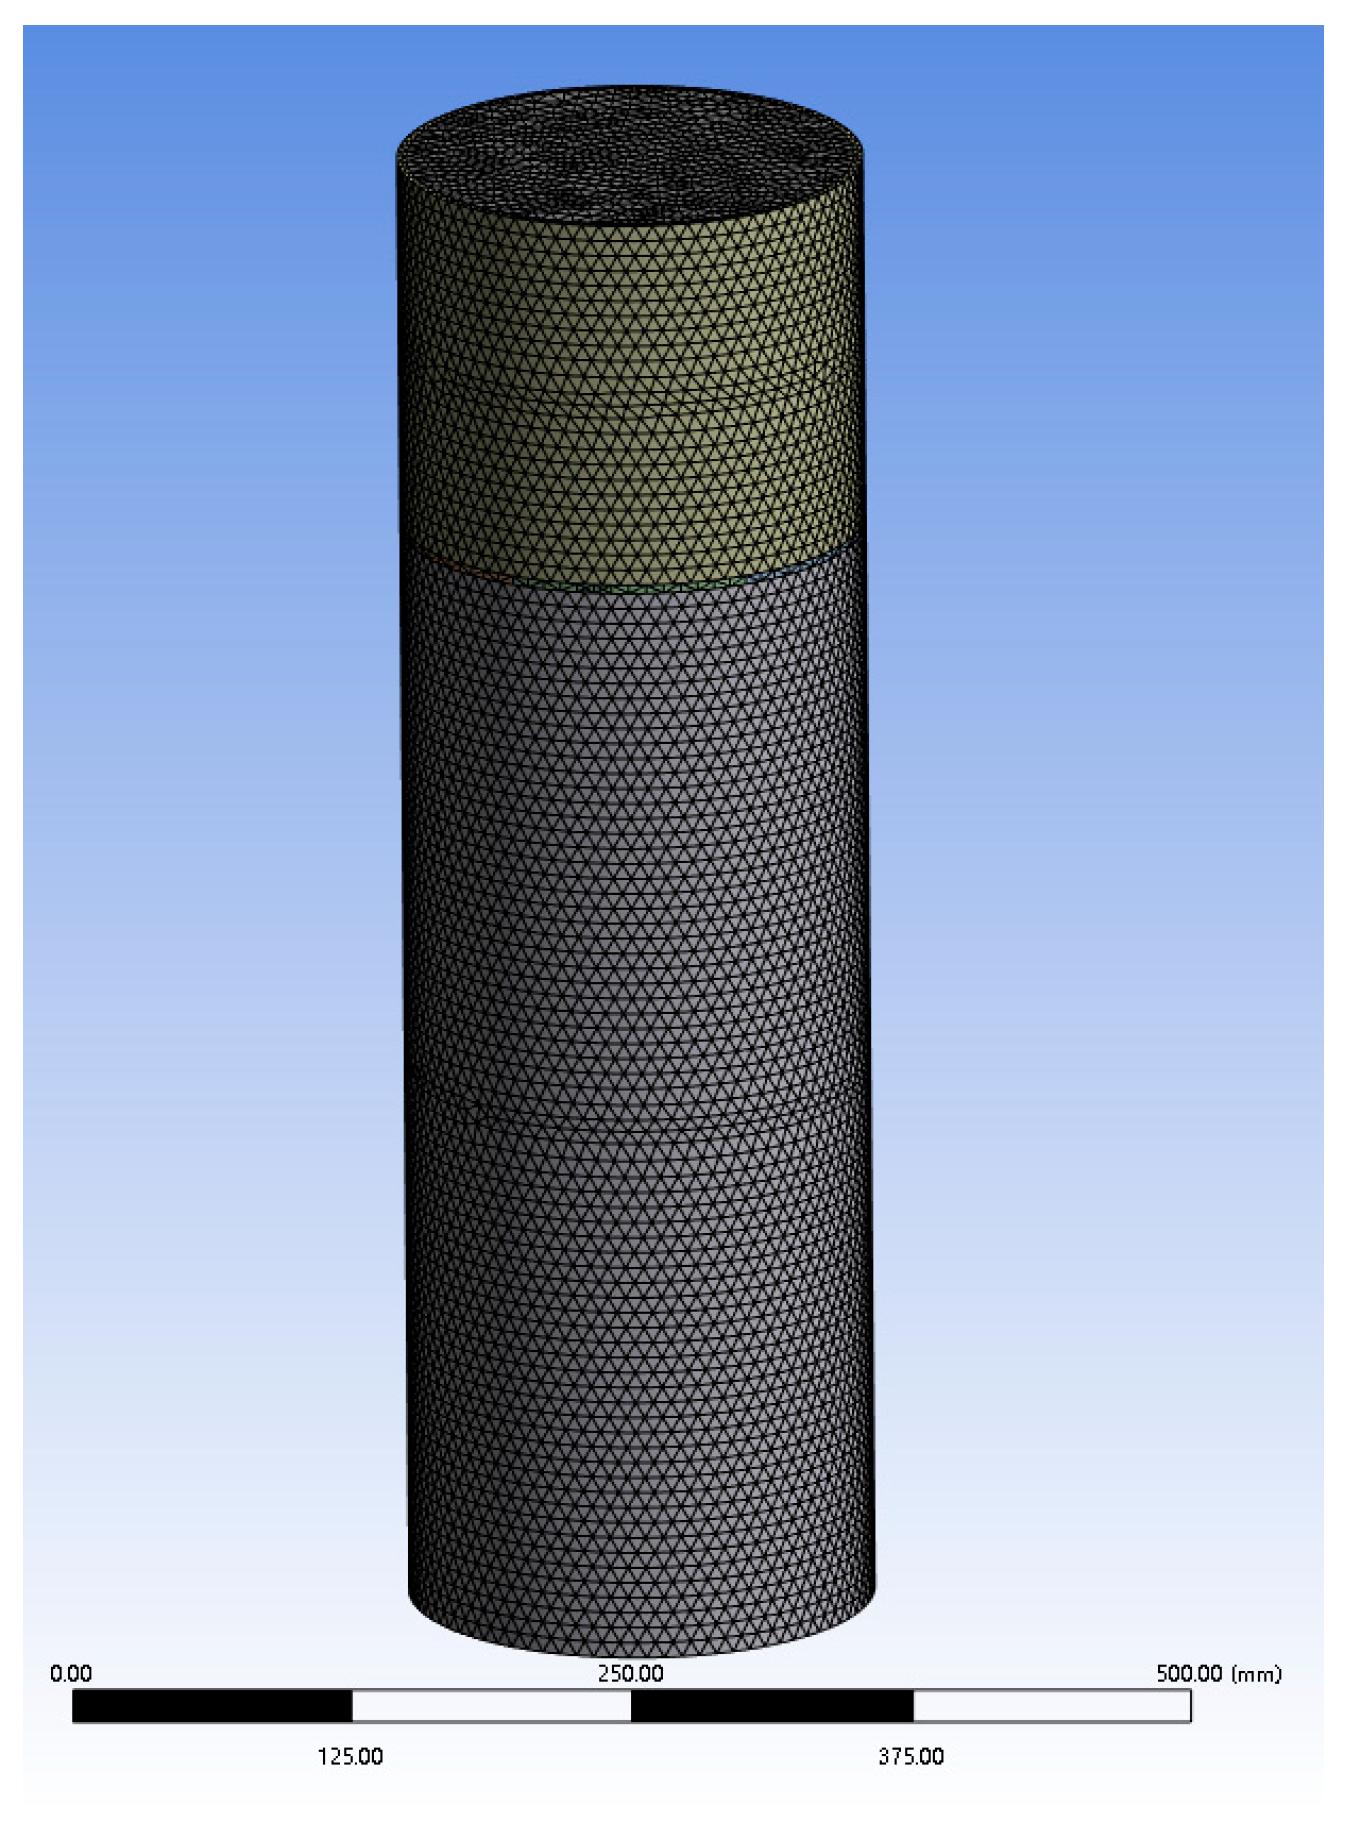
In order to reduce the amount of computer calculation, the porosity measuring instrument was simplified in the simulation process and imported into Fluent software (2023 R1 Version) for grid division, as shown in
Figure 6. Most of the ventilation pipes of paddy drying equipment adopt industrial pipes and are in the environment of wind field flow (
Re > 4000). In order to simulate the variation characteristics of paddy porosity in the ventilation environment of the actual paddy drying process, this paper uses k-epsilon model in ANSYS (2023 R1 Version) Fluent software. In the discrete element simulation software program EDEM, the three-dimensional model of paddy is imported and filled with spherical particles to form a paddy particle model. This paddy model can highly restore the appearance characteristics of real paddy in morphology, thus reducing the experimental error. The parameters related to the simulation model are shown in
Table 5. A particle generation module is constructed in EDEM software, and several paddy particle models are generated to form a certain stacking thickness. The flow velocity of the paddy model is controlled by adjusting the opening of the valve (in EDEM software, it is controlled through the valve motion structure). In the simulation model, the airflow passes through the convective area from the bottom (the paddy moves down, the airflow moves up), flows through the valve, flows into the paddy layer in the porosity measurement area, and then flows out from the top of the paddy layer. The paddy porosity measurement simulation model is shown in
Figure 7. In the simulation process, in order to keep the accumulation thickness of paddy layer constant, it is necessary to continuously add paddy particles into the paddy porosity measurement layer to ensure the consistency of the simulation process and the actual paddy drying process.
2.5.2. Variation Characteristics of Paddy Velocity in Paddy Porosity Simulation Measurement Layer
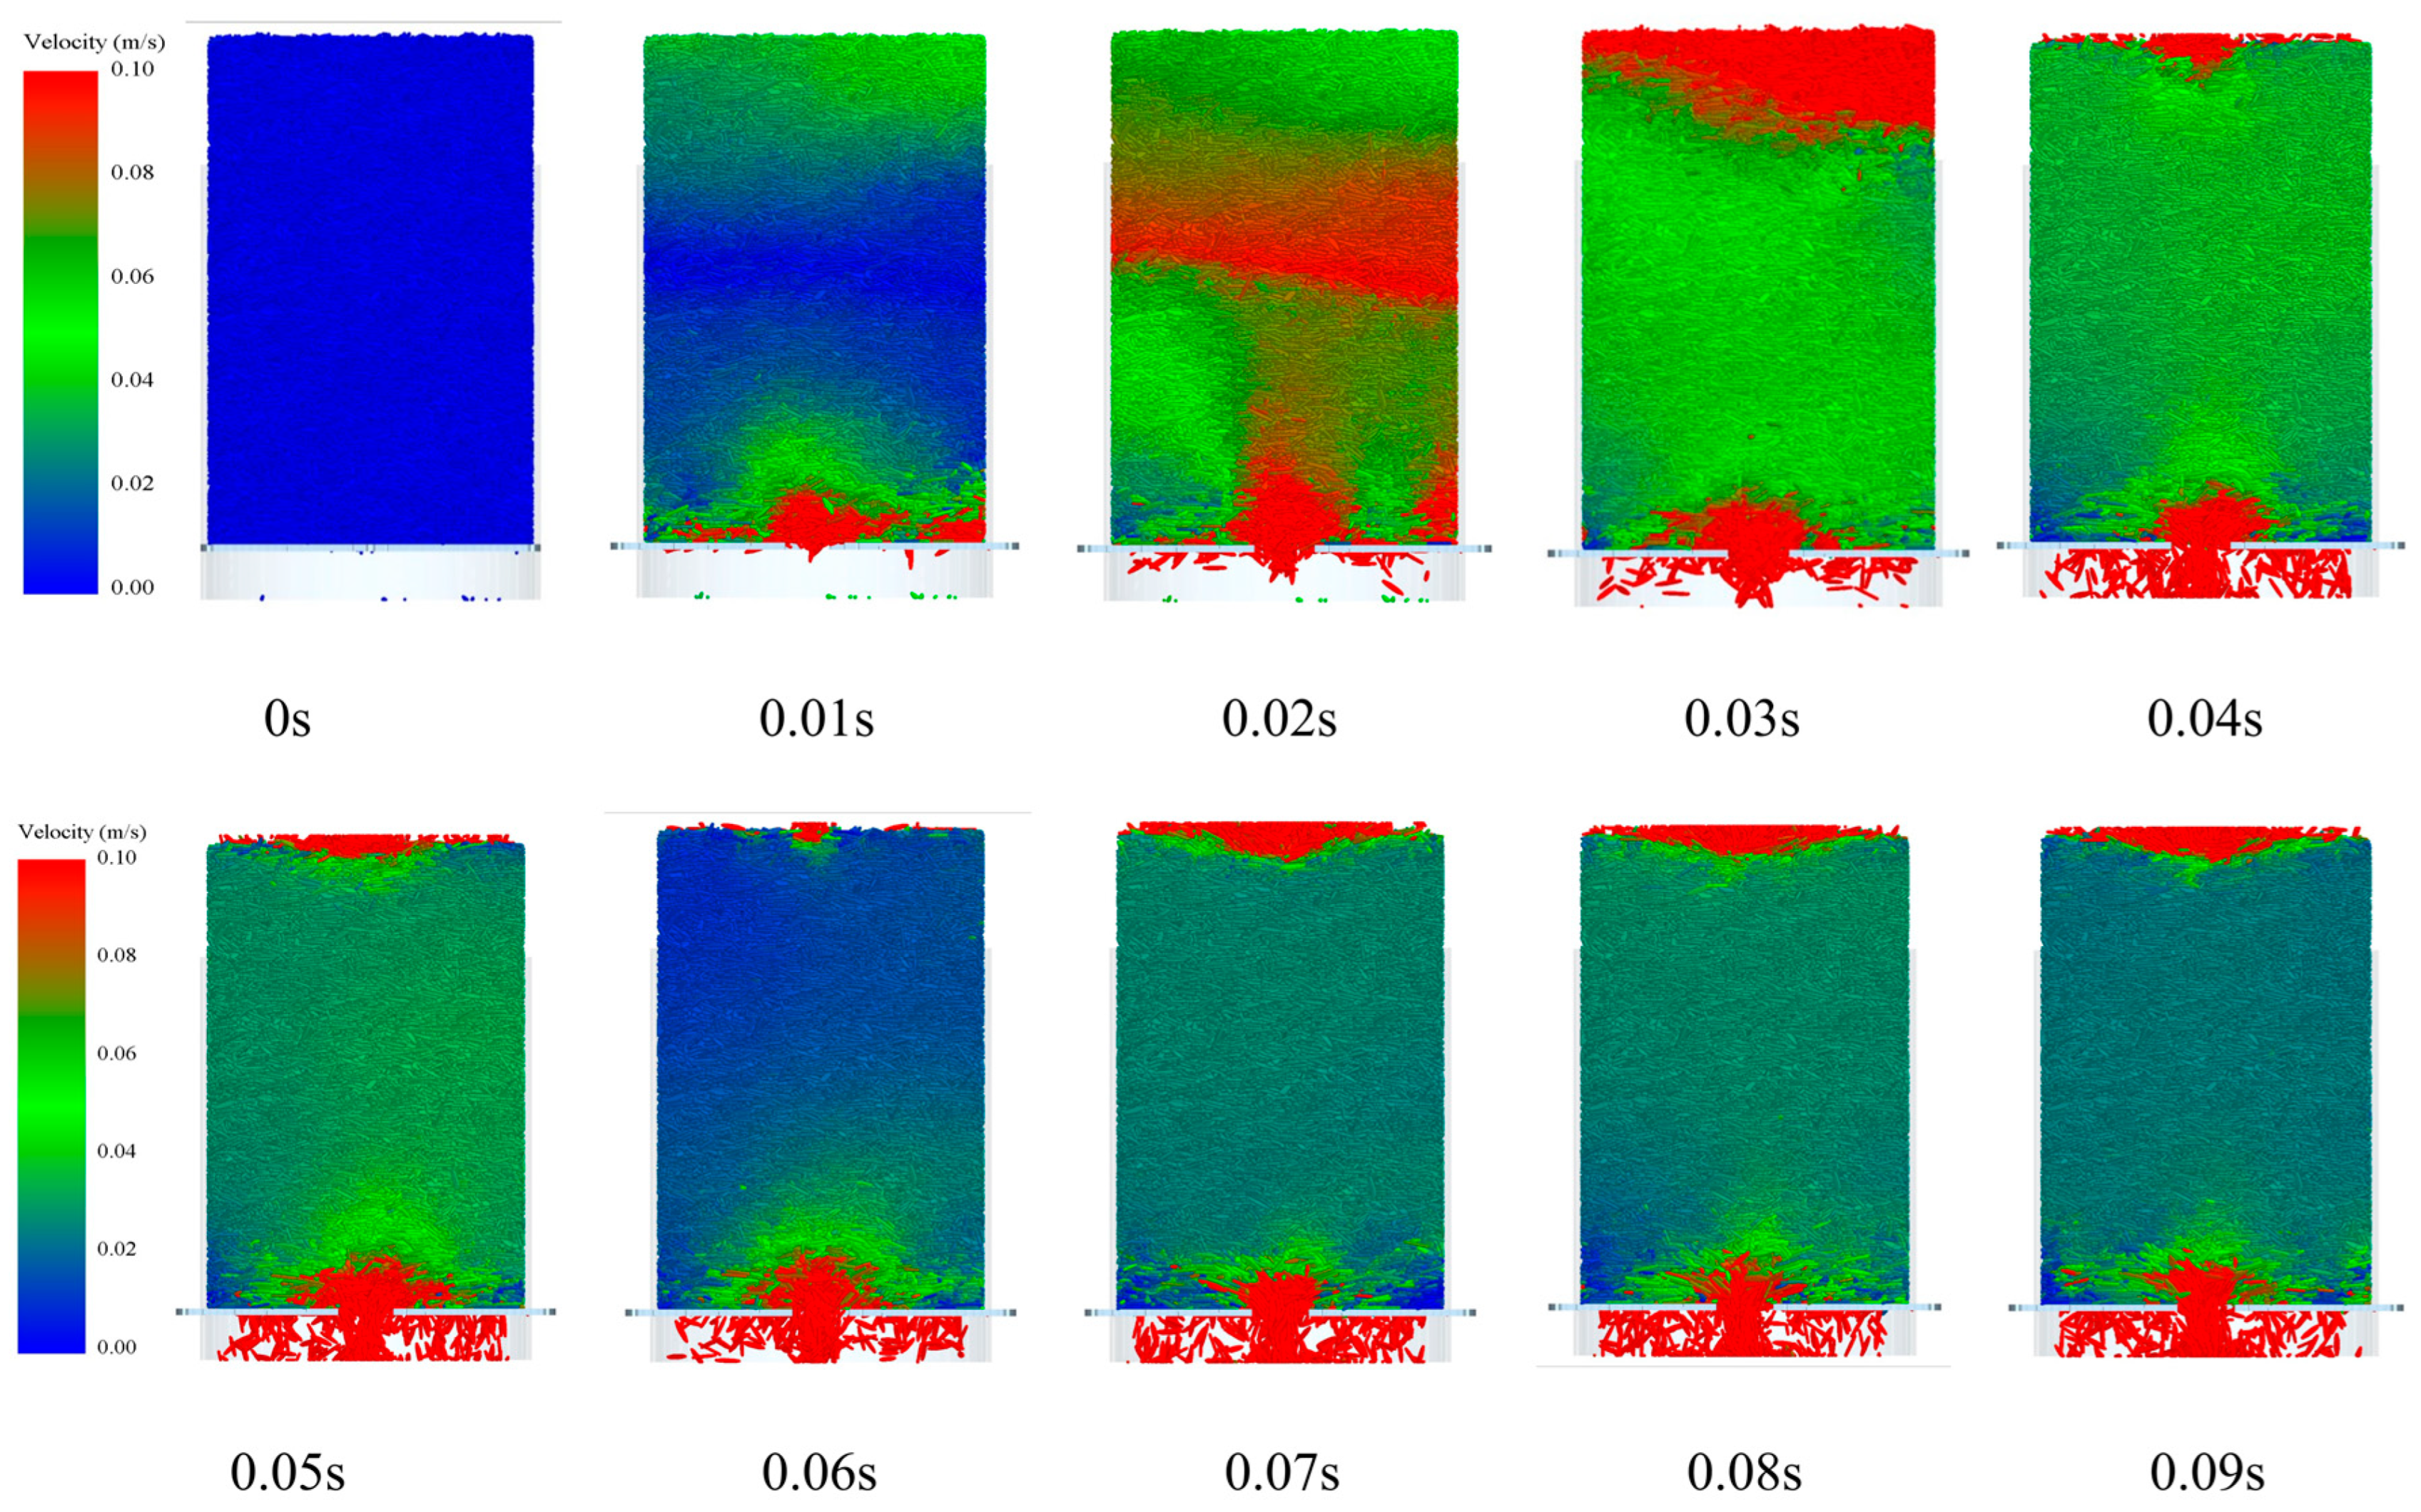
In investigate the state of play of the paddy in the paddy porosity layer from unstable to stable, EDEM–Fluent coupled simulation simulates this process as shown in
Figure 8. The 0–0.01 s process is the opening process of the valve. The figure shows that the motion status of the lowest layer of paddy particles in direct contact with the ventilator valve is most frequently changed. During the period 0.02–0.03 s, the maximum velocity of the paddy porosity measurement layer is gradually carried from the bottom to the top, resulting in the phenomenon of ‘collapse’ (the paddy sank rapidly). At 0.04 s, the paddy particulate model is added to the top of the paddy porosity measurement layer to ensure that the total accumulation thickness is not altered. During the period 0.04 s to 0.06 s, the movement velocity of the paddy particles in the paddy porosity measurement layer is high, but starts to decrease when it reaches 0.06 s. At this time, the filling density of the paddy particles in the paddy porosity measurement layer is usually stable and the paddy particle motion velocity is stable after 0.07 s. Therefore, in order to determine the true porosity, it is necessary to ensure that the whole system is running until the rate of the paddy porosity measurement layer reaches a steady state. Only then can the relevant data be extracted and the true porosity of the paddy calculated, ensuring the correctness of the experimental results.
2.6. Experimental Scheme
For the determination of the change in paddy porosity, a large number of literature reviews indicate that the main factors influencing the change in grain crop porosity are mainly moisture content, wind speed, temperature, thickness of the soil, type of material, etc. [
16]. After careful consideration, this paper mainly deals with the application of porosity to paddy in drying. Therefore, this paper selects four factors, namely, moisture content, wind speed, layer thickness, and paddy flow velocity, for the single-factor experiment to determine the change in porosity characteristics of the paddy under different conditions. The single-factor experimental scheme is shown in
Table 6. When the stacking thickness of paddy in the table is 10 cm, 15 cm, and 20 cm, the measuring chamber volume is 785 cm
3, 1177.5 cm
3, and 1570 cm
3, respectively.
Based on the above single-factor experiment design, the Box–Behnken experiment method was used in the Design Expert analysis software (Design-Expert 12) program to perform experiments on four factors: moisture content, wind speed, layer thickness, and paddy flow velocity. The response surface analysis was carried out with the porosity of the paddy measurement layer as the response value. The level of each factor and the coding value are shown in
Table 7.
2.7. EDEM–Fluent Coupling Simulation Analysis
According to the single factor experimental scheme in
Table 6, the effects of moisture content (
Mc), layer thickness (
L), paddy velocity (
vd), and wind velocity (
vw) on paddy porosity were studied by combining EDEM–Fluent coupled numerical simulation with measured porosity. The graph analysis based on the comparison between the simulated value and the measured value shows that as shown in
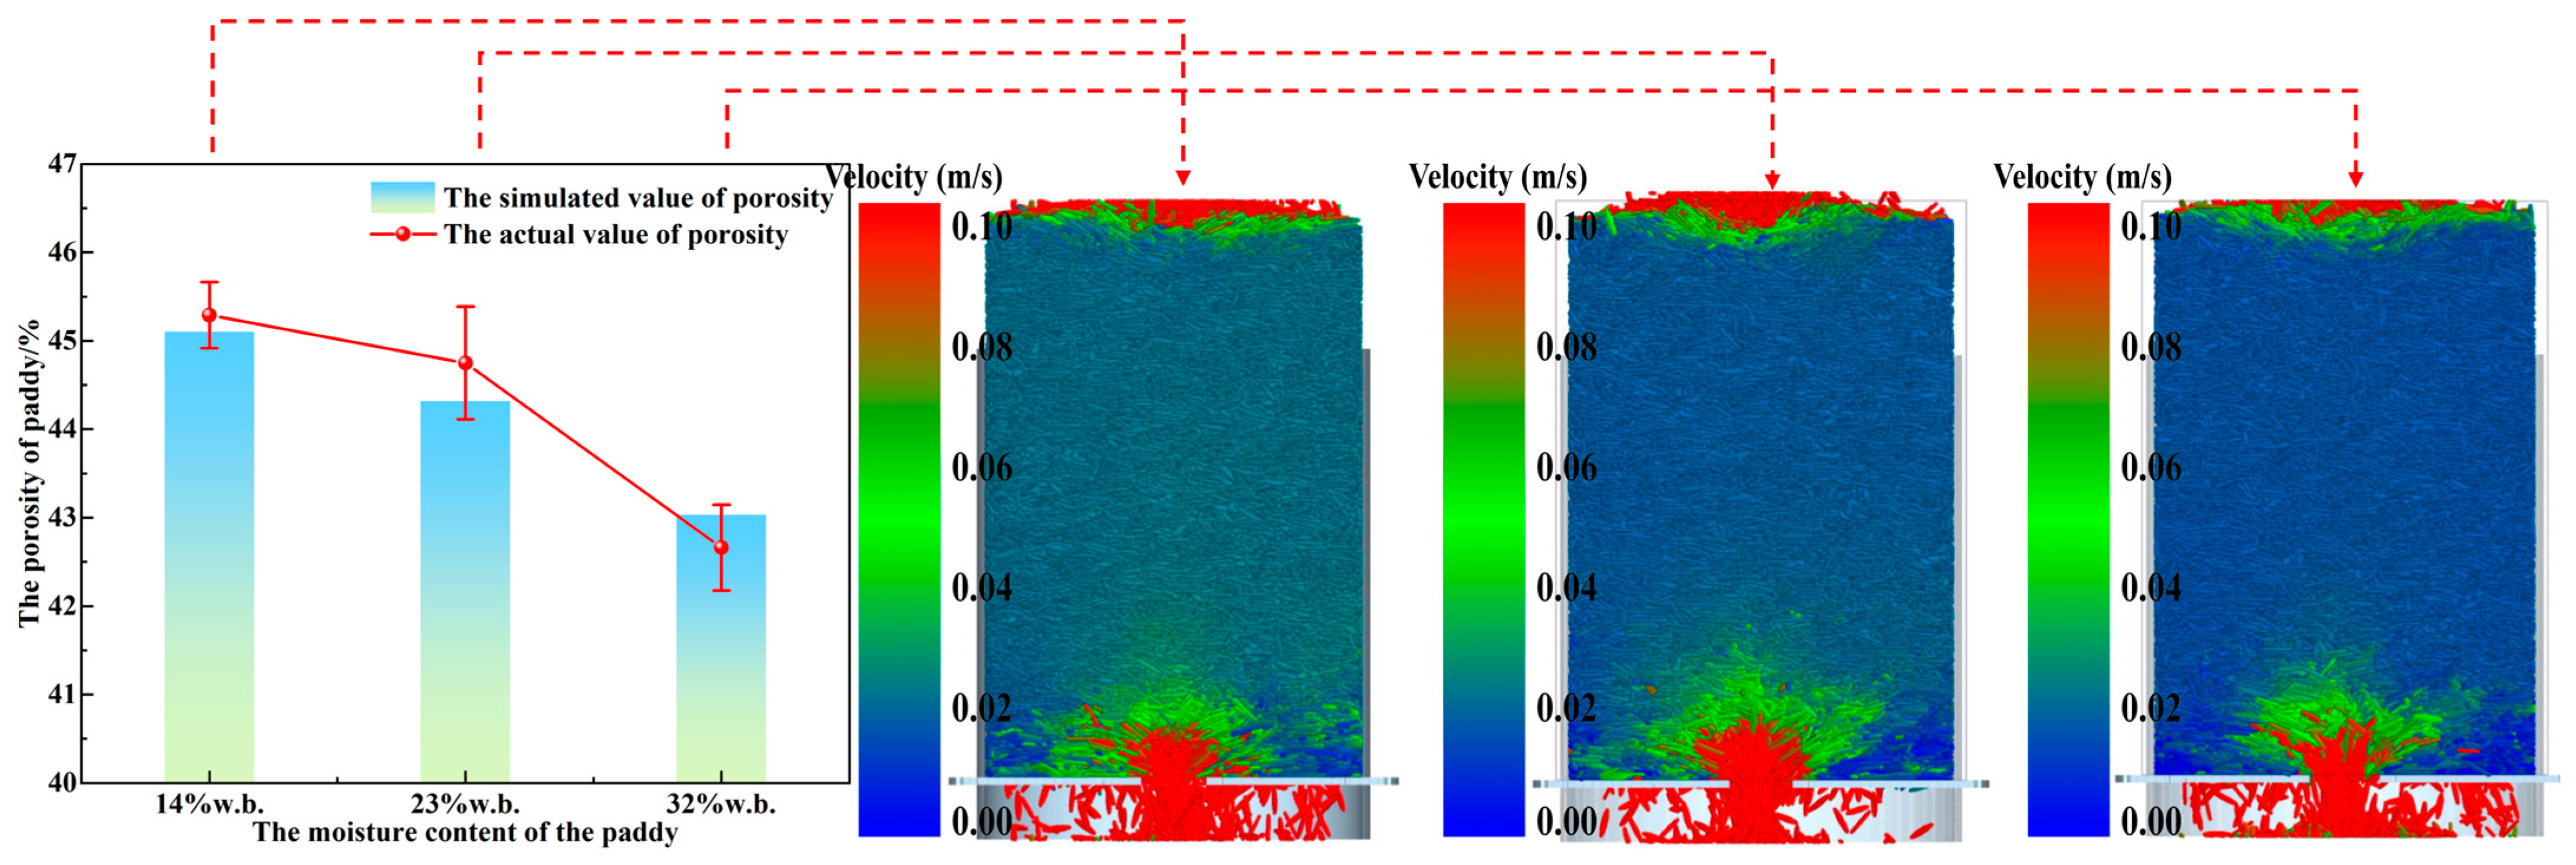
Figure 9, there is a significant negative correlation between porosity and moisture content (
Mc), which may be attributed to the effect of particle expansion caused by water.
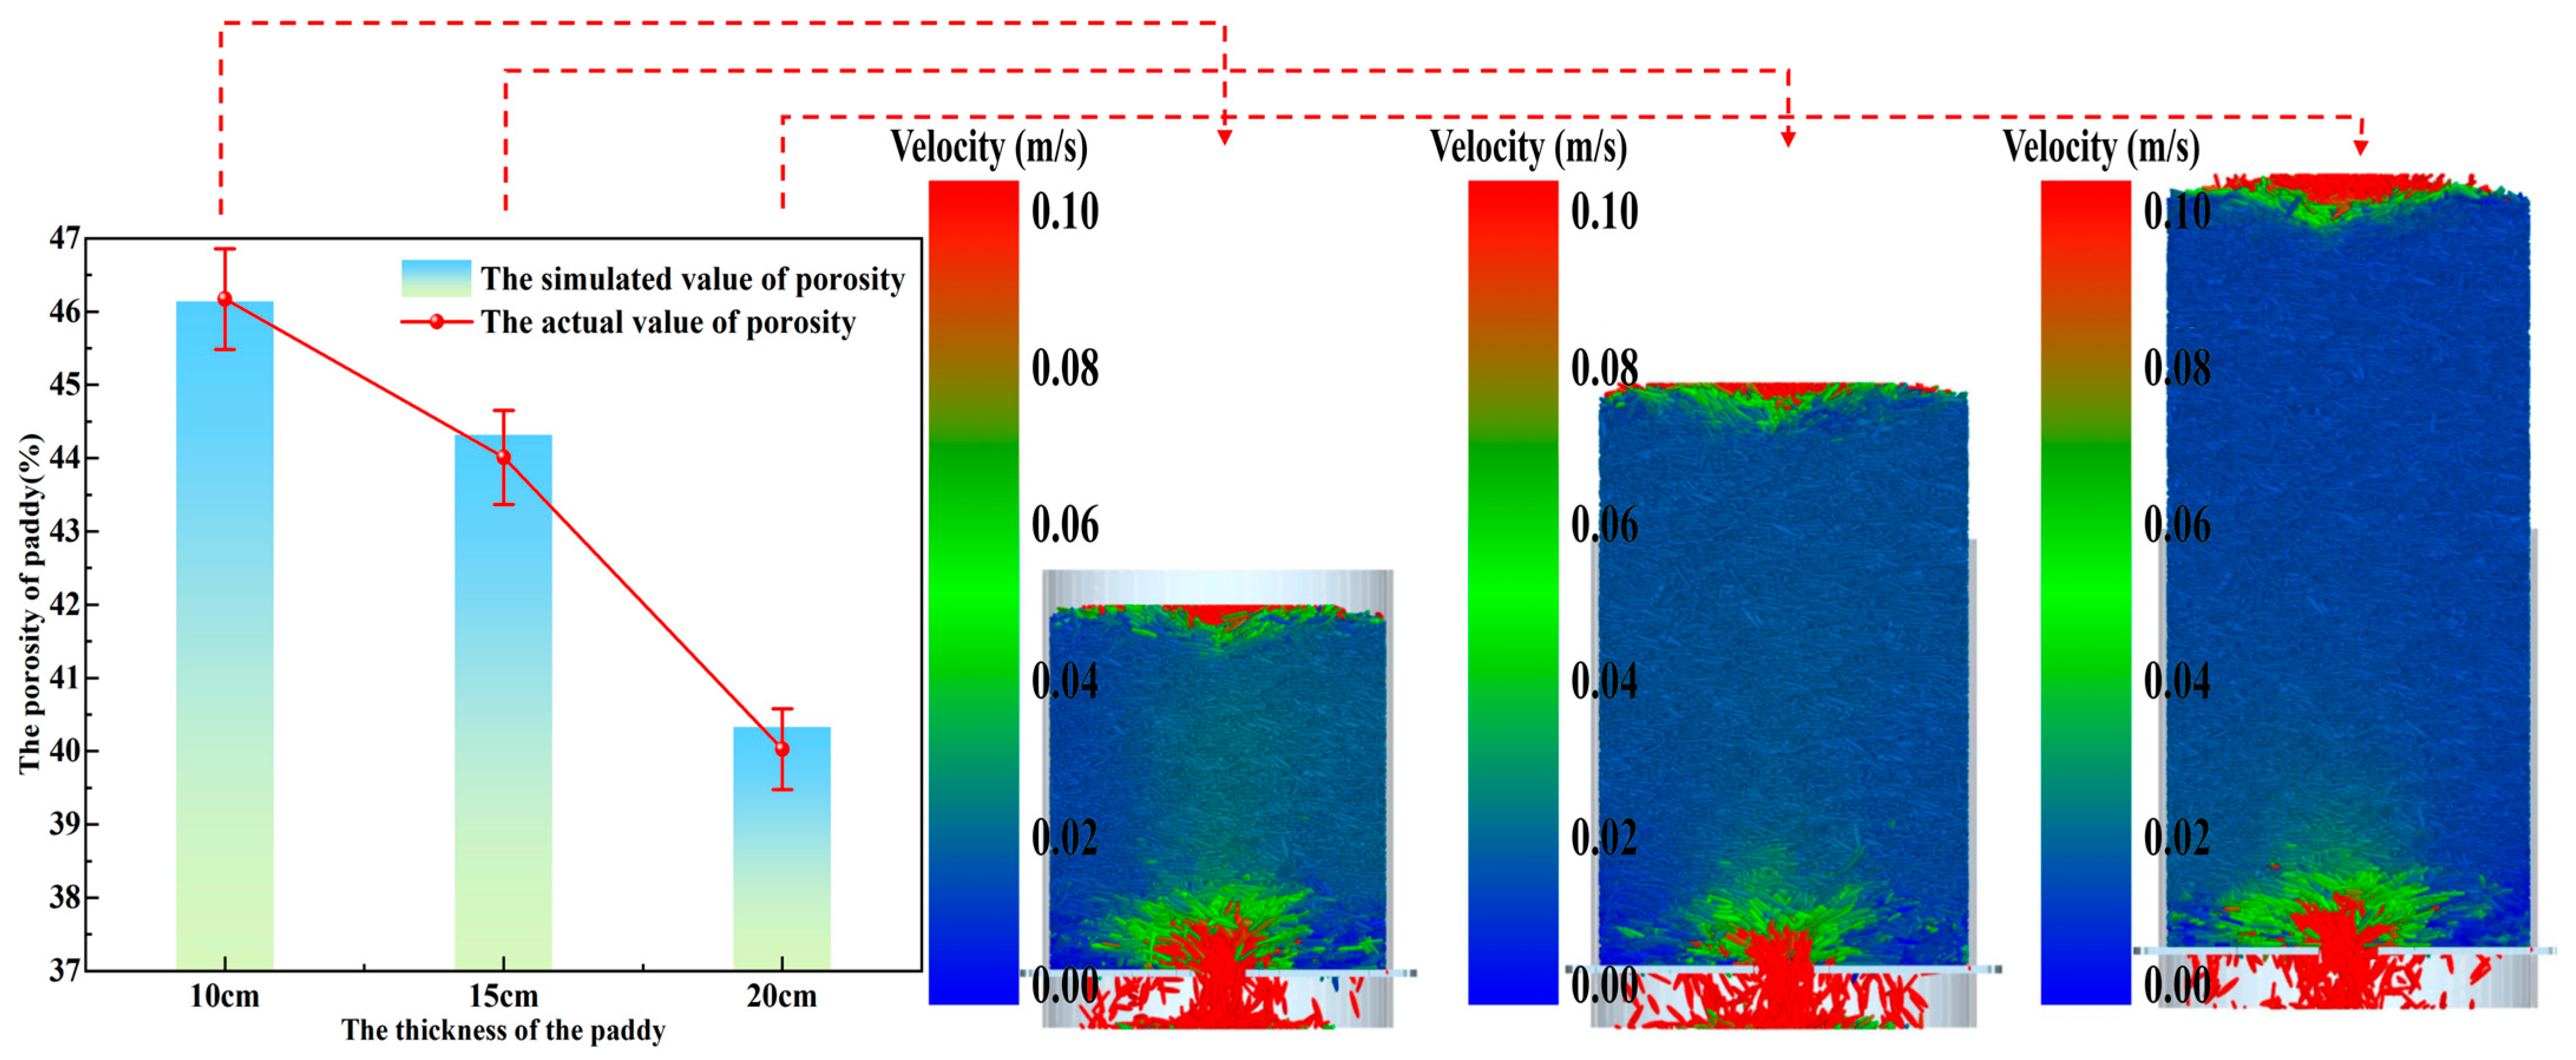
Figure 10 reveals that the increase in accumulation layer thickness (
L) aggravates the pore compression phenomenon.
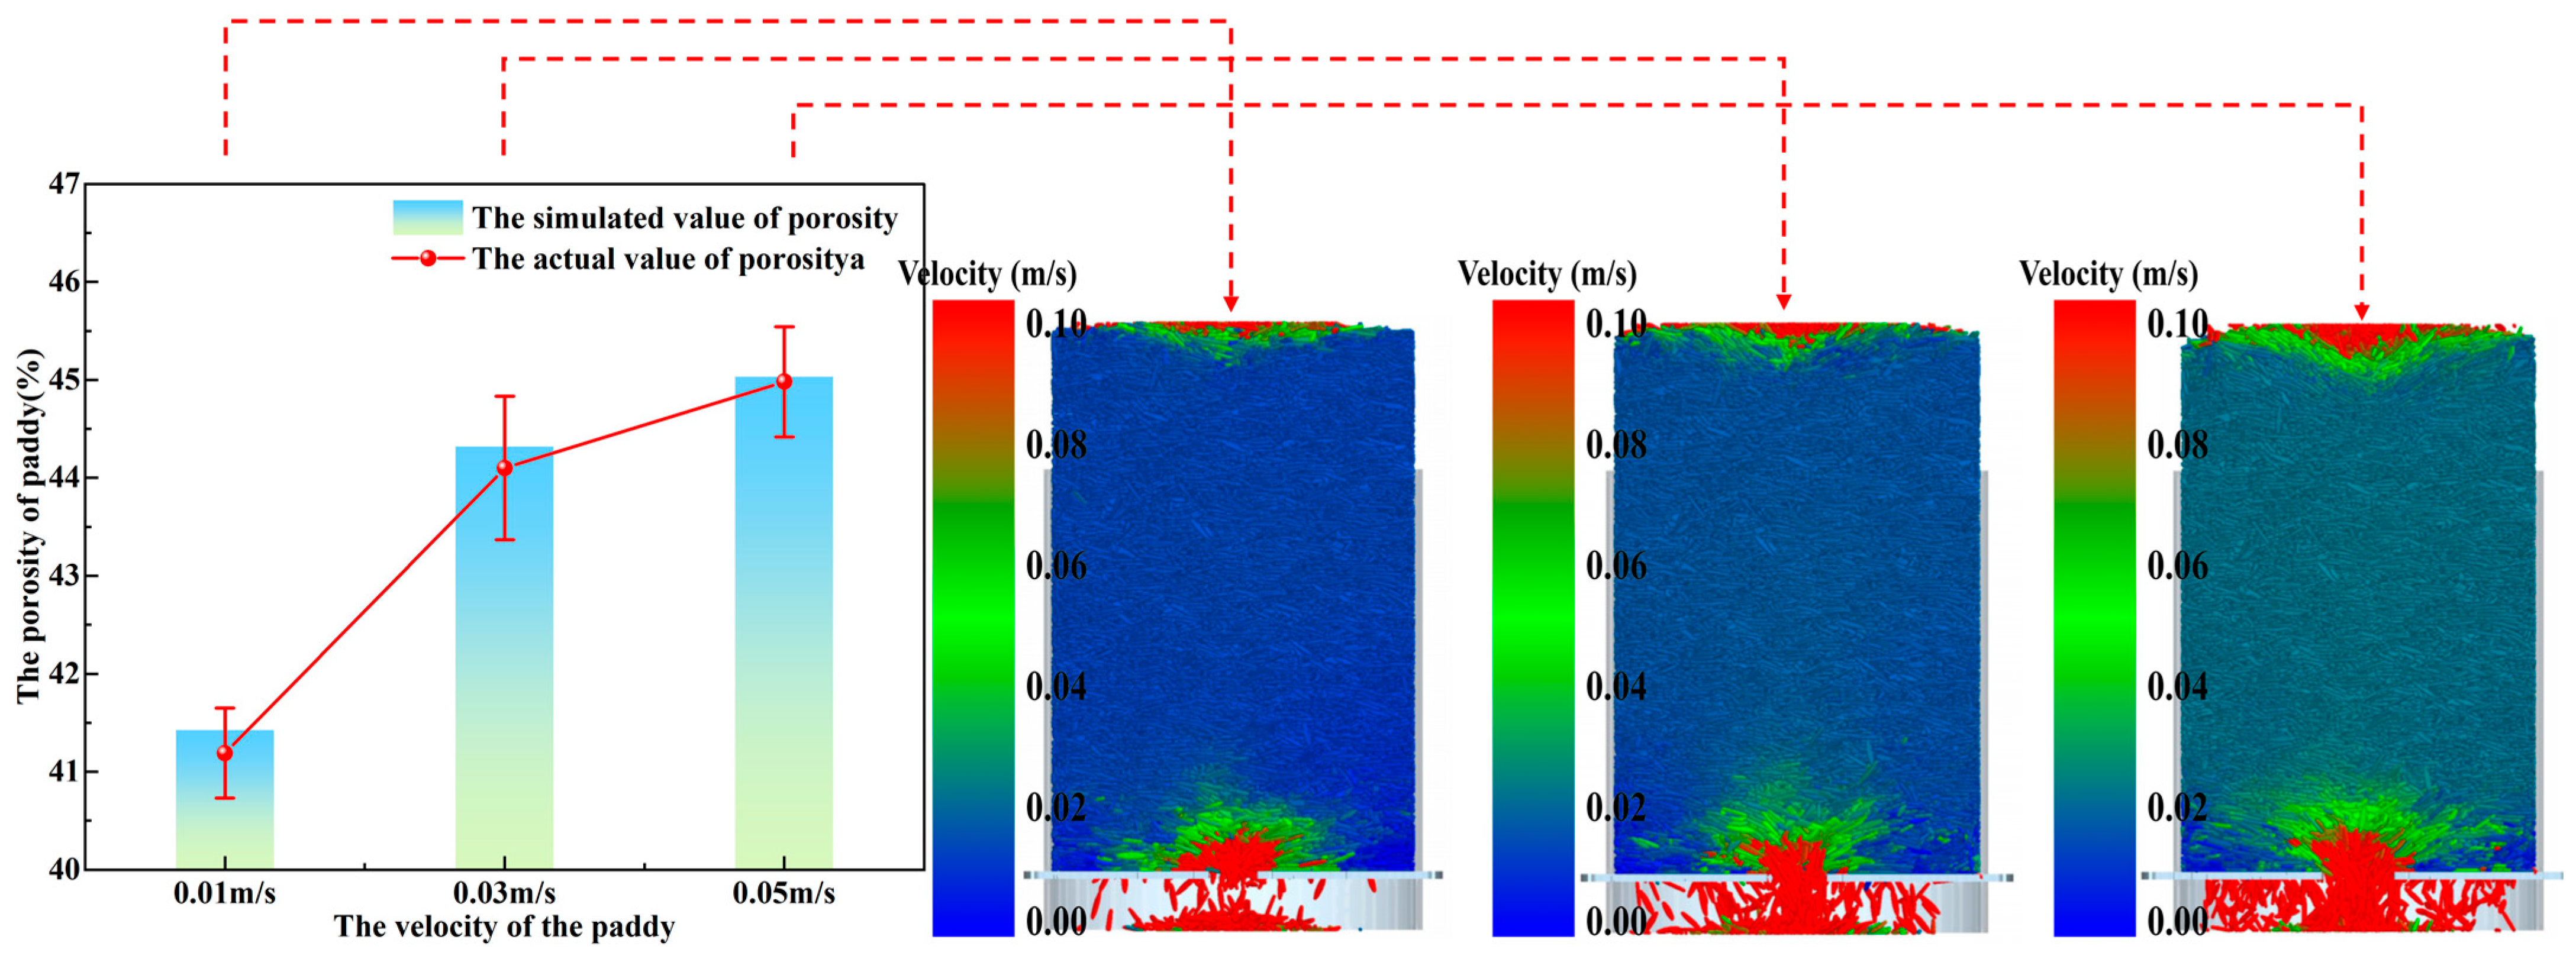
Figure 11 shows a significant positive correlation between paddy velocity (
vd) and porosity, which is related to the loose packing structure formed by high-speed flow. The data in
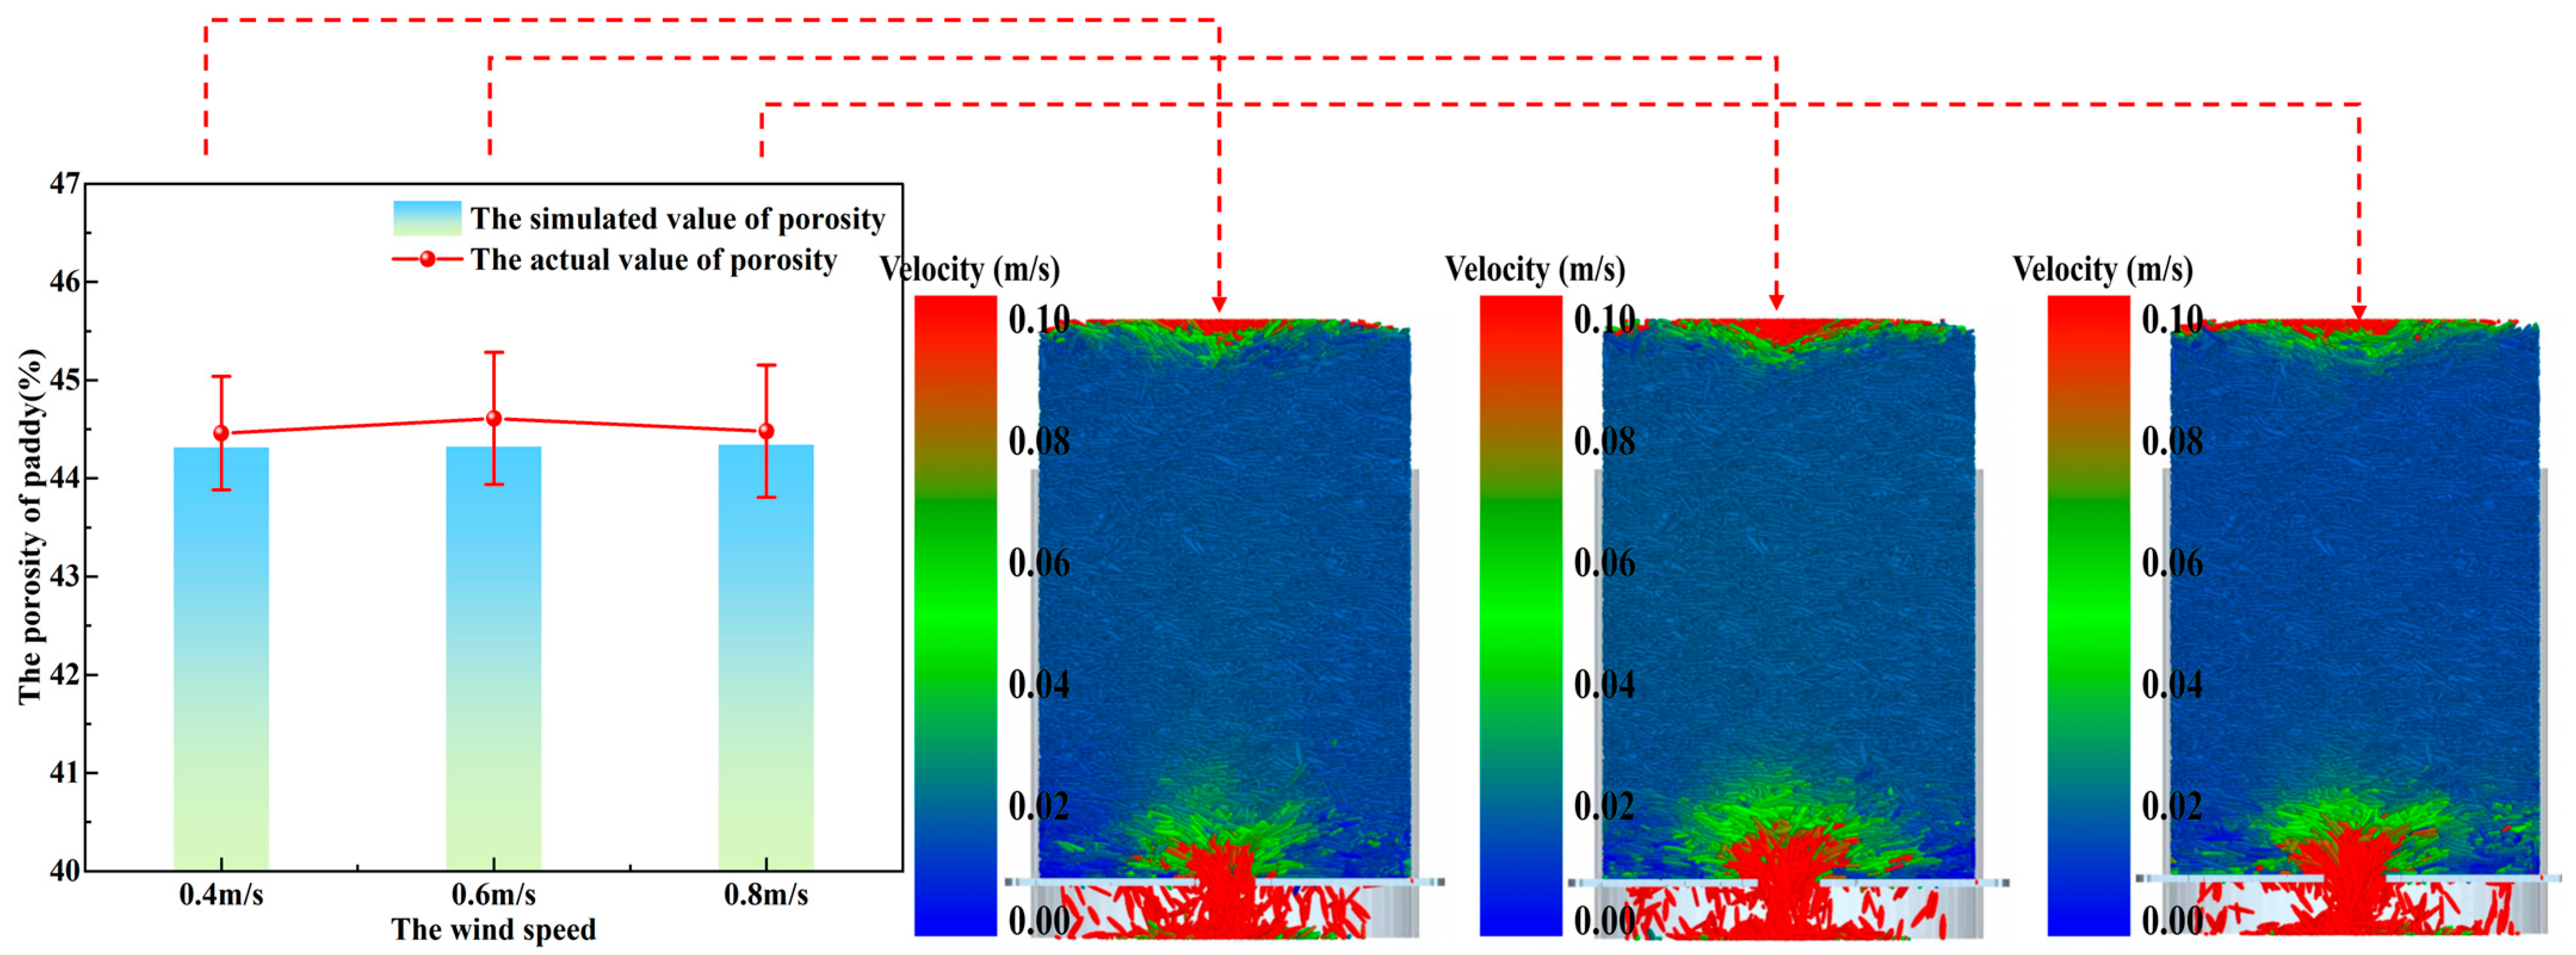
Figure 12 show that the influence of the wind velocity (
vw) parameter on the porosity is not significant, and there is no significant difference in the motion state of paddy particles according to the simulation results of the three groups in
Figure 12, which further verified the inference that the above-mentioned air disturbance had no effect on the porosity of the dynamic layer of paddy.
2.8. Uncertainty Analysis
As a key link in scientific research and engineering applications, uncertainty analysis is the process of systematically quantifying and assessing the range of uncertainties that exist in models, experiments, or systems [
17,
18]. At its core, it reveals the potential impact of variability in input parameters, boundary conditions, model assumptions, or measurement data on the final result. It is also a common and efficient method for evaluating experimental results. The experimental uncertainty in this study is determined using Equations (5) and (6) and the results of the uncertainty calculation are shown in
Table 8.
3. Results and Analysis
In his multi-scale model study of flow and heat and moisture transfer during corn drying, scholar Liu Wenlei used a porous media simulation model to replace the traditional porosity model to study heat and moisture transfer [
19]. The results show that during the drying process, the heat and moisture transfer rate is the fastest in the region with higher porosity. Therefore, the variation characteristics of porosity in the paddy layer revealed by this study are of great significance for the research on optimizing and improving the structure of paddy drying equipment. By converting it into a porous medium model, it is expected to achieve efficient heat and mass transfer and reduce the energy consumption of the equipment.
3.1. Box–Behnken Experiment Analysis
In order to study the influence of interaction among various factors on paddy porosity, this paper conducted platform experiment to measure the measured value of porosity (
εr) according to the experimental scheme generated by the Design Expert analysis software program in the above-mentioned (
Table 7). The experimental results of paddy porosity are shown in
Table 9. Independent variables
X1,
X2,
X3, and
X4 in the table are, respectively, moisture content (
Mc), paddy flow velocity (
vd), wind speed (
vw), and layer thickness (
L); dependent variable
Y indicates that the measured porosity value (
εr) of the paddy measurement layer is the experimental response value. As shown in
Table 9, it is not difficult to see that the variation range of paddy porosity is 39.562–46.006%, and a mathematical model of paddy porosity with respect to moisture content (
Mc), paddy flow velocity (
vd), wind velocity (
vw), and paddy deposition thickness (
L) is established, as shown in Equation (7) below. The correlation coefficient of the mathematical model is 0.968, which indicates that the predicted value of the mathematical model fits the measured value very well and has high reliability.
The results of variance analysis of Box–Behnken experiment on paddy porosity (
εr) are shown in
Table 10. According to the data in the table, the effect of wind speed (
vw) on paddy porosity (
εr) is not significant. The
p value of the mathematical model constructed in this experiment Equation (7) is less than 0.0001, which further indicates the reliability of the mathematical model.
According to
Table 9, it can be seen that paddy moisture content (
Mc), paddy velocity (
vd), paddy deposition thickness (
L), interaction between paddy moisture content and paddy velocity (
Mc·
vd), and interaction between paddy velocity and paddy deposition thickness
(vd·
L) all have significant effects on paddy porosity (
εr). Among them, paddy moisture content (
Mc), paddy velocity (
vd), and paddy deposition thickness (
L) have significant effects on paddy porosity (
εr) (
p < 0.0001). In terms of interaction, the interaction effect of (
Mc·
vd) is greater than that of (
vd·
L).
3.2. Influence of Interaction Between Factors on Paddy Porosity
According to the variance analysis in
Section 3.1 above, the interaction of paddy moisture content and paddy flow velocity (
Mc·
vd), as well as the paddy flow velocity and paddy deposition thickness (
vd·
L), has significant effects. The specific impacts are as follows:
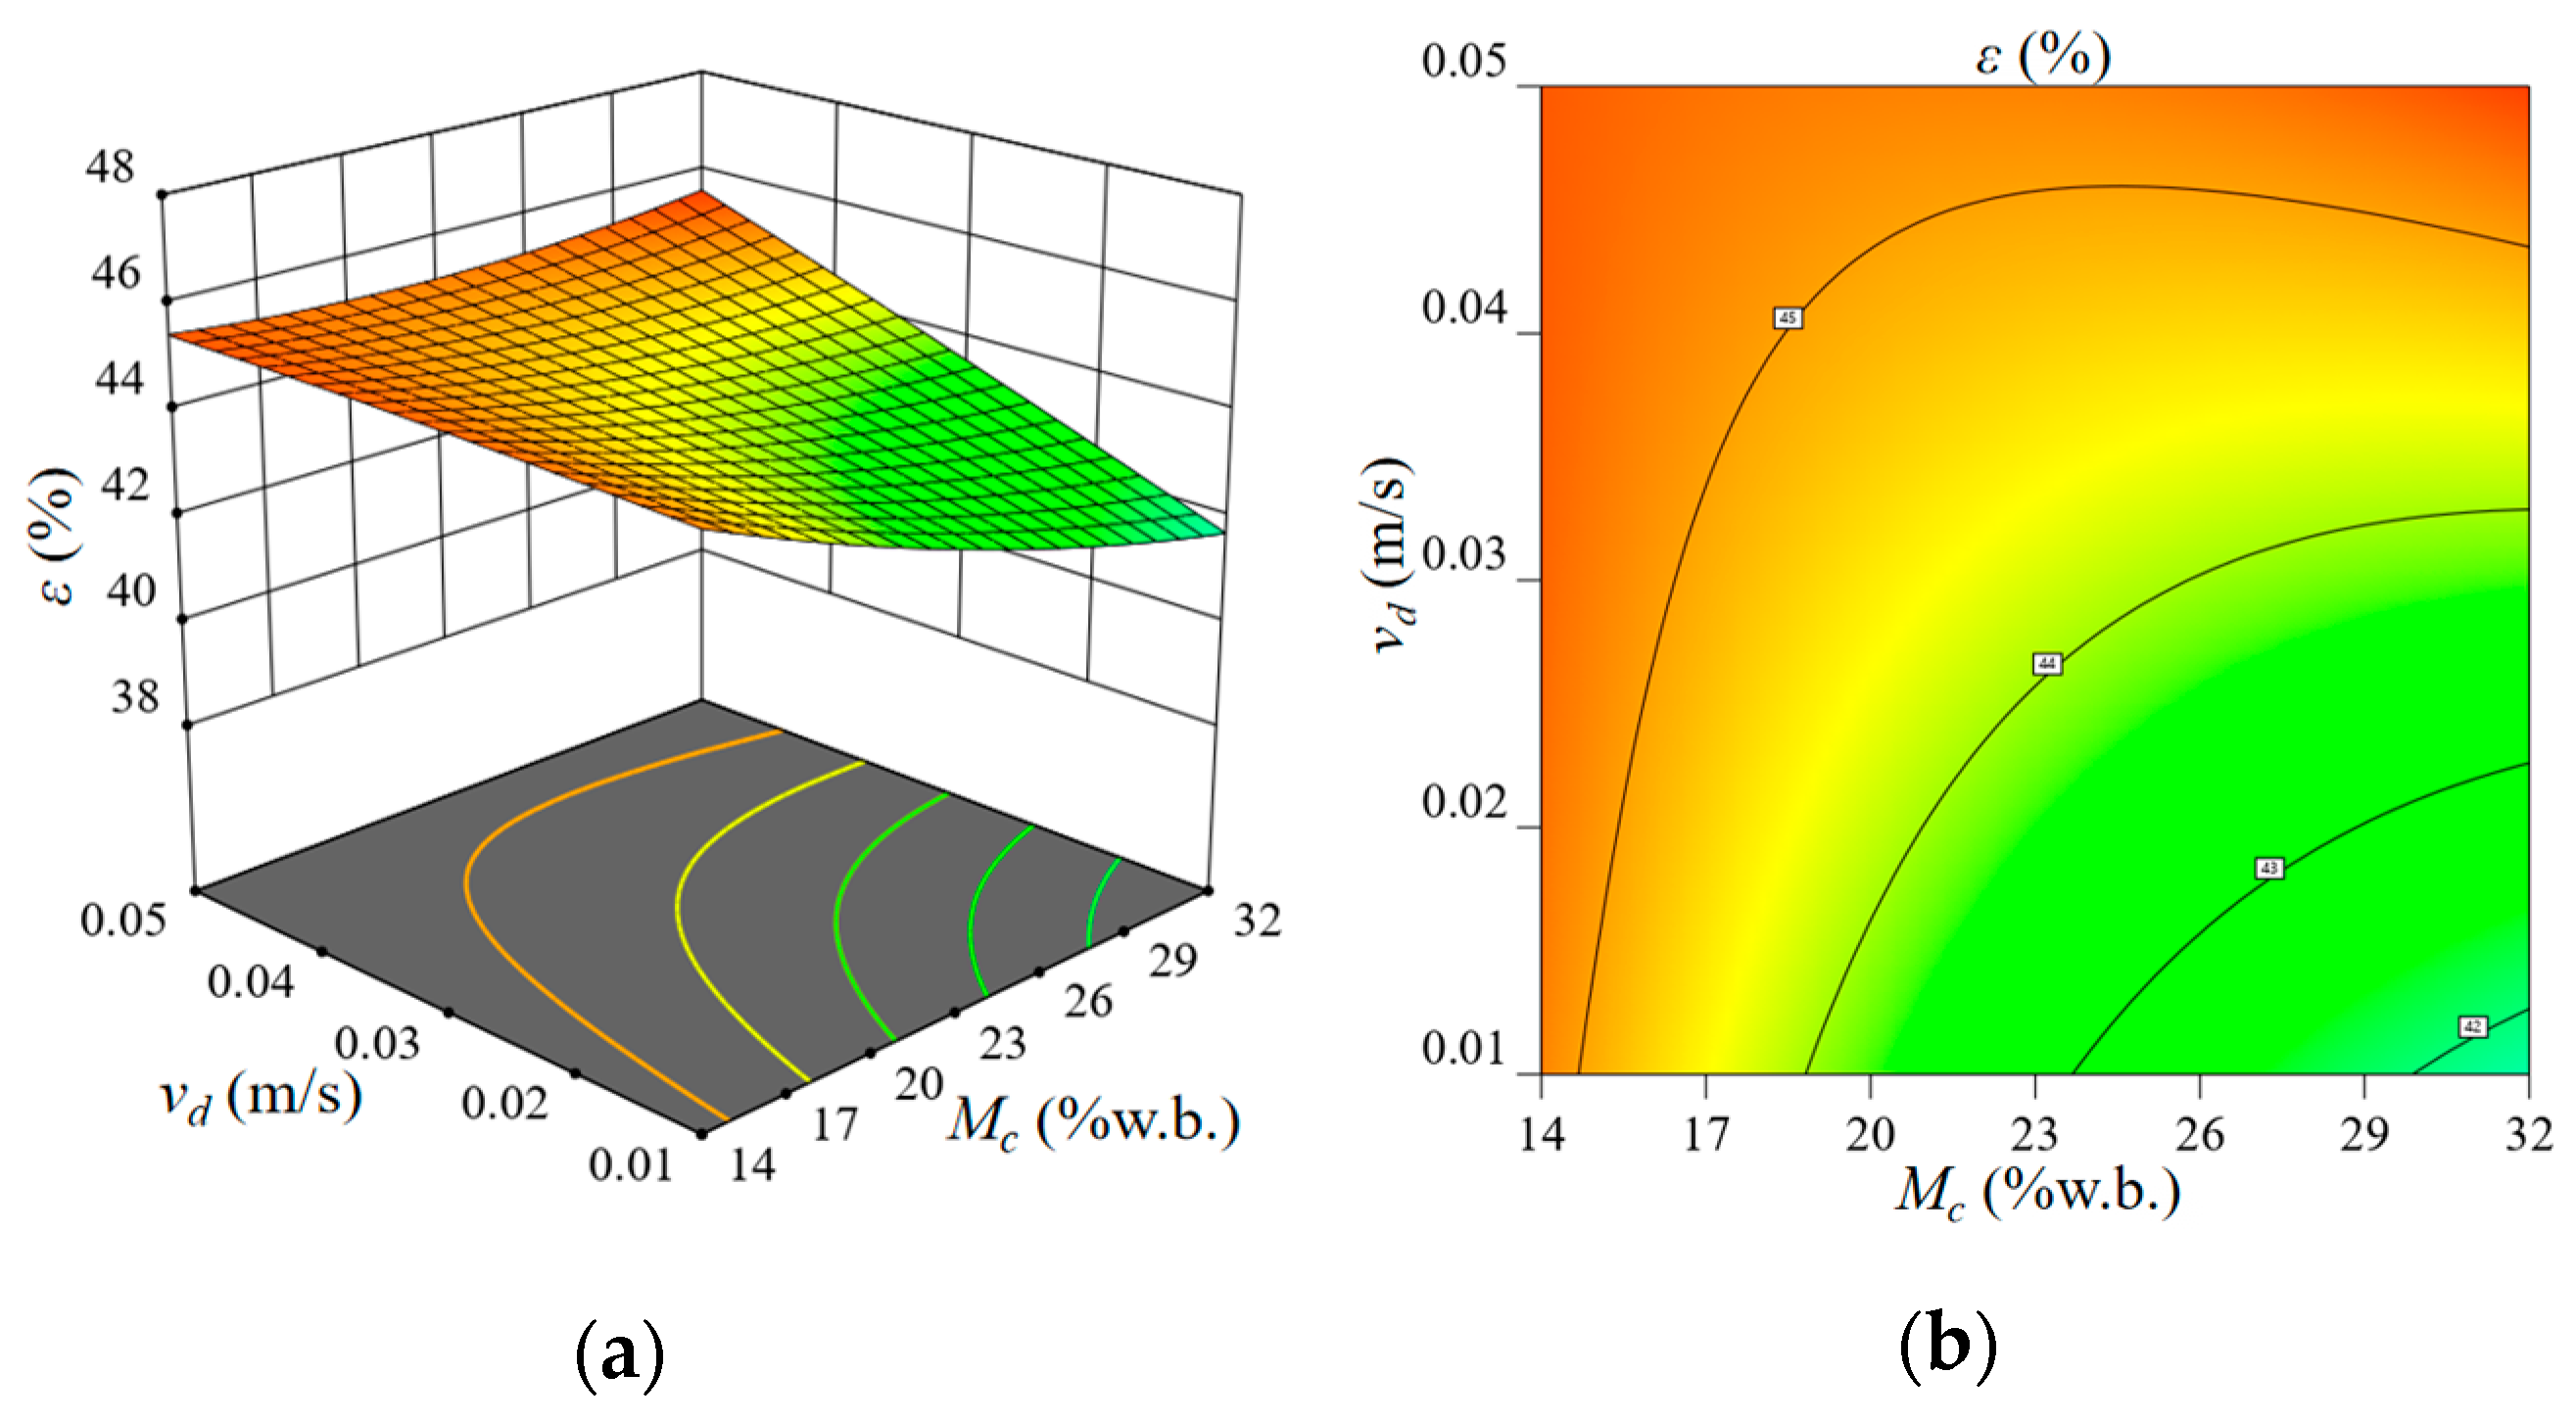
It is not difficult to see from
Figure 13a that, under the interaction between paddy velocity and paddy moisture content, paddy porosity increases with the decrease in paddy moisture content. This phenomenon is because paddy exhibits both solid and fluid behaviors [
20,
21], with concave and convex meshing on its surface. The sliding friction coefficient and internal friction coefficient of paddy surface gradually increase [
22], and the viscous force between paddy also increases, resulting in obvious adhesion and agglomeration between paddy. The motion of paddy is obviously affected by factors such as friction, viscous force, and moisture content on the surface of paddy [
23], which leads to the dissipation of kinetic energy of paddy, thus hindering the flow of particles, intensifying agglomeration among particles, and increasing interparticle pores. As a result, the porosity in the paddy flow layer gradually increases with the decrease of moisture content. However, the porosity of paddy increases with the increase in the flow velocity of paddy. This phenomenon is due to the interaction between paddy particles and the surface of the silo wall in contact during the flow, which leads to disturbance of the flowing paddy cluster and changes the porosity in the flow layer [
24]. In order to obtain the flow characteristics of granular particles, Xiao Guoxian [
25] conducted a simulation analysis of particulate matter, and the results showed that the particle density in the fast flow layer was inconsistent with that in the slow flow layer, the porosity in the fast flow layer was large, and it was confirmed that the change in flow regime was one of the factors leading to the change in porosity. So, the greater the flow velocity, the greater the porosity.
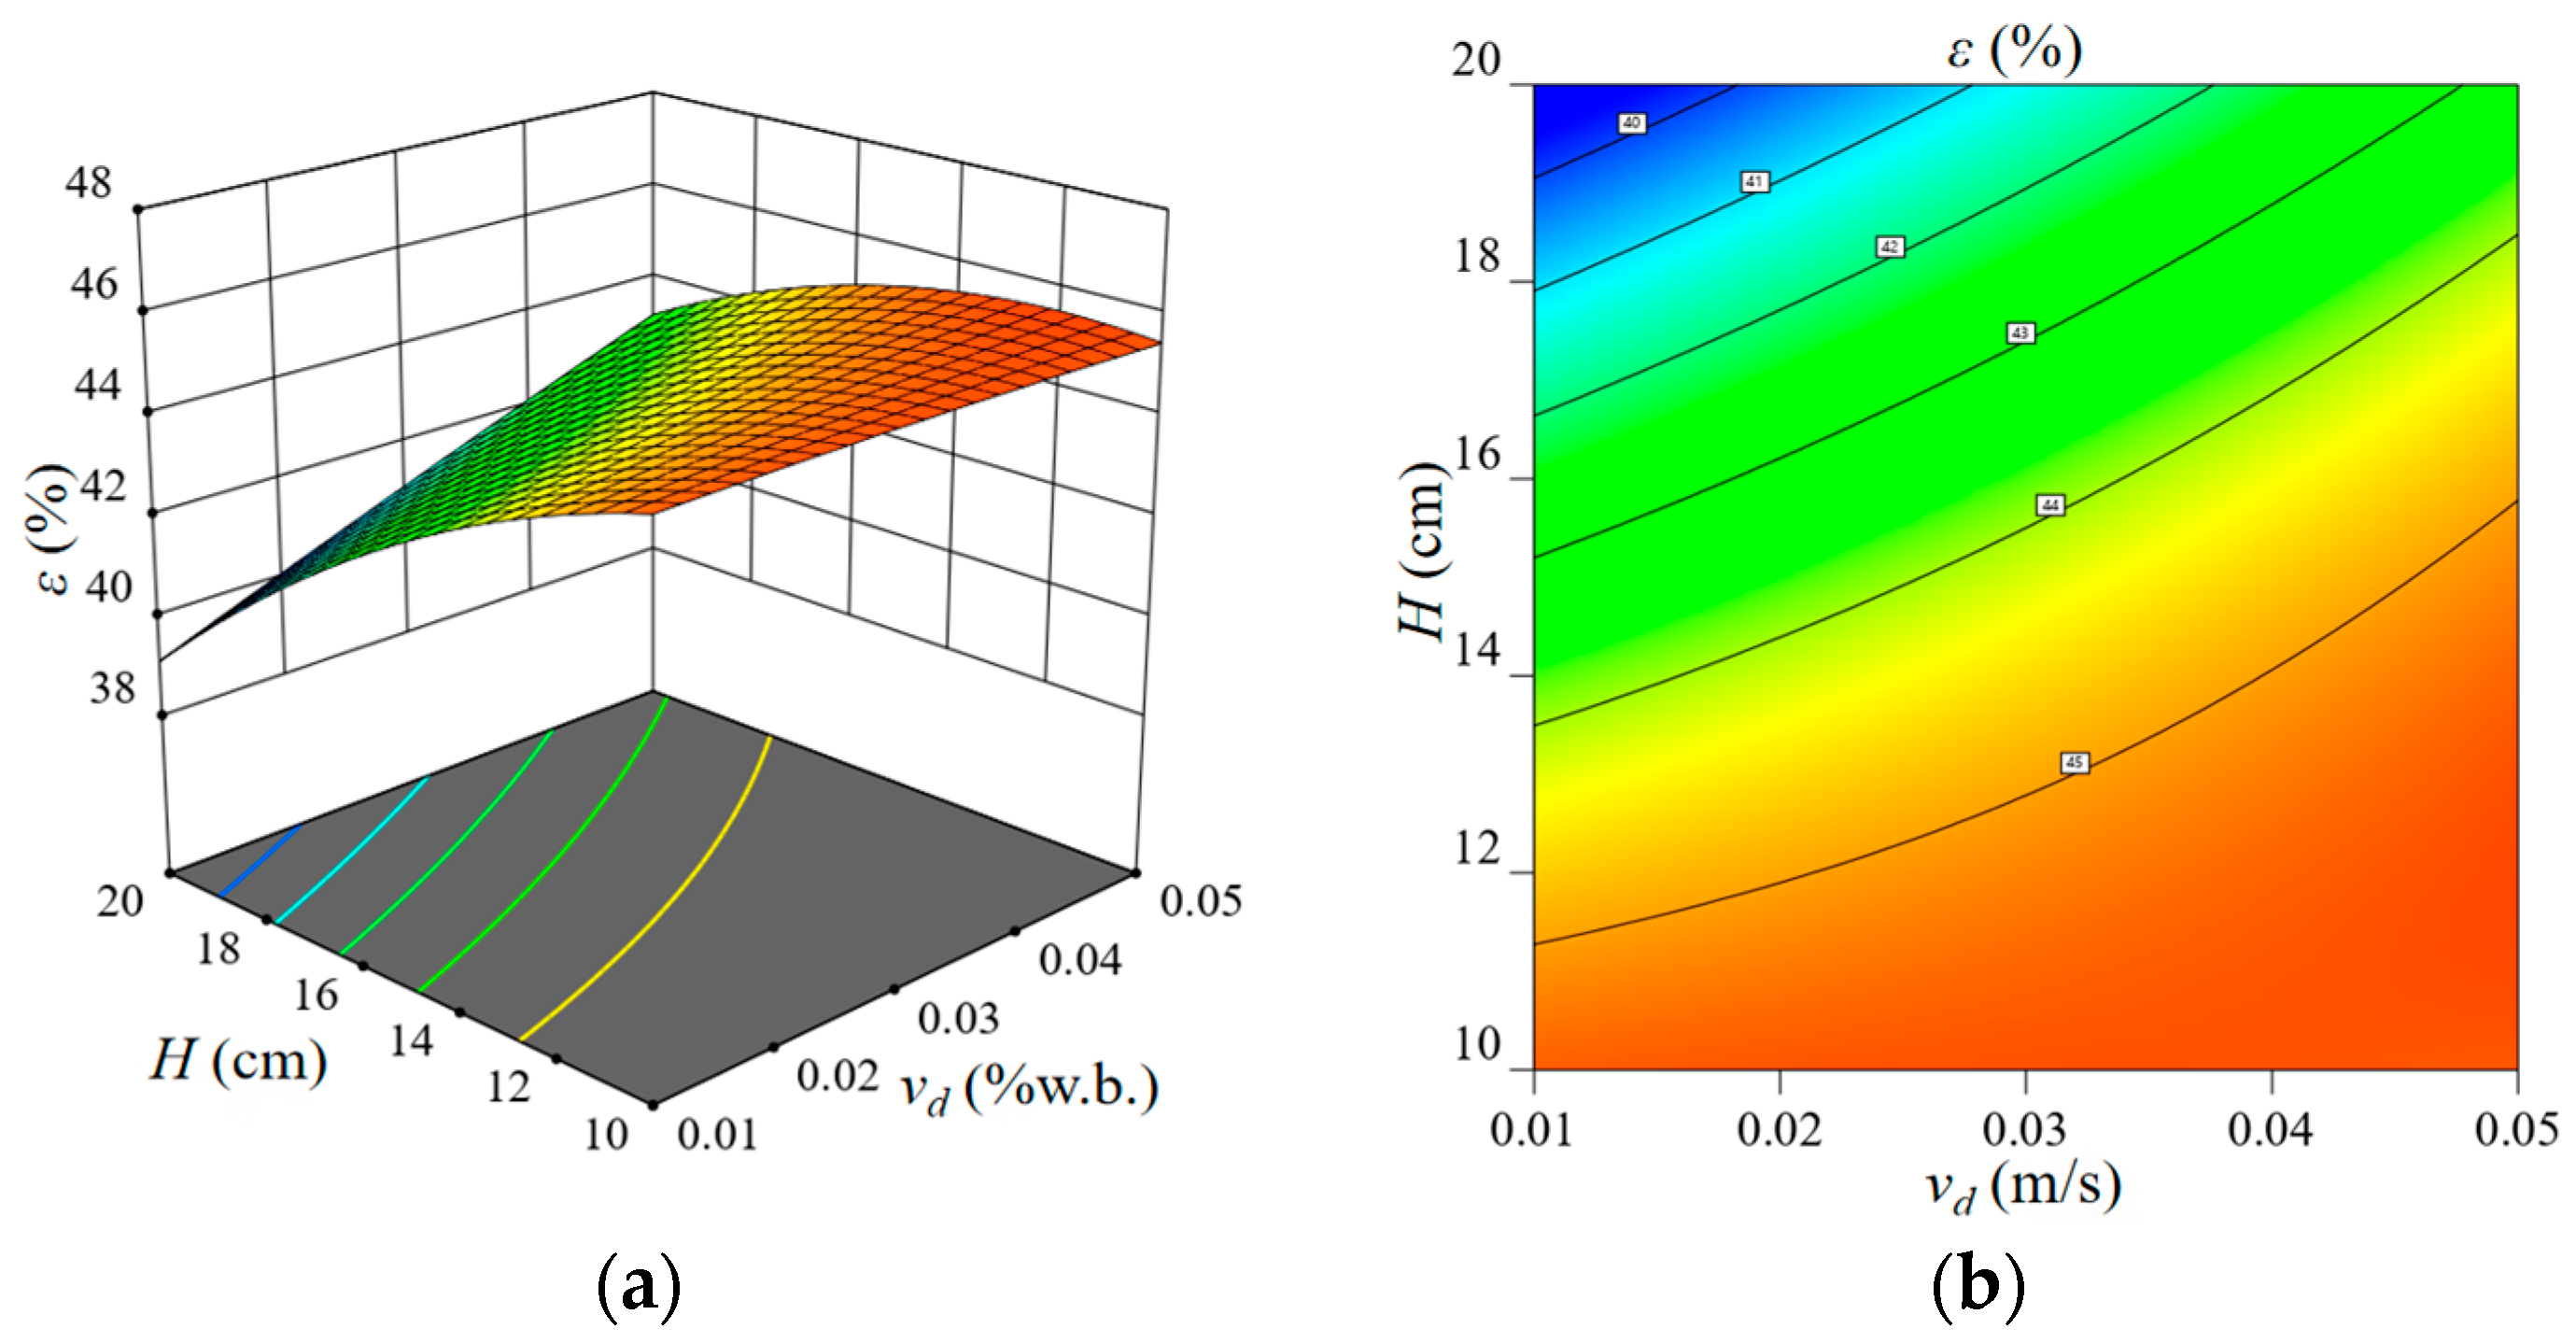
As can be seen from
Figure 14, the porosity of paddy decreases with the increase in the thickness of paddy deposition, mainly because the greater the thickness of paddy deposition, the more paddy mass in the measuring chamber. Under the action of the gravity of the paddy itself and the surface pressure of the measurement chamber wall, the paddy is subjected to repeated extrusion, collision, and shear of the radial pressure and tangential friction force, resulting in uneven distribution of particles in the flow layer [
24,
26,
27,
28], resulting in increased porosity of the paddy.
3.3. Comparative Experiment
The Box–Behnken experimental scheme in
Table 7 was repeated once again through the EDEM–Fluent coupled simulation. The simulation value of the porosity of the flow layer of paddy (
εs) was obtained using Equation (3). As shown in
Table 11, which is the simulation value of porosity (
εs), the predicted value of mathematical model (
εp), and the measured value of porosity (
εr). It is found that the relative error between the real value of paddy porosity (
εr) and the simulated value of paddy porosity (
εs) is ±1% (Meets instrument measurement error [
29]), which indicates that the measured value of paddy porosity has a certain reliability.
3.4. Experimental Verification
According to the five sets of independent measurement data listed in
Table 12, by comparing the error distribution characteristics of the predicted and actual porosity values of paddy, it can be seen that the relative errors of all test groups are still stably within the fluctuation range of −1~1%. Further, this confirms that the established numerical model has high calculation accuracy and engineering applicability, as well as that the actual values have high reliability.
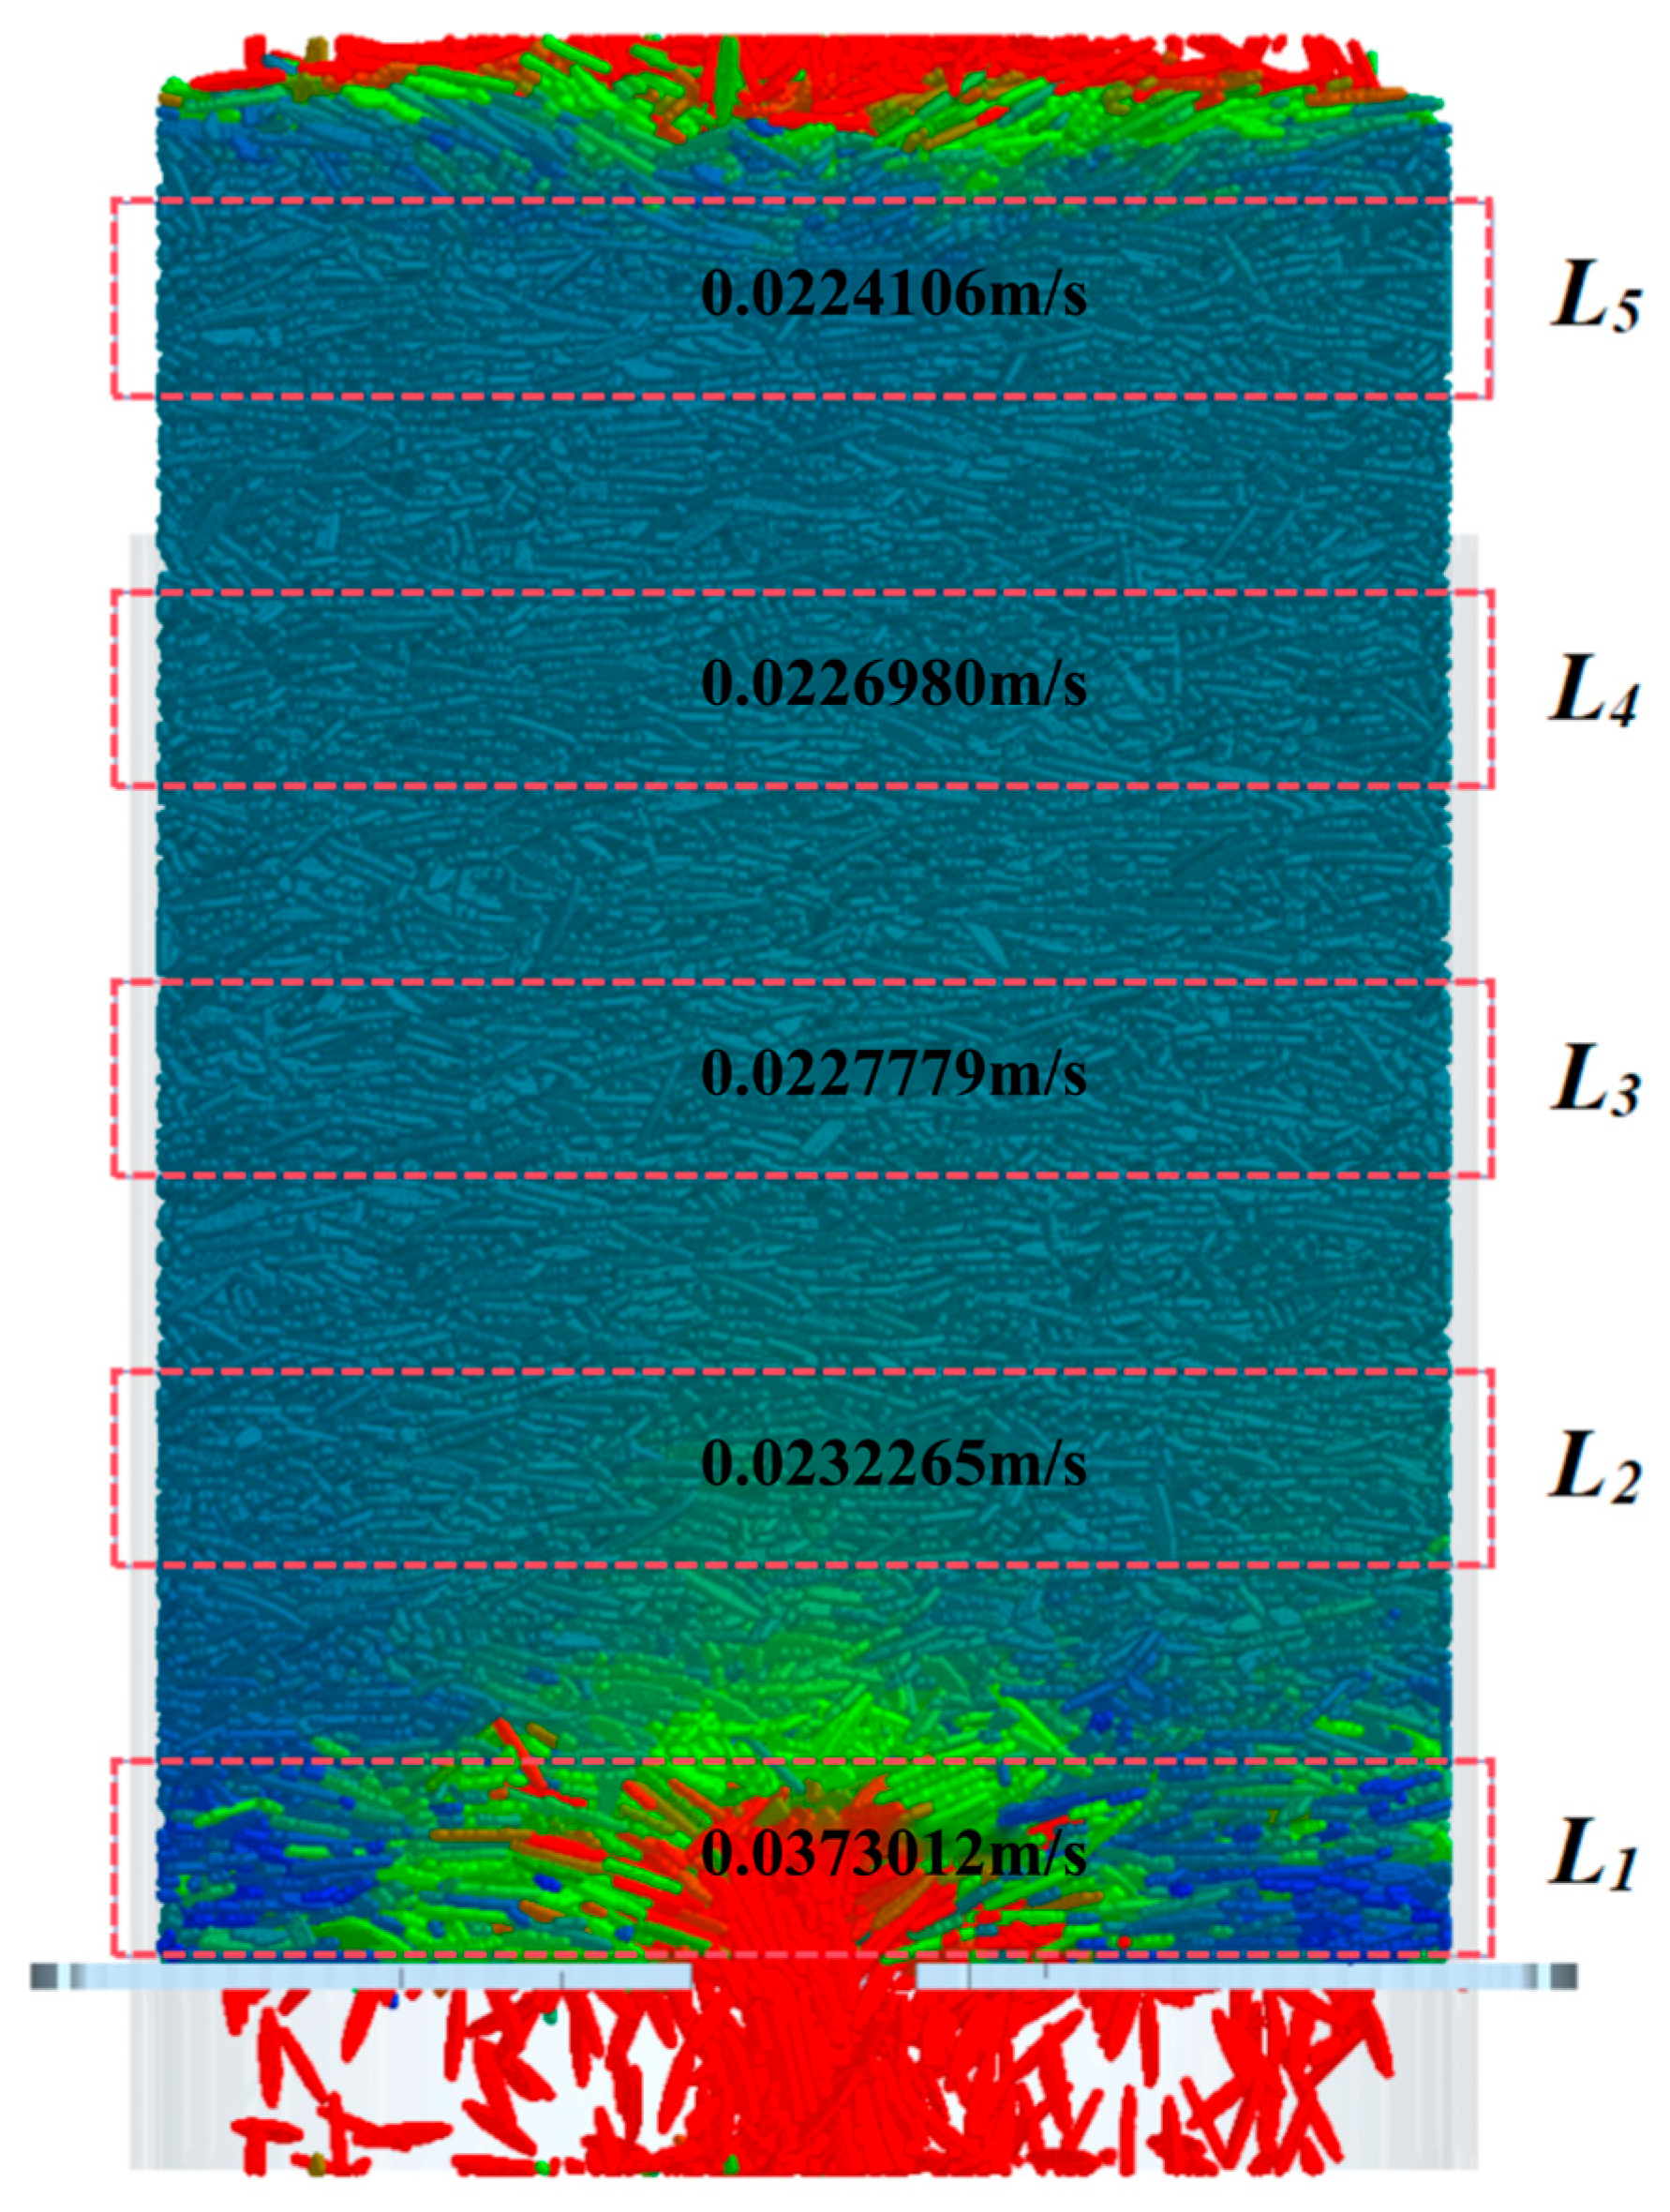
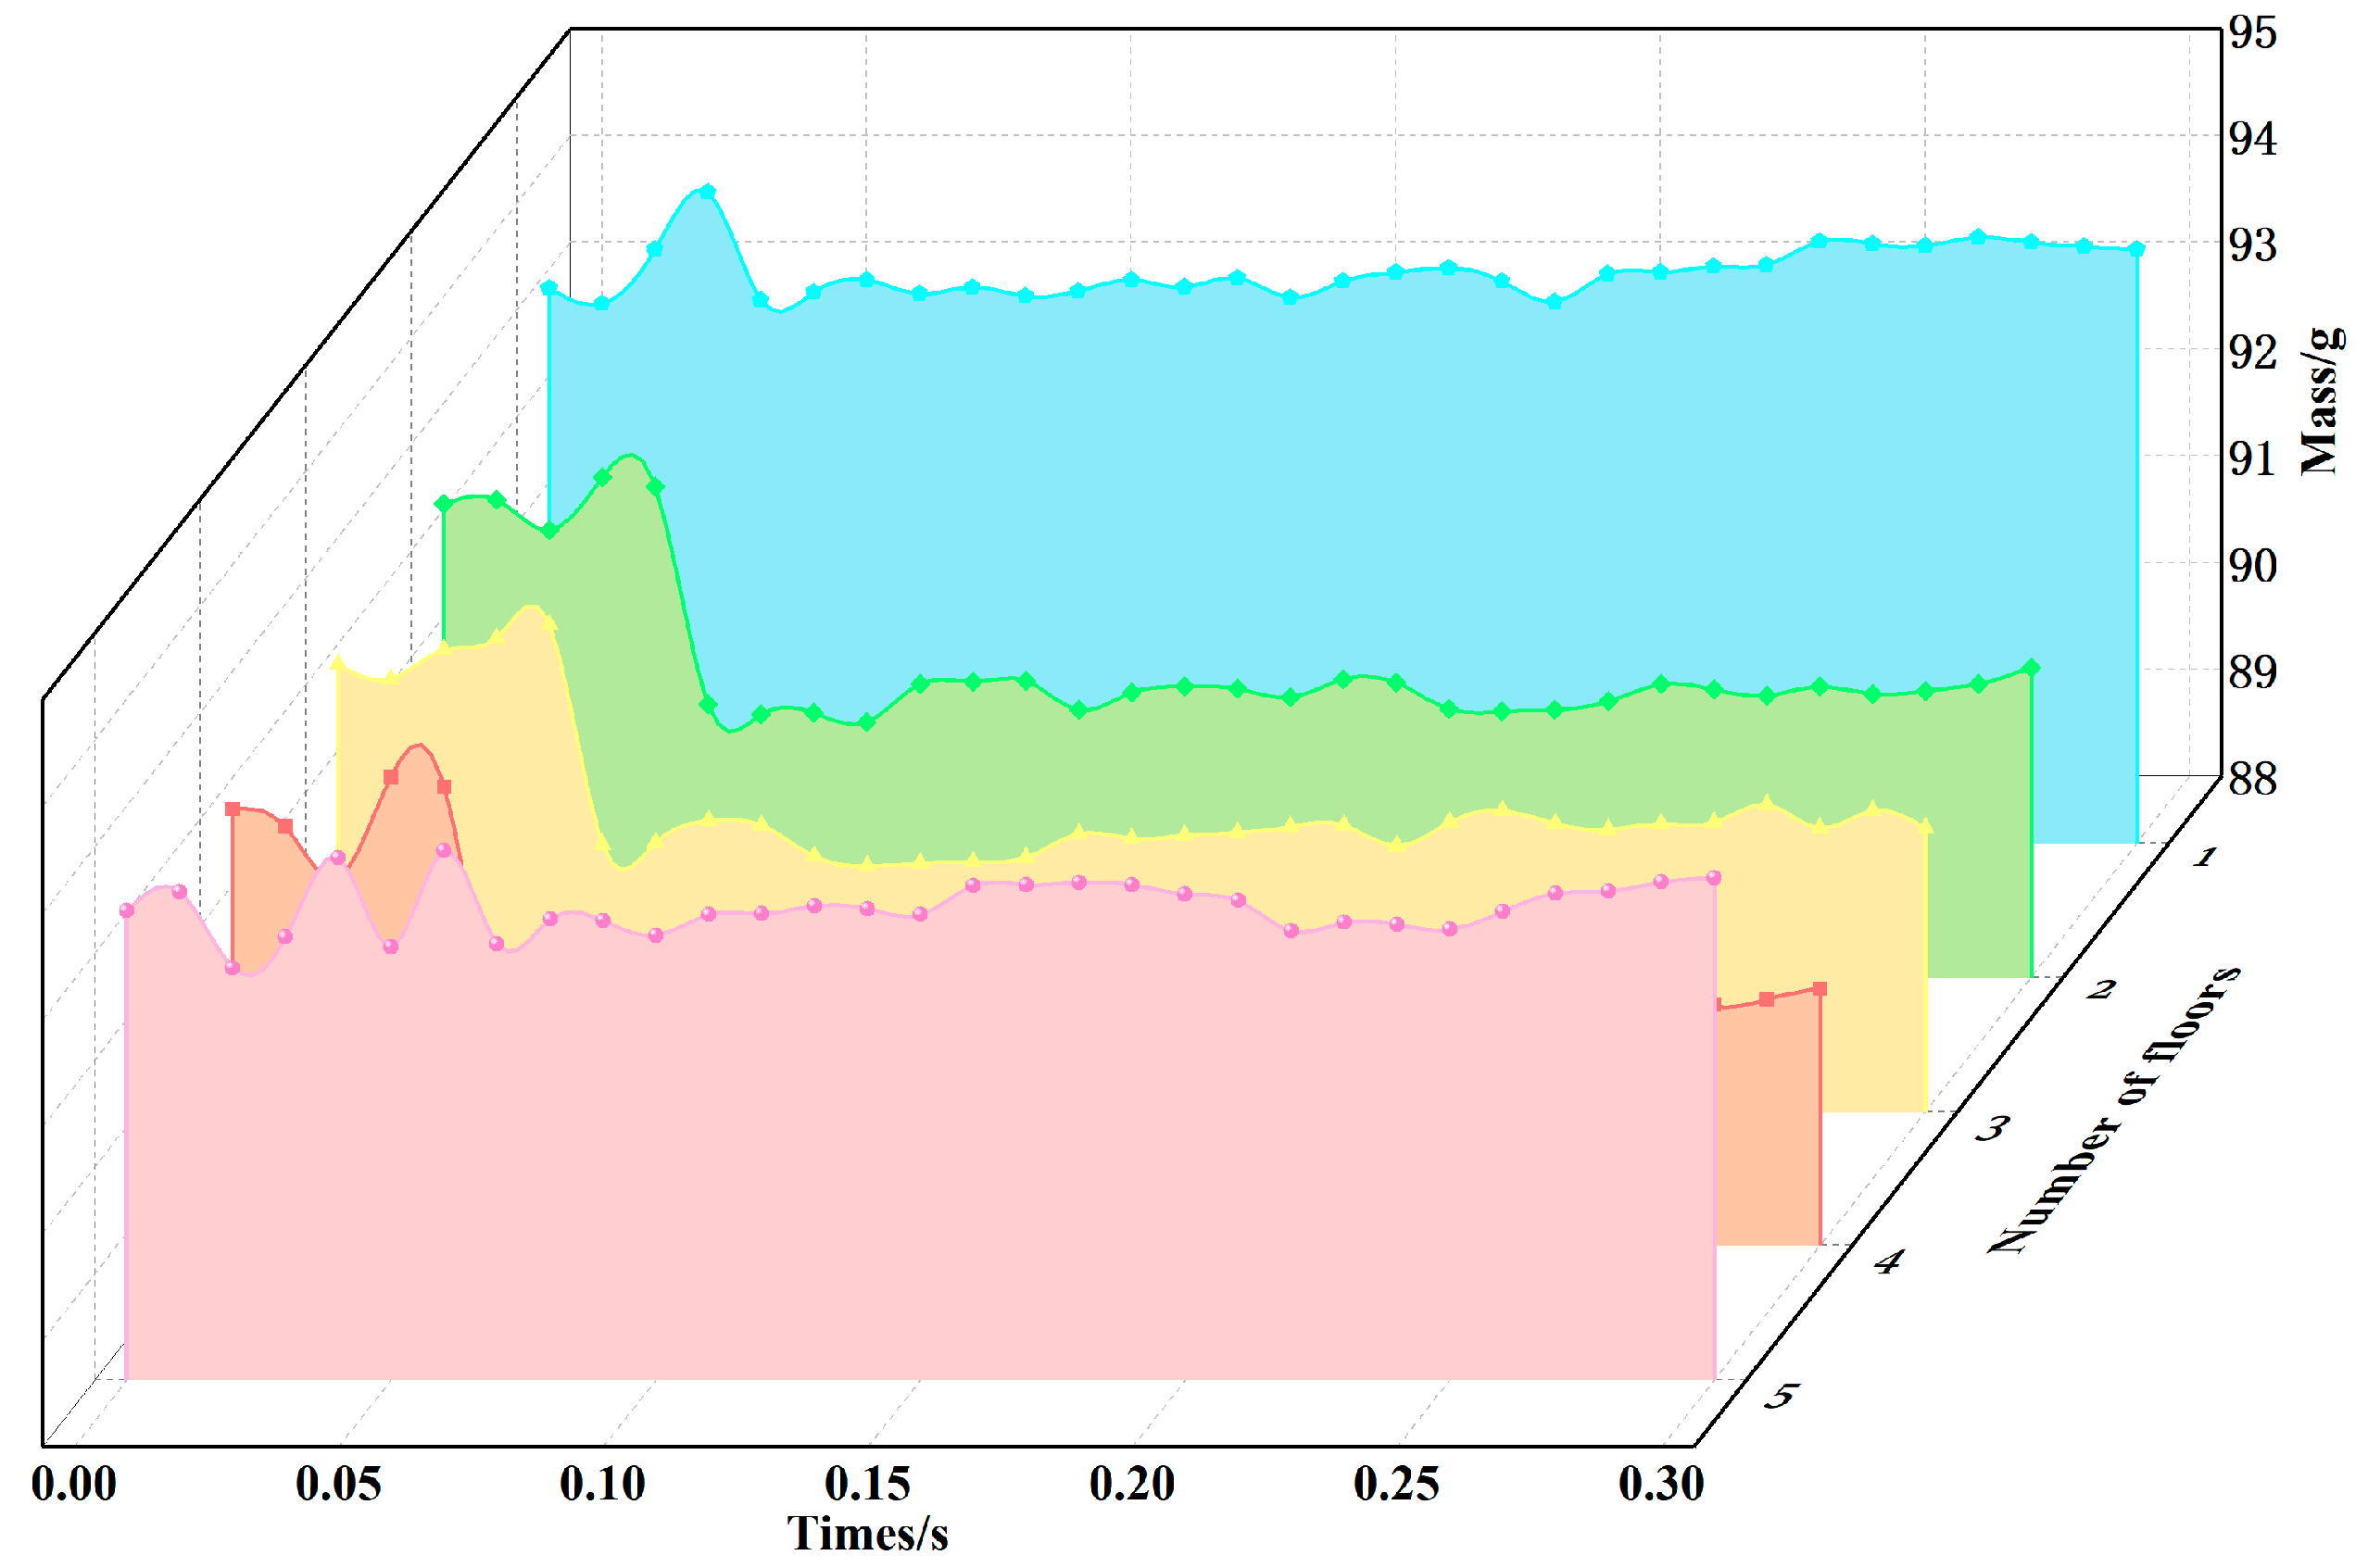
3.5. Local Simulation Analysis of the Paddy Layer
For the purpose of investigating the change in paddy porosity in the real drying equipment, the paddy porosity measurement layer was subdivided into five local measurement layers of 15 cm thickness during the simulation procedure, as shown in
Figure 15. In the EDEM software program, we obtained data on the dynamic change quality of each local layer of the porosity measurements, as shown in
Figure 16. The results showed that the dynamic change in the quality of the paddy was relatively stable in layers
L2,
L3, and
L4, with an average weight of approximately 90.56 g. The paddy mass of
L5 is higher than that of the three above layers and the corresponding paddy porosity is lower. On the contrary, the dynamic change in the quality of the paddy in layer
L1 is much greater than in the other four layers and its paddy porosity is also lower than in the other four layers. The reason for this is that the flow of paddy at the valve opening of the porosity measuring device is less than that of the paddy porosity layer
L1, which leads to a blockage of the
L1 layer and consequently to excess weight in the
L1 layer over the other four layers. In summary, the distilled portion of the paddy with the highest porosity has the best drying effect [
30].
3.6. Analysis of Correlation Coefficient Results
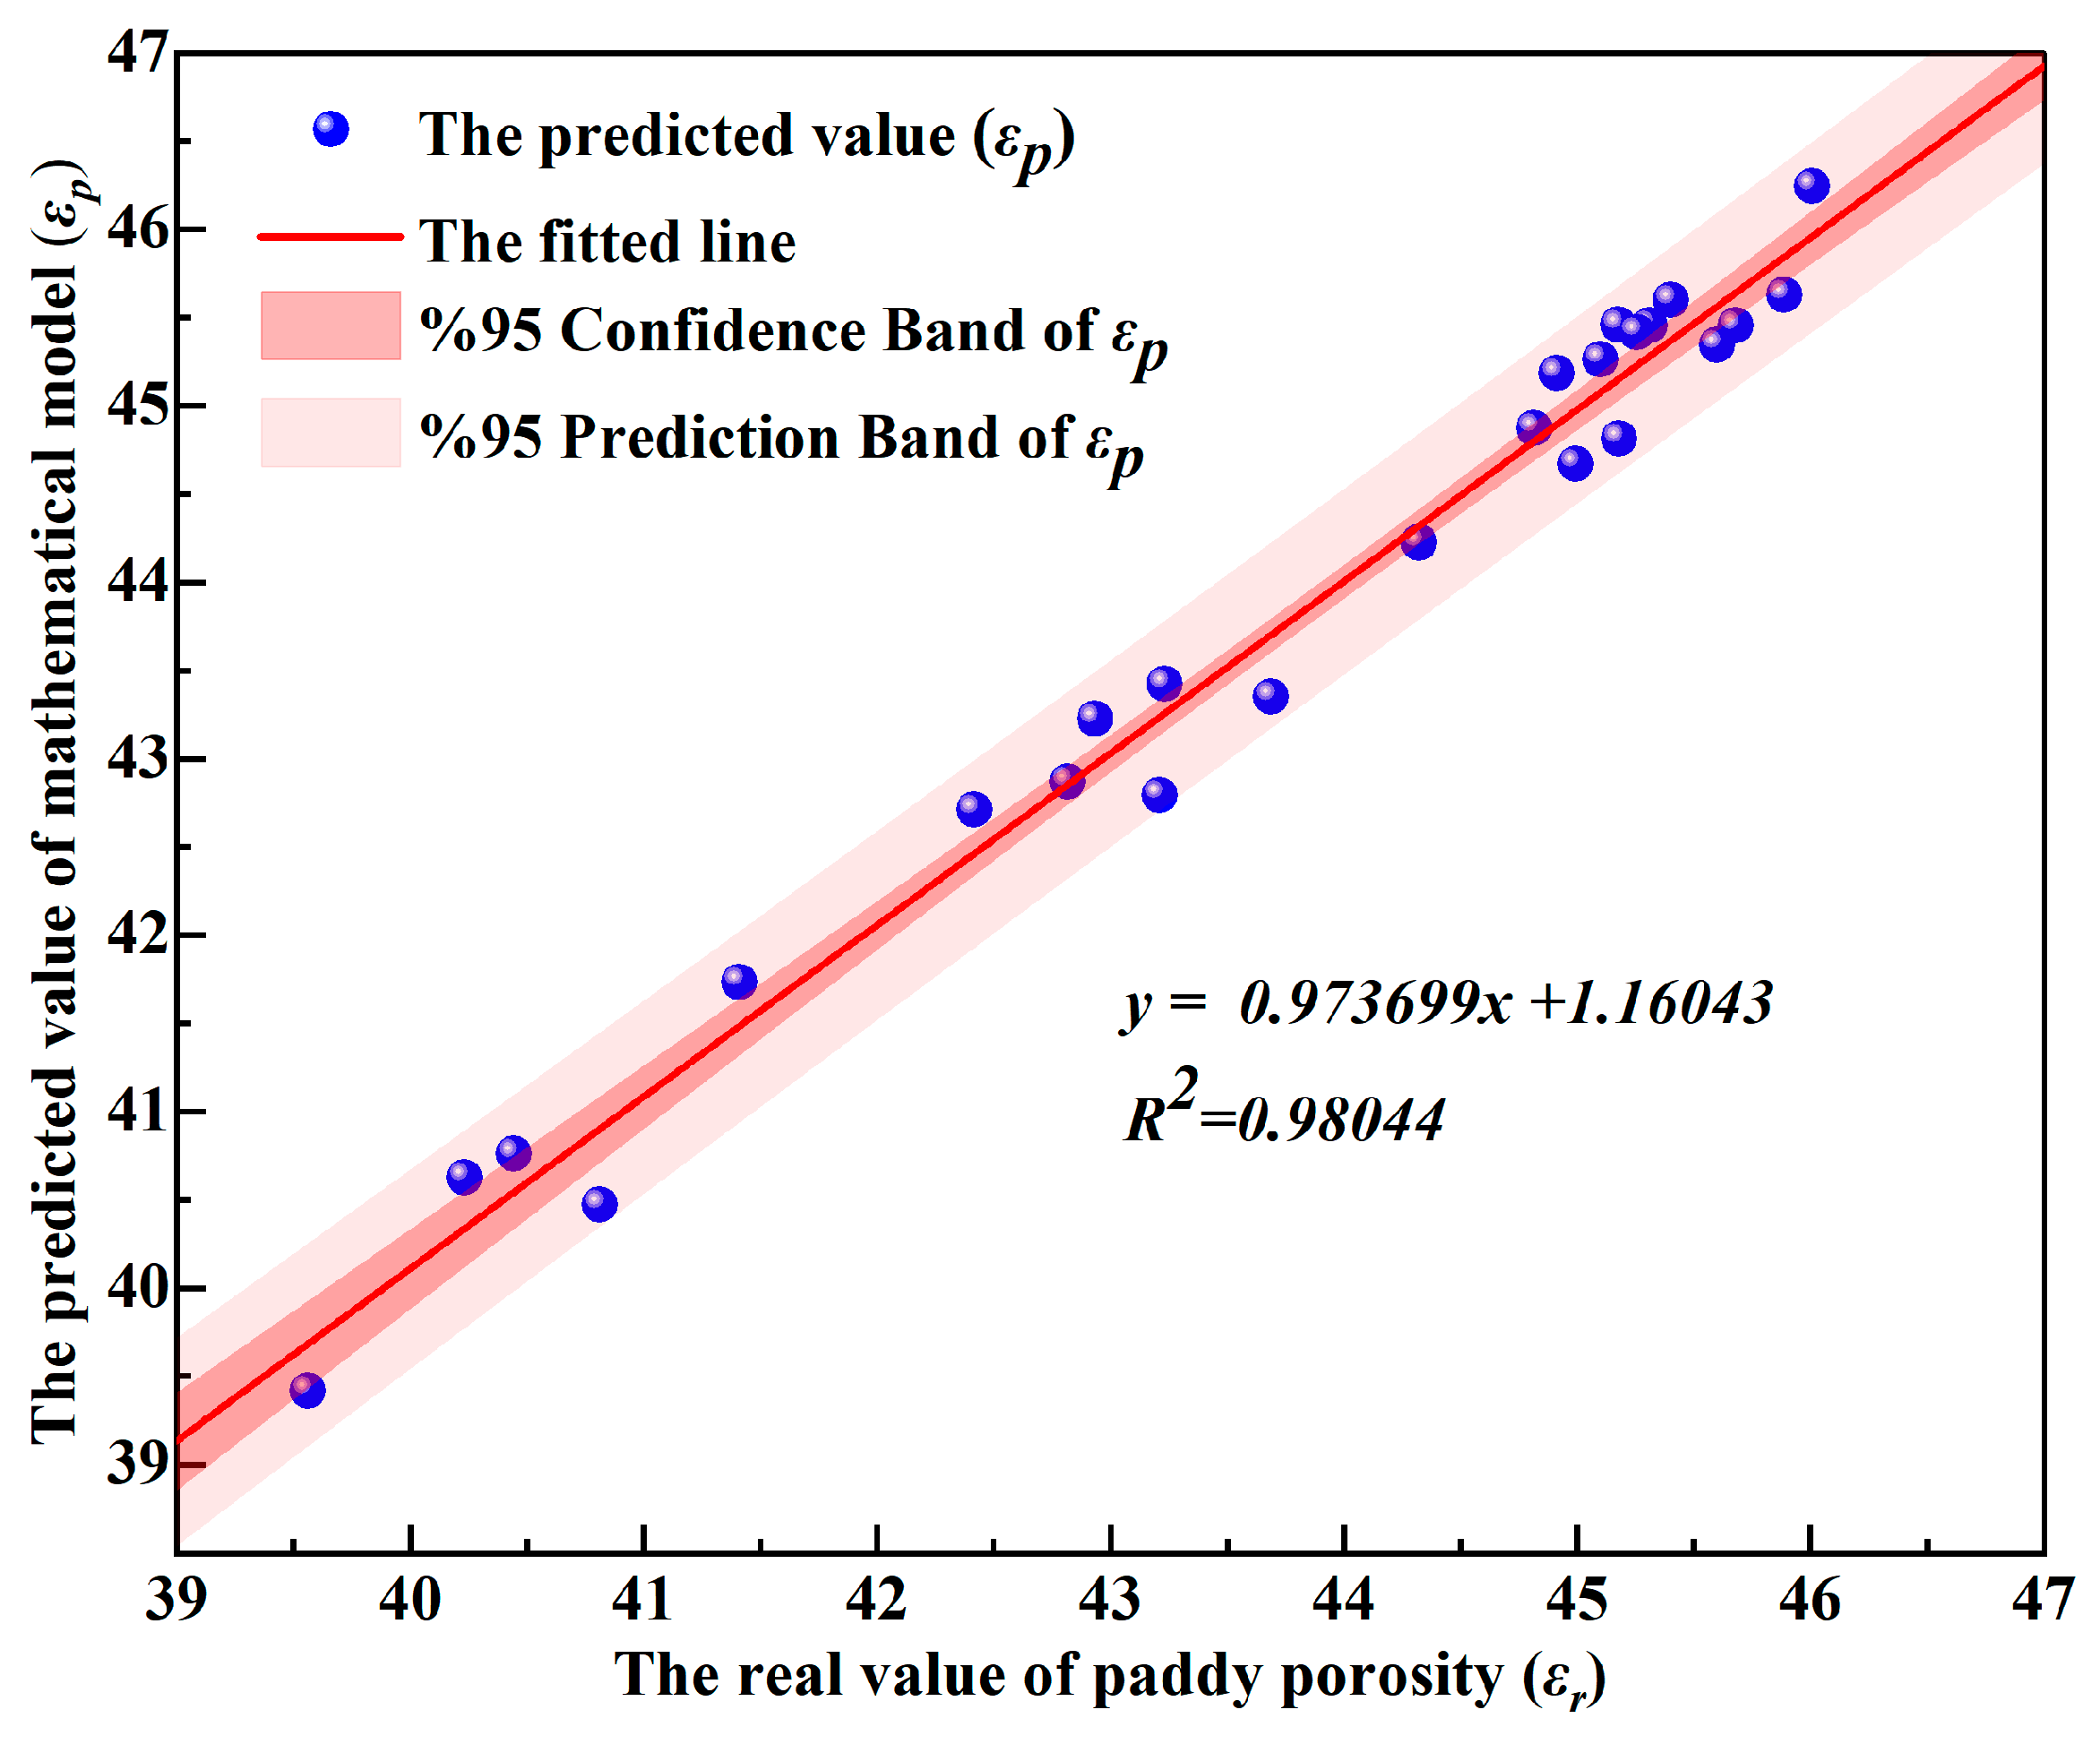
The
Figure 17 shows that the predicted porosity value of paddy grains (
εp) has a highly linear correlation with the actual value (
εr) (R
2 = 0.98). The 95% confidence band is narrow and closely follows the fitted line, indicating that the model parameter estimation is precise. The porosity values are densely distributed within the prediction band, further verifying the reliability of the model.
4. Conclusions
1. The variation characteristics of paddy porosity under different moisture contents (Mc), wind speeds (vw), layer thicknesses (L), and paddy flow velocities (vd) were measured by the porosity experiment platform built. The obtained paddy porosity range was 39.562–46.006%.
2. Data analysis by Design Expert showed that paddy moisture content (Mc), paddy flow rate (vd), the layer thickness of the paddy (L), interaction between paddy moisture content and paddy flow velocity (Mc·vd), and interaction between paddy flow velocity and the layer thickness of the paddy (vd·L) all had significant effects on paddy porosity (Mc·vd > vd·L). Wind speed (vw) had no significant effect on the porosity. The mathematical model function (correlation coefficient is 0.968) of moisture content (Mc), velocity of paddy (vd), wind speed (vw), and the layer thickness of the paddy (L) is established. The mathematical model function is reliable.
3. The simulation value (εs) of paddy porosity obtained by EDEM–Fluent coupled simulation experiment was compared with the measured value (εr) of the paddy porosity measurement platform, and the relative error range of the two was ±1%.
4. Through the EDEM–Fluent coupling simulation, the change characteristics of the porosity of paddy in the actual drying equipment are explored. It is found that the porosity of paddy at the bottom layer is smaller than that of the other four layers in the flowing state, followed by that of the top layer. The porosity of paddy in the middle part is relatively uniform and greater than that of the upper and lower layers.
5. According to Pearson correlation analysis, paddy porosity is negatively correlated with paddy moisture content (Mc) and layer thickness (L). There was a positive correlation between the porosity of paddy and the paddy flow velocity (vd).
6. Different from the fact that the commonly used models (Shedd equation and Hukill equation) can only describe a static layer, the current work introduces a porosity model that focuses on a dynamic layer and can better reveal the characteristics of the porosity variation during the actual drying of the paddy. Although the model can be used as a reference for the design of the drying process of the paddy, further work should be devoted to the combination of heat and weight transfer and drying behavior of the paddy material.
Author Contributions
Conceptualization, B.L. and C.L. (Chuandong Liu); methodology, B.L. and C.L. (Chuandong Liu); software, C.L. (Chuandong Liu) and Z.L.; validation, Z.L. and Y.L.; formal analysis, X.Z.; investigation, B.L. and H.Z.; resources, B.L. and Z.Z.; data curation, C.L. (Cheng Lv) and X.Z.; writing—original draft preparation, C.L. (Chuandong Liu) and B.L.; writing—review and editing, C.L. (Chuandong Liu) and B.L.; visualization, Z.L. and B.L.; supervision, X.Z., C.L. (Cheng Lv), and Z.Z.; project administration, B.L.; funding acquisition, B.L. All authors have read and agreed to the published version of the manuscript.
Funding
This research was funded by National Natural Science Foundation of China (Grant No. 32401733); Natural Science Foundation of Chongqing, China CSTC (CSTB2022NSCQ-BHX0016); China Postdoctoral Science Foundation (Grant No. 2023T160768); Special Support Project of Chongqing Postdoctoral Science Foundation (Grant No. 2021XM1034); and Science and Technology Research Program of Chongqing Municipal Education Commission (Grant No. KJQN202201322; KJQN202401348).
Data Availability Statement
The original contributions presented in this study are included in the article. Further inquiries can be directed to the corresponding author.
Acknowledgments
The authors would like to thank to the editors and reviewers for their valuable and constructive comments.
Conflicts of Interest
The authors declare that they have no known competing financial interests or personal relationships that could have appeared to influence the work reported in this paper.
Abbreviations
The following abbreviations are used in this manuscript:
| Parameter Symbol | Practical Meaning | Unit |
| Δp | Resistance of grain layer | Pa |
| L | The paddy layer thickness | m |
| Dp | Equivalent diameter of paddy | m |
| ε | Flow layer porosity | % |
| u | The wind speed in the measuring chamber | m/s |
| μ | Dynamic viscosity of air | Pa·s |
| ρa | Air density | kg/m3 |
| L0 | The average length of paddy | m |
| B | The average width of paddy | m |
| H | The average height of paddy | m |
| M | The quality of paddy in the measurement chamber | g |
| V | The volume of the measurement chamber | cm3 |
| ρt | The true density of paddy | g/cm3 |
| m | The mass of the falling paddy | kg |
| ρ | The paddy density | kg/m3 |
| t | The measurement time | s |
| A | The circulation cross section area | m2 |
| v | The average flow velocity of paddy per unit time | m/s |
| Mc | The moisture content | %w.b. |
| L | The layer thickness of the paddy | cm |
| vd | The paddy velocity | m/s |
| vw | The wind velocity | m/s |
| εp | The predicted value of porosity | % |
| εr | The real value of paddy porosity | % |
| εs | The simulation value of porosity | % |
References
- Vallespir, F.; Rodríguez, Ó.; Eim, V.S.; Rosselló, C.; Simal, S. Effects of Freezing Treatments before Convective Drying on Quality Parameters: Vegetables with Different Microstructures. J. Food Eng. 2019, 249, 15–24. [Google Scholar] [CrossRef]
- Chen, Z.; Chen, C.; Kamchoom, V.; Chen, R. Gas Permeability and Water Retention of a Repacked Silty Sand Amended with Different Particle Sizes of Peanut Shell Biochar. Soil Sci. Soc. Am. J. 2020, 84, 1630–1641. [Google Scholar] [CrossRef]
- Steiros, K.; Hultmark, M. Drag on Flat Plates of Arbitrary Porosity. J. Fluid Mech. 2018, 853, R3. [Google Scholar] [CrossRef]
- Luhrmann, T.M.; Weisman, K. Porosity Is the Heart of Religion. Curr. Dir. Psychol. Sci. 2022, 31, 247–253. [Google Scholar] [CrossRef]
- Salhi, M.; Chaatouf, D.; Raillani, B.; Amraqui, S.; Mezrhab, A. Investigating the Effect of Food Trays Porosity on the Drying Process. Innov. Food Sci. Emerg. Technol. 2022, 76, 102939. [Google Scholar] [CrossRef]
- Qi, H.; Ba, J.; Müller, T.M. Temperature Effect on the Velocity-Porosity Relationship in Rocks. J. Geophys. Res. Solid Earth 2020, 126, e2019JB019317. [Google Scholar] [CrossRef]
- Oliveros, N.O.; Hernández, J.A.; Sierra-Espinosa, F.Z.; Guardián-Tapia, R.; Pliego-Solórzano, R. Experimental Study of Dynamic Porosity and Its Effects on Simulation of the Coffee Beans Roasting. J. Food Eng. 2017, 199, 100–112. [Google Scholar] [CrossRef]
- Xu, Q.; Tao, T.; Xu, S.; Zhou, Z.; Pan, J.; Hong, Y.; Cheng, X. Experimental Study on the Porosity of Rapeseed. Grain Sci. Technol. Econ. 2018, 43, 73–75+110. [Google Scholar] [CrossRef]
- Li, Q.Q.; Chen, X.; Bi, W.Y. Research on Determination Method and Influencing Factors of Porosity of Wheat Pile. Sci. Technol. Cereals Oils Foods 2021, 29, 187–193. [Google Scholar] [CrossRef]
- Witrowa-Rajchert, D.; Rząca, M. Effect of Drying Method on the Microstructure and Physical Properties of Dried Apples. Dry. Technol. 2009, 27, 903–909. [Google Scholar] [CrossRef]
- Li, C.; Fang, Z.; Mai, Z. Design and Test on Porosimeter for Particle Materia. Trans. Chin. Soc. Agric. Mach. 2014, 45, 200–206. [Google Scholar]
- Tong, J.; Li, C.; Liu, M. Design and Experiment of Detection Device of Porosity in Rice Flowing Layer. J. Chin. Agric. Mech. 2023, 44, 26–31. [Google Scholar] [CrossRef]
- Fu, T. Design and Trial of Adaptive Copying Picking Device for Tea Leaves. Master’s Thesis, Zhejiang University of Science and Technology, Hangzhou, China, 2024. [Google Scholar]
- Rudnicki, J.W. Porosity Evolution in Rate and State Friction. Geophys. Res. Lett. 2022, 49, e2022GL101056. [Google Scholar] [CrossRef]
- Zhang, Z.Y.; Li, L.C.; Ma, M.X.; Li, L.J.; Zou, Z.X.; Wang, W.R. Experiment and Numerical Simulation of Layer Resistance Parametersin Dryer. Trans. Chin. Soc. Agric. Mach. 2014, 45, 216–221. [Google Scholar]
- Bai, Y.; Rahman, M.S.; Perera, C.O.; Smith, B.; Melton, L.D. Structural Changes in Apple Rings during Convection Air-Drying with Controlled Temperature and Humidity. J. Agric. Food Chem. 2002, 50, 3179–3185. [Google Scholar] [CrossRef]
- Boelen, P.A.; Lenferink, L.I.M. Latent Class Analysis of Indicators of Intolerance of Uncertainty. Scand. J. Psychol. 2018, 59, 243–251. [Google Scholar] [CrossRef] [PubMed]
- Liu, M.; Cao, C. Model of Safe Drying Temperature for Paddy Rice Seed. Trans. Chin. Soc. Agric. Eng. 2003, 19, 174–177. [Google Scholar]
- CNKI. Available online: https://cdmd.cnki.com.cn/Article/CDMD-10463-1024631991.htm (accessed on 15 February 2025).
- de Gennes, P.G. Granular Matter: A Tentative View. Rev. Mod. Phys. 1999, 71, S374–S382. [Google Scholar] [CrossRef]
- Forterre, Y.; Pouliquen, O. Flows of Dense Granular Media. Annu. Rev. Fluid Mech. 2008, 40, 1–24. [Google Scholar] [CrossRef]
- Fang, N.; Xu, R.; Huang, L.; Zhang, B.; Duan, P.; Li, N.; Luo, Y.; Li, Y. SMALL GRAIN 11 Controls Grain Size, Grain Number and Grain Yield in Rice. Rice 2016, 9, 64. [Google Scholar] [CrossRef]
- Sielamowicz, I.; Czech, M.; Kowalewski, T.A. Empirical Description of Granular Flow inside a Model Silo with Vertical Walls. Biosyst. Eng. 2011, 108, 334–344. [Google Scholar] [CrossRef]
- Zhu, H.C.; Hu, L.; Bai, J.Y. Data-Processing Method for Millikan Oi-l Drop Experiment. Phys. Exp. Ation 2010, 30, 39–42+46. [Google Scholar]
- Xiao, G.X. Numerical Simulation Study upon Granular Materials Flow in Silos. Ph.D. Thesis, Nanjing Tech University, Nanjing, China, 2004. [Google Scholar]
- Xu, Y.; Kafui, K.D.; Thornton, G. Discharge Simulations with Different Particulate Properties Using the Distinct Element Method. Trans. CSAE 1999, 15, 65–69. [Google Scholar]
- Wang, Z.; Van Beers, R.; Aernouts, B.; Watté, R.; Verboven, P.; Nicolaï, B.; Saeys, W. Microstructure Affects Light Scattering in Apples. Postharvest Biol. Technol. 2020, 159, 110996. [Google Scholar] [CrossRef]
- Rabinovich, E.; Kalman, H.; Peterson, P.F. Granular Material Flow Regime Map for Planar Silos and Hoppers. Powder Technol. 2021, 377, 597–606. [Google Scholar] [CrossRef]
- Vallero, D.A. Handbook of Measurement in Science and Engineering; Wiley & Sons: Hoboken, NJ, USA, 2013. [Google Scholar] [CrossRef]
- Livers, B.; Lininger, K.B.; Kramer, N.; Sendrowski, A. Porosity Problems: Comparing and Reviewing Methods for Estimating Porosity and Volume of Wood Jams in the Field. Earth Surf. Process. Landf. 2020, 45, 3336–3353. [Google Scholar] [CrossRef]
Figure 1.
Three-dimensional diagram of the paddy porosity measurement apparatus (a) and its schematic diagram (b). 1. Paddy inlet. 2. Paddy porosity measurement layer. 3. The air–paddy interaction chamber. 4. Sensor B. 5. A structural frame. 6. Paddy outlet. 7. Sensor A. 8. Metal blade. 9. Six-blade valve. 10. Centrifugal fan. 11. Paperless recorder. 12. Monitor. 13. Air duct. 14. Base.
Figure 2.
A paddy porosity measurement platform. 1. Paddy inlet. 2. The porosity measurement area. 3. A wind pressure sensor. 4. A structural frame. 5. The air–paddy interaction chamber. 6. Ventilation pipes. 7. Three-way PVC pipes. 8. The wind speed monitor. 9. Paddy outlet. 10. Differential pressure monitor. 11. Sensor pipes B. 12. Paperless recorder. 13. Sensor pipes A. 14. Monitor. 15. Centrifugal fan. 16. Wind speed governor.
Figure 3.
Paddy flow velocity regulating mechanism (a) and paddy flow velocity (b).
Figure 3.
Paddy flow velocity regulating mechanism (a) and paddy flow velocity (b).
Figure 4.
The working principle diagram of actual paddy drying equipment.
Figure 4.
The working principle diagram of actual paddy drying equipment.
Figure 5.
Mesh independency analysis.
Figure 5.
Mesh independency analysis.
Figure 6.
Mesh division of porosity measuring instrument.
Figure 6.
Mesh division of porosity measuring instrument.
Figure 7.
Simulation model of paddy porosity measurement and paddy particles.
Figure 7.
Simulation model of paddy porosity measurement and paddy particles.
Figure 8.
Variation of paddy velocity.
Figure 8.
Variation of paddy velocity.
Figure 9.
Effect of Mc on porosity.
Figure 9.
Effect of Mc on porosity.
Figure 10.
Effect of L on porosity.
Figure 10.
Effect of L on porosity.
Figure 11.
Effect of vd on porosity.
Figure 11.
Effect of vd on porosity.
Figure 12.
Effect of vw on porosity.
Figure 12.
Effect of vw on porosity.
Figure 13.
Effect of vd·Mc on εr (a), corresponding contour plot (b).
Figure 13.
Effect of vd·Mc on εr (a), corresponding contour plot (b).
Figure 14.
Effect of vd·H on εr (a), corresponding contour plot (b).
Figure 14.
Effect of vd·H on εr (a), corresponding contour plot (b).
Figure 15.
Five local porosity measurement layers.
Figure 15.
Five local porosity measurement layers.
Figure 16.
Paddy quality in each layer is measured by local porosity.
Figure 16.
Paddy quality in each layer is measured by local porosity.
Figure 17.
Fitted curve plot.
Figure 17.
Fitted curve plot.
Table 1.
The true density corresponding to different moisture content.
Table 1.
The true density corresponding to different moisture content.
| Moisture Content (%w.b.) | True Density (g/cm3) |
|---|
| 14 | 1.3912 |
| 23 | 1.3676 |
| 32 | 1.3418 |
Table 2.
Air parameters [
12].
Table 2.
Air parameters [
12].
Dry Bulb
Temperature (°C) | Relative Humidity (%) | Air Density ρa (kg/m3) | Dynamic Viscosity of Air μ (Pa·s) |
|---|
| 18–22 | 42–44 | 1.21 | 1.8033 × 10⁻⁵ |
Table 3.
Relation between valve opening and paddy flow velocity with different moisture content.
Table 3.
Relation between valve opening and paddy flow velocity with different moisture content.
| Moisture Content of Paddy Mc (%w.b.) | The Valve Opening l (mm) | Velocity of Paddy Flow Layer vd (m/s) |
|---|
| 14% | 6 | 0.014613 ± 0.003992 |
| 7.5 | 0.030077 ± 0.006606 |
| 9 | 0.050385 ± 0.017390 |
| 23% | 5.5 | 0.013733 ± 0.006240 |
| 7 | 0.030035 ± 0.009666 |
| 9 | 0.052280 ± 0.009922 |
| 32% | 6 | 0.014004 ± 0.007629 |
| 8 | 0.033391 ± 0.008789 |
| 9.5 | 0.049139 ± 0.004045 |
Table 4.
Mesh quality assessment form.
Table 4.
Mesh quality assessment form.
| Parameters | Values |
|---|
| Minimum element quality | 0.21 |
| Maximum aspect ratio | 8.581 |
| Minimum orthogonal quality | 0.2 |
| Maximum skewness | 0.8 |
| Minimum tetrahedral collapse ratio | 0.195 |
| The number of mesh | 386,980 |
Table 5.
Parameters related to the simulation model [
15].
Table 5.
Parameters related to the simulation model [
15].
| Parameters | Values | Unit |
|---|
| Poisson ratio of paddy particles | 0.25 | - |
| Shear modulus of paddy particles | 54.3 | MPa |
| Elastic recovery coefficient between paddy particles | 0.4 | - |
| Coefficient of static friction between paddy particles | 0.81 | - |
| Coefficient of rolling friction between paddy particles | 0.01 | - |
| Poisson ratio of acrylic wall | 0.35 | |
| Acrylic wall density | 1.18 | g/cm3 |
| Shear modulus of acrylic wall | 252 | MPa |
| Elastic recovery coefficient of paddy particles and acrylic wall | 0.42 | - |
| Static friction coefficient between paddy particles and acrylic wall | 0.53 | - |
| Coefficient of rolling friction between paddy particles and acrylic wall | 0.01 | - |
Table 6.
Single-factor experimental scheme.
Table 6.
Single-factor experimental scheme.
| Number | Moisture Content Mc (%w.b.) | Wind Speed vw (m/s) | Paddy Velocity vd (m/s) | Layer Thickness L (cm) |
|---|
| 1 | 14 | 0.6 | 0.03 | 15 |
| 2 | 23 |
| 3 | 32 |
| 4 | 23 | 0.4 | 0.03 | 15 |
| 5 | 0.6 |
| 6 | 0.8 |
| 7 | 23 | 0.6 | 0.01 | 15 |
| 8 | 0.03 |
| 9 | 0.05 |
| 10 | 23 | 0.6 | 0.03 | 10 |
| 11 | 15 |
| 12 | 20 |
Table 7.
Box–Behnken experimental scheme.
Table 7.
Box–Behnken experimental scheme.
| Code | Moisture Content Mc (%w.b.) | Paddy Velocity vd (m/s) | Wind Speed vw (m/s) | Layer Thickness L (cm) |
|---|
| 1 | 14 | 0.01 | 0.4 | 10 |
| 0 | 23 | 0.03 | 0.6 | 15 |
| −1 | 32 | 0.05 | 0.8 | 20 |
Table 8.
Uncertainty of experiment parameters.
Table 8.
Uncertainty of experiment parameters.
| Parameter Name | Units | Uncertainty |
|---|
| Outlet wind speed (vw) | m/s | ±0.02 |
| Wind pressure difference () | Pa | ±0.03 |
| Velocity of paddy bed (vd) | m/s | ±0.03 |
| Valve opening (l) | mm | ±0.05 |
| Volume flow (Q) | m3/s | ±0.02 |
| Equivalent diameter of paddy (Dp) | mm | ±0.03 |
Table 9.
Results of Box–Behnken experiment.
Table 9.
Results of Box–Behnken experiment.
| Std | Run | X1 | X2 | X3 | X4 | | Y |
|---|
| 16 | 1 | 23 (0) | 0.05 (1) | 0.8 (1) | 15 (0) | −168 | 44.993 |
| 20 | 2 | 32 (1) | 0.03 (0) | 0.8 (1) | 15 (0) | −187 | 43.690 |
| 22 | 3 | 23 (0) | 0.05 (1) | 0.6 (0) | 10 (−1) | −63 | 45.178 |
| 5 | 4 | 23 (0) | 0.03 (0) | 0.4 (−1) | 10 (−1) | −29 | 45.679 |
| 24 | 5 | 23 (0) | 0.05 (1) | 0.6 (0) | 20 (1) | −164 | 42.933 |
| 29 | 6 | 23 (0) | 0.03 (0) | 0.6 (0) | 15 (0) | −102 | 44.322 |
| 17 | 7 | 14 (−1) | 0.03 (0) | 0.4 (−1) | 15 (0) | −45 | 45.100 |
| 2 | 8 | 32 (1) | 0.01 (−1) | 0.6 (0) | 15 (0) | −135 | 41.411 |
| 14 | 9 | 23 (0) | 0.05 (1) | 0.4 (−1) | 15 (0) | −44 | 45.601 |
| 15 | 10 | 23 (0) | 0.01 (−1) | 0.8 (1) | 15 (0) | −191 | 42.417 |
| 4 | 11 | 32 (1) | 0.05 (1) | 0.6 (0) | 15 (0) | −99 | 45.403 |
| 11 | 12 | 14 (−1) | 0.03 (0) | 0.6 (0) | 20 (1) | −149 | 43.210 |
| 28 | 13 | 23 (0) | 0.03 (0) | 0.6 (0) | 15 (0) | −102 | 44.322 |
| 3 | 14 | 14 (−1) | 0.05 (1) | 0.6 (0) | 15 (0) | −93 | 45.310 |
| 23 | 15 | 23 (0) | 0.01 (−1) | 0.6 (0) | 20 (1) | −184 | 39.562 |
| 25 | 16 | 23 (0) | 0.03 (0) | 0.6 (0) | 15 (0) | −102 | 44.322 |
| 9 | 17 | 14 (−1) | 0.03 (0) | 0.6 (0) | 10 (−1) | −60 | 46.006 |
| 10 | 18 | 32 (1) | 0.03 (0) | 0.6 (0) | 10 (−1) | −64 | 45.258 |
| 6 | 19 | 23 (0) | 0.03 (0) | 0.8 (1) | 10 (−1) | −114 | 44.817 |
| 26 | 20 | 23 (0) | 0.03 (0) | 0.6 (0) | 15 (0) | −102 | 44.322 |
| 19 | 21 | 14 (−1) | 0.03 (0) | 0.8 (1) | 15 (0) | −165 | 45.181 |
| 8 | 22 | 23 (0) | 0.03 (0) | 0.8 (1) | 20 (1) | −201 | 40.233 |
| 1 | 23 | 14 (−1) | 0.01 (−1) | 0.6 (0) | 15 (0) | −97 | 44.914 |
| 18 | 24 | 32 (1) | 0.03 (0) | 0.4 (−1) | 15 (0) | −54 | 43.234 |
| 21 | 25 | 23 (0) | 0.01 (−1) | 0.6 (0) | 10 (−1) | −62 | 45.889 |
| 27 | 26 | 23 (0) | 0.03 (0) | 0.6 (0) | 15 (0) | −102 | 44.322 |
| 13 | 27 | 23 (0) | 0.01 (−1) | 0.4 (−1) | 15 (0) | −56 | 42.816 |
| 12 | 28 | 32 (1) | 0.03 (0) | 0.6 (0) | 20 (1) | −187 | 40.814 |
| 7 | 29 | 23 (0) | 0.03 (0) | 0.4 (−1) | 20 (1) | −94 | 40.444 |
Table 10.
Analysis of variance.
Table 10.
Analysis of variance.
| Source | Sum of Squares | df | Mean Square | F-Value | p-Value |
|---|
| Model | 91.1 | 14 | 6.51 | 30.23 | <0.0001 |
| X1 | 8.19 | 1 | 8.19 | 38.02 | <0.0001 *** |
| X2 | 12.83 | 1 | 12.83 | 59.6 | <0.0001 *** |
| X3 | 0.1984 | 1 | 0.1984 | 0.9217 | 0.3533 |
| X4 | 54.75 | 1 | 54.75 | 254.29 | <0.0001 *** |
| X1×2 | 3.23 | 1 | 3.23 | 15.02 | 0.0017 *** |
| X1X3 | 0.0352 | 1 | 0.0352 | 0.1633 | 0.6922 |
| X1X4 | 0.679 | 1 | 0.679 | 3.15 | 0.0975 |
| X2X3 | 0.0109 | 1 | 0.0109 | 0.0507 | 0.8251 |
| X2X4 | 4.17 | 1 | 4.17 | 19.35 | 0.0006 *** |
| X3X4 | 0.1059 | 1 | 0.1059 | 0.492 | 0.4945 |
| X12 | 0.6877 | 1 | 0.6877 | 3.19 | 0.0956 |
| X22 | 0.0253 | 1 | 0.0253 | 0.1174 | 0.737 |
| X32 | 0.7505 | 1 | 0.7505 | 3.49 | 0.083 |
| X42 | 4.83 | 1 | 4.83 | 22.44 | 0.0003 *** |
| Residual | 3.01 | 14 | 0.2153 | | |
| Lack of fit | 2.82 | 10 | 0.2821 | 5.85 | 0.0517 |
| Pure error | 0.1929 | 4 | 0.0482 | | |
| Cor total | 94.11 | 28 | | | |
| Mean | 43.83 |
| C.V.% | 1.06 |
| R2 | 0.968 |
| Adj R2 | 0.936 |
Table 11.
Comparative experimental results.
Table 11.
Comparative experimental results.
| Number | εs/% | εp/% | εr/% | RE/% |
|---|
| Relative Error of εs and εr | Relative Error of εp and εr |
|---|
| 1 | 45.150 | 44.672 | 44.993 | 0.35 | 0.72 |
| 2 | 43.922 | 43.351 | 43.690 | 0.53 | 0.78 |
| 3 | 45.523 | 45.458 | 45.178 | 0.76 | −0.62 |
| 4 | 45.824 | 45.453 | 45.679 | 0.32 | 0.50 |
| 5 | 42.540 | 43.226 | 42.933 | −0.92 | −0.68 |
| 6 | 44.646 | 44.226 | 44.322 | 0.73 | 0.22 |
| 7 | 45.437 | 45.264 | 45.100 | 0.74 | −0.36 |
| 8 | 41.516 | 41.733 | 41.411 | 0.25 | −0.77 |
| 9 | 45.693 | 45.345 | 45.601 | 0.20 | 0.56 |
| 10 | 42.275 | 42.711 | 42.417 | −0.34 | −0.69 |
| 11 | 44.988 | 45.598 | 45.403 | −0.92 | −0.43 |
| 12 | 43.611 | 42.795 | 43.210 | 0.92 | 0.97 |
| 13 | 44.646 | 44.227 | 44.322 | 0.73 | 0.21 |
| 14 | 45.708 | 45.456 | 45.310 | 0.87 | −0.32 |
| 15 | 39.461 | 39.419 | 39.562 | −0.26 | 0.36 |
| 16 | 44.646 | 44.221 | 44.322 | 0.73 | 0.23 |
| 17 | 46.089 | 46.241 | 46.006 | 0.18 | −0.51 |
| 18 | 45.342 | 45.418 | 45.258 | 0.19 | −0.35 |
| 19 | 44.946 | 44.874 | 44.817 | 0.29 | −0.13 |
| 20 | 44.646 | 44.226 | 44.322 | 0.73 | 0.22 |
| 21 | 45.359 | 44.813 | 45.181 | 0.39 | 0.82 |
| 22 | 40.159 | 40.627 | 40.233 | −0.18 | −0.97 |
| 23 | 45.222 | 45.184 | 44.914 | 0.68 | −0.60 |
| 24 | 43.384 | 43.423 | 43.234 | 0.35 | −0.44 |
| 25 | 45.708 | 45.627 | 45.889 | −0.40 | 0.57 |
| 26 | 44.646 | 44.223 | 44.322 | 0.73 | 0.22 |
| 27 | 42.981 | 42.868 | 42.816 | 0.38 | −0.12 |
| 28 | 41.101 | 40.471 | 40.814 | 0.70 | 0.85 |
| 29 | 40.487 | 40.758 | 40.444 | 0.11 | −0.77 |
Table 12.
Comparison between predicted and simulated values of paddy porosity.
Table 12.
Comparison between predicted and simulated values of paddy porosity.
| Number | Mc (%) | Vd (m/s) | Vw (m/s) | L (cm) | εp (%) | εr (%) | Relative
Error (%) |
|---|
| 1 | 16 | 0.02 | 0.5 | 11 | 45.096 | 45.463 | −0.81 |
| 2 | 17 | 0.04 | 0.7 | 12 | 42.298 | 42.214 | 0.20 |
| 3 | 18 | 0.05 | 0.5 | 13 | 39.060 | 39.401 | −0.87 |
| 4 | 19 | 0.05 | 0.6 | 12 | 40.299 | 40.365 | −0.16 |
| 5 | 16 | 0.02 | 0.5 | 11 | 45.096 | 44.996 | 0.22 |
| Disclaimer/Publisher’s Note: The statements, opinions and data contained in all publications are solely those of the individual author(s) and contributor(s) and not of MDPI and/or the editor(s). MDPI and/or the editor(s) disclaim responsibility for any injury to people or property resulting from any ideas, methods, instructions or products referred to in the content. |
© 2025 by the authors. Licensee MDPI, Basel, Switzerland. This article is an open access article distributed under the terms and conditions of the Creative Commons Attribution (CC BY) license (https://creativecommons.org/licenses/by/4.0/).


