
Automated Detection and Counting of Gossypium barbadense Fruits in Peruvian Crops Using Convolutional Neural Networks


Abstract
1. Introduction
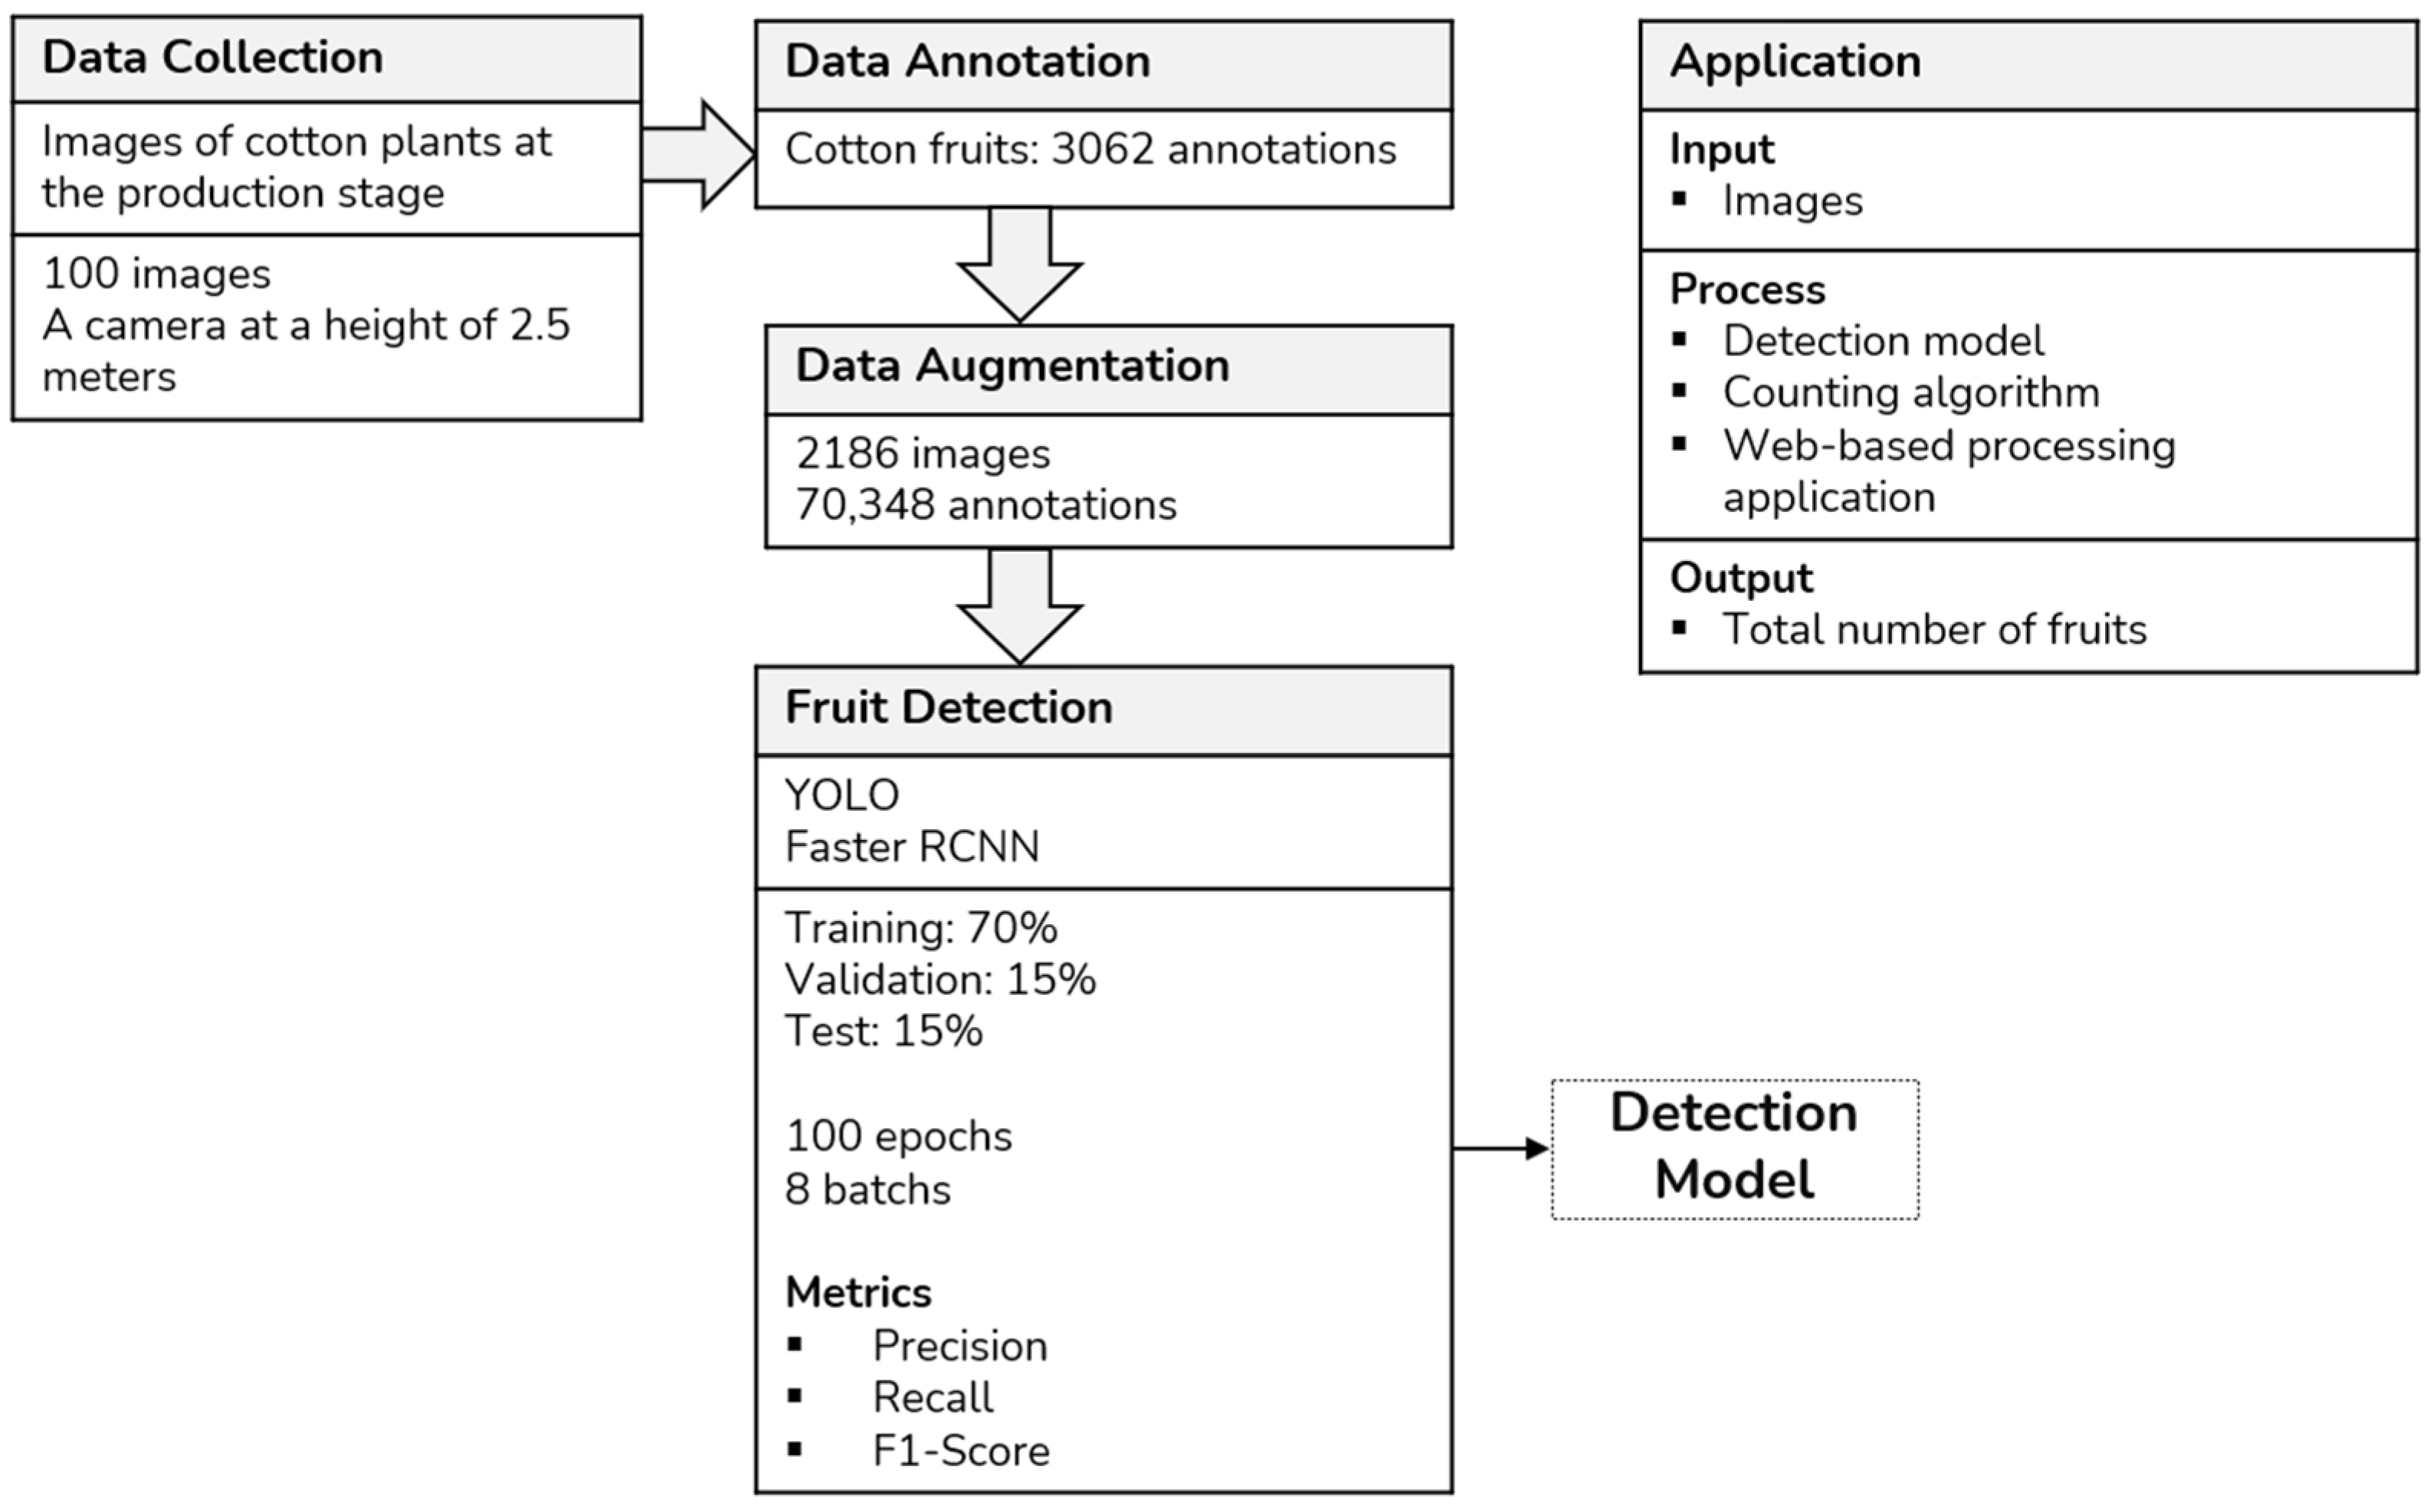
2. Materials and Methods
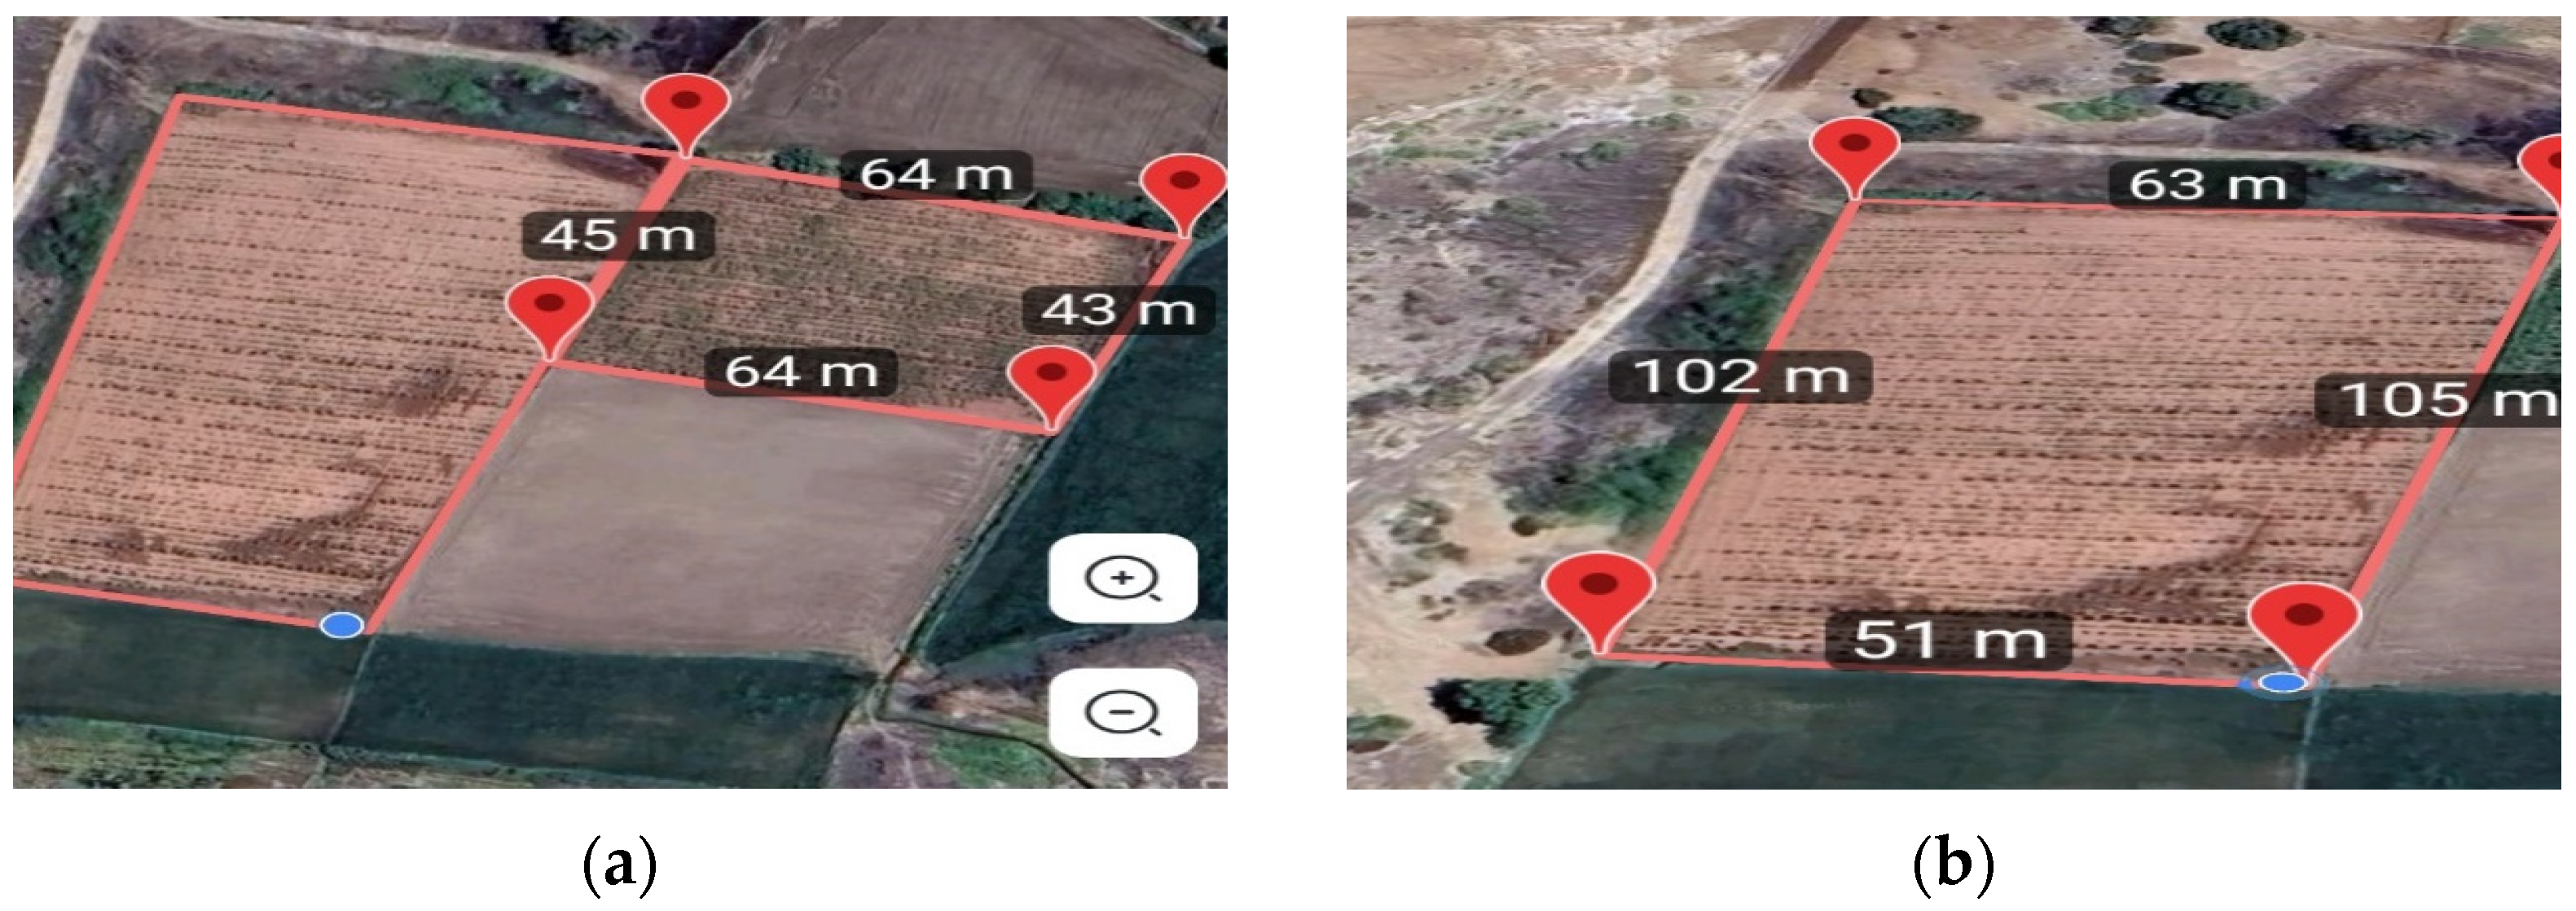
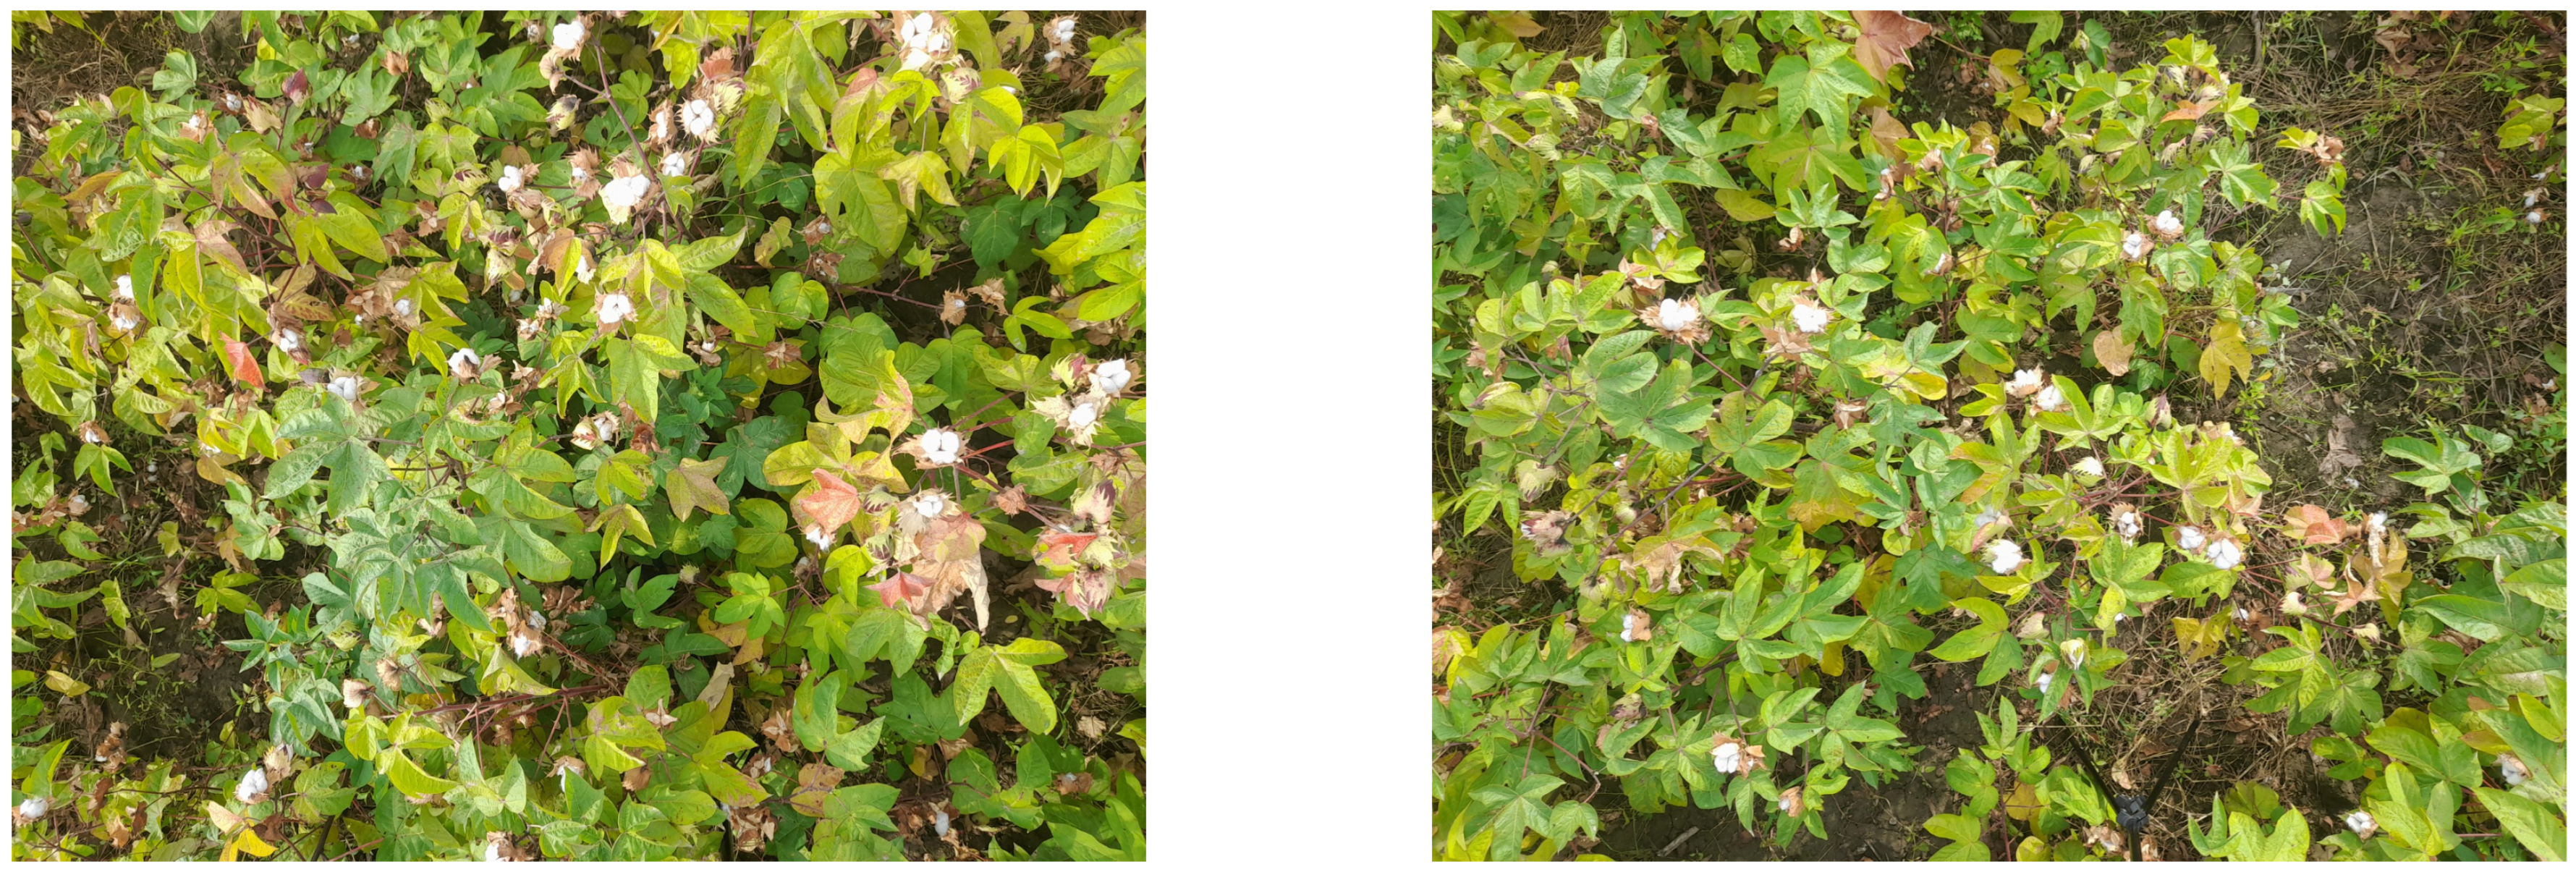
2.1. Study Area and Data Collection
2.2. Data Collection
2.3. Data Anotation
2.4. Data Augmentation
2.5. Fruit Detection
2.5.1. YOLO
2.5.2. Faster R-CNN
2.6. Performance Evaluation
3. Results
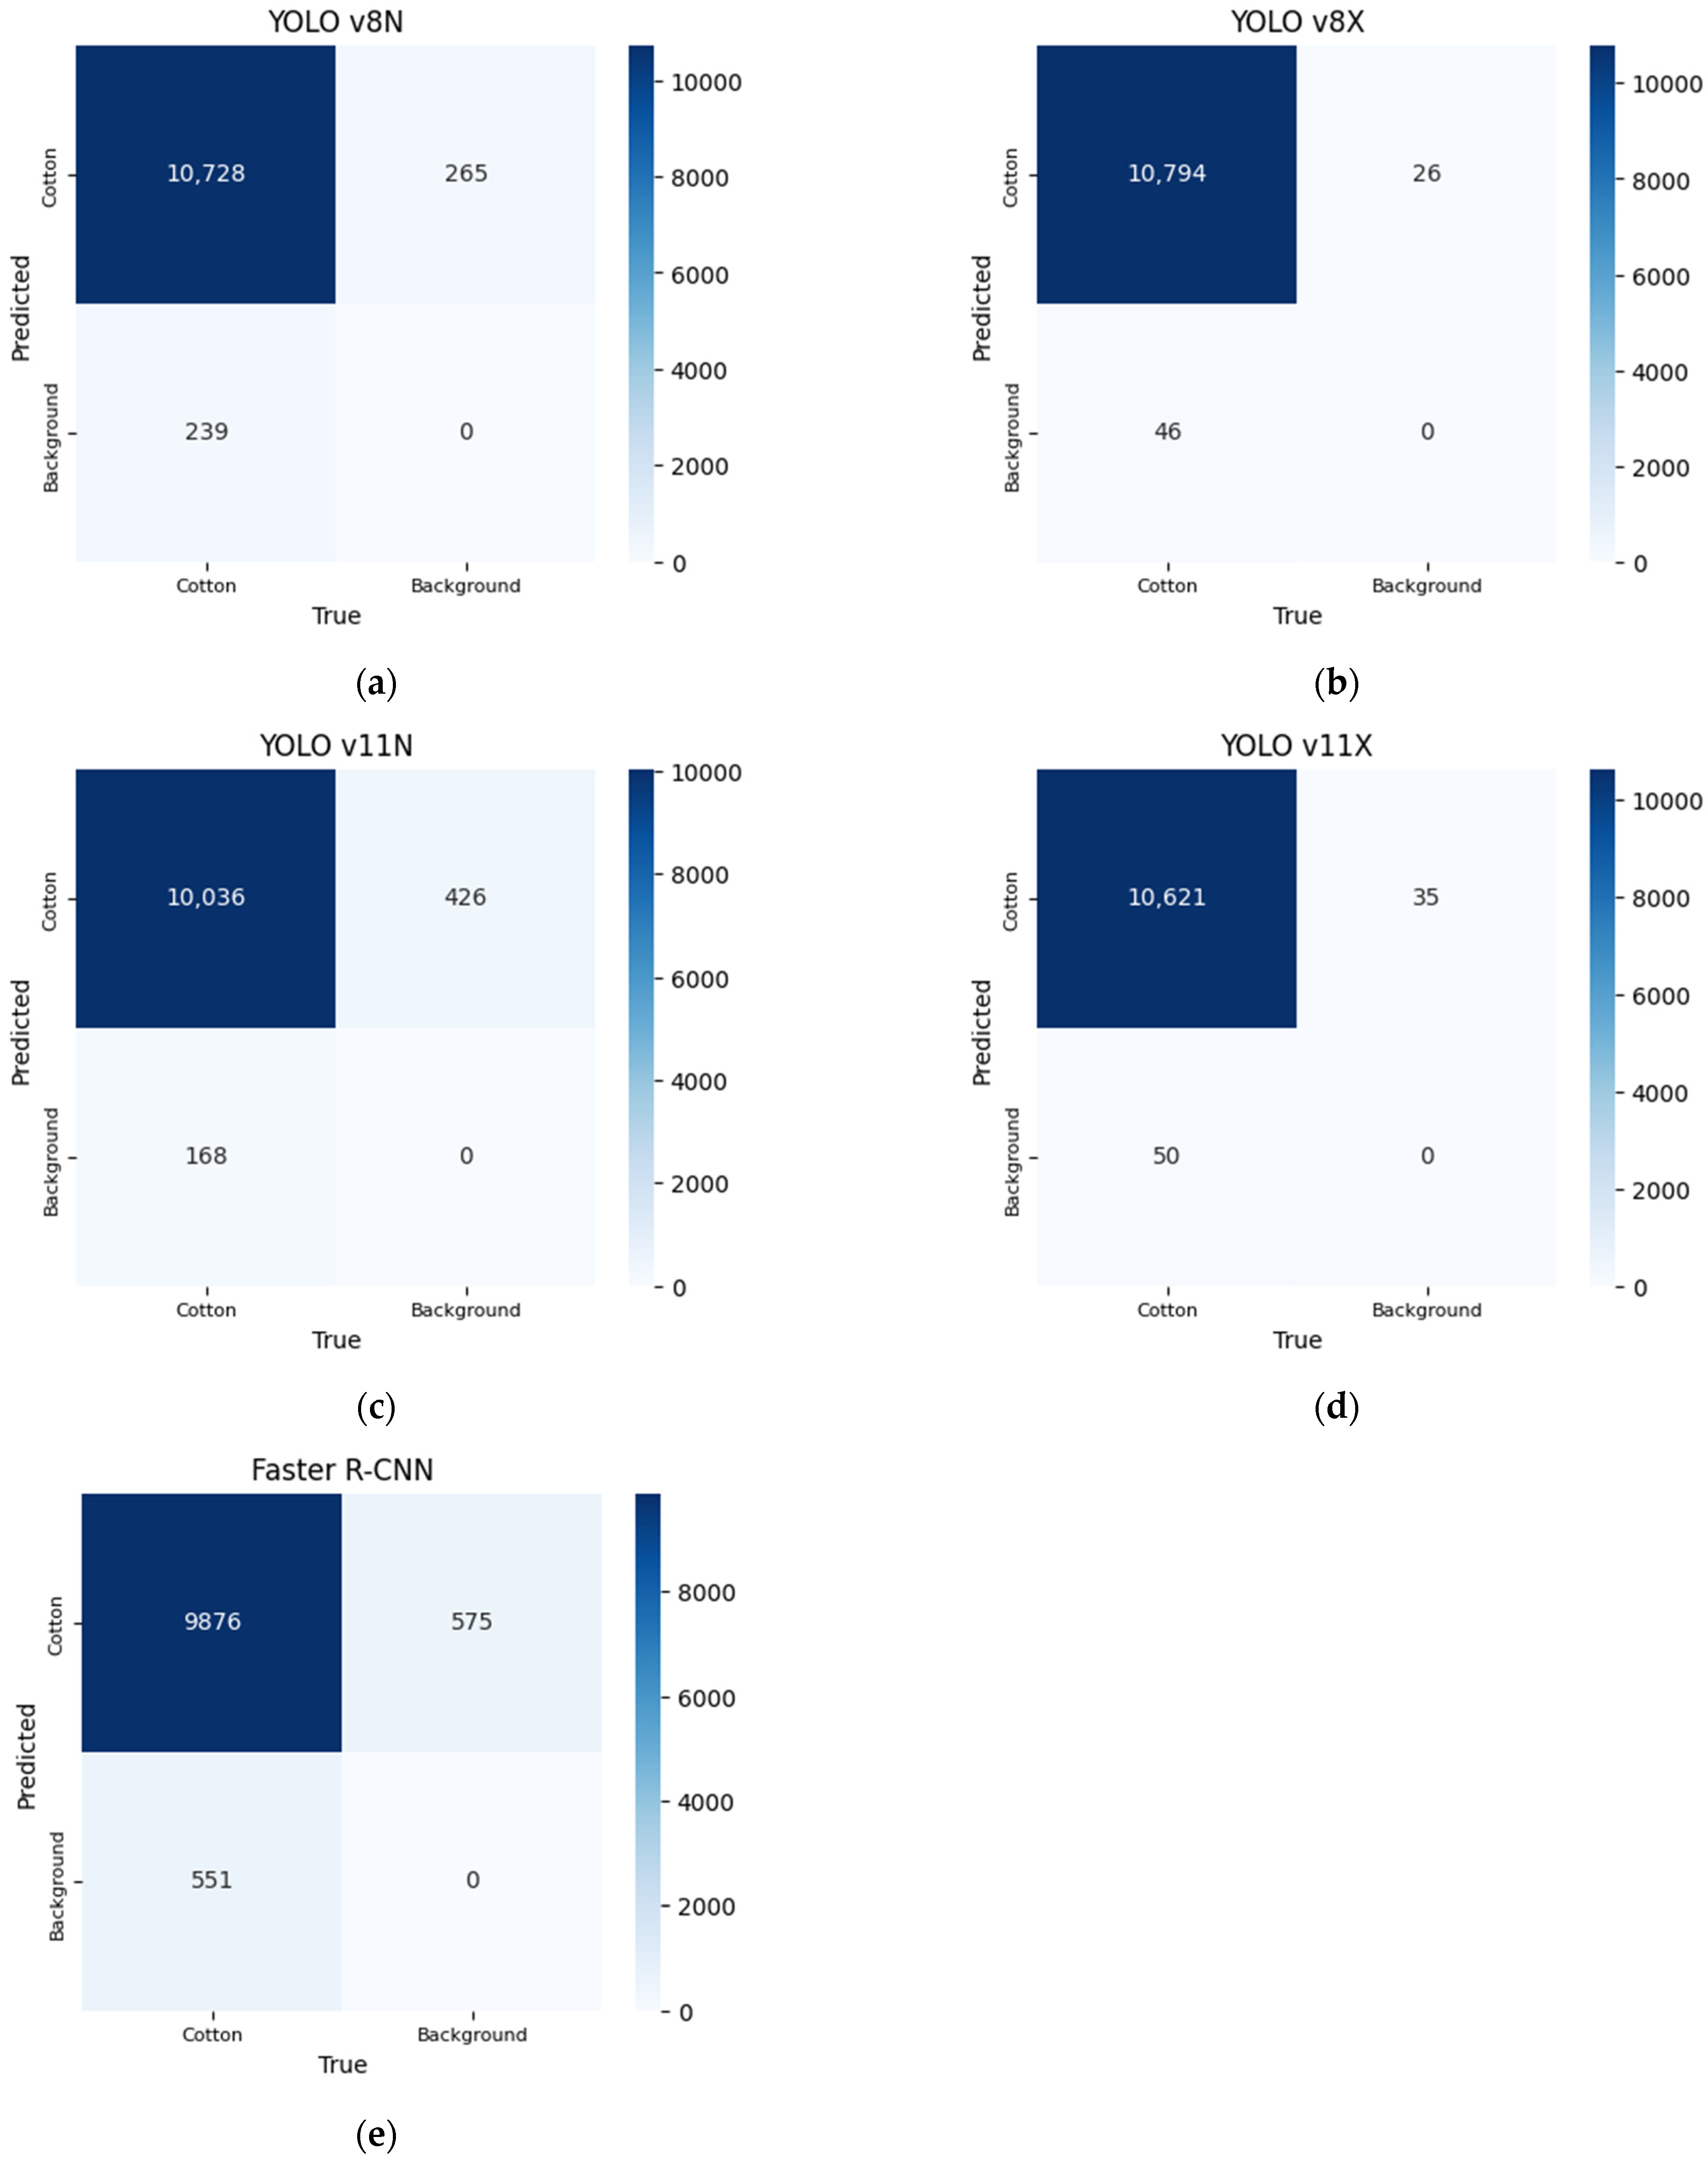
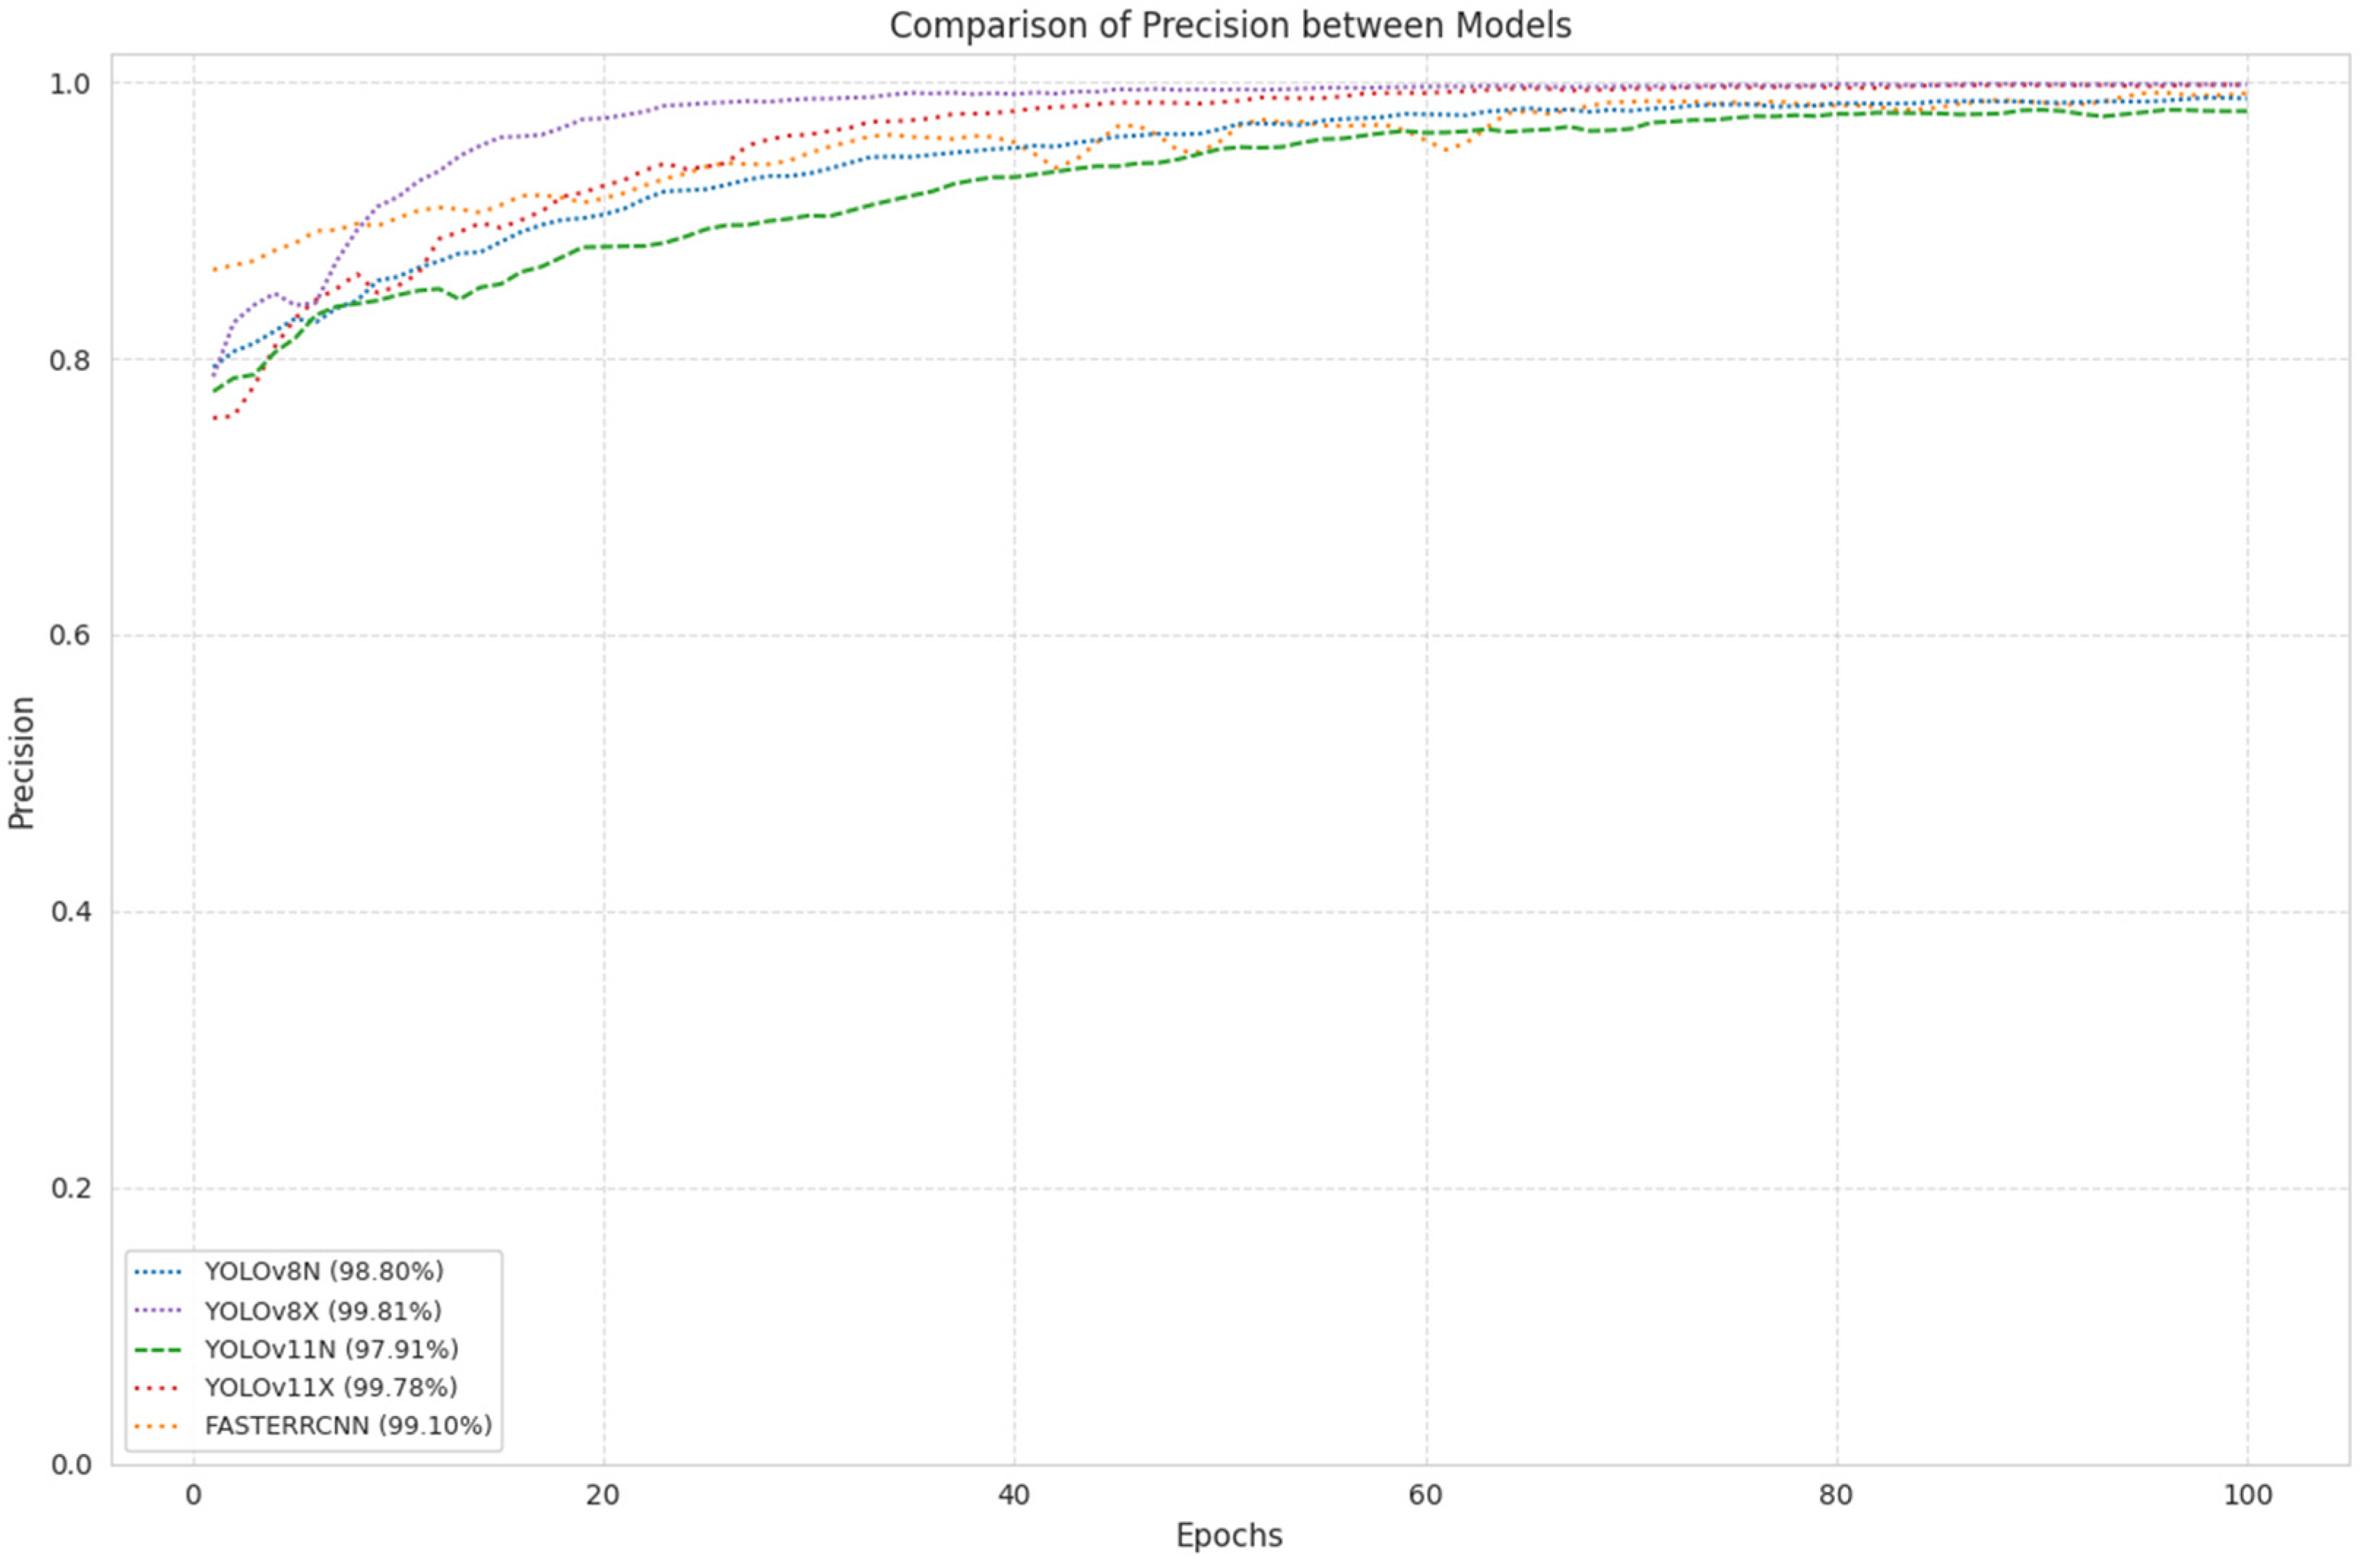
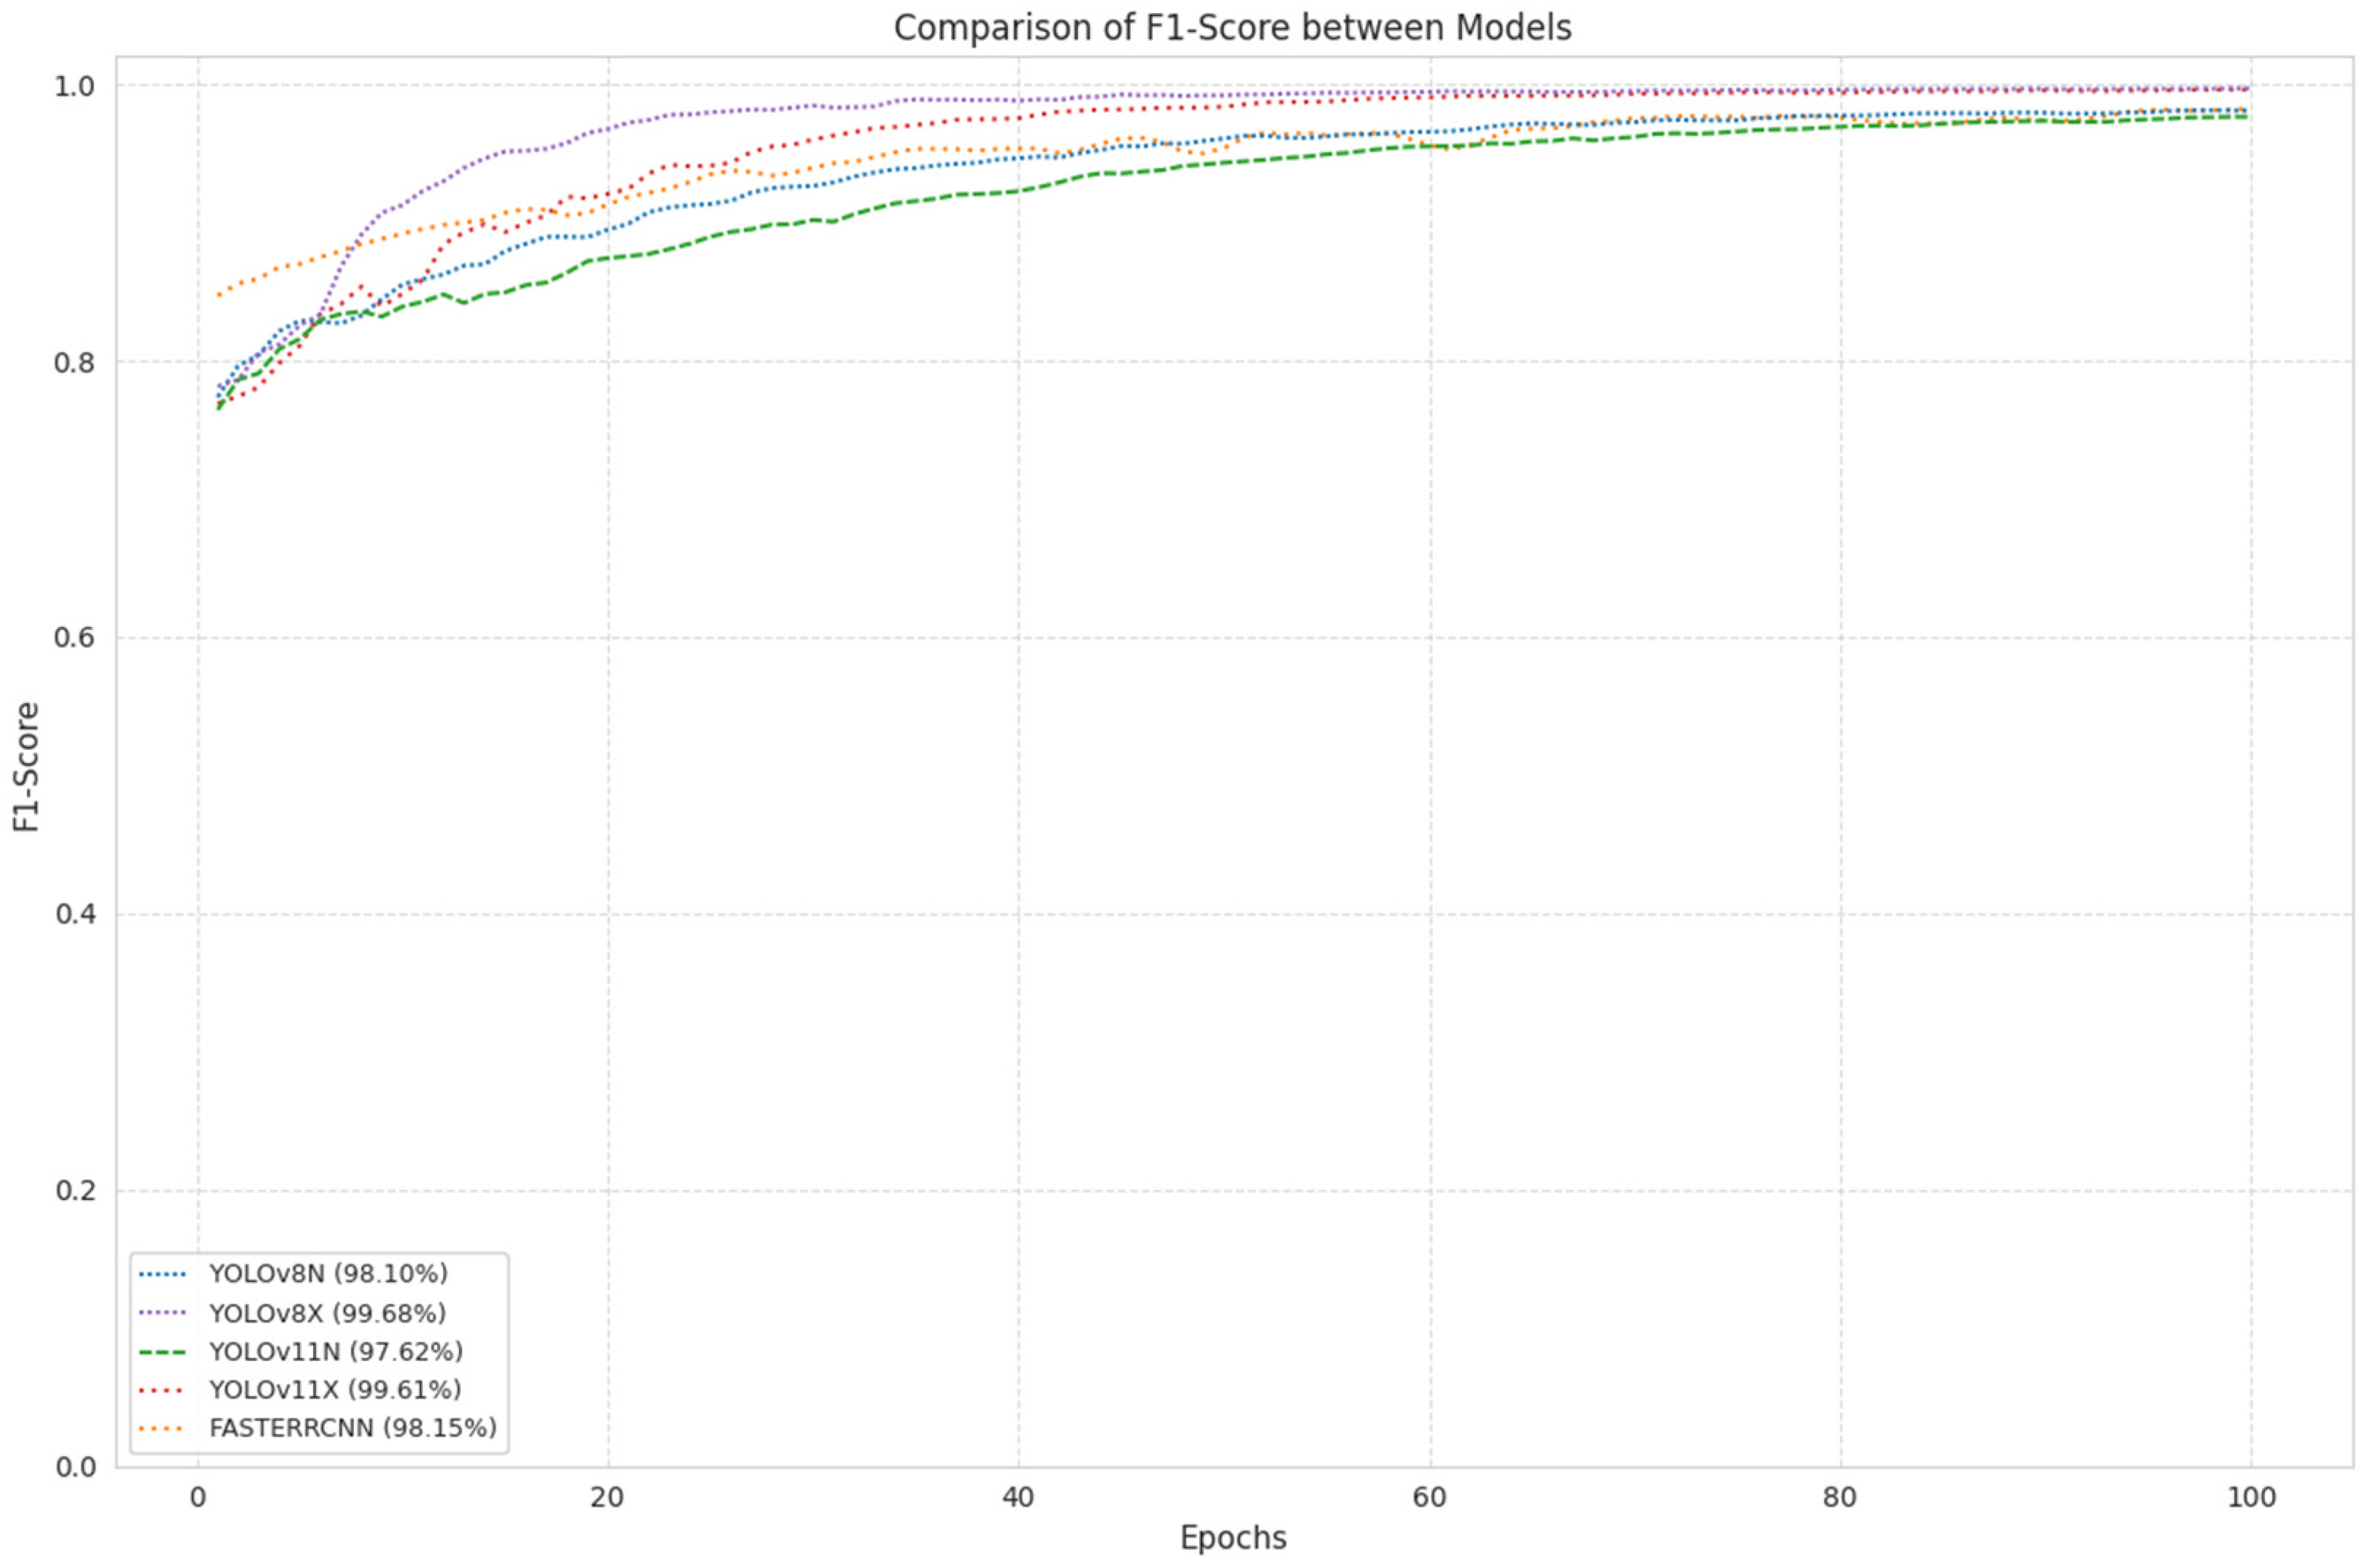
3.1. Performance
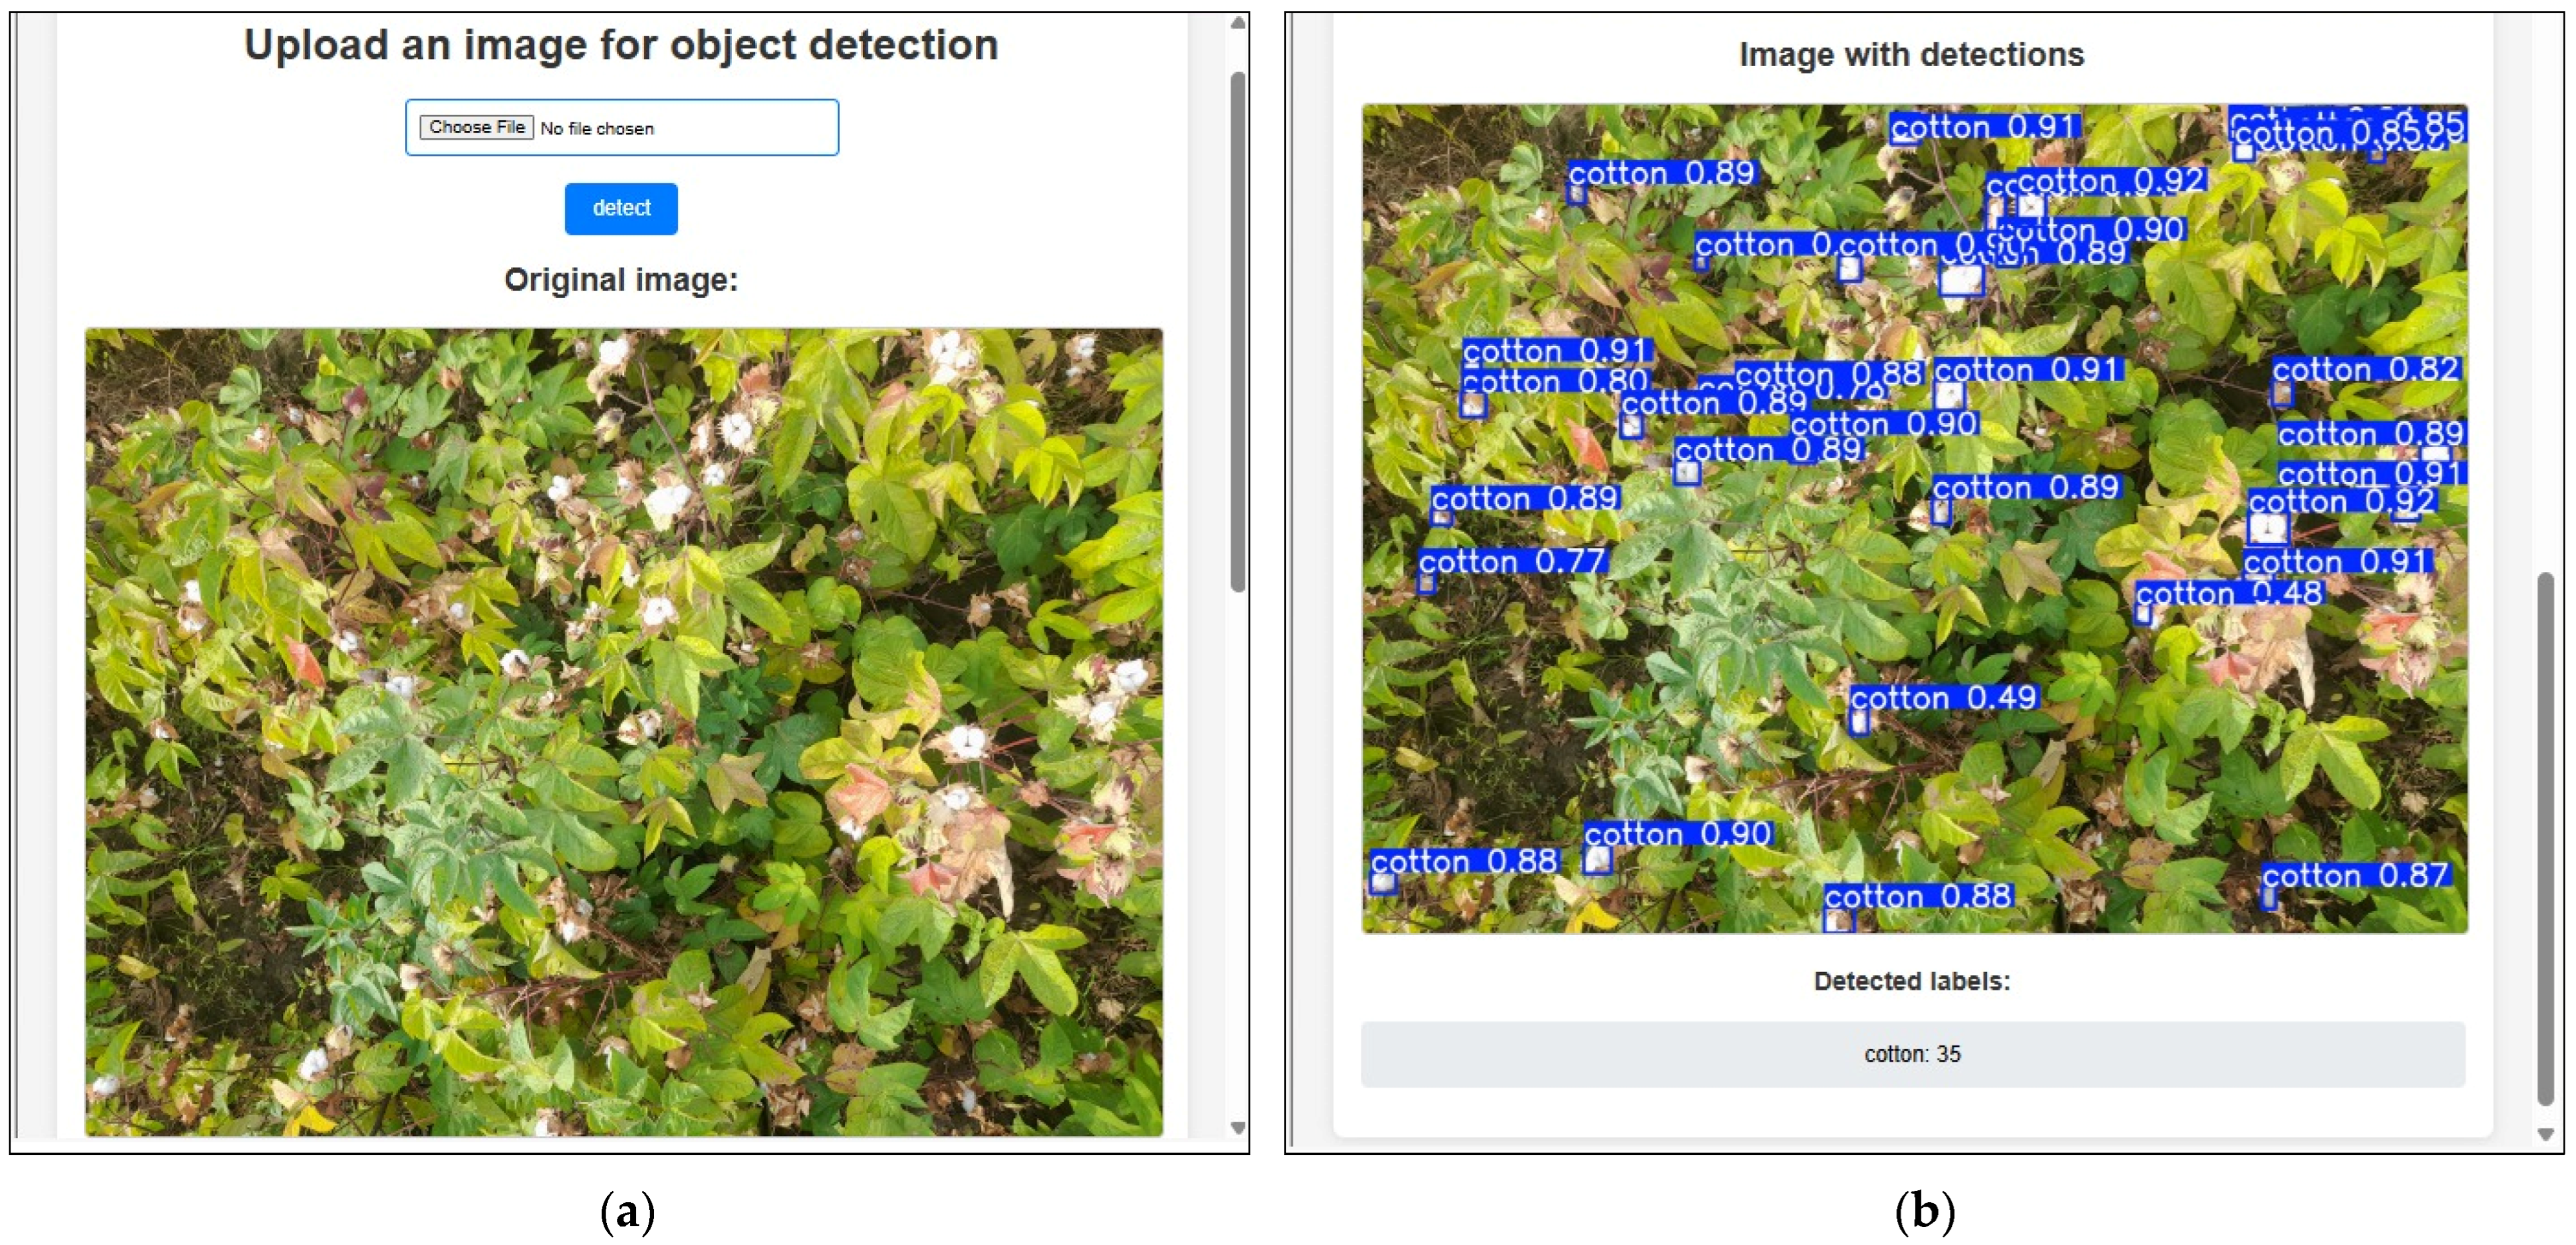
3.2. Application
4. Discussion
5. Conclusions
Author Contributions
Funding
Institutional Review Board Statement
Informed Consent Statement
Data Availability Statement
Conflicts of Interest
References
- Farjon, G.; Huijun, L.; Edan, Y. Deep-learning-based counting methods, datasets, and applications in agriculture: A review. Precis. Agric. 2023, 24, 1683–1711. [Google Scholar] [CrossRef]
- Manavalan, R. Towards an intelligent approaches for cotton diseases detection: A review. Comput. Electron. Agric. 2022, 200, 107255. [Google Scholar] [CrossRef]
- Tedesco-Oliveira, D.; da Silva, R.P.; Maldonado, W.; Zerbato, C. Convolutional neural networks in predicting cotton yield from images of commercial fields. Comput. Electron. Agric. 2020, 171, 105307. [Google Scholar] [CrossRef]
- Dang, F.; Chen, D.; Lu, Y.; Li, Z.; Zheng, Y. DeepCottonWeeds (DCW): A Novel Benchmark of YOLO Object Detectors for Weed Detection in Cotton Production Systems. In Proceedings of the 2022 ASABE Annual International Meeting, Houston, TX, USA, 17–20 July 2022; American Society of Agricultural and Biological Engineers: St. Joseph, MI, USA, 2022. [Google Scholar] [CrossRef]
- Bappi, M.B.R.; Swapno, S.M.M.R.; Rabbi, M.M.F. Deploying DenseNet for Cotton Leaf Disease Detection on Deep Learning; Springer: Berlin/Heidelberg, Germany, 2025; pp. 485–498. [Google Scholar] [CrossRef]
- Meng, K.; Xu, K.; Cattani, P.; Mei, S. Camouflaged cotton bollworm instance segmentation based on PVT and Mask R-CNN. Comput. Electron. Agric. 2024, 226, 109450. [Google Scholar] [CrossRef]
- Zhang, M.; Chen, W.; Gao, P.; Li, Y.; Tan, F.; Zhang, Y.; Ruan, S.; Xing, P.; Guo, L. YOLO SSPD: A small target cotton boll detection model during the boll-spitting period based on space-to-depth convolution. Front. Plant Sci. 2024, 15, 1409194. [Google Scholar] [CrossRef] [PubMed]
- Huang, Y.; Li, Y.; Liu, Y.; Zheng, D. In-field cotton counting and localization jointly based on density-guided optimal transport. Comput. Electron. Agric. 2023, 212, 108058. [Google Scholar] [CrossRef]
- Fue, K.G.; Porter, W.M.; Rains, G.C. Deep Learning based Real-time GPU-accelerated Tracking and Counting of Cotton Bolls under Field Conditions using a Moving Camera. In Proceedings of the 2018 ASABE Annual International Meeting, Detroit, MI, USA, 29 July–1 August 2018; American Society of Agricultural and Biological Engineers: St. Joseph, MI, USA, 2018. [Google Scholar] [CrossRef]
- Li, F.; Bai, J.; Zhang, M.; Zhang, R. Yield estimation of high-density cotton fields using low-altitude UAV imaging and deep learning. Plant Methods 2022, 18, 55. [Google Scholar] [CrossRef] [PubMed]
- Yeom, J.; Jung, J.; Chang, A.; Maeda, M.; Landivar, J. Automated Open Cotton Boll Detection for Yield Estimation Using Unmanned Aircraft Vehicle (UAV) Data. Remote Sens. 2018, 10, 1895. [Google Scholar] [CrossRef]
- Xu, R.; Li, C.; Paterson, A.H.; Jiang, Y.; Sun, S.; Robertson, J.S. Aerial Images and Convolutional Neural Network for Cotton Bloom Detection. Front. Plant Sci. 2018, 8, 2235. [Google Scholar] [CrossRef] [PubMed]
- Yu, G.; Cai, R.; Luo, Y.; Hou, M.; Deng, R. A-pruning: A lightweight pineapple flower counting network based on filter pruning. Complex Intell. Syst. 2024, 10, 2047–2066. [Google Scholar] [CrossRef]
- Bolouri, F.; Kocoglu, Y.; Pabuayon, I.L.B.; Ritchie, G.L.; Sari-Sarraf, H. CottonSense: A high-throughput field phenotyping system for cotton fruit segmentation and enumeration on edge devices. Comput. Electron. Agric. 2024, 216, 108531. [Google Scholar] [CrossRef]
- Tan, C.; Sun, J.; Paterson, A.H.; Song, H.; Li, C. Three-view cotton flower counting through multi-object tracking and RGB-D imagery. Biosyst. Eng. 2024, 246, 233–247. [Google Scholar] [CrossRef]
- Bairi, A.; Dulhare, U.N. Advanced Cotton Boll Segmentation, Detection, and Counting Using Multi-Level Thresholding Optimized with an Anchor-Free Compact Central Attention Network Model. Eng 2024, 5, 2839–2861. [Google Scholar] [CrossRef]
- Xu, R.; Paterson, A.; Li, C. Cotton flower detection using aerial color images. In Proceedings of the 2017 ASABE Annual International Meeting, Spokane, WA, USA, 16–19 July 2017; American Society of Agricultural and Biological Engineers: St. Joseph, MI, USA, 2017. [Google Scholar] [CrossRef]
- Lu, Z.; Han, B.; Dong, L.; Zhang, J. COTTON-YOLO: Enhancing Cotton Boll Detection and Counting in Complex Environmental Conditions Using an Advanced YOLO Model. Appl. Sci. 2024, 14, 6650. [Google Scholar] [CrossRef]
- Tzutalin. LabelImg: Image Annotation Tool. Available online: https://github.com/HumanSignal/labelImg (accessed on 21 December 2024).
- van Dyk, D.A.; Meng, X.-L. The Art of Data Augmentation. J. Comput. Graph. Stat. 2001, 10, 1–50. [Google Scholar] [CrossRef]
- Jiang, P.; Ergu, D.; Liu, F.; Cai, Y.; Ma, B. A Review of Yolo Algorithm Developments. Procedia Comput. Sci. 2022, 199, 1066–1073. [Google Scholar] [CrossRef]
- Ren, S.; He, K.; Girshick, R.B.; Sun, J. Faster R-CNN: Towards Real-Time Object Detection with Region Proposal Networks. arXiv 2015. [Google Scholar] [CrossRef] [PubMed]
- Reddy, J.; Niu, H.; Scott, J.L.L.; Bhandari, M.; Landivar, J.A.; Bednarz, C.W.; Duffield, N. Cotton Yield Prediction via UAV-Based Cotton Boll Image Segmentation Using YOLO Model and Segment Anything Model (SAM). Remote Sens. 2024, 16, 4346. [Google Scholar] [CrossRef]


| Insights | Dataset | Results | Applications |
|---|---|---|---|
| YOLO small-scale pyramid depth-aware detection (SSPD) model, enhancing automated detection and counting of cotton bolls (Gossypium barbadense) using UAV imagery [7]. | ‘Xinlu Early No. 53’ and ‘Xinlu Early No. 74’ varieties. Collected during three stages of cotton fluffing period. | Boll detection accuracy: 0.874 on UAV-scale imagery Coefficient of determination (R2): 0.86, RMSE: 12.38, RRMSE: 11.19% | Cotton yield estimation during the flocculation period. High-precision cotton monitoring using UAV imagery. |
| Joint cotton counting and localization algorithm using VGG19 and a density-guided optimal transport approach, effectively addressing challenges in detecting and counting Gossypium barbadense cotton in unevenly distributed and occluded field environments [8]. | Constructed in-field cotton dataset with 400 images. Dataset used for validating the proposed algorithm. | Lower counting error MAE and RMSE by 10.54 and 11.57. Increased Precision and Recall by 1.7% and 3.8%. | In-field counting of cotton status. Localization for intelligent agricultural management. |
| Automated detection and counting of cotton bolls using YOLO v2 [9]. | Twelve defoliated cotton plants in pots. 486 images with 7498 bolls for training. | System achieved 93% accuracy and 21 fps processing speed. Counting performance accuracy was around 93% with 6% standard deviation. | Robotic harvesting of cotton bolls in real-time. Navigation and environmental perception for harvesting operations. |
| Optimized Mask R-CNN with TensorRT for segmenting and counting cotton fruits in four growth stages [14]. | RGB-D cameras, 344 images | AP score of 79%, R2 = 0.94 Average segmentation model accuracy: 79%. Correlation between total fruit count per image and expert evaluations: R2 = 0.94. | CottonSense is an HTP system that monitors cotton development using computer vision, segmentation, and real-time fruit counting. |
| YOLO v8x trained to detect flowers in RGB images [15]. | Videos of cotton flowers captured with three RGB-D cameras in an experimental field | Mean Average Precision (mAP) of YOLOv8x: 96.4%. | Facilitates the study of flowering time and the productivity of different cotton genotypes without relying on manual methods. |
| An anchor-free compact central attention network model, significantly enhancing the efficiency and precision in identifying and quantifying cotton fruits in agricultural studies [16]. | Annotated dataset extracted from weakly supervised detection. Data gathered from various sources for analysis | Accuracy of proposed technique: 94%. Precision, recall, F1-score, specificity: 93.8%, 92.99%, 93.48%, 92.99%. | It utilizes image preprocessing, noise removal, segmentation, and detection. |
| CNN for detecting and counting cotton flowers in images captured by a drone [17]. | RGB images taken by a UAV | 4.5% false negatives and 5.1% false positives. A correlation between flower count and cotton yield was observed | Production estimation and agricultural management. |
| Implementation of the COTTON-YOLO model, based on YOLOv8n [18] | Images of cotton bolls captured in natural environments under varying lighting and weather conditions | COTTON-YOLO improves detection accuracy compared to YOLOv8 | Automated monitoring of cotton bolls in agricultural fields. |
| Criteria | Value |
|---|---|
| Distance | 1 m between rows |
| Area | 8458.37 m2 ó 0.85 ha |
| Height | 2.5 m from the ground |
| Camera angle | 180° |
| Weather | Sunny |
| Wind speed | 22.5 °C |
| Temperature | 7.6 Km/h SSW |
| Humidity | 71% |
| Time | 9:00 AM |
| Day | 5 May 2024 |
| Latitude | 6°40′20″ S |
| Longitude | 79°53′17″ W |
| Original Images | Data Augmentation | ||
|---|---|---|---|
| Images | Annotations | Images | Annotations |
| 100 | 3062 | 2186 | 70,348 |
| Metric | YOLO v8N | YOLO v8X | YOLO v11N | YOLO v11X | Faster R-CNN |
|---|---|---|---|---|---|
| Precision (%) | 98.80 | 99.81 | 97.91 | 99.78 | 99.10 |
| Recall (%) | 97.40 | 99.54 | 97.33 | 99.44 | 97.22 |
| F1-Score (%) | 98.10 | 99.68 | 97.62 | 99.61 | 98.15 |
Disclaimer/Publisher’s Note: The statements, opinions and data contained in all publications are solely those of the individual author(s) and contributor(s) and not of MDPI and/or the editor(s). MDPI and/or the editor(s) disclaim responsibility for any injury to people or property resulting from any ideas, methods, instructions or products referred to in the content. |
© 2025 by the authors. Licensee MDPI, Basel, Switzerland. This article is an open access article distributed under the terms and conditions of the Creative Commons Attribution (CC BY) license (https://creativecommons.org/licenses/by/4.0/).
Share and Cite
Ballena-Ruiz, J.; Arcila-Diaz, J.; Tuesta-Monteza, V. Automated Detection and Counting of Gossypium barbadense Fruits in Peruvian Crops Using Convolutional Neural Networks. AgriEngineering 2025, 7, 152. https://doi.org/10.3390/agriengineering7050152
Ballena-Ruiz J, Arcila-Diaz J, Tuesta-Monteza V. Automated Detection and Counting of Gossypium barbadense Fruits in Peruvian Crops Using Convolutional Neural Networks. AgriEngineering. 2025; 7(5):152. https://doi.org/10.3390/agriengineering7050152
Chicago/Turabian StyleBallena-Ruiz, Juan, Juan Arcila-Diaz, and Victor Tuesta-Monteza. 2025. "Automated Detection and Counting of Gossypium barbadense Fruits in Peruvian Crops Using Convolutional Neural Networks" AgriEngineering 7, no. 5: 152. https://doi.org/10.3390/agriengineering7050152
APA StyleBallena-Ruiz, J., Arcila-Diaz, J., & Tuesta-Monteza, V. (2025). Automated Detection and Counting of Gossypium barbadense Fruits in Peruvian Crops Using Convolutional Neural Networks. AgriEngineering, 7(5), 152. https://doi.org/10.3390/agriengineering7050152